Article

An Integrated Approach Using Remote Sensing and Multi-Criteria Decision Analysis to Mitigate Agricultural Drought Impact in the Mazowieckie Voivodeship, Poland

by
Magdalena Łągiewska
*,† and
Maciej Bartold
Remote Sensing Centre, Institute of Geodesy and Cartography, Modzelewskiego 27, 02-679 Warszawa, Poland
*
Author to whom correspondence should be addressed.
These authors contributed equally to this work.
Remote Sens. 2025, 17(7), 1158; https://doi.org/10.3390/rs17071158
Submission received: 11 February 2025 / Revised: 17 March 2025 / Accepted: 21 March 2025 / Published: 25 March 2025

Abstract

:
Climate change, particularly the increasing frequency of droughts, poses a critical challenge for agriculture. Rising temperatures and water scarcity threaten both agricultural productivity and ecosystem stability, making the identification of effective drought mitigation strategies essential. This study introduces an innovative approach to agricultural drought monitoring in Poland, utilizing remote sensing (RS) satellite data, collected from 2001 to 2020, and the Drought Identification Satellite System (DISS) index at a 1 km × 1 km spatial resolution, in combination with Copernicus High-Resolution Layers (HRL). To assess areas’ capacities to mitigate drought risks, a multi-criteria decision (MCD) analysis of regional environmental conditions was conducted. Focusing on the Mazowieckie Voivodeship, an algorithm was developed to evaluate regional susceptibility to drought. Spatial datasets were used to analyze environmental indicators, producing a map of communal temperature mitigation capacities. Statistical analysis identified drought vulnerability, highlighting areas in need of urgent intervention, such as increased mid-field tree planting. The study revealed that the frequency of droughts in this region during the growing season from 2001 to 2020 exceeded 40%. As a result, 40 LAU 2 administrative units have been affected by multiple negative environmental factors that contribute to drought formation and its long-term persistence. The proposed methodology, integrating diverse satellite data sources and spatial analyses, offers an effective tool for drought monitoring, mitigation planning, and ecosystem protection in a changing climate. This approach provides valuable insights for policymakers and land managers in addressing agricultural drought challenges and enhancing regional resilience to the impacts of climate change.

1. Introduction

The rising frequency of extreme weather events, particularly droughts, represents a significant and growing challenge to the modern world [1]. Agriculture, a key part of the global economy, is especially vulnerable to the adverse impacts of climate change [2]. Prolonged periods of water scarcity caused by droughts severely undermine agricultural productivity and efficiency [3]. Recent research highlights a steady rise in average monthly temperatures, leading to more frequent and intense droughts affecting vast regions, including Poland [4]. This concerning trend aligns with the global increase in anomalous meteorological phenomena driven by both natural and human-induced factors [1].
According to a report by NIK—the Supreme Audit Office of Poland [5], approximately 40% of agricultural and forested areas in Poland face extreme or severe risk of agricultural drought. Drought has been a persistent and longstanding issue in Polish agriculture. Between 1951 and 1981, it occurred, on average, every five years. However, in the subsequent period from 1981 to 2011, droughts were recorded, on average, every two years [6]. Unfortunately, in recent years, droughts have affected significant areas of the country almost annually, including in 2015, 2016, 2018, 2019, and 2020. The water shortages led to losses in agricultural production, necessitating state assistance for affected farmers. In 2015, the aid amounted to approximately PLN 500 million, but by 2019 it had risen nearly fourfold to PLN 1.9 billion [5].
An NIK audit found that although the management of water resources was transferred to the State Water Holding Polish Waters, the issue persists due to the lack of a coherent strategy to ensure a strategic and systemic approach to water management in agriculture. Following the audit results, NIK submitted recommendations emphasizing the need to develop solutions to address water shortages in agriculture, including the establishment of essential tools and mechanisms to support their implementation. The importance of collaboration to raise awareness and educate farmers on proper water management practices was also underscored. In addition to traditional water management strategies, there is significant potential for leveraging Earth Observation (EO) data to support drought monitoring and mitigate the impacts of drought in agriculture [7]. EO data provide real-time, high-resolution information on various environmental factors such as soil moisture, vegetation health, and precipitation patterns, all of which are crucial for assessing drought conditions [8]. These data can be used to develop early warning systems that allow for timely interventions in drought-prone areas. Moreover, EO data can assist in spatial planning by identifying regions most vulnerable to water scarcity and guiding the allocation of resources for drought mitigation [9]. Integrating EO technologies into decision-making processes can enhance the accuracy of drought predictions and contribute to more effective, evidence-based strategies for managing water resources in agriculture [10].
However, there is still a lack of established standards and methodologies in spatial planning and land management in the context of areas at risk of drought occurrence [11,12]. Therefore, the main aim of this work is to develop an innovative methodology for identifying areas characterized by frequent drought occurrences, and thus high vulnerability to drought risk, considering different types of land cover that can help mitigate the effects of agricultural drought. This study presents an approach based on multi-criteria decision (MCD) analysis for detecting drought-affected areas and identifying administrative units at level 2 (LAU 2) that are critical for improving water retention and mitigating the effects of drought in agriculture. This research is significant as it addresses the urgent need for adaptive strategies in agriculture in the face of climate change. By identifying drought-vulnerable areas through the use of geospatial datasets from the Copernicus Programme with satellite imagery derived from MODIS, this work contributes to broader efforts aimed at increasing agricultural resilience and promoting sustainable land management. Through advanced geospatial techniques, such as satellite-based monitoring, this study enhances the capacity to detect, assess, and mitigate drought risks, ultimately supporting more informed and proactive decision-making in agricultural planning.

2. Materials and Methods

2.1. Study Area

The study area is the Mazowieckie Voivodeship (Figure 1), located in the central part of Poland (52.22°N, 21.01°E). Covering approximately 35,558 km2, it is the largest voivodeship in the country. This region has a favorable temperate transitional climate, characterized by warm summers and cool winters [13]. While the average temperature in July is around 18.5 °C, the annual precipitation of 550 mm supports the cultivation of various plants, including cereals and vegetables. The study area is also characterized by extensive agricultural areas and numerous orchards, which are significant in the region [14].
The Mazowieckie Voivodeship is largely flat, with expansive fields and meadows stretching across its central areas, while gentle hills shape the landscape in the north and southeast [15]. Its rich, fertile soils make it well-suited for agriculture, fostering the growth of various field crops. The region also benefits from an extensive network of rivers and water bodies, including the Vistula, Bug, and Narew, which provide a dependable water supply essential for vegetation [16].
Home to over 5.4 million residents, the Mazowieckie Voivodeship is among Poland’s most densely populated regions. Its key cities include Warsaw, Radom, Płock, and Siedlce. The region boasts a diverse economy, driven by a thriving service sector, substantial industrial operations, and a strong agricultural presence [17]. Administratively, the region is divided into 314 municipalities at the local administrative unit level 2 (LAU 2), consisting of 35 urban, 76 urban-rural, and 203 rural municipalities [18]. LAU 2 corresponds to municipalities, which represent the smallest governance tier in Poland.

2.2. Geospatial Data Collection

The input data utilized in this study comes from a diverse range of High-Resolution Layers (HRL) datasets and other environmental and administrative sources, offering comprehensive spatial and temporal information for analytical purposes (Table 1). HRL datasets are part of the Copernicus Land Monitoring Service (LMS) and provide detailed land cover and land use information across Europe. These datasets, developed by the European Environment Agency (EEA), are crucial for monitoring environmental changes, supporting policy-making, and conducting landscape assessments. One of the primary datasets used is the HRL Forest Type, which covers the EEA38 countries and the UK. It provides spatial resolutions of 10 m, 20 m, and 100 m for the years 2012, 2015, and 2018, with updates every three years. This layer distinguishes between different types of forests, allowing for detailed forest monitoring and ecological assessments. Similarly, the HRL Tree Cover Density dataset offers insights into tree cover extent, density, and spatial distribution at comparable resolutions and update frequencies, contributing to forest and biomass analyses. The HRL Small Woody Features layer focuses on smaller vegetative elements, such as hedgerows and woody patches, which are often overlooked in broader datasets but which are essential for biodiversity and habitat connectivity studies. This dataset provides high-resolution imagery at 5 m and 100 m for the years 2015 and 2018, with updates every three years. Additionally, the HRL Water and Wetness layer captures the spatial extent of water bodies and wet areas, which is critical for hydrological studies, flood risk assessment, and wetland preservation. This dataset includes resolutions of 20 m and 100 m and covers the years 2015 and 2018.
Urban and infrastructure monitoring is supported by the HRL Imperviousness layer, which maps sealed surfaces such as roads and buildings. This dataset, spanning from 2006 to 2018 with updates every three years, is available at resolutions of 10 m, 20 m, and 100 m. Understanding impervious surfaces is essential for urban planning, climate adaptation strategies, and water runoff management. Figure 2 presents an example of HRL data visualization for our study area, with an enhanced view zoomed in on the Narew River’s mouth flowing into the Vistula River in the Mazowieckie Voivodeship.
Drought maps were developed based on the crop growth monitoring system framework outlined in [24]. The maps were prepared to estimate vegetation conditions using an index derived from Terra MODIS satellite imagery. The Drought Identification Satellite System (DISS) index was developed as a function of the Temperature Condition Index (TCI) and the Hydrothermal Coefficient (HTC), both of which characterize climatic conditions in Poland. The TCI was derived from MOD11A2 products, while the HTC was calculated using ERA-5 Land air temperature and precipitation datasets. The DISS drought index was generated with a spatial resolution of 1 km × 1 km for each eight-day period during the growing season in areas identified in the CORINE Land Cover (CLC) database as follows: (1) agricultural areas, including CLC class 211 (non-irrigated arable land) and class 242 (complex cultivation patterns); and (2) grasslands, comprising CLC class 231 (pastures). The study focused exclusively on MODIS pixels with a resolution of 1 km × 1 km that met the requirement of at least 50% coverage according to the specified CLC classes. The methodology for generating CLC-based agricultural masks was based on the approach outlined in [26].
Drought detection was developed based on statistical analysis evaluating the percentage of observations with precipitation deficits within specific DISS index ranges [24]. The system categorized the satellite-based DISS drought index into five levels, reflecting varying soil moisture conditions and associated water deficit risks, ranging from excessive moisture to drought and extreme drought (Table 2). Agricultural drought was identified when DISS values were below 0.8. This threshold was adopted because precipitation deficits were observed in over 70% of cases within this category, effectively representing the probability of a precipitation-free period [24].
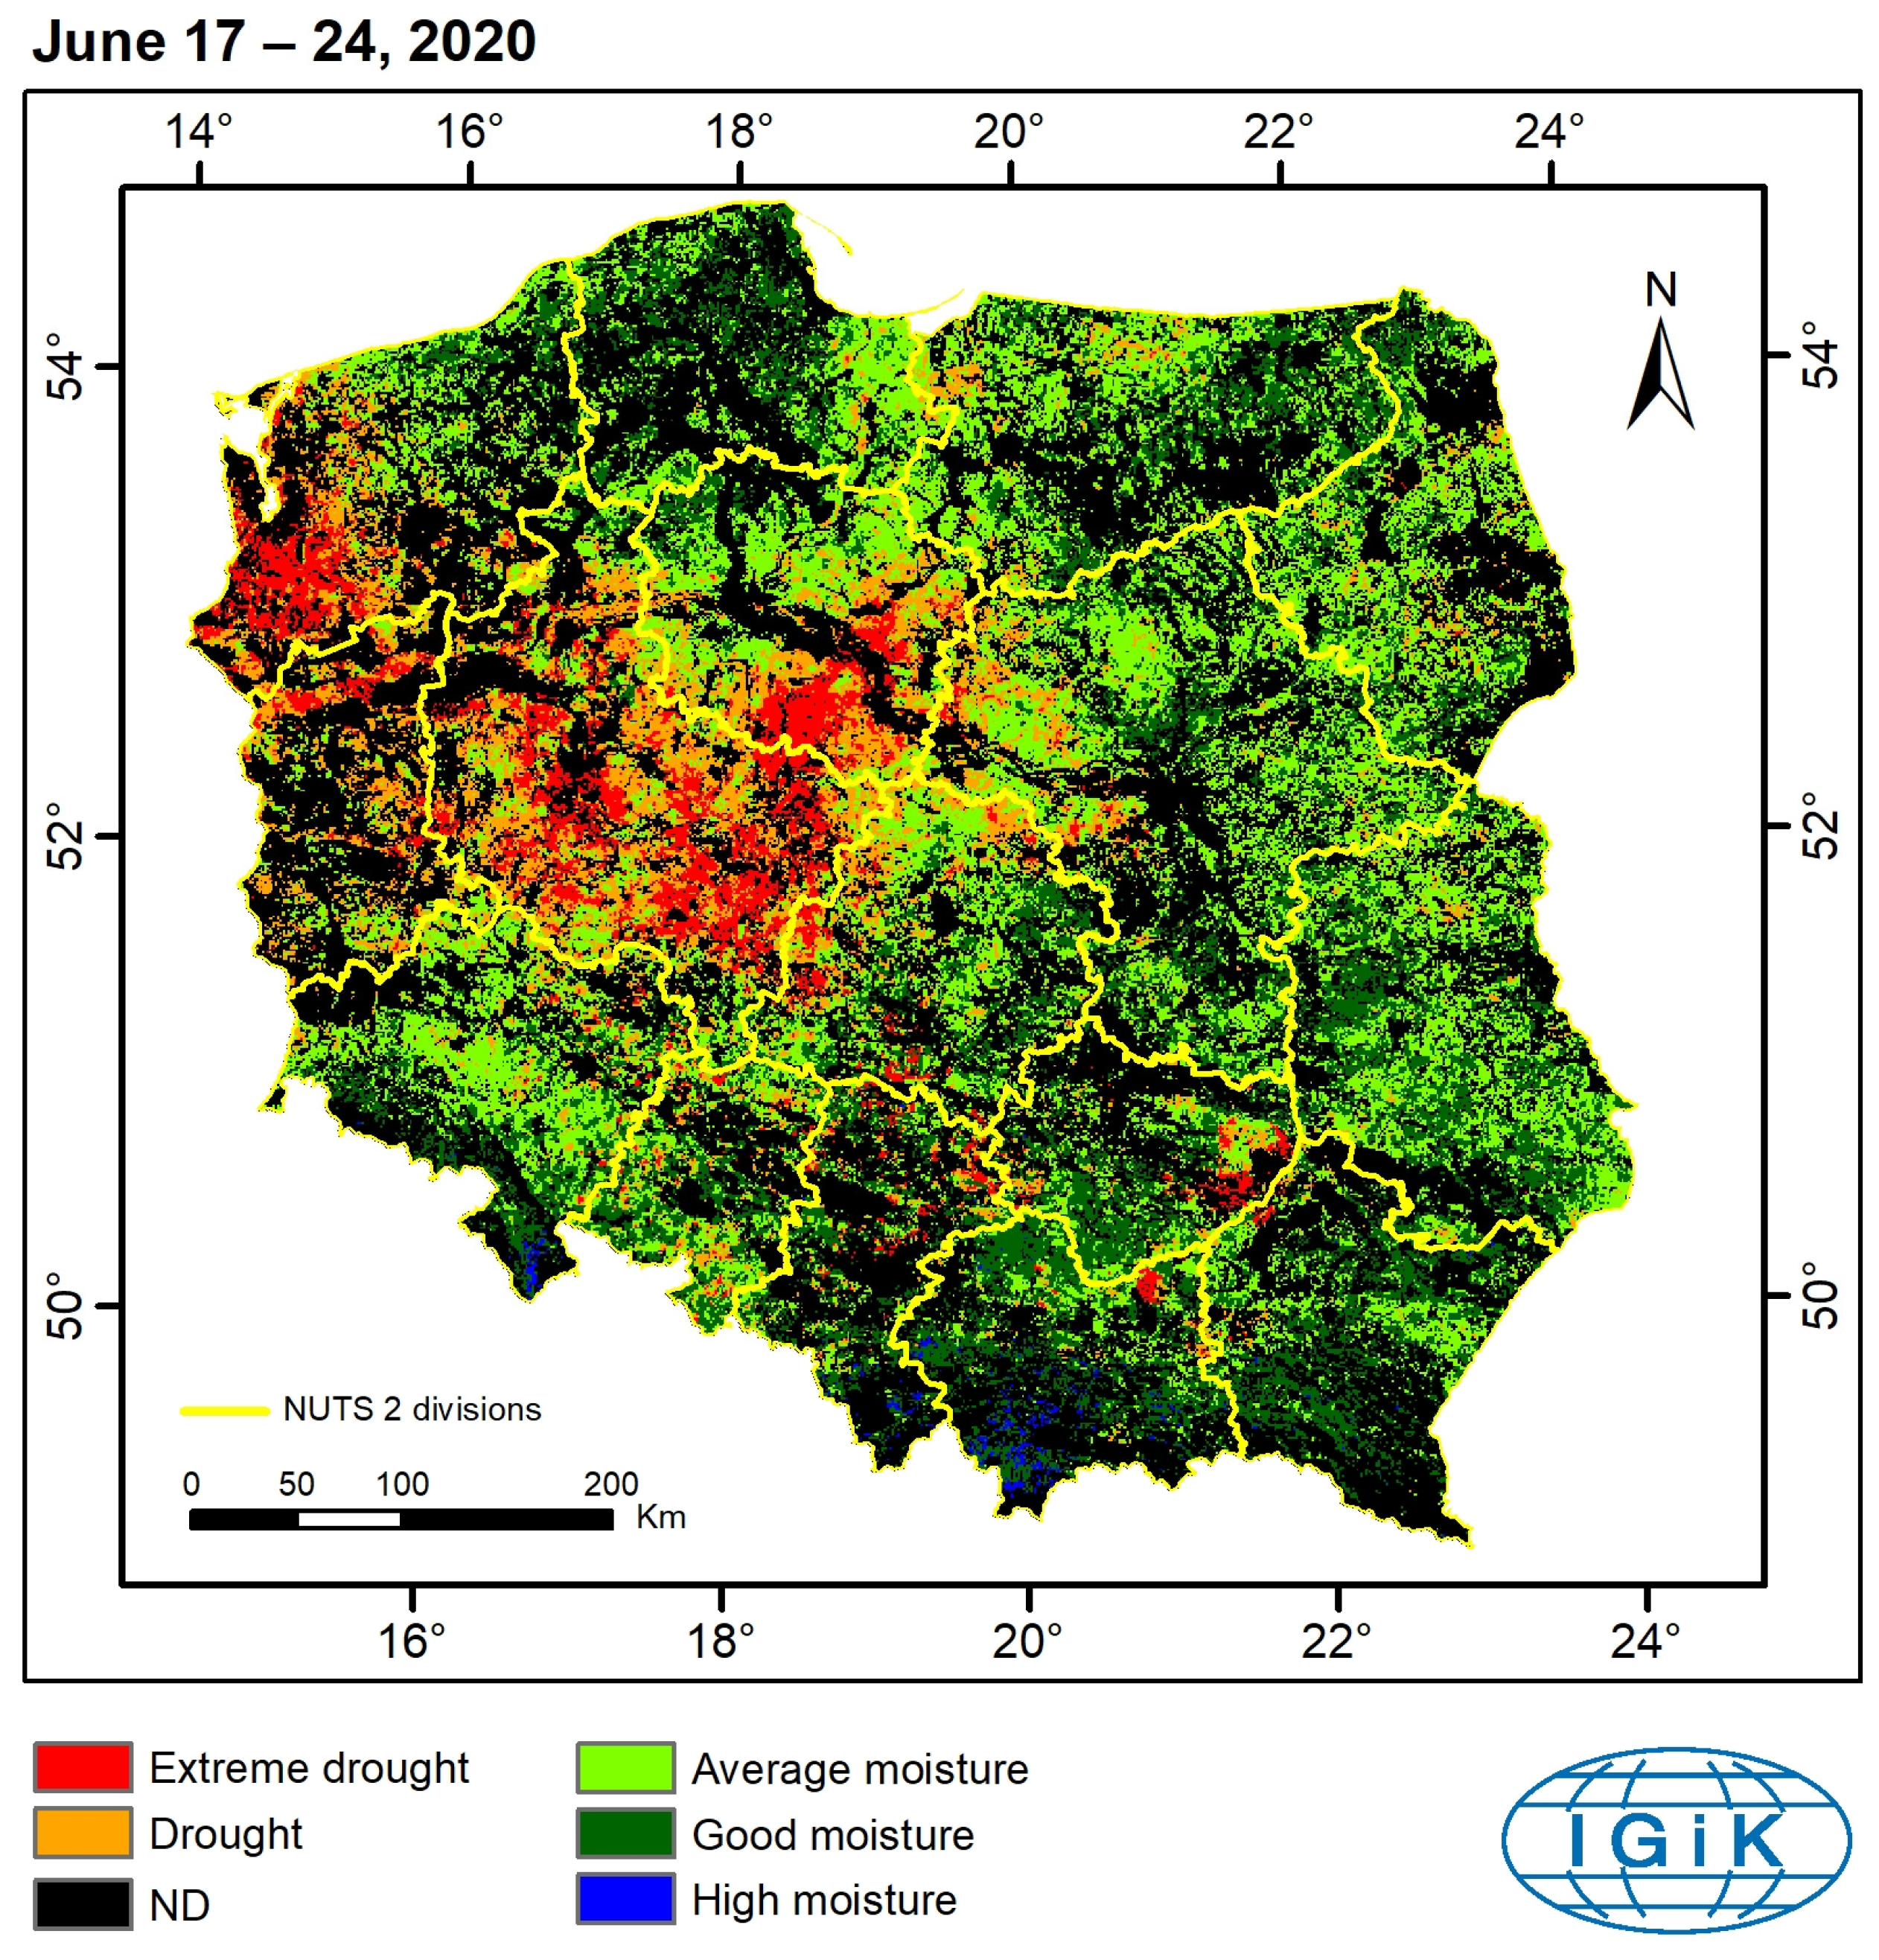
The 1 km × 1 km spatial resolution of the data enables the observation of a larger surface area across the entirety of Poland and reduces data acquisition time. It is successfully utilized for operational satellite-based monitoring of drought conditions in Poland [27]. Figure 3 illustrates an example of a drought map, with red areas indicating severe drought from 17 to 24 June 2020.
Lastly, administrative boundaries are represented by the Administrative Units (LAU 2) dataset, sourced from Eurostat and the European Commission. Covering the EU-27 and EFTA countries, this vector-based dataset at a scale of 01M provides up-to-date administrative divisions, essential for spatial analysis and policy implementation.

2.3. Analysis for Drought Risk Assessment

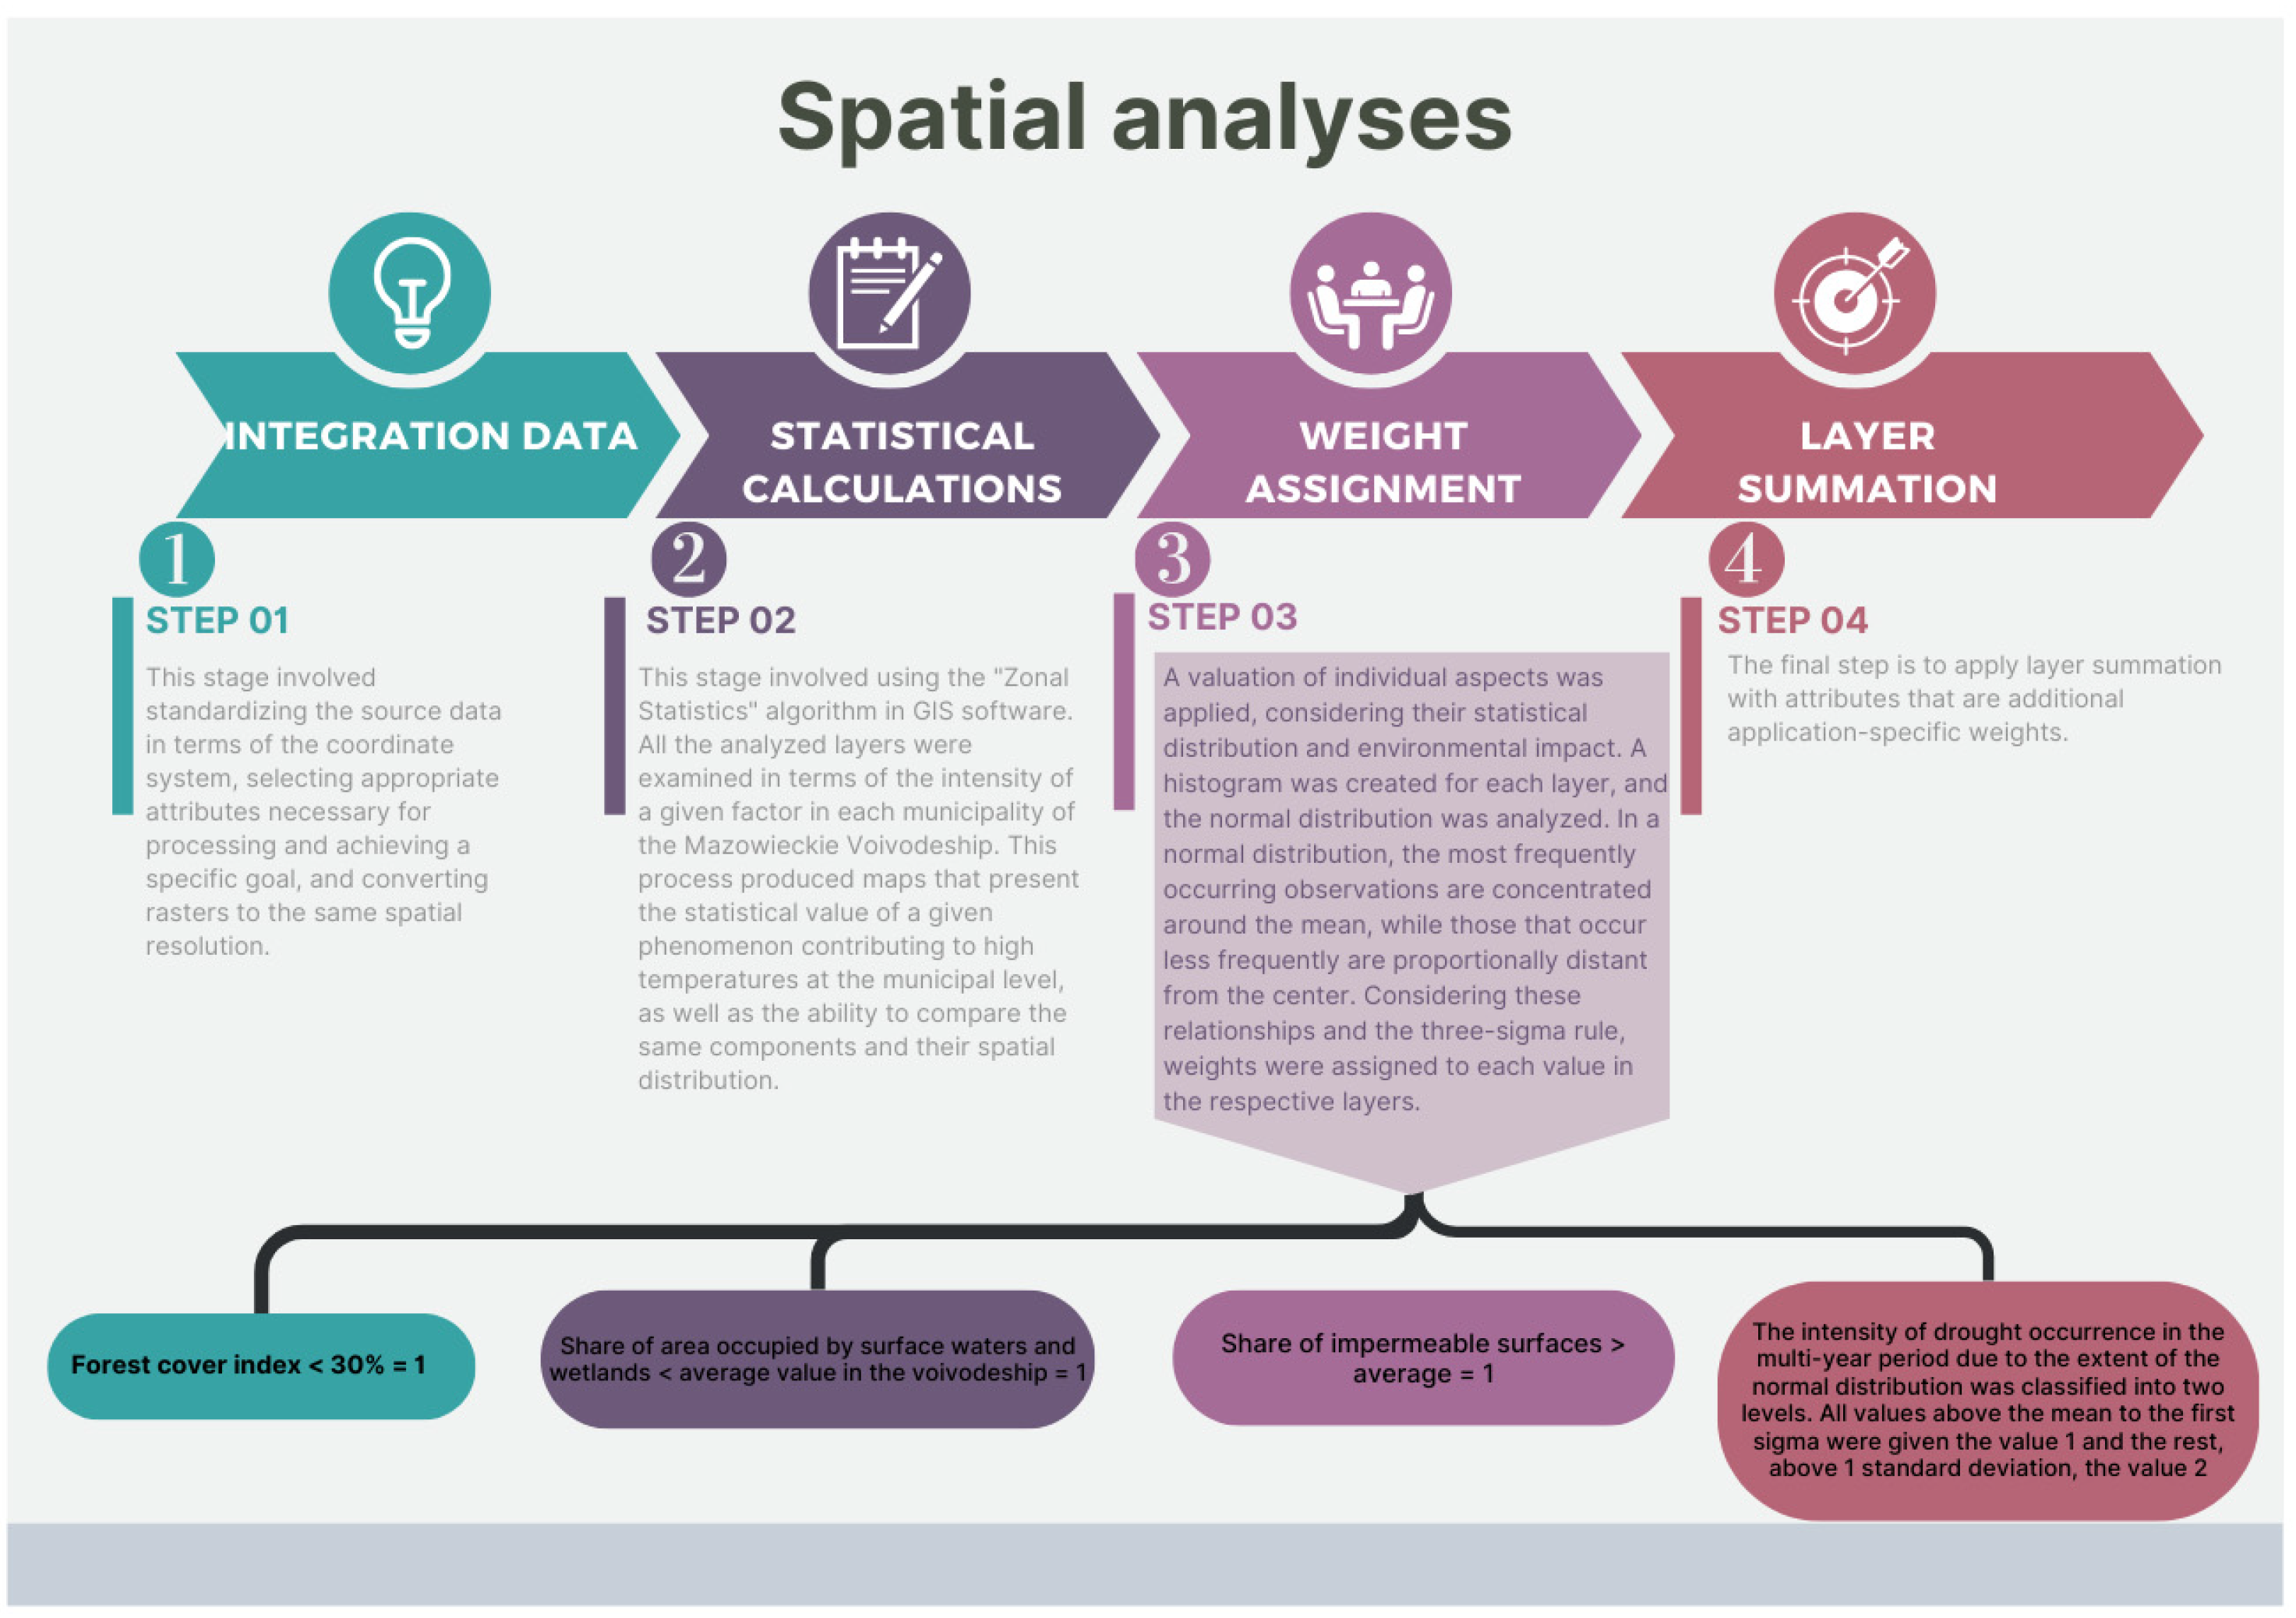
The following steps were taken in MCD geospatial analysis, including drought maps supported by HRL datasets, to evaluate the possibilities of mitigating drought occurrences in the Mazowieckie Voivodeship (Figure 4): (1) data integration, standardizing input for consistent spatial resolution; (2) statistical calculations, using the “Zonal Statistics” algorithm for administrative units at level 2 to assess key environmental indicators across LAU 2; (3) weight assignment, prioritizing factors based on environmental impact and applying a normal distribution to emphasize central and critical features; and (4) layer summation, combining spatial layers with application-specific attributes to derive actionable insights. The following key parameters were considered: forest cover below 30%, high shares of surface waters and wetlands, impermeable surfaces exceeding average values, and drought occurrence intensity assessment.
In accordance with the adopted methodology and based on current knowledge, the approach for determining the capacity of areas to mitigate drought relies on several key assumptions [28]. First, the occurrence of areas with recurrent water shortages or those significantly threatened by water deficiency is crucial [29]. The identification of these areas at risk of water shortages was conducted through an analysis of the intensity of agricultural drought occurrences from 2001 to 2020. Second, the existing landscape structure plays a significant role in influencing the occurrence of drought risk [30]. Factors classified as land cover determinants, which necessitate an increase in plantings, include the percentage of impermeable surfaces, existing plantings such as forests and mid-field trees, and the size of areas occupied by water bodies and wetlands [31].

2.3.1. HRL Land Cover Categories

In order to develop methodological assumptions for an algorithm assessing the capacity of areas in the Mazowieckie Voivodeship to mitigate drought impacts, including the selection of land cover indicators for evaluation, HRL spatial datasets were analyzed to identify potential source materials for delineating areas susceptible to frequent droughts.
To calculate forest cover for a given area, high-resolution spatial data (5 m and 10 m) obtained from the Copernicus LMS were analyzed. The following HRL Tree Cover Density datasets were included: Forest Type (10 m), Small Woody Features (5 m), and Tree Cover Density (10 m). To prevent information duplication, these rasters were standardized to a spatial resolution of 10 m and merged, producing a continuous representation of tree cover within a unified raster. Forest cover density, indicating the percentage of forested land in the study area, was computed by calculating the proportion of forest-covered land to the total area of each LAU 2 administrative unit. The HRL Water and Wetness layer was also considered. This dataset encompasses permanent and temporary surface waters, as well as wetlands and peatlands. The share of these features within each LAU 2 was calculated by counting the corresponding pixels and relating them to the total area of the administrative unit. The final HRL-based landscape indicator used to assess the need for increased tree planting due to drought impacts was the imperviousness layer, also sourced from the Copernicus LMS database. Unlike previous layers, this dataset highlights negative environmental impacts. With values ranging from 0% to 100%, where 100% represents completely impervious ground, the analysis focused on calculating the median imperviousness for each LAU 2 using the “Zonal Statistics” function. This value was then related to the proportion of impervious surfaces within each administrative unit.
All HRL datasets have been converted to raster format, logically merged to eliminate duplicate values, and standardized to a common resolution of 10 m. These layers were analyzed based on their influence of drought in specific areas and the recommended intensification of LAU 2 for tree planting to mitigate this phenomenon. Zonal statistics were computed for each layer, with administrative units at level 2 in the Mazowieckie Voivodeship serving as the reference units. This algorithm calculates statistics for raster layers by analyzing the features of overlapping vector layers within specified LAU 2 administrative units. The analysis involved calculating the number of pixels, the sum of their values, and the median for each processed layer within each LAU 2. Finally, maps illustrating the intensity of various landscape elements relative to the area of each LAU 2 were prepared.

2.3.2. Identification of Drought Frequency in Gminy Mazowieckie

A total of 480 images of the satellite-based DISS drought index were collected for the months of April through September from 2001 to 2020 in the Mazowieckie Voivodeship. Two DISS classes, drought and extreme drought, were taken into account to assess the intensity of drought occurrence in the study area. The analysis was conducted both at the 1 km × 1 km pixel size and at the LAU 2 administrative unit level. The study included a correlation analysis and the Mann–Whitney U test to examine the relationship between drought frequency and HRL tree cover at the LAU 2 level. In the correlation analysis, the results were reported using the correlation coefficient r and the coefficient of determination R2 to quantify the strength and direction of the relationship. Additionally, the Mann–Whitney U test, a non-parametric method, was used to compare differences between two independent groups when the assumption of normality was not met. Instead of comparing means directly, this test evaluates whether one group tends to have higher values than the other. The null hypothesis (H0) assumed no significant difference in drought frequency between groups with different levels of forest cover, while the alternative hypothesis (H1) proposed a significant difference. For this analysis, urban municipalities were excluded, i.e., 35 out of 314 LAU 2 units in Mazowieckie Voivodeship, resulting in 279 LAU 2 administrative units being analyzed.

2.3.3. Multi-Criteria Decision Analysis

MCD analysis for the identification of Mazowieckie Voivodeship LAU 2 administrative units eligible for increased tree planting within their areas is based on performing a series of spatial data analyses using GIS techniques and tools. Spatial analyses were carried out for numerical data available for the entire Mazowieckie Voivodeship. The source spatial databases used from Table 1 for these analyses were selected based on three main criteria: (I) the relevance of their informational scope in relation to the assumptions for identifying areas with a tendency for drought risk; (II) the scale and accuracy of the development in relation to the criteria for these areas; (III) the availability of data resources.
The processing for identifying areas was carried out using QGIS 3.28 software with spatial analysis extensions (zonal.statistics function). The procedure (Figure 5) followed a series of steps: first, the harmonization and integration of data; next, statistical calculations using the “Zonal Statistics” algorithm; and, then, the assignment of weights to individual environmental aspects to create continuous information on areas excessively exposed to drought impacts. The final step involved summing the layers with attributes representing the weights of the various environmental aspects.
The datasets integration involved standardizing the source data in terms of coordinate systems, selecting the appropriate attributes necessary for processing and achieving the specified objective, and converting rasters to the same spatial resolution. In the indicated zonal statistics analysis, all the discussed layers were analyzed for the intensity of the occurrence of a given factor in each of the LAU 2 units in the Mazowieckie Voivodeship. This process resulted in maps that present the statistical value of each phenomenon contributing to drought at the administrative unit level 2, as well as the ability to compare the same components and their distribution.
After executing the “Zonal Statistics” algorithm, the distributions of environmental factors contributing to the local occurrence of intensified drought effects were obtained. These distributions were then analyzed to understand the relationship between the factors and their spatial impact on drought conditions. In the subsequent step, weights were assigned to each environmental aspect, taking into account their statistical distribution and overall impact on the environment. For this purpose, a histogram was created for each layer, and a normal distribution was analyzed. In a normal distribution, the most frequently occurring observations are clustered around the mean, while those that occur less frequently are spread further from the center in a proportional manner.
Based on these relationships and the “three-sigma” rule, weights were assigned to each value within the individual layers. Values deviating from the mean were assigned a weight of 1. Specifically, the following criteria were applied:
  • Forest cover index < 30% = 1;
  • Proportion of surface water and wetland areas < the average value in the voivodeship = 1;
  • Proportion of impervious surfaces > the average = 1.
Lastly, the classification of drought occurrence intensity over multiple years was based on the distribution of values within a normal statistical framework (Table 3). Specifically, drought frequencies were categorized into two levels using the mean (μ) and standard deviation (σ) as reference points. Observations within one standard deviation from the mean (μ ≤ x < μ + σ) were assigned a weight of 1, while values exceeding one standard deviation (x ≥ μ + σ) were assigned a weight of 2, reflecting their higher deviation from the central tendency. This approach allows for a structured differentiation of drought intensities based on statistical dispersion while maintaining robustness in classification.
As a result, an informational layer was created in which LAU 2 units with high exposure to drought effects were assigned a value of 4, while those with low exposure received a value of 0. For example, an LAU 2 with a low forest cover index, a small proportion of surface water and wetland areas, a high proportion of impervious surfaces, and a high intensity of drought occurrences over the years was given a value of 4. This value reflected the sum of the values from the various layers analyzed. This process enabled the identification of areas with both high and low exposure to drought risk, distinguishing regions that are particularly vulnerable to these environmental stressors from those less affected.
The point-based assessment method is based on the author assigning various characteristics of differentiated value, present within the studied spatial unit, an appropriate number of points according to an established value scale. In the subsequent stage, the points assigned to individual characteristics are summed to determine the total value. This method allows for a synthetic evaluation of the selected spatial unit in comparison to other units [32].
The principles of this method were discussed in detail by Bartkowski [33] and Sołowiej [34], both considered pioneers in comprehensive natural environment analysis. The essence of the point-based assessment method lies in assigning scores to individual assessment areas, reflecting the intensity of successively analyzed natural elements or phenomena [33]. Within a single assessment unit, the scores for each element are summed and subsequently classified into predefined value ranges [34]. A significant advantage of this approach is the ability to obtain a synthetic and objective result, facilitating comparison between different assessment units [35].

3. Results

3.1. Spatial Distribution of HRL Land-Cover Types

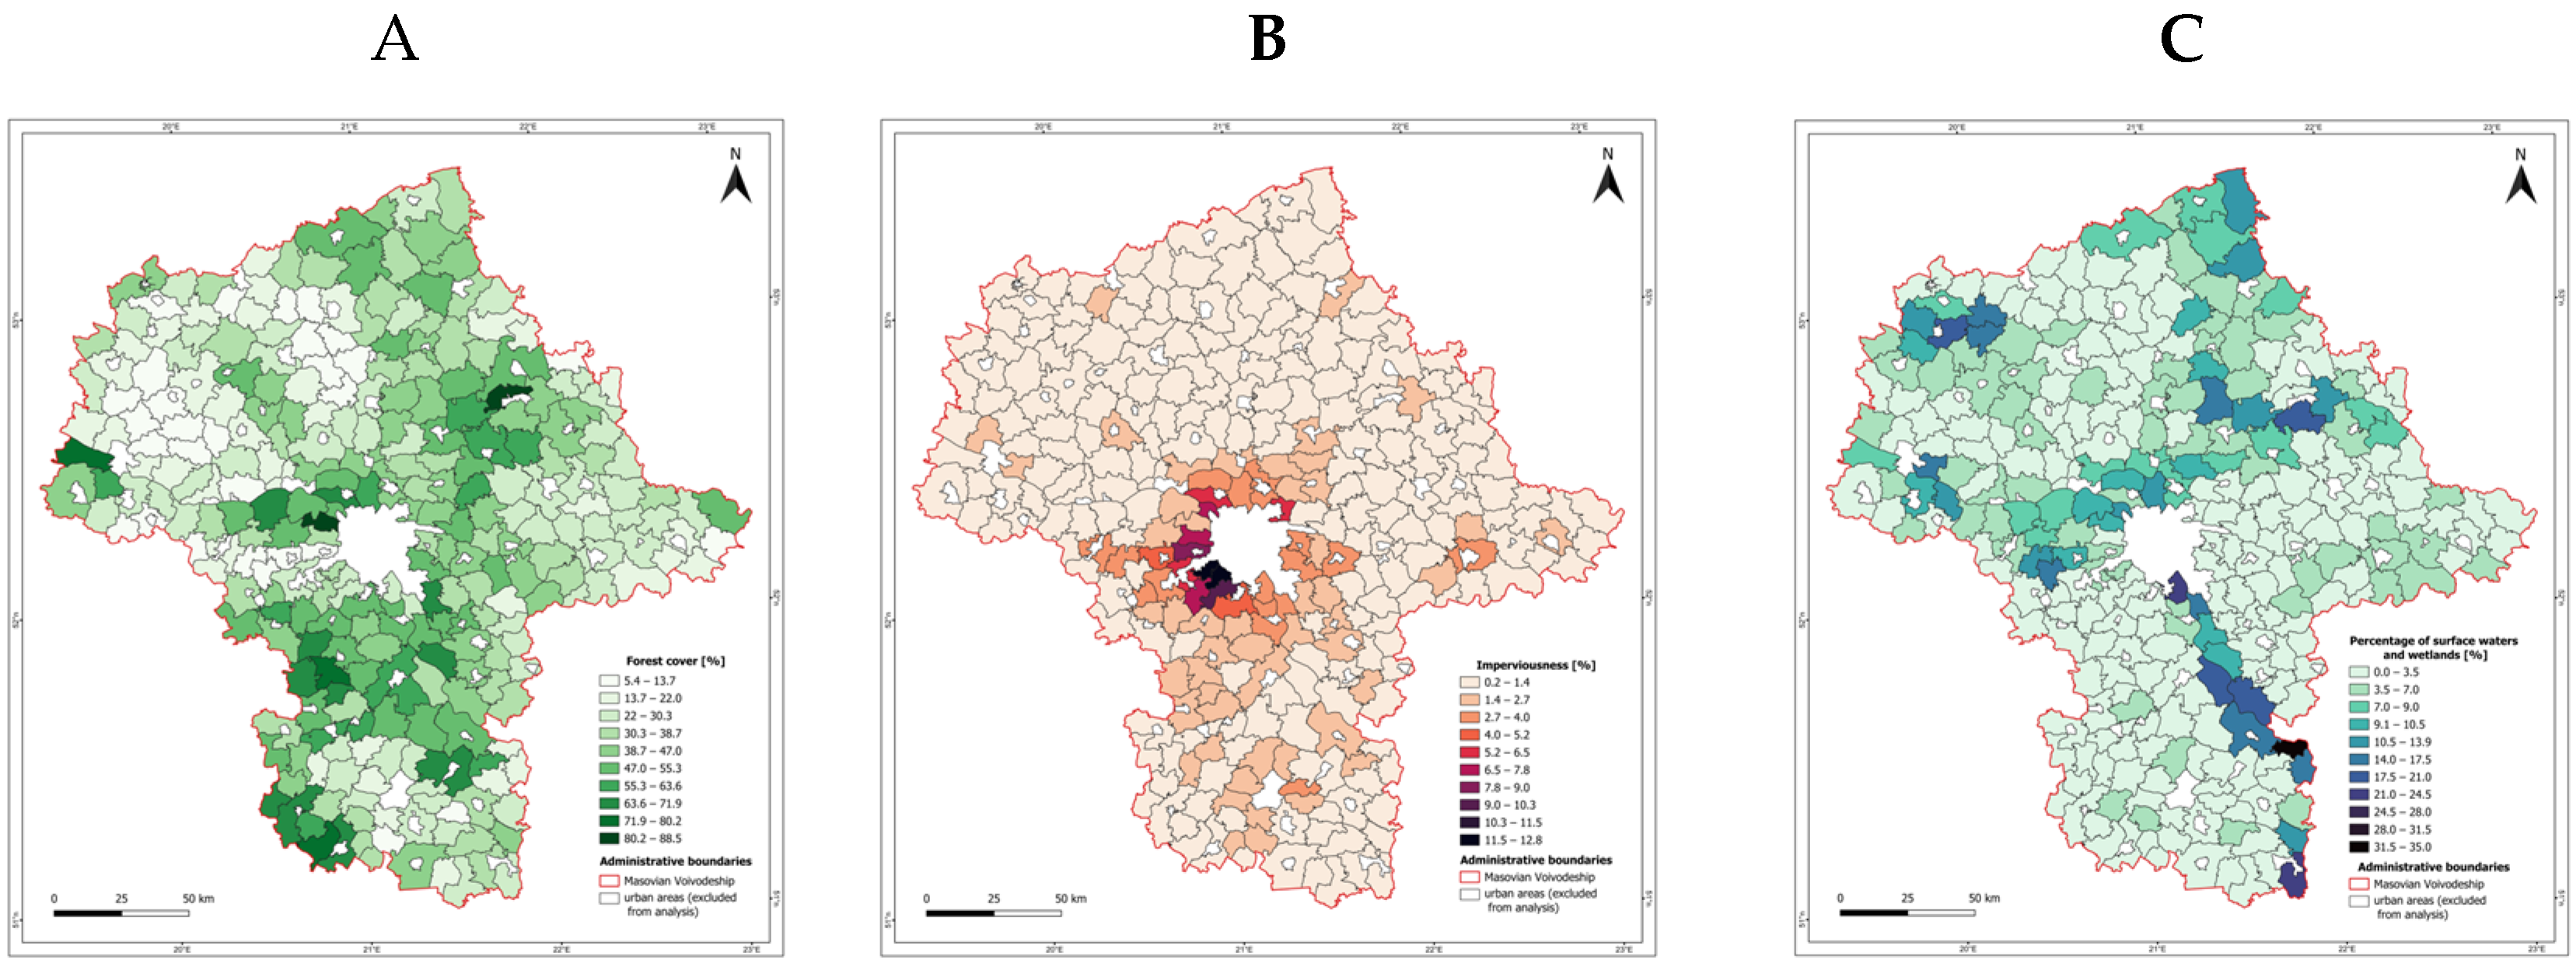
Figure 6 illustrates the maps of the spatial distribution of various land-cover types in percentage by LAU 2 in the study area. The first map (Figure 6A) illustrates the forest-cover distribution. The color gradient, as indicated by the legend, represents varying levels of tree cover, with darker shades corresponding to higher percentages of forested areas. There is a significant spatial alignment between dense forest cover and the locations of national forest reserves and landscape parks. In the southern part of the voivodeship, the Chojnowski Park Krajobrazowy stands out with a noticeable concentration of darker shades, indicating a high percentage of tree cover. Similarly, the eastern region, where the Mazowiecki Park Krajobrazowy is located, shows substantial forest cover. In the western part, the Kampinos National Park is characterized by the darkest shades on the map, signaling one of the highest levels of forest density. In contrast, the central and urbanized areas surrounding Warsaw and other LAU 2 units display significantly lower forest cover. These regions are often marked by the lightest shades on the map, representing less than 20% forested land. This pattern aligns with the expansion of urban development and agricultural activities, which reduce natural woodland areas.
The second map (Figure 6B) depicts the distribution of surface water and wetlands in the Mazowieckie Voivodeship at the LAU 2 level. The legend indicates a gradient from light to dark blue, with darker shades representing higher percentages of water bodies and wetland coverage. A key observation from the map is the concentration of surface water and wetlands in specific regions. The central and eastern parts of the voivodeship, particularly along the Vistula River and its tributaries, show prominent dark blue areas, indicating a high presence of water and wetlands. Additionally, the southern section near the Pilica River and other smaller water bodies exhibits substantial water coverage. The presence of natural water systems in these regions is essential for the local ecosystem and water management. In contrast, much of the northern and western areas display lighter shades, indicating a lower percentage of surface water and wetland presence. These regions are characterized by agricultural and developed landscapes where natural water systems are less prevalent.
The third map (Figure 6C) shows the percentage of soil impermeability in relation to the surface area of LAU 2 administrative units within the Mazowieckie Voivodeship. The legend uses a grayscale gradient, where darker shades represent a higher percentage of impermeable surfaces, while lighter shades indicate lower percentages. A clear pattern emerges around the central region, particularly in the vicinity of Warsaw. This area is marked by the darkest shades, signifying the highest levels of soil impermeability. The dense urban development and extensive infrastructure in the metropolitan area contribute significantly to this phenomenon. Suburban LAU 2 units immediately surrounding Warsaw also exhibit intermediate shades, indicating moderate levels of impermeable surfaces as urban sprawl extends outward. In contrast, much of the northern, eastern, and southern parts of the voivodeship display lighter shades, indicating lower levels of soil impermeability. These regions are more rural and predominantly characterized by natural landscapes and agricultural land, where permeable soil surfaces are more prevalent. The spatial distribution highlighted by the map emphasizes the direct correlation between urbanization and soil impermeability. The concentration of impermeable surfaces in the central metropolitan region underscores the challenges associated with water retention, flood risk, and environmental management in heavily developed areas.

3.2. Drought Occurrence Frequency

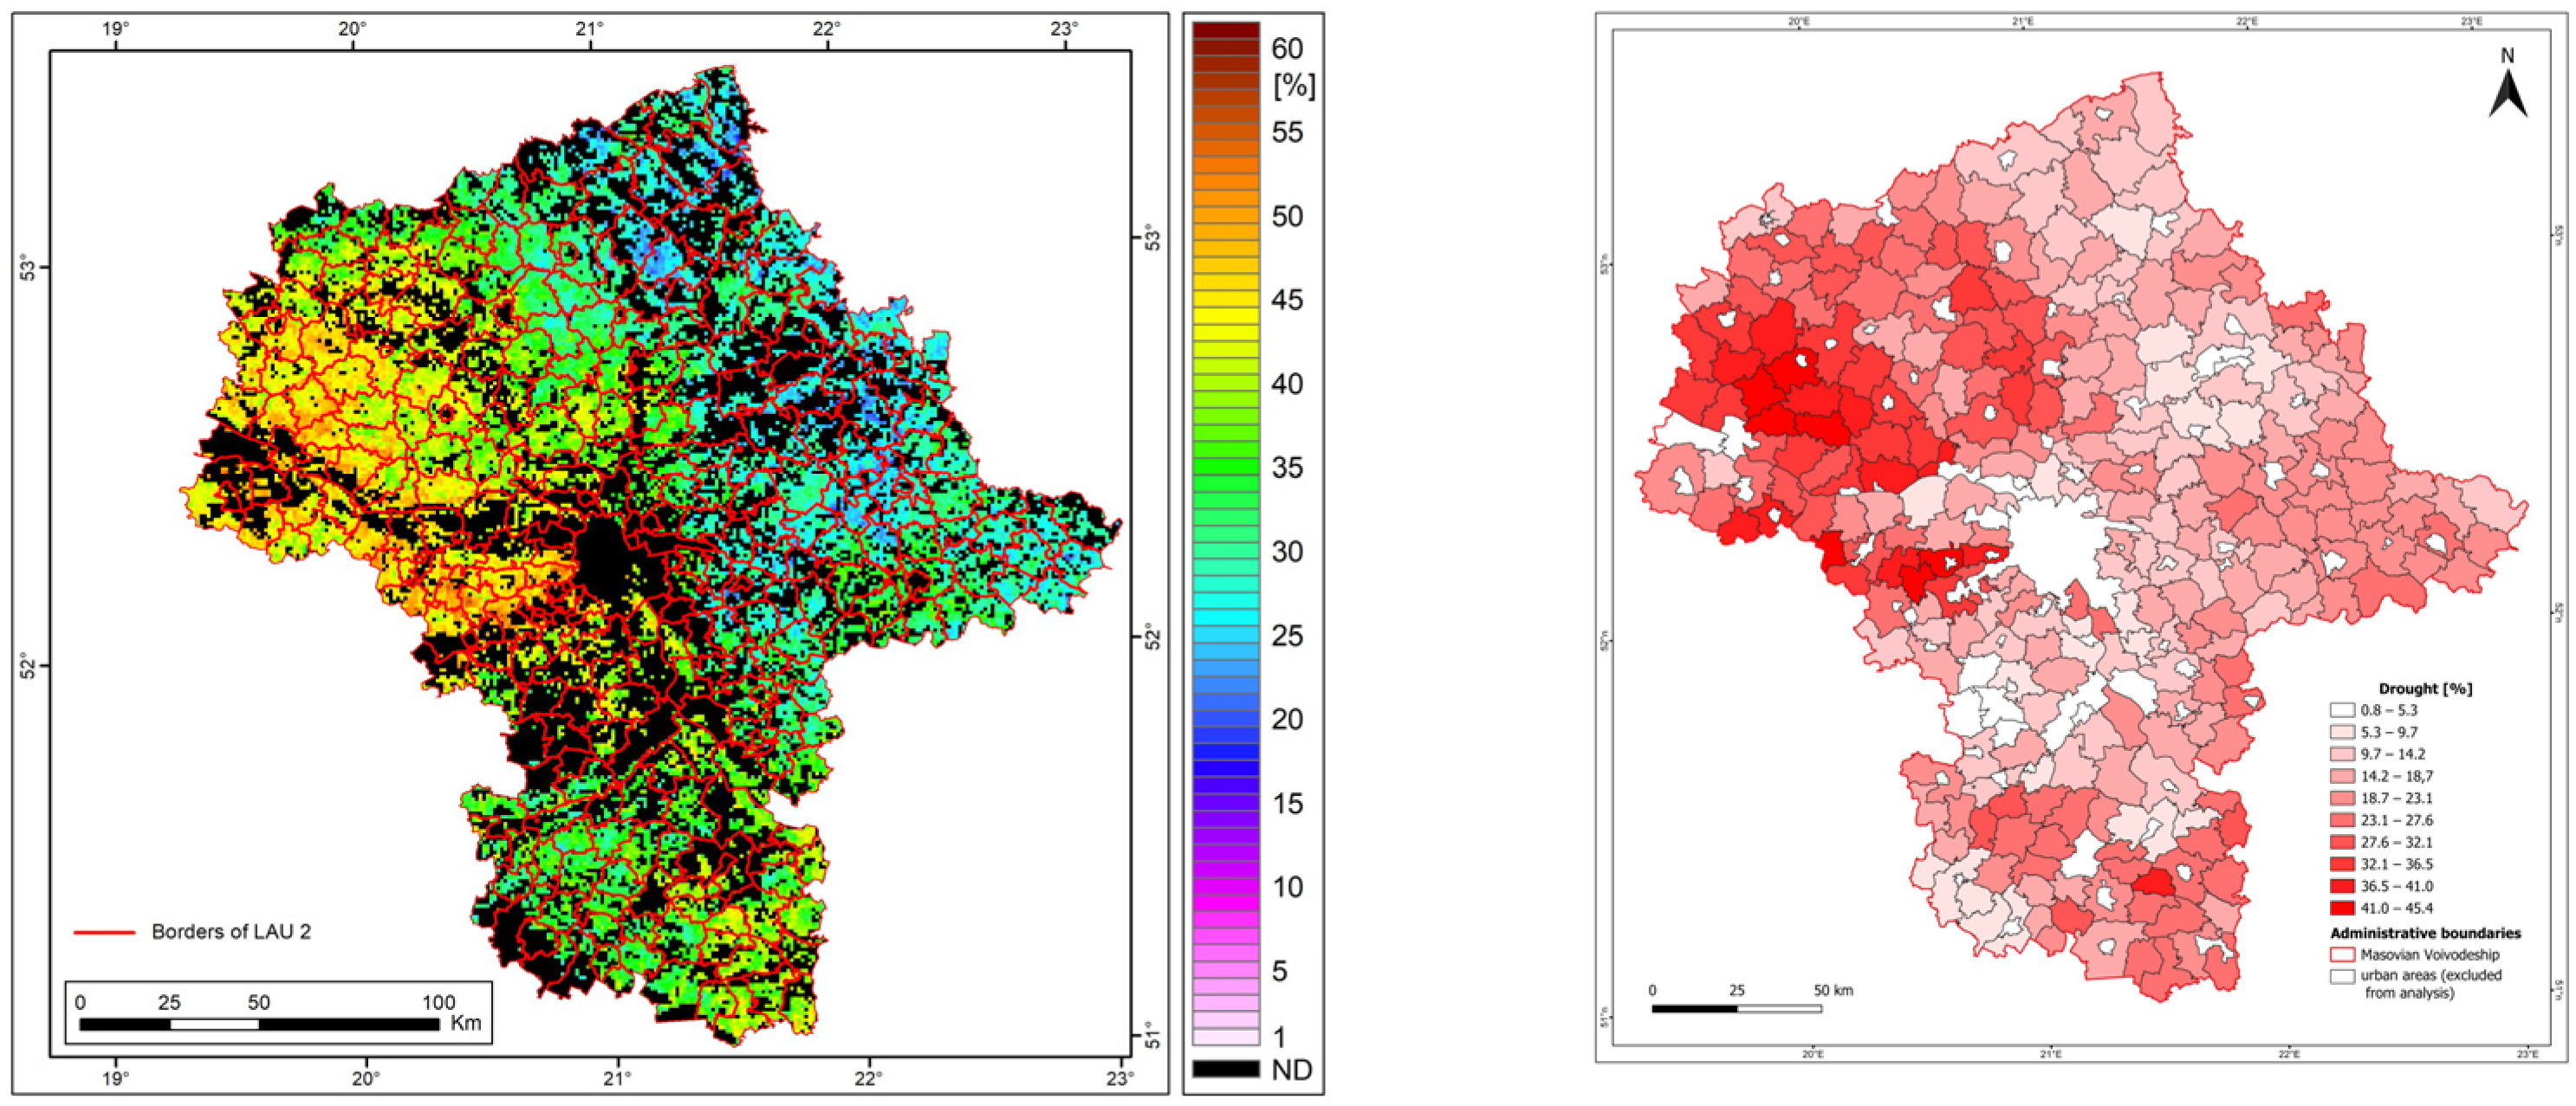
The maps in Figure 7 illustrate the frequency of drought occurrences during the growing seasons from 2001 to 2020 in the voivodeship. On the left is a map with a spatial resolution of 1 km × 1 km pixels, which reveals that agricultural areas in the western part of the Mazowieckie Voivodeship are most at risk of water shortages. The frequency of droughts in this region during the growing season from 2001 to 2020 was recorded at over 40%. In contrast, agricultural areas in the eastern and northeastern parts of the voivodeship exhibited a lower drought frequency of around 25%. On the right is a map depicting the intensification of the drought phenomenon by LAU 2, created using calculations that considered both the median and the ratio of the area affected by drought to the total area of each LAU 2 unit. These studies clearly highlight the division of the area into western LAU 2 units affected by drought in previous years and the remaining LAU 2 units where drought did not occur.
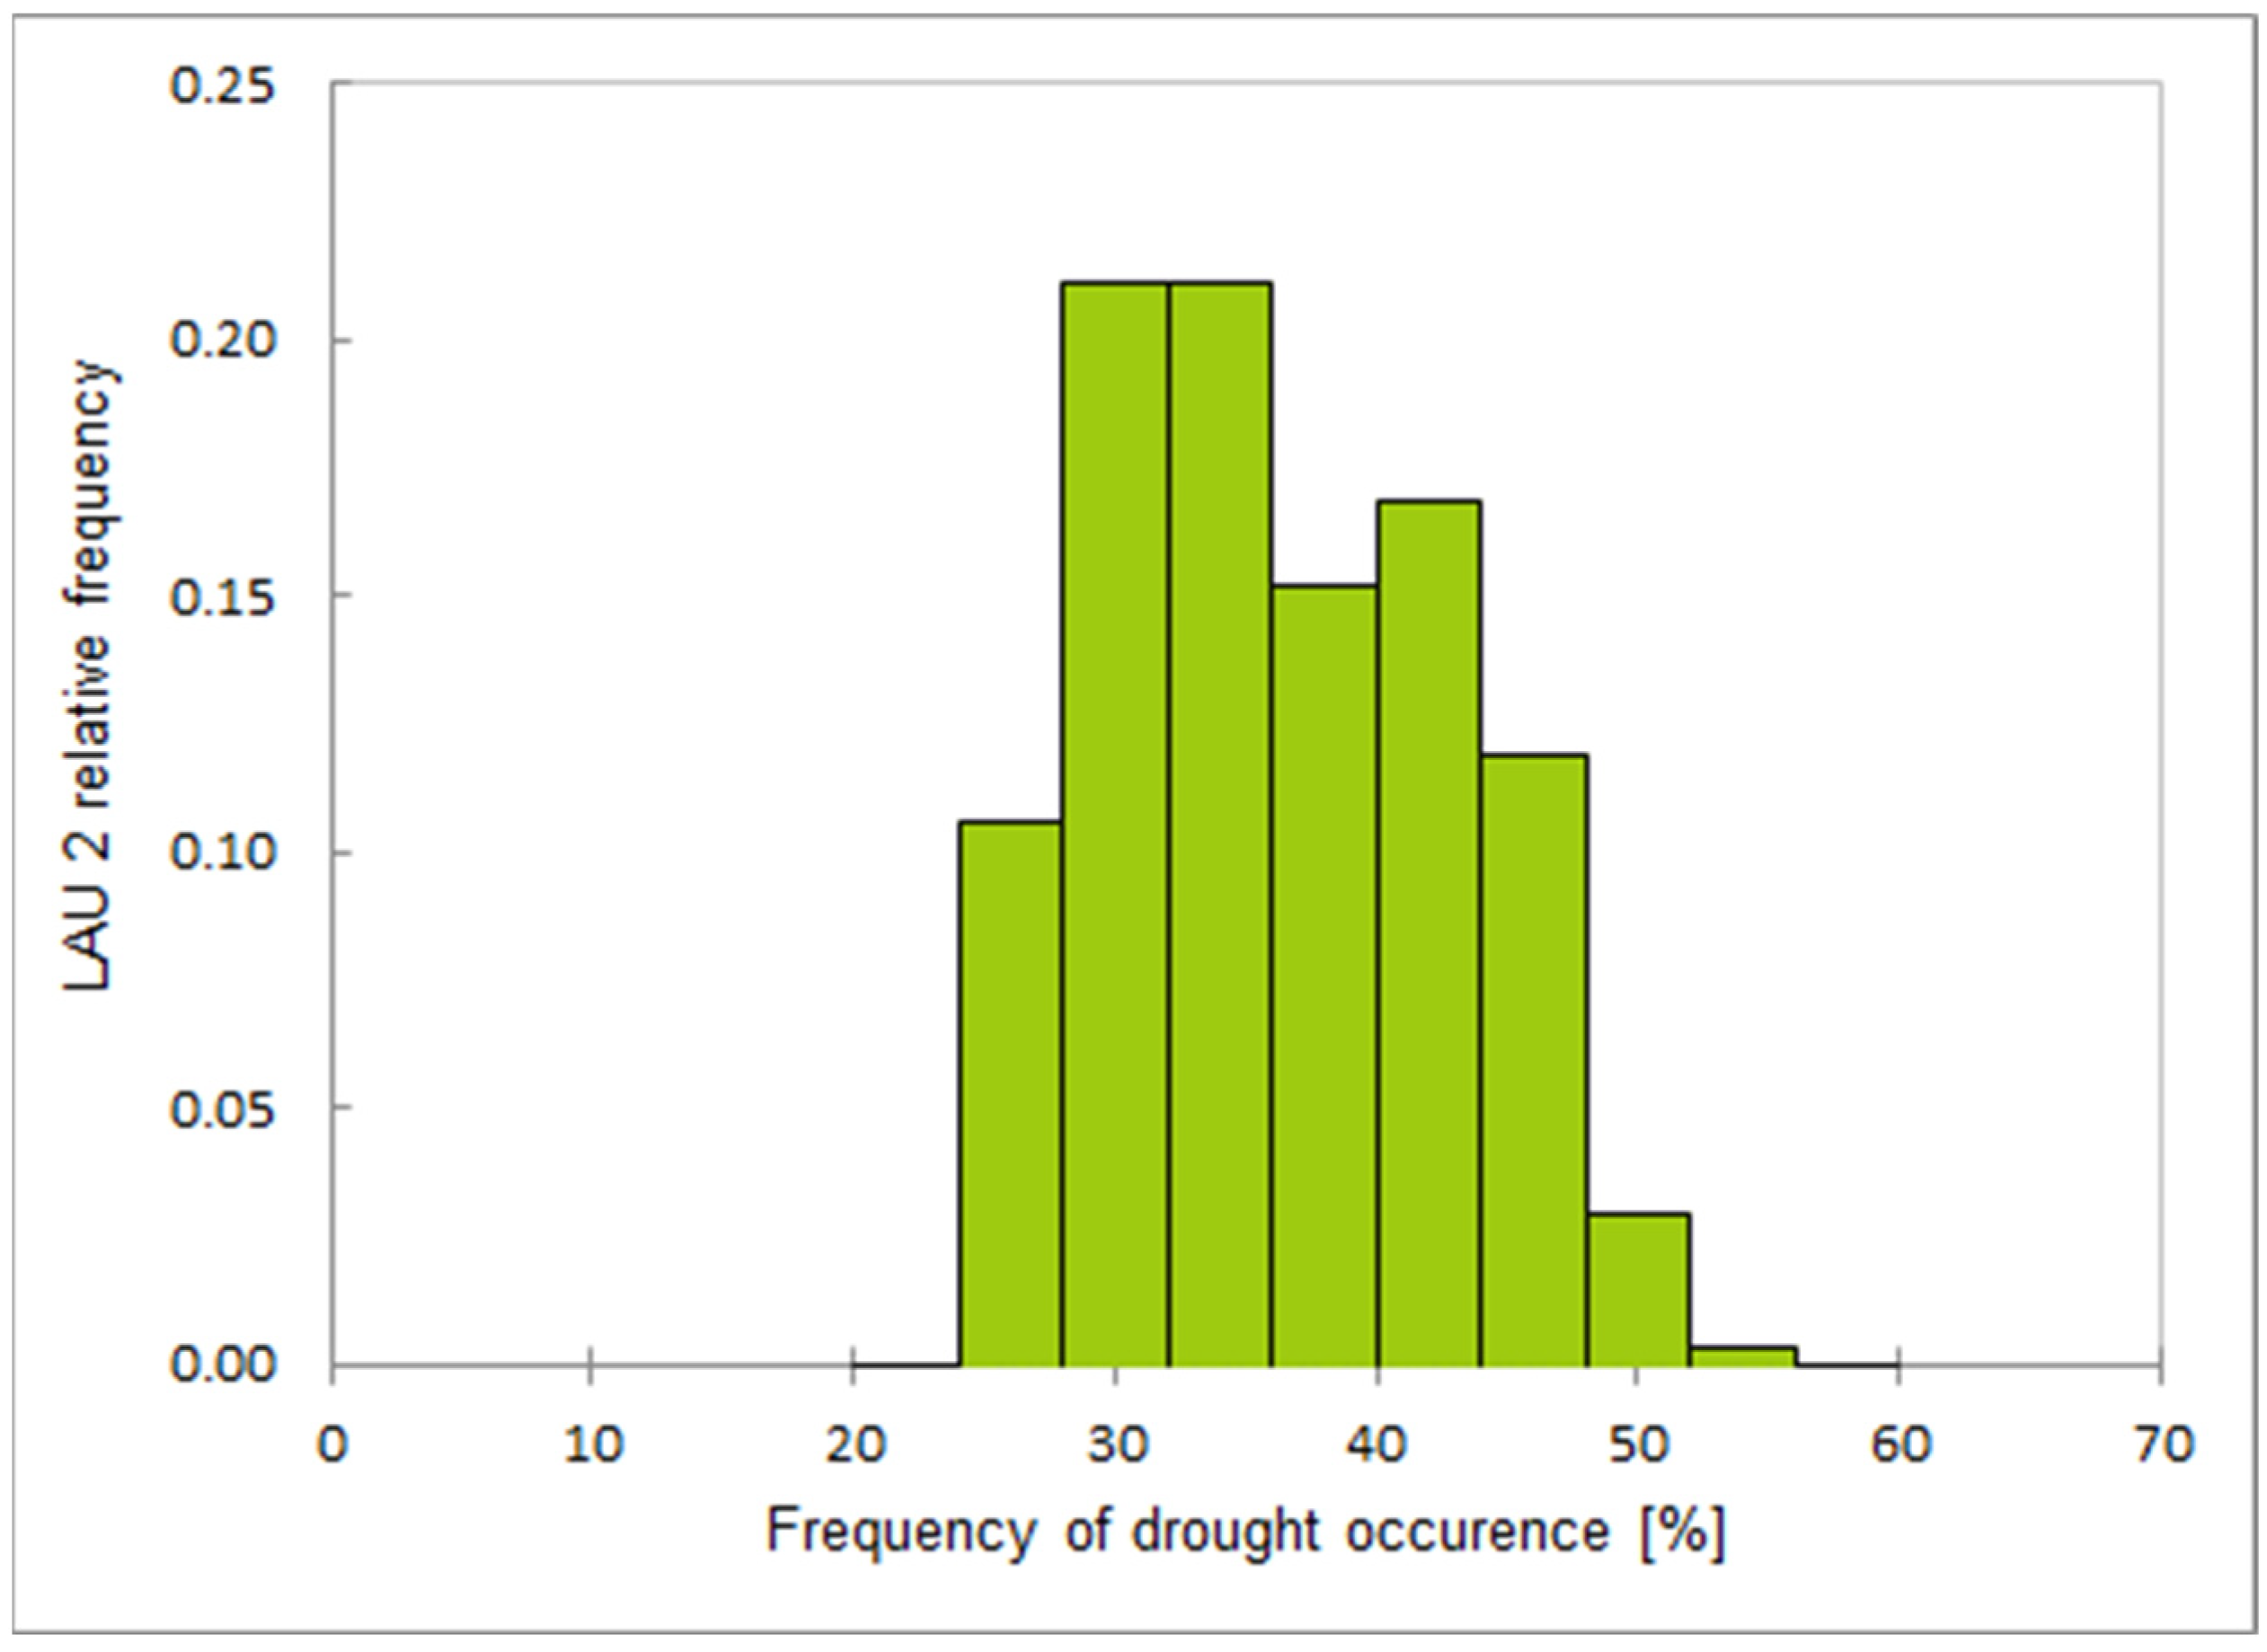
The histogram (Figure 8) illustrates the relative frequency distribution of drought occurrence among LAU 2 administrative units. The intervals on the x-axis represent different ranges of drought frequency percentages, while the y-axis shows the corresponding relative frequency percentages for each interval. The most common drought frequency range occurs in the interval of 30% to 40%, where the relative frequency peaks at approximately 0.20 (20%). Following this, the interval 40% to 50% displays the second-highest relative frequency, indicating that a significant number of LAU 2 units experience drought occurrences within this frequency range. The third most common interval is 20% to 30%, although its relative frequency is somewhat lower compared to the previous ranges. Drought frequencies beyond 50% occur less frequently, as indicated by the relatively low bar heights in these intervals. Frequencies below 20% are similarly uncommon, showing minimal representation in the dataset. The concentration of units in the central intervals suggests that most LAU 2 administrative units are moderately affected by drought occurrences.
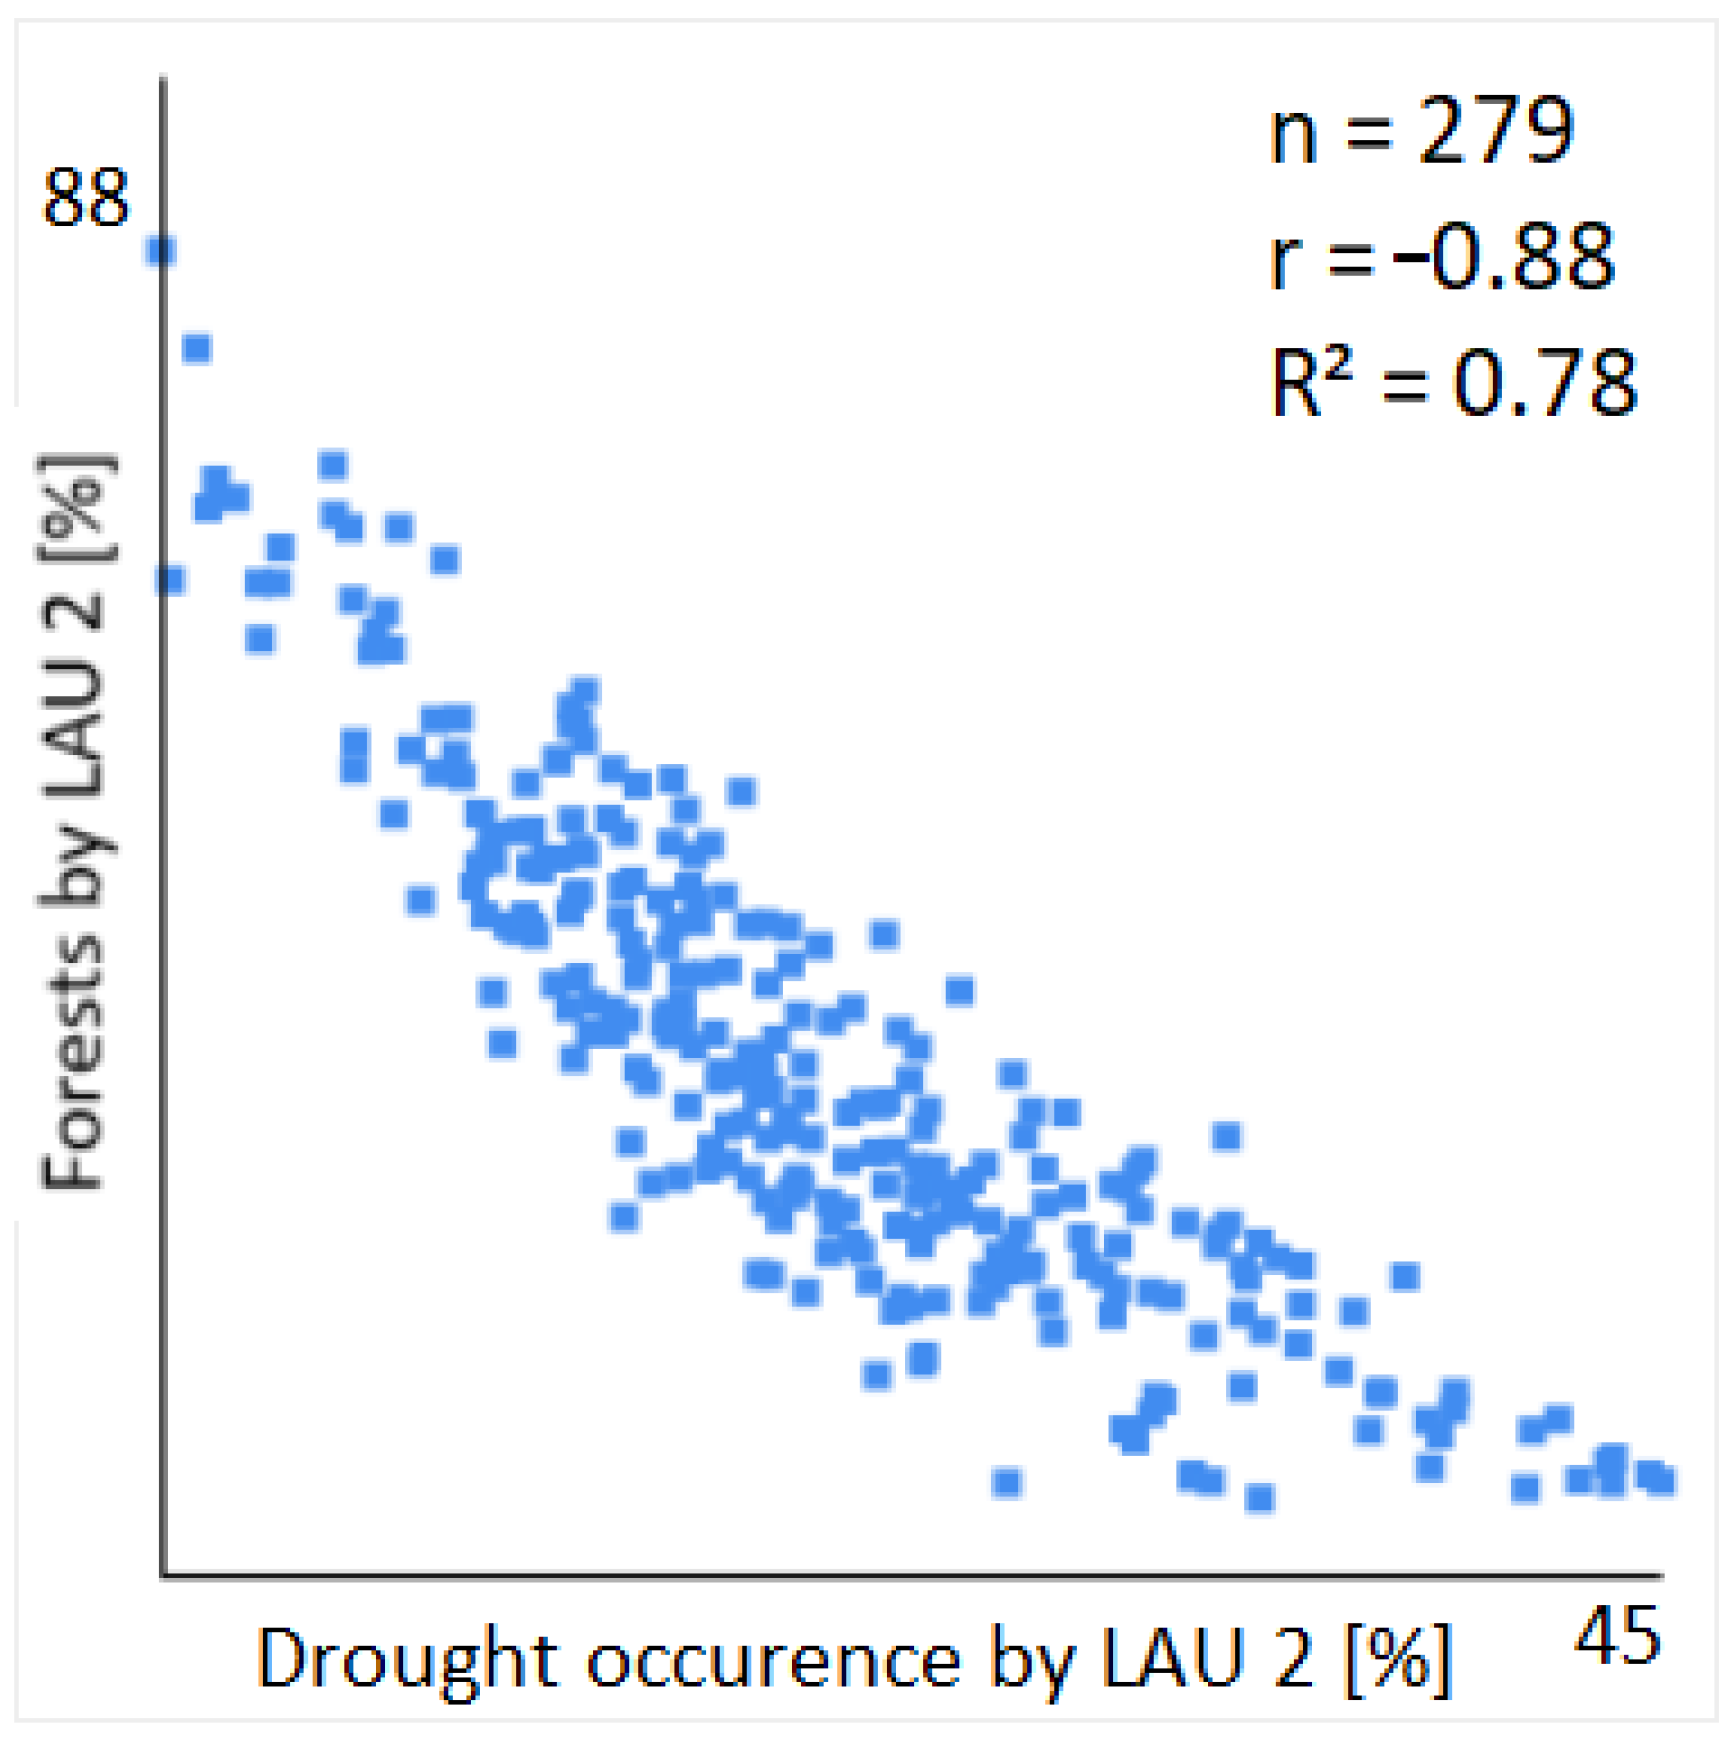
The scatter plot from Figure 9 illustrates the correlation between forest cover (%) and drought occurrence (%) at the LAU 2 level. The negative correlation coefficient (r = −0.88) indicates a strong inverse relationship, meaning that as forest cover increases, drought occurrence tends to decrease. Additionally, the coefficient of determination (R2 = 0.78) suggests that 78% of the variability in drought occurrence can be explained by forest cover, highlighting a significant association. The total number of observations (n = 279) corresponds to the LAU 2 administrative units analyzed after excluding urban municipalities. The strong negative correlation confirms that areas with higher forest cover are more resilient to drought, which could be attributed to the role of forests in maintaining soil moisture, reducing evaporation, and influencing local microclimates.
The results of the Mann–Whitney U test, presented in Table 4, reveal a highly statistically significant relationship between forest cover and drought occurrence at the LAU 2 level in the Mazowieckie Voivodeship. The p-value < 0.0001 is well below the significance threshold, leading to the rejection of the null hypothesis (H0) that assumed no difference in drought occurrence between areas with varying forest cover. Consequently, the alternative hypothesis (H1), which posits a significant difference, is accepted. The Mann–Whitney U statistic and its standardized value further reinforce the robustness of this distinction. Additionally, the expected U value and the variance of U provide further validation of the test’s reliability. These findings align with the correlation analysis, suggesting that areas with higher forest cover tend to be more resilient to drought, likely due to the role of forests in regulating local hydrological conditions and reducing drought susceptibility.

3.3. Assessment of Drought Risk

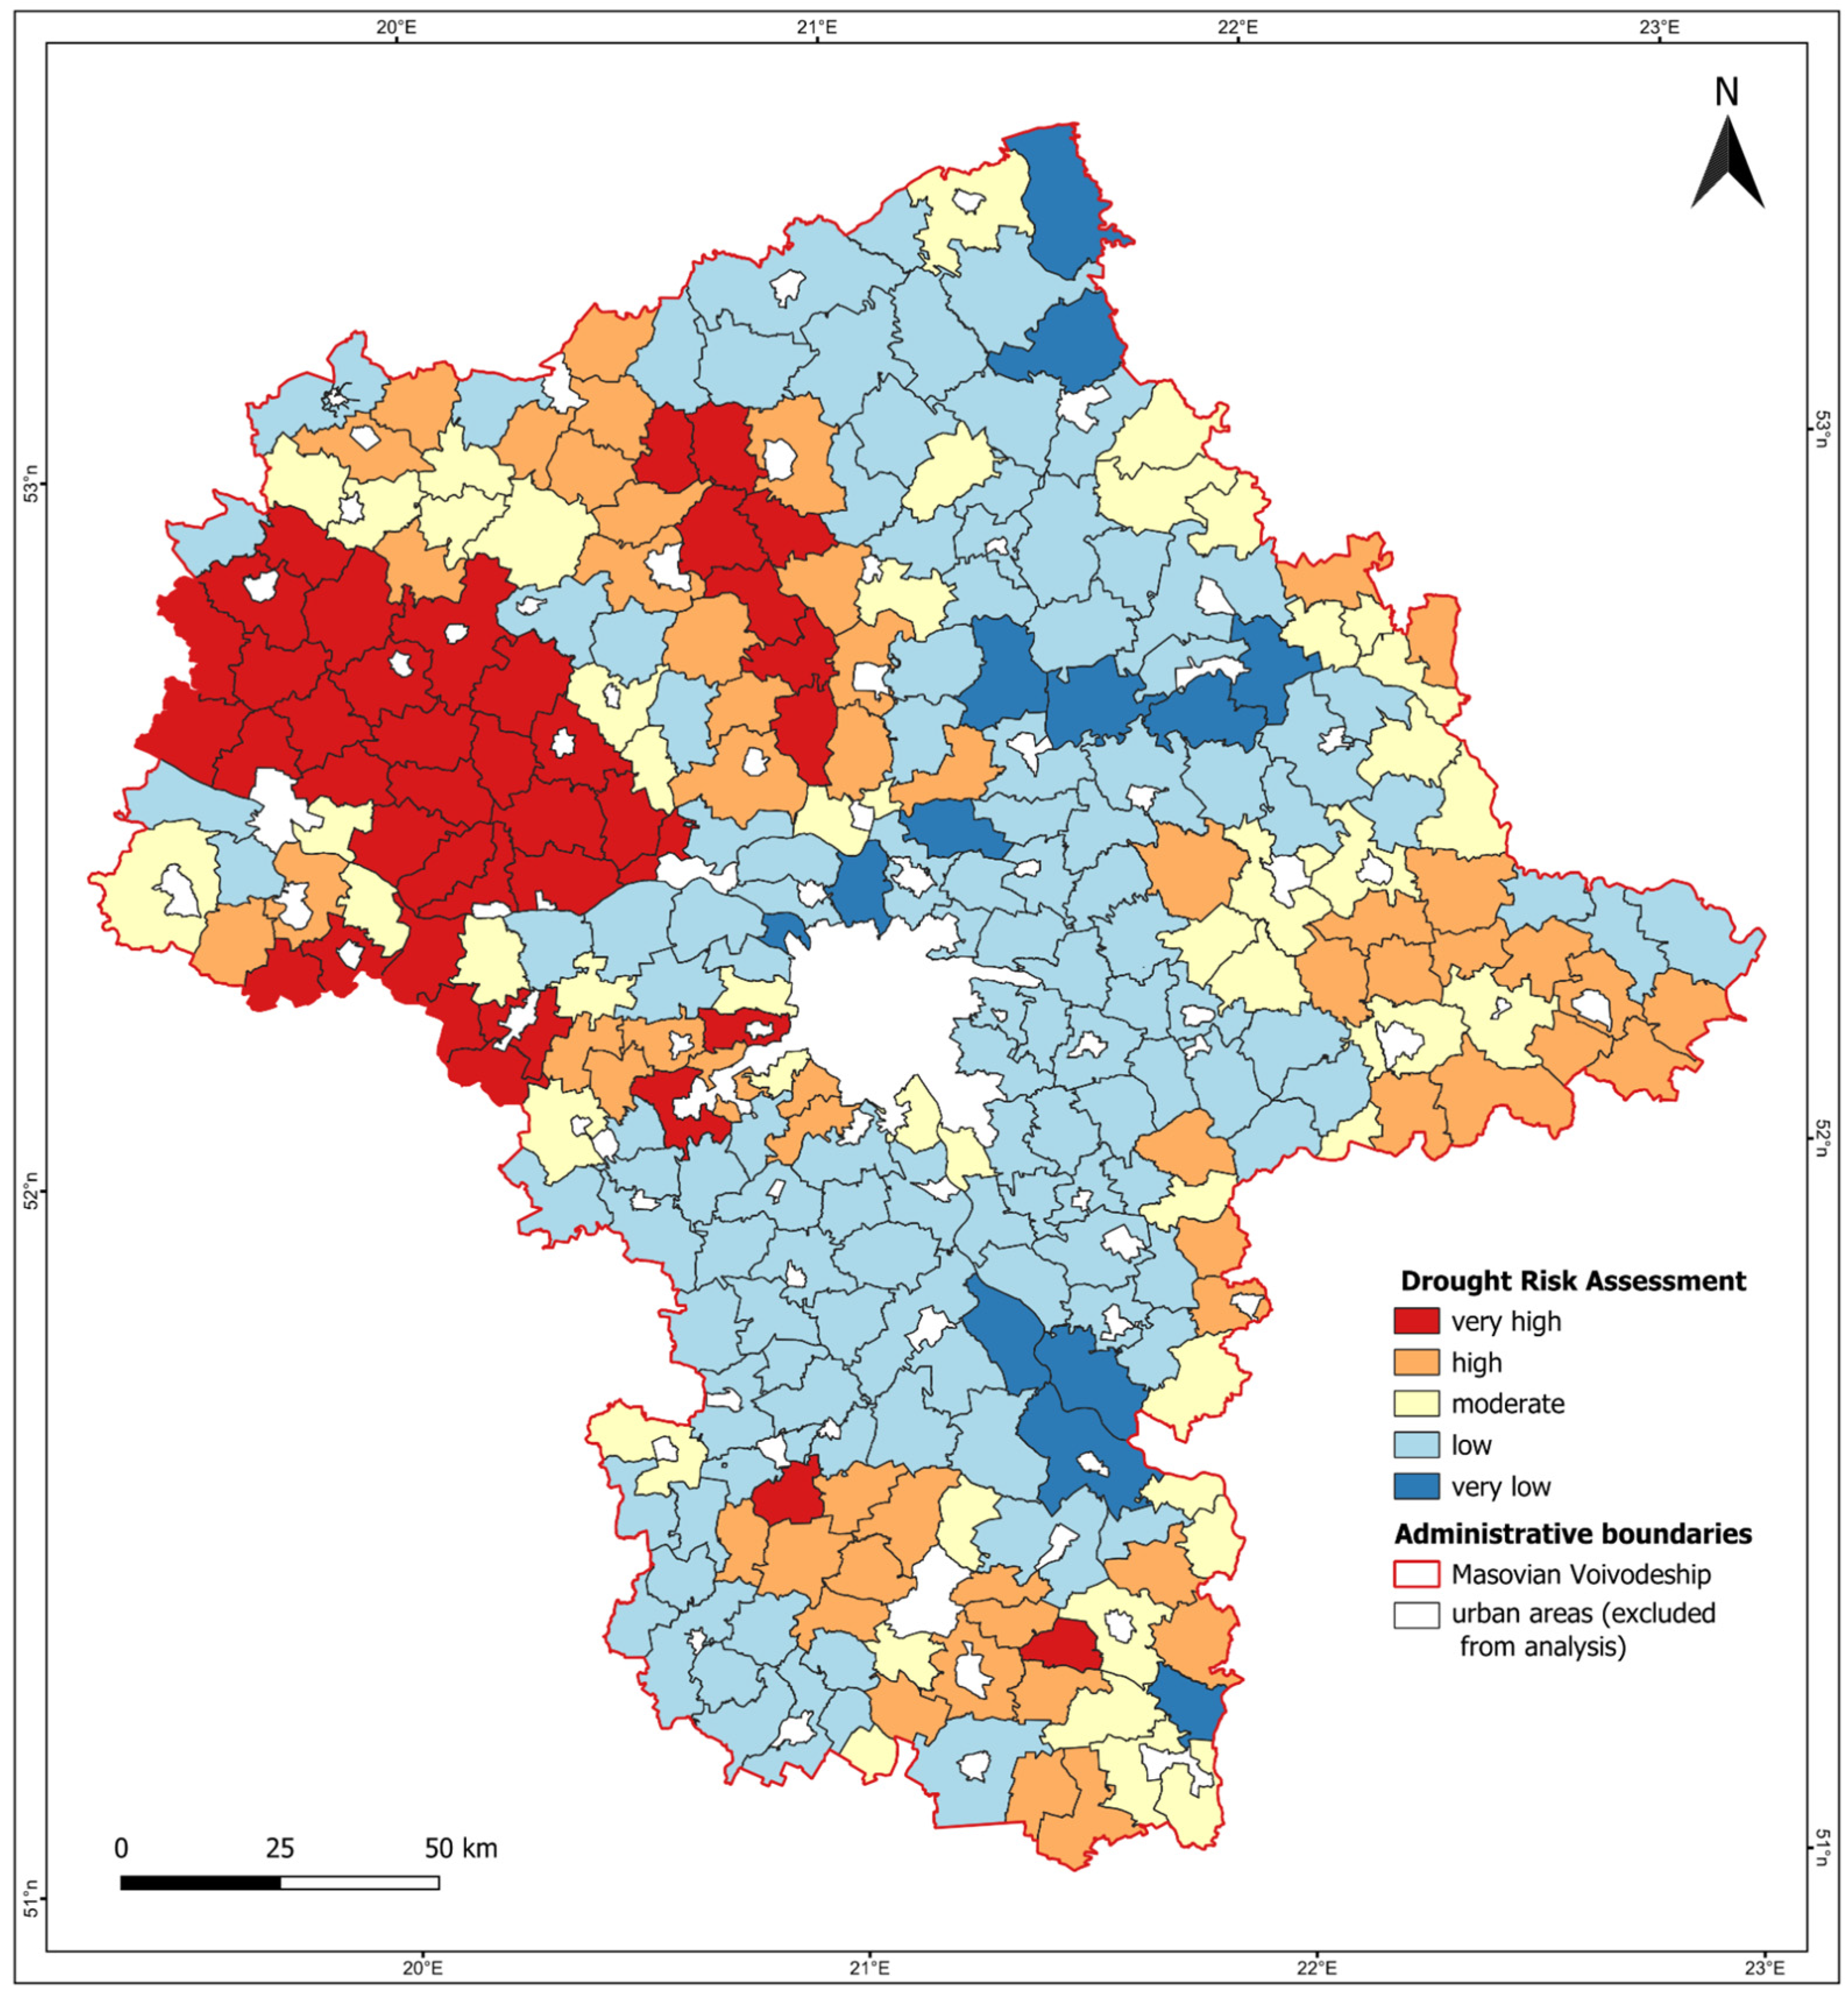
Figure 10 presents a map illustrating the spatial distribution of LAU 2-level administrative units for mitigation of the drought impact strategy based on the MCD analysis. The map, with a scale ranging from very low to very high drought resistance, enables a straightforward spatial analysis of various boundary values for areas critical in mitigating the effects of drought. It also highlights the potential of mapping LAU 2 units for mitigation strategies, taking into account the planting of trees that help reduce the impact of agricultural drought across the Mazowieckie Voivodeship.
Consequently, 13 LAU 2 administrative units in the Mazowieckie Voivodeship have a very low saturation coefficient for factors related to drought exposure (forest cover above 30%, low substrate permeability, infrequent drought occurrences during the multi-year period 2001–2020, and a high percentage of surface area occupied by surface waters and wetlands above the regional average). Therefore, there is no urgent need for field tree planting or the intensification of wasteland afforestation in these areas. As many as 120 LAU 2 level units are affected by at least one factor contributing to the intensification of high-temperature effects. A total of 48 LAU 2 units have moderate risk associated with their occurrence, characterized by two out of four unfavorable factors. A total of 58 LAU 2 units in the voivodeship have three such factors, while 40 LAU 2 units are affected by all negative environmental aspects that contribute to the formation of drought in the area and its long-term maintenance. In these administrative units, it would be appropriate to undertake actions to increase afforestation or field tree planting, which could significantly help reduce the effects of drought and locally assist in halting and preventing drought development. The LAU 2 units with very good and good conditions for coping with drought risks are marked in blue in Figure 10, where there is no urgent need for increased plantings. LAU 2 units with moderate environmental conditions are colored yellow, where two of the four factors contribute to and may worsen the effects of drought. LAU 2 units marked in orange and red have at least three factors intensifying the impact of drought, meaning that urgent actions for forest planting, field tree planting, or the development of wastelands through tree planting should be undertaken.

4. Discussion

The study for identifying drought frequency and analyzing mitigation strategies was conducted for each LAU 2 unit within the Mazowieckie Voivodeship. The analysis was carried out in rural areas, excluding urban ones. Areas identified as requiring action to mitigate the effects of frequent droughts were determined using the Zonal Statistics algorithm, which calculates values for selected environmental parameters, including HRL forest cover, water and wetland areas, impervious surfaces, as well as drought data within each LAU2 unit. Median values, sums, and the percentage share of these parameters were also computed for each administrative unit. MCD analysis with threshold selection and factor weighting was based on literature reviews [28,29,36,37]. Data processing steps, including the harmonization and integration of spatial datasets, raster format conversion, and logical summation of thematic raster layers, facilitated the creation of a final map (Figure 10) illustrating the algorithm’s assessment of LAU 2 units’ potential to mitigate drought impacts.
Landscape data from HRL datasets are crucial for environmental analysis in understanding and mitigating the impacts of drought. Among these, the results from Figure 10 and Table 2 reveal that forests stand out due to their significant role in managing temperature, retaining water, and maintaining overall environmental stability during drought conditions. The forest cover layer is particularly important as forests help regulate local climate and water cycles. Trees and vegetation provide shade, reduce evaporation, and contribute to the cooling of the surrounding environment, thus mitigating the effects of drought often exacerbated by drought. The water and wetness layer, which includes reservoirs, riverbeds, wetlands, and peatlands, plays a critical role in drought management [38]. Wetlands, especially peatlands, retain large volumes of water, acting as natural buffers by absorbing excess water during wet periods and releasing it during dry spells. Mapping with RS data on vegetation humidity and estimating biomass in Ramsar Convention wetlands not only aids in flood prevention but also helps maintain stable thermal conditions, as water bodies have a high heat capacity [39]. Water stored in lakes, ponds, or rivers requires more energy to heat up and retains heat longer, leading to smaller temperature fluctuations and a milder local climate. Biophysical parameters related to vegetation and soil characteristics, obtained from both optical and radar satellite imagery, can be used to monitor this process [40]. Lastly, the imperviousness layer, which highlights areas covered by impermeable surfaces, is vital for understanding environmental stress during droughts. Impervious surfaces prevent water from infiltrating the ground, increasing surface runoff and contributing to water scarcity. Analyzing imperviousness helps in identifying areas where tree planting or other mitigation strategies could reduce the negative effects of drought by promoting better water infiltration and retention. Together, these layers provide a comprehensive view of how the landscape interacts with water and temperature, offering key insights into how to mitigate drought impacts effectively.
Earth Observation data have been widely recognized and applied for many years in detecting and monitoring agricultural drought in Poland. EO-based indicators characterizing vegetation conditions, such as NDVI, VCI derived from AVHRR [26,41], and MODIS [42,43] sensors onboard environmental and meteorological satellites are commonly used for drought monitoring. The DISS datasets obtained from the satellite-based agricultural drought monitoring system developed primarily by Dabrowska-Zielinska [24] were developed using a sophisticated model that incorporates land surface temperature for calculating TCI and meteorological factors, air temperature, and precipitation to compute HTC. The model has been tested and validated under Polish climate conditions, both for agricultural areas [24,27] and agriculturally managed grasslands [43]. The proposed method for monitoring agricultural areas, which tracks changes in soil moisture and associated water shortage risks using satellite imagery in the optical electromagnetic spectrum, offers a new valuable tool for identifying conditions that hinder crop growth and detecting drought-affected zones. Given the annual prevalence of agricultural drought risks and the dynamic nature of extreme weather events, this approach can be used to identify areas prone to recurrent water shortages and to plan targeted actions to safeguard ecosystems from degradation. These remote sensing techniques for drought monitoring are applicable not only to agricultural land but also other land cover types such as meadows and forests.
Drought frequency was analyzed across various LAU 2 units in the Mazowieckie Voivodeship, with the DISS index specifically designed for agricultural areas, including meadows and pastures, ranging from 1% to 60% within each 1 km × 1 km pixel size. Due to the frequent occurrence of droughts in the study area, we emphasize the urgent need to develop drought information tools. RS and GIS tools are essential for implementing effective agricultural drought management plans and facilitating real-time decision-making across a significantly larger area, encompassing the entire territory of Poland. Wang [44] noted that most underdeveloped nations are situated in arid and semi-arid regions, which are particularly vulnerable to the negative impacts of climate change. Consequently, these countries are expected to face substantial rises in drought hazards, vulnerability, and risks, creating significant challenges for sustainable development. On the other hand, economically developed countries located in humid and semi-humid regions will also experience heightened drought hazards, though the changes in drought vulnerability and risk will differ by region. A critical aspect of this research involves the satellite-based identification of drought and risk assessment. Therefore, mapping agricultural drought with RS remains a subject of study in various regions, including sub-Saharan Africa [45], Southeast Asia [46], and Central Europe [47]. Studies have demonstrated that analyses based on satellite data and GIS tools are essential for spatial planning in areas at risk of drought, even on a national scale [48]. Vicente-Serrano [49] emphasized that real-time drought monitoring using geospatial data is indispensable for ensuring the effectiveness of drought preparedness plans. Khan [30] and Belal [31] stated that all drought-prone nations should develop national drought policies and preparedness plans that prioritize risk management rather than relying on the traditional reactive approach of crisis management focused solely on emergency responses.
The findings of water retention analyses in the Mazowieckie Voivodeship, corroborated by the IPCC (2023) Synthesis Report [50], underscore the critical necessity for implementing policies leveraging the synergistic integration of climate adaptation and mitigation measures. The first priority should be the expansion of the National Forest Afforestation Program (KPZL), which aimed to increase the country’s forest cover to 30% by 2020, a goal that was successfully achieved at 30.8% [51]. The program involves optimal afforestation distribution and the establishment of ecological and economic priorities. This necessitates increased funding for post-agricultural afforestation and the involvement of local governments in spatial planning, which can reduce soil erosion by up to 15–30% and which can enhance water infiltration [52]. The second crucial element involves the implementation of the Drought Consequences Mitigation Plan (PPSS) for 2021–2027, which recommends the construction of hundreds of retention reservoirs, the renaturalization of 1500 km of watercourses, and the deployment of real-time agricultural drought monitoring systems. In the context of the Mazowieckie Voivodeship, this entails prioritizing investments in channel retention (e.g., on the Mleczna and Liwiec rivers) and modernizing drainage systems across 200,000 hectares of agricultural land [53]. Cross-sectoral cooperation is crucial, as highlighted by the IPCC AR6 report, which emphasizes that climate change-related funding will need to increase by three to six times by 2030 to achieve mitigation goals. Combining afforestation, retention, and education can significantly reduce economic losses caused by drought [52].
It is important to highlight the need to further detail the results of the analysis at a local level using a more precise scale and more detailed environmental data, primarily in relation to existing tree cover. A more accurate identification of tree locations that mitigate the effects of drought should rely on data with a significantly higher level of detail. This would enable the precise identification of trees in specific, open spaces, while also incorporating the most up-to-date information, such as very high-resolution satellite data from QuickBird and WorldView-2, detailed land use information, forestry databases, natural resource inventories, and other region-specific data sources. The goal of these analyses should be to assess the impact of individual plantings and their effects on other environmental factors within the defined area, depending on its type. For field plantings, it seems particularly important to analyze the structure of agricultural landscapes and the degree of their mosaic pattern. When considering large-scale afforestation, it is advisable to analyze areas to identify agricultural fallow lands that could be successfully integrated into afforestation projects. An agricultural drought risk assessment can then be conducted using geospatial techniques with Earth Observation (EO) data, such as those from Landsat satellites [54], or by combining multi-source satellite imagery [55]. However, there are specific limitations in EO-based drought monitoring in Poland, primarily due to frequent cloud cover, which often limits the availability of sufficient data during the growing season. This challenge is particularly relevant given that Poland experiences an average of 180 days of cloud cover per year [56]. A potential solution could involve advanced methods that combine low-resolution satellite data with high-resolution data, along with modeling additional parameters such as chlorophyll fluorescence [57], or providing new drought mapping products through incorporating optical and radar data fusion [58,59].
As noted by [60], previous agricultural drought studies have primarily focused on (i) drought definitions, (ii) datasets, and (iii) methods and tools for assessing and monitoring drought risks. However, several research challenges in agricultural drought assessments have been identified in the present, and several prerequisites have been highlighted to address these gaps for future research. Anthropogenic droughts are expected to intensify due to the combined effects of environmental change and human actions. At the same time, these models can be used to explore a range of plausible policy responses and assess their outcomes. Significant uncertainties and assumptions are associated with the scenarios, which may affect the results. Our research in this direction may lead to policies and management strategies aimed at mitigating the impacts of droughts. However, currently available models are limited in both time and space, making it difficult to study the effects of short-term and regional shocks [61].

5. Conclusions

A multi-criteria decision analysis for identifying areas that require enhanced retention capabilities in the Mazowieckie Voivodeship was developed through the implementation of this study. However, this method can also be effectively extended to larger regions, including the entire country of Poland. The proposed approach for identifying agricultural areas where increased protection against drought impacts should be prioritized through intensified planting efforts and where actions to raise awareness among farmers are necessary yielded objective results. It also facilitated a comprehensive analysis of the entire voivodeship by identifying unfavorable conditions related to vegetation, using satellite imagery.
It is crucial to establish and promote an early warning system that alerts communities about impending droughts, allowing them to take timely preventive steps. The distribution of drought relief funds should be guided by weather data and drought impact maps to ensure that the most affected farmers receive adequate support. Continuous, government-funded research on drought is essential to keep the public well-informed and prepared. In light of changing climate patterns, it is necessary to design and plan infrastructure, agricultural systems, and buildings to be drought-resilient, minimizing potential damage. Stakeholder engagement plays a pivotal role in the success of drought mitigation efforts, ensuring that both policy development and implementation are aligned with local needs and environmental conditions. Collaboration between governmental agencies, local authorities, farmers, and environmental organizations is crucial for designing and adopting effective retention and afforestation strategies. By integrating stakeholders into decision-making processes, it is possible to enhance public awareness, encourage best practices in water management, and promote sustainable land-use changes. Strengthening participatory approaches will not only improve the efficiency of drought mitigation measures but will also foster long-term resilience at the regional level. Adopting and applying these strategies effectively will help mitigate and manage drought risks in the region [52].

Author Contributions

Conceptualization, M.Ł. and M.B.; methodology, M.Ł. and M.B.; software, M.Ł.; validation, M.Ł. and M.B.; formal analysis, M.Ł. and M.B.; investigation, M.Ł. and M.B.; resources, M.B.; data curation, M.Ł. and M.B.; writing—original draft preparation, M.B. and M.Ł.; writing—review and editing, M.Ł. and M.B.; visualization, M.Ł. and M.B.; supervision, M.B.; project administration, M.Ł.; funding acquisition, M.Ł. All authors have read and agreed to the published version of the manuscript.

Funding

This research was funded by The Office of the Marshal of the Mazowieckie Voivodeship in Warsaw under grant number W/UMWM-UU/UM/CG/5258/2020, entitled “Implementation of Smart Villages concept in Mazowieckie Voivodeship”.

Data Availability Statement

The datasets used and analysed during the current study are available from the corresponding author on reasonable request.

Conflicts of Interest

The authors declare no conflicts of interest.

References

  1. Intergovernmental Panel On Climate Change (IPCC). Climate Change 2022—Impacts, Adaptation and Vulnerability: Working Group II Contribution to the Sixth Assessment Report of the Intergovernmental Panel on Climate Change, 1st ed.; Cambridge University Press: Cambridge, UK, 2023; ISBN 978-1-00-932584-4. [Google Scholar]
  2. Wiebe, K.; Lotze-Campen, H.; Sands, R.; Tabeau, A.; Van Der Mensbrugghe, D.; Biewald, A.; Bodirsky, B.; Islam, S.; Kavallari, A.; Mason-D’Croz, D.; et al. Climate Change Impacts on Agriculture in 2050 under a Range of Plausible Socioeconomic and Emissions Scenarios. Environ. Res. Lett. 2015, 10, 085010. [Google Scholar] [CrossRef]
  3. Lesk, C.; Rowhani, P.; Ramankutty, N. Influence of Extreme Weather Disasters on Global Crop Production. Nature 2016, 529, 84–87. [Google Scholar] [CrossRef] [PubMed]
  4. Bartoszek, K.; Matuszko, D.; Węglarczyk, S. Trends in Sunshine Duration in Poland (1971–2018). Int. J. Climatol. 2021, 41, 73–91. [Google Scholar] [CrossRef]
  5. NIK Report No. 192/2020/P/20/043/KRR, 2020 Entitled “Przeciwdziałanie Niedoborom Wody w Rolnictwie”. Available online: https://www.nik.gov.pl/plik/id,23582,vp,26318.pdf (accessed on 18 May 2022). (In Polish)
  6. Kalbarczyk, R.; Kalbarczyk, E. Research into Meteorological Drought in Poland during the Growing Season from 1951 to 2020 Using the Standardized Precipitation Index. Agronomy 2022, 12, 2035. [Google Scholar] [CrossRef]
  7. Arun Kumar, K.C.; Reddy, G.P.O.; Masilamani, P.; Turkar, S.Y.; Sandeep, P. Integrated Drought Monitoring Index: A Tool to Monitor Agricultural Drought by Using Time-Series Datasets of Space-Based Earth Observation Satellites. Adv. Space Res. 2021, 67, 298–315. [Google Scholar] [CrossRef]
  8. Mashala, M.J.; Dube, T.; Mudereri, B.T.; Ayisi, K.K.; Ramudzuli, M.R. A Systematic Review on Advancements in Remote Sensing for Assessing and Monitoring Land Use and Land Cover Changes Impacts on Surface Water Resources in Semi-Arid Tropical Environments. Remote Sens. 2023, 15, 3926. [Google Scholar] [CrossRef]
  9. Patel, R.; Patel, A. Evaluating the impact of climate change on drought risk in semi-arid region using GIS technique. Results Eng. 2024, 21, 101957. [Google Scholar] [CrossRef]
  10. Wang, J.; Wang, Y.; Li, G.; Qi, Z. Integration of Remote Sensing and Machine Learning for Precision Agriculture: A Comprehensive Perspective on Applications. Agronomy 2024, 14, 1975. [Google Scholar] [CrossRef]
  11. Pizzorni, M.; Innocenti, A.; Tollin, N. Droughts and floods in a changing climate and implications for multi-hazard urban planning: A review. City Environ. Interact. 2024, 24, 100169. [Google Scholar] [CrossRef]
  12. Ward, P.J.; de Ruiter, M.C.; Mård, J.; Schröter, K.; Van Loon, A.; Veldkamp, T.; von Uexkull, N.; Wanders, N.; AghaKouchak, A.; Arnbjerg-Nielsen, K.; et al. The need to integrate flood and drought disaster risk reduction strategies. Water Secur. 2020, 11, 100070. [Google Scholar] [CrossRef]
  13. Woś, A. Klimat Polski; Wydawnictwo Naukowe PWN: Warsaw, Poland, 1999. (In Polish) [Google Scholar]
  14. Wójcik, M.; Traczyk, A. Changes in the Spatial Organisation of Fruit Growing at the Beginning of the 21St Century: The Case of Grójec Poviat (Mazovia Voivodeship, Poland). Quaest. Geogr. 2017, 36, 71–84. [Google Scholar] [CrossRef]
  15. Kondracki, J. Regiony Fizycznogeograficzne Polski; Wydawnictwa Uniwersytetu Warszawskiego: Warszawa, Poland, 1977. (In Polish) [Google Scholar]
  16. Borzęcka, I.; Buras, P.; Szlakowski, J.; Gasiński, Z.; Wiśniewolski, W. The fish fauna in selected rivers of Mazovian Lowland. Fragm. Faun. 2012, 55, 75–90. [Google Scholar] [CrossRef]
  17. Ostaszewska, K.; Richling, A. Geografia Fizyczna Polski; Wydawnictwo Naukowe PWN: Warsaw, Poland, 2005; ISBN 83-01-14426-2. (In Polish) [Google Scholar]
  18. Śleszyński, P. Klasyfikacja gmin województwa mazowieckiego= Classification of gminas in Poland’s Mazowieckie voivodship. Przegląd Geogr. 2012, 84, 559–576. (In Polish) [Google Scholar] [CrossRef]
  19. Forest Type 2018 (Raster 10 m), Europe, 3-Yearly. Available online: https://doi.org/10.2909/59b0620c-7bb4-4c82-b3ce-f16715573137 (accessed on 28 October 2022).
  20. Small Woody Features 2018 (Raster 5 m), Europe, 3-Yearly. Available online: https://doi.org/10.2909/a8e683b1-2f96-45c8-827f-580a79413018 (accessed on 28 October 2022).
  21. Tree Cover Density 2018 (Raster 10 m), Europe, 3-Yearly. Available online: https://doi.org/10.2909/486f77da-d605-423e-93a9-680760ab6791 (accessed on 28 October 2022).
  22. Water and Wetness 2018 (Raster 10 m), Europe, 3-Yearly. Available online: https://doi.org/10.2909/7992f641-bf77-47b7-b0c1-74fc832b78b1 (accessed on 28 October 2022).
  23. Imperviousness Density 2018 (Raster 10 m), Europe, 3-Yearly. Available online: https://doi.org/10.2909/3bf542bd-eebd-4d73-b53c-a0243f2ed862 (accessed on 28 October 2022).
  24. Dabrowska-Zielinska, K.; Malinska, A.; Bochenek, Z.; Bartold, M.; Gurdak, R.; Paradowski, K.; Lagiewska, M. Drought Model DISS Based on the Fusion of Satellite and Meteorological Data under Variable Climatic Conditions. Remote Sens. 2020, 12, 2944. [Google Scholar] [CrossRef]
  25. Local Administrative Units (LAU). Available online: https://ec.europa.eu/eurostat/web/nuts/local-administrative-units (accessed on 28 October 2022).
  26. Turlej, K.; Bojanowski, J.; Bartold, M. Maska obszarów rolniczych dostosowana do monitoringu wzrostu roślin uprawnych w Polsce przy użyciu szeregów czasowych NOAA-AVHRR. Arch. Fotogram. Kartogr. I Teledetekcji 2013, 25, 233–242. (In Polish) [Google Scholar]
  27. Dabrowska-Zielinska, K.; Bochenek, Z.; Malinska, A.; Bartold, M.; Gurdak, R.; Lagiewska, M.; Paradowski, K. Drought Assessment Applying Joined Meteorological and Satellite Data. In Proceedings of the 2021 IEEE International Geoscience and Remote Sensing Symposium IGARSS, Brussels, Belgium, 11–16 July 2021; pp. 6591–6594. [Google Scholar] [CrossRef]
  28. Penny, J.; Khadka, D.; Alves, P.B.; Chen, A.S.; Djordjević, S. Using multi criteria decision analysis in a geographical information system framework to assess drought risk. Water Res. X 2023, 20, 100190. [Google Scholar] [CrossRef]
  29. Dolui, G.; Das, N.; Guchhait, S.; Roy, S. Multi-Criteria Decision-Making Approach Using Remote Sensing and GIS for Assessment of Groundwater Resources; Springer: Berlin/Heidelberg, Germany, 2021; pp. 59–79. [Google Scholar] [CrossRef]
  30. Khan, K.A.; Hashmi, M.A. Drought Mitigation and Preparedness Planning using RS and GIS. In Proceedings of the 2006 International Conference on Advances in Space Technologies, Islamabad, Pakistan, 2–3 September 2006; pp. 136–141. [Google Scholar] [CrossRef]
  31. Belal, A.-A.; El-Ramady, H.R.; Mohamed, E.S.; Saleh, A.M. Drought risk assessment using remote sensing and GIS techniques. Arab. J. Geosci. 2014, 7, 35–53. [Google Scholar] [CrossRef]
  32. Galiński, M.; Siwek, G.; Szuwarski, J. Metoda Bonitacji Punktowej Jako Narzędzie Waloryzacji Zjawisk Przestrzennych. Geomatyka I Inżynieria 2013, 2, 5–20. [Google Scholar]
  33. Bartkowski, T. O Metodyce Oceny Środowiska Geograficznego. Przegląd Geogr. 1971, 53, 263–281. (In Polish) [Google Scholar]
  34. Sołowiej, D. Podstawy Metodyki Oceny Środowiska Przyrodniczego Człowieka; Wydawnictwo Naukowe Uniwersytetu im. Adama Mickiewicza: Poznań, Poland, 1992. (In Polish) [Google Scholar]
  35. Litwin, U.; Bacior, S.; Piech, I. Metodyka waloryzacji i oceny krajobrazu. Geod. Kartogr. I Fotogram. 2009, 71, 14–25. (In Polish) [Google Scholar]
  36. Abuzar, M.K.; Mahmood, S.A.; Sarwar, F.; Saleem, A.R.; Khubaib, N.; Malik, A.H.; Shaista, S. Drought risk assessment using GIS and remote sensing: A case study of District Khushab, Pakistan. In Proceedings of the 15th International Conference on Environmental Science and Technology, Rhodes, Greece, 31 August–2 September 2017. [Google Scholar]
  37. Ihinegbu, C.; Ogunwumi, T. Multi-criteria modelling of drought: A study of Brandenburg Federal State, Germany. Model. Earth Syst. Environ. 2022, 8, 2035–2049. [Google Scholar] [CrossRef]
  38. Dembek, W.; Oświt, J. Niektóre aspekty roli mokradeł w gospodarce wodnej krajobrazu. Some aspects of the role of wetlands in the water management). Wiadomości Melior. I Łąkarskie 1989, 8, 150–161. (In Polish) [Google Scholar]
  39. Dabrowska-Zielinska, K.; Budzynska, M.; Tomaszewska, M.; Bartold, M.; Gatkowska, M. The study of multifrequency microwave satellite images for vegetation biomass and humidity of the area under Ramsar convention. In Proceedings of the 2015 IEEE International Geoscience and Remote Sensing Symposium (IGARSS), Milan, Italy, 26–31 July 2015; pp. 5198–5200. [Google Scholar] [CrossRef]
  40. Dąbrowska-Zielińska, K.; Budzyńska, M.; Kowalik, W.; Małek, I.; Gatkowska, M.; Bartold, M.; Turlej, K. Biophysical Parameters Assessed from Microwave and Optical Data. Int. J. Electron. Telecommun. 2012, 58, 99–104. [Google Scholar] [CrossRef]
  41. Dąbrowska-Zielińska, K.; Ciołkosz, A.; Malińska, A.; Bartold, M. Monitoring of agricultural drought in Poland using data derived from environmental satellite images. Geoinf. Issues 2011, 3, 87–97. [Google Scholar] [CrossRef]
  42. Bojanowski, J.S.; Sikora, S.; Musiał, J.P.; Woźniak, E.; Dąbrowska-Zielińska, K.; Slesiński, P.; Milewski, T.; Łączyński, A. Integration of Sentinel-3 and MODIS Vegetation Indices with ERA-5 Agro-Meteorological Indicators for Operational Crop Yield Forecasting. Remote Sens. 2022, 14, 1238. [Google Scholar] [CrossRef]
  43. Bartold, M.; Wróblewski, K.; Kluczek, M.; Dąbrowska-Zielińska, K.; Goliński, P. Examining the Sensitivity of Satellite-Derived Vegetation Indices to Plant Drought Stress in Grasslands in Poland. Plants 2024, 13, 2319. [Google Scholar] [CrossRef]
  44. Wang, T.; Sun, F. Integrated drought vulnerability and risk assessment for future scenarios: An indicator based analysis. Sci. Total Environ. 2023, 900, 165591. [Google Scholar] [CrossRef]
  45. Fava, F.; Vrieling, A. Earth Observation for Drought Risk Financing in Pastoral Systems of Sub-Saharan Africa. Curr. Opin. Environ. Sustain. 2021, 48, 44–52. [Google Scholar] [CrossRef]
  46. Ha, T.V.; Huth, J.; Bachofer, F.; Kuenzer, C. A Review of Earth Observation-Based Drought Studies in Southeast Asia. Remote Sens. 2022, 14, 3763. [Google Scholar] [CrossRef]
  47. Crocetti, L.; Forkel, M.; Fischer, M.; Jurečka, F.; Grlj, A.; Salentinig, A.; Trnka, M.; Anderson, M.; Ng, W.-T.; Kokalj, Ž.; et al. Earth observation for agricultural drought monitoring in the Pannonian Basin (Southeastern Europe): Current state and future directions. Reg. Environ. Chang. 2020, 20, 123. [Google Scholar] [CrossRef]
  48. Singh, G.; Das, N.N.; Prasad, P.V. Geospatial monitoring and analysis of agricultural drought to identify hotspots and risk assessment for Senegal. Geogr. Sustain. 2024, 6, 100248. [Google Scholar] [CrossRef]
  49. Vicente-Serrano, S.M.; Beguería, S.; Gimeno, L.; Eklundh, L.; Giuliani, G.; Weston, D.; El Kenawy, A.; López-Moreno, J.I.; Nieto, R.; Ayenew, T.; et al. Challenges for drought mitigation in Africa: The potential use of geospatial data and drought information systems. Appl. Geogr. 2012, 34, 471–486. [Google Scholar] [CrossRef]
  50. IPCC. 2023: Sections. In Climate Change 2023: Synthesis Report. Contribution of Working Groups I, II and III to the Sixth Assessment Report of the Intergovernmental Panel on Climate Change; Core Writing Team, Lee, H., Romero, J., Eds.; IPCC: Geneva, Switzerland; pp. 35–115. [CrossRef]
  51. Ministry of Climate and Environment; Department of Forestry and Hunting. Information on the State of Forests and the Implementation of the National Forest Afforestation Program in 2019 Warsaw. Available online: https://www.gov.pl/attachment/1c4d8d8e-c93a-40ce-8c05-5cd691fe3182 (accessed on 20 November 2024).
  52. Council of Ministers of Poland; Ministry of Environment. Program for Counteracting Water Shortage for the Years 2023–2027 with a Perspective to 2030 (Resolution No. 152 of August 22, 2023). Monitor Polski, Item 1119. Available online: https://isap.sejm.gov.pl/isap.nsf/download.xsp/WMP20230001119/O/M20231119.pdf (accessed on 3 December 2024).
  53. Minister of Infrastructure. Regulation Regarding the Adoption of the Drought Consequences Mitigation Plan (Dz.U. 2021 poz. 1615) Dziennik Ustaw, 3 September 2021. Available online: https://dziennikustaw.gov.pl/DU/2021/1615 (accessed on 25 November 2024). (In Polish)
  54. Gao, F.; Zhang, S.; Yu, R.; Zhao, Y.; Chen, Y.; Zhang, Y. Agricultural Drought Risk Assessment Based on a Comprehensive Model Using Geospatial Techniques in Songnen Plain, China. Land 2023, 12, 1184. [Google Scholar] [CrossRef]
  55. Badarneh, O.; Hazaymeh, K.; Almagbile, A.; Al Shogoor, S. Remote sensing-based agricultural drought mapping in Northern Jordan using Landsat and MODIS data. Environ. Adv. 2024, 18, 100602. [Google Scholar] [CrossRef]
  56. Wojciechowska, I.; Kotarba, A.; Żmudzka, E. Cloud type frequency over Poland (2003–2021) revealed by independent satellite-based (MODIS) and surface-based (SYNOP) observations. Int. J. Clim. 2023, 43, 5208–5226. [Google Scholar] [CrossRef]
  57. Gurdak, R.; Bartold, M. Remote Sensing Techniques to Assess Chlorophyll Fluorescence in Support of Crop Monitoring in Poland. Misc. Geogr. 2021, 25, 226–237. [Google Scholar] [CrossRef]
  58. Gurdak, R.; Dabrowska-Zielinska, K.; Bochenek, Z.; Kluczek, M.; Bartold, M.; Newete, S.W.; Chirima, G.J. 2021, Crop Growth Monitoring and Yield Prediction System Applying Copernicus Data for Poland & South Africa. In Proceedings of the 2021 IEEE International Geoscience and Remote Sensing Symposium IGARSS, Brussels, Belgium, 11–16 July 2021; pp. 6564–6567. [Google Scholar] [CrossRef]
  59. Moreno, M.; Bertolín, C.; Ortiz, P.; Ortiz, R. Satellite product to map drought and extreme precipitation trend in Andalusia, Spain: A novel method to assess heritage landscapes at risk. Int. J. Appl. Earth Obs. Geoinf. 2022, 110, 102810. [Google Scholar] [CrossRef]
  60. Mullapudi, A.; Vibhute, A.D.; Mali, S.; Patil, C.H. A Review of Agricultural Drought Assessment with Remote Sensing Data: Methods, Issues, Challenges and Opportunities. Appl. Geomat. 2023, 15, 1–13. [Google Scholar] [CrossRef]
  61. Stephan, R.; Stahl, K.; Dormann, C.F. Drought impact prediction across time and space: Limits and potentials of text reports. Environ. Res. Lett. 2023, 18, 074004. [Google Scholar] [CrossRef]
Figure 1. Map of Poland’s voivodeships with Mazowieckie highlighted in yellow. NUTS 2 statistical region codes are presented.
Remotesensing 17 01158 g001
Figure 2. Example of HRL products in the study area with a view of the Narew River mouth at the Vistula.
Remotesensing 17 01158 g002
Figure 3. An example of a drought map in Poland from 17 to 24 June 2020, developed within the framework of [14].
Remotesensing 17 01158 g003
Figure 4. MCD analysis for spatial risk assessment in the Mazowieckie Voivodeship.
Remotesensing 17 01158 g004
Figure 5. Approach for integrating multiple data sources for environmental risk assessment.
Remotesensing 17 01158 g005
Figure 6. Percentage of forests (A), surface water and wetlands (B), and impervious areas by LAU 2 in the Mazowieckie Voivodeship (C).
Remotesensing 17 01158 g006
Figure 7. The frequency (%) of drought occurrence from April to September between 2001 and 2020, shown at a 1 km × 1 km spatial resolution (left) and by LAU 2 (right).
Remotesensing 17 01158 g007
Figure 8. Distribution of drought frequency among LAU 2 administrative units.
Remotesensing 17 01158 g008
Figure 9. Correlation between forests identified in the HRL Tree Cover and drought occurrences by LAU 2 administrative units.
Remotesensing 17 01158 g009
Figure 10. Drought risk assessment at the LAU 2 level in the Mazowieckie Voivodeship.
Remotesensing 17 01158 g010
Table 1. Brief characteristics of the spatial data used in this study.
Layer NameGeographical CoverageYear of ProductionUpdate FrequencySpatial Resolution:Provider:Source:
HRL Forest TypeEEA38 and the UK2012, 2015, 20183 years10 m, 20 m, 100 mEEACopernicus LMS [19]
HRL Small Woody FeaturesEEA38 and the UK2015, 20183 years5 m, 100 mEEACopernicus LMS [20]
HRL Tree Cover DensityEEA38 and the UK2015, 20183 years10 m, 20 m, 100 mEEACopernicus LMS [21]
HRL Water and WetnessEEA38 and the UK2015, 20183 years20 m, 100 mEEACopernicus LMS [22]
HRL ImperviousnessEEA38 and the UK2006, 2009, 2012, 2015, 20183 years10 m, 20 m, 100 mEEACopernicus LMS [23]
DroughtPoland2001–2020Yearly1000 mIGiKOn demand [24]
Administrative units LAU 2EU-27 and EFTA20213 yearsVector-Scale 01MEurostatEuropean Commission [25]
Table 2. Classification of DISS index values from Dabrowska-Zielinska et al. [24].
DISS
ValueActive Surface Moisture ClassProbability of Precipitation Deficit Occurrence in Agricultural Areas
Below 0.5extreme drought82.5%
(<0.5, 0.8)drought70.0%
(<0.8, 1.3)average49.0%
(<1.3, 2.0)good29.6%
Above 2.0high17.0%
Table 3. Criteria for environmental vulnerability assessment with assigned weights.
FactorCriterionWeightDescription
Forest CoverIndex < 30%1Areas with forest cover below the regional average
Surface Water & WetlandsProportion < Voivodeship Average1Areas with a deficit of water and wetland ecosystems compared to the regional average
Impervious SurfacesProportion > Voivodeship Average1Areas with excessive urbanization and hardened surfaces
Drought Frequencyμ ≤ x < μ + σ1Values within one standard deviation
Drought Frequencyx ≥ μ + σ2Values exceeding one standard deviation
Table 4. Summary statistics and Mann–Whitney test results for drought occurrences and forests recognized by LAU 2.
Summary Statistics Mann–Whitney Test
VariableDrought occurrence (%)Forest cover (%)U18,628
Observations by LAU 2279279U (standardized)−10.656
Minimum0.8605.409Expected value38,920.500
Maximum45.04788.540Variance (U)3,626,093.250
Mean20.30134.146p-value (Two-tailed)<0.0001
Std. deviation9.2449.244alpha0.0001
Disclaimer/Publisher’s Note: The statements, opinions and data contained in all publications are solely those of the individual author(s) and contributor(s) and not of MDPI and/or the editor(s). MDPI and/or the editor(s) disclaim responsibility for any injury to people or property resulting from any ideas, methods, instructions or products referred to in the content.