Abstract
To address the challenges of spectral unmixing and feature extraction in the hot jet mixtures of two types of aero-engine hot jets, Fourier transform infrared spectrometry was employed to precisely measure these mixtures. The collected data encompassed the spectra of hot jets generated individually by the two distinct engine models, as well as those of the mutually mixed hot jets. In this paper, a mixed spectral unmixing algorithm based on VCA was put forward. Initially, the vertex component analysis (VCA) algorithm was utilized to decompose the mixed spectra. By comparing with the separately measured actual pure spectra, it was found that the mean RMSE of the hot jet pure spectra extracted by VCA for the two engines was 0.34846, and the mean SAM reached 0.00096, thus validating the effectiveness of the algorithm. Subsequently, the least squares (LS) algorithm was applied to ascertain the abundance values of the mixed spectra. Among the mixed samples, the average abundance values of the two pure spectra were 0.78 and 0.22, respectively. To further extract the spectral features after unmixing, an innovative one-dimensional convolutional multi-head self-attention mechanism neural network (MHSA-CNN) algorithm was devised in this study. This algorithm can accurately pinpoint the key wave crests of the features at 2282–2283 cm−1 and 2388–2389 cm−1. The research findings offer crucial technical backing for the intelligent fault diagnosis of aero-engines and contribute to enhancing the accuracy and reliability of engine operating condition monitoring.
1. Introduction
As the core component of aircraft, the reliability of aircraft engines is directly related to flight safety. With the continuous progress of aviation technology, the design and manufacturing process of engines is becoming more and more complex, and fault diagnosis technology is also constantly developing. At present, aero-engine fault diagnosis mainly relies on the following technical means: (1) Manual detection technology, combined with the knowledge and experience of experts in the field, builds a fault diagnosis model and assists technicians in fault judgment. However, the diagnosis process relies too much on the knowledge and experience of experts, and there are disadvantages, such as subjectivity. (2) Sensor technology, through the installation of sensors in the key parts of the engine, real-time monitoring of temperature, pressure, vibration, and other parameters, can detect anomalies in time. However, high-quality sensors are expensive and have high maintenance fees. Additionally, sensors produce a lot of abnormal data and also need a lot of signal-processing algorithms for analysis and processing. (3) Remote monitoring technology achieves real-time monitoring and remote diagnosis of aircraft engines worldwide through satellite communication and ground stations. However, there are some disadvantages, such as the security of data transmission, over-reliance on satellite communication, and technical complexity of remote monitoring systems.
In recent years, the field of artificial intelligence has seen rapid development, with more and more researchers exploring aero-engine fault diagnosis methods based on machine learning and deep learning. Chen et al. innovatively proposed a method that compensates for quantized actuator faults through dynamic effects. They constructed component-level models that were capable of fault identification of four typical actuators in high-bypass turbofan engines under both dynamic and steady-state conditions [1]. Shen et al. proposed a new generative transfer learning framework. This framework was designed to generate unpaired mechanical fault signals with the help of hard-constrained periodic consistent adversarial networks (Cycle GAN-HCs), which can then be used to train classifiers that can operate across different domains. It effectively promoted feature transmission and data enhancement, and its effectiveness and reliability have been verified in four cross-domain fault diagnosis missions of piston aero-engines. It has shown excellent performance and stronger generalization ability in complex mechanical fault diagnosis scenarios [2]. Liao et al. innovatively proposed a new mixed-diagnosis algorithm. The algorithm uses an engine model, feature extractor, feature filter, fault classifier, and several feature mappers. The function of the feature mapper was to generate fault features based on the incoming trouble-free data so as to rebalance the tuned data set [3]. However, their research only focused on the use of big data technology to process and analyze massive data so as to dig out potential failure modes and cannot clearly explain the principle of fault diagnosis, such as what data characteristics and logic are based on. At the same time, real-time data analysis has become a problem that needs to be solved.
The Fourier transform infrared spectrometer is designed based on the principle of double-beam interference. After the interference light irradiates the sample, the detector acquires the interference pattern. Subsequently, by performing a Fourier transform on the interference pattern, the infrared spectrum is obtained, which enables the analysis and determination of the elements, components, and molecular structure of the tested substance. It does not require sampling operation or pretreatment and can achieve real-time and remote monitoring. It can also conduct rapid analysis of multiple components simultaneously [4,5,6,7]. The passive remote sensing method does not require an additional active infrared light source. Spectrometry can directly receive infrared radiation signals, flexibly change the detection location, and the detection distance can be up to several kilometers.
In statistical methods, the unmixing of hyperspectral images can usually be regarded as a problem of blind source separation [8]. Blind source separation can separate multiple mixed signals and recover their original signals without prior knowledge. There are many methods for blind source separation, among which the more commonly used methods include independent component analysis (ICA) [9,10,11], vertex component analysis (VCA) [12], and non-negative matrix factorization (NMF) [13,14,15,16].
Feature extraction of a spectrum refers to the process of determining the characteristics that represent the essential information of the spectrum for the unique identification from complex spectral data. Common feature extraction methods include PCA [17], PLS [18], LDA [19,20], and so on. In recent years, deep learning methods have also been widely used in spectral feature extraction. By constructing multi-layer neural network structures, deep features in spectral data can be automatically learned, showing strong advantages and potential in processing large-scale and complex spectral data. For instance, there have been remarkable achievements in hyperspectral image classification [21,22,23], substance composition recognition [24,25,26], speech processing [27,28,29], and other fields. Alaghbari et al. proposed a new integrated model based on depth autoencoders (AEs) for anomaly detection and feature extraction. First, an AE is trained and then used to detect anomalies. The trained AE model is used again to extract useful low-dimensional features for the abnormal data [30]. Demir et al. used the Resnet101 network in a sample projector build, where the feature generator created 6000 microplastic features. Using NCA (neighborhood component analysis), the best 1000 features are selected from a pool of 6000 features. Then, a KNN (k nearest neighbor) algorithm was used to classify the generated feature vectors [31]. Dong et al. combined multi-scale feature extraction with enhanced fusion of channels and residual block networks and proposed a three-residual fusion network called MSCR-FuResNet to enhance detailed feature extraction through multi-scale feature extraction. Then, the discrimination of similar features was improved by suppressing channels and pixels, and finally, low-contrast feature extraction was increased by modifying activation functions and residual blocks [32].
The work of this paper is mainly divided into the following three points:
- Fourier infrared spectrometry is used to accurately measure the hot jets of two different types of aero-engines. The collected data include the hot jet spectra generated separately by each type of engine and the spectral information of the mixed hot jets of the two types of engines.
- Combined with the VCA method in statistics, the VCA algorithm is proposed to carry out the unmixing operation on the mixed spectra of the hot jets of two aero-engines. The independent pure spectra of the hot jets of two engines are successfully obtained through VCA, and the proportion of each pure spectrum in the mixed spectrum is calculated, which lays a solid foundation for the subsequent in-depth analysis.
- A one-dimensional convolutional deep learning MHSA-CNN algorithm is proposed. In order to grasp the intrinsic characteristics and differences of two different types of aero-engine hot jets more accurately, the algorithm extracts the features of the two types of aero-engine hot jets after unmixing. This provides powerful data support and technical guarantee for aero-engine fault diagnosis.
2. Aero-Engine Hot Jet Spectrum Data Collection
External field measurements were made on the hot jets of the two types of aero-engines, as shown in Figure 1.
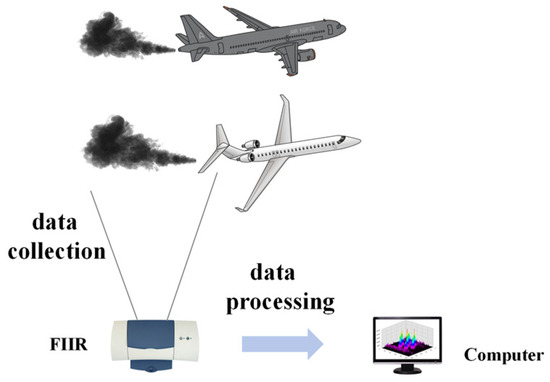
Figure 1.
Spectral data collection.
The spectrometer was kept at a distance of 5 m and 10 m from the aero-engine, perpendicular to the nozzle outlet of the exhaust stream. During the measurement, the outdoor temperature was 26.3 °C, and the humidity was 56.4%Rh. The measuring instrument was an EM27 Fourier infrared spectrometer, the measurement mode was passive measurement mode, the spectral resolution was 1 cm−1, the spectral measurement range was 2.5–12 μm, and the full perspective reached 30 mrad. The EM27 spectrometer initially subtracts the bias of the spectral signal entering the instrument and obtains the luminance temperature according to Planck’s formula [33].
where represents the Planck constant value, . represents the speed of light, . stands for wave number in cm−1. represents the Boltzmann constant value, represents the radiant flux of the unit beam.
We collected 295 samples of hot jet spectrum data of two types of aero-engines. Among them, there are 151 pure spectrum samples of the type I engine hot jet, 41 pure spectrum samples of the type II engine hot jet, and 103 mixed spectrum samples of the two types of engine hot jets. As shown in Figure 2, we took the average of each sample and plotted the spectrogram below. The overall trend of the three spectra is similar, and the corresponding brightness temperature at each wave number is somewhat different, which provided data input for the following feature extraction.
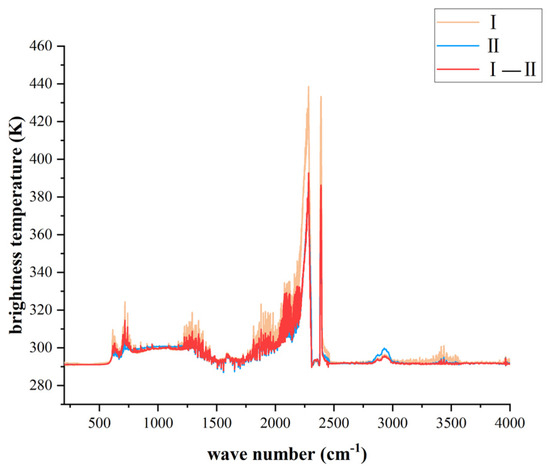
Figure 2.
Average spectrum of hot jet Type I, Type II, and Type I–Type II mixed engines.
3. Remote Sensing Mixed Spectral Feature Extraction Network for Aero-Engine Hot Jet
3.1. VCA Method for Mixed Spectral Unmixing
In the spectral data, suppose that the i-th mixed spectral data vector (that is, the vector corresponding to the i-th sample is written with ) indicates, then can be expressed as follows:
where represents the end element spectrum, is the abundance value of the corresponding end element, is the number of endmembers, represents the noise in the spectrum .
The physical meaning of abundance is the proportion of each end element in each wave number space, and therefore, needs to satisfy the “sum is one” and “non-negative” constraints. The formula is as follows:
The vertex component analysis (VCA) is based on the hypothesis of the linear mixing model, which holds that the observed mixing spectrum is composed of several pure endmembers in a certain proportion. Accordingly, in our study, we believe that the mixed spectrum of the two engines’ hot jets is composed of the pure spectrum of the two engines’ hot jets mixed in a certain proportion. The endmembers in the unmixing experiment represent the pure spectra of the engine hot jet. Previous studies by our team have shown that the infrared spectra data of the engine hot jet measured by the remote sensing Fourier transform infrared spectrometer have different spectral characteristics for different types of aircraft engine hot jets, such as different brightness temperatures of CO2, CO, H2O, etc. [34,35]. Since we measured the mixed spectra of the hot jets of two types of engines, to analyze the spectral characteristics of each type of engine hot jet, we need to first perform unmixing operations on the mixed spectra. After extracting the endmembers through the VCA method, that is, extracting the pure spectrum of the hot jet of the two engines from the mixed spectrum, we choose the least squares method to determine the proportion of each end element in the mixed spectrum, that is, the abundance value.
The vertex component analysis is based on the concept of simple forms. In our mixed spectral data, each spectrum can be seen as a point in a high-dimensional space, with the pure spectrum at the apex of this space. After the affine transformation of the projection, the spectrum representing the pure matter remains at the apex. Therefore, by projecting the data into an orthogonal subspace direction, we calculate the vector with the largest projected distance value, which is the end element to look for. As shown in Figure 3, the small black dots represent all the mixed spectral data vectors. The singlet is the projection on the hyperplane found by the vector, and the vertices of are still the vertices of the singlet after projection. Estimates of the endmembers and can be found according to and in the projection vector.
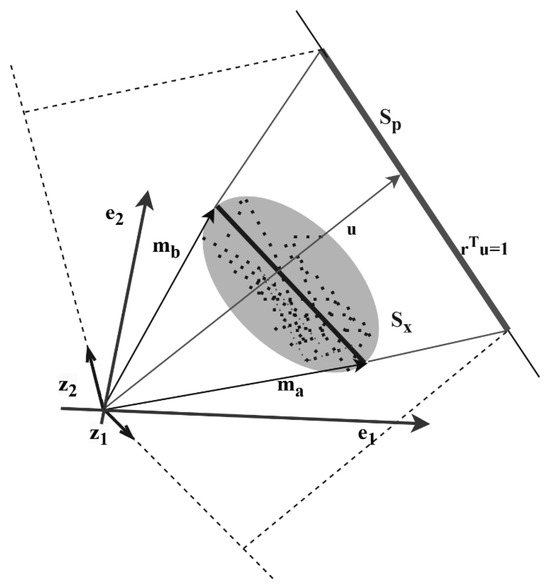
Figure 3.
Schematic diagram of VCA principle.
The specific calculation steps are as follows:
Step 1: Data preprocessing.
- The mean of the brightness temperature of all samples for each wave number is calculated for all the aero-engine hot jet mixing spectral data.
- The mean value corresponding to each wave number is subtracted from the data, and the DC component in the data is removed to obtain zero mean data. The purpose of this is to reduce errors that can be caused by data offset or background light, etc., so that our model only focuses on the intrinsic characteristics of the data.
- The 2-dimensional projection matrix is calculated by SVD decomposition, and the zero-mean data of the previous step is projected into the 2-dimensional subspace to obtain the projected data and the original data :
- The SNR threshold and are calculated according to the following formula:
- 5.
- If , indicating that the signal-to-noise ratio is low, the project is projected into the 1-dimensional subspace to filter the noise. If , indicating that the signal-to-noise ratio is high, it is projected into the 2-dimensional subspace to preserve the complete spectral characteristics.
- 6.
- The matrix is normalized for subsequent VCA unmixing.
Step 2: VCA end element extraction.
- Set the number of endmembers p = 2;
- Choose an initial vector at random, making sure that there are no observed vectors orthogonal to ;
- Initialize projection correlation parameters such that = I;
- Calculate projection vectors for all mixed spectral data vectors:
- In the projection results of all samples, to find the vector corresponding to the most “prominent” sample in the projection direction, we use the Euclidean norm as the selection criterion. Find the vector with the largest norm in the projection vector , and define its corresponding mixed spectral data vector as the first endmember estimate :
- , where is the matrix from which we construct our found endmember estimates;
- In order to project all the data vectors in directions that have been found to be orthogonal to the first endmember , the projection matrix is computed:
- Calculate the projection vectors of all the mixed spectral data vectors:
- Also using the Euclidean norm, we find the vector with the largest norm in the projection vector , and define it as the second end element estimate corresponding to the mixed spectral data vector .
Step 3: Least squares to determine the abundance value.
The mixing ratio of two pure aero-engine hot jets in each wave number is calculated using the least squares method.
where the end element matrix .
3.2. Feature Extraction Network MHSA-CNN
With the deepening of the network architecture, the number of channels and redundant information in the training process increases. Inspired by human sensory vision, the attention mechanism is used to optimize features so as to improve the efficiency of network training. In this paper, a one-dimensional deep learning (MHSA-CNN) algorithm is proposed for feature extraction and visualization analysis of the pure spectrum of the hot jet of two aero-engines after unmixing. The structure diagram of the one-dimensional convolutional neural network model MHSA-CNN constructed by us is shown in Figure 4. The model consists of three convolution layers of different scales, a multi-head self-attention mechanism module, a maximum pooling layer, a flat operation, and full connection layer to extract the features of the two pure spectra extracted by VCA. In order for the network to extract multi-scale and local characteristic information of two different aero-engine hot jets, convolution kernels of different sizes are used for the three convolution layers. The specific parameters of the convolution layers are shown in Table 1. Deep learning networks generate more parameters during operation. In order to retain key features and reduce redundancy, the convolution kernel size of the maximum pooling layer is set to 2, and the feature length is halved so that the convolution and pooling operations compress the feature length.
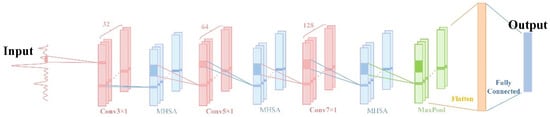
Figure 4.
Structure of MHSA-CNN network model.

Table 1.
The architecture of CNN.
We believe that the largest wave peak in the spectral information is the characteristic peak, and the local wave peak extracted by the convolutional neural network (CNN) is input into the attention mechanism, which is divided into three parts: query (Q), key (K), and value (V). The query represents the characteristic peak of the current network attention, the key represents all the peaks of the input spectral data, and the value represents the actual characteristic peak. Firstly, the similarity of the query and key is calculated by the dot product operation; that is, the correlation between the two is judged. The higher the similarity, the more relevant the feature peaks of current concern are. Next, the similarity is converted to probability weights by the softmax function, and these weights are then weighted to sum all characteristic peaks. The process of extracting feature peaks of the attention mechanism is shown in Figure 5.
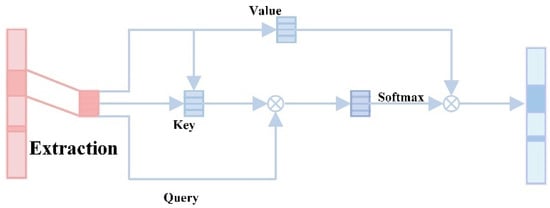
Figure 5.
Process of extracting feature peaks of attention mechanism.
The core formula of the self-attention mechanism is as follows:
where represent the query, key, and value matrices, respectively, and is the dimension of the key vector, which is used to scale the dot product to stabilize the softmax function.
In this paper, the number of heads of the multi-head self-attention mechanism is set to 4, and the model diagram is shown in Figure 6. Four attention heads are obtained by different linear transformations of the input one-dimensional spectral data. These four attention heads focus on peaks in different bands in parallel, allowing the model to capture peak information in spectral data from multiple angles.
where , , are the query, key, and value transformation matrices of the head, respectively.
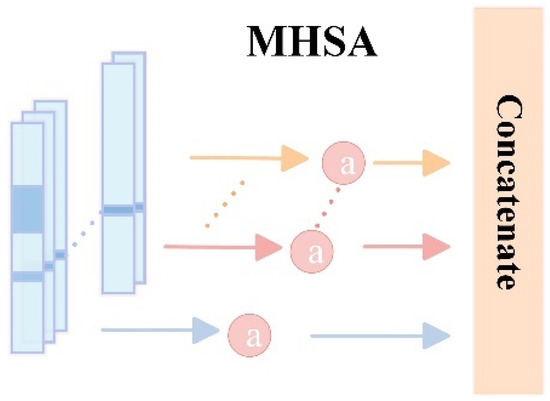
Figure 6.
Multi-head self-attention mechanism model diagram.
The output of all heads is spliced together, and then, after a final linear transformation and layer normalization, the output of multi-head attention is obtained. This step integrates the feature information extracted from different subspaces, enhances the expression ability of the model, and finally extracts the most critical feature peak in the spectrum.
where is the final output transformation matrix.
4. Experiment
The main working flow chart of this paper is shown in Figure 7. First, the spectral data of the hot jet of the two aero-engines is collected, and the mixed spectral is unmixed. After the unmixing, the pure spectral data are analyzed and extracted.
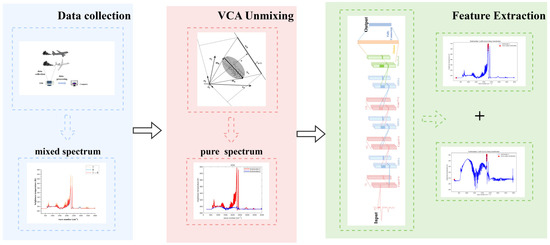
Figure 7.
Workflow chart.
4.1. Spectral Unmixing
In this paper, the VCA method is used to unmix the hot jet spectrum of two aero-engines. Firstly, the VCA method is used to extract the pure spectrum of the hot jet of two aero-engines. Then, the least squares (LS) method is used to obtain the average abundance value of each sample. The results of the VCA are shown in Figure 8.
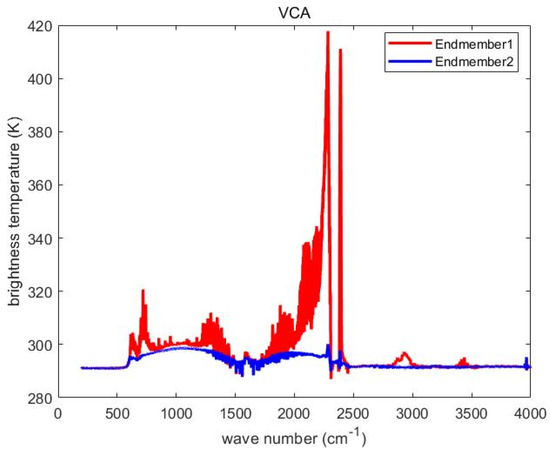
Figure 8.
Results of the VCA.
After the mixed spectra were unmixed by VCA, the purified spectra after unmixing were compared with the average spectra of the two types of aero-engine hot jets measured separately, using RMSE [36,37,38] and SAM [39,40].
Root mean square error (RMSE) is used to measure the deviation between the predicted value and the true value by calculating the square root of the sum of the squares of the difference between the predicted value and the true value. The smaller the value of RMSE, the higher the prediction accuracy of the model. The calculation formula is as follows:
where represents the number of samples; represents the true value of the sample; represents the predicted value of the sample.
Spectral angle mapping (SAM) measures the similarity between the spectra by calculating the angle between the two vectors. The smaller the angle is, the more similar the two spectra are, and the greater the possibility of belonging to the same object. The smaller the value of the spectral angle, the stronger the similarity between the two spectra.
where represents the target vector that has been provided; represents the vector to be measured.
The mean RMSE and SAM of the pure spectrum extracted by VCA were 0.34846 and 0.00096, respectively, compared with the pure spectrum measured separately. For the two pure spectra extracted by VCA, the least square method is used to calculate the proportion of the two pure spectra in the mixed spectrum, that is, the abundance value. We calculated average abundance values of 0.78 and 0.22 for all mixed samples, respectively. In recent years, autoencoder (AE) models have been widely applied in hyperspectral unmixing [41,42]. We also adopted the AE model to unmix the spectral data of two types of aero-engine hot jets. However, the results were very poor. When comparing the pure spectra extracted by AE with the actual pure spectra measured separately, the average RMSE was 278.6715, and the average SAM was 0.3977.
4.2. Spectral Feature Extraction
During the operation of the network, in order to better understand the feature extraction effect of different convolution layers on the hot jet spectral data of two aero-engines, we multiply the feature set of the deep layer of the network with the weight coefficient matrix obtained by the pooling layer and finally map a heat map that can represent the attention. The brighter areas in the figure represent areas of high-density or high-intensity data, that is, hot spots. Darker areas represent areas of low-density or intensity data, as shown in Figure 9.
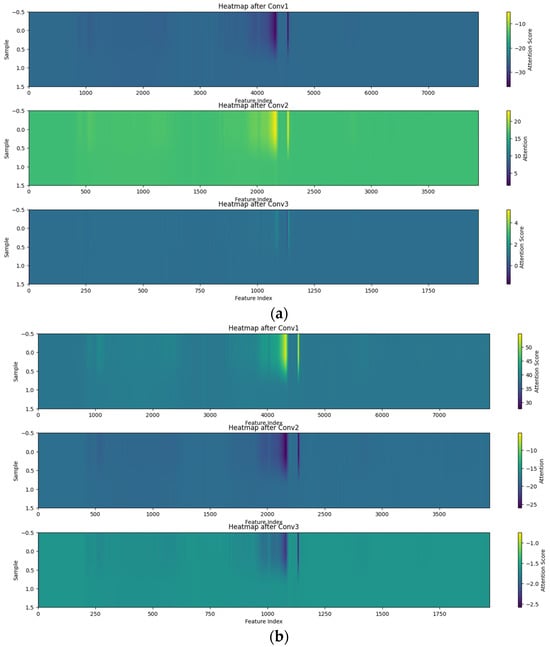
Figure 9.
Heat map of feature extraction. (a) CNN; (b) MHSA-CNN.
The features extracted by CNN are mainly concentrated at 2281–2284 cm−1 and 2388–2390 cm−1,as shown in Figure 10.The feature range extracted by MHSA-CNN has been narrowed down to 2282–2283 cm−1 and 2388–2389 cm−1 bands. The crest of 2282–2283 cm−1 mainly represents a cyano (-C≡N) or some specific isocyanate (-N=C=O) functional group correlation. The characteristic absorption peaks in this range are mainly due to the stretching vibration of the triple bond (C≡N or N=C=O); 2388–2389 cm−1 mainly represents CO2 [43].
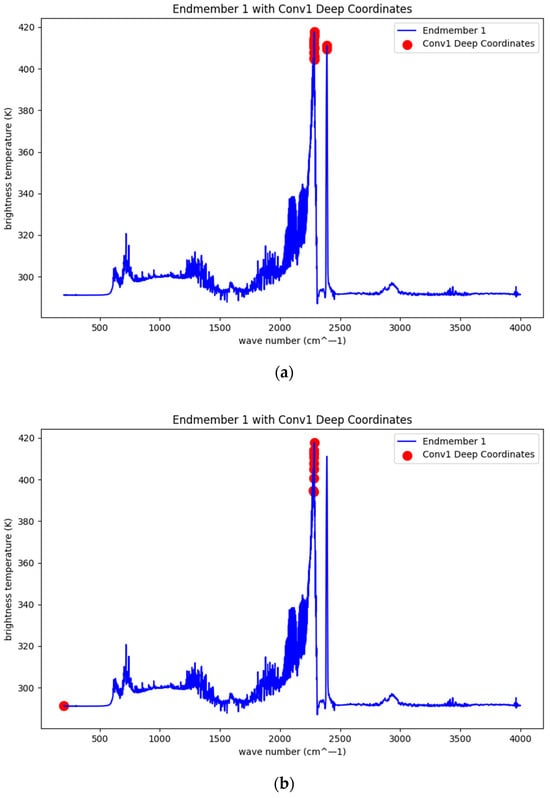
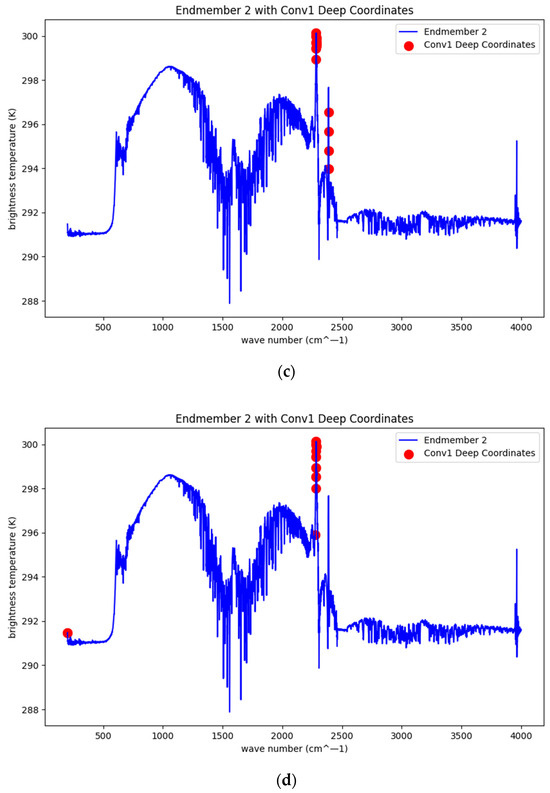
Figure 10.
Extracted features. (a) Type I extracted by CNN. (b) Type I extracted by MHSA-CNN. (c) Type II extracted by CNN. (d) Type II extracted by MHSA-CNN.
5. Discussion
In order to solve the problem of hot jet unmixing and feature extraction of two types of mixed aero-engines, this paper adopts the method of external field measurement to ensure the same measurement environment, such as temperature and humidity, the same measurement conditions, such as distance and angle and adopts the EM27 Fourier infrared spectrometer to measure the center of the aero-engine tail nozzle. The luminance temperature of 200–4000 cm−1 band was selected for modeling analysis. In this paper, we propose a VCA algorithm to unmix the independent pure spectra and abundance values of the hot jets of two mixed aero-engines. The results of the summary show that the intensity and characteristics of the hot jets of the two aero-engines are relatively obvious in the 1800–2500 cm−1 band, which is related to the type of engine, fuel type, and combustion efficiency. The abundance values of all samples of the hot jets of the two aero-engines calculated by LS are 0.78 and 0.22, respectively. The influencing factors of this result are not only engine type, fuel type, combustion efficiency, etc., but also related to the measurement distance to a certain extent. During the field experiment, the two aero-engines were parked side by side, taking into account the safety of the measurement personnel and the stability of the spectrometer. The spectrometer was placed on the side of the aero-engine, resulting in a certain difference in the distance between the hot jets of the two aero-engines and the spectrometer. Aiming at the pure spectrum of the two engines unmixed, we designed the one-dimensional convolutional deep learning MHSA-CNN algorithm to expand the feature extraction and introduced the multi-head self-attention module into the one-dimensional convolutional CNN model, which significantly improved the feature extraction and processing capability. Through the multi-head attention mechanism, the module can effectively identify and focus on the feature points with the most information after the convolution operation so as to accurately locate the key bands 2282–2283 cm−1 and 2388–2389 cm−1 and optimize the model performance. We use the hot map to visualize the features extracted from the network so as to understand and distinguish the intrinsic characteristics of the aero-engine more accurately and provide a solid data foundation and technical support for its fault diagnosis.
Our experiment only covered 103 samples of the mixed spectral data of two types of aero-engine thermal jets. When the sample size is insufficient, it may affect the accuracy of the statistical characteristics of the endmember spectra, leading to a significant increase in the mean square error of abundance estimation. The MHSA-CNN algorithm captures the global correlation of spectral sequences through multiple self-attention heads, but under the condition of a small sample size, it is difficult to fully learn the differentiation of different attention heads. During the measurement experiment, the aero-engine was rotating, and there might be noise interference caused by the wear of old components, resulting in slight noise in the spectral data we collected. At present, the problem is that the sample size is insufficient. If conditions permit, more types of aero-engine hot jet data can be collected later, and after extracting features with our method, different types of engines can be classified and identified, providing a new idea for aero-engine fault diagnosis research. The VCA and MHSA-CNN algorithms involve multi-step processing and deep learning models with high computational complexity, which may require powerful hardware support and could be limited in application in resource-constrained embedded systems. The spectral characteristics of the thermal jet of an aero-engine may be affected by environmental factors such as temperature, pressure, and atmospheric conditions, and the robustness of the method may face challenges under different flight conditions, requiring further verification and optimization. The method we proposed provides a high-precision tool for the component analysis of the thermal jet of aeroengines and is applicable to fields such as engine performance evaluation and emission monitoring. It has significant application potential in aero-engine-type identification, fault diagnosis, or operational status monitoring, especially in scenarios with complex mixed signals. Besides aero-engines, this method also has potential applications in other fields of mixed-signal processing, such as remote sensing spectral analysis and chemical composition detection, and has a certain universality.
6. Conclusions
In this paper, a VCA algorithm is designed to unmix the Fourier infrared spectrum of the hot jets of two types of mixed aero-engines. First, a VCA algorithm is used to decompose the mixed spectrum into a pure spectrum, and then an LS algorithm is used to determine the abundance value of the mixed spectrum. Compared with the actual pure spectrum measured separately, the mean RMSE and SAM of the pure spectrum extracted by our unmixed VCA are 0.34846 and 0.00096, respectively. We also designed a new one-dimensional convolution MHSA-CNN algorithm to extract the pure spectra of the two aero-engine hot jets after unmixing and locating the key bands of the features to 2282–2283 cm−1 and 2388–2389 cm−1. The proposed method can be integrated into the aero-engine monitoring system to achieve real-time analysis of the thermal jet spectra, providing support for the optimization of aircraft operation and the assessment of environmental impact.
Author Contributions
Formal analysis, Y.L.; investigation, Z.K. and Z.L.; software, X.Y.; validation, Z.L. All authors have read and agreed to the published version of the manuscript.
Funding
This research was funded by the National Natural Science Foundation of China, grant number 62005320.
Data Availability Statement
The data presented in this study are available upon request from the corresponding author.
Conflicts of Interest
The authors declare no conflicts of interest.
References
- Chen, Y.; Zhang, W.; Zhao, Z.; Tsoutsanis, E.; Malkogianni, A.; Ma, Y.; Gou, L. Actuator fault diagnosis and severity identification of turbofan engines for steady-state and dynamic conditions. Chin. J. Aeronaut. 2025, 38, 103243. [Google Scholar]
- Shen, P.; Bi, F.; Bi, X.; Guo, M.; Lu, Y. Piston aero-engine fault cross-domain diagnosis based on unpaired generative transfer learning. Eng. Appl. Artif. Intell. 2024, 137, 109159. [Google Scholar]
- Liao, Z.; Zhan, K.; Zhao, H.; Deng, Y.; Geng, J.; Chen, X.; Song, Z. Addressing class-imbalanced learning in real-time aero-engine gas-path fault diagnosis via feature filtering and mapping. Reliab. Eng. Syst. Saf. 2024, 249, 110189. [Google Scholar]
- Ni, Q.; Zuo, Y.; Zhi, Z.; Shi, Y.; Liu, G.; Ou, Q. Diagnosis of corn leaf diseases by FTIR spectroscopy combined with machine learning. Vib. Spectrosc. 2024, 135, 103744. [Google Scholar]
- Lafi, A.G.A.; Naser, I.; Abboud, H. Application of two dimensional correlation Fourier Transform Infrared spectroscopy (2D-COS-FTIR) to the quantification of carbohydrates in milk powder. J. Food Compos. Anal. 2024, 134, 106541. [Google Scholar]
- Kryska, A.; Depciuch, J.; Krysa, M.; Paja, W.; Wosiak, A.; Nicoś, M.; Budzynska, B.; Bartnicka, A.S. Lipids balance as a spectroscopy marker of diabetes. Analysis of FTIR spectra by 2D correlation and machine learning analyses. Spectrochim. Acta Part A Mol. Biomol. Spectrosc. 2024, 320, 124653. [Google Scholar]
- Rios, T.G.; Larios, G.; Marangoni, B.; Oliveira, S.L.; Cena, C.; Ramos, C.A.D.N. FTIR spectroscopy with machine learning: A new approach to animal DNA polymorphism screening. Spectrochim. Acta Part A Mol. Biomol. Spectrosc. 2021, 261, 120036. [Google Scholar]
- Congedo, M.; Gouy-Pailler, C.; Jutten, C. On the blind source separation of human electroencephalogram by approximate joint diagonalization of second order statistics. Clin. Neurophysiol. 2008, 119, 119,2677–2686. [Google Scholar]
- Braak, H.; Braak, E. Neuropathological staging of Alzheimer-related changes. Acta Neuropathol. 1991, 82, 239–259. [Google Scholar]
- Moussaoui, S.; Hauksdottir, H.; Schmidt, F.; Jutten, C.; Chanussot, J.; Brie, D.; Doute, S.; Benediktsson, J.A.J.N. On the decomposition of Mars hyperspectral data by ICA and Bayesian positive source separation. Neurocomputing 2008, 71, 2194–2208. [Google Scholar]
- Du, H.; Qi, H.J.I. An FPGA implementation of parallel ICA for dimensionality reduction in hyperspectral images. In Proceedings of the IGARSS 2004. 2004 IEEE International Geoscience and Remote Sensing Symposium, Anchorage, AK, USA, 20–24 September 2004. [Google Scholar]
- Nascimento, J.M.; Dias, J.M. Vertex component analysis: A fast algorithm to unmix hyperspectral data. IEEE Trans. Geosci. Remote Sens. 2005, 43, 898–910. [Google Scholar]
- Lee, D.D.; Seung, H.S.J.N. Learning the parts of objects by non-negative matrix factorization. Nature 1999, 401, 788–791. [Google Scholar] [PubMed]
- Smaragdis, P.; Fevotte, C.; Mysore, G.J.; Mohammadiha, N.; Hoffman, M. Static and Dynamic Source Separation Using Nonnegative Factorizations: A unified view. IEEE Signal Process. Mag. 2014, 31, 66–75. [Google Scholar]
- Ren, L.; Ma, Z.; Bovolo, F.; Hu, J.; Bruzzone, L. Hyperspectral unmixing using weighted sparse regression with total variation regularization. Int. J. Remote Sens. 2022, 43, 6124–6151. [Google Scholar]
- Bioucas-Dias, J.M.; Plaza, A.; Dobigeon, N.; Parente, M.; Du, Q.; Gader, P.; Chanussot, J. Hyperspectral Unmixing Overview: Geometrical, Statistical, and Sparse Regression-Based Approaches. IEEE J. Sel. Top. Appl. Earth Obs. Remote Sens. 2012, 5, 354–379. [Google Scholar]
- Rosipal, R.; Girolami, M.; Trejo, L.J.; Cichocki, A. Kernel PCA for Feature Extraction and De-Noising in Nonlinear Regression. Neural Comput. Appl. 2001, 10, 231–243. [Google Scholar]
- Carlo, L.; Michel, T.; Vincenzo Esposito, V.; Yvesmarie, C. PLS path modeling. Comput. Stat. Data Anal. 2005, 48, 159–205. [Google Scholar]
- Cococcioni, M.; De Gironcoli, S. A linear response approach to the calculation of the effective interaction parameters in the LDA+U method. Phys. Rev. B-Condens. Matter Mater. Phys. 2004, 71, 035105. [Google Scholar]
- Lu, J.; Plataniotis, K.N.; Venetsanopoulos, A.N. Face Recognition Using LDA-Based Algorithms. IEEE Trans. Neural Netw. 2003, 14, 195–200. [Google Scholar]
- Arshad, T.; Zhang, J.; Anyembe, S.C.; Mehmood, A. Spectral Spatial Neighborhood Attention Transformer for Hyperspectral Image Classification. Can. J. Remote Sens. 2024, 50, 2347631. [Google Scholar]
- Cui, B.; Wen, J.; Song, X.; He, J. MADANet: A Lightweight Hyperspectral Image Classification Network with Multiscale Feature Aggregation and a Dual Attention Mechanism. Remote Sens. 2023, 15, 5222. [Google Scholar] [CrossRef]
- Li, Z.; Chen, G.; Li, G.; Zhou, L.; Pan, X.; Zhao, W.; Zhang, W. DBANet: Dual-branch Attention Network for hyperspectral remote sensing image classification. Comput. Electr. Eng. 2024, 118, 109269. [Google Scholar] [CrossRef]
- Ghazlane, Y.; Gmira, M.; Medromi, H. Development Of A Vision-based Anti-drone Identification Friend or Foe Model to Recognize Birds and Drones Using Deep Learning. Appl. Artif. Intell. 2024, 38, 2318672. [Google Scholar] [CrossRef]
- Li, H.; Tian, Z.; Li, X.; Arebi, P. Identifying effective nodes in term of the influence maximization on the social IoT networks using deep learning-based node embedding. Computing 2024, 107, 38. [Google Scholar] [CrossRef]
- Shang, D.; Lv, Z.; Gao, Z.; Li, Y. Detection of coal gangue by YOLO deep learning method based on channel pruning. Int. J. Coal Prep. Util. 2025, 45, 231–243. [Google Scholar] [CrossRef]
- Chowdary, M.K.; Priya, E.A.; Danciulescu, D.; Anitha, J.; Hemanth, D.J. Hybrid deep learning models based emotion recognition with speech signals. Intell. Decis. Technol. 2023, 17, 1435–1453. [Google Scholar] [CrossRef]
- Yadav, A.K.; Kumar, M.; Kumar, A.; Shivani; Kusum; Yadav, D. Hate speech recognition in multilingual text: Hinglish documents. Int. J. Inf. Technol. 2023, 15, 1319–1331. [Google Scholar]
- Pookpanich, P.; Siriborvornratanakul, T. Offensive language and hate speech detection using deep learning in football news live streaming chat on YouTube in Thailand. Soc. Netw. Anal. Min. 2024, 14, 18. [Google Scholar] [CrossRef]
- Alaghbari, K.A.; Lim, H.S.; Saad, M.H.; Yong, Y.S. Deep Autoencoder-Based Integrated Model for Anomaly Detection and Efficient Feature Extraction in IoT Networks. IoT 2023, 4, 345–365. [Google Scholar] [CrossRef]
- Demir, K.; Yaman, O. Applications. Projector deep feature extraction-based garbage image classification model using underwater images. Multimed. Tools Appl. 2024, 83, 79437–79451. [Google Scholar] [CrossRef]
- Chen, X.; Xing, X.; Zhang, Y.; Liu, R.; Li, L.; Zhang, R.; Tang, L.; Shi, Z.; Zhou, H.; Guo, R.; et al. MSCR-FuResNet: A Three-Residual Network Fusion Model Based on Multi-Scale Feature Extraction and Enhanced Channel Spatial Features for Close-Range Apple Leaf Diseases Classification under Optimal Conditions. Horticulturae 2024, 10, 953. [Google Scholar] [CrossRef]
- Ade, P.; Aghanim, N.; Arnaud, M.; Arroja, F.; Ashdown, M.; Aumont, J.; Baccigalupi, C.; Ballardini, M.; Banday, A.J.; Barreiro, R.B.J.S.C. Planck 2015 results: XX. Constraints Inflat. 2015, 16, 145–159. [Google Scholar]
- Du, S.; Han, W.; Kang, Z.; Lu, X.; Liao, Y.; Li, Z. Continuous Wavelet Transform Peak-Seeking Attention Mechanism Conventional Neural Network: A Lightweight Feature Extraction Network with Attention Mechanism Based on the Continuous Wave Transform Peak-Seeking Method for Aero-Engine Hot Jet Fourier Transform Infrared Classification. Remote Sens. 2024, 16, 3097. [Google Scholar] [CrossRef]
- Du, S.; Han, W.; Kang, Z.; Luo, F.; Liao, Y.; Li, Z. A Peak-Finding Siamese Convolutional Neural Network (PF-SCNN) for Aero-Engine Hot Jet FT-IR Spectrum Classification. Aerospace 2024, 11, 703. [Google Scholar] [CrossRef]
- Barnston, A.G. Correspondence among the Correlation, RMSE, and Heidke Forecast Verification Measures; Refinement of the Heidke Score. Weather. Forecast. 1992, 7, 699–709. [Google Scholar]
- Koper, M.T.; Lebedeva, N.P.; Hermse, C.G. Dynamics of CO at the solid/liquid interface studied by modeling and simulation of CO electro-oxidation on Pt and PtRu electrodes. Faraday Discuss. 2002, 121, 301–311. [Google Scholar]
- Bai, S.B.; Wang, J.; Lü, G.N.; Zhou, P.G.; Hou, S.S.; Xu, S.N. GIS-based logistic regression for landslide susceptibility mapping of the Zhongxian segment in the Three Gorges area, China. Geomorphology 2010, 115, 23–31. [Google Scholar]
- Schlerf, M.; Atzberger, C.; Hill, J. Remote sensing of forest biophysical variables using HyMap imaging spectrometer data. Remote Sens. Environ. 2005, 95, 177–194. [Google Scholar]
- McCormick, M.P.; Steele, H.M.; Hamill, P.; Chu, W.P.; Swissler, T.J. Polar Stratospheric Cloud Sightings by SAM II. J. Atmos. Sci. 1982, 39, 1387–1397. [Google Scholar] [CrossRef]
- Rasti, B.; Zouaoui, A.; Mairal, J.; Chanussot, J. Image Processing and Machine Learning for Hyperspectral Unmixing: An Overview and the HySUPP Python Package. IEEE Trans. Geosci. Remote Sens. 2024, 62, 5517631. [Google Scholar]
- Yu, Y.; Ma, Y.; Mei, X.; Fan, F.; Huang, J.; Li, H. Multi-stage convolutional autoencoder network for hyperspectral unmixing. Int. J. Appl. Earth Obs. Geoinf. 2022, 113, 102981. [Google Scholar]
- Heland, J.; Schäfer, K. Determination of major combustion products in aircraft exhausts by FTIR emission spectroscopy. Atmos. Environ. 1998, 32, 3067–3072. [Google Scholar]
Disclaimer/Publisher’s Note: The statements, opinions and data contained in all publications are solely those of the individual author(s) and contributor(s) and not of MDPI and/or the editor(s). MDPI and/or the editor(s) disclaim responsibility for any injury to people or property resulting from any ideas, methods, instructions or products referred to in the content. |
© 2025 by the authors. Licensee MDPI, Basel, Switzerland. This article is an open access article distributed under the terms and conditions of the Creative Commons Attribution (CC BY) license (https://creativecommons.org/licenses/by/4.0/).