Article

Spatial Distribution Pattern of Forests in Yunnan Province in 2022: Analysis Based on Multi-Source Remote Sensing Data and Machine Learning

1
Rubber Research Institute, Chinese Academy of Tropical Agricultural Sciences, Haikou 571101, China
2
Hainan Academy of Forestry (Hainan Academy of Mangrove), Haikou 571100, China
3
College of Big Data and Intelligence Engineering, Southwest Forestry University, Kunming 650224, China
4
College of Forestry, Nanjing Forestry University, Nanjing 210037, China
*
Author to whom correspondence should be addressed.
Remote Sens. 2025, 17(7), 1146; https://doi.org/10.3390/rs17071146
Submission received: 12 January 2025 / Revised: 10 March 2025 / Accepted: 12 March 2025 / Published: 24 March 2025

Abstract

:
Forest mapping using remote sensing has made considerable progress over the past decade, but substantial uncertainties remain in complex regions, particularly where terrain and climate vary dramatically. Yunnan Province, China, represents such a challenging case, with its diverse climatic zones ranging from tropical to temperate and its topography spanning over 6500 m in elevation. These factors contribute to substantial variation in vegetation types, complicating the accurate identification of forest cover through remote sensing. This study aims to enhance forest mapping in Yunnan by leveraging multi-temporal remote sensing data from Sentinel-2 and Landsat 8/9 imagery, incorporating key phenological stages—such as the leaf greening (GRN) period, as well as the senescence, defoliation, and foliation (SDF) stages of deciduous forests—along with kNDVI and terrain factors. A random forest (RF) classifier was applied on the Google Earth Engine (GEE) platform to create a 10 m resolution forest map (LS2-RF). This map achieved an overall accuracy of 96.35% when validated with 1572 ground samples, significantly outperforming existing global datasets, such as Dynamic World (73.88%) and WorldCover (87.66%). These maps agreed well in extensive forested areas; discrepancies were noted in mixed land types, including farmland, urban areas, and regions with fragmented landscapes. In 2022, Yunnan’s forest cover was 60.40%, with higher coverage in the southwestern region and lower in the northeast. The largest forested area was found in Pu’er City, while the smallest was in Yuxi City. Forests were most abundant at elevations between 1500 and 2500 m (occupying 52.29% of the total forest area) and slopes of 15° to 25° (occupying 39.19% of the total forest area). Conversely, forest cover was lowest in areas below 500 m elevation (occupying 0.64% of the total forest area) and on slopes less than 5° (occupying 2.40% of the total forest area). The analysis also revealed a general trend of increasing forest cover with decreasing latitude and longitude, with peak forest coverage at mid-elevations and slopes, followed by a decline at higher elevations. The resultant forest map provides valuable data for ecological assessments, forest conservation initiatives, and informed policy decision-making.

1. Introduction

Forests are an important resource for human survival and development, with significant impacts on various aspects, including social, economy, and ecological [1]. Although the percentage of forest cover is more than 30% of the global land area [2], this ecosystem continues to lose millions of hectares each year [3]. Human activities, including agriculture, mining, and unsustainable logging, as well as extreme weather events like hurricanes and droughts, are the primary causes of these ongoing losses [4,5]. The rate of forest coverage directly influences the reduction of carbon dioxide emissions and is crucial to the climate change mitigation strategy aimed at achieving zero carbon emissions [6]. Therefore, an accurate assessment of forest cover is especially important. It not only helps in understanding the spatial distribution of forests, but also provides essential data support for decision-making and sustainable development in related fields sectors [7].
Traditional statistical methods and field surveys for forest assessment are time-consuming, costly, and often impractical for large-scale geographical inventories, particularly in inaccessible regions. Advanced remote sensing technology provides comprehensive forest coverage mapping, overcoming the spatial and temporal limitations of traditional methods [8]. To satisfy the increasing demand for land cover information from regional to global scales, numerous research institutions have developed large-scale land cover datasets, with a particular focus on forest coverage. For instance, early datasets such as the IGBP DISCover (1 km) [9], the University of Maryland’s UMD dataset (1 km) [10], and the Global Land Cover Mapping with MODIS [11] were released. However, due to the limitations of data sources and technology, early datasets had lower temporal and spatial resolutions. With the progress in remote sensing technology, subsequent datasets have become more detailed and accurate. Examples include the Global Land Cover Map [12], the 10 m Near Real-Time (NRT) Land Use/Land Cover (LULC) Dataset [13], the Global Forest Cover Change Data from 1990 to 2000 [14], and the Global Forest Cover Change Map [15]. In addition, some studies focus on the height of global vegetation canopy [16,17], and such datasets are also crucial indicators for estimating forest cover.
Although there are already many Land-Use and Land-Cover Change (LUCC) products and relatively mature technologies, the diversity of land types, data sources, and classification methods leads to the fact that different products may produce significantly different classification results for the same area, especially global products [18,19]. Improving the accuracy of forest product estimations and land cover mapping requires a multi-pronged approach. This includes using more accurate algorithms, better training data, additional predictor variables, and less noisy input data to reduce discrepancies in forest products. The methods mentioned above have achieved many results in forest mapping research on both global and regional scales.
In the research on data sources, Ref. [20] used the RF algorithm to extract national-scale forest cover data for Indonesia, utilizing Planet-NICFI imagery and Sentinel-2 spectral data within GEE. Compared to other products, their data provide much higher accuracy and detail when mapping forest patches in small-scale areas, with overall classification accuracy ranging from 92% to 99%. Ref. [21] integrated Planet-NICFI imagery and Sentinel-1 SAR (Synthetic Aperture Radar) images to create a forest cover map for Southeast Asia and achieved an overall accuracy of 93.7%. Compared to optical data, this method achieves more precise identification capabilities in areas where the spectral signatures of forests and non-forest areas are similar. However, the classification was less effective for areas with distinctive spatial patterns and phenology, such as orchards, plantations, as well as complete stand gaps. Ref. [22] conducted a comparative analysis of the spectral and spatial characteristics of ZY-3, Sentinel-2, Landsat, and their fused datasets, as well as the influence of terrain factors on the classification results of subtropical forest ecosystems. The findings indicated that data fusion significantly improves classification accuracy compared to using single data sources.
In the research on methods, Ref. [23] utilized Sentinel-1/2 time series data to develop a novel phenological indicator (NDVImax−NDVIwinter_max) and applied a thresholding method to produce a 10 m resolution distribution map of evergreen forests in the Dalaoshan area of China for 2019. The approach achieved an impressive accuracy of 97.98%. However, Sentinel-2 data suffers from missing image issues due to cloud cover, leading to uncertainties. Furthermore, interannual variations in phenology caused by climate change alter the thresholds required for land cover classification, rendering the thresholds set in this study non-universal. Ref. [24] constructed the first annual tree cover dataset for China, spanning the period from 1985 to 2023, with a spatial resolution of 30 m. This study utilized RF feature importance for feature selection and employed five-fold cross-validation to validate the classifier’s predictions. The results demonstrated that this method provides an innovative and cost-effective framework, achieving an R2 of 0.76. Additionally, other studies have applied various classification methods to forest research and conducted comparative analyses [25,26,27]. In conclusion, various methods have been applied to forest research and are becoming increasingly mature.
In the research on the scale of the study area, some studies suggest that reducing the research scale can enhance classification accuracy at the regional level; this is especially crucial in biodiversity hotspots where higher classification accuracy is needed. Several studies have explored forests at the regional scale and compared their results with global-scale land cover and forest cover products, demonstrating that reducing the study area scale can significantly improve classification accuracy. For example, Ref. [28] noted that existing forest cover products contain significant uncertainties. Therefore, they combined 30 m Landsat-8 data with 1 m resolution Gaofen-2 data to estimate forest cover in the Three-North Region of China. Their results were compared with three existing global forest cover products for accuracy. The results indicate that regional-scale forest cover products exhibited better spatial distribution consistency than global products. Moreover, differences in algorithms, data sources, and sampling methods among various products were found to have a significant impact on the results. Ref. [29] focused on the Han River Basin in China and developed a method that integrated the Dynamic World and WorldCover datasets to automatically estimate forest cover areas. Their results were compared with two global forest cover products for accuracy. The study revealed that the generated 10 m regional forest cover map significantly outperformed the global products, particularly in capturing spatial detail.
In remote sensing imagery, substantial disparities frequently emerge among data sources within the same study area, influencing the continuity of forest mapping; this phenomenon is particularly conspicuous in Yunnan Province [30]. Located in southwest China, Yunnan exhibits strong geographic and climatic heterogeneity, spanning multiple climatic zones including tropical, subtropical, temperate, and cold zones. This heterogeneity not only results in rich and diverse forest resources, but also presents considerable challenges for interpreting remote sensing data. Issues such as the resemblance of surface characteristics across climatic zones, the similar spectral signatures of different vegetation types, and the spectral mixing between various land use types complicate efforts in forest classification. Amid the increasingly severe global climate issues such as global warming, the abundant forest resources in Yunnan are playing an important role in global climate governance, thereby attracting the attention of a considerable number of scholars. Ref. [31] analyzed forest cover and fragmentation patterns in Yunnan Province from 2000 to 2006 using the MODIS-VCF (Vegetation Continuous Fields) product, noticing an overall increase in forest area and a slowing trend in fragmentation. However, the low resolution of the MODIS-VCF at 250 m introduces errors in analyzing smaller forest areas. Ref. [32] utilized Sentinel-2 MSI data to extract multi-temporal and spectral information, integrating terrain data to map forest types in the Shangri-La Mountain area of Yunnan Province. However, due to the heterogeneity of the forest structure and the high degree of forest fragmentation in the study area, collecting a sufficient number of high-quality samples proved challenging. This limitation led to potential misclassification of some rare and dominant tree species. Ref. [33] used seasonal median values of Landsat-8 OLI (Operational Land Imager) images from March 2017 to March 2018, combined with various environmental factors, to produce a 30 m resolution forest map of Yunnan Province. This study indicates that due to the difficulty of obtaining samples from the entire study area, the samples are distributed in eight locations rather than across the entire Yunnan Province, which may result in the classification outcomes being influenced by the local distribution of the samples. Other studies on Yunnan’s forests have focused on forest types [34], tree species distribution [35,36], and forest fire analysis [37,38].
Although certain studies on the forests in Yunnan have been conducted recently, there are deficiencies in sample points, data sources, and methods that require resolution, and no high-resolution forest cover map has been created in recent years. To address these challenges and meet the diverse needs for forest distribution data in Yunnan Province, this study utilized a machine learning method based on the RF algorithm within the GEE to create a high-resolution (10 m) forest distribution map for the year 2022. The performance of this newly developed forest product was evaluated against two existing 10 m resolution products (Dynamic World [13] and WorldCover [39]) at provincial, city, and terrain scales to assess its accuracy. Additionally, the study examined the relationship between forest area and changes in latitude and longitude. The goal is to develop high-precision forest distribution maps in areas with significant geographic and climatic heterogeneity, thereby providing a robust scientific basis for promoting sustainable development and ecological conservation in Yunnan Province.

2. Materials and Methods
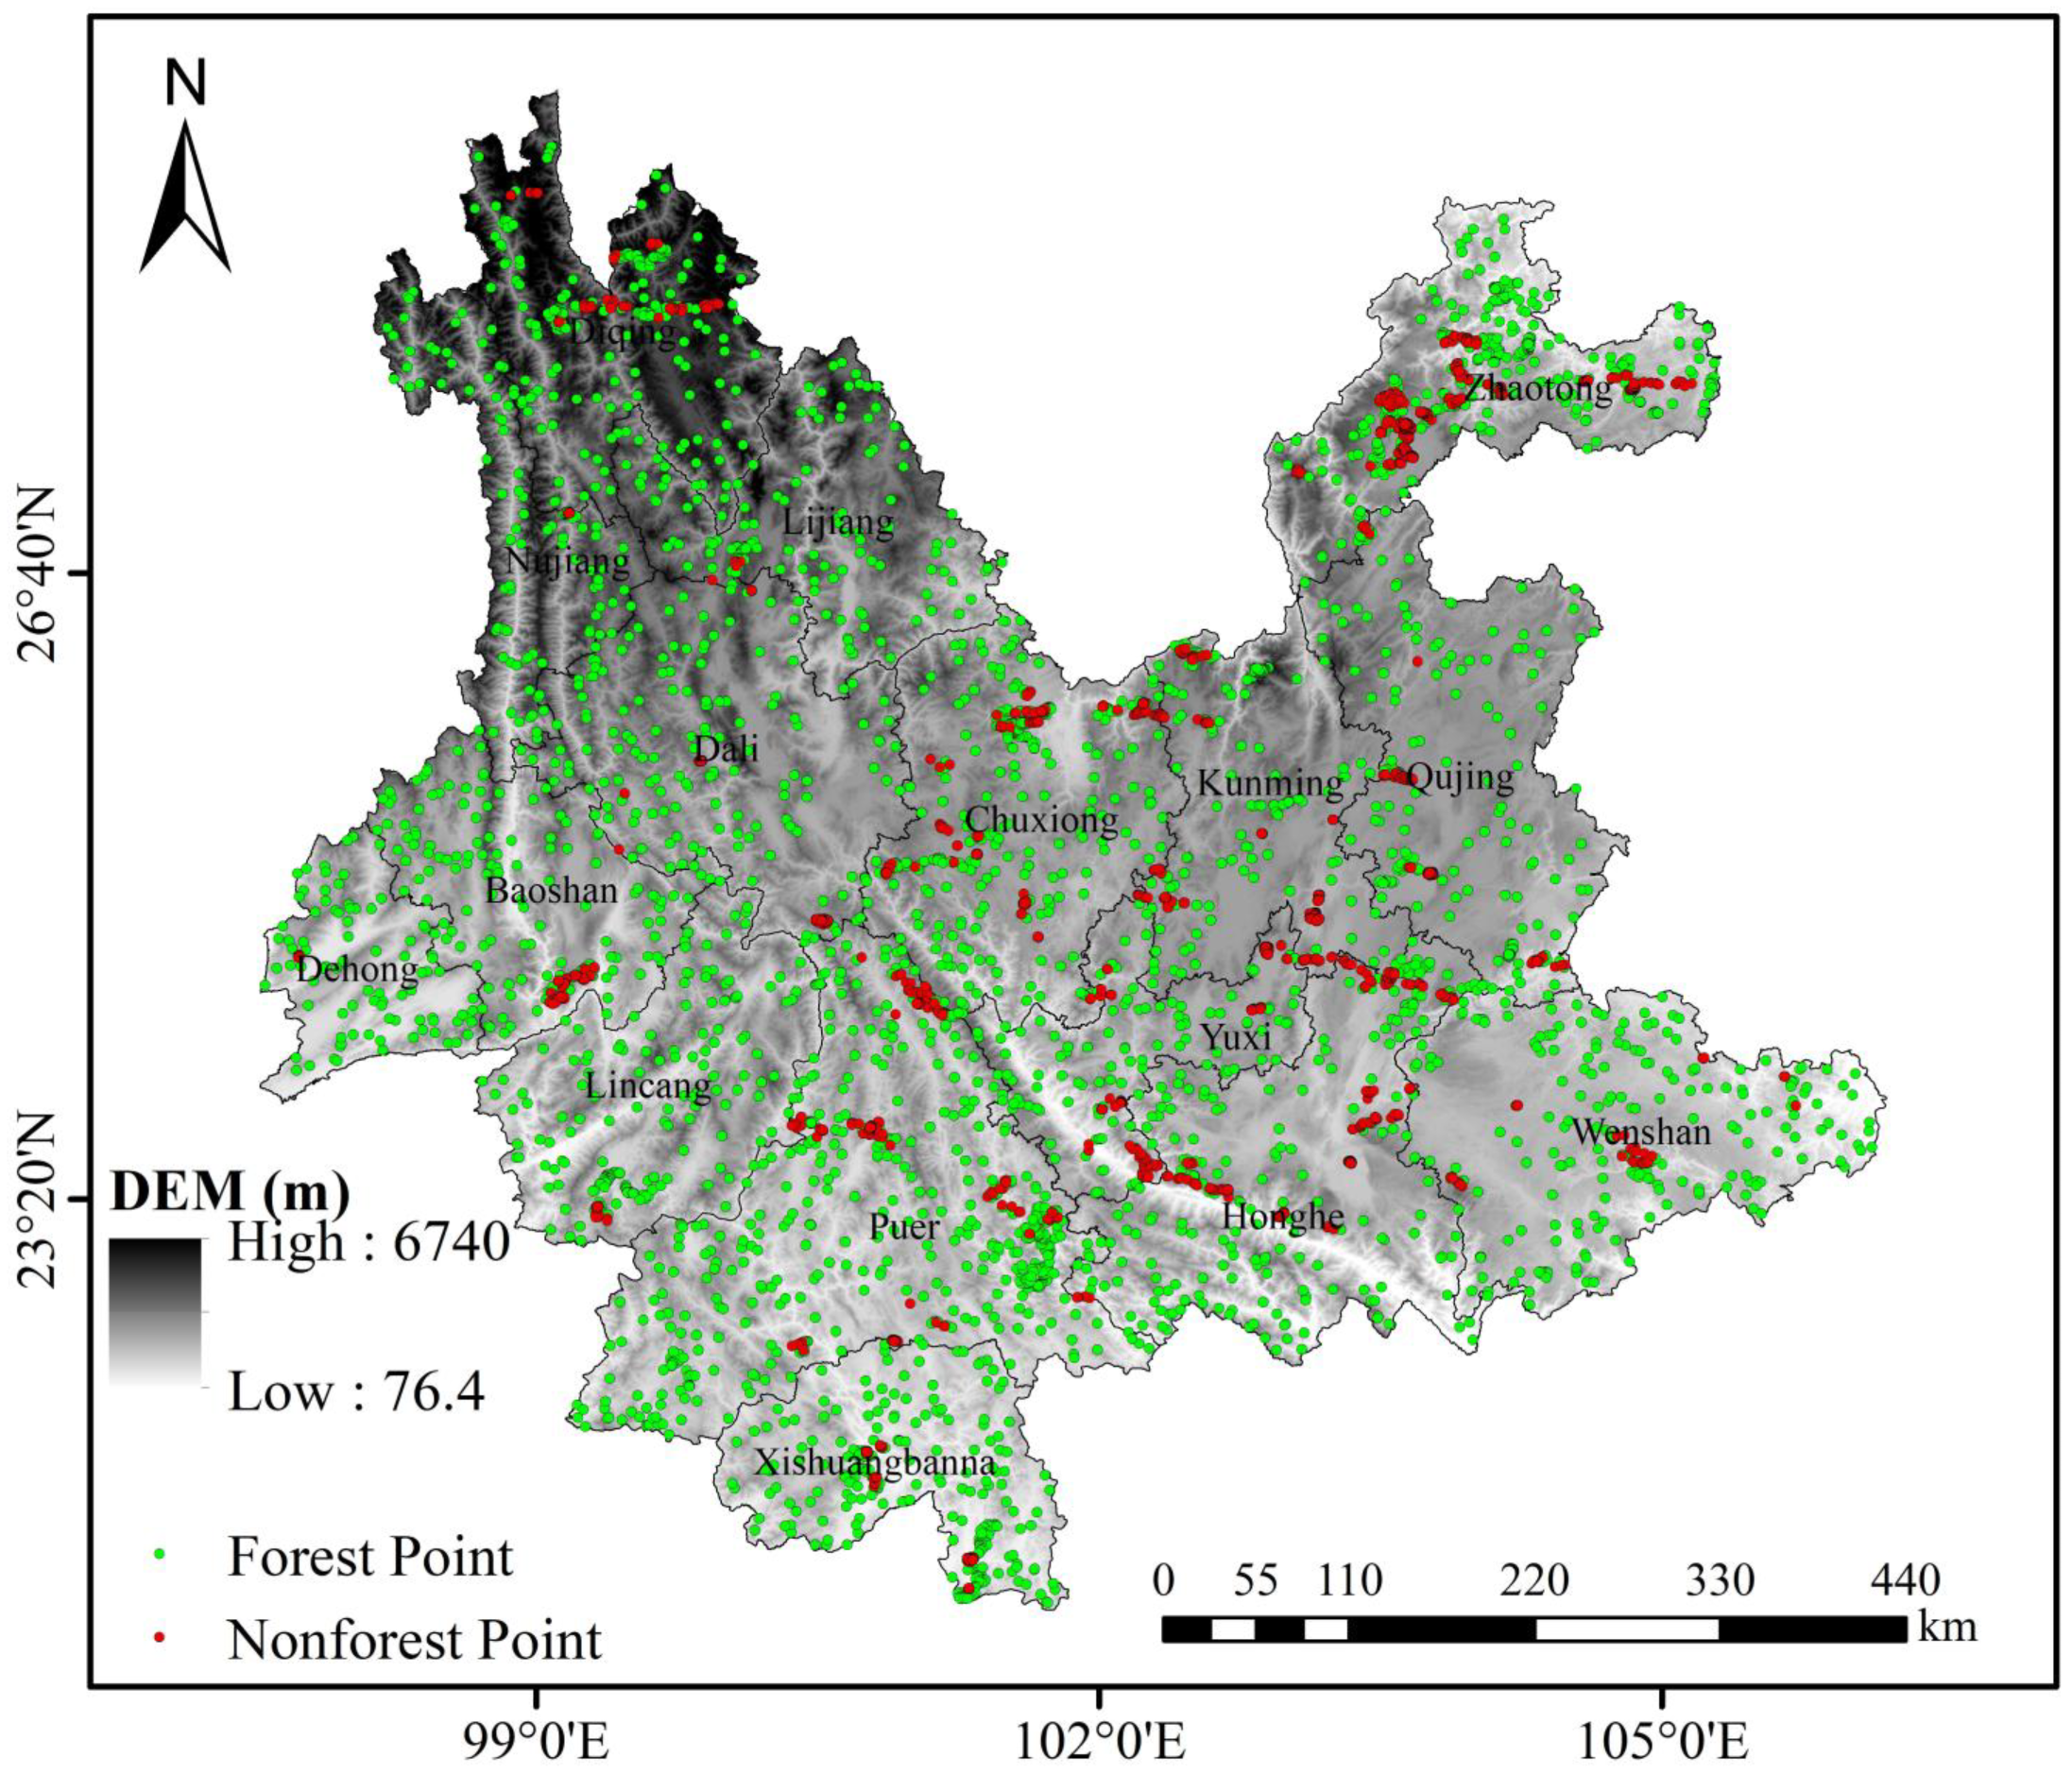
2.1. Study Area

Yunnan Province, located on the southwestern border of China, spans latitudes 21°8′ to 29°15′ north and longitudes 97°31′ to 106°11′ east. It shares borders with Myanmar to the west and is adjacent to Laos and Vietnam in the south, making it one of the provinces with the longest borderlines in China. Historically, it holds significant importance as a cradle of human civilization (Figure 1). The topography of Yunnan Province is characterized by higher elevations in the northwest, descending stepwise towards the southeast. This creates a diverse terrain with an average elevation of around 2000 m, but with substantial variations reaching up to a relative difference of 6664 m. Mountainous areas cover 88.64% of the province. The region experiences small annual temperature variations, but significant daily temperature fluctuations. Climate conditions vary considerably with elevation, resulting in substantial differences in precipitation distribution across the province. Yunnan’s landscape features high mountains, deep valleys, plateau lakes, virgin forests, and modern glaciers. These diverse climate types and unique geographical advantages have nurtured abundant forest resources, establishing Yunnan Province as a crucial ecological barrier for ecological security [40].

2.2. Data Sources and Preprocessing

2.2.1. Satellite Imagery and Preprocessing

The Landsat 8 and Landsat 9 satellites, launched in 2013 and 2020, respectively, were developed through a collaboration between the National Aeronautics and Space Administration (NASA) and the United States Geological Survey (USGS). This study utilized Level 2, Collection 2, Tier 1 data products from these satellites, which offer a spatial resolution of 30 m. To ensure data accuracy and reliability, the QA_PIXEL band was employed to filter out low-quality pixels, and cloud and shadow masks were applied.
The Sentinel-2 satellite, operated by the European Space Agency (ESA), is designed to capture high-resolution optical images of the Earth’s surface. In this study, Sentinel-2 Level-2A data products were used. For cloud removal, the Cloud Score+ (CS+) algorithm, as proposed by [41], was employed. This algorithm leverages a globally distributed training dataset generated by weakly supervised atmospheric similarity metrics to train the quality assessment model. Validation results show an overall accuracy of 80.96%, positioning it as one of the most advanced cloud removal methods currently available.
For the study region, preprocessed Landsat and Sentinel-2 imagery acquired in 2022 were merged and are hereafter referred to as LS2. Two commonly used vegetation indices—the normalized difference vegetation index (NDVI) and the land surface water index (LSWI)—were calculated using Equations (1) and (2), respectively:
N D V I = ρ n i r ρ r e d ρ n i r + ρ r e d
L S W I = ρ n i r ρ s w i r ρ n i r + ρ s w i r
where ρ N I R , ρ S W I R , and ρ r e d refer to the near-infrared (nir), shortwave infrared 1 (swir1), and red bands of LS2, respectively. NDVI is particularly effective in identifying and analyzing dense vegetation, while LSWI is useful for detecting changes in vegetation water content and identifying areas of bare soil and defoliation [42].
We also calculated kNDVI using Sentinel-2 satellite imagery. kNDVI is a recently proposed improved vegetation index based on the nonlinear generalization of NDVI. It addresses the saturation phenomenon in high-vegetation coverage areas by improving the linearization issue of NDVI, significantly enhancing the sensitivity and accuracy to vegetation greenness and biomass. Additionally, it exhibits advantages in terms of temporal and spatial stability, noise reduction, and linearity. These improvements make kNDVI highly applicable in fields such as ecological monitoring and agricultural production. The formula for calculating kNDVI is shown in Equation (3) [43]:
k N D V I = t a n h ρ n i r ρ r e d 2 σ 2
where σ is the parameter of the nuclear function used to control the distance between the near-infrared and red light bands.
Furthermore, we utilized the swir1, swir2, nir, red, green, and blue bands of Sentinel-2 data for annual median compositing, which served as input data for classification. This approach enables the effective identification of deforestation and reforestation areas within the year, enhancing mapping accuracy.

2.2.2. Digital Elevation Model (DEM)

The DEM originates from the Shuttle Radar Topography Mission (SRTM), which is currently one of the most comprehensive high-resolution models available. It has a spatial resolution of 1 arc-second (approximately 30 m) [44]. In this study, the elevation was directly obtained from the DEM, and the slope was calculated using the terrain functions provided by GEE. This approach enhances the efficiency and accuracy of acquiring terrain information.

2.3. Land Cover Data and Processing

The precision comparison products we chose were Dynamic World [13] and WorldCover [39], which are widely used in remote sensing. WorldCover does not have the data from 2022 because the change of forest area in one year is small, which has little impact on the overall area in the study area. Therefore, we chose the latest year (2021) to compare the accuracy with our product. Dynamic World is a near real-time global 10 m land use cover dataset published in 2022, and because it is near real-time, initial processing of the dataset is required. To mitigate inaccuracies stemming from the lack of cloud-free imagery at certain times, a frequency-based approach was employed to synthesize the forest category within the Dynamic World datasets. This approach involved labeling pixels with a forest probability, P(A), greater than 0.8, by Equation (4), as forest and converting them into a binary image to generate the forest frequency map:
P ( A ) = n ( A ) n ( T )
where P(A) represents the frequency of event A occurring, n(A) represents the number of times event A occurs, and n(T) represents the total number of possible events. The LS2-RF product was compared with the two existing products at the provincial, prefecture, and terrain scales. Given that WorldCover lacks data for 2022, the most recent available year was selected for comparison.

2.4. Methods

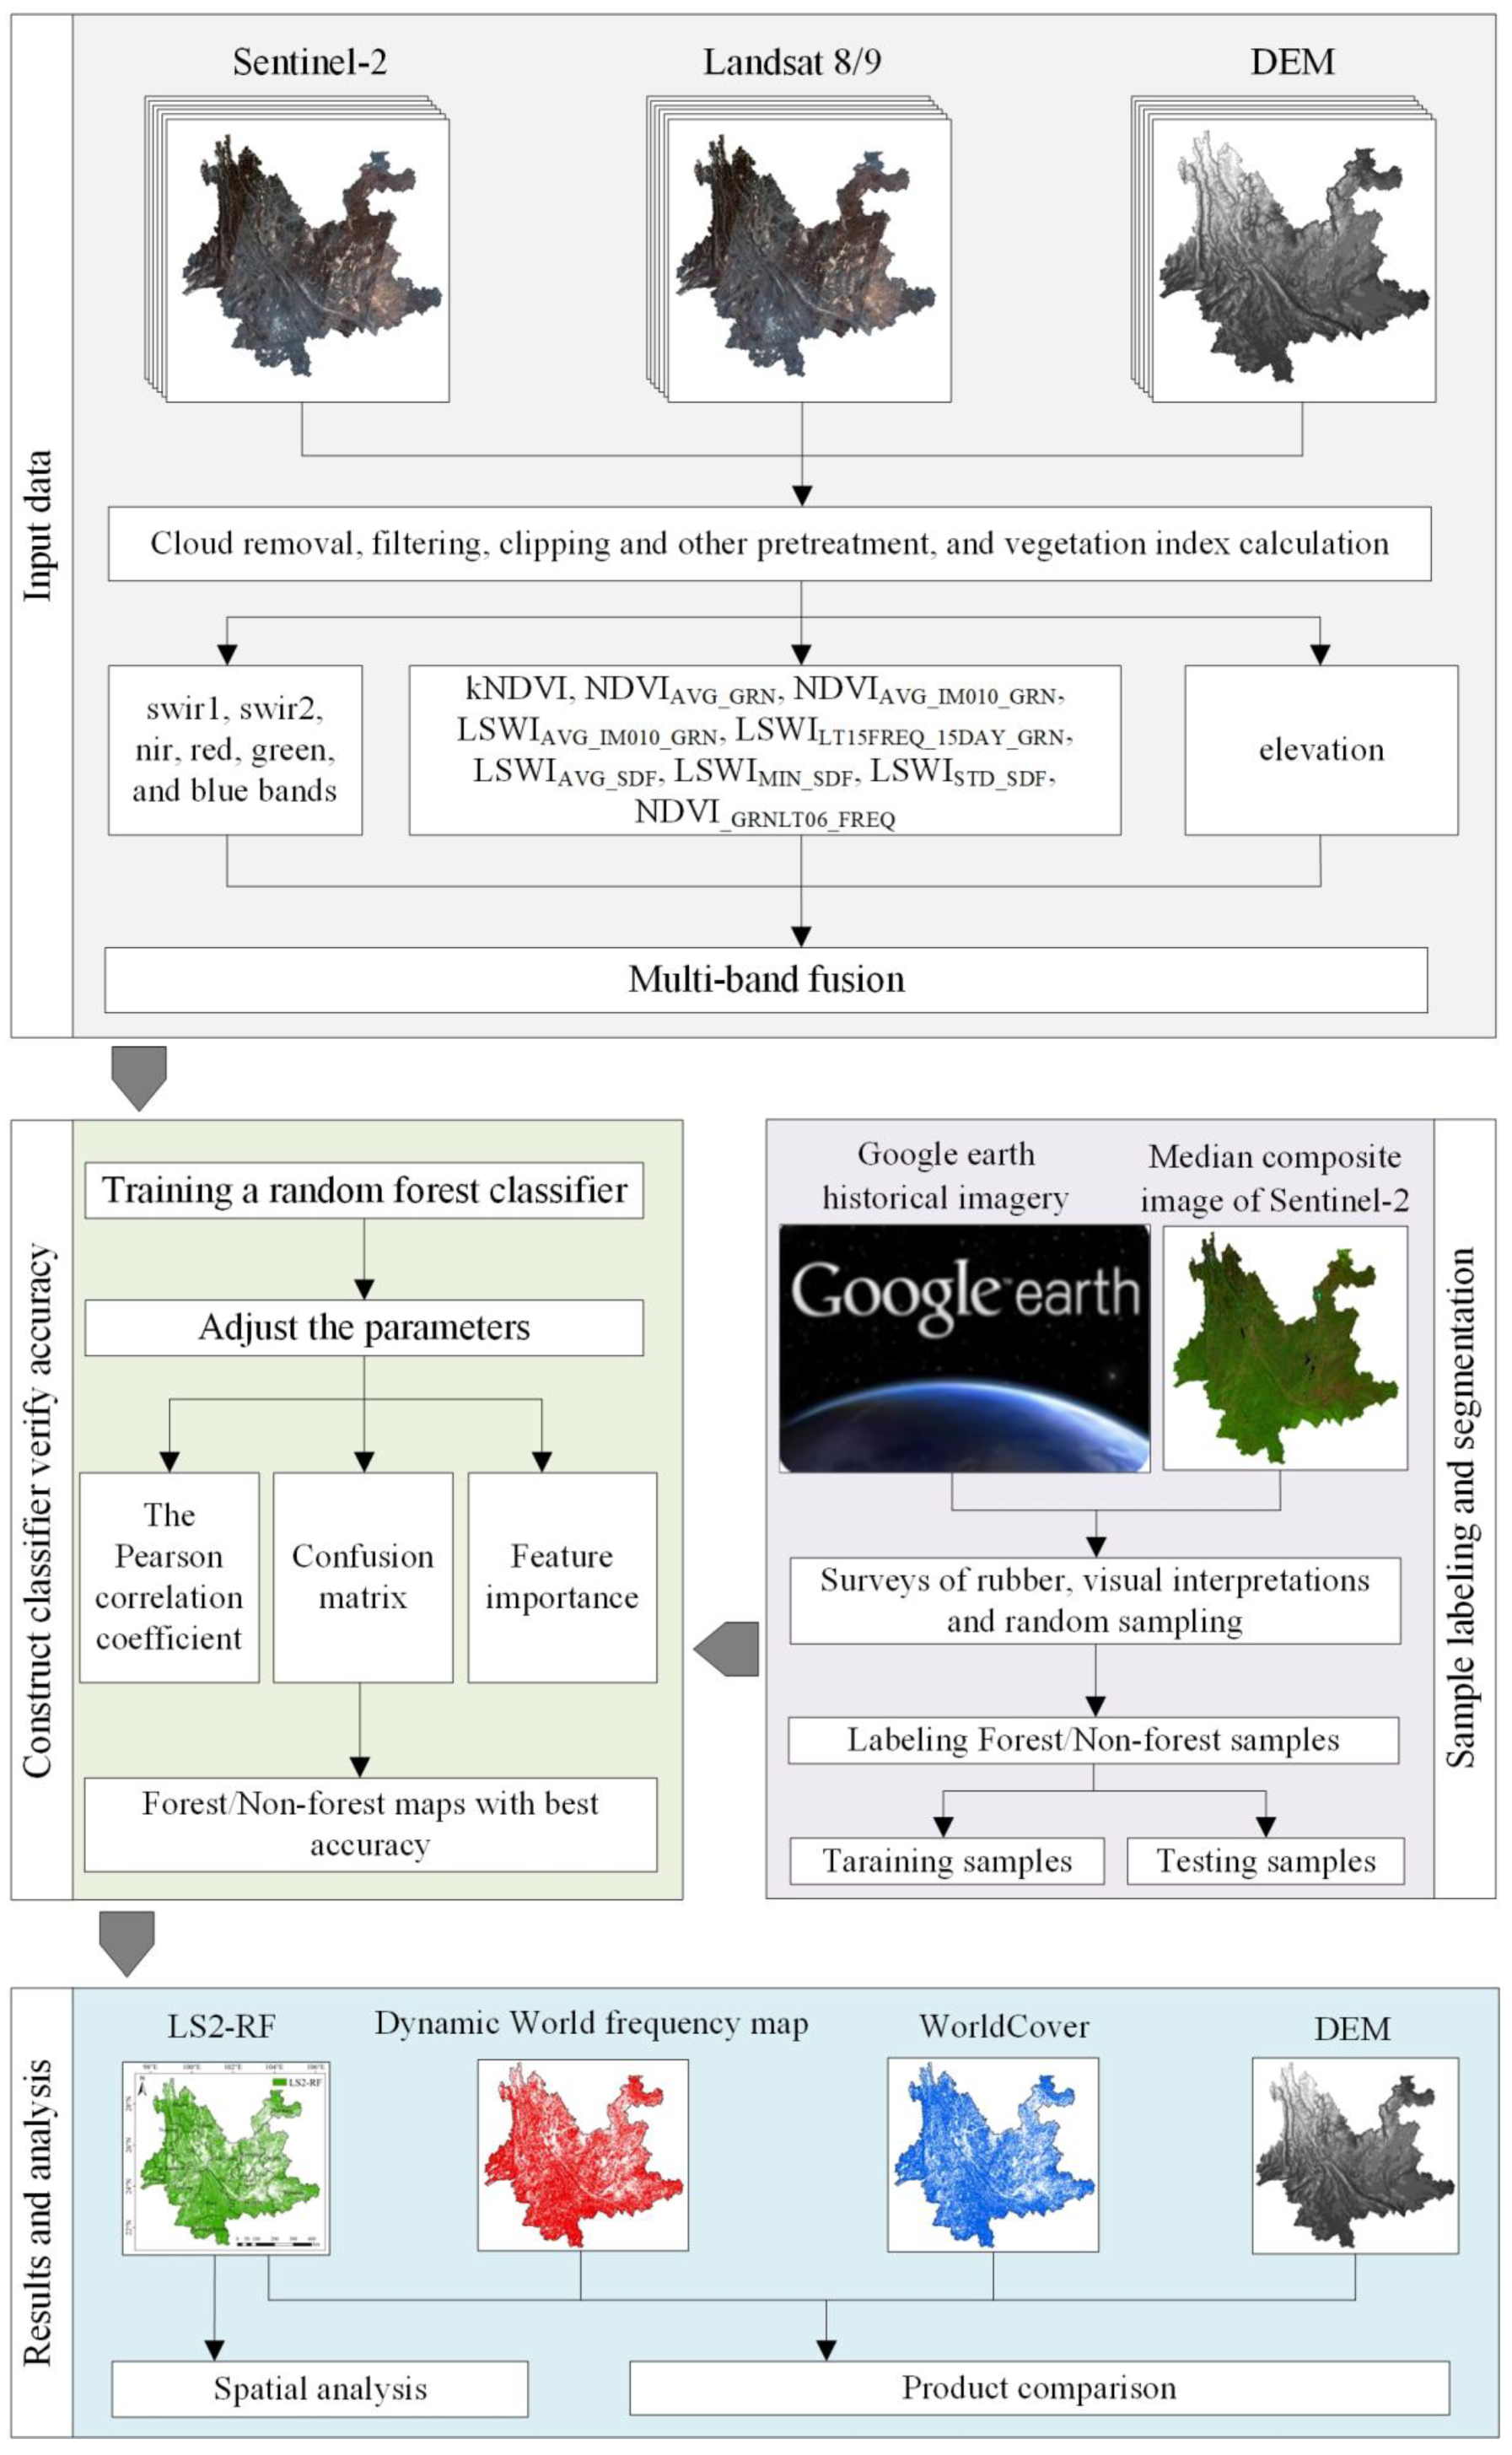
2.4.1. Technology Roadmap

The workflow, as illustrated in Figure 2, consists of seven primary steps: (1) preprocessing of satellite images, such as cloud removal and other steps, (2) generation of classification features from remote sensing data, (3) preparation of ground reference data, (4) construction of the classifier, (5) analysis of feature importance and Pearson correlation coefficients of the features, (6) accuracy assessment and product comparison, and (7) analysis of forest spatial distribution patterns. Each step is meticulously designed to ensure a comprehensive and precise mapping of forest cover, from the initial data preparation to the final analysis.

2.4.2. Construction of Classification Features

Yunnan Province spans a range of climatic zones, from tropical to temperate, supporting a diverse array of deciduous and evergreen forests. Notably, the region’s rubber trees, which are predominant in tropical areas, undergo significant leaf fall in mid-February, contrasting sharply with the phenological patterns of northern and higher-altitude forests. Leveraging remote sensing imagery captured during this leaf fall period facilitates the differentiation between evergreen and deciduous forests. However, relying solely on this imagery for classification can introduce considerable uncertainty in identifying deciduous types. Furthermore, the highly fragmented agricultural landscape, characterized by croplands with high biomass crops such as bananas and sugarcane, further complicates forest identification [45,46].
To improve the accuracy of forest classification across different seasons and reduce uncertainties associated with agricultural crops, this study defines two distinct temporal windows for image synthesis. The period from 10 April to 30 November (days 100 to 335) is designated as the vegetation leaf greening (GRN) period, while the period from 1 December to 10 April of the following year (days 1 to 100 and 335 to 365) is identified as the vegetation leaf Senescence, Defoliation, and Foliation (SDF) period for deciduous forests. During these intervals, LS2 data were preprocessed and synthesized to support the analysis.
Specifically, for the GRN period, the following features were generated: the average NDVI (NDVIAVG_GRN), the interval means of 0th to 10th percentiles of NDVI and LSWI (NDVIAVGIM010_GRN and LSWIAVGIM010_GRN), the frequency of NDVI below 0.6 (NDVI_GRNLt06_FREQ), and the frequency of LSWI below 0.15 in a 15-day time window (LSWILT15FREQ_15DAY_GRN). The thresholds, such as NDVI < 0.6 and LSWI < 0.15, were determined based on a combination of empirical testing and established references [46]. NDVIAVG_GRN is particularly targeted at dense vegetation, while the other features primarily identify land use change (e.g., planting, harvest). Forests are unlikely to exhibit higher values for NDVIAVG_IM010_GRN, LSWIAVGIM010_GRN, NDVI_GRNLT06_FREQ, and LSWILT15FREQ_15DAY_GRN during the GRN season, whereas croplands with high biomass may hold higher values for these metrics. During the SDF period, three features were generated: the minimum, average, and standard deviation of LSWI (LSWIMIN_SDF, LSWIAVG_SDF, and LSWISTD_SDF), which are particularly useful for deciduous rubber plantation identification [47]. Additionally, a median value composite of the spectral bands, including blue, green, red, NIR, SWIR1, and SWIR2 from LS2 data, was employed to construct the data cube for classification.
Due to the significant elevation differences in Yunnan, terrain factors can significantly impact forest distribution. Therefore, we extracted terrain features as important indicators for forest recognition. Most importantly, we incorporated the latest kNDVI into the feature set as input data, aiming to enhance the ability to handle complex vegetation environments. All the aforementioned methods were implemented in GEE.

2.4.3. Ground Samples

The ground samples for this study were derived from three sources: surveys of rubber plantations in the southern region (in 2022, plant diversity of rubber plantation was investigated in southern Yunnan, and rubber and non-rubber sample points were marked in and around rubber plantation plots), visual interpretations of high-resolution satellite imagery, and random sampling of three product-classified consistent areas (random sampling can evenly distribute the sample points in the study area and greatly reduce the risk of sample distribution bias). To enhance the efficiency of ground sample interpretation, an initial categorization was performed, dividing samples into forest and non-forest categories using GEE. This process involved implementing buffer reinforcement strategies at sample points to address weight imbalance and minimize classification errors. The categorization utilized the latest high-resolution imagery from Google and median composite images from Sentinel-2. Studies have shown that leveraging the similarities and differences between existing land cover products can further enhance mapping accuracy [48]. Therefore, the included forest frequency maps from Dynamic World and WorldCover were incorporated with a particular focus on reconciling discrepancies in forest classification outcomes between these two sources. After a preliminary classification with high accuracy was obtained, the results from Dynamic World, WorldCover, and our classification were overlaid. In GEE, random sampling in areas considered forest by all three products was performed, setting the number of sample points to 2000. Finally, the sampling results were merged with ground samples and reclassified to further improve classification accuracy.
The labeled results were exported as KML files and further validated using historical imagery from Google Earth. This rigorous workflow ensured precise ground truthing, resulting in the labeling of 7861 sample points, comprising 4541 forest samples and 3320 non-forest samples. The spatial distribution of these sample points is depicted in Figure 1.

2.4.4. Algorithm for Classification

Machine learning has become a powerful tool for handling and analyzing large-scale remote sensing data, and it has been widely applied across various fields, including land use/land cover change [27,49,50]. Among the machine learning algorithms, RF has superior accuracy compared to other algorithms, making it a preferred choice for processing satellite imagery and addressing environmental issues [51,52]. RF is a non-parametric ensemble learning algorithm based on decision trees, developed by [53]. It aggregates numerous independent decision trees, each trained on different datasets, to produce optimal prediction results. Currently, RF is widely applied in the field of vegetation mapping research [54,55]. In this study, the RF on GEE was used to generate a forest map of Yunnan Province with a resolution of 10 m for 2022. By continuously iterating on the parameters, the optimal classification accuracy is achieved when the number of trees is determined to be 300.

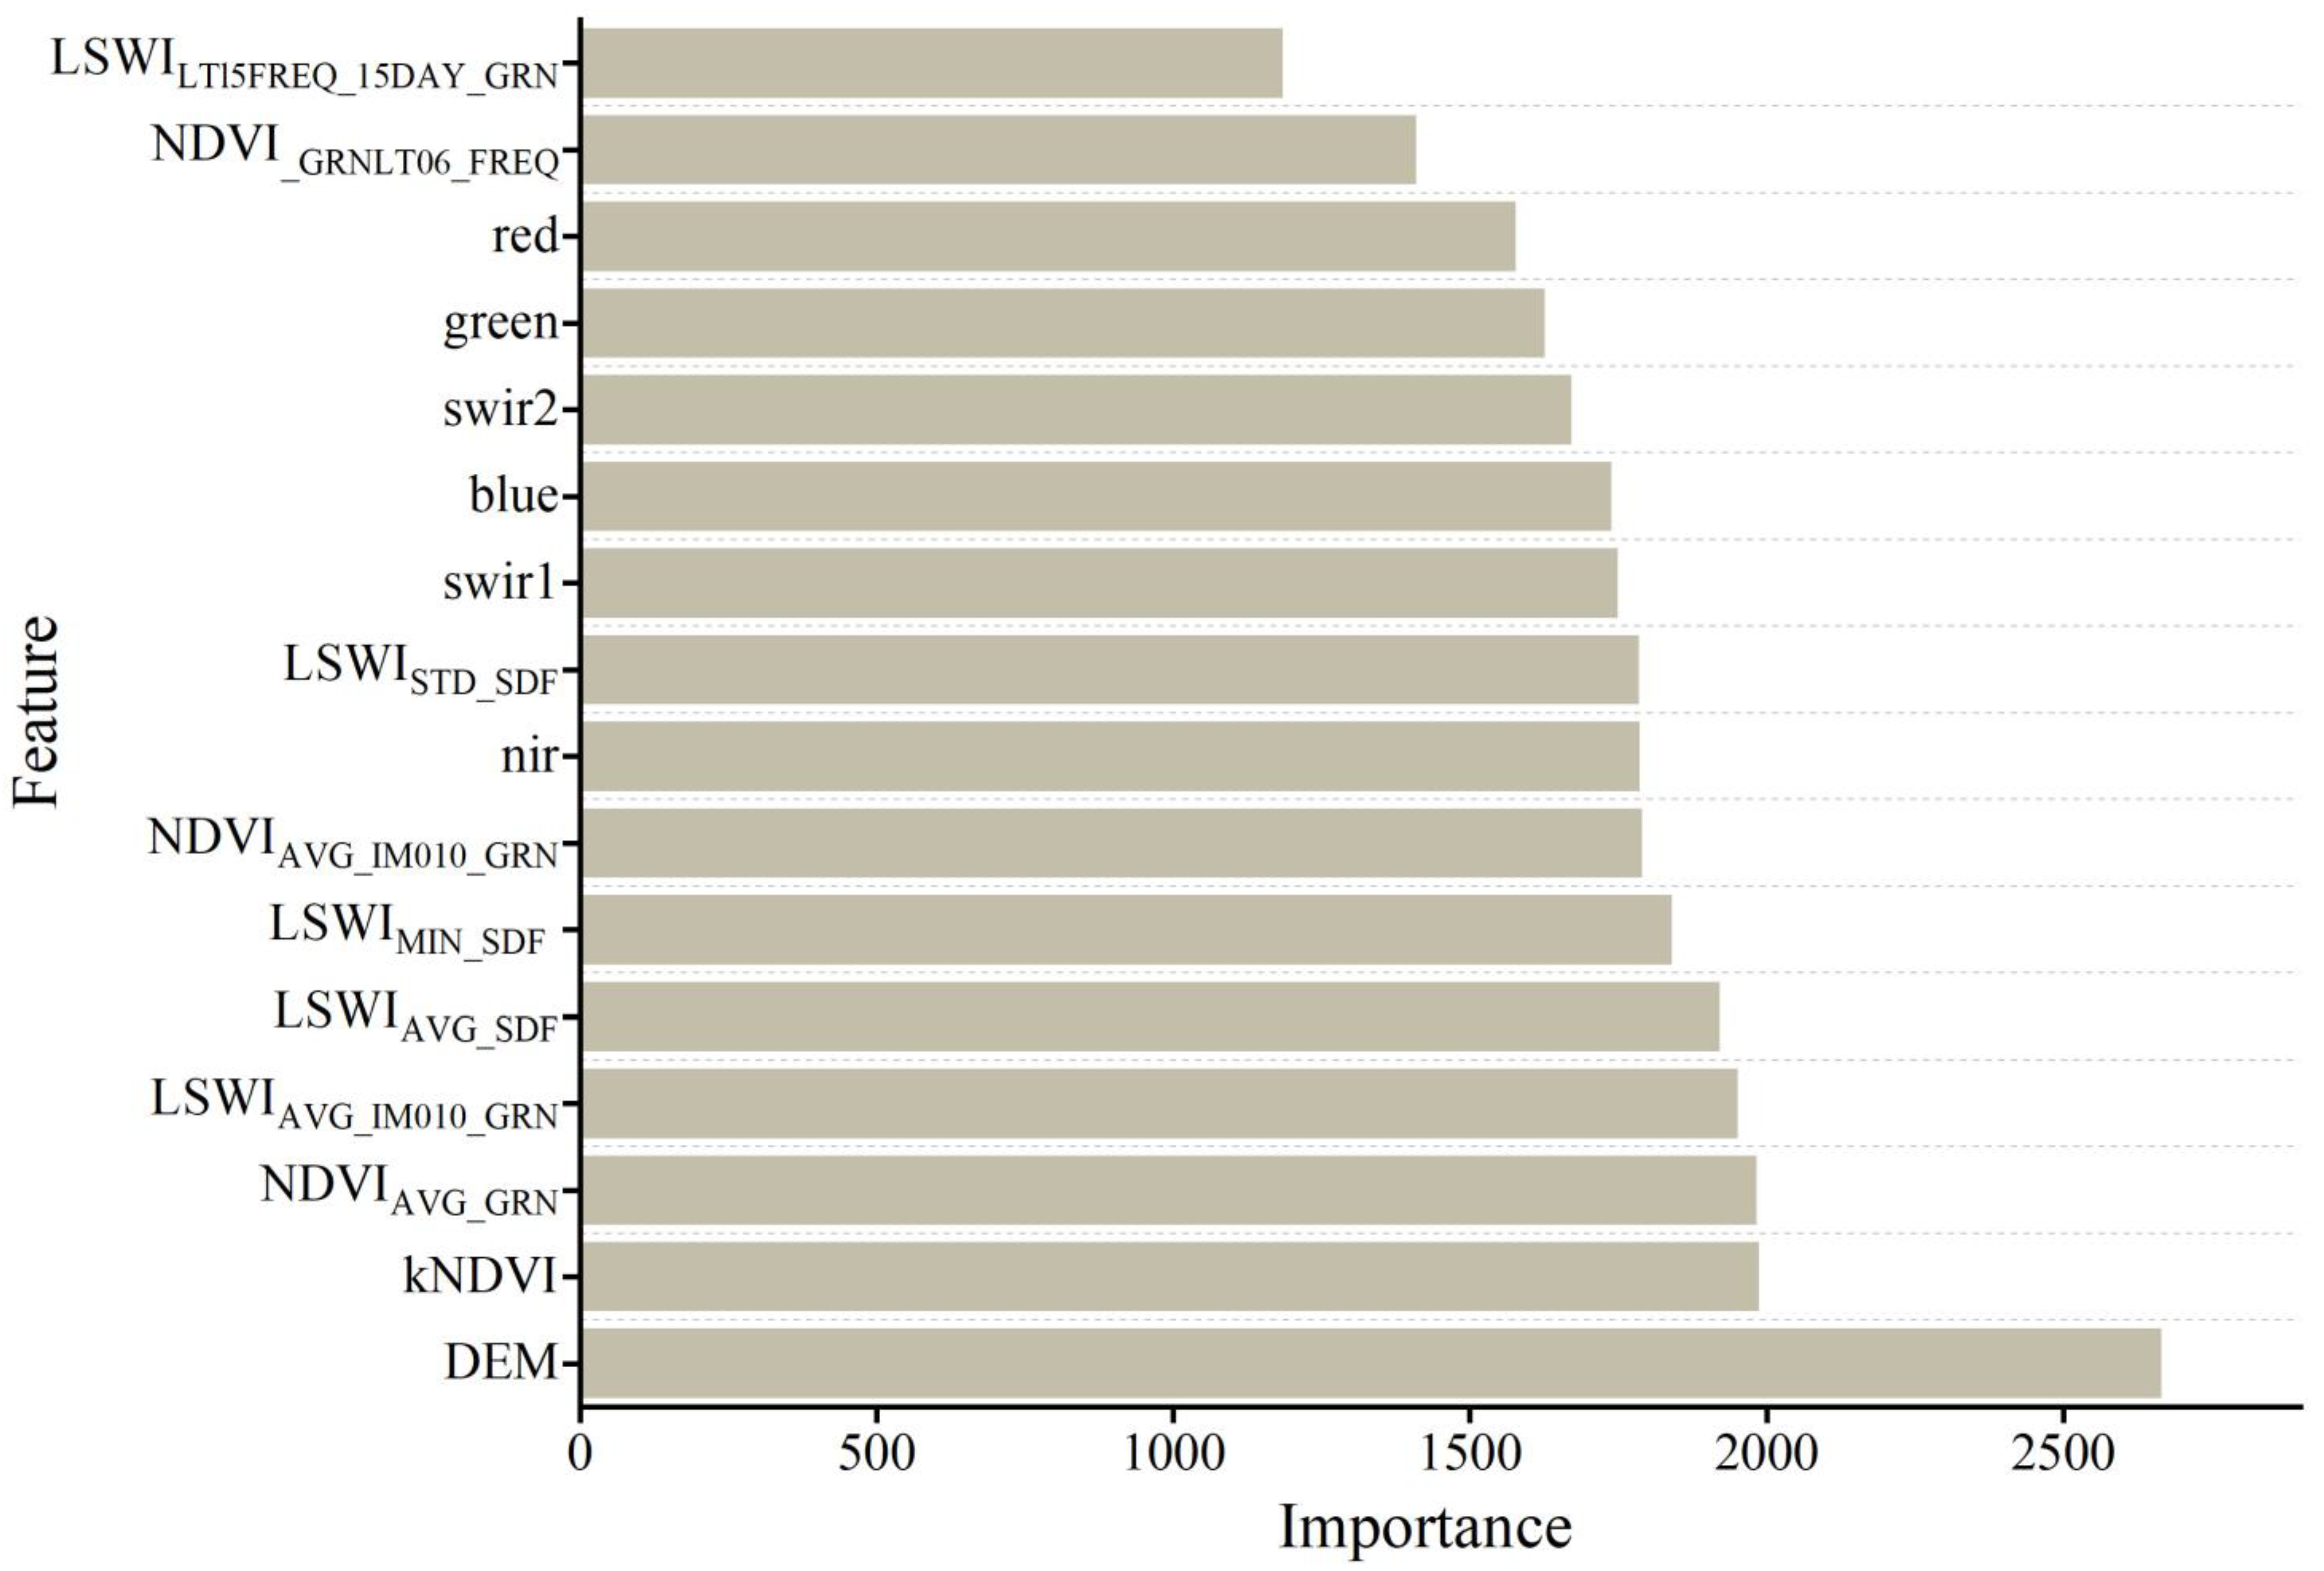
2.4.5. The Method of Feature Importance

The RF not only effectively performs image classification, but also selects features from high-dimensional data [56]. In this study, the feature importance scores for all features were calculated using the RF feature importance method in GEE. The principle of this method involves replacing the values of a specific feature with random numbers to assess its impact on the model’s accuracy. The importance of the parameter is measured by the average decrease in accuracy obtained from multiple calculations—the higher the value, the more important the variable [57].

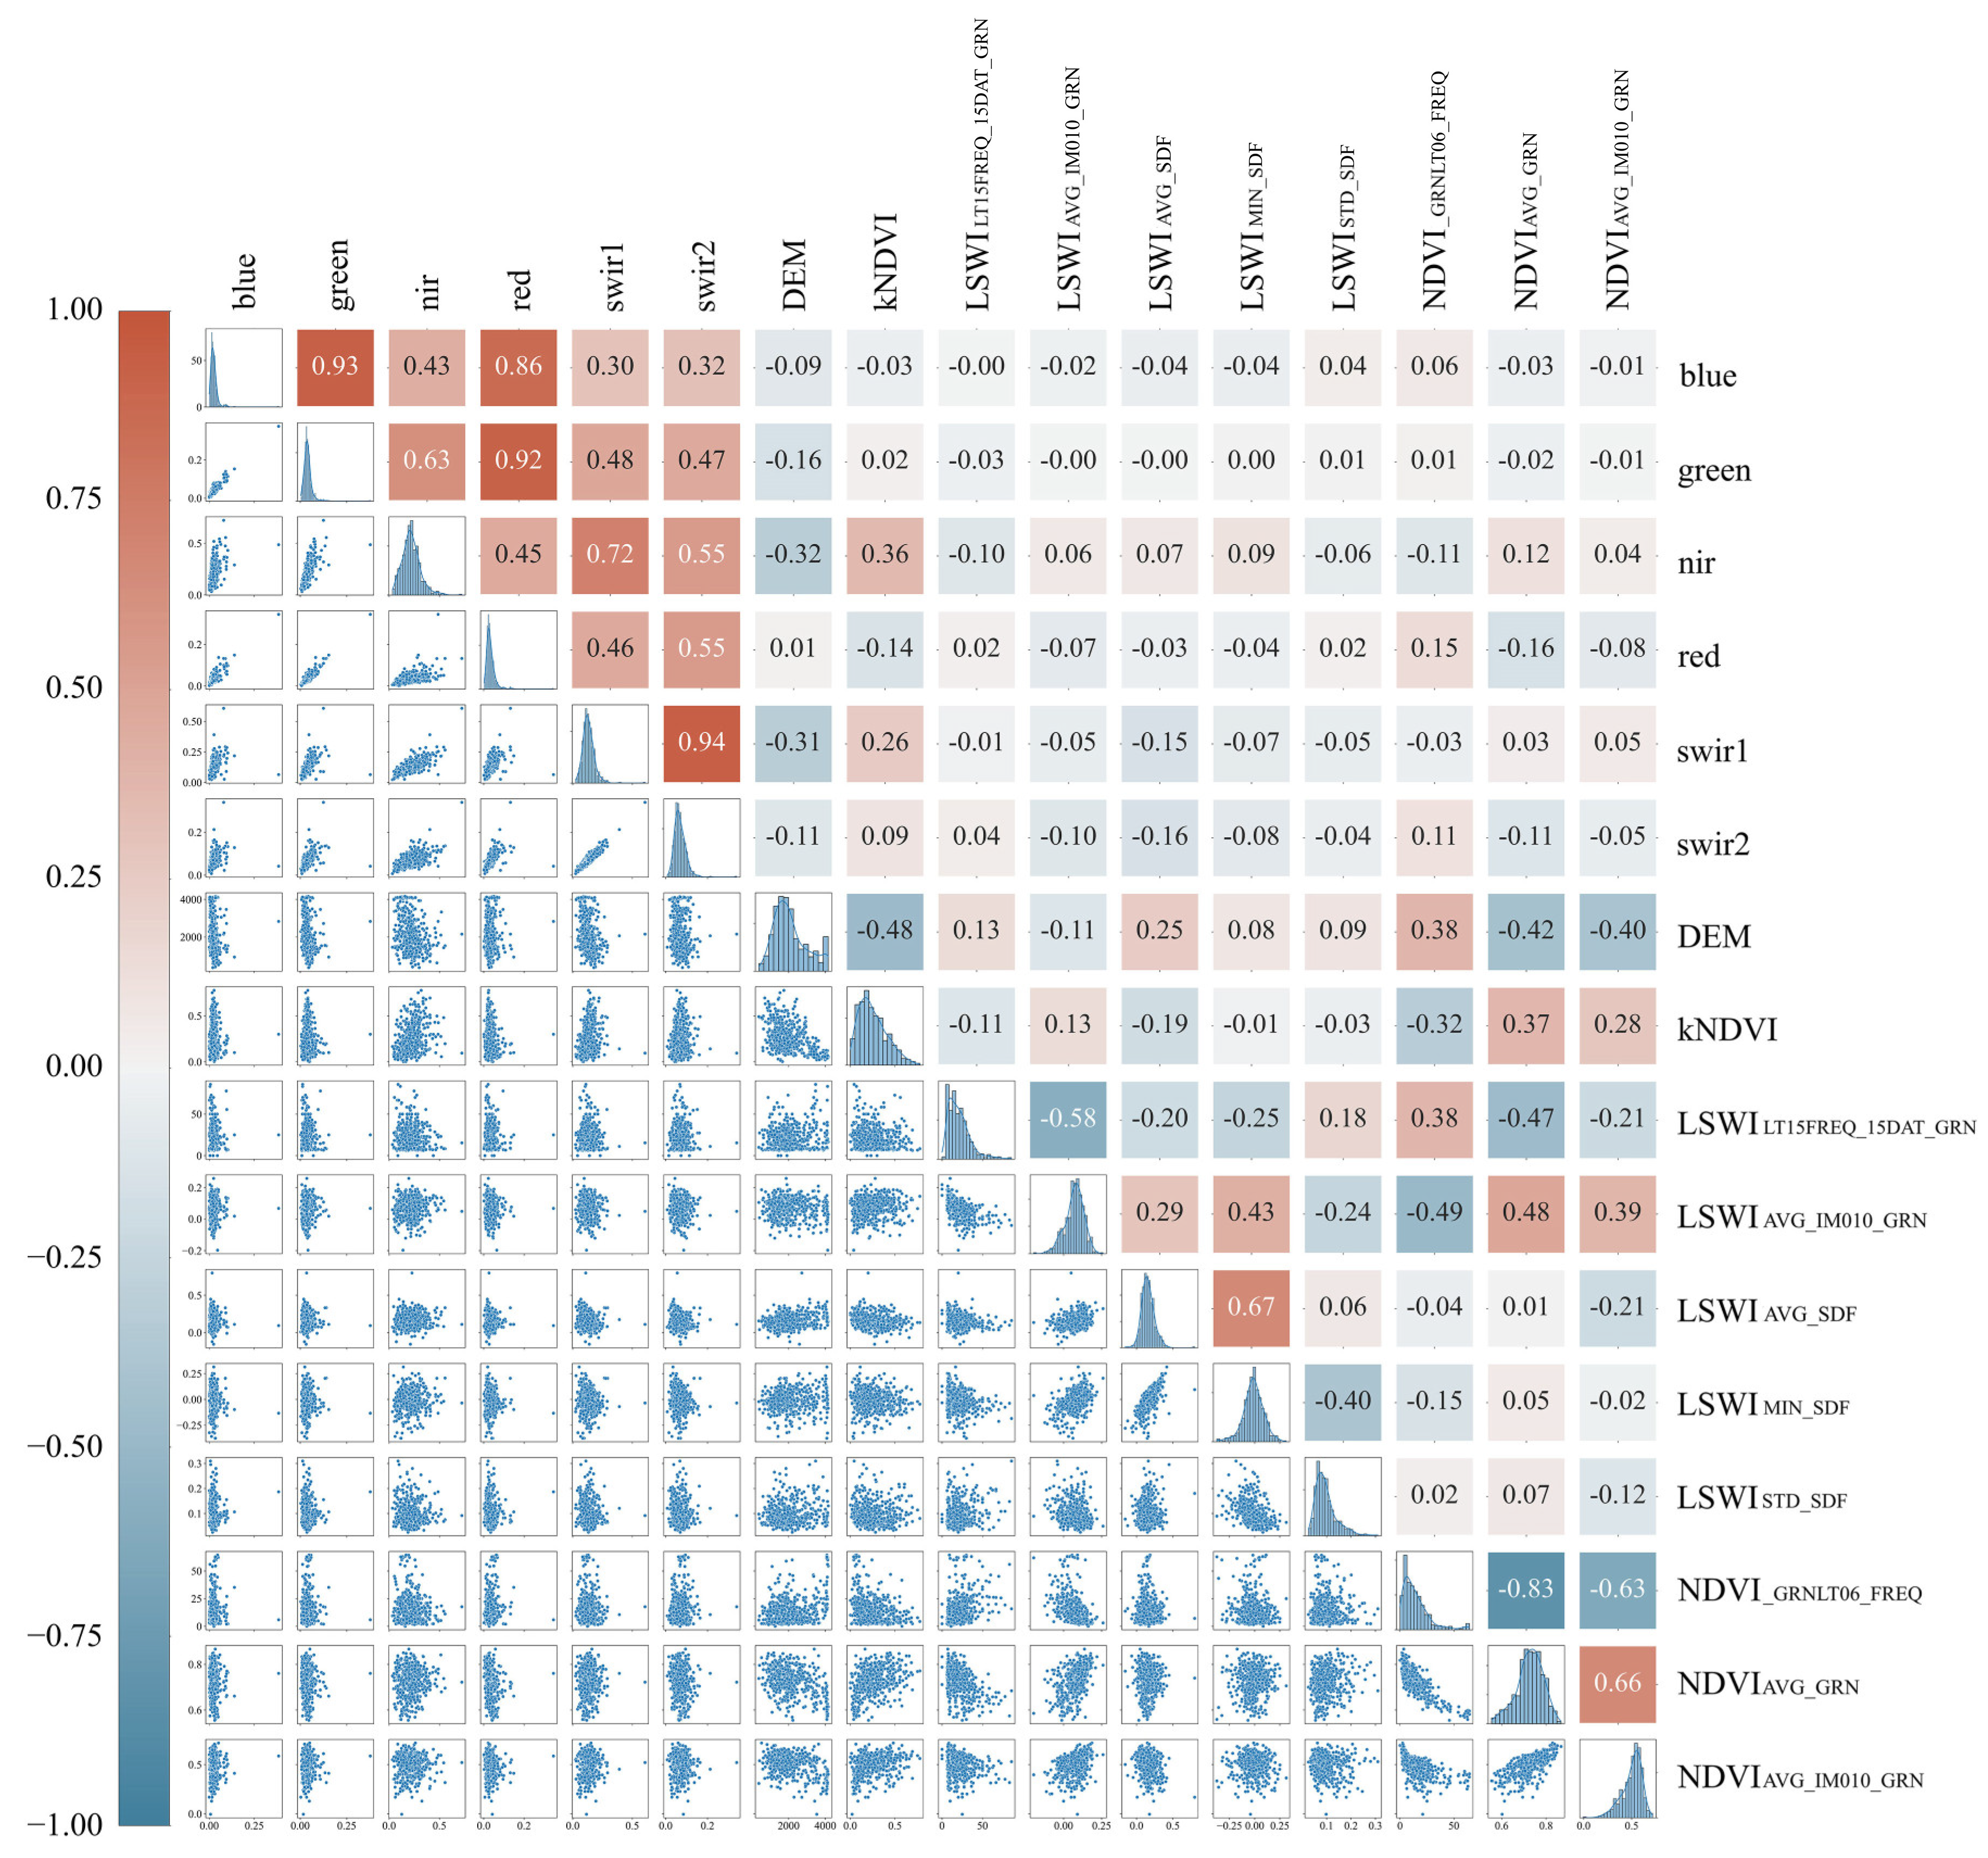
2.4.6. The Pearson Correlation Coefficient

The Pearson correlation coefficient is a statistical measure of the strength and direction of a linear relationship between two continuous variables [58]. It ranges from −1 to 1. A correlation coefficient of 1 indicates a perfect positive linear relationship between the two variables, while a correlation coefficient of −1 indicates a perfect negative linear relationship. A correlation coefficient of 0 indicates no linear relationship between the two variables. The formula for calculating the Pearson correlation coefficient is as follows:
r = i = 1 n x i x ¯ y i y ¯ i = 1 n x i x ¯ 2 i = 1 n y i y ¯ 2
where x i and y i are the observed values of the two variables, and x and y are their respective means. The numerator represents the covariance, which measures the extent to which the variations of two variables change together. The denominator is the product of the standard deviations of the two variables, used to normalize the result.

2.4.7. Accuracy Assessment and Product Comparison

To evaluate the performance of the RF classifier, a total of 1572 sample points were used. The evaluation was based on a confusion matrix, a square matrix where the rows represent actual classes, and the columns represent predicted classes [59]. In this study, a binary classification task resulted in a 2 × 2 confusion matrix with four possible outcomes: True Positive (TP), False Negative (FN), False Positive (FP), and True Negative (TN).
The forest cover map generated in this study for 2022, referred to as “LS2-RF,” was compared with the 2022 Dynamic World forest frequency map and the 2021 WorldCover forest cover map by ESA, both of which have a spatial resolution of 10 m.

2.4.8. Analysis of Forest Spatial Distribution Patterns

Slope was categorized into six classes: gentle slope (0–5°), moderate slope (>5–8°), gradual slope (>8–15°), steep slope (>15–25°), very steep slope (>25–35°), and extremely steep slope (>35°). Elevation was divided into six categories with boundaries at 0 m, 500 m, 1000 m, 1500 m, 2500 m, and 3500 m. The distribution differences among the three products were analyzed based on these terrain categories. Additionally, the latitude and longitude distribution of LS2-RF was calculated using GEE. Latitude was discretized into bands with a 0.1-degree interval, and pixel area calculations were performed using a latitude filter to determine the forest area for each latitude interval. The same methodology was applied to analyze forest distribution along longitude.
Finally, this study analyzed the spatial distribution patterns of forest cover in Yunnan Province in 2022 at the provincial, prefecture, terrain, and latitude/longitude scales. The objective was to provide detailed and comprehensive information for forest monitoring, thereby supporting regional ecological assessments, forest conservation efforts, and governmental decision-making processes.

3. Results

3.1. Accuracy Assessment

Because the classification accuracy of Dynamic World and WorldCover is global-scale, it may not accurately represent the classification accuracy at the regional scale. Therefore, in order to clearly contrast the differences in accuracy, we randomly sampled 20% of the sample points and used a confusion matrix to validate the accuracy of three products, calculating overall accuracy, producer’s accuracy, user’s accuracy, and kappa coefficient. The results are shown in Table 1. The results indicate that the LS2-RF model demonstrated a high classification accuracy (overall accuracy: 96.35%; producer’s accuracy: 97.74%; user’s accuracy: 97.41%; kappa coefficient: 0.9015) (Table 1). In contrast, Dynamic World has the lowest classification accuracy (overall accuracy: 73.88%; producer’s accuracy: 94.54%; user’s accuracy: 72.98%; kappa coefficient: 0.3502). The WorldCover product displayed higher accuracies in classification compared to the Dynamic World product (overall accuracy: 87.66%; producer’s accuracy: 98.36%; user’s accuracy: 84.87%; kappa coefficient: 0.7128). Overall, our forest products exhibit the highest accuracy compared to the other two datasets.

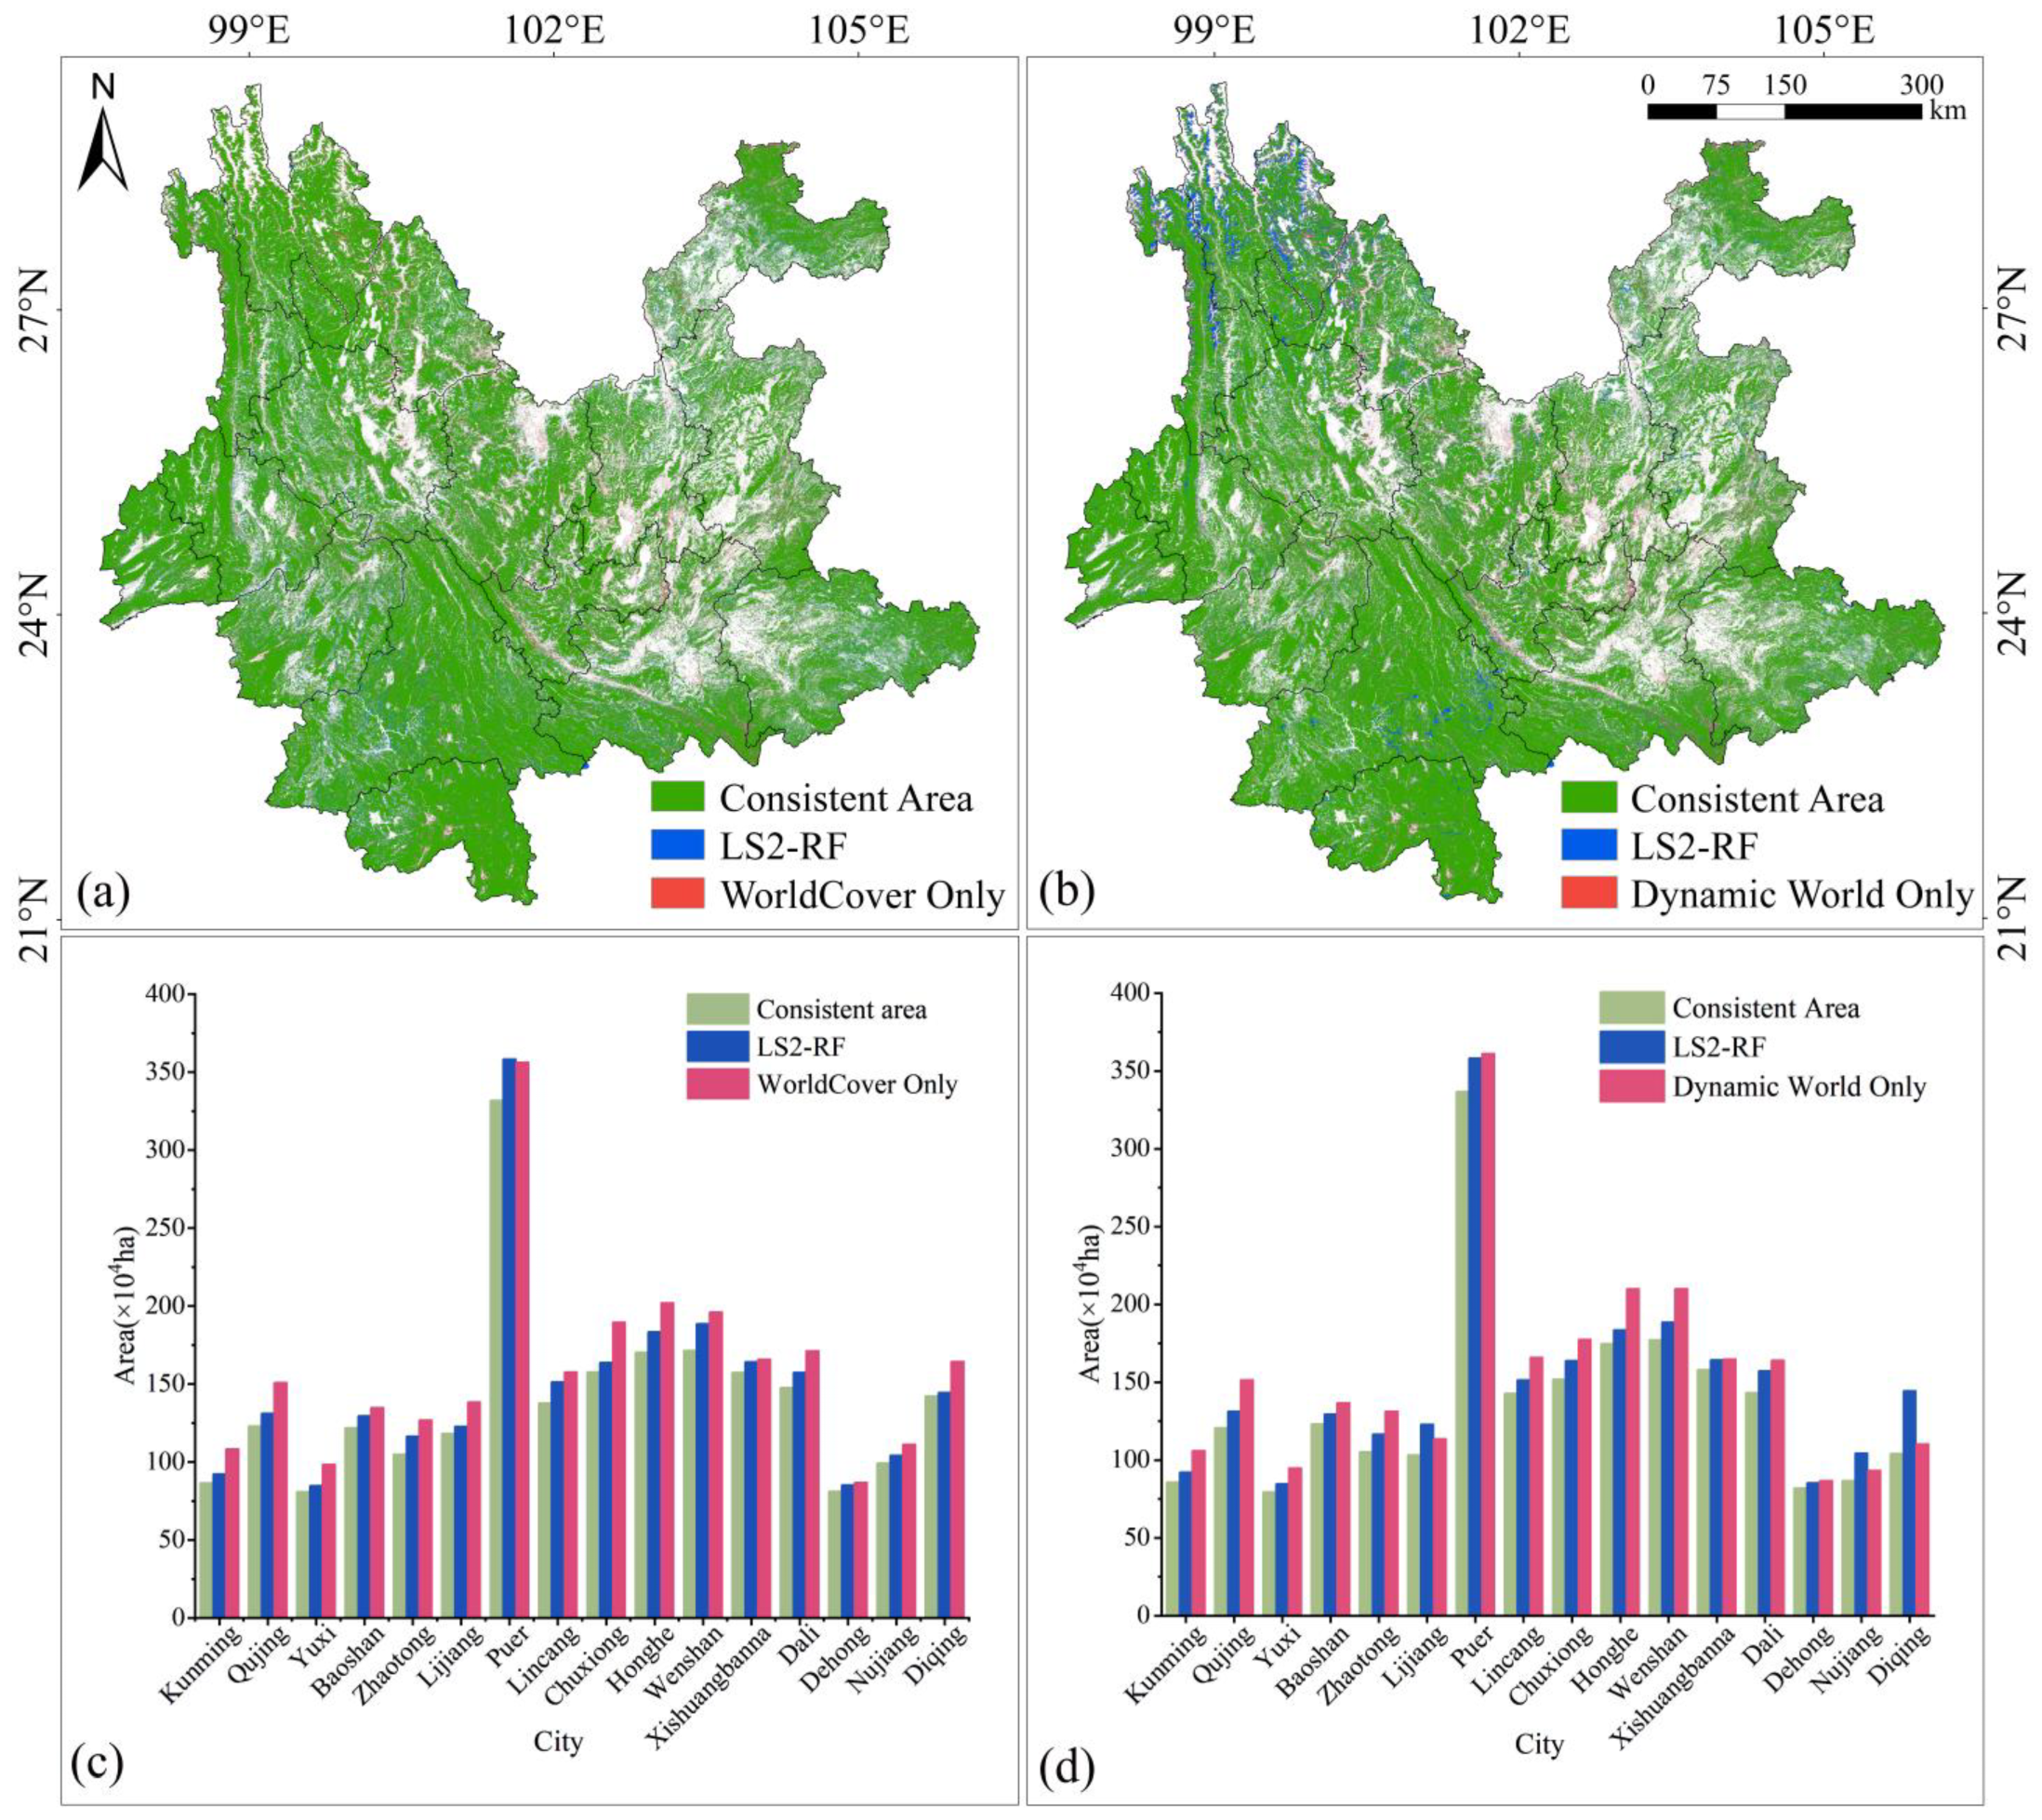
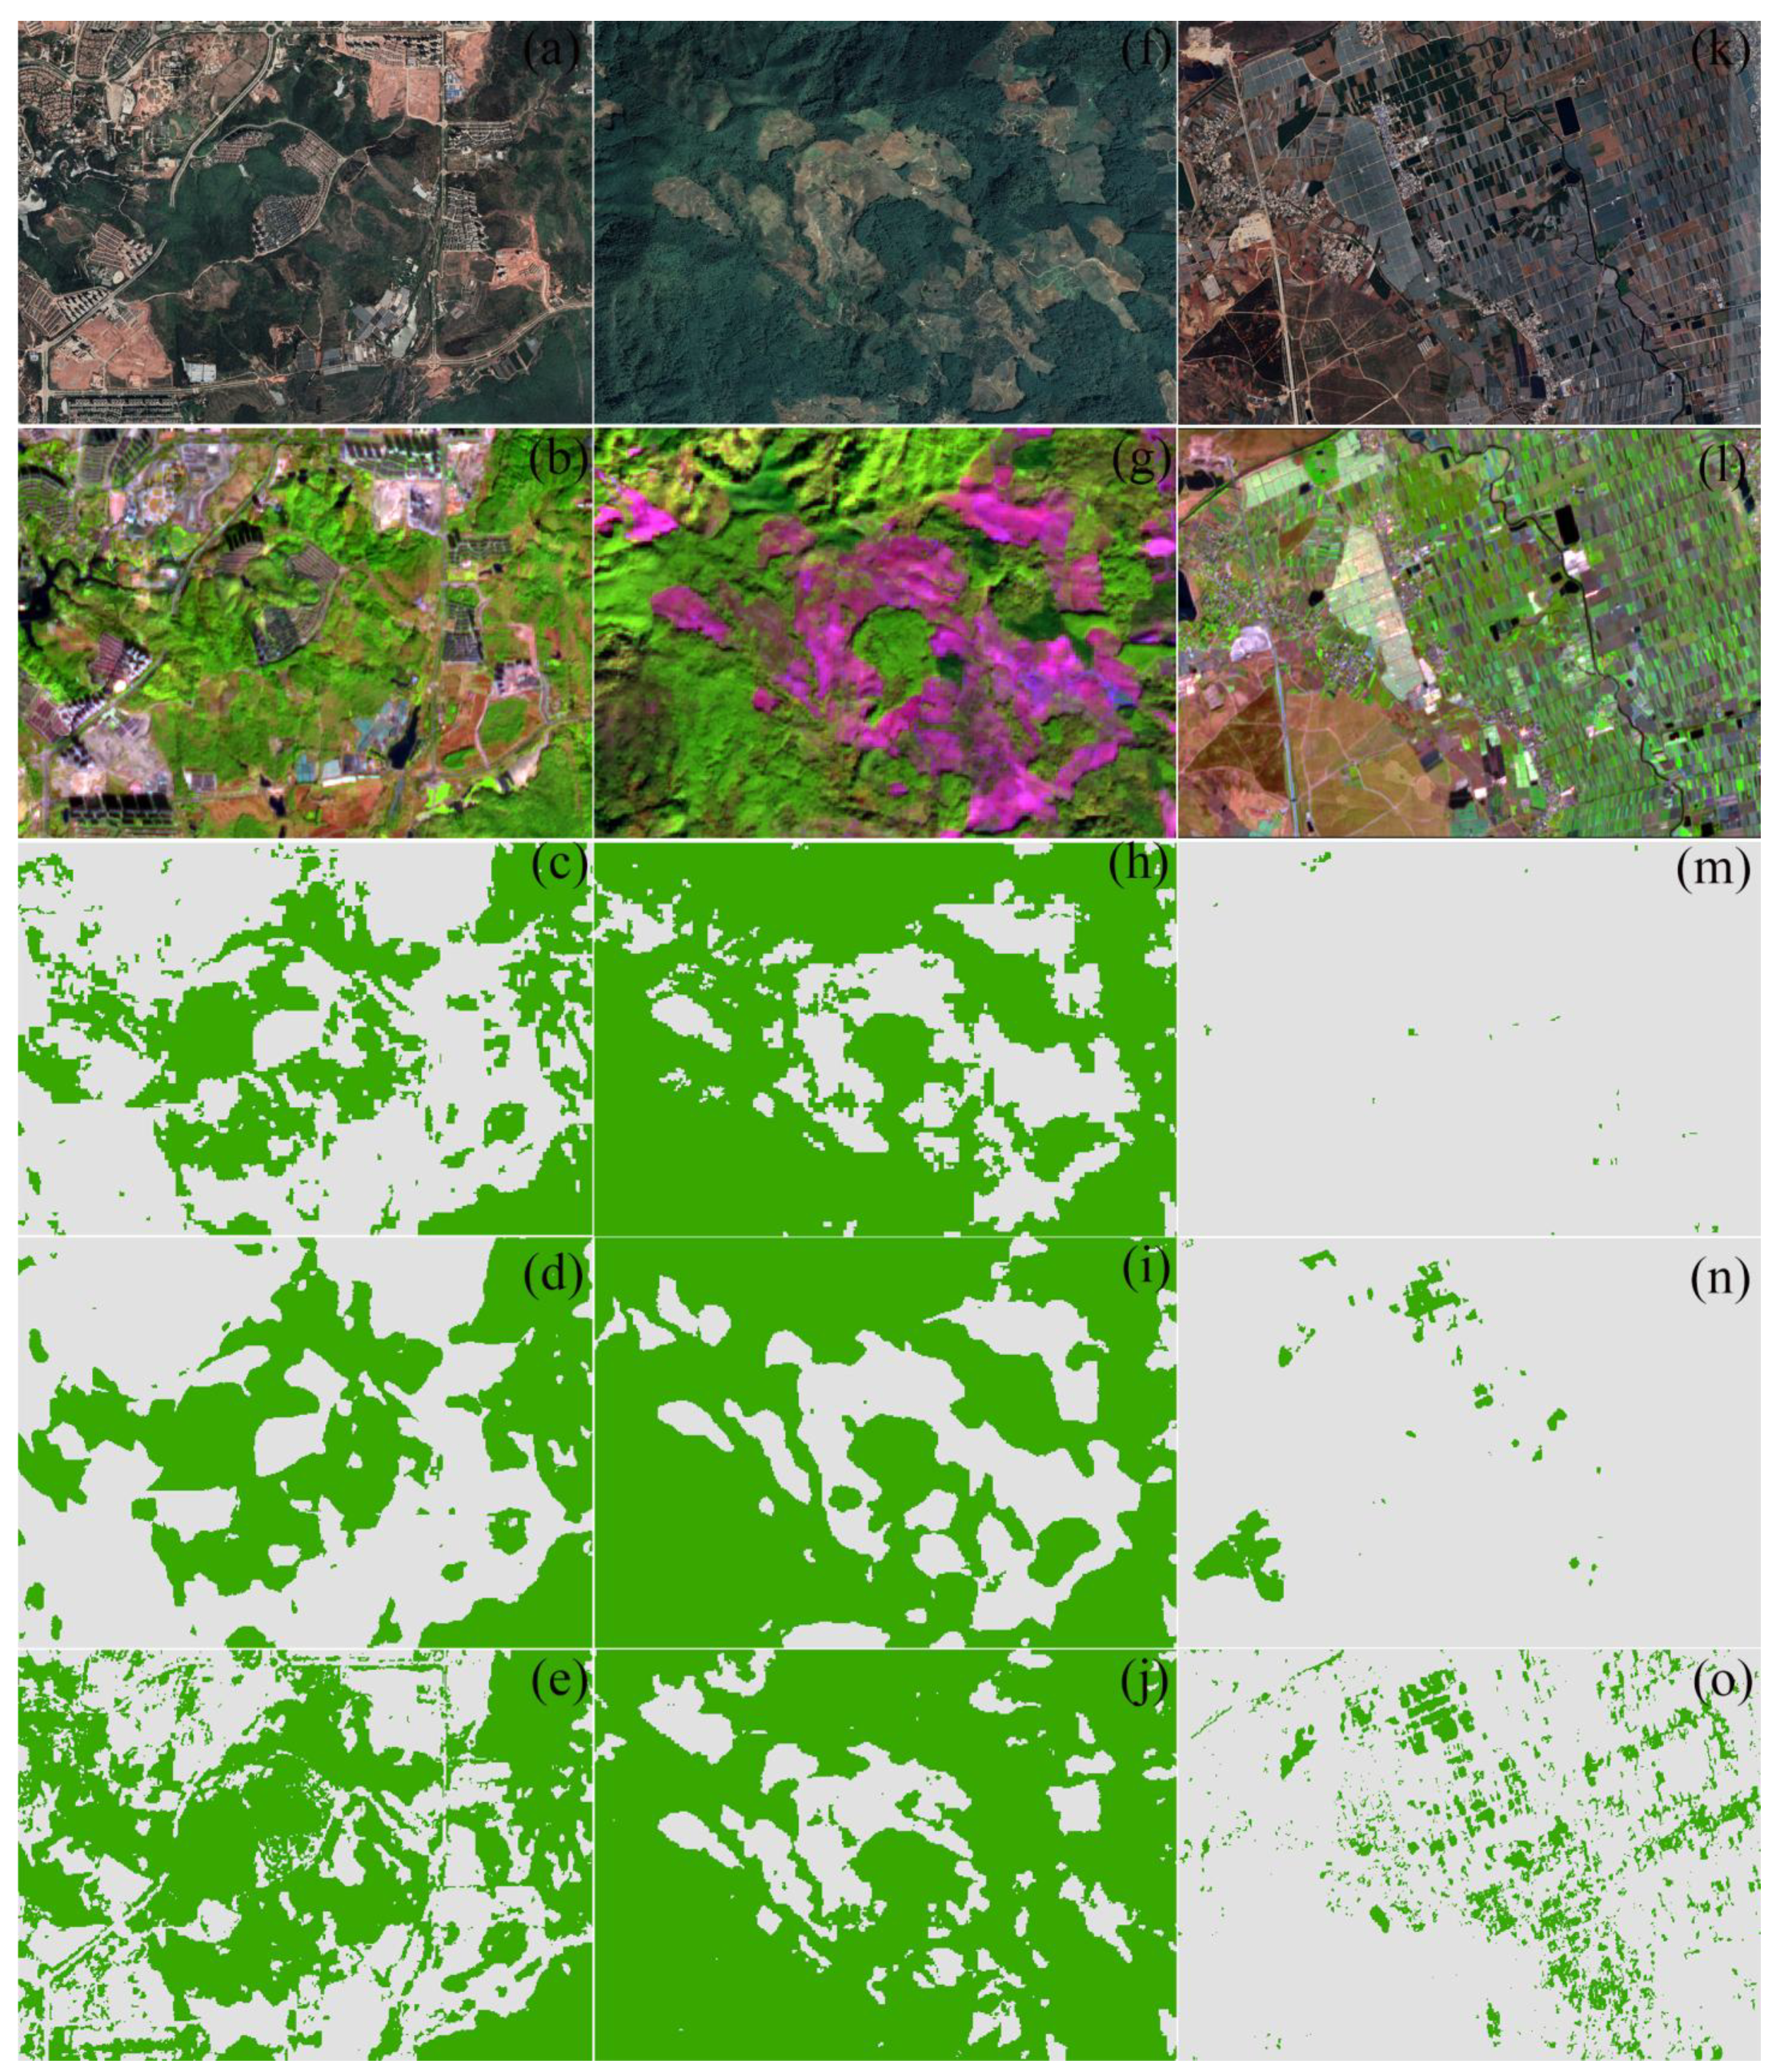
3.2. Spatial and Areal Comparison of Different Forest Products

At the provincial scale, Figure 3 reveals that the three products display overall similarities in forest coverage areas, adhering to the general trend of “more in the southwest, less in the northeast.” While spatial consistency is high, there are significant differences in the identification of different land cover types. This study performed pixel-level area statistics for the different products, revealing that WorldCover reports a significantly higher forest area in the southwestern region compared to the other two products, while LS2-RF indicates noticeably smaller forest areas in the central region and northern regions. The estimated forest coverage rate by Dynamic World is approximately 62.90% (24.79 million hectares). In contrast, WorldCover estimates the forest coverage rate at approximately 64.97% (25.61 million hectares). Meanwhile, LS2-RF’s estimate of the forest coverage rate stands at approximately 60.40% (23.80 million hectares). While the total forest area of the three products is similar, there are significant differences in forest distribution across different regions.
A comparison of the three products at the city/prefecture scale is shown in Figure 3c,d. Further analysis shown in Figure 4c indicates that, compared with WorldCover, the prefectures of Diqing (200,053 hectares), Chuxiong (257,086 hectares), Qujing (196,231 hectares), Honghe (185,283 hectares), and Kunming (160,689 hectares) register the largest variances, respectively. Further analysis (Figure 4d) indicates that LS2-RF demonstrates inconsistencies when compared to Dynamic World and WorldCover. Notably, the cities of Diqing (342,377 hectares), Honghe (264,689 hectares), Wenshan (213,802 hectares), and Qujing (203,114 hectares) demonstrate the largest discrepancies relative to Dynamic World. In terms of terrain, forests were most abundant at elevations between 1500 and 2500 m (occupying 52.29% of the total forest area, covering a total of 124,453 million hectares) and slopes of 15° to 25° (occupying 39.19% of the total forest area, covering a total of 932,850 million hectares). Conversely, forest cover was lowest in areas below 500 m elevation (occupying 0.64% of the total forest area, covering a total of 151,495 hectares) and on slopes less than 5° (occupying 2.40% of the total forest area, covering a total of 571,396 hectares).
Figure 4a–o illustrates significant differences among the three products in classifying mixed land types, particularly in farmland areas, bare land, deforestation and replanting areas, certain building areas, and forest boundaries. Due to the issue of missing imagery in Landsat data for certain years in the Yunnan (for example, in Figure 4f, the latest image year is February 2022), issues such as deforestation and replanting cannot be directly reflected. Therefore, we compared the three products using annual median composite images from Sentinel-1 (Figure 4b,g,l). Although these three products show higher spatial consistency in extensive forest areas, LS2-RF stands out in depicting details of non-forest areas and fragmented regions. Due to its superior overall performance, LS2-RF has become a robust dataset for forest research and can effectively serve as the foundational data for such studies.
Topographic variations play a pivotal role in influencing forest distribution within mountain ecosystems. The integration of topographic factors into classification protocols and data analysis is crucial for a comprehensive understanding of forest distribution patterns. As illustrated in Figure 5, all three forest cover products demonstrate a consistent trend of initial increase, followed by a decrease in forest cover as both elevation and slope increase. This pattern underscores the impact of elevation and slope on forest dynamics, which may reflect variations in climatic conditions, soil types, and other ecological factors inherent to different elevational and sloping environments.
From the perspective of elevation distribution (Figure 5a), the forest distribution of LS2-RF shows significant differences from Dynamic World (433,197 hectares) and WorldCover (430,265 hectares) in the altitude range of 1500–2500 m, with the smallest difference occurring in the altitude interval of 0–500 m (635.48 hectares and 33,192 hectares). Regarding the slope distribution (Figure 5b), the main differences between LS2-RF and the Dynamic World forest distribution are observed above 35° (210,104 hectares), with the smallest difference in the range of 0–5° (2697.22 hectares). The differences with WorldCover are primarily concentrated between 5° and 15° (263,572 hectares), while the smallest differences are observed between 25° and 35° (163,573 hectares and 201,311 hectares).

3.3. Forest Spatial Distribution Characteristics

The forest coverage rate in Yunnan Province presented a spatial distribution pattern of higher in the southwest and lower in the northeast in 2022 (Figure 3), with forest coverage percentages ranging from 86.10% in Xishuangbanna (1,644,177 hectares) to 43.95% in Kunming (923,518 hectares). At the city level, among the various cities and counties in Yunnan Province, Pu’er has the largest forest area (3,583,940 hectares), while Yuxi has the smallest forest area (848,098 hectares), primarily due to the significant influence of municipal administrative area size. In addition, we also mapped the distribution of forests in Yunnan Province at latitude and longitude (Figure 6). The forest area in Yunnan Province demonstrates a distinctive trend of increasing from north to south as latitude decreases (Figure 6b). This trend reaches a peak between latitude 24° N and 23° N before rapidly declining. Regarding longitude distribution (Figure 6c), Yunnan Province exhibits a distinct characteristic of having more forest coverage in the west and less in the east. The peak forest area is consistently maintained between longitudes 99° E and 102° E, highlighting a pronounced longitudinal variation in forest distribution across the region.

4. Discussion

4.1. Feature Importance and Correlation Analysis

The importance of features used in this study is shown in Figure 7. As can be seen, the importance of DEM (around 2666) data in forest mapping is far ahead of the rest. The main reason may be that Yunnan has a significant elevation difference, with farmlands and buildings typically distributed in low-altitude, flat areas. The types and distribution densities of vegetation are significantly influenced by topographical factors. Previous studies have also demonstrated the importance of topographic factors for forest identification [60,61]. Therefore, DEM plays an extremely important role in forest identification. Ranking second and third in importance are kNDVI (around 1988) and the average NDVI during the growing season (around 1983), respectively. kNDVI can effectively alleviate the saturation phenomenon of NDVI in areas with high vegetation coverage, and it has higher accuracy in classification tasks. The average NDVI during the growing season helps to differentiate between dense woody vegetation (with higher NDVI) and other vegetation categories with significant variations in greenness [62]. Meanwhile, in the southern part of Yunnan, where a large area is planted with rubber trees, the average LSWI during the leaf-fall period plays a significant role in the identification of this region. Other features are primarily used to identify land use changes such as planting and harvesting. Although some features have relatively low scores, such as LSWILT15FREQ_15DAY_GRN (around 1185) and NDVI_GRNLT06_FREQ (around 1410), they still help in improving the classification accuracy. Overall, all features significantly contribute to the model’s predictions, and removing any one feature results in a reduction in overall accuracy.
The correlation between features is shown in Figure 8. It can be seen from the figure that there is a certain level of correlation among most features, but the strength of correlation varies. The two features with the strongest positive correlation are swir1 and swir1 (correlation coefficient: 0.94), while the highest negative correlation is between NDVIAVG_GRN and NDVI_GRNLT06_FREQ (correlation coefficient: −0.83). There are some features with weak or no correlation, but weak or no correlation does not necessarily mean that these features will reduce the accuracy of forest identification.
The histograms on the diagonal clearly display the value range and frequency distribution of single variables. The peak areas of the histograms represent the density of data within that interval, while the skewness of the data clearly shows the central tendency of the data. For instance, the correlation between DEM and other variables is mostly weak or even non-existent, which may be because DEM provides independent information that is not directly related to spectral features and vegetation indices. However, this does not mean that DEM is unimportant in forest identification. On the contrary, the calculation results of feature importance indicate that DEM holds key information for forest identification and should be retained in modeling. Therefore, feature importance and correlation should be analyzed in conjunction.
Nevertheless, since the features used in this study are limited to spectral features, derived indices, and terrain features, and the number of features is relatively small, all features have been applied in the modeling process. Future research could incorporate texture features and polarization features. In the case of feature redundancy, the combination of strongly correlated features could be used to extract primary information, while independent features should be retained to enhance the predictive power of the model. Additionally, features with the highest correlation to the target variable, according to specific research objectives, should be selected to optimize the model.

4.2. Comparative Spatial Analysis of Forest Cover Datasets

The areas with the largest differences in forest mapping between LS2-RF and other products are mainly in central Yunnan and eastern Yunnan regions (Figure 3). These areas are characterized by a suitable climate and frequent human activities, which pose significant challenges for forest identification due to extensive crop cultivation [63]. Visual observations in GEE reveal that both Dynamic World and WorldCover often yield unsatisfactory classification results for large-scale farmland, frequently misclassifying it as forest. Furthermore, the three products show significant differences in the northwestern region of Yunnan, but the discrepancies between LS2-RF, Dynamic World, and WorldCover are not consistent across the board. The major reason for the large difference between LS2-RF and Dynamic World is the extensive data gaps in the Diqing and Lijiang areas in Dynamic World, leading to significantly lower forest cover estimates in those regions compared to LS2-RF. On the other hand, the main reason for the difference between LS2-RF and WorldCover is that the latter has poor identification of grasslands in snow-covered areas and tends to classify sparsely treed areas as forests. However, this may be due to differences in the definition of forests, such as the definition of individual trees and the division of forests in urban areas, which may lead to different classification results [64,65].
The areas with the smallest differences between LS2-RF and the other products are Dehong and Xishuangbanna. Dehong Prefecture exhibits the smallest difference, not only because it is the smallest prefecture within Yunnan Province, but also due to the effective implementation of ecological restoration projects such as natural forest protection, ecological conservation redlines, and reforestation of abandoned farmland. These efforts have facilitated vegetation expansion [66], resulting in more robust forest integrity and relatively easier classification, reducing misclassification rates. In Xishuangbanna, a significant area is covered by rubber plantations, which exhibit high species uniformity, and landscape fragmentation is not severe [67]. The binary classification of forest and non-forest areas was less prone to misclassification when considering rubber plantations, primarily because these areas typically exhibit regular planting textures, which reduces the occurrence of boundary misclassification.
From the elevation perspective (Figure 5a), notable differences in forest distribution between LS2-RF, Dynamic World, and WorldCover are primarily concentrated within the 1000–2500 m range. This phenomenon can be attributed to Yunnan’s diverse topography, which ranges in elevation from 76.4 to 6740 m [68]. The 1000–2500 m range, being the most densely populated area, experiences significant human activity impacting land cover changes. The size of built-up areas and farmland correlates directly with population density. Moreover, rice cultivation, which has reflectance characteristics in the visible light range similar to forests, is challenging above 2000 m, and most rice cultivation in Yunnan occurs below this altitude. Thus, these land cover types are prone to misclassification as forests, especially in mixed land cover areas. The significant differences between LS2-RF and Dynamic World in areas above 2500 m are primarily attributed to the latter’s data loss issues in high-altitude regions.
From the perspective of slope (Figure 5b), the differences between LS2-RF and Dynamic World are mainly concentrated in steep slope areas above 25° (due to missing data), while the differences with WorldCover are mainly concentrated in gentle slopes and flat areas below 15°. Yunnan’s varied topography means that areas with slopes below 5° are generally flat and more conducive to reclaimed farmland and development into towns [69]. The poor performance of WorldCover in identifying high-biomass farmland areas and towns (Figure 4e,o) precisely proves the reason for the significant differences between the two in low-slope areas, indicating that LS2-RF has a superior identification effect on high-biomass farmland areas and towns compared to WorldCover. Agriculture, especially in the form of terraced fields, is predominantly practiced on slopes ranging from 5–25° [63]. Areas with slopes above 25° are restricted from high-standard agricultural development due to their steepness, susceptibility to soil erosion from rainfall, and consequent loss of soil fertility, making them unsuitable for agriculture. Slopes above 35°, being extremely steep and precipitous, are less accessible and are typically covered by extensive vegetation, resulting in smaller differences between the products.

4.3. Patterns of Forest Distribution in Yunnan Province

In 2022, spatial distribution of forest cover in Yunnan Province displayed a distinct pattern characterized by higher coverage in the southwest and lower in the northeast, and the Xishuangbanna region had the highest forest coverage rate, while Kunming had the lowest. The climatic and geographical conditions in Xishuangbanna are particularly conducive to the growth of rubber trees, which have become a dominant land cover and economic staple due to the increased economic value of rubber over recent decades. This region has expanded its rubber cultivation areas substantially, establishing Xishuangbanna as one of the major rubber-producing areas in China [70,71]. However, the large-scale planting of rubber forests is beneficial for economic growth, but it also increases the ecological risk. The expansion of rubber cultivation involves extensive land development and deforestation [15], which severely damages the original forest ecosystem, leading to a high degree of species homogenization and posing serious threats to biodiversity. The ecological issues associated with large-scale rubber planting include soil erosion, overuse of water resources, and the excessive use of pesticides and fertilizers. Furthermore, rubber forests are often managed by large agricultural enterprises, which can lead to land ownership disputes and social conflicts, as evidenced by the Menglian incident in 2008 [72]. Implementing sustainable management practices, improving agricultural techniques, and adopting new technologies are essential for mitigating these environmental impacts and safeguarding both ecological and social interests. Kunming, located on the central Yunnan Plateau, enjoys a temperate climate that is ideal for the cultivation of rice, vegetables, and flowers. As the capital and economic hub of Yunnan, its dense population and urban development contribute to the lowest forest coverage rate in the province [73,74].
From the perspective of latitude and longitude, the spatial pattern of forest distribution in Yunnan is significantly influenced by geographical latitude. Yunnan’s location in a low-latitude, high-altitude zone and the presence of the Tropic of Cancer exacerbate temperature variations across the province. This results in a wide range of forest types, from tropical broadleaf to high mountain coniferous forests, as elevation changes from north to south. The province’s abundant sunlight contributes to its status as China’s “kingdom of plants,” boasting extensive biodiversity [75]. The distribution along longitude highlights the significant longitudinal variation in forest distribution. This spatial pattern underscores the influence of topographical and climatic factors that vary significantly across the province. The main reason for this result is that the western region, which includes the Hengduan Mountains and the Himalayas, features abundant water resources, fertile soil, and less human disturbance, supporting dense forest growth. In contrast, the eastern region, with higher economic activity and population density, experiences more land use for agriculture, urbanization, and industrial development, resulting in substantially lower forest coverage [76].
Forest remote sensing mapping provides powerful data support for accurate identification and monitoring of forest ecosystems. Monitoring of forest cover can help develop targeted conservation strategies to reduce the risk of species extinction, especially in areas rich in biodiversity. The results of this study show that, although there is still a large area of forest in the middle- and low-altitude areas, obviously, human activities have seriously affected the forest integrity and diversity, which will significantly reduce or even remove the habitats of organisms originally living in the middle- and low-altitude areas, resulting in the forced migration of races from middle and high altitudes, which is not conducive to the development of biodiversity. In addition, deforestation and land use change can lead to the release of carbon from the soil, increasing greenhouse gas emissions and exacerbating global climate change. Of course, many countries now realize the importance of forests, and the policies beneficial to forest protection are becoming more and more perfect. The application of remote sensing technology to large-area forest monitoring is becoming more and more extensive, and the requirements for the accuracy and efficiency of data acquisition are also getting higher and higher. Subsequent studies should explore more refined long-term and large-space forest datasets. Recent studies have mature techniques for identifying large-area forests, and mapping differences mainly exist in mixed land types, so more advanced algorithms and higher-resolution data sources are the key to solving the problem.

5. Conclusions

This study combines Sentinel-2 and Landsat satellites to define the GRN and the SDF, two different time windows, which improves the accuracy of forest classification in different seasons and reduces uncertainties related to crops. Areas of deforestation and reforestation were also identified using the median annual composite image of Sentinel 2. As the distribution of forests is significantly influenced by terrain, the study also incorporated DEM data to further enhance the classification accuracy. In addition, the latest feature (kNDVI) was added to reduce the saturation effect of high biomass vegetation cover area. Ultimately, based on the RF algorithm, forests in Yunnan Province are identified, resulting in the creation of a forest distribution map with a 10 m resolution. The LS2-RF effectively delineates forest/non-forest areas and handles mixed land covers such as farmland and urban regions, especially excelling in areas of deforestation and reforestation. Despite its strengths, the model faced challenges due to Yunnan’s diverse climatic and topographic conditions, which host a variety of crop and vegetation types with similar spectral signatures, complicating the classification process. Spatial and areal comparisons across different administrative and topographic scales highlighted significant discrepancies in forest coverage estimates among the products, particularly in areas with complex terrain and high human activity. This study provides data support for the accurate positioning and management of forest resources, improvement of management efficiency, and promotion of the coordinated development of regional economy and ecology.

Author Contributions

Conceptualization, G.W.; Methodology, G.W.; Investigation, H.L., X.Y. and Z.W.; Resources, B.C.; Data curation, W.K.; Writing—original draft, G.L.; Writing—review & editing, Z.C. All authors have read and agreed to the published version of the manuscript.

Funding

This research was funded by Natural Science Foundation of Hainan Province (422CXTD527), National Natural Science Foundation of China (32260391), Central Public-interest Scientific Institution Basal Research Fund (1630022023007), and Earmarked Fund for China Agriculture Research System (CARS-33).

Data Availability Statement

The data that support the findings of this study are available from the corresponding author upon reasonable request. The comparison of the spatial distribution of Yunnan Province’s forests in 2022 can be viewed in detail on the GEE platform: https://ee-963606094.projects.earthengine.app/view/forest-distribution-in-yunnan-2022 (accessed on 12 January 2025).

Conflicts of Interest

The authors declare no conflicts of interest.

References

  1. Bonan, G.B. Forests and Climate Change: Forcings, Feedbacks, and the Climate Benefits of Forests. Science 2008, 320, 1444–1449. [Google Scholar] [CrossRef]
  2. Debebe, B.; Senbeta, F.; Teferi, E.; Diriba, D.; Teketay, D. Analysis of Forest Cover Change and Its Drivers in Biodiversity Hotspot Areas of the Semien Mountains National Park, Northwest Ethiopia. Sustainability 2023, 15, 3001. [Google Scholar] [CrossRef]
  3. Moradi, E.; Sharifi, A. Assessment of forest cover changes using multi-temporal Landsat observation. Environ. Dev. Sustain. 2023, 25, 1351–1360. [Google Scholar] [CrossRef]
  4. Zeng, Z.; Estes, L.; Ziegler, A.D.; Chen, A.; Searchinger, T.; Hua, F.; Guan, K.; Jintrawet, A.; Wood, E.F. Highland cropland expansion and forest loss in Southeast Asia in the twenty-first century. Nat. Geosci. 2018, 11, 556–562. [Google Scholar] [CrossRef]
  5. Zhao, Z.; Li, W.; Ciais, P.; Santoro, M.; Cartus, O.; Peng, S.; Yin, Y.; Yue, C.; Yang, H.; Yu, L.; et al. Fire enhances forest degradation within forest edge zones in Africa. Nat. Geosci. 2021, 14, 479–483. [Google Scholar] [CrossRef]
  6. Mbow, C.; Smith, P.; Skole, D.; Duguma, L.; Bustamante, M. Achieving mitigation and adaptation to climate change through sustainable agroforestry practices in Africa. Curr. Opin. Environ. Sustain. 2014, 6, 8–14. [Google Scholar] [CrossRef]
  7. Wang, R.; Ding, X.; Yi, B.; Wang, J. Spatiotemporal characteristics of vegetation cover change in the Central Yunnan urban agglomeration from 2000 to 2020 based on Landsat data and its driving factors. Geocarto Int. 2024, 39, 2316643. [Google Scholar] [CrossRef]
  8. Hościło, A.; Lewandowska, A. Mapping Forest Type and Tree Species on a Regional Scale Using Multi-Temporal Sentinel-2 Data. Remote Sens. 2019, 11, 929. [Google Scholar] [CrossRef]
  9. Loveland, T.R.; Reed, B.C.; Brown, J.F.; Ohlen, D.O.; Zhu, Z.; Yang, L.; Merchant, J.W. Development of a global land cover characteristics database and IGBP DISCover from 1 km AVHRR data. Int. J. Remote Sens. 2000, 21, 1303–1330. [Google Scholar] [CrossRef]
  10. Hansen, M.C.; Defries, R.S.; Townshend, J.R.G.; Sohlberg, R. Global land cover classification at 1 km spatial resolution using a classification tree approach. Int. J. Remote Sens. 2000, 21, 1331–1364. [Google Scholar] [CrossRef]
  11. Friedl, M.A.; McIver, D.K.; Hodges, J.C.F.; Zhang, X.Y.; Muchoney, D.; Strahler, A.H.; Woodcock, C.E.; Gopal, S.; Schneider, A.; Cooper, A.; et al. Global land cover mapping from MODIS: Algorithms and early results. Remote Sens. Environ. 2002, 83, 287–302. [Google Scholar] [CrossRef]
  12. Gong, P.; Wang, J.; Yu, L.; Zhao, Y.; Zhao, Y.; Liang, L.; Chen, J. Finer resolution observation and monitoring of global land cover: First mapping results with Landsat TM and ETM+ data. Int. J. Remote Sens. 2013, 34, 2607–2654. [Google Scholar] [CrossRef]
  13. Brown, C.F.; Brumby, S.P.; Guzder-Williams, B.; Birch, T.; Hyde, S.B.; Mazzariello, J.; Czerwinski, W.; Pasquarella, V.J.; Haertel, R.; Ilyushchenko, S.; et al. Dynamic World, Near real-time global 10 m land use land cover mapping. Sci. Data 2022, 9, 251. [Google Scholar] [CrossRef]
  14. Kim, D.; Sexton, J.O.; Noojipady, P.; Huang, C.; Anand, A.; Channan, S.; Feng, M.; Townshend, J.R. Global, Landsat-based forest-cover change from 1990 to 2000. Remote Sens. Environ. 2014, 155, 178–193. [Google Scholar] [CrossRef]
  15. Hansen, M.C.; Potapov, P.V.; Moore, R.; Hancher, M.; Turubanova, S.A.; Tyukavina, A.; Thau, D.; Stehman, S.V.; Goetz, S.J.; Loveland, T.R.; et al. High-resolution global maps of 21st-century forest cover change. Science 2013, 342, 850–853. [Google Scholar] [CrossRef] [PubMed]
  16. Lang, N.; Jetz, W.; Schindler, K.; Wegner, J.D. A high-resolution canopy height model of the Earth. Nat. Ecol. Evol. 2023, 7, 1778–1789. [Google Scholar] [CrossRef]
  17. Tolan, J.; Yang, H.; Nosarzewski, B.; Couairon, G.; Vo, H.V.; Brandt, J.; Spore, J.; Majumdar, S.; Haziza, D.; Vamaraju, J.; et al. Very high resolution canopy height maps from RGB imagery using self-supervised vision transformer and convolutional decoder trained on aerial lidar. Remote Sens. Environ. 2024, 300, 113888. [Google Scholar] [CrossRef]
  18. Wang, Y.; Sun, Y.; Cao, X.; Wang, Y.; Zhang, W.; Cheng, X. A review of regional and Global scale Land Use/Land Cover (LULC) mapping products generated from satellite remote sensing. Isprs-J. Photogramm. Remote Sens. 2023, 206, 311–334. [Google Scholar] [CrossRef]
  19. Zhang, W.; Tian, J.; Zhang, X.; Cheng, J.; Yan, Y. Which land cover product provides the most accurate land use land cover map of the Yellow River Basin? Front. Ecol. Evol. 2023, 11, 1275054. [Google Scholar] [CrossRef]
  20. Aulia, O.D.; Apriani, I.; Juanda, A.; Barri, M.F.; Dewi, R.W.; Muharam, F.N.; Oktanine, B.; Phoa, T.B.; Condro, A.A. Refining National Forest Cover Data Based on Fusion Optical Satellite Imageries in Indonesia. Int. J. For. Res. 2023, 2023, 1–11. [Google Scholar] [CrossRef]
  21. Yang, F.; Jiang, X.; Ziegler, A.D.; Estes, L.D.; Wu, J.; Chen, A.; Ciais, P.; Wu, J.; Zeng, Z. Improved Fine-Scale Tropical Forest Cover Mapping for Southeast Asia Using Planet-NICFI and Sentinel-1 Imagery. J. Remote Sens. 2023, 3, 0064. [Google Scholar] [CrossRef]
  22. Yu, X.; Lu, D.; Jiang, X.; Li, G.; Chen, Y.; Li, D.; Chen, E. Examining the Roles of Spectral, Spatial, and Topographic Features in Improving Land-Cover and Forest Classifications in a Subtropical Region. Remote Sens. 2020, 12, 2907. [Google Scholar] [CrossRef]
  23. Li, R.; Xia, H.; Zhao, X.; Guo, Y. Mapping evergreen forests using new phenology index, time series Sentinel-1/2 and Google Earth Engine. Ecol. Indic. 2023, 149, 110157. [Google Scholar] [CrossRef]
  24. Cai, Y.; Xu, X.; Zhu, P.; Nie, S.; Wang, C.; Xiong, Y.; Liu, X. Unveiling spatiotemporal tree cover patterns in China: The first 30 m annual tree cover mapping from 1985 to 2023. Isprs-J. Photogramm. Remote Sens. 2024, 216, 240–258. [Google Scholar] [CrossRef]
  25. Purwanto, A.D.; Wikantika, K.; Deliar, A.; Darmawan, S. Decision Tree and Random Forest Classification Algorithms for Mangrove Forest Mapping in Sembilang National Park, Indonesia. Remote Sens. 2023, 15, 16. [Google Scholar] [CrossRef]
  26. Zagajewski, B.; Kluczek, M.; Raczko, E.; Njegovec, A.; Dabija, A.; Kycko, M. Comparison of Random Forest, Support Vector Machines, and Neural Networks for Post-Disaster Forest Species Mapping of the Krkonoše/Karkonosze Transboundary Biosphere Reserve. Remote Sens. 2021, 13, 2581. [Google Scholar] [CrossRef]
  27. Mohajane, M.; Costache, R.; Karimi, F.; Bao Pham, Q.; Essahlaoui, A.; Nguyen, H.; Laneve, G.; Oudija, F. Application of remote sensing and machine learning algorithms for forest fire mapping in a Mediterranean area. Ecol. Indic. 2021, 129, 107869. [Google Scholar] [CrossRef]
  28. Liu, X.; Liang, S.; Li, B.; Ma, H.; He, T. Mapping 30 m Fractional Forest Cover over China’s Three-North Region from Landsat-8 Data Using Ensemble Machine Learning Methods. Remote Sens. 2021, 13, 2592. [Google Scholar] [CrossRef]
  29. Wang, X.; Zhang, Y.; Zhang, K. Automatic 10 m Forest Cover Mapping in 2020 at China’s Han River Basin by Fusing ESA Sentinel-1/Sentinel-2 Land Cover and Sentinel-2 near Real-Time Forest Cover Possibility. Forests 2023, 14, 1133. [Google Scholar] [CrossRef]
  30. Nguyen, T.; Kellenberger, B.; Tuia, D. Mapping forest in the Swiss Alps treeline ecotone with explainable deep learning. Remote Sens. Environ. 2022, 281, 113217. [Google Scholar] [CrossRef]
  31. Zhu, R.; Shen, W.; Zhang, Y.; Li, M. Assessing changes in forest coverage and forest fragmentation patterns in Yunnan Province from time series MODIS-VCF products (2000–2016). J. Nanjing For. Univ. 2019, 62, 184. [Google Scholar]
  32. Li, J.; Wang, L.; Fang, P.; Xu, W.; Dai, Q. Forest Type Mapping at a Regional Scale Based Using Multitemporal Sentinel-2 Imagery. In Proceedings of the 2021 IEEE International Geoscience and Remote Sensing Symposium IGARSS, Brussels, Belgium, 11–16 July 2021; pp. 4228–4231. [Google Scholar]
  33. Li, R.; Fang, P.; Xu, W.; Wang, L.; Ou, G.; Zhang, W.; Huang, X. Classifying Forest Types over a Mountainous Area in Southwest China with Landsat Data Composites and Multiple Environmental Factors. Forests 2022, 13, 135. [Google Scholar] [CrossRef]
  34. Huang, T.; Ou, G.; Wu, Y.; Zhang, X.; Liu, Z.; Xu, H.; Xu, X.; Wang, Z.; Xu, C. Estimating the Aboveground Biomass of Various Forest Types with High Heterogeneity at the Provincial Scale Based on Multi-Source Data. Remote Sens. 2023, 15, 3550. [Google Scholar] [CrossRef]
  35. Zhang, Y.; Ling, F.; Foody, G.M.; Ge, Y.; Boyd, D.S.; Li, X.; Du, Y.; Atkinson, P.M. Mapping annual forest cover by fusing PALSAR/PALSAR-2 and MODIS NDVI during 2007–2016. Remote Sens. Environ. 2019, 224, 74–91. [Google Scholar] [CrossRef]
  36. Song, X.; Cao, M.; Li, J.; Kitching, R.L.; Nakamura, A.; Laidlaw, M.J.; Tang, Y.; Sun, Z.; Zhang, W.; Yang, J. Different environmental factors drive tree species diversity along elevation gradients in three climatic zones in Yunnan, southern China. Plant Divers. 2021, 43, 433–443. [Google Scholar] [CrossRef]
  37. Zhu, Z.; Deng, X.; Zhao, F.; Li, S.; Wang, L. How Environmental Factors Affect Forest Fire Occurrence in Yunnan Forest Region. Forests 2022, 13, 1392. [Google Scholar] [CrossRef]
  38. Shi, Y.; Feng, C.; Yang, S. Predictive Modeling of Forest Fires in Yunnan Province: An Integration of ARIMA and Stepwise Regression Analysis. Appl. Sci. 2024, 14, 256. [Google Scholar] [CrossRef]
  39. Zanaga, D.; Van De Kerchove, R.; Daems, D.; De Keersmaecker, W.; Brockmann, C.; Kirches, G.; Wevers, J.; Cartus, O.; Santoro, M.; Fritz, S.; et al. ESA WorldCover 10 m 2021 v200. 2022. Available online: https://pure.iiasa.ac.at/id/eprint/18478/ (accessed on 22 October 2023).
  40. Lü, F.; Song, Y.; Yan, X. Evaluating Carbon Sink Potential of Forest Ecosystems under Different Climate Change Scenarios in Yunnan, Southwest China. Remote Sens. 2023, 15, 1442. [Google Scholar] [CrossRef]
  41. Pasquarella, V.J.; Brown, C.F.; Czerwinski, W.; Rucklidge, W.J. Comprehensive quality assessment of optical satellite imagery using weakly supervised video learning. In Proceedings of the IEEE/CVF Conference on Computer Vision and Pattern Recognition (CVPR) Workshops, Vancouver, BC, Canada, 17–24 June 2023; pp. 2125–2135. [Google Scholar]
  42. Rouse, J.W.; Haas, R.H.; Schell, J.A.E.A. Monitoring vegetation systems in the Great Plains with ERTS. Nasa Spec. Publ. 1974, 351, 309. [Google Scholar]
  43. Camps-Valls, G.; Campos-Taberner, M.; Moreno-Martinez, A.; Walther, S.; Duveiller, G.; Cescatti, A.; Mahecha, M.D.; Munoz-Mari, J.; Garcia-Haro, F.J.; Guanter, L.; et al. A unified vegetation index for quantifying the terrestrial biosphere. Sci. Adv. 2021, 7, eabc7447. [Google Scholar] [CrossRef]
  44. Farr, T.G.; Rosen, P.A.; Caro, E.; Crippen, R.; Duren, R.; Hensley, S.; Kobrick, M.; Paller, M.; Rodriguez, E.; Roth, L.; et al. The Shuttle Radar Topography Mission. Rev. Geophys. 2007, 45. [Google Scholar] [CrossRef]
  45. Chen, B.; Xiao, X.; Ye, H.; Ma, J.; Doughty, R.; Li, X.; Zhao, B.; Wu, Z.; Sun, R.; Dong, J.; et al. Mapping Forest and Their Spatial–Temporal Changes From 2007 to 2015 in Tropical Hainan Island by Integrating ALOSALOS-2 L-Band SAR and Landsat Optical Images. IEEE J. Sel. Top. Appl. Earth Observ. Remote Sens. 2018, 11, 852–867. [Google Scholar] [CrossRef]
  46. Zhai, D.; Dong, J.; Cadisch, G.; Wang, M.; Kou, W.; Xu, J.; Xiao, X.; Abbas, S. Comparison of Pixel- and Object-Based Approaches in Phenology-Based Rubber Plantation Mapping in Fragmented Landscapes. Remote Sens. 2018, 10, 44. [Google Scholar] [CrossRef]
  47. Chen, B.; Li, X.; Xiao, X.; Zhao, B.; Dong, J.; Kou, W.; Qin, Y.; Yang, C.; Wu, Z.; Sun, R.; et al. Mapping tropical forests and deciduous rubber plantations in Hainan Island, China by integrating PALSAR 25-m and multi-temporal Landsat images. Int. J. Appl. Earth Obs. Geoinf. 2016, 50, 117–130. [Google Scholar]
  48. Meng, S.; Pang, Y.; Huang, C.; Li, Z. Improved forest cover mapping by harmonizing multiple land cover products over China. Gisci. Remote Sens. 2022, 1, 1570–1597. [Google Scholar] [CrossRef]
  49. Camargo, F.F.; Sano, E.E.; Almeida, C.M.; Mura, J.C.; Almeida, T. A Comparative Assessment of Machine-Learning Techniques for Land Use and Land Cover Classification of the Brazilian Tropical Savanna Using ALOS-2/PALSAR-2 Polarimetric Images. Remote Sens. 2019, 11, 1600. [Google Scholar] [CrossRef]
  50. Ma, L.; Li, M.; Ma, X.; Cheng, L.; Du, P.; Liu, Y. A review of supervised object-based land-cover image classification. Isprs-J. Photogramm. Remote Sens. 2017, 130, 277–293. [Google Scholar] [CrossRef]
  51. Talukdar, S.; Singha, P.; Mahato, S.; Pal, S.; Liou, Y.A.; Rahman, A. Land-Use Land-Cover Classification by Machine Learning Classifiers for Satellite Observations—A Review. Remote Sens. 2020, 12, 1135. [Google Scholar] [CrossRef]
  52. Guo, Q.; Zhang, J.; Guo, S.; Ye, Z.; Deng, H.; Hou, X.; Zhang, H. Urban Tree Classification Based on Object-Oriented Approach and Random Forest Algorithm Using Unmanned Aerial Vehicle (UAV) Multispectral Imagery. Remote Sens. 2022, 14, 3885. [Google Scholar] [CrossRef]
  53. Breiman, L. Random forests. Mach. Learn. 2001, 45, 5–32. [Google Scholar] [CrossRef]
  54. Baudoux, L.; Inglada, J.; Mallet, C. Toward a Yearly Country-Scale CORINE Land-Cover Map without Using Images: A Map Translation Approach. Remote Sens. 2021, 13, 1060. [Google Scholar] [CrossRef]
  55. Dobrinić, D.; Gašparović, M.; Medak, D. Sentinel-1 and 2 Time-Series for Vegetation Mapping Using Random Forest Classification: A Case Study of Northern Croatia. Remote Sens. 2021, 13, 2321. [Google Scholar] [CrossRef]
  56. Zhao, Y.; Zhu, W.; Wei, P.; Fang, P.; Zhang, X.; Yan, N.; Liu, W.; Zhao, H.; Wu, Q. Classification of Zambian grasslands using random forest feature importance selection during the optimal phenological period. Ecol. Indic. 2022, 135, 108529. [Google Scholar] [CrossRef]
  57. Genuer, R.; Poggi, J.; Tuleau-Malot, C. Variable selection using random forests. Pattern Recognit. Lett. 2010, 31, 2225–2236. [Google Scholar] [CrossRef]
  58. Mei, K.; Tan, M.; Yang, Z.; Shi, S. Modeling of Feature Selection Based on Random Forest Algorithm and Pearson Correlation Coefficient. J. Phys. Conf. Ser. 2022, 2219, 12046. [Google Scholar] [CrossRef]
  59. Caelen, O. A Bayesian Interpretation of the Confusion Matrix. Ann. Math. Artif. Intell. 2017, 81, 429–450. [Google Scholar] [CrossRef]
  60. Liu, Y.; Gong, W.; Hu, X.; Gong, J. Forest Type Identification with Random Forest Using Sentinel-1A, Sentinel-2A, Multi-Temporal Landsat-8 and DEM Data. Remote Sens. 2018, 10, 946. [Google Scholar] [CrossRef]
  61. Hörsch, B. Modelling the spatial distribution of montane and subalpine forests in the central Alps using digital elevation models. Ecol. Model. 2003, 168, 267–282. [Google Scholar] [CrossRef]
  62. Misra, G.; Cawkwell, F.; Wingler, A. Status of Phenological Research Using Sentinel-2 Data: A Review. Remote Sens. 2020, 12, 2760. [Google Scholar] [CrossRef]
  63. Chen, Z.; Shi, D. Spatial Structure Characteristics of Slope Farmland Quality in Plateau Mountain Area: A Case Study of Yunnan Province, China. Sustainability 2020, 12, 7230. [Google Scholar] [CrossRef]
  64. Grainger, A. The Influence of End-Users on the Temporal Consistency of an International Statistical Process: The Case of Tropical Forest Statistics. J. Off. Stat. 2007, 23, 553–592. [Google Scholar]
  65. Keenan, R.J.; Reams, G.A.; Achard, F.; de Freitas, J.V.; Grainger, A.; Lindquist, E. Dynamics of global forest area: Results from the FAO Global Forest Resources Assessment 2015. For. Ecol. Manag. 2015, 352, 9–20. [Google Scholar] [CrossRef]
  66. Li, J.; Wang, J.; Zhang, J.; Zhang, J.; Kong, H. Dynamic changes of vegetation coverage in China-Myanmar economic corridor over the past 20 years. Int. J. Appl. Earth Obs. Geoinf. 2021, 102, 102378. [Google Scholar] [CrossRef]
  67. Sarathchandra, C.; Alemu Abebe, Y.; Worthy, F.R.; Lakmali Wijerathne, I.; Ma, H.; Yingfeng, B.; Jiayu, G.; Chen, H.; Yan, Q.; Geng, Y.; et al. Impact of land use and land cover changes on carbon storage in rubber dominated tropical Xishuangbanna, South West China. Ecosyst. Health Sustain. 2021, 7, 1915183. [Google Scholar] [CrossRef]
  68. Li, W.; Xu, Q.; Yi, J.; Liu, J. Predictive model of spatial scale of forest fire driving factors: A case study of Yunnan Province, China. Sci. Rep. 2022, 12, 19029. [Google Scholar] [CrossRef]
  69. He, D.; Huang, X.; Tian, Q.; Zhang, Z. Changes in Vegetation Growth Dynamics and Relations with Climate in Inner Mongolia under More Strict Multiple Pre-Processing (2000–2018). Sustainability 2020, 12, 2534. [Google Scholar] [CrossRef]
  70. Chen, G.; Liu, Z.; Wen, Q.; Tan, R.; Wang, Y.; Zhao, J.; Feng, J. Identification of Rubber Plantations in Southwestern China Based on Multi-Source Remote Sensing Data and Phenology Windows. Remote Sens. 2023, 15, 1228. [Google Scholar] [CrossRef]
  71. Zhai, J.; Xiao, C.; Liu, X.; Liu, Y. Analysis of 10-m Sentinel-2 imagery and a re-normalization approach reveals a declining trend in the latest rubber plantations in Xishuangbanna. Adv. Space Res. 2024, 73, 5910–5924. [Google Scholar] [CrossRef]
  72. Tanner, H.M. The people’s liberation army and CHINA’s internal security challenges. In The Pla at Home and Abroad: Assessing the Operational Capabilities of China’S Military; Us Army War College Strategic Studies Institute: Carlisle Barracks, PA, USA, 2010; pp. 259–266. [Google Scholar]
  73. Zhang, B.; Luo, M.; Du, Q.; Yi, Z.; Dong, L.; Yu, Y.; Feng, J.; Lin, J. Spatial distribution and suitability evaluation of nighttime tourism in Kunming utilizing multi-source data. Heliyon 2023, 9, e16826. [Google Scholar] [CrossRef]
  74. Wang, Y.; Yue, X.; Li, C.; Wang, M.; Zhang, H.O.; Su, Y. Relationship between Urban Three-Dimensional Spatial Structure and Population Distribution: A Case Study of Kunming’s Main Urban District, China. Remote Sens. 2022, 14, 3757. [Google Scholar] [CrossRef]
  75. Zhang, Y.; Ai, J.; Sun, Q.; Li, Z.; Hou, L.; Song, L.; Tang, G.; Li, L.; Shao, G. Soil organic carbon and total nitrogen stocks as affected by vegetation types and altitude across the mountainous regions in the Yunnan Province, south-western China. Catena 2021, 196, 104872. [Google Scholar] [CrossRef]
  76. Yang, R.; He, Y.; Zhong, C.; Yang, Z.; Wang, X.; Xu, M.; Cao, L. Study on the Spatiotemporal Evolution and Influencing Factors of Forest Coverage Rate (FCR): A Case Study on Yunnan Province Based on Remote Sensing Image Interpretation. Forests 2024, 15, 238. [Google Scholar] [CrossRef]
Figure 1. Study area and location of ground references used for algorithm training and validation.
Remotesensing 17 01146 g001
Figure 2. Technology roadmap.
Remotesensing 17 01146 g002
Figure 3. Spatial and areal comparison of different forest products in Yunnan Province: (a) spatial difference between WorldCover and LS2-RF; (b) spatial difference between Dynamic World and LS2-RF; (c) comparison of forest consistent area, LS2RF, and WorldCover forest area; and (d) comparison of forest consistent area, LS2RF, and Dynamic World forest area.
Remotesensing 17 01146 g003
Figure 4. Comparison analysis of forest products in built-up area and bare area, logging and replanting areas, and cropland areas: This figure illustrates the forest products for three representative regions at coordinates 102.57511° E, 24.90659° N (built-up area and bare area), 97.78875° E, 24.61743° N (deforestation and replanting areas), and 103.34569° E, 23.52446° N (cropland area). Panels (a,f,k) show Landsat 8 satellite images, panels (b,g,l) are median composite images of Sentinel-2, panels (c,h,m) depict the LS2-RF map from this study, and panels (d,i,n) present Dynamic World, while panels (e,j,o) display images from WorldCover.
Remotesensing 17 01146 g004
Figure 5. Comparison of forest areas at different elevations and slope regions: (a) elevation differences and (b) slope differences.
Remotesensing 17 01146 g005
Figure 6. Latitudinal and longitudinal variations of forest area in Yunnan Province. (a) Forest distribution in Yunnan province; (b) Variation of forest area at latitude; (c) The change of forest area in longitude.
Remotesensing 17 01146 g006
Figure 7. Feature importance ranking.
Remotesensing 17 01146 g007
Figure 8. Feature correlation. (The upper triangle represents the pairwise correlations between features. Red indicates a positive correlation, while blue indicates a negative correlation. The intensity of the color represents the strength of the correlation. The lower triangle consists of scatter plots that visually depict the relationship between two features. The diagonal of the plot is a histogram, and a smooth curve has been added to the histogram using Kernel Density Estimation (KDE), primarily showing the distribution of each variable).
Remotesensing 17 01146 g008
Table 1. Accuracy assessment and comparison.
ProductsLS2-RFDynamic WorldWorldCover
Ground Truth SamplesGround Truth SamplesGround Truth Samples
ClassificationForestNon-ForestForestNon-ForestForestNon-Forest
Forest290067121370126221
Non-Forest77898449255225486
Producer accuracy (%)97.7492.1094.5436.2298.3668.35
Omission error (%)2.267.905.4663.781.6431.65
User accuracy (%)97.4193.0672.9878.4684.8795.86
Commission error2.596.9427.0221.5415.134.14
Overall accuracy (%)96.3573.8887.66
Kappa coefficient0.90150.35020.7128
Disclaimer/Publisher’s Note: The statements, opinions and data contained in all publications are solely those of the individual author(s) and contributor(s) and not of MDPI and/or the editor(s). MDPI and/or the editor(s) disclaim responsibility for any injury to people or property resulting from any ideas, methods, instructions or products referred to in the content.

