
Pre-Launch Day-Night Band Radiometric Performance of JPSS-3 and -4 VIIRS


Abstract
1. Introduction
1.1. On-Orbit Calibration
2. Pre-Launch Calibration Methods
3. Pre-Launch Calibration Results
3.1. Dark Current Noise
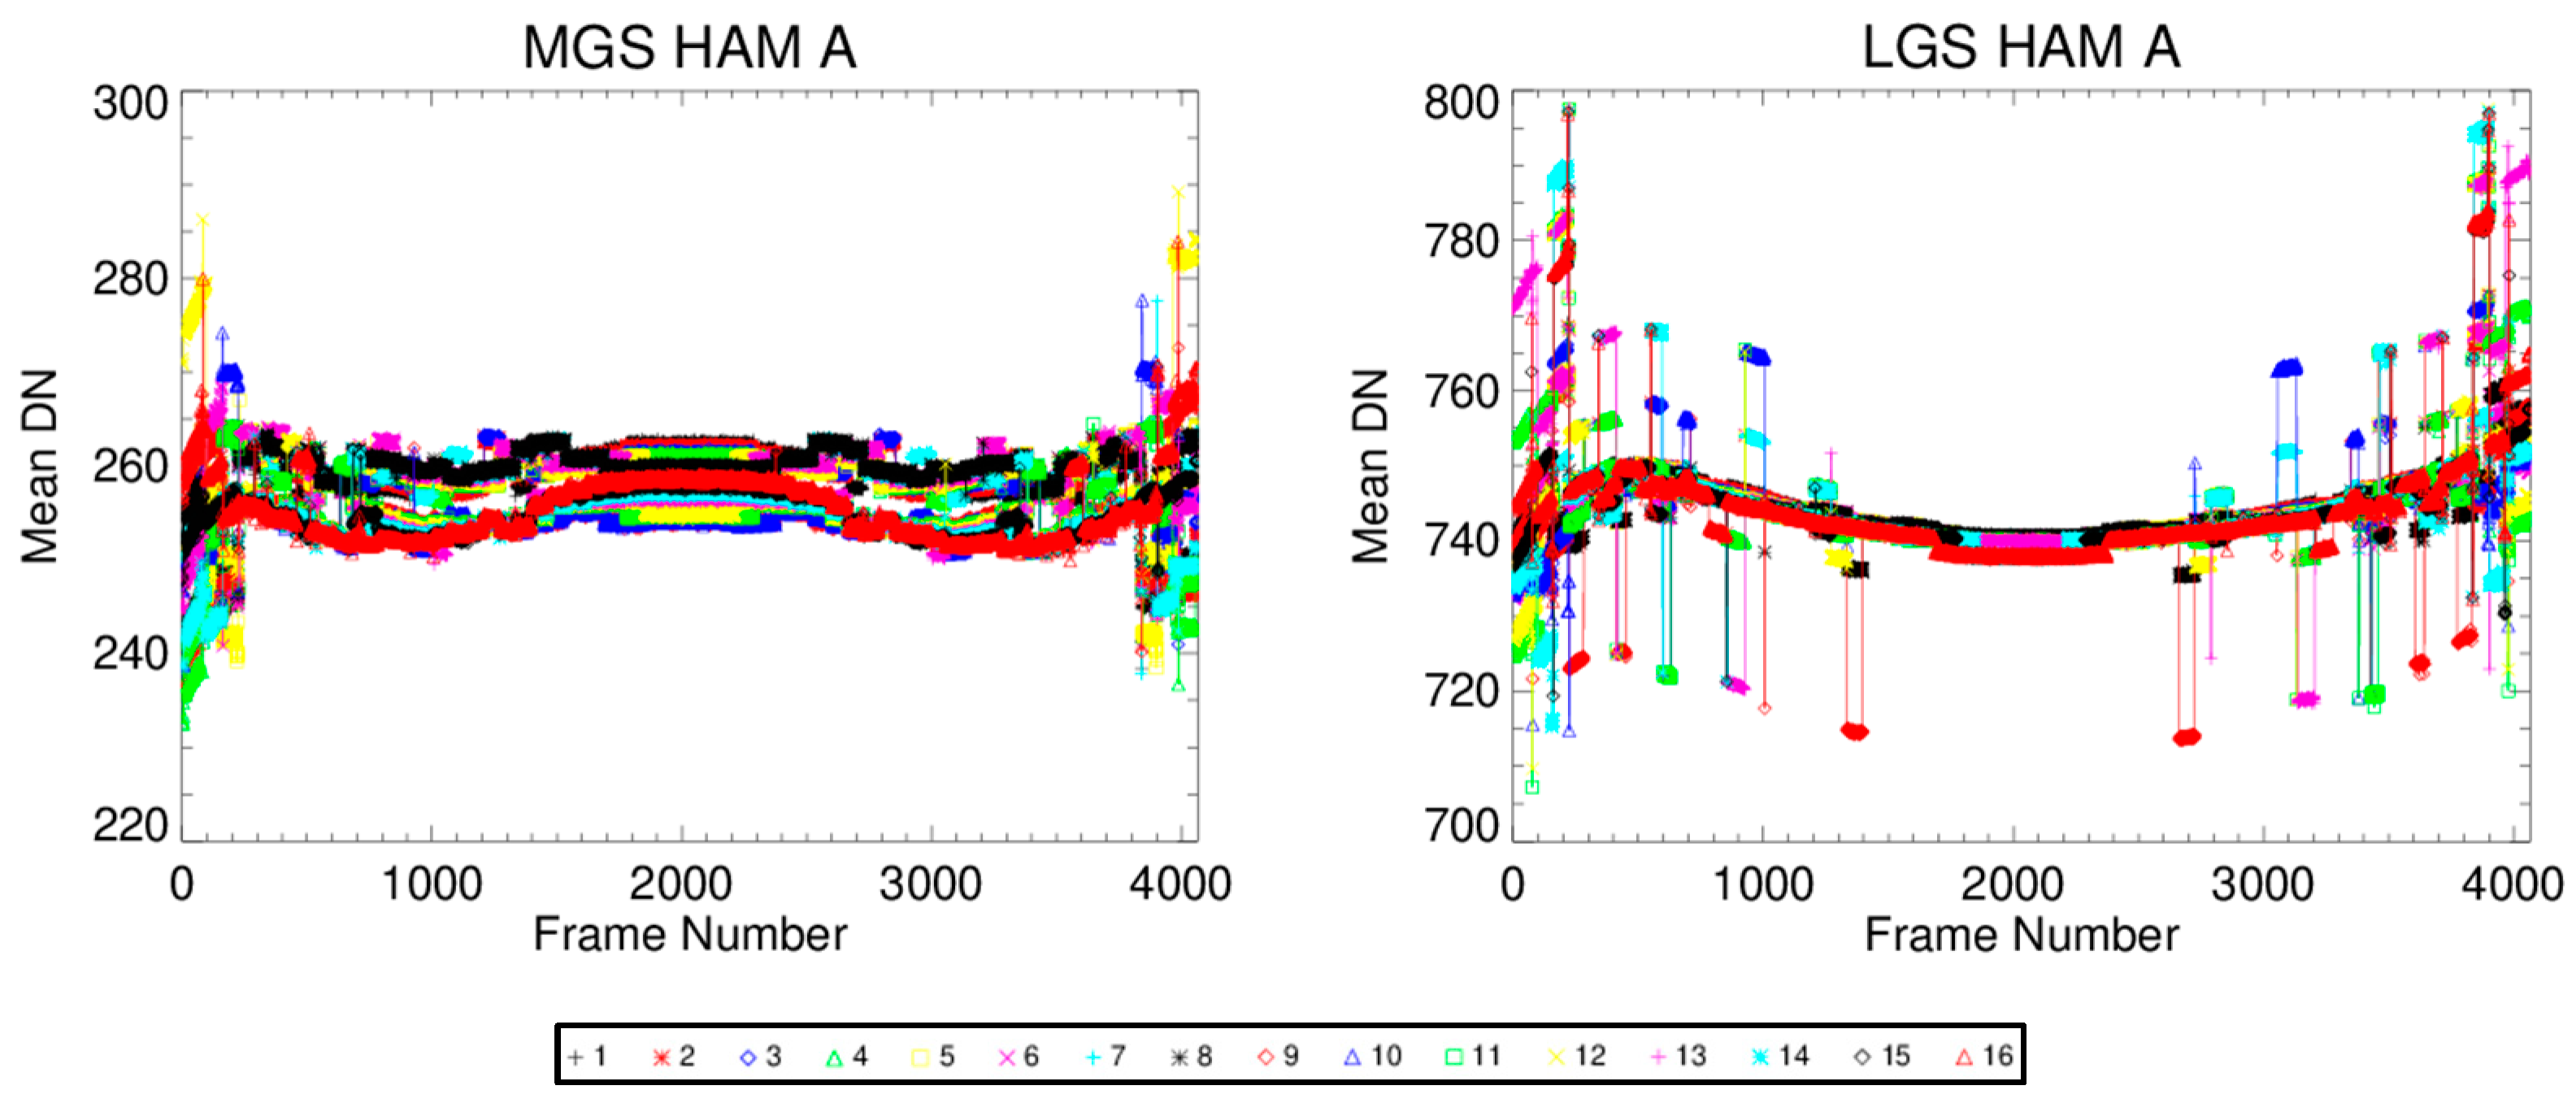
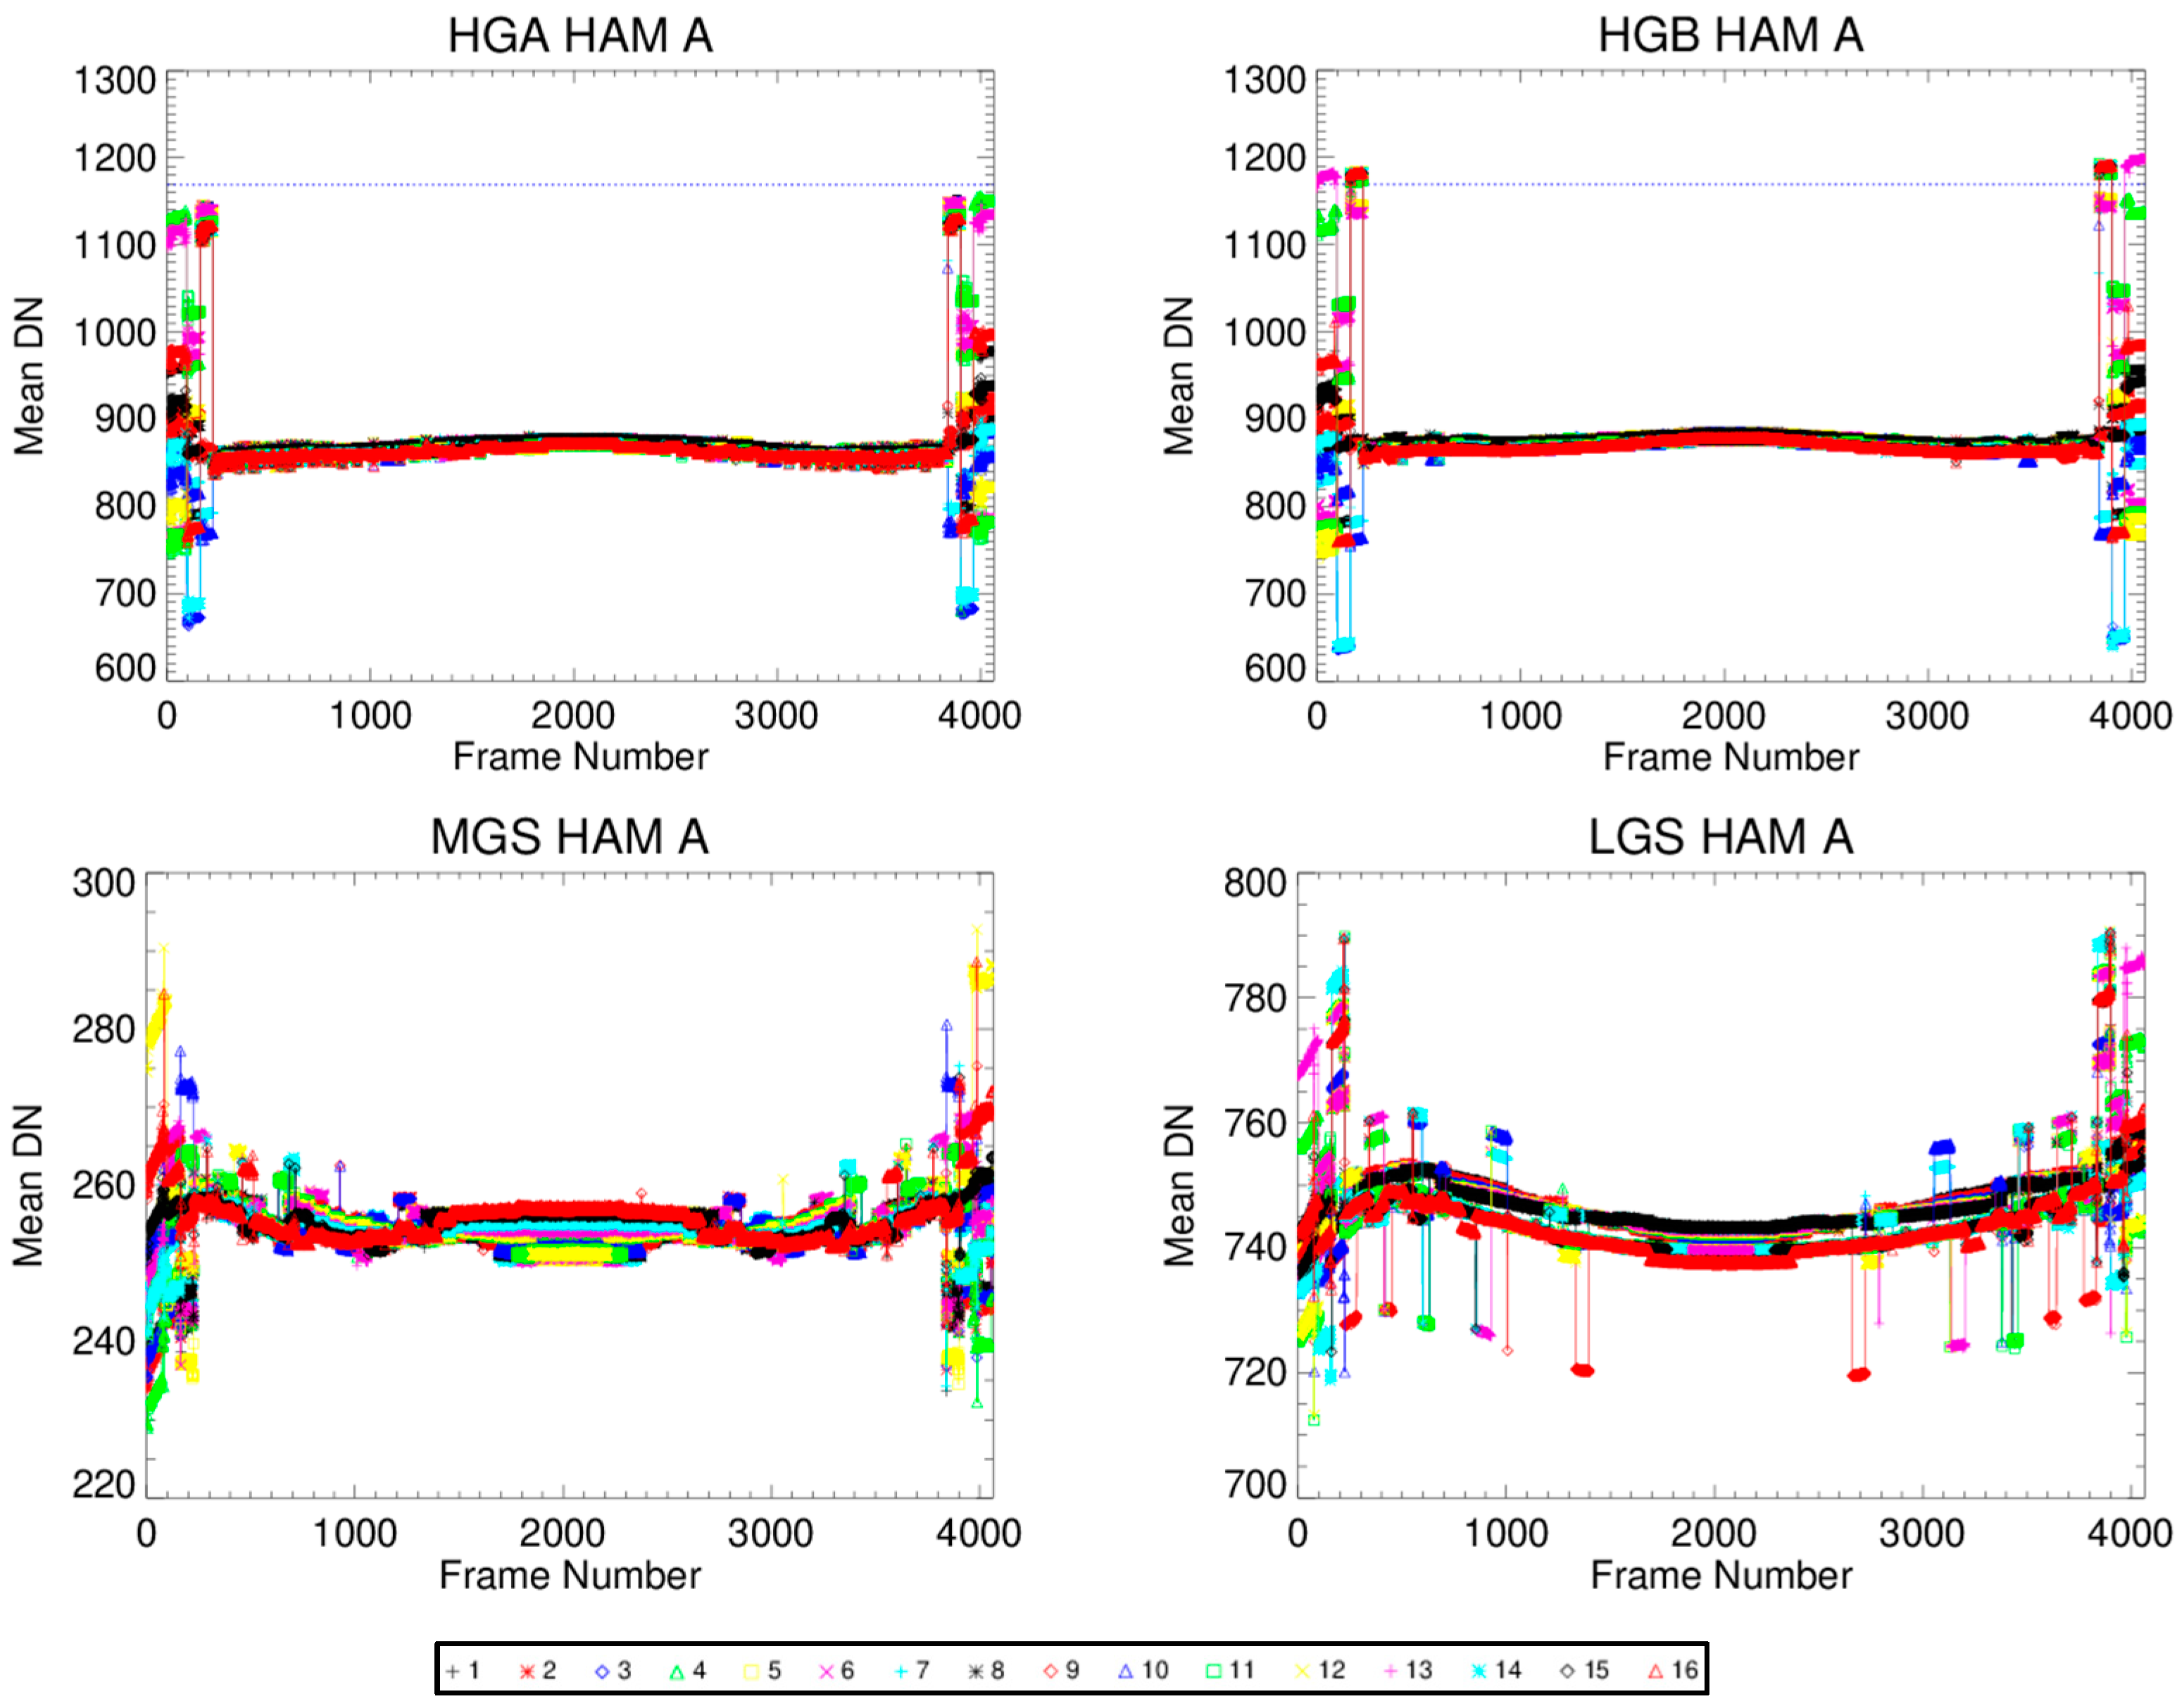
3.2. Gain Transition
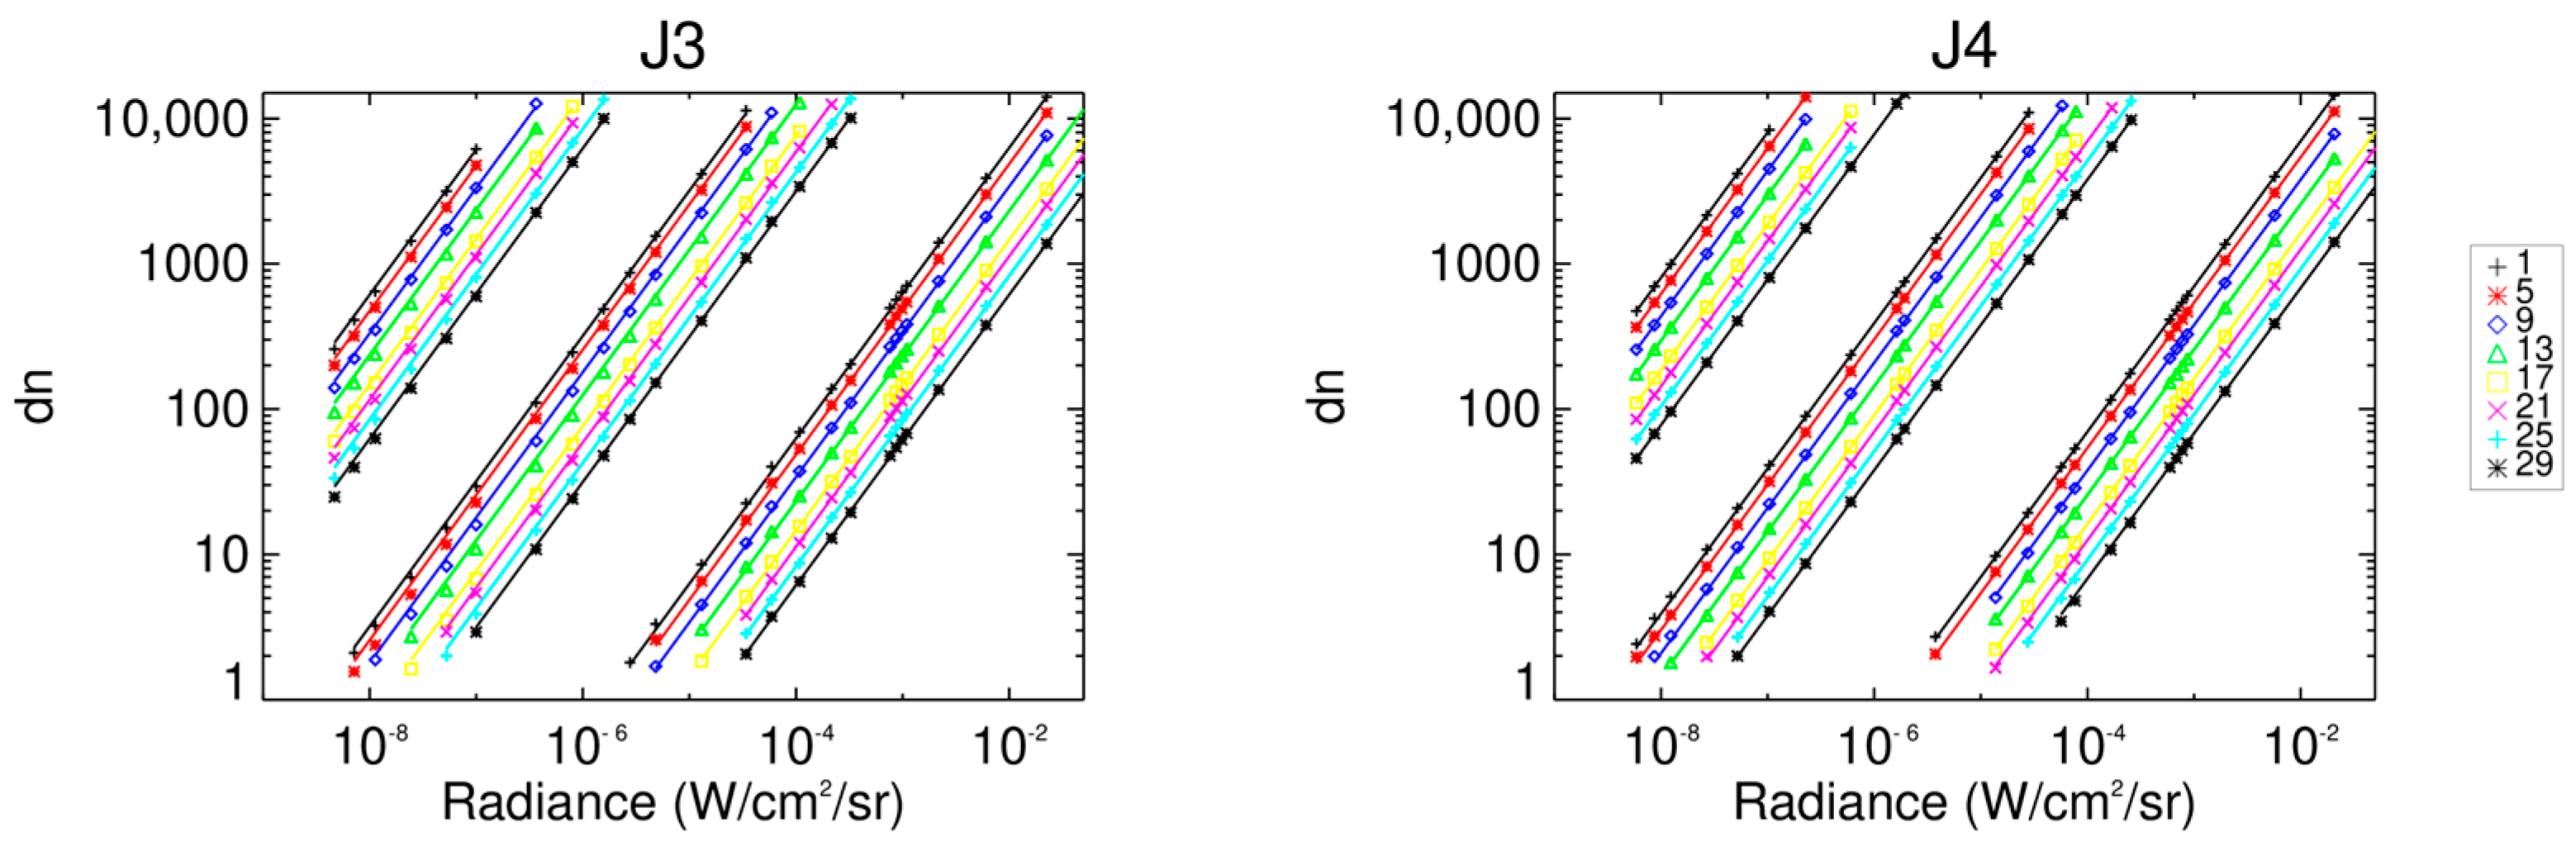
3.3. Gain Determination
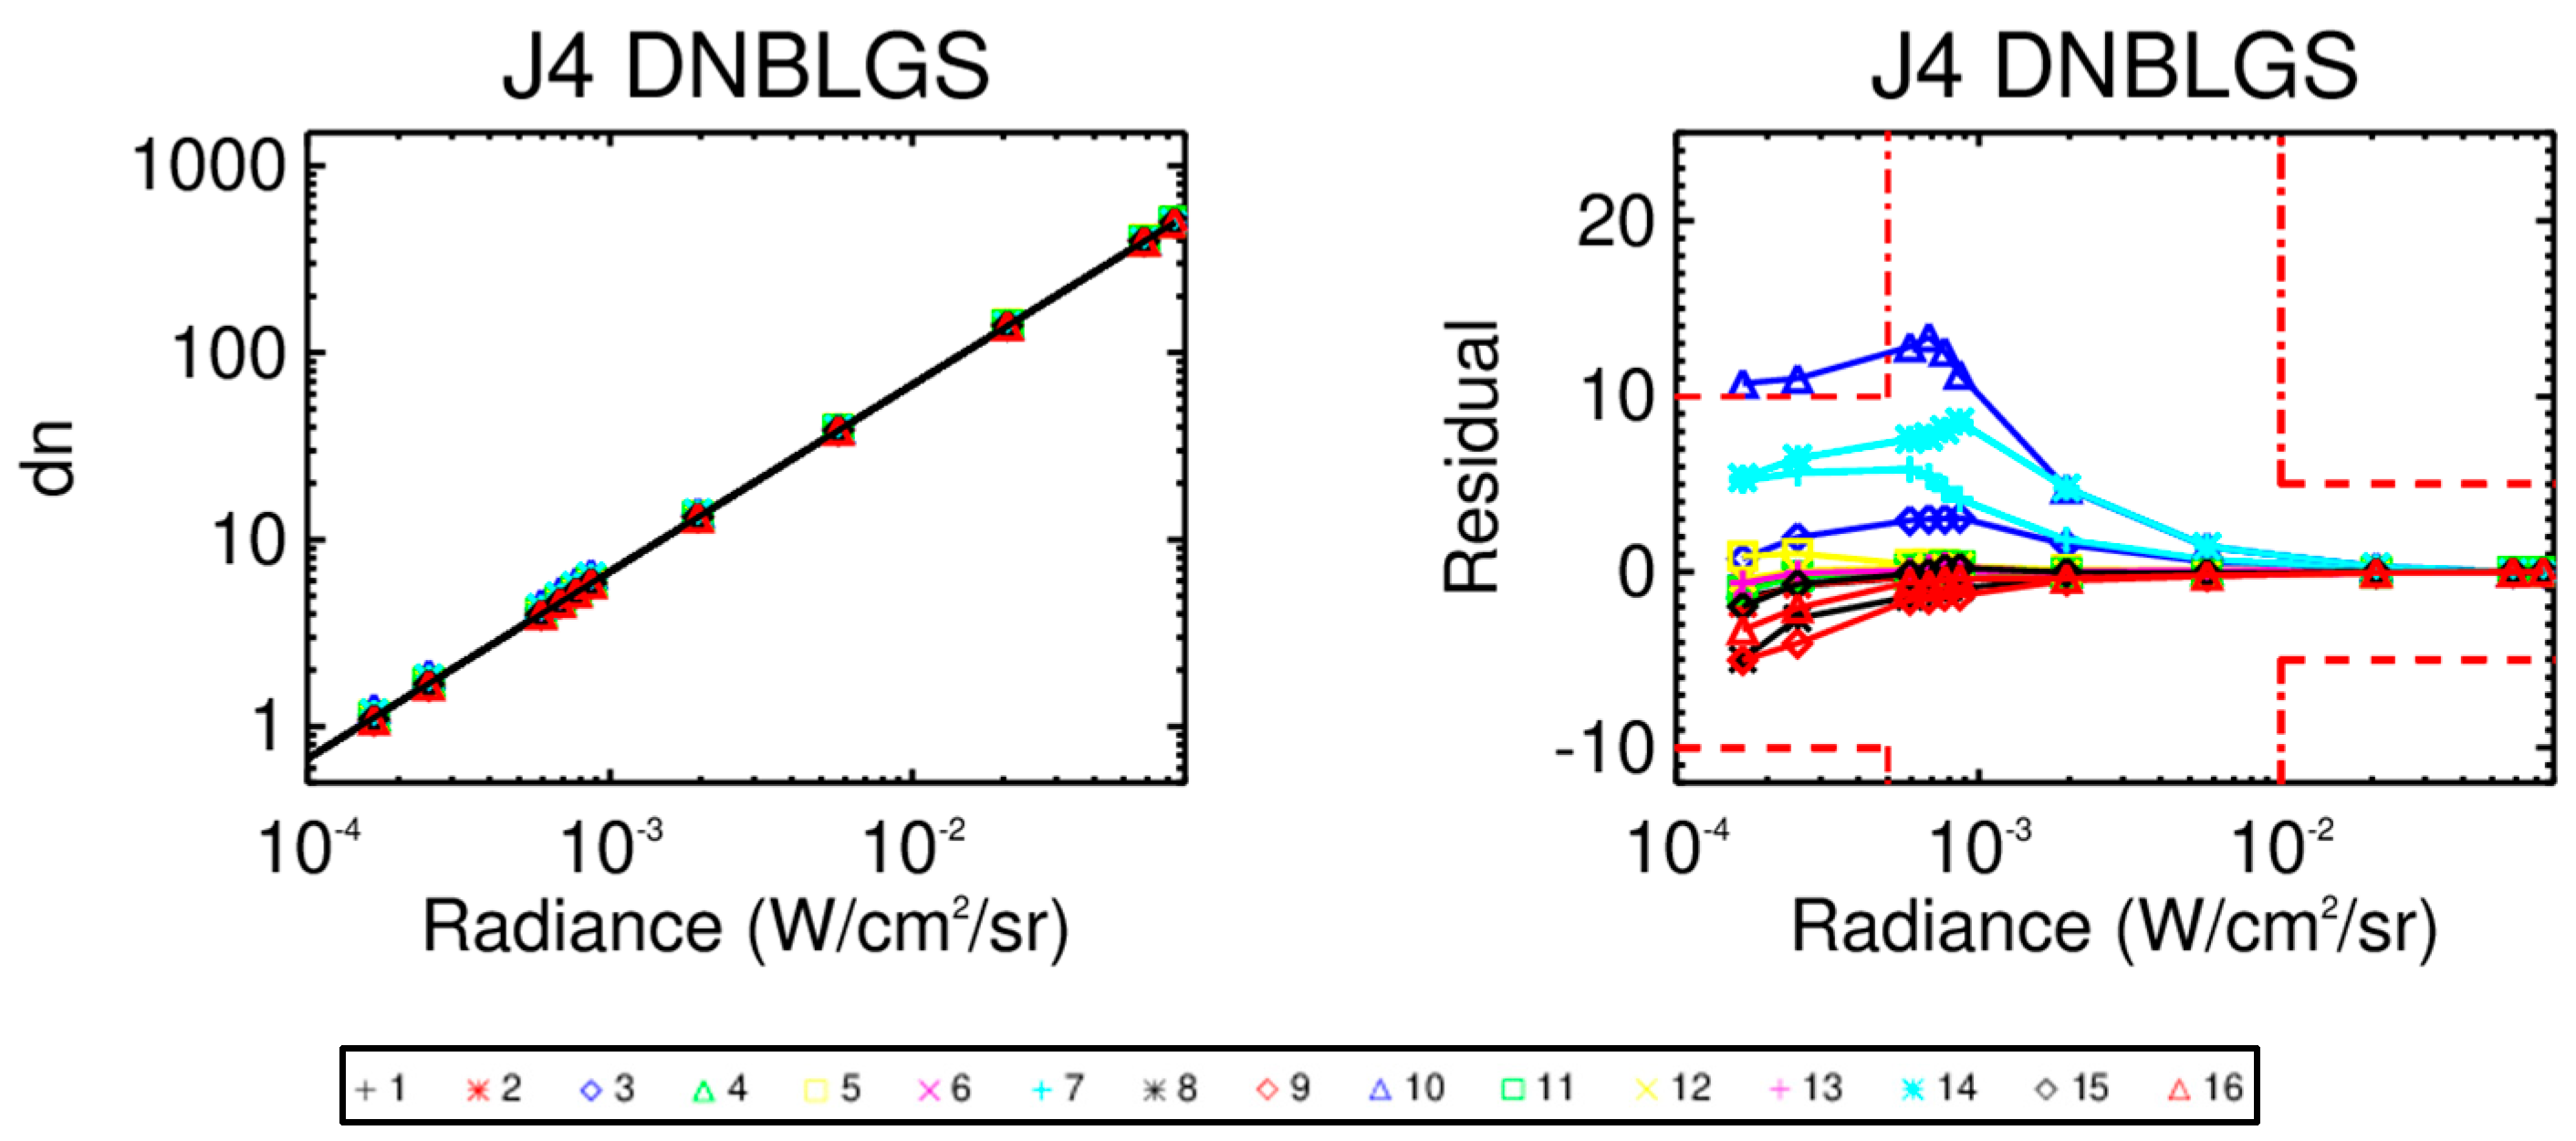
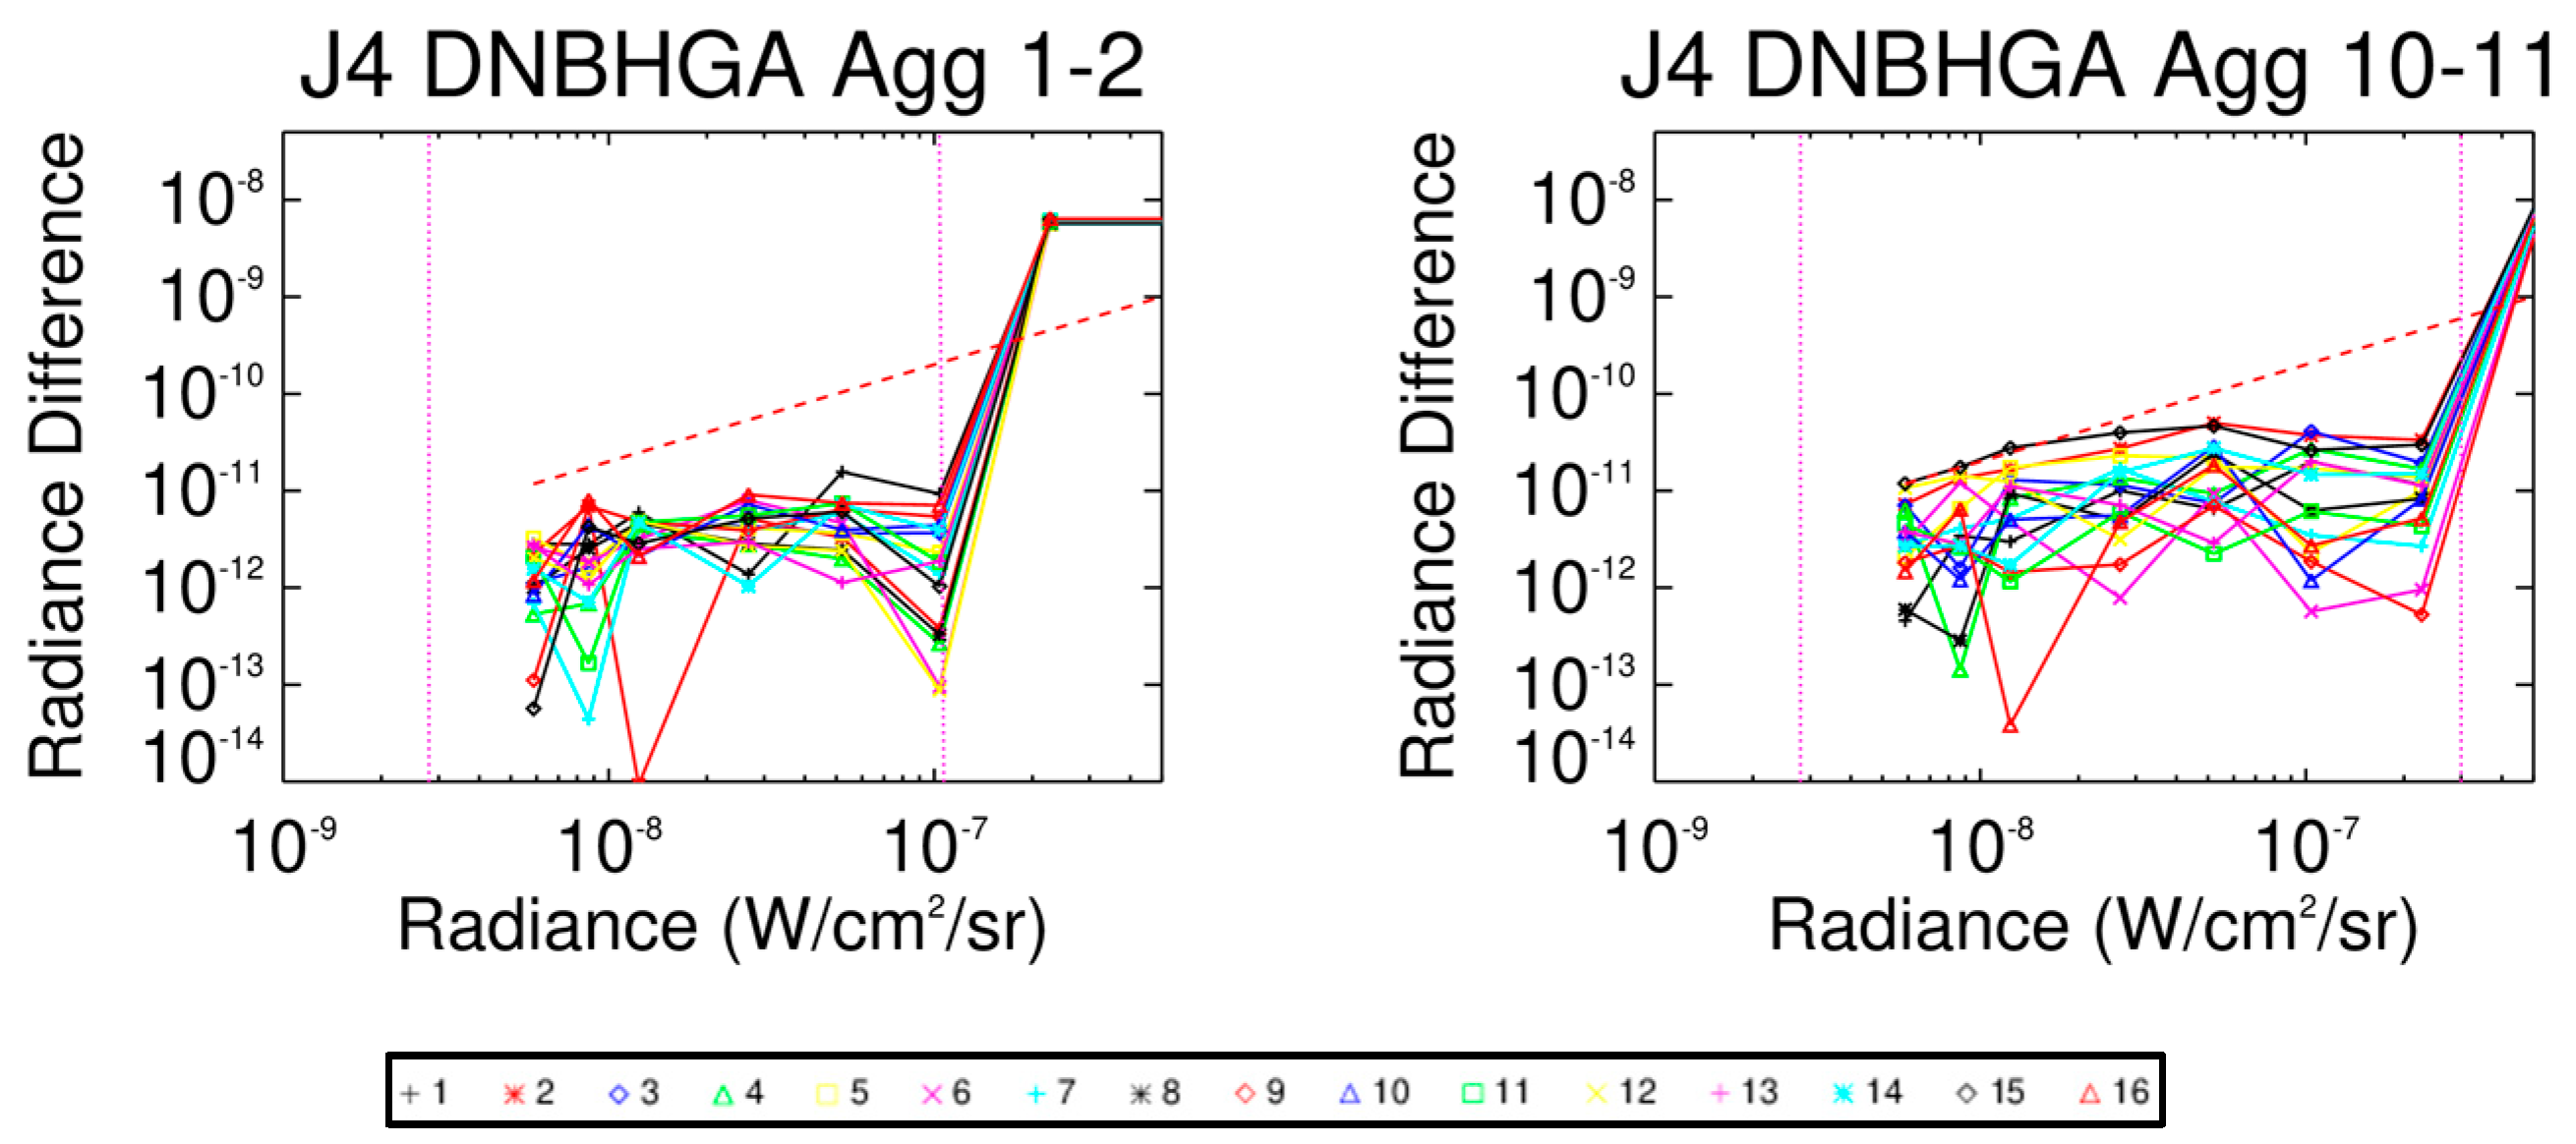
3.4. Non-Linearity
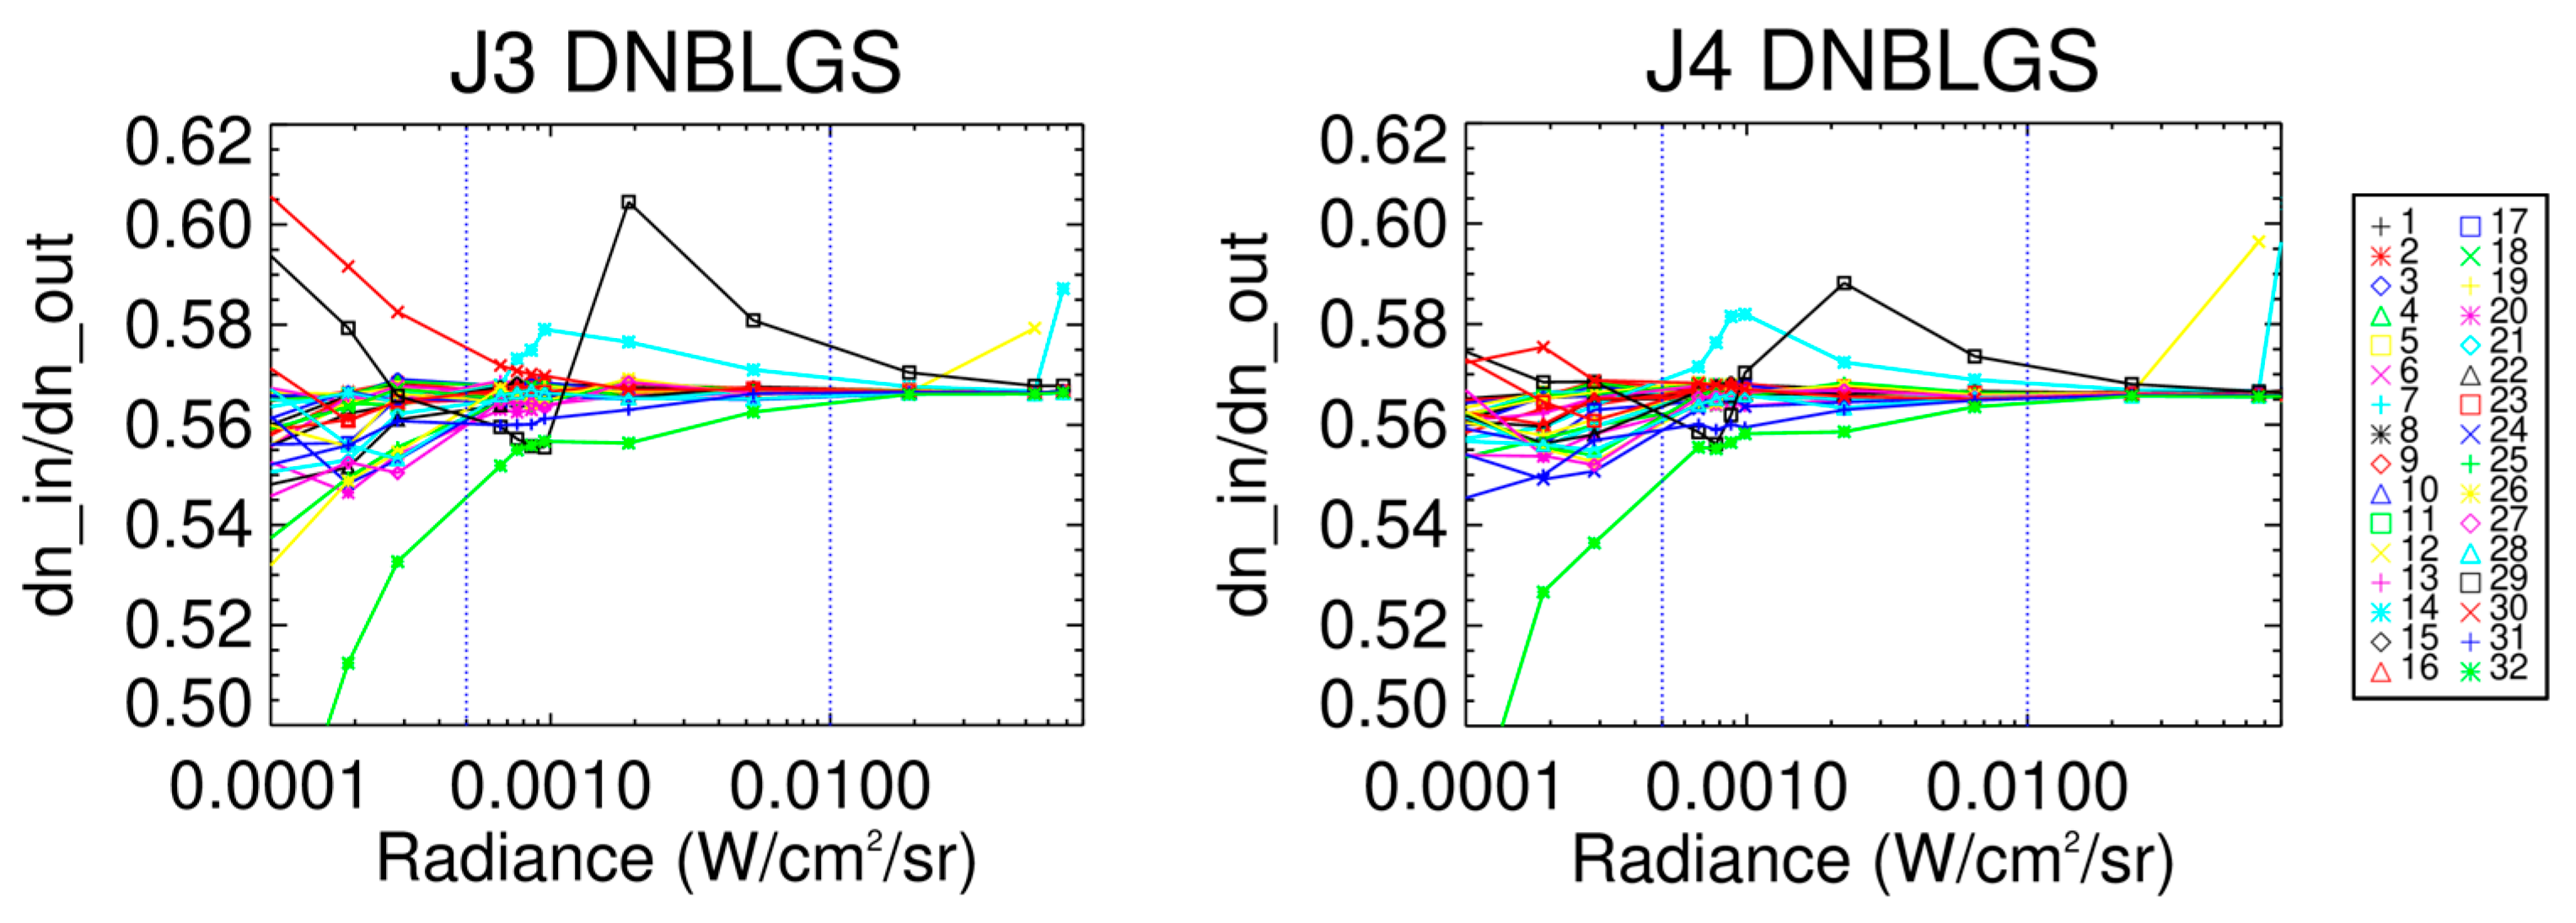
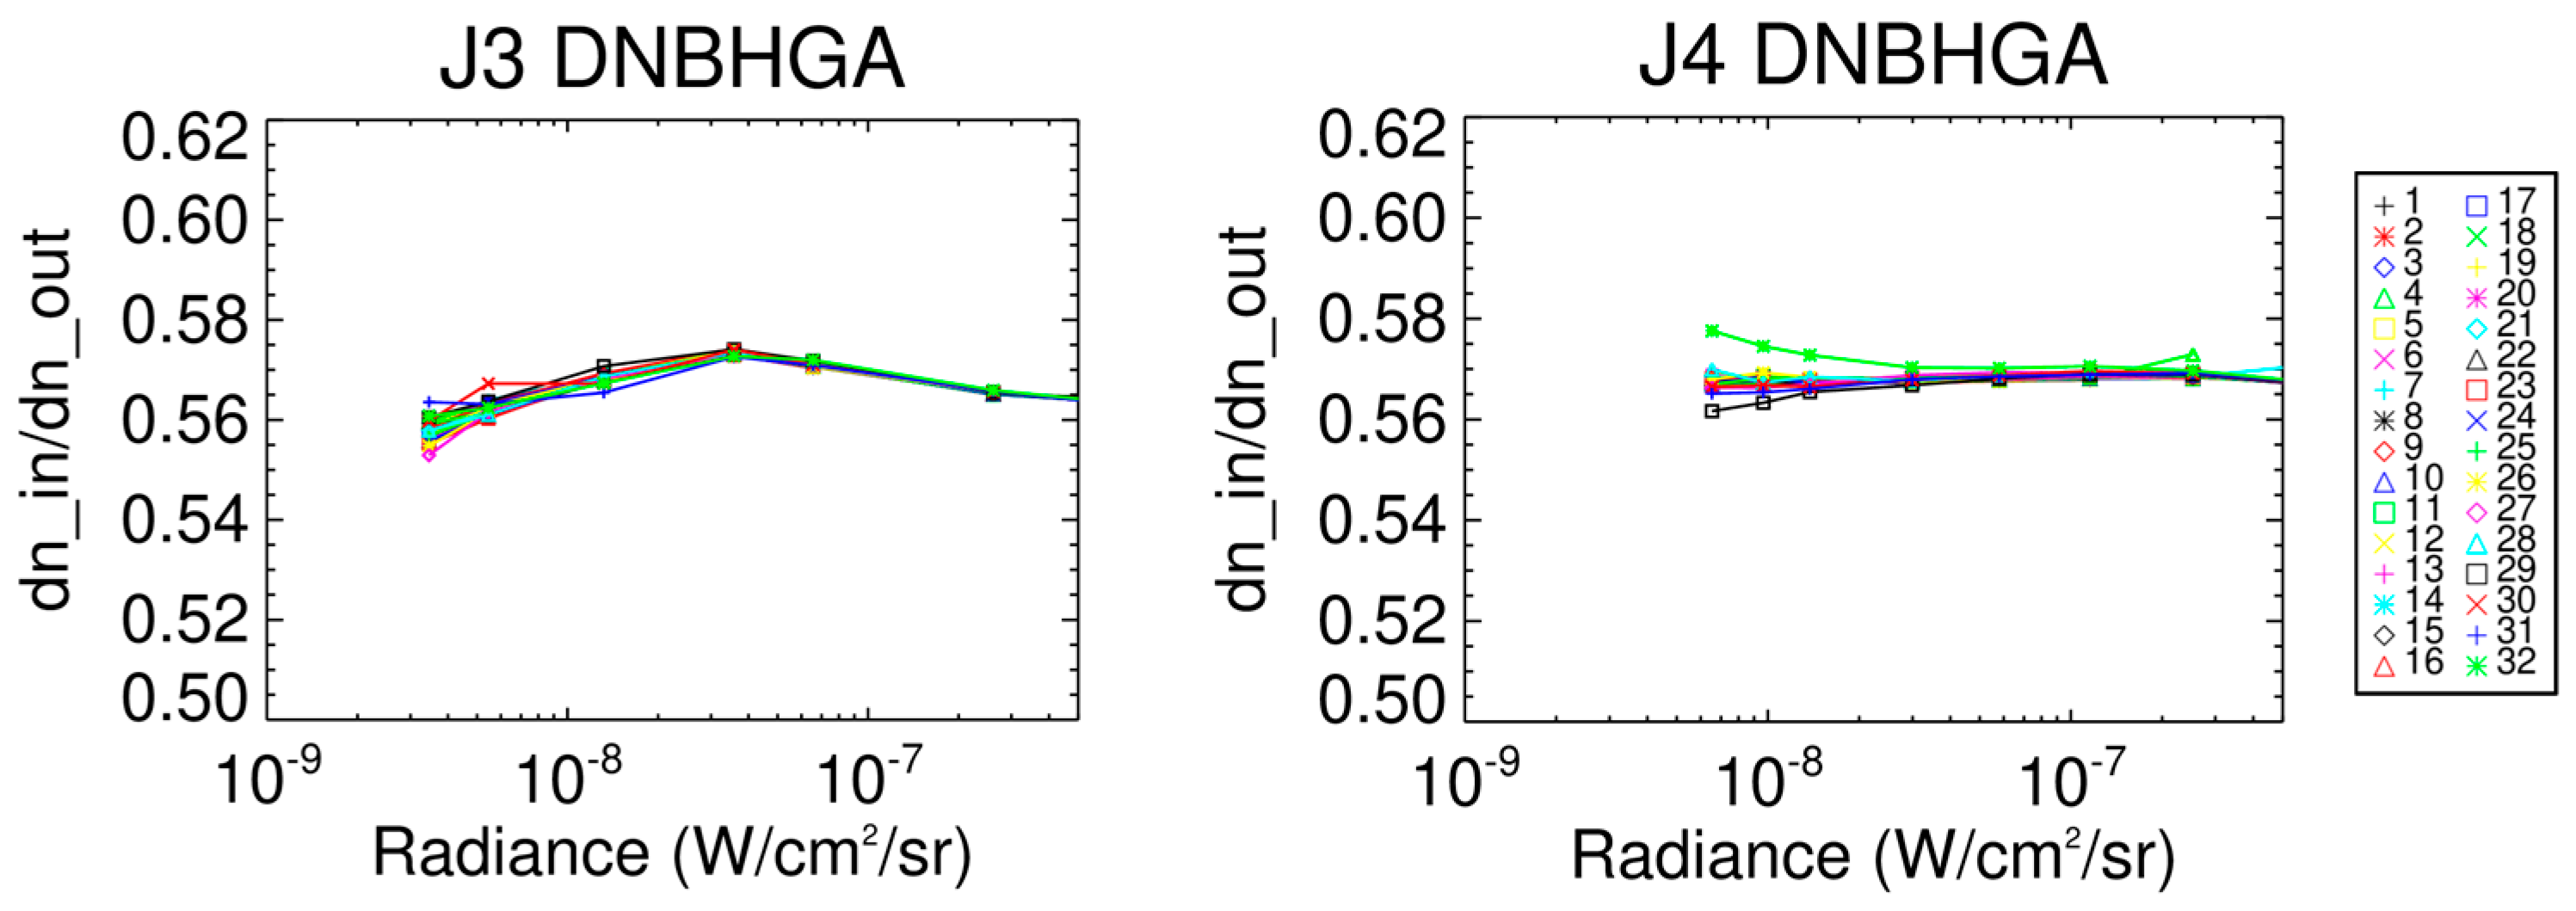
3.5. Uniformity
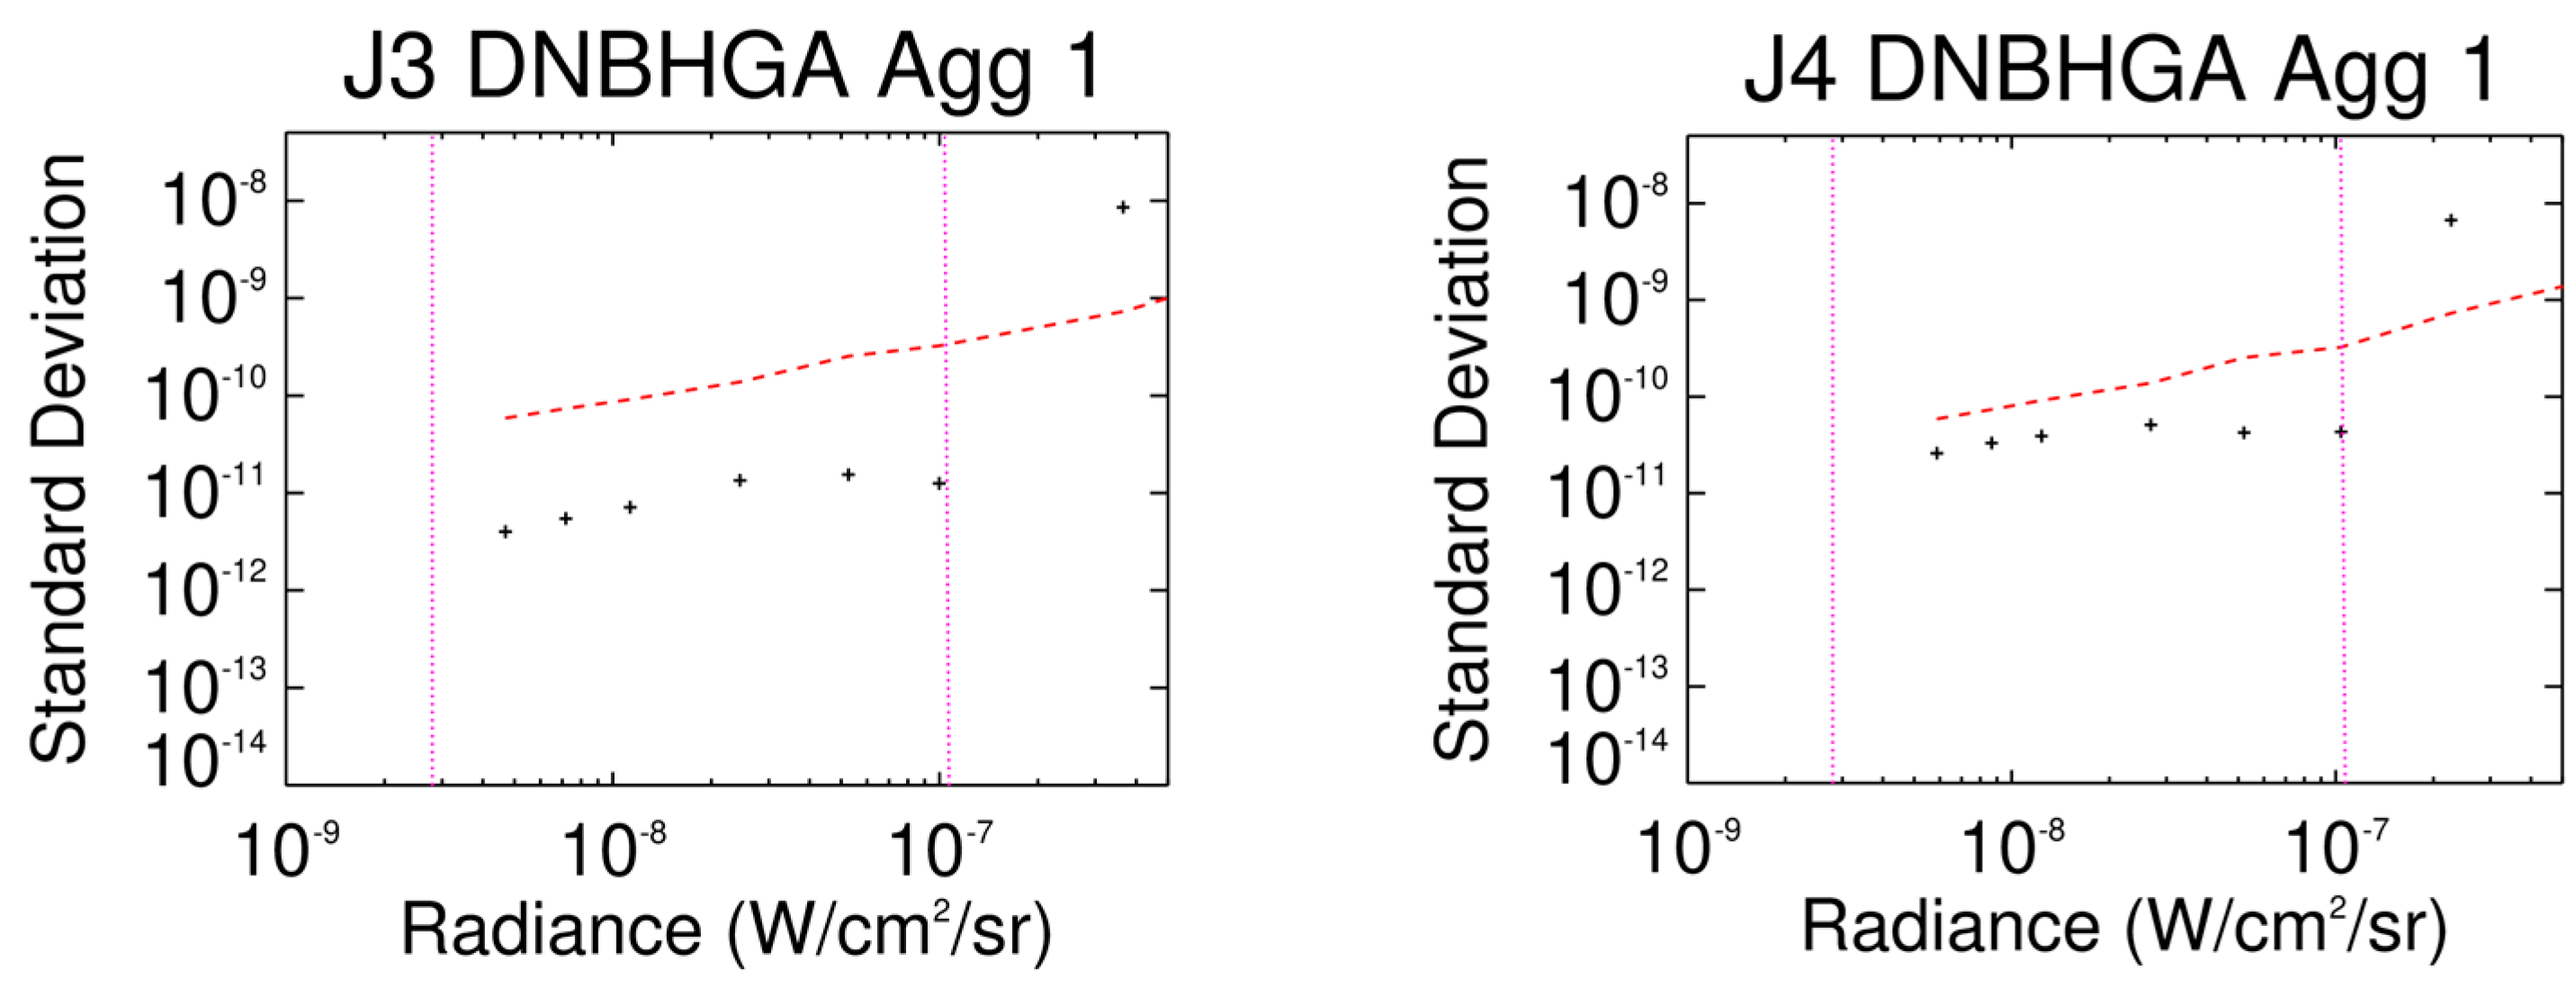
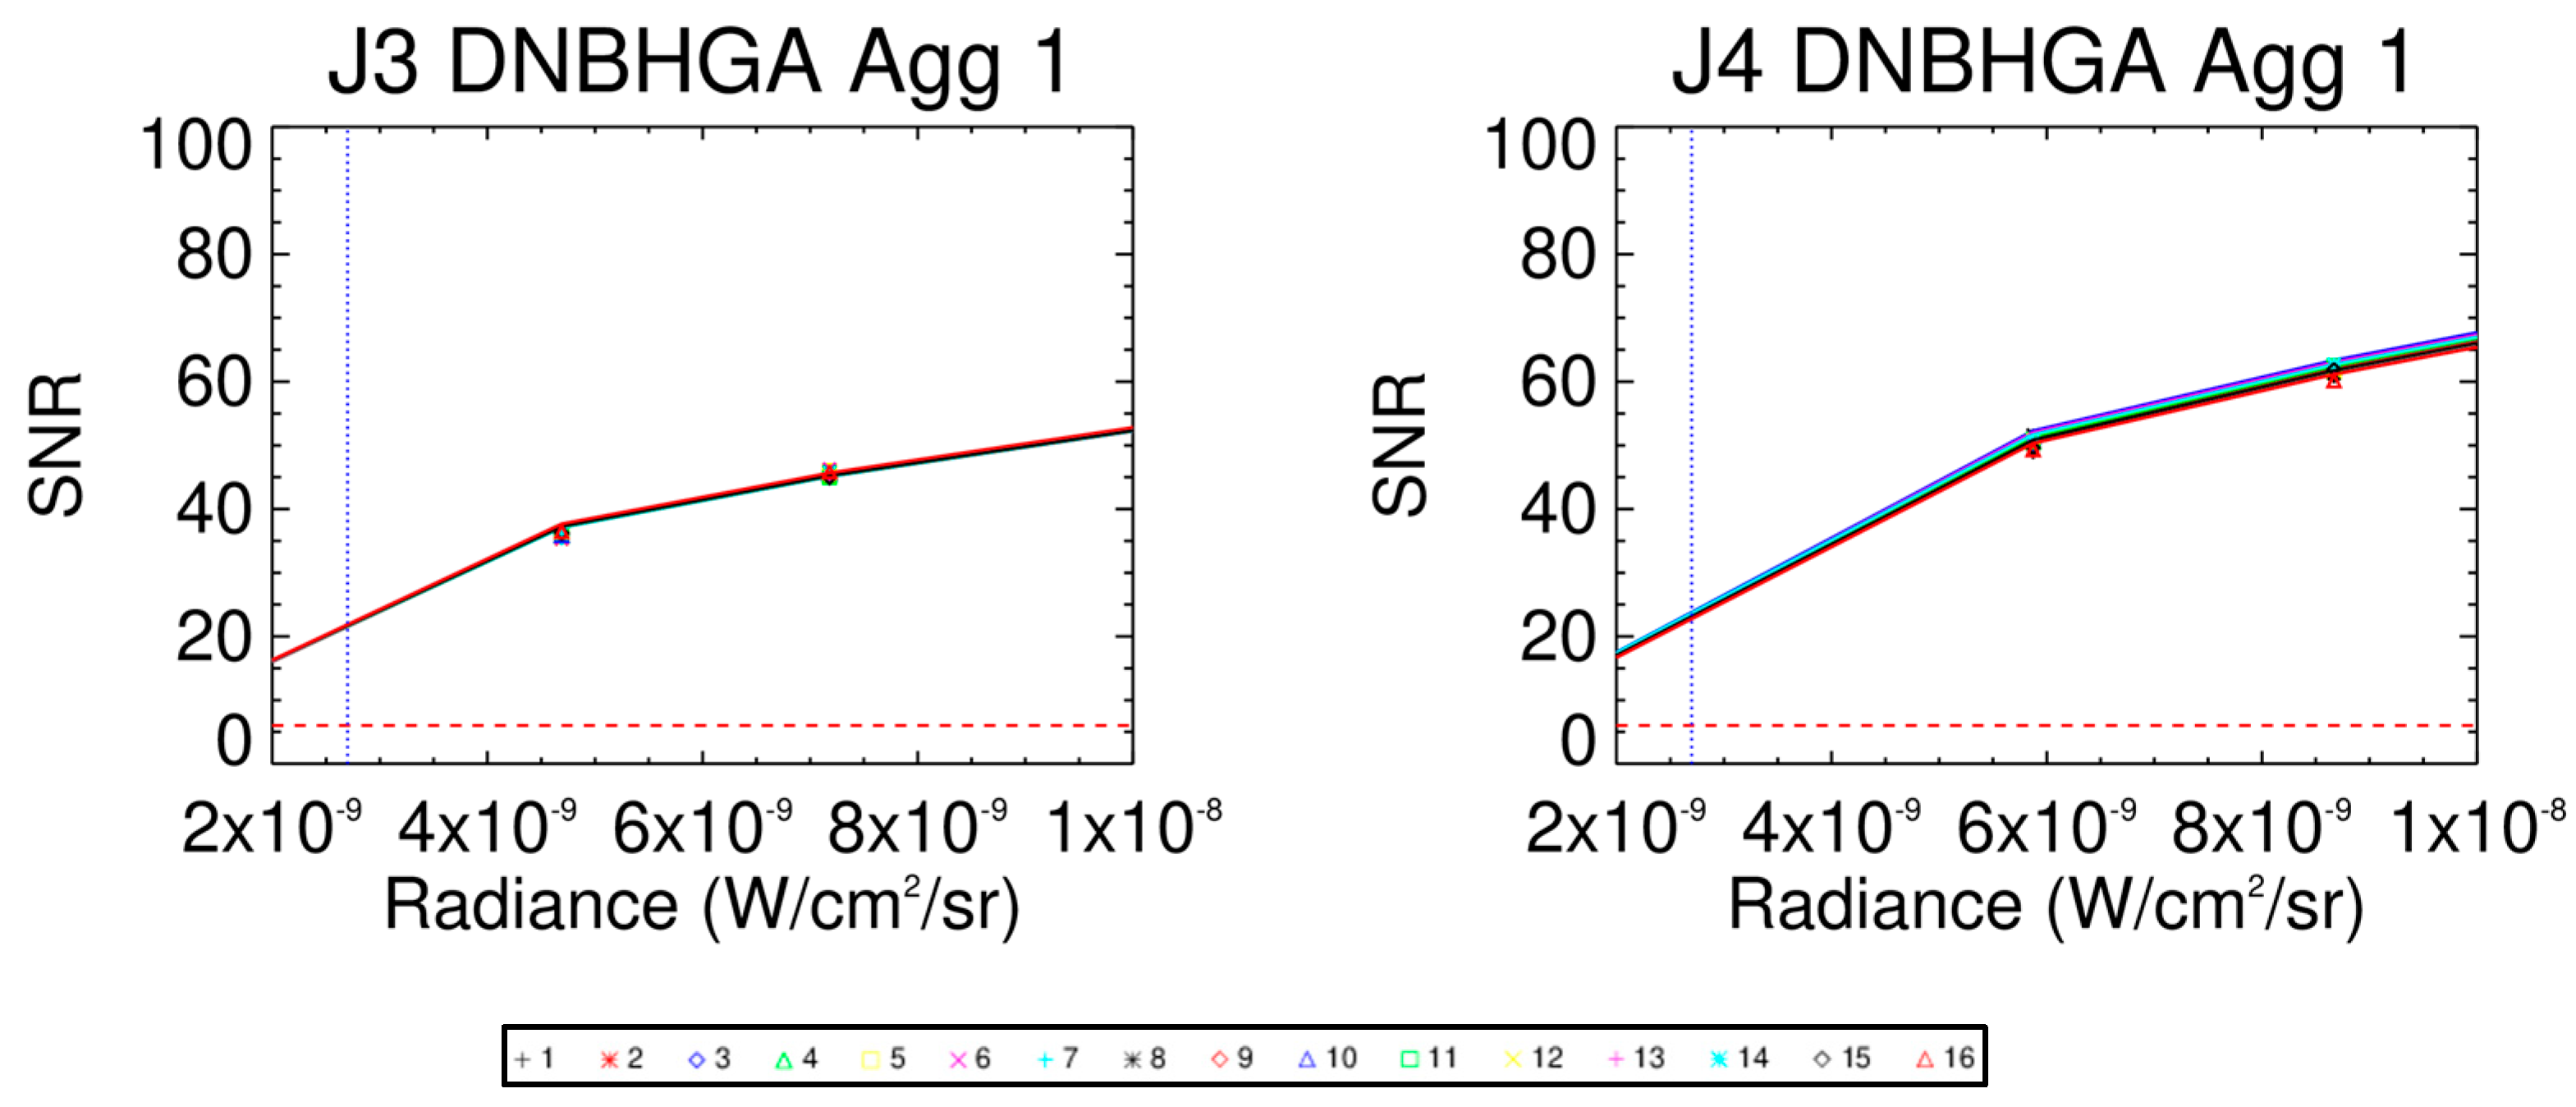
3.6. SNR
4. Discussion
4.1. Uncertainty
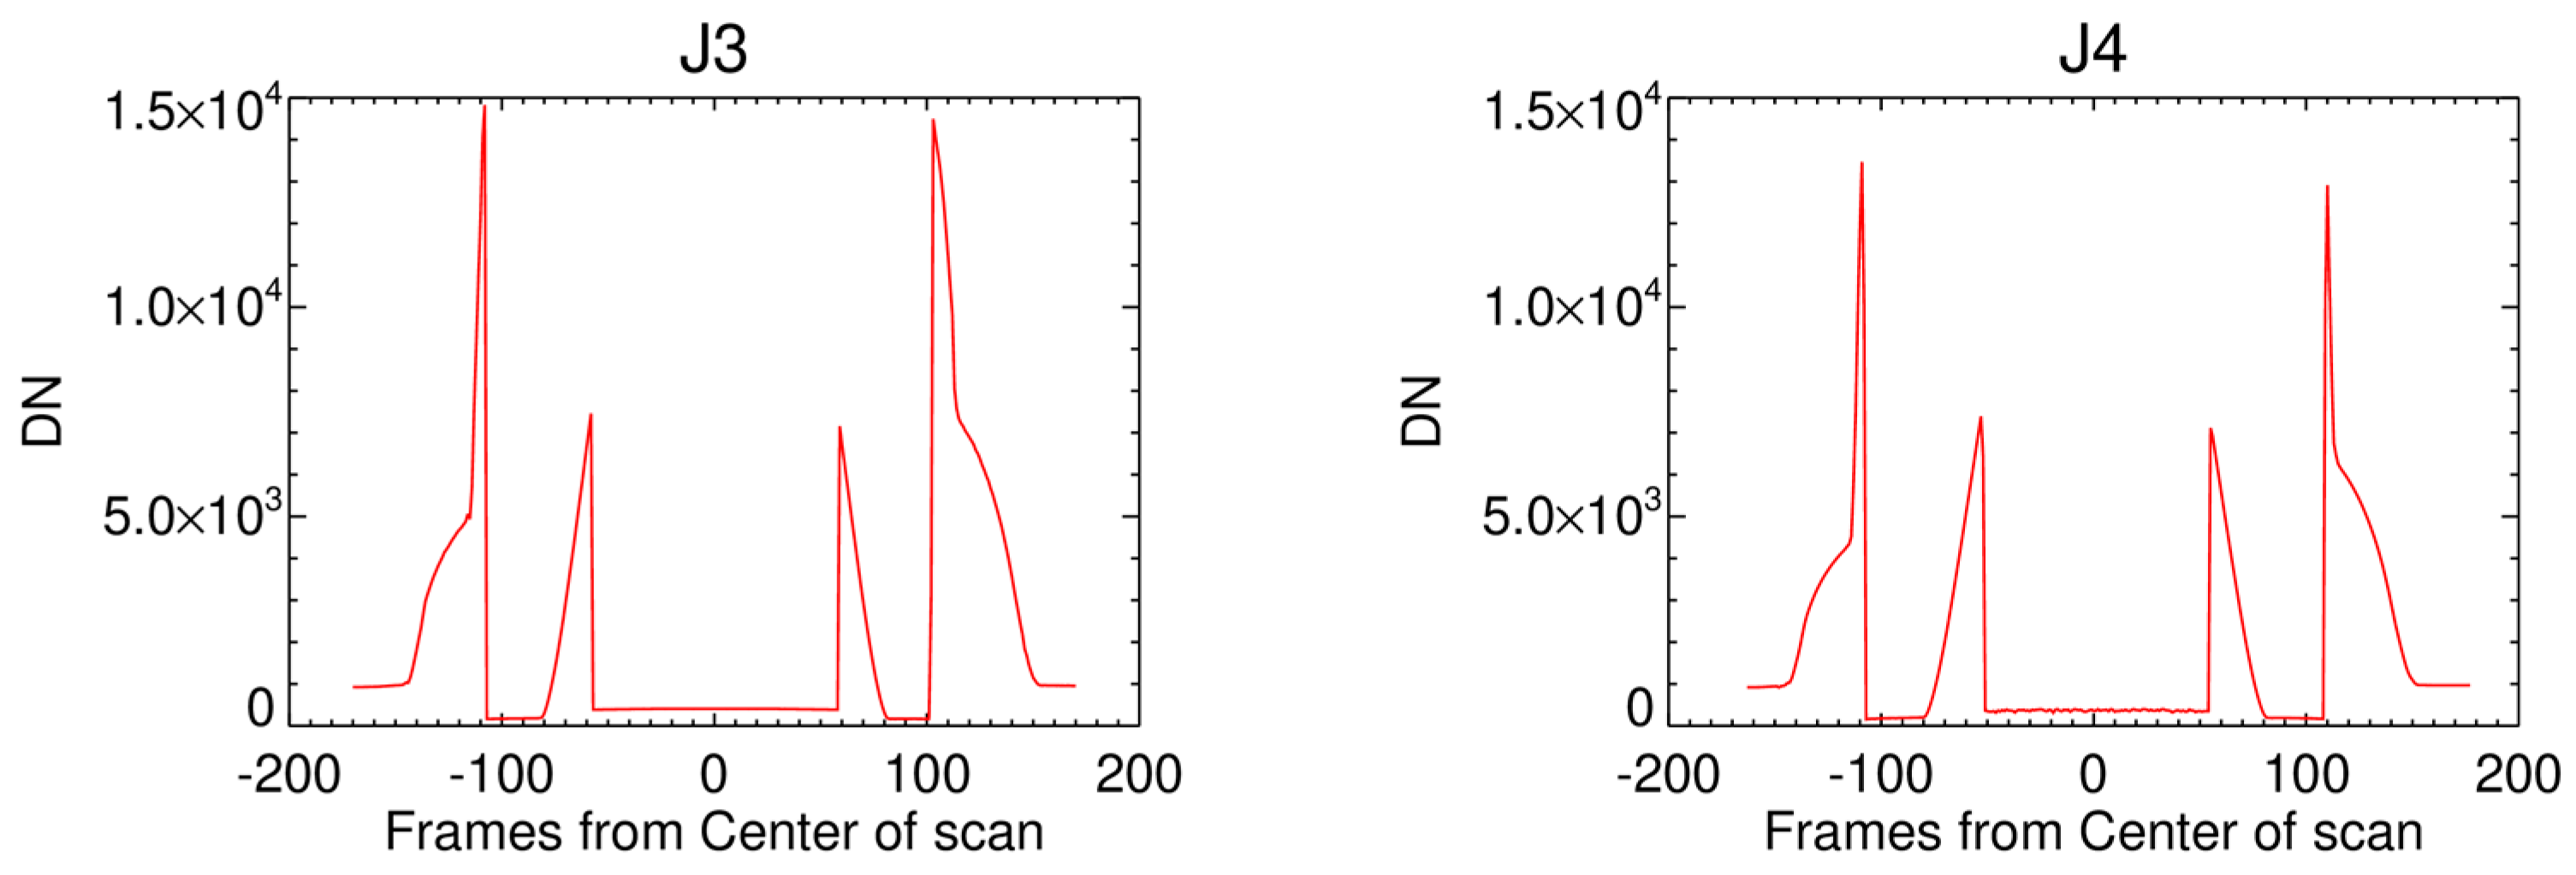
4.2. Stray Light
5. Conclusions
Author Contributions
Funding
Data Availability Statement
Acknowledgments
Conflicts of Interest
References
- Schueler, C.; Clement, J.E.; Ardanuy, P.E.; Welsch, C.; DeLuccia, F.; Swenson, H. NPOESS VIIRS sensor design overview. In Earth Observing Systems VI; SPIE: Bellingham, WA, USA, 2002. [Google Scholar]
- Xiong, X.; Butler, J.; Chiang, K.; Efremova, B.; Fulbright, J.; Lei, N.; McIntire, J.; Oudrari, H.; Sun, J.; Wang, Z.; et al. VIIRS on-orbit calibration methodology and performance. J. Geophys. Res. Atmos. 2013, 119, 5065–5078. [Google Scholar] [CrossRef]
- Xiong, X.; Butler, J.; Chiang, K.; Efremova, B.; Fulbright, J.; Lei, N.; McIntire, J.; Oudrari, H.; Wang, Z.; Wu, A. Assessment of S-NPP VIIRS On-Orbit Radiometric Calibration and Performance. Remote Sens. 2016, 8, 84. [Google Scholar] [CrossRef] [PubMed]
- Lee, S.; Chiang, K.; Xiong, X.; Sun, C.; Anderson, S. The S-NPP VIIRS Day-Night Band On-Orbit Calibration/Characterization and Current State of SDR Products. Remote Sens. 2014, 6, 12427–12446. [Google Scholar] [CrossRef]
- Chen, H.; Sun, C.; Xiong, X.; Sarid, G.; Sun, J. SNPP VIIRS Day Night Band: Ten Years of On-orbit Calibration and Performance. Remote Sens. 2021, 13, 4179. [Google Scholar] [CrossRef]
- Xiong, X.; Cao, C.; Lei, N.; Chiang, K.; Angal, A.; Li, Y.; Blonski, S.; Wang, W.; Choi, T. Early Results from NOAA-20 (JPSS-1) VIIRS On-ORBIT Calibration and Characterization. In Proceedings of the IEEE International Geoscience and Remote Sensing Symposium, Valencia, Spain, 22–27 July 2018. [Google Scholar]
- Chen, H.; Sun, J.; Link, D.; Sun, C.; Chiang, K.; Xiong, X. NOAA-21 VIIRS day-night band on-orbit calibration and performance in early mission. In Proceedings of the SPIE 12729: Sensors, Systems, and Next-Generation Satellites XXVII, Amsterdam, The Netherlands, 3–6 September 2023. [Google Scholar]
- Xiong, X.; Angal, A.; Lei, N.; Twedt, K.; Chen, H.; Chiang, K. An update of NOAA-21 VIIRS on-orbit calibration and performance. In Proceedings of the SPIE 13192: Sensors, Systems, and Next-Generation Satellites XXVII, Edinburgh, UK, 16–19 September 2024. [Google Scholar]
- Oudrari, H.; McIntire, J.; Xiong, X.; Butler, J.; Lee, S.; Lei, N.; Schwarting, T.; Sun, J. Prelaunch Radiometric Characterization and Calibration of the S-NPP VIIRS Sensor. IEEE Trans. Geosci. Remote Sens. 2015, 53, 2195–2210. [Google Scholar]
- Oudrari, H.; McIntire, J.; Xiong, X.; Butler, J.; Ji, Q.; Schwarting, T.; Lee, S.; Efremova, B. JPSS-1 VIIRS Radiometric Characterization and Calibration Based on Pre-Launch Testing. Remote Sens. 2016, 8, 41. [Google Scholar] [CrossRef]
- Oudrari, H.; McIntire, J.; Xiong, X.; Butler, J.; Ji, Q.; Schwarting, T.; Angal, A. An Overall Assessment of JPSS-2 VIIRS Radiometric Performance Based on Pre-Launch Testing. Remote Sens. 2018, 10, 1921. [Google Scholar] [CrossRef]
- McIntire, J.; Xiong, X.; Butler, J.J.; Angal, A.; Moyer, D.; Ji, Q.; Schwarting, T.; Link, D.; Sun, C. An Overall Assessment of JPSS-3 VIIRS Radiometric Performance Based on Pre-Launch Testing. Remote Sens. 2022, 14, 1999. [Google Scholar] [CrossRef]
- Angal, A.; Moyer, D.; Xiong, X.; Link, D.; Schwarting, T.; McIntire, J.; Ji, Q.; Sun, C. JPSS-4 VIIRS prelaunch calibration performance and assessment. In Proceedings of the SPIE 13192: Sensors, Systems, and Next-Generation Satelllites XXVII, Edinburgh, UK, 16–19 September 2024. [Google Scholar]
- Zhang, P.; Lin, G.; Wolfe, R.E. JPSS-3 VIIRS prelaunch geometric calibration and characterization status. In Proceedings of the SPIE 11829: Earth Observing Systems XXVI, San Diego, CA, USA, 1–5 August 2021. [Google Scholar]
- Zhang, P.; Lin, G. JPSS-4 VIIRS prelaunch geometric calibration and characterization status. In Proceedings of the SPIE 13143: Earth Observing Systems XXIX, San Diego, CA, USA, 20–21 August 2024. [Google Scholar]
- Moeller, C.; Schwarting, T.; Moyer, D.; Barsi, J. The JPSS-3 VIIRS version 2 at-launch relative spectral response characterization. In Proceedings of the SPIE Earth Observing Systems XXVIII, San Diego, CA, USA, 22–24 August 2023. [Google Scholar]
- Moeller, C.; Schwarting, T.; Moyer, D.; Barsi, J.; Angal, A. The JPSS-4 VIIRS version 2 at-launch relative spectral response characterization. In Proceedings of the SPIE Earth Observing Systems XXIX, San Diego, CA, USA, 20–21 August 2024. [Google Scholar]
- Schwarting, T.; Link, D.; Sun, C.; McIntire, J.; Xiong, X. JPSS-3 VIIRS day-night band pre-launch radiometric characterization. In Proceedings of the SPIE 11829, Earth Observing Systems XXVI, San Diego, CA, USA, 1–5 August 2021. [Google Scholar]
- Schwarting, T.; Link, D.; Sun, C.; Angal, A.; Xiong, X. Prelaunch radiometric calibration of the J4 VIIRS day-night band. In Proceedings of the SPIE 13143, Earth Observing Systems XXIX, San Diego, CA, USA, 20–21 August 2024. [Google Scholar]
- Schwarting, T.A.; Link, D.; Sun, C.; McIntire, J.; Xiong, X. Mitigation of sample dependent non-linearity in JPSS VIIRS day-night band radiometric calibration. In Proceedings of the SPIE 12232: Earth Observing Systems XXVII, San Diego, CA, USA, 23–25 August 2022. [Google Scholar]
- Elvidge, C.D.; Baugh, K.; Zhizhin, M.; Hsu, F.C.; Ghosh, T. VIIRS night-time lights. Int. J. Remote Sens. 2017, 38, 5860–5879. [Google Scholar] [CrossRef]
- Liao, L.B.; Weiss, S.; Mills, S.; Hauss, B. Suomi NPP VIIRS day-night band on-orbit performance. J. Geophys. Rem. Atmos. 2013, 118, 12704–12718. [Google Scholar]
- Qiu, S.; Shao, X.; Cao, C.Y.; Uprety, S.; Wang, W.H. Assessment of straylight correction performance for the VIIRS Day/Night Band using Dome-C and Greenland under lunar illumiination. Int. J. Remote Sens. 2017, 38, 5880–5898. [Google Scholar]
- Liang, C.K.; Mills, S.; Hauss, B.I.; Miller, S.D. Improved VIIRS Day/Night Band Imagery With Near-Constant Contrast. IEEE Trans. Geosci. Remote Sens. 2014, 52, 6964–6971. [Google Scholar]
- Lee, S.; Cao, C. Soumi NPP VIIRS Day/Night Band Stray Light Characterization and Correction Using Calibration View Data. Remote Sens. 2016, 8, 138. [Google Scholar] [CrossRef]
- Yalong, G.; Blonski, S.; Wang, W.; Uprety, S.; Choi, T.; Shao, X.; Zhang, B.; Cao, C. Improved NOAA-20 Visible Infrared Imaging Radiometer Suite Day/Night Band Image Quality by Upgraded Gain Calibration. Remote Sens. 2021, 13, 2509. [Google Scholar] [CrossRef]
- Xiong, X.; Angal, A.; Sun, J.; Lei, N.; Twedt, K.; Chiang, K. Early Results from NOAA-21 (JPSS-2) VIIRS on-Orbit Calibration. In Proceedings of the IEEE International Geoscience and Remote Sensing Symposium, Pasadena, CA, USA, 16–21 July 2023. [Google Scholar]


| Gain Stage | Lmin (W·cm−2·sr−1) | Lmax (W·cm−2·sr−1) | Subpixels Scan | Subpixels Track | Resolution (m) |
|---|---|---|---|---|---|
| LGS | N/A | 0.02 | 1 | 672 | 742 |
| MGS | N/A | N/A | 3 | 672 | 742 |
| HGS | 3.00 × 10⁻⁹ | N/A | 250 | 672 | 742 |
| LGS Lmin | LGS Lmax | MGS Lmin | MGS Lmax | HGS Lmin | HGS Lmax | |||||||
|---|---|---|---|---|---|---|---|---|---|---|---|---|
| Instrument | J3 | J4 | J3 | J4 | J3 | J4 | J3 | J4 | J3 | J4 | J3 | J4 |
| Gain Cal. | 12.4 | 6.7 | 12.4 | 6.7 | 15.6 | 9.7 | 13.0 | 9.7 | 12.5 | 8.9 | 13.4 | 9.8 |
| Offset Cal. | 0.8 | 2.8 | 0.5 | 0.5 | 0.8 | 1.8 | 0.5 | 1.8 | 9.5 | 12.6 | 0.5 | 0.5 |
| Stability | 5.1 | 4.7 | 0.7 | 0.9 | 0.3 | 0.2 | 0.5 | 0.2 | 0.4 | 52.9 | 0.6 | 3.9 |
| Measurement | 1.0 | 1.0 | 1.0 | 1.0 | 1.0 | 1.0 | 1.0 | 1.0 | 1.8 | 1.8 | 1.0 | 1.0 |
| Total | 13.5 | 8.7 | 12.5 | 6.9 | 15.7 | 10.0 | 13.1 | 9.8 | 15.8 | 55.1 | 13.5 | 10.6 |
| Specification | 10 | 10 | 5 | 5 | 30 | 30 | 10 | 10 | 100 | 100 | 30 | 30 |
Disclaimer/Publisher’s Note: The statements, opinions and data contained in all publications are solely those of the individual author(s) and contributor(s) and not of MDPI and/or the editor(s). MDPI and/or the editor(s) disclaim responsibility for any injury to people or property resulting from any ideas, methods, instructions or products referred to in the content. |
© 2025 by the authors. Licensee MDPI, Basel, Switzerland. This article is an open access article distributed under the terms and conditions of the Creative Commons Attribution (CC BY) license (https://creativecommons.org/licenses/by/4.0/).
Share and Cite
Link, D.; Schwarting, T.; Angal, A.; Xiong, X. Pre-Launch Day-Night Band Radiometric Performance of JPSS-3 and -4 VIIRS. Remote Sens. 2025, 17, 1111. https://doi.org/10.3390/rs17071111
Link D, Schwarting T, Angal A, Xiong X. Pre-Launch Day-Night Band Radiometric Performance of JPSS-3 and -4 VIIRS. Remote Sensing. 2025; 17(7):1111. https://doi.org/10.3390/rs17071111
Chicago/Turabian StyleLink, Daniel, Thomas Schwarting, Amit Angal, and Xiaoxiong Xiong. 2025. "Pre-Launch Day-Night Band Radiometric Performance of JPSS-3 and -4 VIIRS" Remote Sensing 17, no. 7: 1111. https://doi.org/10.3390/rs17071111
APA StyleLink, D., Schwarting, T., Angal, A., & Xiong, X. (2025). Pre-Launch Day-Night Band Radiometric Performance of JPSS-3 and -4 VIIRS. Remote Sensing, 17(7), 1111. https://doi.org/10.3390/rs17071111