Abstract
Urban Functional Zones (UFZs) are spatial units of the city divided according to specific functional activities. Detailed identification of UFZs is vital for optimizing urban management, guiding planning and design, and promoting sustainable development. However, existing UFZ recognition methods face significant challenges, such as difficulties in effectively integrating multi-source heterogeneous data, capturing dynamic spatiotemporal patterns, and addressing the complex interrelationships among various data types. These issues significantly limit the applicability of UFZ mapping in complex urban scenarios. To address these challenges, this paper proposes a tripartite neural network (TriNet) for multimodal data processing, including Remote Sensing (RS) images, Point of Interest (POI) data, and Origin–Destination (OD) data, fully utilizing the complementarity of different data types. TriNet comprises three specialized branches: ImgNet for spatial features extraction from images, POINet for functional density distribution features extraction from POI data, and TrajNet for spatiotemporal pattern features extraction from OD data. Finally, the method deeply fuses these features through a feature fusion module, which utilizes a two-layer fully connected network for deep fusion, allowing the model to fully utilize the interdependencies among the data types, significantly improving the UFZ classification accuracy. The experimental data are generated by mapping OpenStreetMap (OSM) vector into conceptual representations, integrating images with social sensing data to create a comprehensive UFZ classification benchmark. The method achieved an overall accuracy of 84.13% on the test set of Chongqing’s main urban area, demonstrating high accuracy and robustness in UFZ classification tasks. The experimental results show that the TriNet model performs effectively in UFZ classification.
1. Introduction
UFZs are spatial divisions of the city based on various human activities and social services distributed within urban space. They are the fundamental units of urban planning and resource allocation. Due to the accelerated pace of urbanization, the accurate identification and classification of UFZs is crucial for optimizing urban management and resource distribution [1]. However, the heterogeneity and multidimensional attributes of UFZs, particularly in the context of the rapid growth and dynamic changes in multi-source data, present unprecedented challenges to accurate classification [2]. Specifically, a piece of urban land may simultaneously serve multiple functional purposes, significantly increasing the complexity of UFZ mapping. This complexity is further exacerbated in modern cities, where the diversity and dynamism of urban functions add to the difficulty of precise mapping. The mapping of UFZs is a key aspect of urban planning and management, helping to understand the socioeconomic activities and resource distribution within the city [3,4].
Recent studies have focused on integrating various data sources, including RS, social sensing, and multi-source geographic data, to improve the accuracy and effectiveness of UFZ recognition. RS images provide macroscopic information about urban spatial structures, such as building distribution, road networks, and green cover, reflecting the physical form of urban functions [5]. Social sensing data (e.g., POI, mobile signaling data) can record the spatiotemporal distribution of human activities and social function characteristics, revealing the actual use and dynamic properties of urban areas [6,7]. However, traditional mapping methods based on single data sources have achieved success in certain specific scenarios, but they struggle to simultaneously handle the heterogeneity and dynamics of multi-source data. They also fail to automatically capture the complex spatial patterns and latent correlations of UFZs, limiting their applicability in complex urban environments [8]. Therefore, how to effectively combine these multi-source data is the key to achieving high-precision UFZ mapping, and is the current focus of research by scholars [9].
To improve the UFZ recognition accuracy and address the limitations of single data sources, researchers have employed various multi-source data fusion techniques [10], including traditional machine learning classification methods [11,12,13,14], statistical analysis methods [15,16], and clustering analysis methods [17,18]. For instance, a study combined Near-Infrared and normalized Digital Surface Model features from GaoFen-7 imagery with POI data, achieving an accuracy of 88.17% [19]. However, this high accuracy relies on exceptionally high-resolution multispectral imagery (approximately 1 m spatial resolution), which is both expensive and difficult to acquire at scale, making it less feasible for large urban areas.
Furthermore, the reliance on such high-precision data leads to resource-intensive methods that are not easily scalable or adaptable to time-sensitive projects. Other studies, such as those utilizing mobile signaling data, POI data, and Sentinel imagery [20], or integrating POI data with high-resolution RS imagery [21,22], have also achieved notable results. For example, a study in Shenzhen reported an accuracy increase of about 11%, while an experiment in Zhengzhou reached an accuracy of 84.00% [23]. However, despite these methods achieving good overall accuracy, their reliance on static data reveals a common limitation: they fail to account for the dynamic characteristics of urban functions. This limitation makes it difficult to distinguish mixed-function areas, such as commercial and residential zones, which exhibit similar features in static data. Moreover, most of these methods depend on manually designed features and basic statistical models, lacking the ability to fully explore the complex nonlinear patterns and deeper features inherent in multi-source data.
The rapid development of deep learning, in conjunction with its powerful nonlinear feature learning and end-to-end optimization capabilities, has provided new solutions for UFZ mapping. Many studies have explored various deep learning techniques to enhance UFZ classification; for instance, researchers have combined self-supervised learning (SSL) with deep learning to learn features from unlabeled data, which significantly reduces reliance on labeled data and improves the scalability of the models [24]. While this approach has shown promise in feature learning, it still faces challenges in capturing the complex, spatiotemporal patterns required for accurate UFZ classification. The lack of labeled data, though mitigated, remains a limitation in complex urban environments where dynamic changes in UFZs are frequent.
Multimodal deep learning has also made significant progress in UFZ classification by integrating RS imagery with social sensing data and incorporating attention mechanisms. Such methods have achieved breakthroughs in classification accuracy, with recognition accuracies exceeding 93% on the Ningbo dataset [25]. However, these methods often focus primarily on spatial features derived from RS imagery and POI data, neglecting the dynamic relationships between different urban functions, such as the movement patterns between residential, commercial, and public areas. This limitation restricts the ability to model the full complexity of urban functional interactions, particularly in highly dynamic urban settings.
In addition, some studies have proposed a context-aware segmentation network that automatically extracts buildings and road networks from high-resolution RS images to delineate urban functional units and classifies UFZs based on building types [26]. While this method can accurately delineate functional units based on physical structures, it fails to incorporate the temporal or mobility aspects of urban areas, which are crucial for capturing dynamic features such as population flow and daily transitions between zones.
Other research has introduced a unified deep learning framework that combines RS imagery with POI data, optimizing UFZ extraction through a spatial relationship learning network [27]. Although this approach integrates multiple data sources, it still falls short of capturing the complex, dynamic relationships between different functional zones. The approach is limited by its reliance on static data and fails to model the interactions that occur over time or during peak activity periods, thus neglecting essential spatiotemporal dynamics.
While deep learning has significantly advanced UFZ classification, the complexity of UFZs cannot be fully captured by relying solely on a single network. For instance, geoscene modeling uses multi-scale segmentation and hierarchical semantic cognition to depict UFZs [28], but it still struggles to capture the dynamic features of urban zones that evolve over time. Deep coupling models, which rely on knowledge graphs to integrate multi-source semantic knowledge, perform inadequately when handling diverse and temporal data [29]. The UFZ classification method based on the Deepwalk model has improved the modeling capability for homogeneity and structural similarity but lacks the ability to integrate dynamic data or handle multimodal data deeply, limiting its application in complex urban environments [30].
In summary, the major challenges currently faced in UFZ classification can be outlined as follows: First, the data sources used for extracting UFZs are relatively limited, with RS data and POI data being predominantly employed, and the exploration of multi-source data fusion approaches remains narrow. Moreover, the high accuracy in UFZ classification achieved by existing studies often relies on very high-resolution RS imagery. However, acquiring such high-resolution imagery is challenging in practice, which significantly weakens the effectiveness of the extraction process. Second, multi-source data fusion strategies are often quite preliminary, typically relying on simple overlay or rule-driven methods, which fail to fully exploit the complementarity and correlations between different data types. Moreover, these methods have low generalization capabilities and struggle to adapt to the complex data scenarios of different cities. Third, there is insufficient utilization of dynamic data, which restricts the ability to capture temporal variations in UFZs, resulting in a weaker capacity for detailed feature extraction. These issues highlight the necessity of further enhancing the depth of data fusion and feature expression capabilities in UFZ mapping research.
To address the limitations mentioned above, this paper proposes a UFZ extraction method based on the TriNet model. The method utilizes independent branches to extract spatial features from RS imagery, semantic features from POI data, and dynamic spatiotemporal features from OD data, which are then integrated through a feature fusion module to comprehensively combine multi-source data. This approach solves the problem of feature extraction and deep fusion of multi-source heterogeneous data by introducing a multi-branch network framework. By incorporating OD data into the model, in addition to RS and POI data, dynamic features are integrated into the classification model. Compared to existing methods, this framework can capture the latent correlations between multimodal data, handle complex dynamic spatiotemporal relationships, and significantly improve the accuracy and robustness of UFZ classification through end-to-end optimization. In the proposed TriNet method, three independent branch networks extract features from image data, POI data, and OD data, respectively. The method fully explores the complementarity of multi-source data and deeply integrates the extracted features for UFZ mapping. Finally, the effectiveness of the proposed method is validated using a sample dataset generated from OSM data. The experiment was conducted in the main urban area of Chongqing, and the results validated the high performance of the proposed method, the proposed method achieved an accuracy of 84.13%.
To effectively address the shortcomings of current fusion techniques, the TriNet proposed in this paper designs specialized feature extraction modules for different data sources. The main innovations and contributions, from an architectural perspective, are as follows:
- 1.
- Integrating data from multiple sources, including image data, POI data, and OD data, the TriNet model extends traditional methods that primarily rely on image and POI data by exploring the possibility of extracting features from multi-source data to achieve a more comprehensive representation of the multidimensional characteristics of urban functions;
- 2.
- TriNet leverages deep learning techniques to extract high-level features and introduces a three-branch network architecture, which combines the ImgNet branch based on the EfficientNet-B4 model, the POINet branch based on kernel density estimation, and the TrajNet branch built on the Transformer architecture. This design enables the model to uncover nonlinear patterns within complex data and to capture the interactions among features derived from image, POI, and OD data, providing finer feature representations for UFZ classification;
- 3.
- By incorporating OD data, the model explicitly models the movement and dynamic relationships between land parcels. Compared to traditional methods that rely solely on static data, this approach better captures the dynamic features of UFZs, particularly in revealing the interaction patterns between residential, commercial, and commuting areas, offering a more comprehensive spatiotemporal perspective for UFZ delineation.
The structure of this paper is as follows: Section 1 discusses the development of UFZ classification, identifies existing issues in the current research, and introduces the key highlights of the proposed method. Section 2 provides an introduction to the experimental materials and offers a detailed description of the proposed TriNet model architecture. Section 3 presents the UFZ mapping experiment conducted in the central urban area of Chongqing, including ablation experiments and a comparison of the performance of different models. Section 4 examines the model’s performance, the role of each component, its advantages, and the limitations of the study. Finally, the conclusion summarizes the research findings and outlines potential directions for future research.
2. Materials and Methods
2.1. Materials
2.1.1. Study Area and Dataset
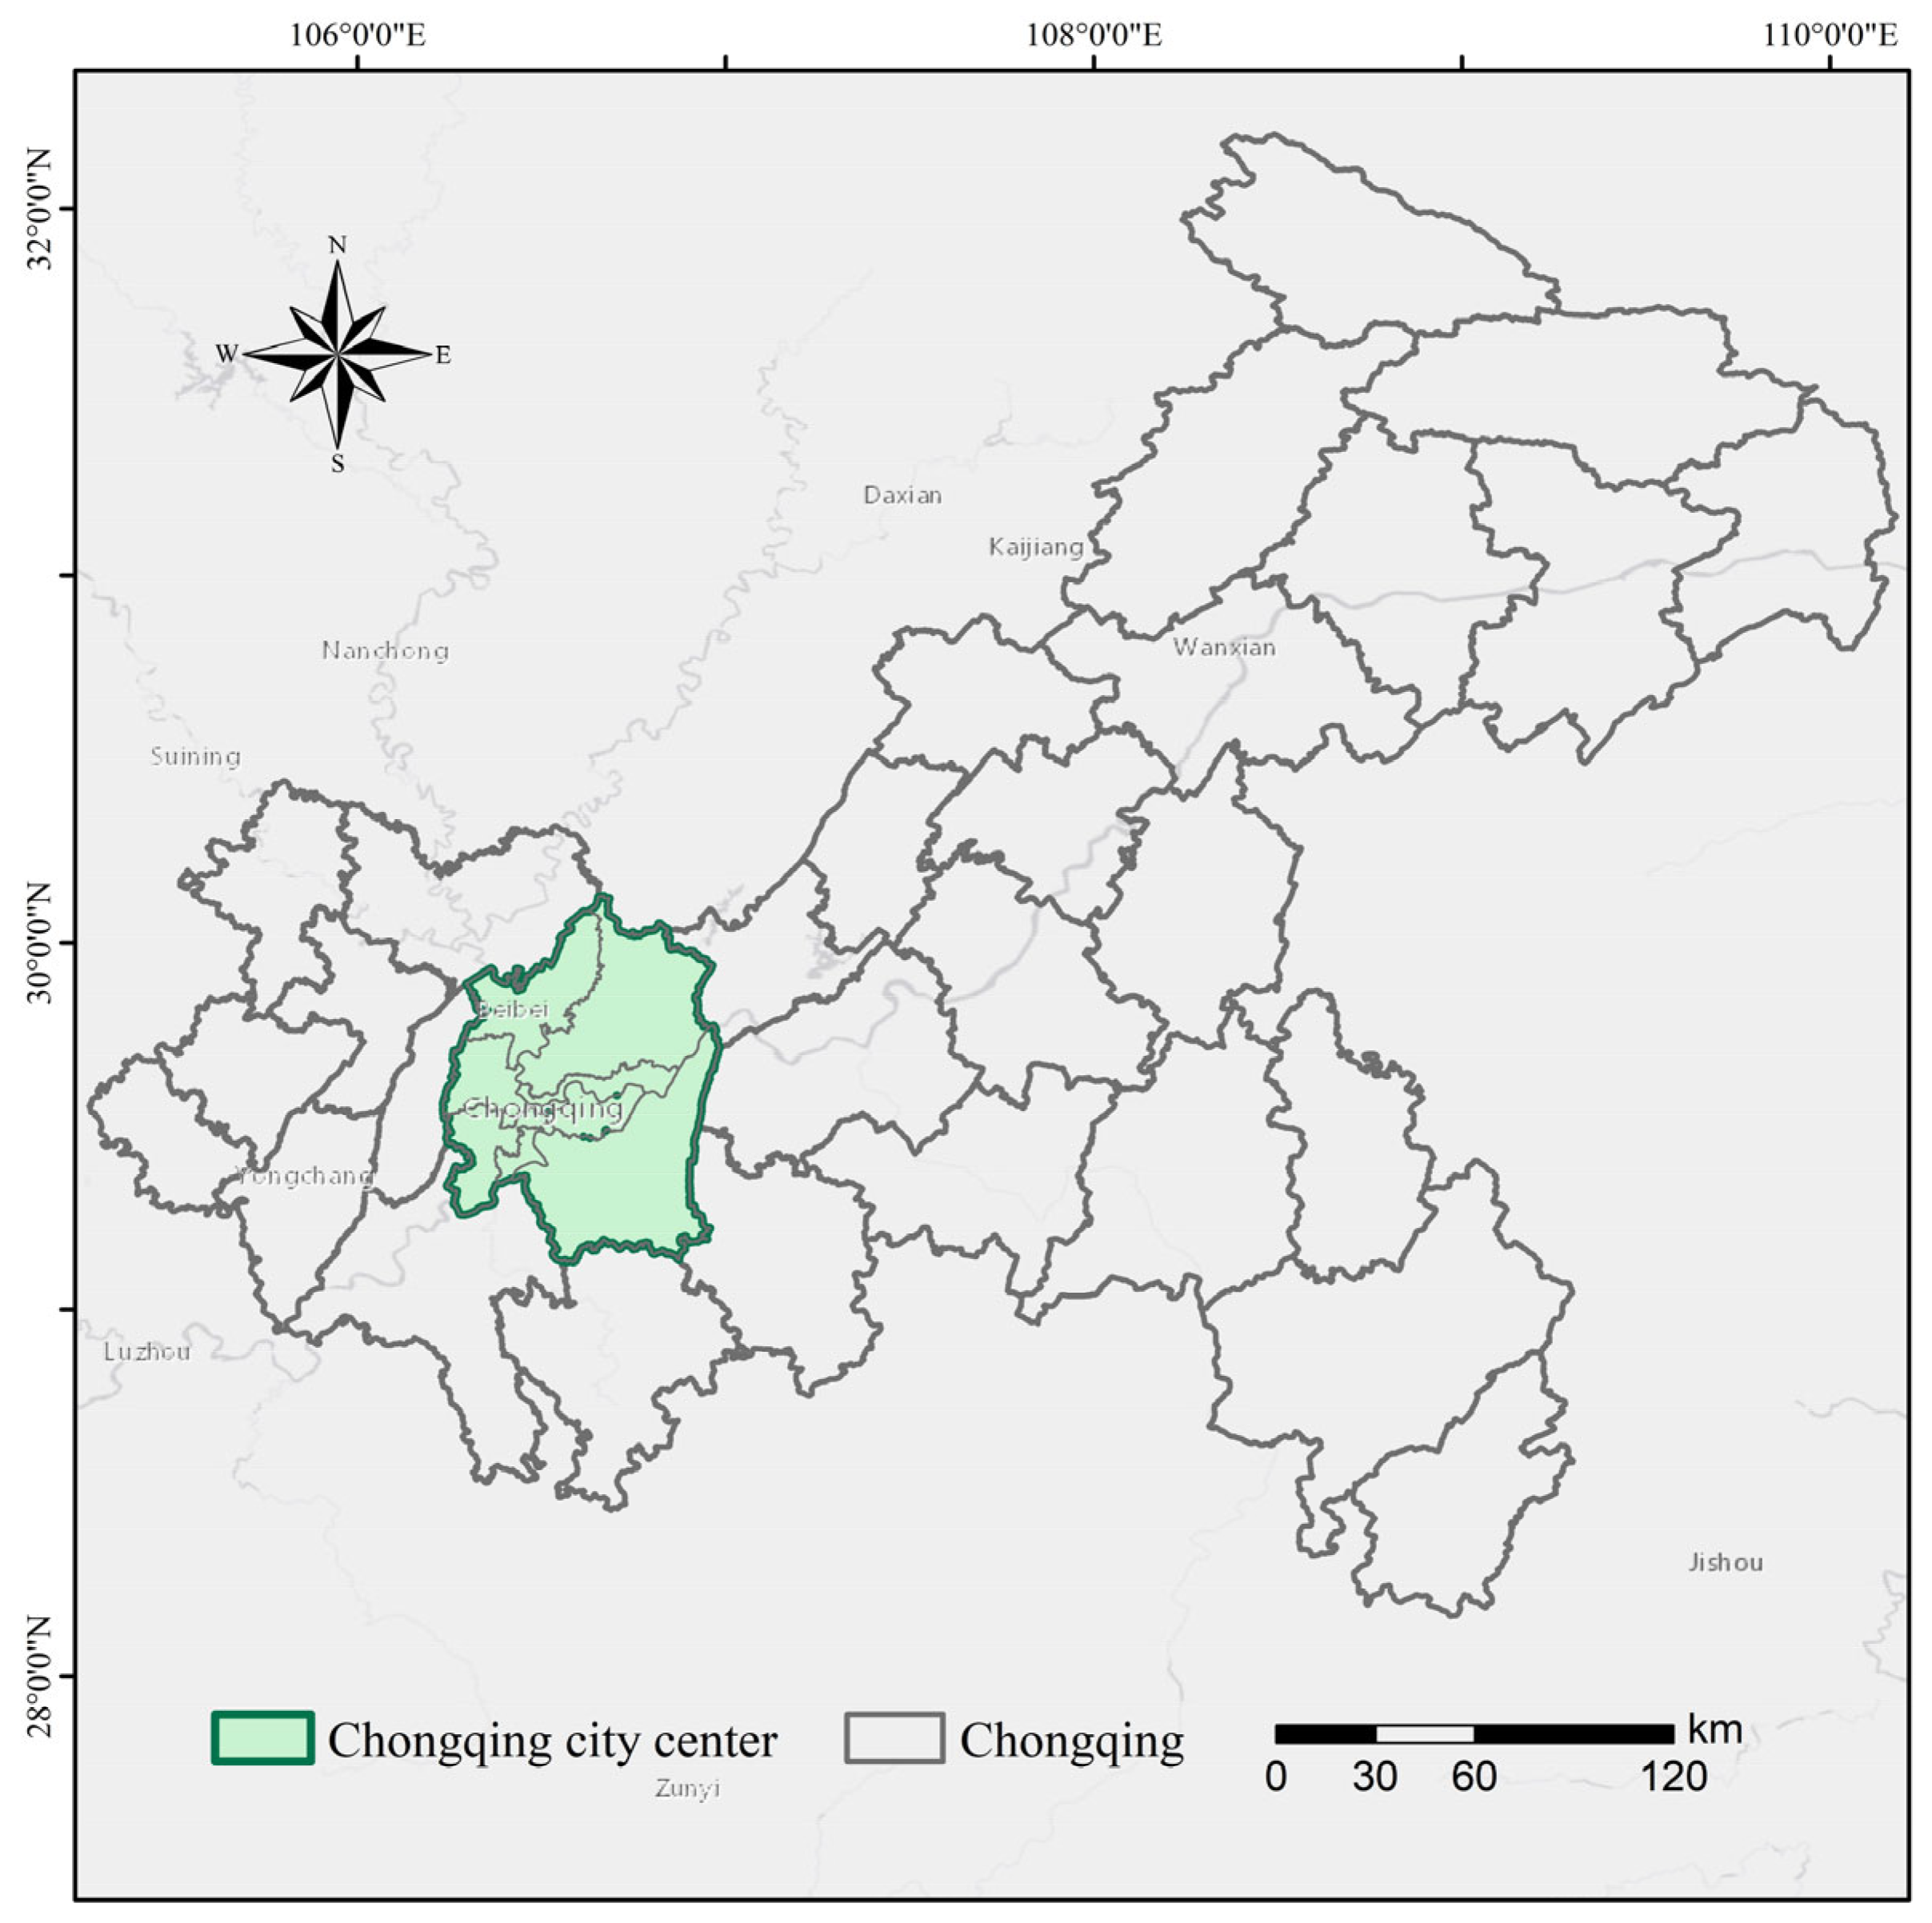
This study uses the central urban area of Chongqing, including Yuzhong District, Dadukou District, Jiangbei District, and seven other districts, as the experimental region for UFZ mapping. As shown in Figure 1, Chongqing is located in the central-western part of the city at the confluence of the Jialing and Yangtze Rivers. The city is a typical mountainous area with diverse functional zones, such as tourism, migration, industry, finance, and trade, contributing to its vitality and development potential.
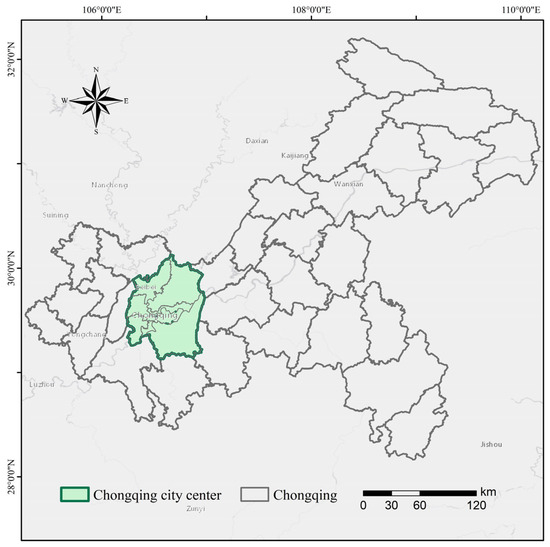
Figure 1.
Study area map.
The UFZ categorization system follows the Classification of Urban and Rural Land Use and Planning Standards of Development Land [31] issued by the Ministry of Housing and Urban-Rural Development of China. It classifies UFZs into four main types: residential, commercial, public service, and industrial zones, as shown in Table 1. This classification reflects the core functions of different urban regions, with residential areas focusing on living needs, commercial areas on economic activities, industrial areas on production, and public service areas on services like education and healthcare. The classification system is clear, practical, and highly versatile, suitable for urban planning research.

Table 1.
UFZ categories and descriptions.
The experiment integrates multiple data sources, including images, POI data, OD data, and OSM land use data, to support UFZ mapping. The combination of these complementary data sources significantly enhances the accuracy, robustness, and multidimensional representation of UFZ classification. A detailed description of each data source is provided below.
- 1.
- Images: The image data includes high-resolution RS imagery, as well as population, GDP, and nighttime light raster data. High-resolution RS imagery provides several advantages, such as fine spatial resolution, extensive coverage, and short acquisition periods, offering detailed and intuitive surface information that is essential for studying urban land use and functional zoning. This imagery allows for precise classification of land features and accurate spatial referencing, thereby enhancing the scientific rigor and accuracy of UFZ delineation. For the experiments in this study, the RS imagery for the central urban area of Chongqing was derived from Sentinel-2 imagery acquired on 26 August 2020, with less than 5% cloud cover and a spatial resolution of 10 m. Additionally, population, GDP, and nighttime light raster data from the same year were incorporated as auxiliary features to train the classification model. The population raster data were obtained from the WorldPop platform, released by Southampton University, with a 100 m resolution, representing the annual total population of China. GDP data are sourced from a publicly available dataset by Professor Zhao et al. [32], as published in their article. Nighttime light data are derived from the DMSP-OLS dataset by Wu et al. [33], which covers China from 1992 to 2023 and continues to be updated. All datasets have been corrected for accuracy and resampled to ensure consistency in both spatial and temporal resolution, aligning with the resolution of the RS data.
- 2.
- POI Data: POI data marks various locations related to human activities, such as restaurants, stores, and banks, and reflects the distribution of social functions, making it useful for creating UFZ maps. In this study, POI data for Chongqing were obtained from Amap (Gaode Maps), which legally collected and publicly released geographical information in 2020. The dataset includes 410,947 valid records with key fields such as name, coordinates, and category. It is a point-based dataset, where each POI represents a specific location (longitude, latitude) of a facility or service. The data covers 19 categories, including business and residential areas, dining services, healthcare, education, transportation, and government agencies, among others. The dataset contains 19 categories: business and residential areas, road ancillary facilities, dining services, vehicle maintenance, motorcycle services, companies and enterprises, shopping services, education, culture, and science, sports and leisure, transportation facilities, finance and insurance, accommodation services, tourist attractions, car sales, government agencies and social organizations, life services, healthcare, public utilities, and car services.
- 3.
- OD Data: OD data, as a dynamic crowd behavior data, plays an important supplementary role in multi-source data-based UFZ extraction research. Compared to static geographic information data such as land use vector data and RS imagery, OD data can reflect the activity patterns of crowds across different temporal and spatial dimensions, capturing the dynamic features of regional functions. This paper primarily utilizes OD data obtained from the processed public transport and subway card swipe data in Chongqing on 5 June 2021. The data are anonymized, with user card IDs omitted, and records the timestamp, departure and arrival coordinates, and mode of transport. The dataset includes approximately 270,000 OD records collected within a 24-h period on 5 June 2021, in Chongqing. The dynamic, continuous nature of OD data, along with its nearly full urban and rural spatial coverage and high possession rate, allows it to effectively reflect the overall spatiotemporal behavior patterns of people, uncovering dynamic urban functional features.
- 4.
- OSM Data: In this experiment, we generate samples based on the application of OSM data in UFZ classification, using 2020 OSM land use polygon vector data. The land use polygon vector data provided by the OSM platform holds significant research value. It contains spatial information on various land uses in the city, such as residential areas, commercial areas, industrial zones, green spaces, etc. In the study of UFZ extraction using multi-source data, OSM land use polygon data provides precise geometric boundaries and basic attribute information for the preliminary classification of functional zones. The decision to utilize OSM land use data was driven by the need to reduce the labor-intensive process of manually selecting sample areas for UFZ classification. While manually selected data offers high accuracy, it is resource-intensive, particularly in large-scale urban studies. OSM data provides a cost-effective alternative, offering readily available, albeit coarse, land use classifications. By using OSM data, we can efficiently generate a large sample dataset that serves as a preliminary classification, enabling the extraction of high-precision UFZs.
2.1.2. Data Preprocessing
The following section describes the data processing procedures for these datasets.
- (1)
- Images data preprocessing
The image data includes high-resolution RS images obtained from Sentinel-2, as well as population, GDP, and nighttime light raster images.
First, the Sentinel-2 high-resolution RS images undergo resampling, band composition, mosaicking, and cropping operations to extract the B2, B3, and B4 bands and generate true-color imagery. The images are then cropped to the study area boundary. Next, the mapped land use vector data from the QGIS platform (version 3.38.1) were used to further crop the RS images, resulting in four types of regions: residential areas, commercial areas, industrial areas, and public service areas.
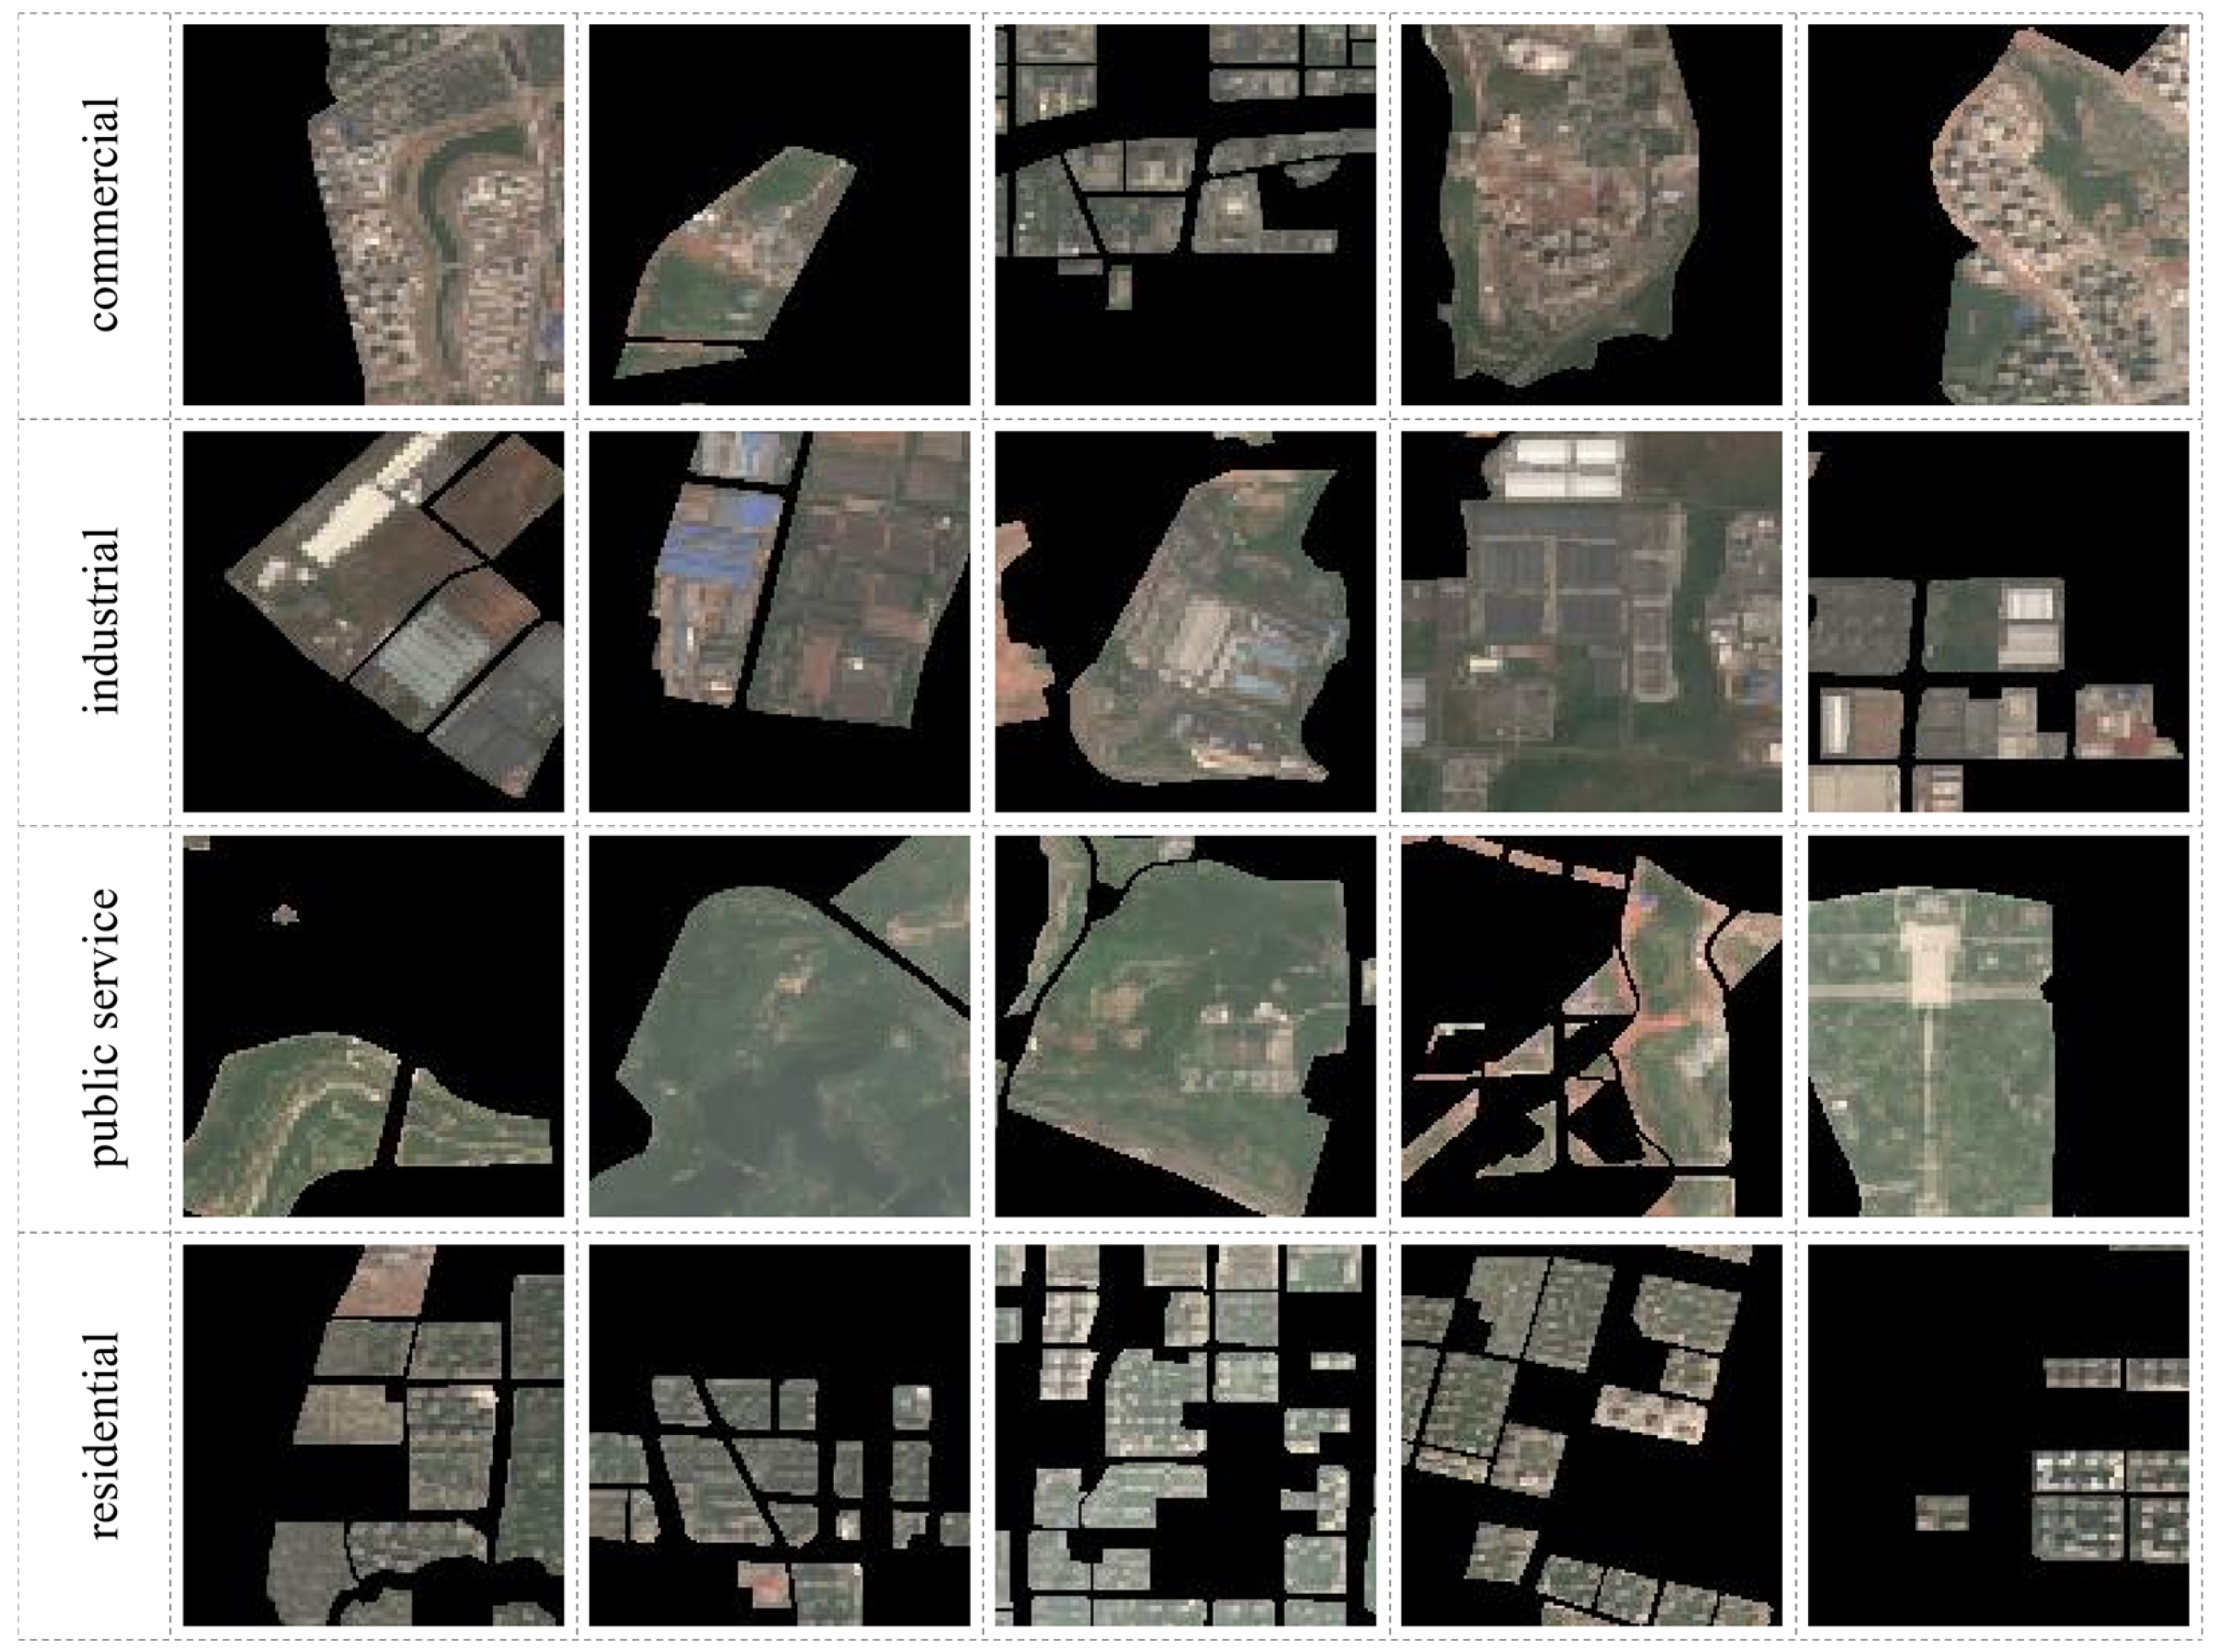
To meet the requirements for model training, the cropped image data were sliced into 128 × 128 pixel image blocks, and a labeled UFZ dataset was generated based on these blocks. Some samples from the UFZ dataset of the central urban area of Chongqing, generated using RS images, are depicted in Figure 2.
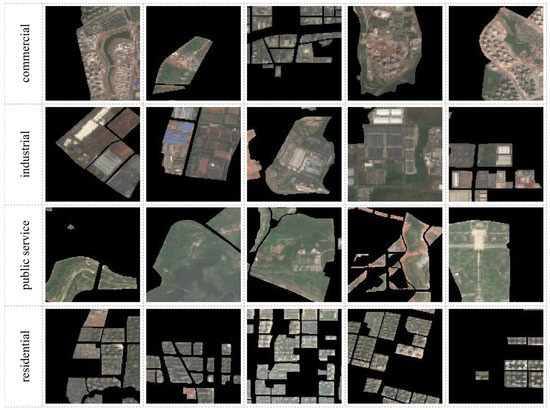
Figure 2.
Samples of UFZ dataset in Chongqing city center. Residential and commercial zones are visually similar, featuring densely clustered buildings. Public service zones are mainly green spaces, depicted in green hues. Industrial zones display richer color variations, encompassing factories and other features like salt pans, which appear as multicolored patches.
In addition to RS image data, the image data required for model training also includes population data, nighttime light data, and GDP data. For these raster data, basic processing such as filling in missing values, unifying the coordinate system, and resampling is performed to ensure that their resolution and coordinates match those of the RS images. This guarantees that the auxiliary features provided by these data can support the enhancement of classification accuracy in subsequent experiments by offering multi-source image data.
- (2)
- POI data preprocessing
The preprocessing of POI data, which is characterized by its static spatial attributes, was conducted through a systematic approach to ensure its analytical validity. Initially, data purification was carried out, where invalid entries were removed via spatial topology validation. Following this, the dataset underwent attribute refinement, where non-essential fields were excluded, retaining only the geolocation coordinates, functional classifications, and time to enhance the dataset’s efficiency. Finally, spatial domain delineation was performed using geospatial analysis tools to extract the relevant POIs within the study area. This process involved unifying the coordinate system and applying boundary-based clipping operations. Through this structured workflow, the spatial accuracy and thematic relevance of the dataset were ensured, making it suitable for subsequent UFZ analysis.
- (3)
- OD data preprocessing
The OD data, which features dynamic spatial attributes, was derived from anonymized smart card transaction records collected from Chongqing’s multimodal public transit network, including both metro and bus systems. After a thorough cleaning and linking process, the data were refined to provide detailed OD information, along with time stamps and travel type classifications. This refined OD dataset captures residents’ travel patterns and facilitates further analysis of urban mobility dynamics.
- (4)
- OSM data preprocessing
After acquiring the OSM data, the primary steps involved are projection unification and conceptual mapping processing to facilitate the subsequent cropping of various types of data within the region. Before conceptual mapping, the validity and topology of the downloaded vector data must be checked to ensure the usability of the data. It is important to note that OSM data have potential limitations, including spatial granularity and regional bias. To address these issues, during the data processing phase, we conducted spatial overlay of the OSM data with RS imagery. This was followed by a rigorous visual interpretation to validate the data. Furthermore, before using the OSM data in the classification process, we ensured that it underwent appropriate preprocessing to improve its reliability.
Preprocessed OSM land use polygon vector data were used as source domain data for conceptual mapping. As shown in Table 2, these data contain 17 land use categories. By defining conceptual mapping rules, these land use categories were converted into target UFZ categories. Specifically, parks, playgrounds, cemeteries, and nature reserves were mapped to public service areas; commercial and retail categories were mapped to commercial areas; residential and industrial categories were mapped to residential areas and industrial areas, respectively. The remaining land use categories were not mapped to any UFZ category. Through this process, the conversion from land use data to UFZ data was completed, and a labeled UFZ dataset was generated.
Table 2.
Conceptual mapping rules of land use to UFZs.
2.2. Methods
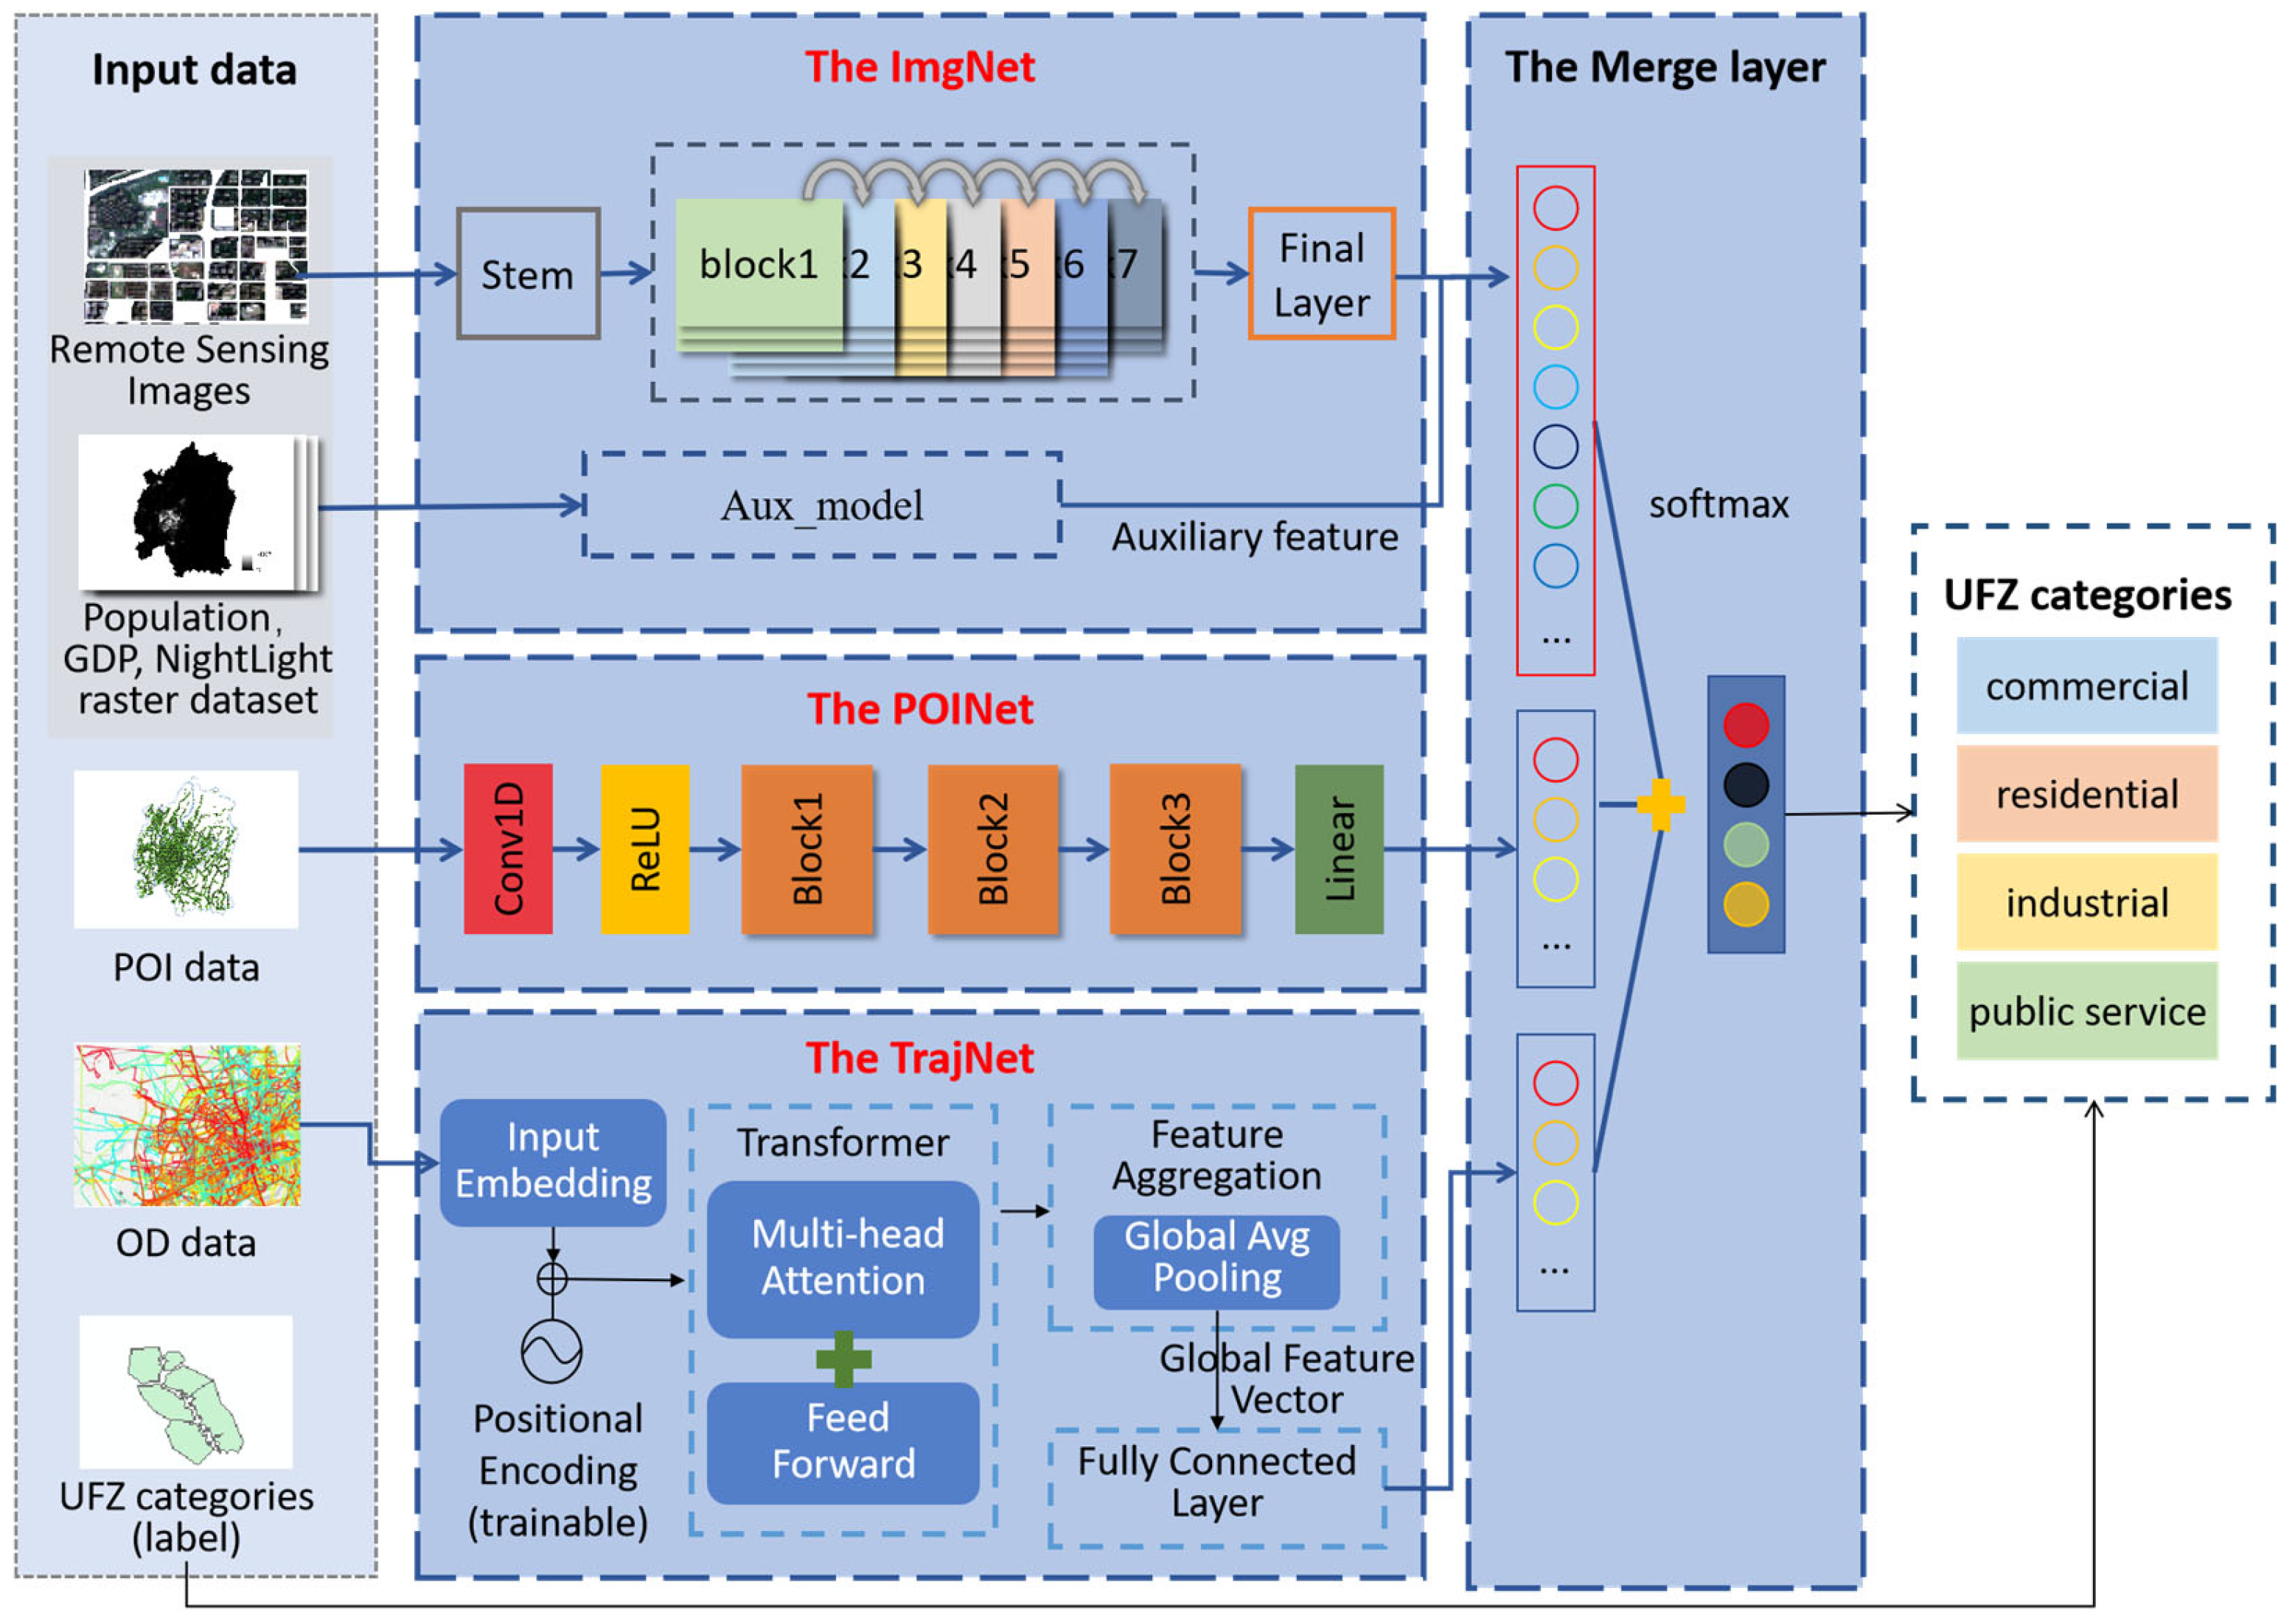
The proposed TriNet framework employed a tripartite neural network architecture designed to process image data, POI data, and OD data independently, enabling precise classification of UFZ categories. The methodological workflow, illustrated in Figure 3, consists of four core components: ImgNet, POINet, TrajNet, and a merge and classification layer.
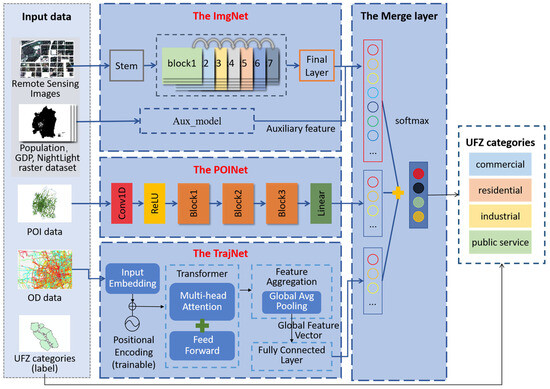
Figure 3.
UFZs identification method architecture. The light blue area represents the data modules, which include the data required for recognition, such as image data, POI data, and OD data. The dark blue area consists of ImgNet, POINet, TrajNet, and the Merge layer, which extract corresponding features and fuse all features, respectively. Finally, the functional zone categories of the land parcels are identified based on the classification labels.
In this approach, diverse data sources were seamlessly integrated to leverage their complementary characteristics. The TriNet architecture incorporates three specialized branch networks: (1) ImgNet extracts spatial features from high-resolution RS imagery and auxiliary raster data such as population density, GDP, and nighttime light intensity; (2) POINet captures semantic and density distribution features of urban functions from POI data; (3) TrajNet models dynamic spatiotemporal patterns from OD data, revealing movement interactions between urban areas. These features, independently extracted by ImgNet, POINet, and TrajNet, were subsequently fused in the merge and classification layer, facilitating a comprehensive multimodal representation and enabling accurate UFZ category prediction.
The UFZ dataset used in this study includes RS imagery annotated with UFZ categories, socioeconomic raster data, POI data reflecting functional distributions, and OD data capturing urban mobility patterns. This diverse dataset supports the evaluation of the proposed TriNet model, demonstrating its effectiveness and robustness in UFZ classification tasks.
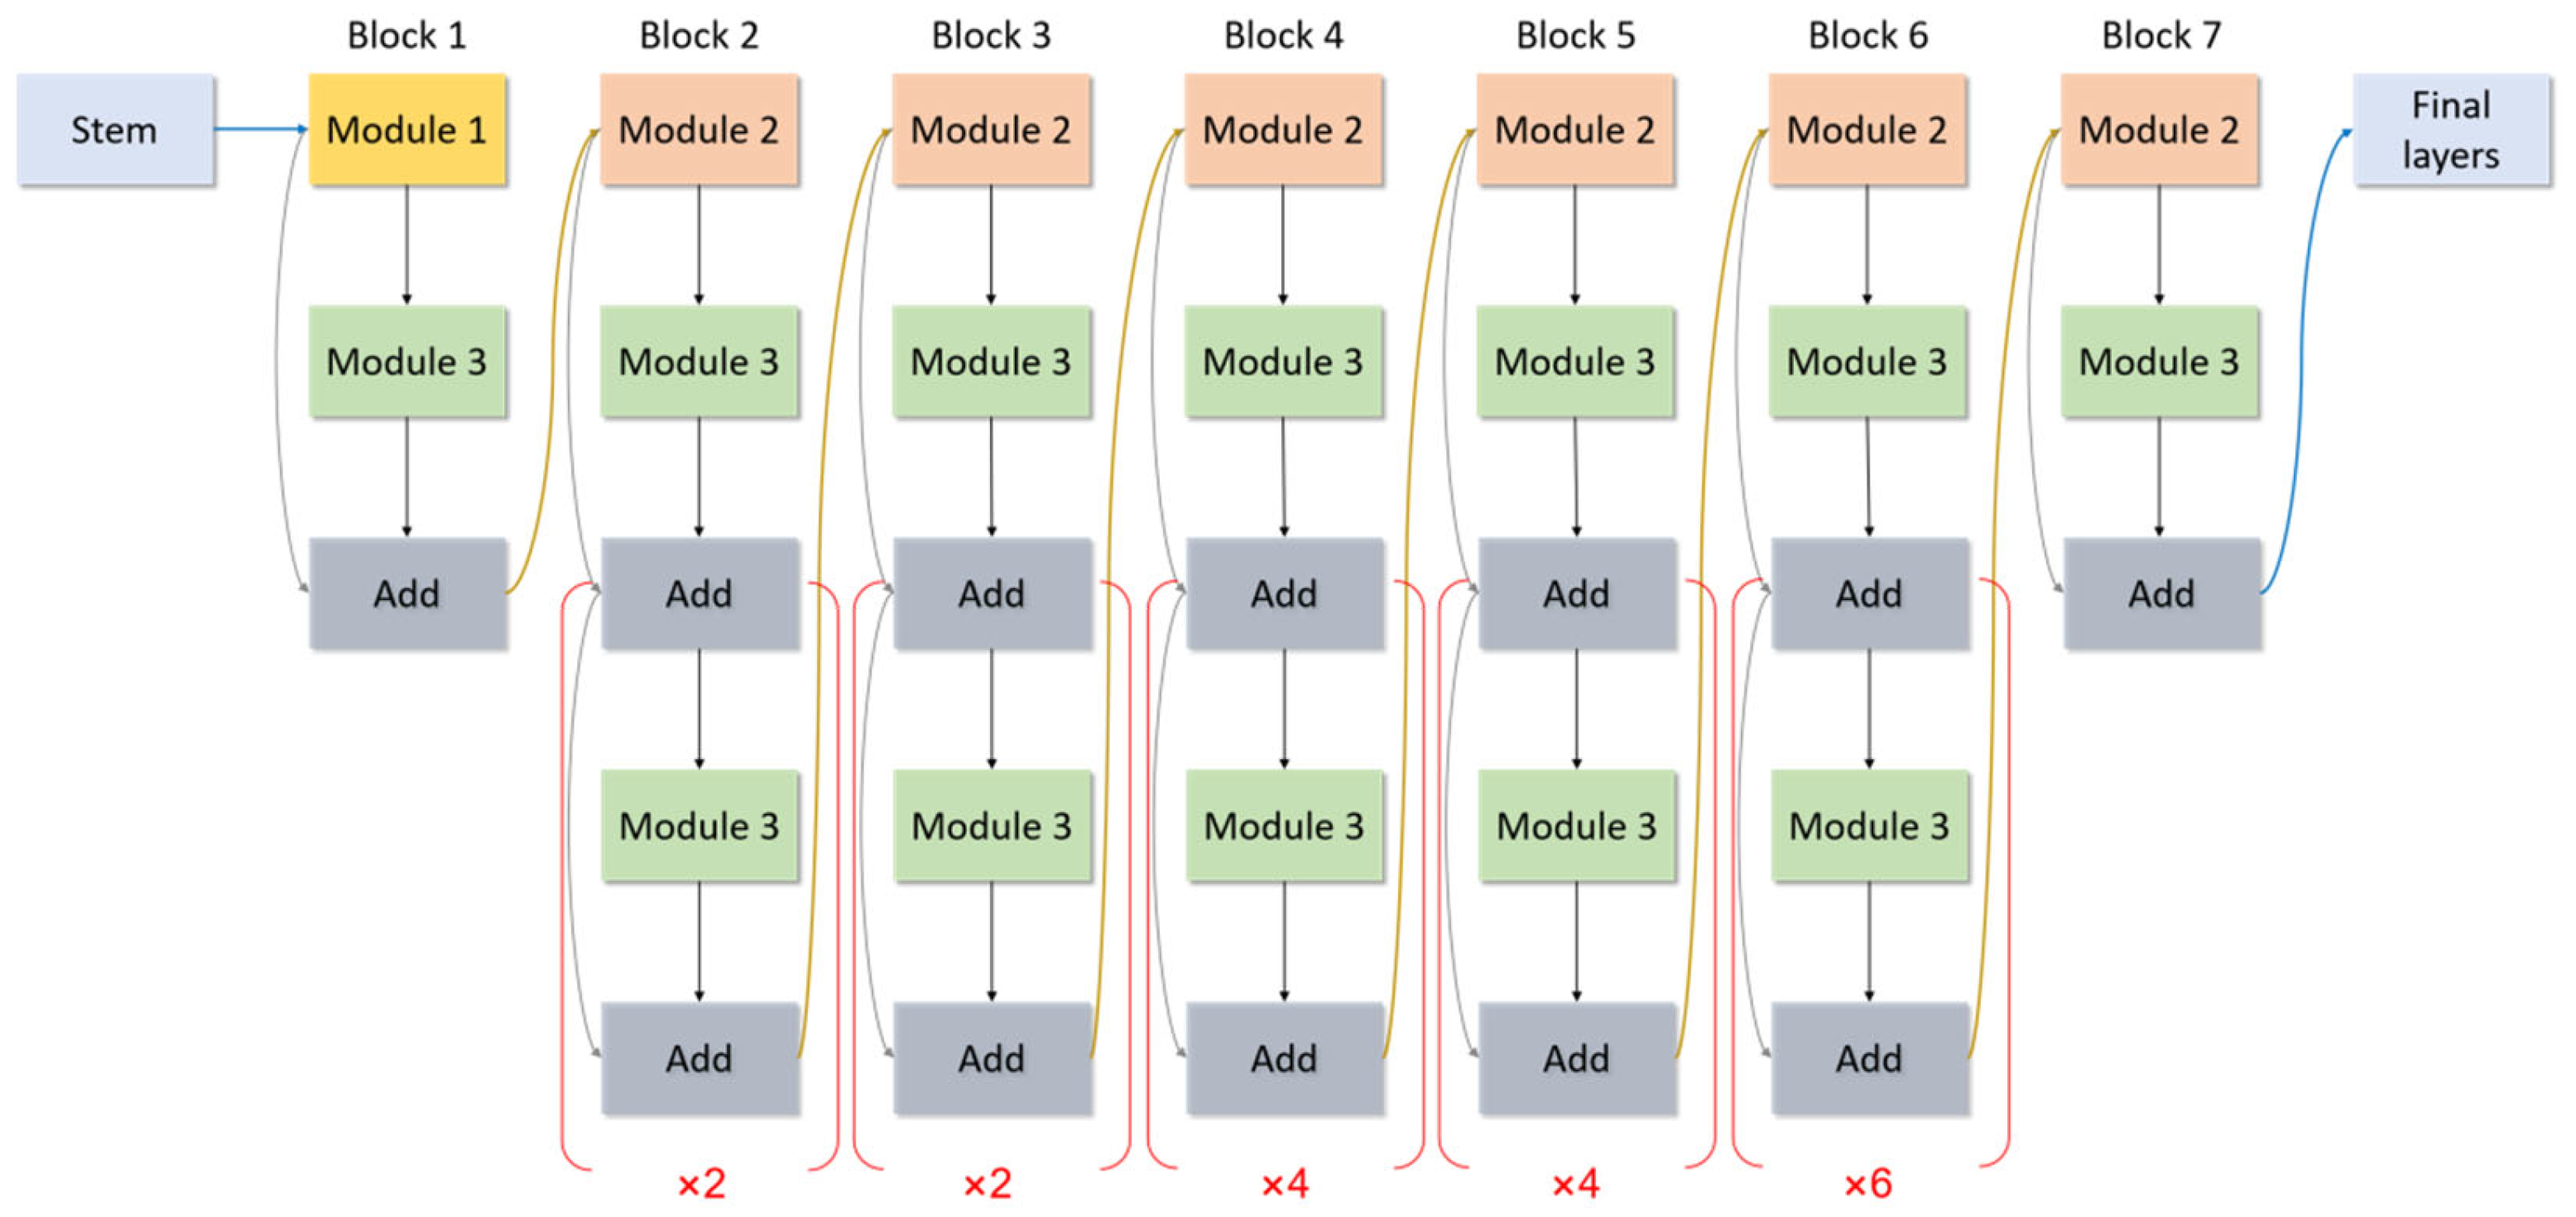
2.2.1. ImgNet: Spatial Feature Extraction from RS Images
The ImgNet contains several submodules, each handling RS image data as well as population, GDP, and nighttime light data, as illustrated in Figure 4 and Figure 5.
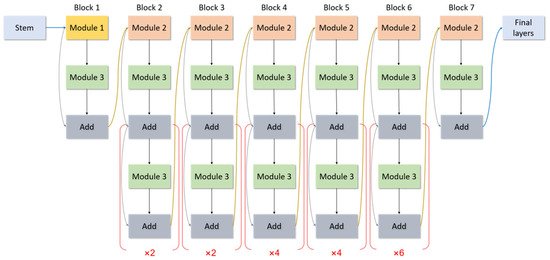
Figure 4.
Feature extraction of RS images in ImgNet.
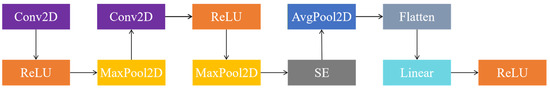
Figure 5.
The auxiliary feature extraction part of ImgNet.
For RS images, the data were input into a pre-trained EfficientNet-B4 model. EfficientNet-B4, introduced by Tan and Le [34], includes an initial convolutional layer (Stem layer) for image preprocessing, followed by multiple MobileInverted Bottleneck (MBConv) modules for feature extraction. Each MBConv module consists of convolution, activation, and batch normalization operations. The network employs a compound scaling strategy to simultaneously adjust the depth, width, and input resolution of the network, optimizing both computational efficiency and performance. The original classification layer is removed, and a linear layer is added on top, mapping the output features to a 512-dimensional feature vector, thereby extracting the deep features of the image.
For population, GDP, and nighttime light data, each type of data was processed through a separate auxiliary module, which was specifically and originally added to complement the image features by extracting additional information from other types of image data. This novel auxiliary processing branch enhanced the model’s capability to capture complementary features from these image-derived data sources, which were integrated to improve classification accuracy. The structure of the auxiliary module includes two convolutional layers. The first convolutional layer is followed by a Rectified Linear Unit (ReLU) activation function and a max pooling layer for initial feature extraction. The second convolutional layer is augmented with an attention mechanism and adaptive average pooling, which further extracts the global representation of the features and flattens them into a one-dimensional vector. The output features are then mapped to a 512-dimensional feature vector through a fully connected layer.
2.2.2. POINet: Semantic Analysis of Urban Functions
POI data were processed through the POINet model to extract POI features. Convolutional Neural Networks (CNNs) have been widely applied to POI data due to their ability to automatically learn hierarchical features and capture complex spatial patterns, making them ideal for functional zone identification [35,36]. As shown in Figure 6, the architecture of POINet includes an initial convolutional layer with a kernel size of 1 × 1, followed by a ReLU activation function for nonlinear transformation of the features.
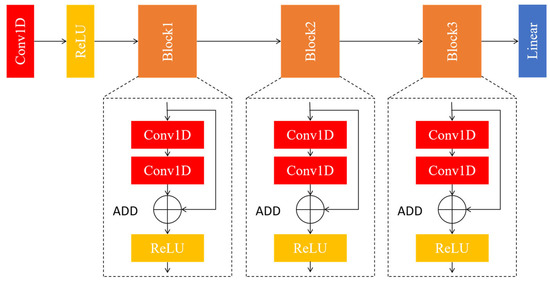
Figure 6.
POINet architecture.
First, the input POI data undergoes standardization, where each POI feature is mapped to a uniform scale, ensuring that the neural network can process these features more efficiently during training. After standardization, the POI data are transformed into a fixed-dimensional feature vector. In the POINet model, POI features are input as a one-dimensional sequence that contains the POI’s category and regional distribution information.
Building upon the two residual modules introduced by Fan [8], our model adds an additional residual module, which helps to extract deeper and more complex POI features, improving the model’s ability to capture intricate patterns in the data. The features are then passed through three residual modules for deep feature extraction. Each residual module contains two 1D convolutional layers, with the first layer having a kernel size of 3 × 3 and the second layer having a kernel size of 1 × 1. A residual connection is used to directly add the input features to the output features. After each residual module, the output is passed through a ReLU activation function before being forwarded to the next module, ultimately extracting higher-level POI features. The convolution operation aims to extract local spatial features from the POI data, and the residual connections help avoid gradient vanishing during training, allowing the model to learn deeper features.
In the VecNet module, the first convolutional layer uses a 1 × 1 kernel, followed by a ReLU activation function. The subsequent two layers, with 3 × 3 and 1 × 1 kernels, help progressively capture the spatial patterns and category information of POI features. By using residual connections, the model benefits from more effective feature learning, avoiding common pitfalls like gradient vanishing and enabling the network to learn more complex features.
After completing the convolution operations, the feature map was flattened into a one-dimensional vector. This flattening process transforms the 2D feature map into a 1D vector, making it compatible with the fully connected layers for further processing. In the fully connected layer, the feature vector is reduced in dimensionality to generate a fixed-length feature vector, with the default output dimension set to 512. This feature vector encapsulates high-level spatial features from the POI data and serves as the output of the POI branch.
Finally, this 512-dimensional POI feature vector is fused with features from other branches (such as those derived from images, population data, GDP, etc.) to complete the final classification task. Through this multimodal feature fusion, the model is able to integrate information from various data sources, improving the accuracy of UFZ classification.
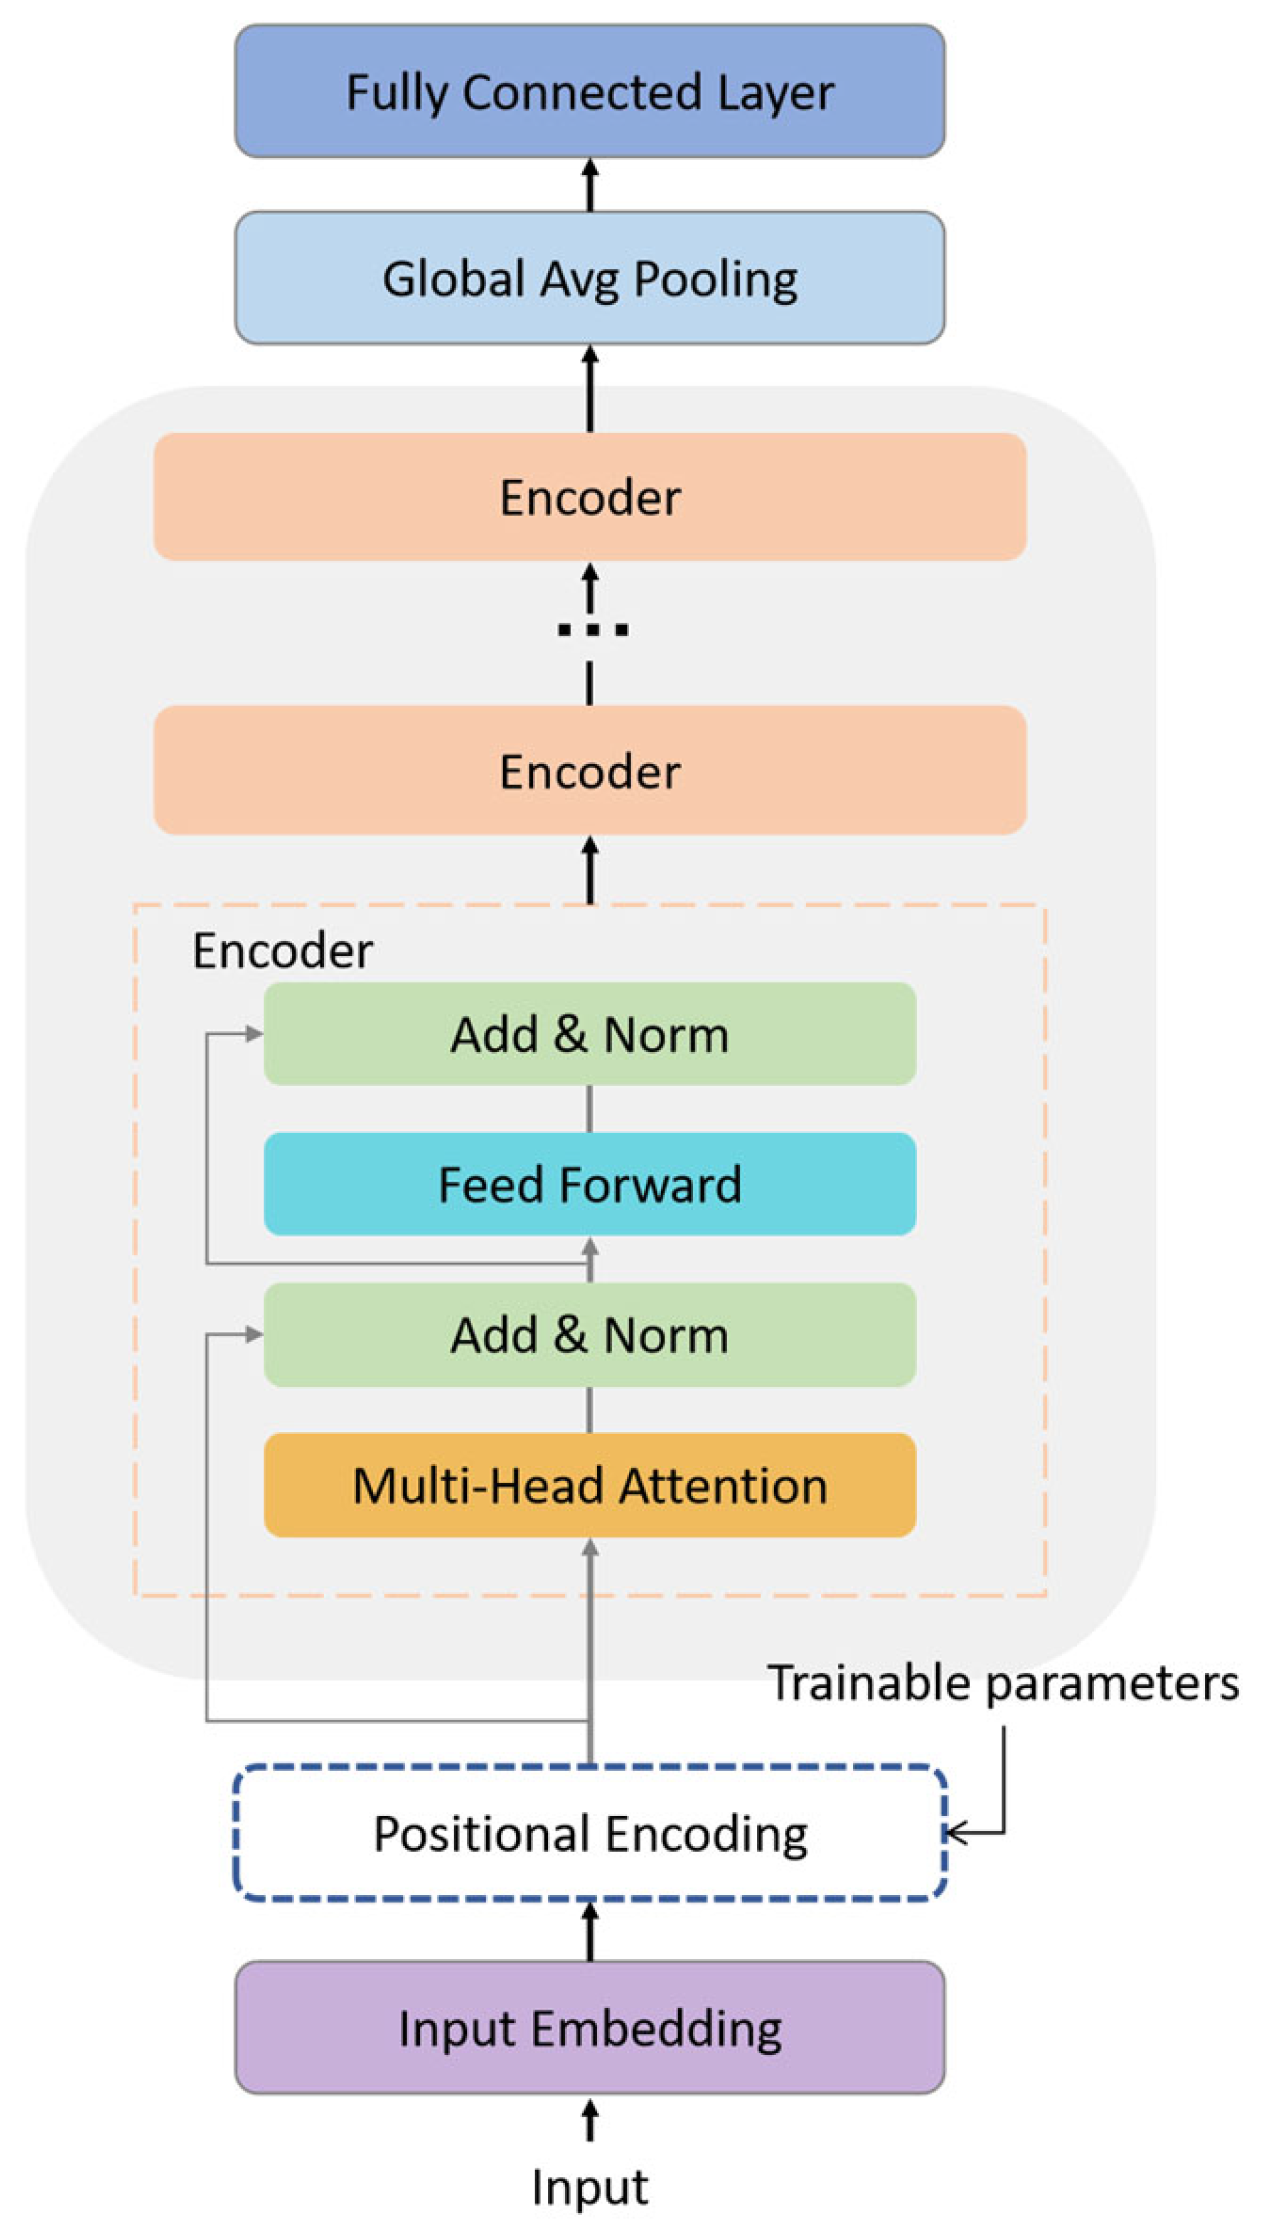
2.2.3. TrajNet: Dynamic Spatiotemporal Modeling from OD Data
The TrajNet is designed to extract spatiotemporal flow features from OD data, which is crucial for capturing temporal dynamics and movement patterns. By adding this trajectory branch, the model addresses a key gap in many studies that overlook these dynamics, thus improving the model’s ability to understand complex spatial interactions and temporal changes in UFZs.
OD data, which tracks the flow of people over time, is processed as a time-ordered sequence capturing spatial movements between locations. Recent research shows that Transformer-based models excel in extracting spatiotemporal features from such sequential data. Their self-attention mechanism captures long-range dependencies and complex temporal patterns, making them particularly suited for analyzing OD data [7].
The feature extraction process of the TrajNet is shown in Figure 7. OD data are first converted into a NumPy array and then passed through a linear embedding layer, where it is mapped into a higher-dimensional embedding space. This embedding layer transforms the input data from its original low-dimensional representation into a higher-dimensional feature space. This transformation helps the model capture more complex patterns and nuances that are not evident in the raw data. The dimensionality of the embedding is determined by the layer’s configuration and is crucial for encoding the temporal dynamics of the data.
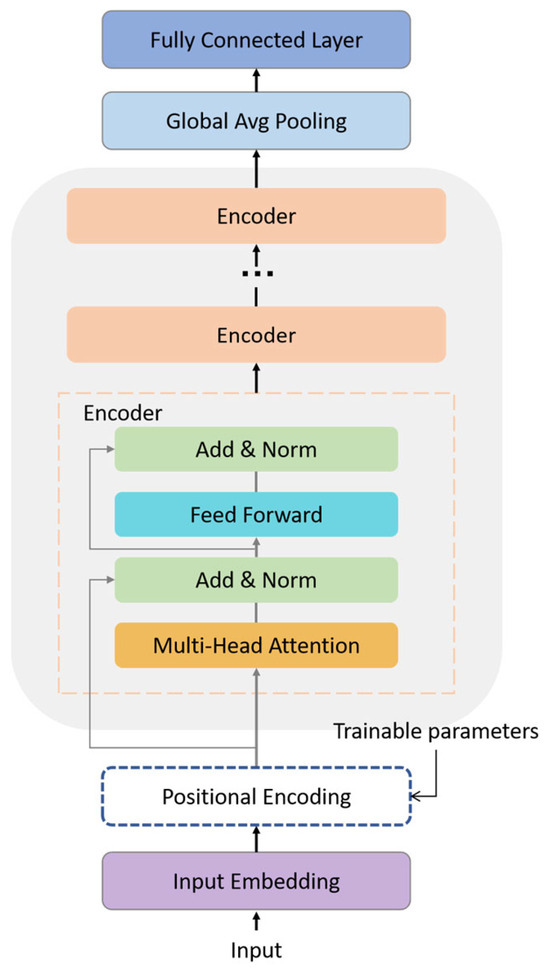
Figure 7.
TrajNet architecture.
After the embedding, positional encodings are added to the data to encode the sequential order of the OD data. This is an essential step because the model needs to understand the position of each data point in the temporal sequence. The positional encodings ensure that the model can track the sequence of movements over time, preserving the temporal relationships and dependencies between the OD data points.
Next, the embedded and encoded OD data were passed into the Transformer encoder, which is the core feature of the extraction process [37]. The Transformer encoder consists of multiple stacked layers, each containing the following:
Multi-head attention mechanisms that enable the model to focus on different parts of the input sequence simultaneously. This allows the model to capture long-range dependencies in the data, such as the movement of people between regions over time.
Feed-forward neural networks that further process the data, enhancing its representational power. These layers allow the model to learn complex, nonlinear relationships within the OD data, which are essential for understanding intricate spatiotemporal patterns.
Each encoder layer in the Transformer performs Add and Norm operations, which apply residual connections and layer normalization. Residual connections allow the input data to bypass the main processing path, which helps prevent issues like vanishing gradients and accelerates convergence during training. Layer normalization is applied to standardize the outputs of each layer, improving the stability of the training process.
After the data have passed through the Transformer encoder layers, the sequence output is pooled using global average pooling. This operation compresses the sequence of data into a single fixed-size vector by averaging over all time steps, capturing the global context of the spatiotemporal flow. This pooled feature vector is then passed through a fully connected layer to produce a 512-dimensional feature vector, which represents the dynamic spatiotemporal flow features extracted from the OD data.
This 512-dimensional feature vector, which encodes the spatiotemporal flow between regions, serves as the output of the OD branch of the model. Through this process, the model leverages the full potential of the dynamic spatiotemporal features in the OD data, addressing the temporal dynamics often overlooked in traditional spatial models and providing a richer, more nuanced understanding of urban function.
2.2.4. Feature Fusion and Classification
The fusion layer connects the feature vectors output by the three networks and integrates them for image recognition and classification. The features from each branch are processed into fixed-length vectors: the image branch outputs 512-dimensional vectors for each image, while the OD and POI branches also output 512-dimensional vectors. These features capture different characteristics: the image branch represents spatial structures and auxiliary data (population, light, GDP), the OD branch captures flow patterns between regions, and the POI branch extracts regional function distribution information.
To integrate these features, the fusion layer concatenates them along the feature dimension into a 3072-dimensional vector, preserving the data representations from all modalities and leveraging their complementary information. The network does not explicitly set modality weights but learns them during training through fully connected layers and feature concatenation, ensuring optimal contribution from each modality.
To reduce redundancy and computational complexity, a two-layer fully connected network is employed to reduce the 3072-dimensional vector to 512 dimensions, applying a ReLU activation function to capture nonlinear relationships. The resulting 512-dimensional feature is passed to the classification module, where it is mapped to the output space through a second fully connected layer. The final output, representing the probability distribution across categories, is obtained through the Softmax activation function, and the category with the highest probability is selected as the model’s prediction.
3. Results
3.1. TribNet Mapping Results
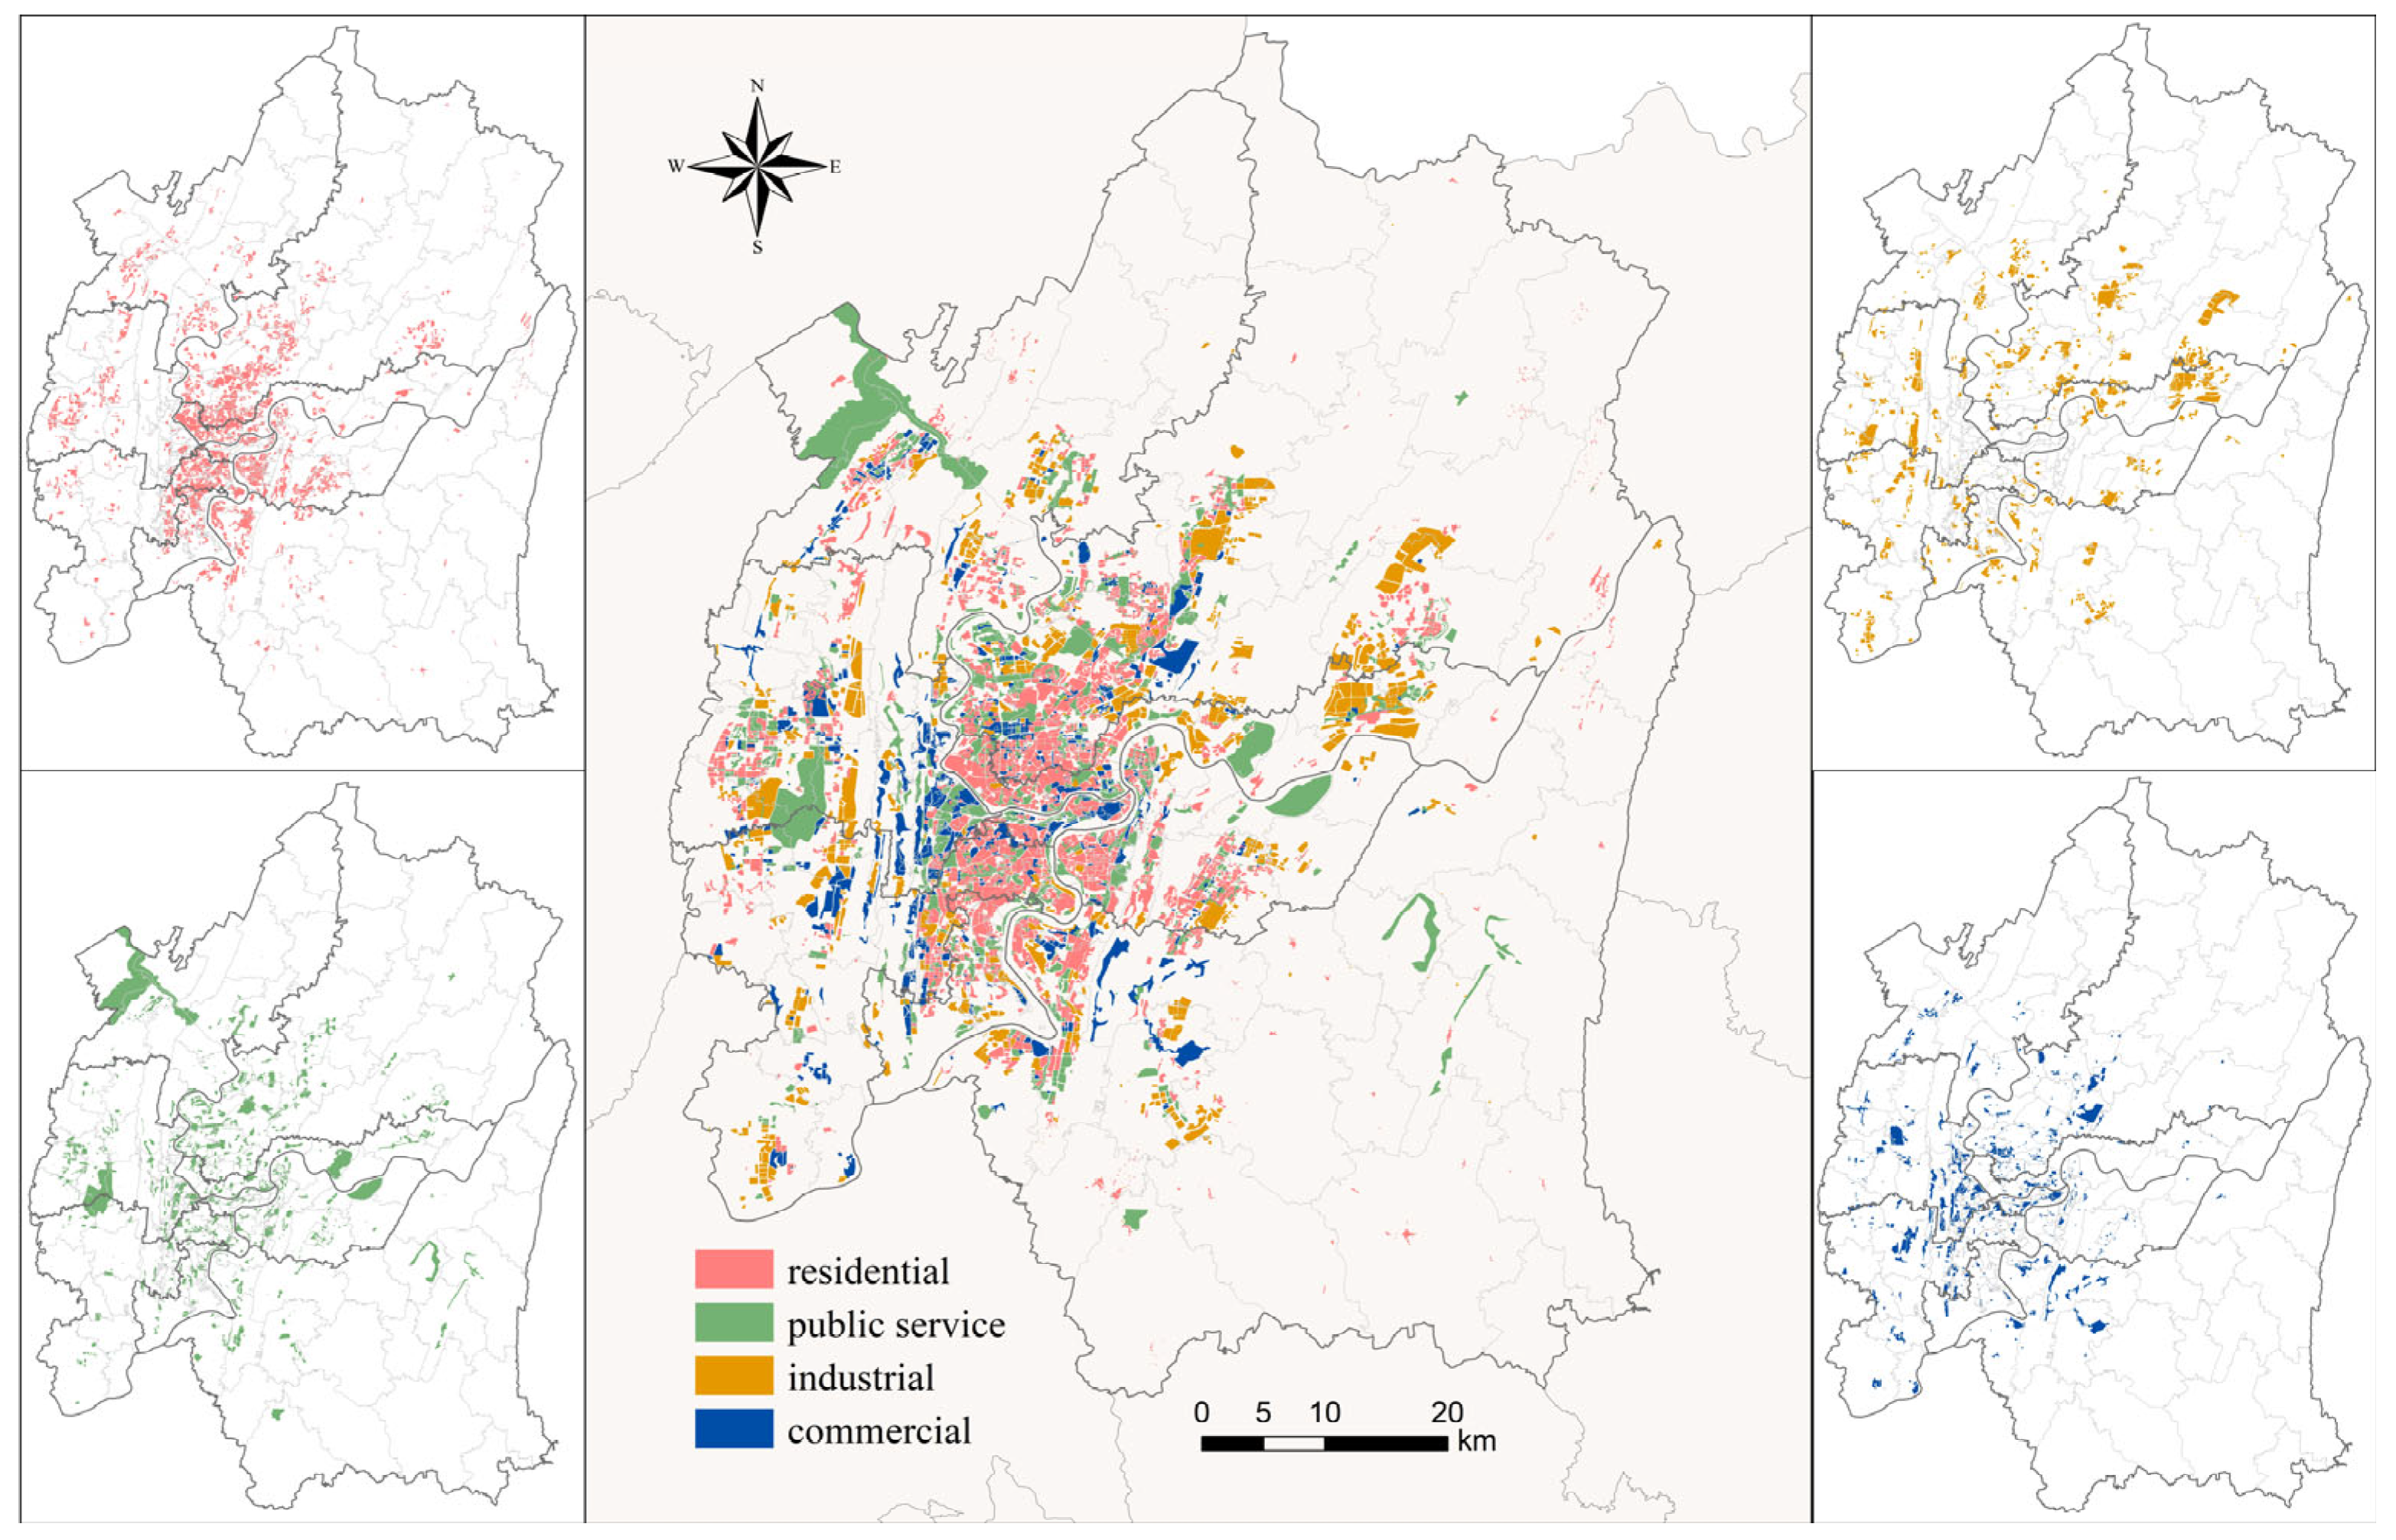
In this experiment, the statistical data of the UFZ dataset generated for the central urban area of Chongqing are shown in Table 3. The dataset used for the experiment contains a total of 2184 samples from the central urban area of Chongqing, which include 820 residential area samples, 307 commercial area samples, 573 public service area samples, and 484 industrial area samples. To evaluate the performance of the proposed model, 80% of the UFZ dataset was randomly sampled as the training set, and 20% was randomly sampled as the test set. The training set consists of 1747 samples, including 656 residential area samples, 246 commercial area samples, 458 public service area samples, and 387 industrial area samples. The test set includes 164 residential area samples, 61 commercial area samples, 115 public service area samples, and 97 industrial area samples. The final UFZ sample dataset is shown in Table 3, and the distribution of the four mapped functional zones is shown in Figure 8.
Table 3.
Statistics from the UFZ dataset.
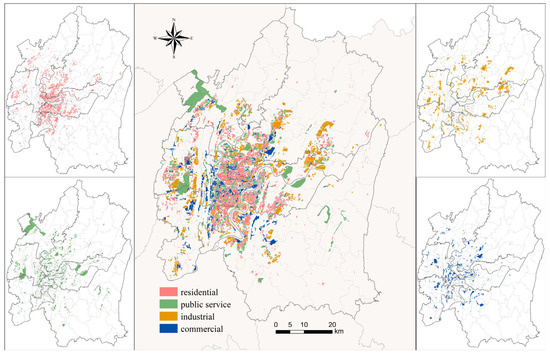
Figure 8.
Distribution of UFZs.
The proposed model utilizes the Adam optimization method with an initial learning rate of 0.001 and a weight decay parameter of 1 × 10⁻⁵ to prevent overfitting. The training process uses a batch size of 16, with a total of 50 epochs. Each epoch takes approximately 100 s to complete, resulting in a total training time of around 83 min. Despite having 21,725,580 parameters, the model is considered moderately large but remains computationally efficient for classification tasks. Modern computational setups can easily handle this parameter count. Additionally, the model exhibits excellent inference performance, processing 2184 images in just 13.03 s. This results in a processing speed of 33.53 images per second, making it well-suited for real-time applications and large-scale data processing.
In terms of classification performance, the TriNet model demonstrates high accuracy in the urban functional zoning task, achieving an overall accuracy (OA) of 84.13% and a Kappa coefficient of 0.779. The Kappa coefficient, which is close to 0.8, reflects a strong consistency between the predicted and true labels, indicating that the model is effective in distinguishing and extracting features relevant to different functional zones.
To further validate the effectiveness of the TriNet classification method, an additional experiment was conducted using OSM road network data. In this experiment, images of the Nan’an District in Chongqing were cropped and classified using the TriNet model to assess the classification of UFZs. The Nan’an District was divided into land parcels of varying sizes based on the road network. After classification with TriNet, non-urban functional land parcels were excluded, leaving 734 urban functional parcels. The parcels, segmented by the road network, were further cropped to match the required input size for the model. This allowed for more precise differentiation of functional zone categories. The results of this experiment, as shown in Figure 9, demonstrate that the TriNet classification method accurately identifies the spatial distribution of UFZs in the Nan’an District of Chongqing. A spatial overlay analysis between the classified parcels and the images further confirms the accuracy of the model’s classification.
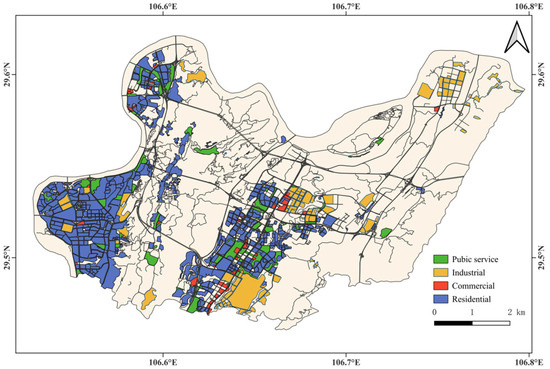
Figure 9.
The spatial distribution map of UFZs in the Nan’an district of Chongqing.
3.2. Classification Results of Other Models
The experiment was conducted from two perspectives. First, an ablation study was performed on the TriNet model to verify whether each branch of the model is indispensable for its overall performance. This allowed us to assess the contribution of each individual component to the accuracy of UFZ classification. Second, the performance of the TriNet model was evaluated by replacing the branches of the model with alternative methods, in order to validate the superiority of each branch in terms of its individual contribution to the classification task.
3.2.1. Ablation Study of the TriNet Multi-Branch Model—Validation of the Irreducibility of Cross-Modal Feature Fusion
This ablation study was conducted using the TriNet multi-branch model to validate the irreducibility of cross-modal feature fusion. The experiment included three variations: (1) combining ImgNet with POINet, (2) combining ImgNet with TrajNet, and (3) combining POINet with TrajNet. These variations were specifically designed to systematically remove each branch network (ImgNet, POINet, and TrajNet) in order to explore the necessity of each component and assess the impact of their absence on the model’s performance, particularly in the context of UFZ classification.
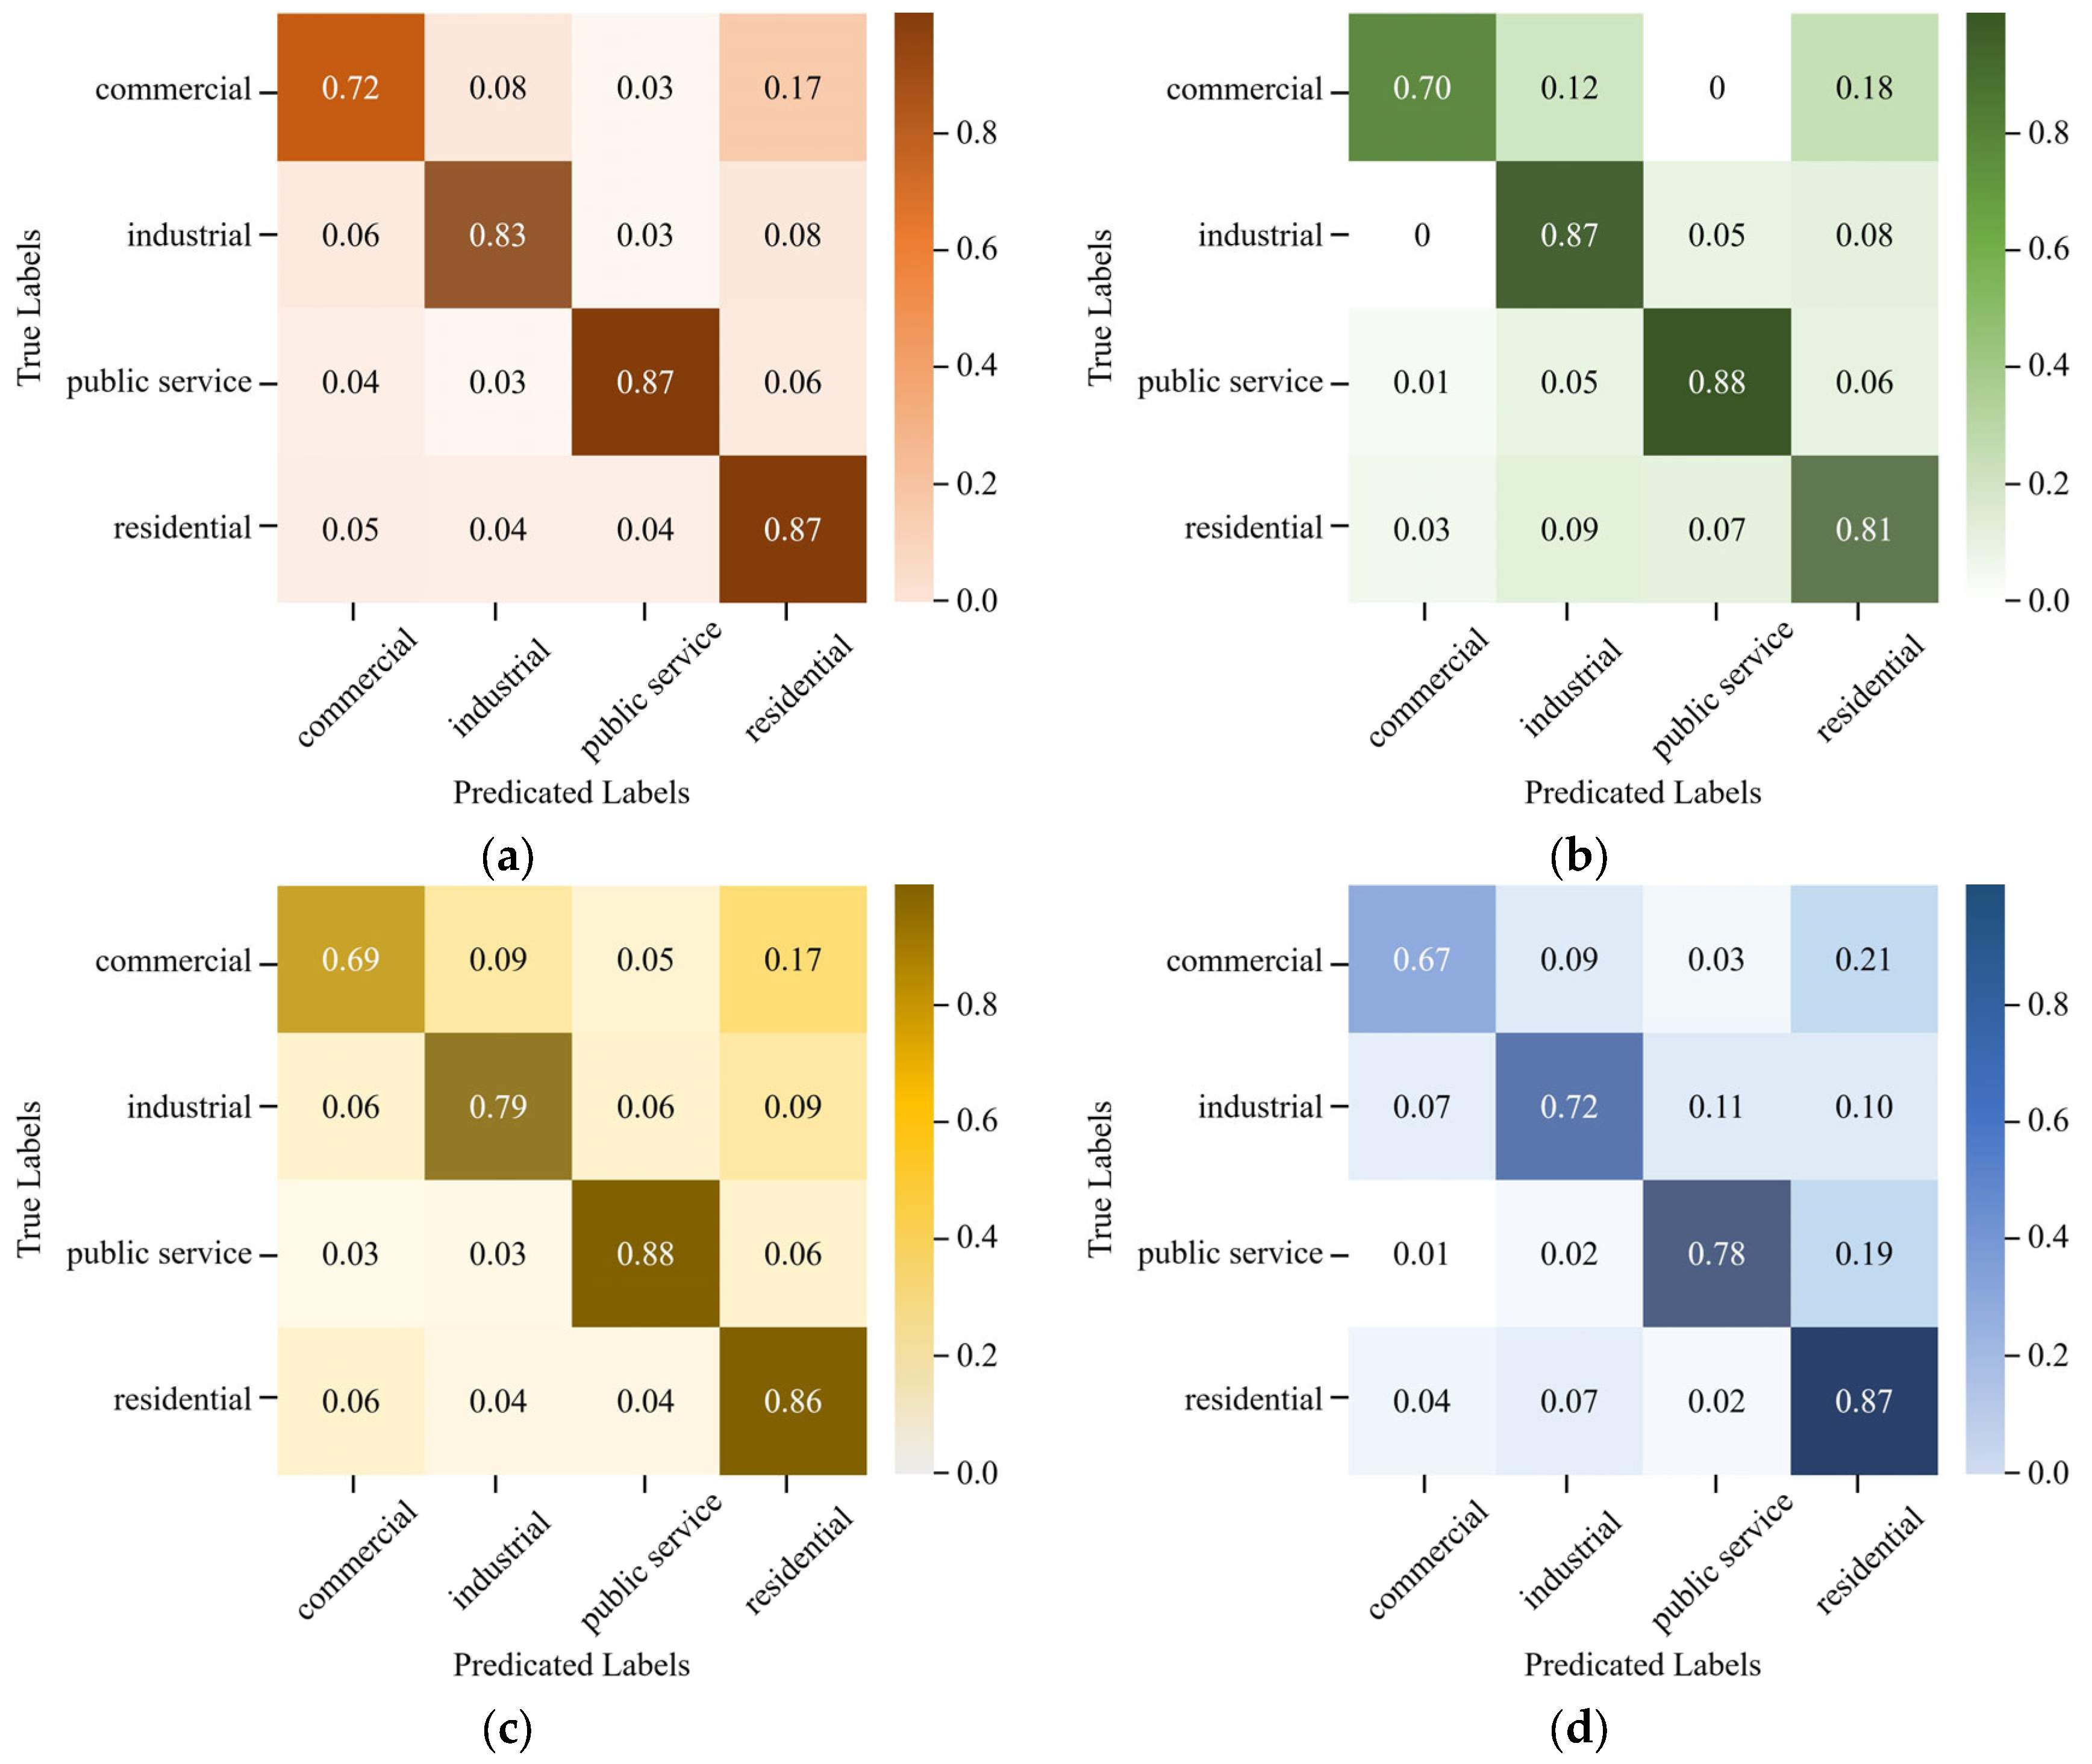
Based on the results of the ablation study, Table 4 and Figure 10 present the overall accuracy (OA), Kappa coefficient, and confusion matrices for four different models. These models include the complete TriNet model (ImgNet, POINet, and OD data) and its three variations: ImgNet and POINet, ImgNet and OD data, and POINet and OD data. These precise data clearly and visually illustrate the impact of removing each branch network on the classification performance of UFZs.
Table 4.
OA and kappa coefficient results of classification models based on different data.
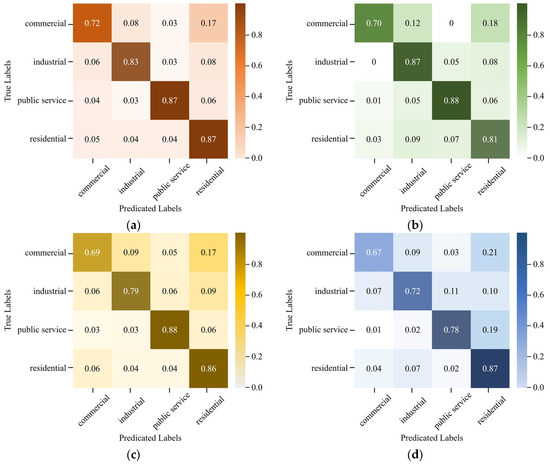
Figure 10.
Confusion matrices. (a) Classification confusion matrix based on the TriNet model; (b) Classification confusion matrix based on ImgNet and POINet; (c) Classification confusion matrix based on ImgNet and TrajNet; (d) Classification confusion matrix based on POINet and TrajNet.
As shown in Table 4 and Figure 10a, the complete TriNet model, which integrates image, POI, and OD data, achieves the highest overall accuracy (OA) of 84.13% and a Kappa coefficient of 0.779, outperforming the other models. The classification accuracy for public service and residential areas is 87%, while industrial zones achieve 83%. The classification accuracy for commercial zones is 72%, which, though lower, is still notable compared to other models. The misclassification rate for all zones is well-controlled, with none exceeding 8%. Notably, 17% of commercial areas are misclassified as residential areas, and 8% of industrial zones as residential areas, suggesting room for improvement. The misclassification of industrial zones as residential areas likely occurs due to feature overlap, particularly building density. Similarly, high spatial similarities in building density, land use, and population distribution, especially in mixed-use areas like Chongqing, increase the likelihood of commercial areas being misclassified as residential. Additionally, the relatively low resolution of the RS images used, which provide limited image detail, contributes to the higher misclassification rate.
After removing the TrajNet branch from the TriNet model, the overall accuracy decreased to 82.61%, with a drop of 1.52%, and the Kappa coefficient reduced to 0.758. As shown in Figure 10b, the classification accuracy for public service areas remains unaffected. However, the classification accuracy for commercial areas drops to 70%, and residential areas even experience a 6 percentage point decrease. OD data provides temporal movement patterns between regions, capturing the dynamic interactions between different functional zones. The absence of OD data weakens the model’s ability to track and capture these temporal interactions, particularly the changing dynamics between commercial and residential areas, leading to more misclassifications. This result not only underscores the irreplaceable role of the TrajNet branch but also highlights the advantage that dynamic features from OD data bring to the classification task. In conclusion, removing TrajNet reduces the model’s overall classification capability, particularly for dynamic areas like commercial and residential zones.
When the TriNet model was modified by removing the POINet branch, the overall accuracy decreased to 82.83%, with a drop of 1.3%, and the Kappa coefficient fell to 0.761. Figure 10c demonstrates the performance of the ImgNet and OD data model, where the accuracy for commercial and industrial zones decreases significantly, dropping to 69% and 79%, respectively. The absence of POI data leads to an increase in the overall misclassification rate, with the misclassification of commercial areas as residential areas remaining at a high rate of 17%. This result suggests that POI data, which provides essential information about the functional characteristics of urban areas, is crucial for distinguishing between zones with overlapping features, such as commercial and residential areas. The lack of POI data makes it harder for the model to differentiate between these zones, particularly in areas where both commercial and residential functions coexist closely. For industrial zones, the absence of POI data contributes to the misclassification of industrial areas as other functional zones, especially in cases where the structural characteristics of these areas resemble those of other zones, but their functions are different. The model may struggle to correctly identify industrial areas as distinct from others without the functional context provided by POI data. Thus, the lack of POI data makes it difficult for the model to capture the functional distinctions between areas with similar physical features but differing urban functions.
When the TriNet model is modified by removing the ImgNet branch, the overall accuracy decreased to 78.49%, with a drop of 5.64%, and the Kappa coefficient fell below 0.7, marking the poorest performance among all results. Figure 10d shows the performance of the POINet and OD data model, where the accuracy for commercial areas drops to 67%, and the classification accuracy for industrial and public service areas also decreases by 11% and 9%, respectively. Clearly, image data are indispensable for the TriNet model. The information provided by image data plays a crucial role in the classification of UFZs. The absence of ImgNet significantly hampers the model’s ability to identify spatial patterns and boundaries, particularly in areas where visual features play a significant role in distinguishing different urban functions. Without the image data, the model struggles to accurately capture spatial differences, leading to a decrease in classification accuracy for all functional zones. The misclassification of industrial zones could be exacerbated, as the model may incorrectly classify industrial areas as commercial zones or residential areas due to their proximity and visual similarities when the image data are not available.
Based on the overall and detailed performance of each model, it is evident that each branch network of the TriNet model plays an indispensable role in achieving optimal classification accuracy. The results of the ablation study clearly demonstrate that removing any of these branches significantly impacts the model’s ability to accurately classify urban areas. The fusion of all three data sources enhances the model’s ability to distinguish UFZs, and the removal of any branch network leads to a noticeable degradation in performance. The misclassification of commercial areas, residential areas, and industrial zones, especially in the absence of TrajNet, POINet, or ImgNet, highlights the challenge of distinguishing overlapping functional areas and suggests areas for further improvement in the model’s ability to handle dynamic features and multi-source data fusion.
3.2.2. Heterogeneous Substitution of TriNet Branches—Validation of the Trade-Off Between Local Optimization and Global Performance
To further validate the effectiveness of the proposed TriNet model, we conducted a comparative experiment with mainstream methods in the field. Specifically, we replaced the image-processing branch (ImgNet) with ResNeXt and EfficientNet-V2 [38], which are advanced convolutional models, and compared their performance with the original TriNet using EfficientNet-B4. The objective was to demonstrate the advantage of using EfficientNet-B4 for RS image classification. Additionally, the POINet and TrajNet components remain unchanged, with POINet utilizing a mainstream CNN model and TrajNet incorporating the Transformer architecture. This experiment aimed to highlight the optimal combination of state-of-the-art models in TriNet for superior classification performance.
From the perspective of overall classification accuracy, the three-branch network model based on EfficientNet-V2 achieves an OA of 80.09%, while the three-branch network model based on ResNeXt has an OA of only 75.86%. Both methods exhibit a significant decrease in classification performance, falling short of the TriNet model, which achieves an OA of 84.13%.
Figure 11b presents the confusion matrix for the three-branch network model based on EfficientNet-V2. Except for the residential area, the classification accuracies for commercial areas, industrial zones, and public service areas all show noticeable declines, particularly the classification of commercial areas, which drops below 60%. Moreover, the probability of misclassifying commercial areas as residential zones rises to 21%, which is the direct cause of the overall decrease in classification accuracy. This decline in performance can be attributed to the relatively lower capability of EfficientNet-V2 in capturing complex spatial patterns compared to EfficientNet-B4. While EfficientNet-V2 is an efficient model, it may not be as well-suited for capturing fine-grained spatial features, especially in urban environments where functional zones exhibit intricate boundaries and overlapping characteristics. The misclassification of commercial areas as residential zones is likely due to the similarities in spatial features, such as building density and infrastructure, that EfficientNet-V2 struggles to differentiate without the finer-grained resolution provided by EfficientNet-B4.
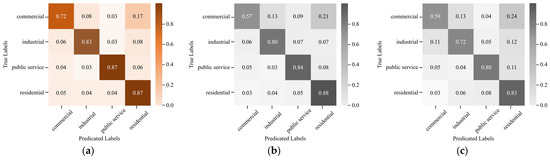
Figure 11.
Confusion matrices of tripartite networks. (a) Confusion matrix of the TriNet classification. (b) Confusion matrix of the tripartite network based on the EfficientNet-V2 network. (c) Confusion matrix of the tripartite network based on the ResNeXt network.
Figure 11c shows the confusion matrix for the three-branch network model based on ResNeXt, where the accuracy for each category also demonstrates a clear decline. The misclassification rate for several categories exceeds 10%, with the probability of misclassifying commercial areas as residential areas increasing to 24%. These results highlight that distinguishing between commercial and residential zones remains the most challenging aspect of the model. The drop in performance when switching to ResNeXt is likely due to the model’s architecture, which may not effectively capture the spatial hierarchies and fine details required for accurate UFZ classification. Although ResNeXt is known for its efficiency and ability to learn from deep architectures, it might not be as optimized for spatial feature extraction in complex urban scenarios compared to EfficientNet-B4. The increased misclassification rate, especially the commercial zones misclassified as residential areas, suggests that ResNeXt may be less capable of distinguishing between these two categories, likely due to the model’s inability to effectively learn the finer spatial and functional distinctions between them.
By comparing the overall and detailed classification metrics for these three models, it is evident that the TriNet model based on EfficientNet-B4 exhibits the best classification performance. This can be attributed to EfficientNet-B4′s superior ability to capture fine spatial features and hierarchical information, which is critical for accurately distinguishing between the overlapping characteristics of UFZs. The model’s ability to extract and integrate both fine spatial and temporal features, combined with its efficiency in handling high-resolution data, gives it an edge over the other models, leading to better overall classification accuracy and fewer misclassifications.
4. Discussion
4.1. Performance of the TriNet Model
The TriNet model demonstrated significant improvements in UFZ classification tasks. As shown in the results, the complete TriNet model (which combines ImgNet, POINet, and TrajNet) outperforms traditional models that rely on single or dual data sources. The model achieved an OA of 84.13%, a Kappa coefficient of 0.779, and an excellent ability to differentiate between complex UFZs.
The TriNet model integrates a combination of image data, POI data, and OD data, which enables the model to better capture the dynamic nature of urban zones and to distinguish between overlapping functional areas. This is especially significant in the classification of commercial and residential areas, where the model outperforms existing methods by distinguishing subtle differences that are often overlooked in simpler models. This success highlights the importance of combining static and dynamic data sources, as well as the ability of TriNet to capture spatiotemporal dynamics in complex urban settings.
4.2. Contribution of Each Branch to Model Performance
TriNet’s success is largely due to its three-branch network architecture, where each branch makes a distinct contribution to feature extraction.
ImgNet (Image Data): The ImgNet branch extracts spatial features from RS images, providing the model with a clear representation of urban layout and infrastructure. This branch is critical for distinguishing functional zones like residential, industrial, and public service areas based on spatial patterns.
POINet (POI Data): The POI data branch captures functional distribution features within the city, such as business, educational, and healthcare services. This branch enhances the model’s capability to classify areas based on their social functions, providing additional insights that image data alone cannot offer.
TrajNet (OD Data): The OD data branch models dynamic spatiotemporal features by capturing the flow patterns between urban zones. This dynamic dimension, which is often neglected by traditional methods, allows the TriNet model to model movement patterns and interactions between functional zones, thus adding an essential layer of temporal data to the classification task.
4.3. Advantages of TriNet over Existing Methods
The TriNet model’s key advantages over existing methods stem from its ability to handle complex urban environments and dynamic changes in UFZs.
Deep Integration of Multi-Source Data: Traditional methods often rely on either RS imagery or POI data, which can fail to capture the dynamic and temporal aspects of urban zones. TriNet’s integration of image, POI, and OD data allows it to better reflect the full complexity of UFZs, improving classification accuracy. Moreover, TriNet’s feature fusion layer effectively combines these diverse data sources, enhancing the model’s ability to uncover latent correlations and spatiotemporal dynamics.
Temporal Dynamics: Existing methods, particularly those using static data, often fail to capture the dynamic interactions between urban zones. TriNet’s incorporation of OD data addresses this gap by modeling movement and interactions between different urban areas. This ability to capture temporal dynamics is especially beneficial in understanding urban functions that evolve over time, such as the interaction between commercial, residential, and transportation zones.
Robustness: The three-branch architecture makes TriNet highly robust in complex urban environments, particularly when dealing with overlapping and multifunctional zones. By leveraging multi-source data, TriNet adapts better to different urban layouts and can accurately distinguish functional zones in cities with varying spatial and dynamic characteristics.
4.4. Limitations and Future Directions
- Limitations of Data Quality
- (1)
- High-Resolution RS Data
The accuracy of the TriNet model is significantly influenced by the quality of the data used. On the one hand, the resolution of RS images can limit the model’s ability to distinguish between functional zones, especially in areas where commercial and residential zones overlap. Low-resolution imagery can lead to unclear boundaries, contributing to misclassifications, particularly in regions with similar spatial characteristics such as building density. To improve classification accuracy, future research should explore incorporating higher-resolution imagery, especially along the borders of overlapping functional zones like commercial and residential areas, to capture fine details more effectively.
- (2)
- Region of Interest (ROI) Data Quality
OSM data, as a type of ROI data, also presents challenges due to spatial granularity and regional biases. Incomplete or outdated spatial labels in certain areas can lead to ambiguous boundaries between functional zones, negatively affecting classification accuracy. Additionally, time inconsistencies, such as delayed updates, can result in outdated or inaccurate classifications. Moreover, the overall quality of the ROI data is crucial, and improving the quality of such data will enhance the reliability of the model. Future research could focus on combining ROI data sources, like OSM, with more precise geographic information and employing data cleaning methods to further improve classification performance, particularly in areas with sparse or outdated data.
- (3)
- Accessibility of OD Data
The free accessibility of OD data is a significant barrier to further model development. The availability of high-quality, diverse OD data from various regions is essential to fully demonstrate the generalization capabilities of the model. Future research will need to address this issue by acquiring OD data from additional regions to enhance the model’s robustness and its ability to perform well across different urban areas.
- 2.
- Computational Complexity
The computational complexity of the three-branch network (ImgNet + POINet + TrajNet) is significantly higher than that of the two-branch combination, with an inference time of 13.03 s (33.53 images/s), 106% longer than the fastest two-branch combination (POINet + TrajNet, 6.33 s/55.03 images/s). This increase is primarily due to the computational bottleneck of the ImgNet backbone (which accounts for 45% of the total time) and the serial execution of the branches. Future research will focus on minimizing this overhead by exploring branch parallelization, which could reduce inference time to 8.93 s (a 48% improvement), and by investigating the use of lightweight backbones to reduce the time overhead of the backbone network.
5. Conclusions
The accurate identification of UFZ is a key foundation for optimizing urban planning, improving resource allocation efficiency, and supporting sustainable development. In this paper, we propose a UFZ mapping method based on TriNet to accurately and effectively identify various types of UFZ. Using a dataset generated from OSM data, TriNet employs a tripartite DNN to comprehensively learn the features of images, POI data, and OD data for UFZ mapping, resulting in further improvements in accuracy.
Based on OSM land use data and conceptual mapping rules, a sample set is quickly generated. The labeled images, POI data, and OD data are then trained through three distinct branches for feature extraction. The experimental area is located in the central urban area of Chongqing, and the OA of the test set for the central urban area of Chongqing reaches 84.13%. The experiment validates the high accuracy of the TriNet-based UFZ mapping method.
Despite these promising results, the study also identifies several areas for improvement. On the one hand, the automatically generated dataset from OSM is not as accurate as manually selected datasets, and the classification accuracy of functional zones depends on the land use classification standards defined by OSM. There are still limitations in the selection and projection of labels, and it is impossible to completely eliminate the manual screening step. On the other hand, the unique topographical structure of the mountainous city results in a high degree of overlap between functional zones. It is necessary to construct multiple urban datasets from different regions and conduct larger-scale data training to improve the generalization ability of the deep learning model.
Author Contributions
Conceptualization, Y.X.; methodology, Y.Z. and Y.X.; software, Y.X.; validation, Y.X.; resources, Y.Z. and J.S.; data curation, Y.X., Z.Z. and J.G.; writing—original draft preparation, Y.X. and J.G.; writing—review and editing, Y.Z. and Y.X.; visualization, Y.X. and Z.Z.; supervision, Y.Z., F.M. and J.S.; project administration, J.S. All authors have read and agreed to the published version of the manuscript.
Funding
This research was funded by the Open Fund of Key Laboratory of Urban Land Resources Monitoring and Simulation, Ministry of Natural Resources (KF-2023-08-22) and the Chongqing Municipal Education Commission Science and Technology Research Key Project (KJZD-K202300707).
Data Availability Statement
UFZ-related experimental data used in this work are available on: (i) the website of European Space Agency (ESA) Copernicus browser https://browser.dataspace.copernicus.eu/ (accessed on 24 December 2024), (ii) the website of OpenStreetMap https://www.openstreetmap.org/ (accessed on 5 November 2024).
Acknowledgments
We would like to sincerely thank all the reviewers for their valuable suggestions and constructive feedback, which greatly improved the quality of this paper.
Conflicts of Interest
The authors declare no conflicts of interest. The funders had no role in the design of the study; in the collection, analyses, or interpretation of data; in the writing of the manuscript; or in the decision to publish the results.
References
- Liu, N. Classification of Urban Functional Zones Based on Multiple Data Sources. E3S Web Conf. 2024, 553, 04004. [Google Scholar] [CrossRef]
- Sun, Z.; Jiao, H.; Wu, H.; Peng, Z.; Liu, L. Block2vec: An approach for identifying urban functional regions by integrating sentence embedding model and points of interest. ISPRS Int. J. Geo-Inf. 2021, 10, 339. [Google Scholar] [CrossRef]
- Liu, S.; Su, L.; Guo, H.; Chen, Y. Identification of Urban Functional Areas and Governance Measures Based on Point of Interest Data: A Case Study of the Shenyang Railway Station Area in Shenyang City. Buildings 2022, 12, 1038. [Google Scholar] [CrossRef]
- Liu, B.; Deng, Y.; Li, M.; Yang, J.; Liu, T. Classification schemes and identification methods for urban functional zone: A Review of Recent Papers. Appl. Sci. 2021, 11, 9968. [Google Scholar] [CrossRef]
- Yin, J.; Dong, J.; Hamm, N.A.; Li, Z.; Wang, J.; Xing, H.; Fu, P. Integrating remote sensing and geospatial big data for urban land use mapping: A review. Int. J. Appl. Earth Obs. Geoinf. 2021, 103, 102514. [Google Scholar] [CrossRef]
- Liu, Z.; Wang, Y.; Zhang, C.; Liu, D. Quantitative Analysis of Spatial Heterogeneity and Driving Forces of the Urban Spatial Structure’s Development Level Based on Multi-Source Big Data: A Case Study of Beijing, China. Land 2023, 12, 1178. [Google Scholar] [CrossRef]
- Wei, B.; Su, G.; Liu, F. Dynamic assessment of spatiotemporal population distribution based on mobile phone data: A Case Study in Xining City, China. Int. J. Disaster Risk Sci. 2023, 14, 649–665. [Google Scholar] [CrossRef]
- Fan, R.; Feng, R.; Han, W.; Wang, L. Urban functional zone mapping with a bibranch neural network via fusing remote sensing and social sensing data. IEEE J. Sel. Top. Appl. Earth Obs. Remote Sens. 2021, 14, 11737–11749. [Google Scholar] [CrossRef]
- Du, S.; Zhang, X.; Lei, Y.; Huang, X.; Tu, W.; Liu, B.; Meng, Q.; Du, S. Mapping urban functional zones with remote sensing and geospatial big data: A systematic review. GIScience Remote Sens. 2024, 61, 2404900. [Google Scholar] [CrossRef]
- Wang, J.; Feng, C.-C.; Guo, Z. A novel graph-based framework for classifying urban functional zones with multisource data and human mobility patterns. Remote Sens. 2023, 15, 730. [Google Scholar] [CrossRef]
- Sanlang, S.; Cao, S.; Du, M.; Mo, Y.; Chen, Q.; He, W. Integrating aerial LiDAR and very-high-resolution images for urban functional zone mapping. Remote Sens. 2021, 13, 2573. [Google Scholar] [CrossRef]
- Li, Y.; Liu, C.; Li, Y. Identification of urban functional areas and their mixing degree using point of interest analyses. Land 2022, 11, 996. [Google Scholar] [CrossRef]
- Liu, B.; Deng, Y.; Li, X.; Li, M.; Jing, W.; Yang, J.; Chen, Z.; Liu, T. Sub-block urban function recognition with the integration of multi-source data. Sensors 2022, 22, 7862. [Google Scholar] [CrossRef]
- Chen, Y.; Yang, J.; Yang, R.; Xiao, X.; Xia, J. Contribution of urban functional zones to the spatial distribution of urban thermal environment. Build. Environ. 2022, 216, 109000. [Google Scholar] [CrossRef]
- Mo, Y.; Guo, Z.; Zhong, R.; Song, W.; Cao, S. Urban Functional Zone Classification Using Light-Detection-and-Ranging Point Clouds, Aerial Images, and Point-of-Interest Data. Remote Sens. 2024, 16, 386. [Google Scholar] [CrossRef]
- Wang, Z.; Ma, D.; Sun, D.; Zhang, J. Identification and analysis of urban functional area in Hangzhou based on OSM and POI data. PLoS ONE 2021, 16, e0251988. [Google Scholar] [CrossRef]
- Jing, C.; Hu, Y.; Zhang, H.; Du, M.; Xu, S.; Guo, X.; Jiang, J. Context-aware matrix factorization for the identification of urban functional regions with POI and taxi OD data. ISPRS Int. J. Geo-Inf. 2022, 11, 351. [Google Scholar] [CrossRef]
- Jing, Y.; Sun, R.; Chen, L. A method for identifying urban functional zones based on landscape types and human activities. Sustainability 2022, 14, 4130. [Google Scholar] [CrossRef]
- Sun, Z.; Li, P.; Wang, D.; Meng, Q.; Sun, Y.; Zhai, W. Recognizing Urban Functional Zones by GF-7 Satellite Stereo Imagery and POI Data. Appl. Sci. 2023, 13, 6300. [Google Scholar] [CrossRef]
- Chang, S.; Wang, Z.; Mao, D.; Liu, F.; Lai, L.; Yu, H. Identifying urban functional areas in China’s Changchun City from Sentinel-2 Images and social sensing data. Remote Sens. 2021, 13, 4512. [Google Scholar] [CrossRef]
- Yan, J.; Feng, P.; Jia, F.; Su, F.; Wang, J.; Wang, N. Identification of secondary functional areas and functional structure analysis based on multisource geographic data. Geocarto Int. 2023, 38, 2191995. [Google Scholar] [CrossRef]
- Huang, C.; Xiao, C.; Rong, L. Integrating point-of-interest density and spatial heterogeneity to identify urban functional areas. Remote Sens. 2022, 14, 4201. [Google Scholar] [CrossRef]
- Wang, J.; Gao, C.; Wang, M.; Zhang, Y. Identification of Urban Functional Areas and Urban Spatial Structure Analysis by Fusing Multi-Source Data Features: A Case Study of Zhengzhou, China. Sustainability 2023, 15, 6505. [Google Scholar] [CrossRef]
- Lu, W.; Qi, J.; Feng, H. Urban functional zone classification based on self-supervised learning: A case study in Beijing, China. Front. Environ. Sci. 2022, 10, 1010630. [Google Scholar] [CrossRef]
- Xie, L.; Feng, X.; Zhang, C.; Dong, Y.; Huang, J.; Liu, K. Identification of urban functional areas based on the multimodal deep learning fusion of high-resolution remote sensing images and Social Perception Data. Buildings 2022, 12, 556. [Google Scholar] [CrossRef]
- Zhao, W.; Li, M.; Wu, C.; Zhou, W.; Chu, G. Identifying urban functional regions from high-resolution satellite images using a context-aware segmentation network. Remote Sens. 2022, 14, 3996. [Google Scholar] [CrossRef]
- Lu, W.; Tao, C.; Li, H.; Qi, J.; Li, Y. A unified deep learning framework for urban functional zone extraction based on multi-source heterogeneous data. Remote Sens. Environ. 2022, 270, 112830. [Google Scholar] [CrossRef]
- Zhang, X.; Du, S. Geoscene Modeling and Analysis for Urban Functional Zones. The International Archives of the Photogrammetry. Remote Sens. Spat. Inf. Sci. 2022, 48, 91–96. [Google Scholar]
- Chen, J.; Peng, S.; Zhang, H.; Lin, S.; Zhao, W. Exploring Urban Functional Zones Based on Multi-Source Semantic Knowledge and Cross Modal Network. The International Archives of the Photogrammetry. Remote Sens. Spat. Inf. Sci. 2023, 48, 1337–1342. [Google Scholar]
- Yang, X.; Bo, S.; Zhang, Z. Classifying Urban Functional Zones Based on Modeling POIs by Deepwalk. Sustainability 2023, 15, 7995. [Google Scholar] [CrossRef]
- GB 50137-2011; Classification of Urban and Rural Land Use and Planning Standards of Development Land. China Architecture & Building Press: Beijing, China, 2011.
- Zhao, N.; Liu, Y.; Cao, G.; Samson, E.L.; Zhang, J. Forecasting China’s GDP at the pixel level using nighttime lights time series and population images. GIScience Remote Sens. 2017, 54, 407–425. [Google Scholar] [CrossRef]
- Wu, Y.; Shi, K.; Chen, Z.; Liu, S.; Chang, Z. Developing improved time-series DMSP-OLS-like data (1992–2019) in China by integrating DMSP-OLS and SNPP-VIIRS. IEEE Trans. Geosci. Remote Sens. 2021, 60, 1–14. [Google Scholar] [CrossRef]
- Tan, M.; Le, Q.V. EfficientNet: Rethinking Model Scaling for Convolutional Neural Networks. In Proceedings of the 36th International Conference on Machine Learning, Long Beach, CA, USA, 9–15 June 2019. [Google Scholar]
- Li, P.; Liu, J.; Luo, A.; Wang, Y.; Zhu, J.; Xu, S. Deep learning method for Chinese multisource point of interest matching. Comput. Environ. Urban Syst. 2022, 96, 101821. [Google Scholar] [CrossRef]
- Alonso, F.D.; Lozano, F.J.; García-Ordás, M.T. Convolutional neural networks for accurate identification of mining remains from UAV-derived images. Appl. Intell. 2023, 53, 30469–30481. [Google Scholar] [CrossRef]
- Lan, W.; He, G.; Liu, M.; Chen, Q.; Cao, J.; Peng, W. Transformer-based single-cell language model: A survey. Big Data Min. Anal. 2024, 7, 1169–1186. [Google Scholar] [CrossRef]
- Wang, Z.; Liang, Y.; He, Y.; Cui, Y.; Zhang, X. Refined Land Use Classification for Urban Core Area from Remote Sensing Imagery by the EfficientNetV2 Model. Appl. Sci. 2024, 14, 7235. [Google Scholar] [CrossRef]


Disclaimer/Publisher’s Note: The statements, opinions and data contained in all publications are solely those of the individual author(s) and contributor(s) and not of MDPI and/or the editor(s). MDPI and/or the editor(s) disclaim responsibility for any injury to people or property resulting from any ideas, methods, instructions or products referred to in the content. |
© 2025 by the authors. Licensee MDPI, Basel, Switzerland. This article is an open access article distributed under the terms and conditions of the Creative Commons Attribution (CC BY) license (https://creativecommons.org/licenses/by/4.0/).