Technical Note

Asymmetric Response of Vegetation Greening near Tropic of Cancer in China to El Niño/Southern Oscillation

1
Southern Marine Science and Engineering Guangdong Laboratory (Zhuhai), School of Atmospheric Sciences, Sun Yat-sen University, Zhuhai 519082, China
2
Key Laboratory of Guangdong for Utilization of Remote Sensing and Geographical Information System, Guangdong Open Laboratory of Geospatial Information Technology and Application, Guangdong Engineering Technology Research Center of Remote Sensing Big Data Application, Guangzhou Institute of Geography, Guangdong Academy of Sciences, Guangzhou 510070, China
3
Joint Laboratory on Low-Carbon Digital Monitoring, Guangdong Institute of Carbon Neutrality (Shaoguan), Shaoguan ShenBay Low Carbon Digital Technology Co., Ltd., Shaoguan 512029, China
*
Author to whom correspondence should be addressed.
Remote Sens. 2025, 17(6), 977; https://doi.org/10.3390/rs17060977
Submission received: 13 December 2024 / Revised: 23 February 2025 / Accepted: 28 February 2025 / Published: 10 March 2025

Abstract

:
El Niño/Southern Oscillation (ENSO) consistently modulates climate patterns in terrestrial ecosystems, triggering vegetation greening or browning. Although vegetation dynamics in the tropics during ENSO has been widely reported, the response of vegetation greening in the near-tropics to ENSO remains uncertain. Here, we explored vegetation greening near the Tropic of Cancer in China (TCC) during three sustained ENSO events during 2001–2018 based on long-term MODIS satellite Leaf Area Index (LAI) products (i.e., MOD15A2H). The results revealed a pronounced asymmetry in vegetation greening responses to ENSO near the TCC. Specifically, vegetation browning during strong La Niña (i.e., LAI anomalies about −0.15) is twice as high as vegetation greening during strong El Niño (i.e., LAI anomalies about +0.05). In La Niña, vegetation browning was accompanied by negative surface air temperature and precipitation anomalies, while in El Niño, vegetation greening was dominated by a positive anomaly in precipitation. This study emphasizes the distinct impact of ENSO on vegetation greening in the near-tropics, providing important insights into the response of vegetation dynamics to climate extremes under a warming world.

1. Introduction

El Niño/Southern Oscillation (ENSO) is the most significant interannual climate signal due to the intensive interactions between the tropical Pacific Ocean and the atmosphere [1,2]. Its cycle generally contains a warm phase, El Niño, a cold phase, La Niña, and a neutral phase [3]. Under climate change, ENSO events are becoming more frequent and intensive, driving shifts in extreme weather [4,5] and terrestrial vegetation [6,7]. Understanding the impacts of ENSO on terrestrial vegetation is crucial for predicting future carbon sequestration potential and ecosystem resilience in the face of climate change, as vegetation plays a vital role in the global carbon cycle and climate regulation.
The impact of ENSO on terrestrial vegetation has been widely investigated [8,9,10]. For instance, long-term satellite monitoring suggests that tropical aboveground carbon stocks failed to recover following the strong 2015/16 El Niño [11]. This is supported by the work of Fan et al. [12], who found that non-woody vegetation is the key to aboveground carbon recovery in the tropics. Recent studies have shown that ENSO events influence vegetation by modulating the terrestrial temperature, precipitation, solar radiation, and soil moisture [13,14]. For example, strong El Niño-driven compound drought and heat waves events lead to severe vegetation decline in Southern Africa [15]. In addition, ENSO events show asymmetric effects (i.e., greenness decline caused by La Niña is higher than vegetation greening promoted by El Niño) on forest greenness in the Amazonian humid tropics [16]. ENSO modulates the atmospheric circulation of the tropics directly and explicitly and extends this effect globally through teleconnections [17,18]. However, it is unclear whether the ENSO–vegetation greening relationships observed in the tropics extend to applied to the near-tropics [19].
The intensive El Niño, such as the 2015/16 El Niño, caused significant teleconnections and modulated the near-tropics [17,20,21]. Zhao et al. pointed out that although China is not a core region affected by ENSO events, high-intensity ENSO events can still have an impact on vegetation dynamics [22]. The role of ENSO events on vegetation in near-tropical regions is essential to comprehensively understanding terrestrial ecosystems’ vegetation dynamics and the carbon cycle under a changing climate [23]. The near-tropical regions, particularly those near the Tropic of Cancer, represent a critical transition zone between tropical and temperate ecosystems, making them particularly sensitive to climate variations and an ideal condition for studying ENSO impacts [24]. Considering the vegetation types, surface climate, and soil properties, the response of vegetation greening in the near-tropics to ENSO events is complicated [25]. Previous studies have revealed different trends in vegetation dynamics between the near-tropics and the tropics [26,27]. However, few studies have examined the dynamic response of near-tropical vegetation to ENSOs.
The world’s largest subtropical forests are located along the Tropic of Cancer in China (TCC) [28], rendering this region ideal for investigating near-tropical vegetation responses to ENSO. The vegetation here is diverse (Figure S1), and the region experiences a typical subtropical monsoon climate, which is sensitive to climate change. Additionally, the TCC region has a wide range of altitudes (Figure 1), providing a complex environment for vegetation growth. This diversity in topography and climate within the TCC region can offer unique insights into how different vegetation types respond to ENSO under various environmental conditions.
With advances in satellite and remote sensing technology, vegetation dynamics’ spatial detail and accuracy have been significantly improved [29,30]. Therefore, it is possible to explore the effect of ENSO on the greening of vegetation in the near-tropics [31,32]. Here, vegetation indices (e.g., Leaf Area Index, LAI, and kernel Normalized Difference Vegetation Index, kNDVI) and meteorological datasets were used to assess the response of vegetation greening near the TCC to ENSO. Specifically, the aims of this research were to analyze 1) the impact of ENSO on the vegetation greening, and 2) the primary climate driving factors of vegetation greening near the TCC from 2001 to 2018. This research will contribute to a better understanding of the complex relationship among ENSO, vegetation dynamics, and the carbon cycle in the near-tropics, which is crucial for global climate change research and carbon management strategies.

2. Materials and Methods
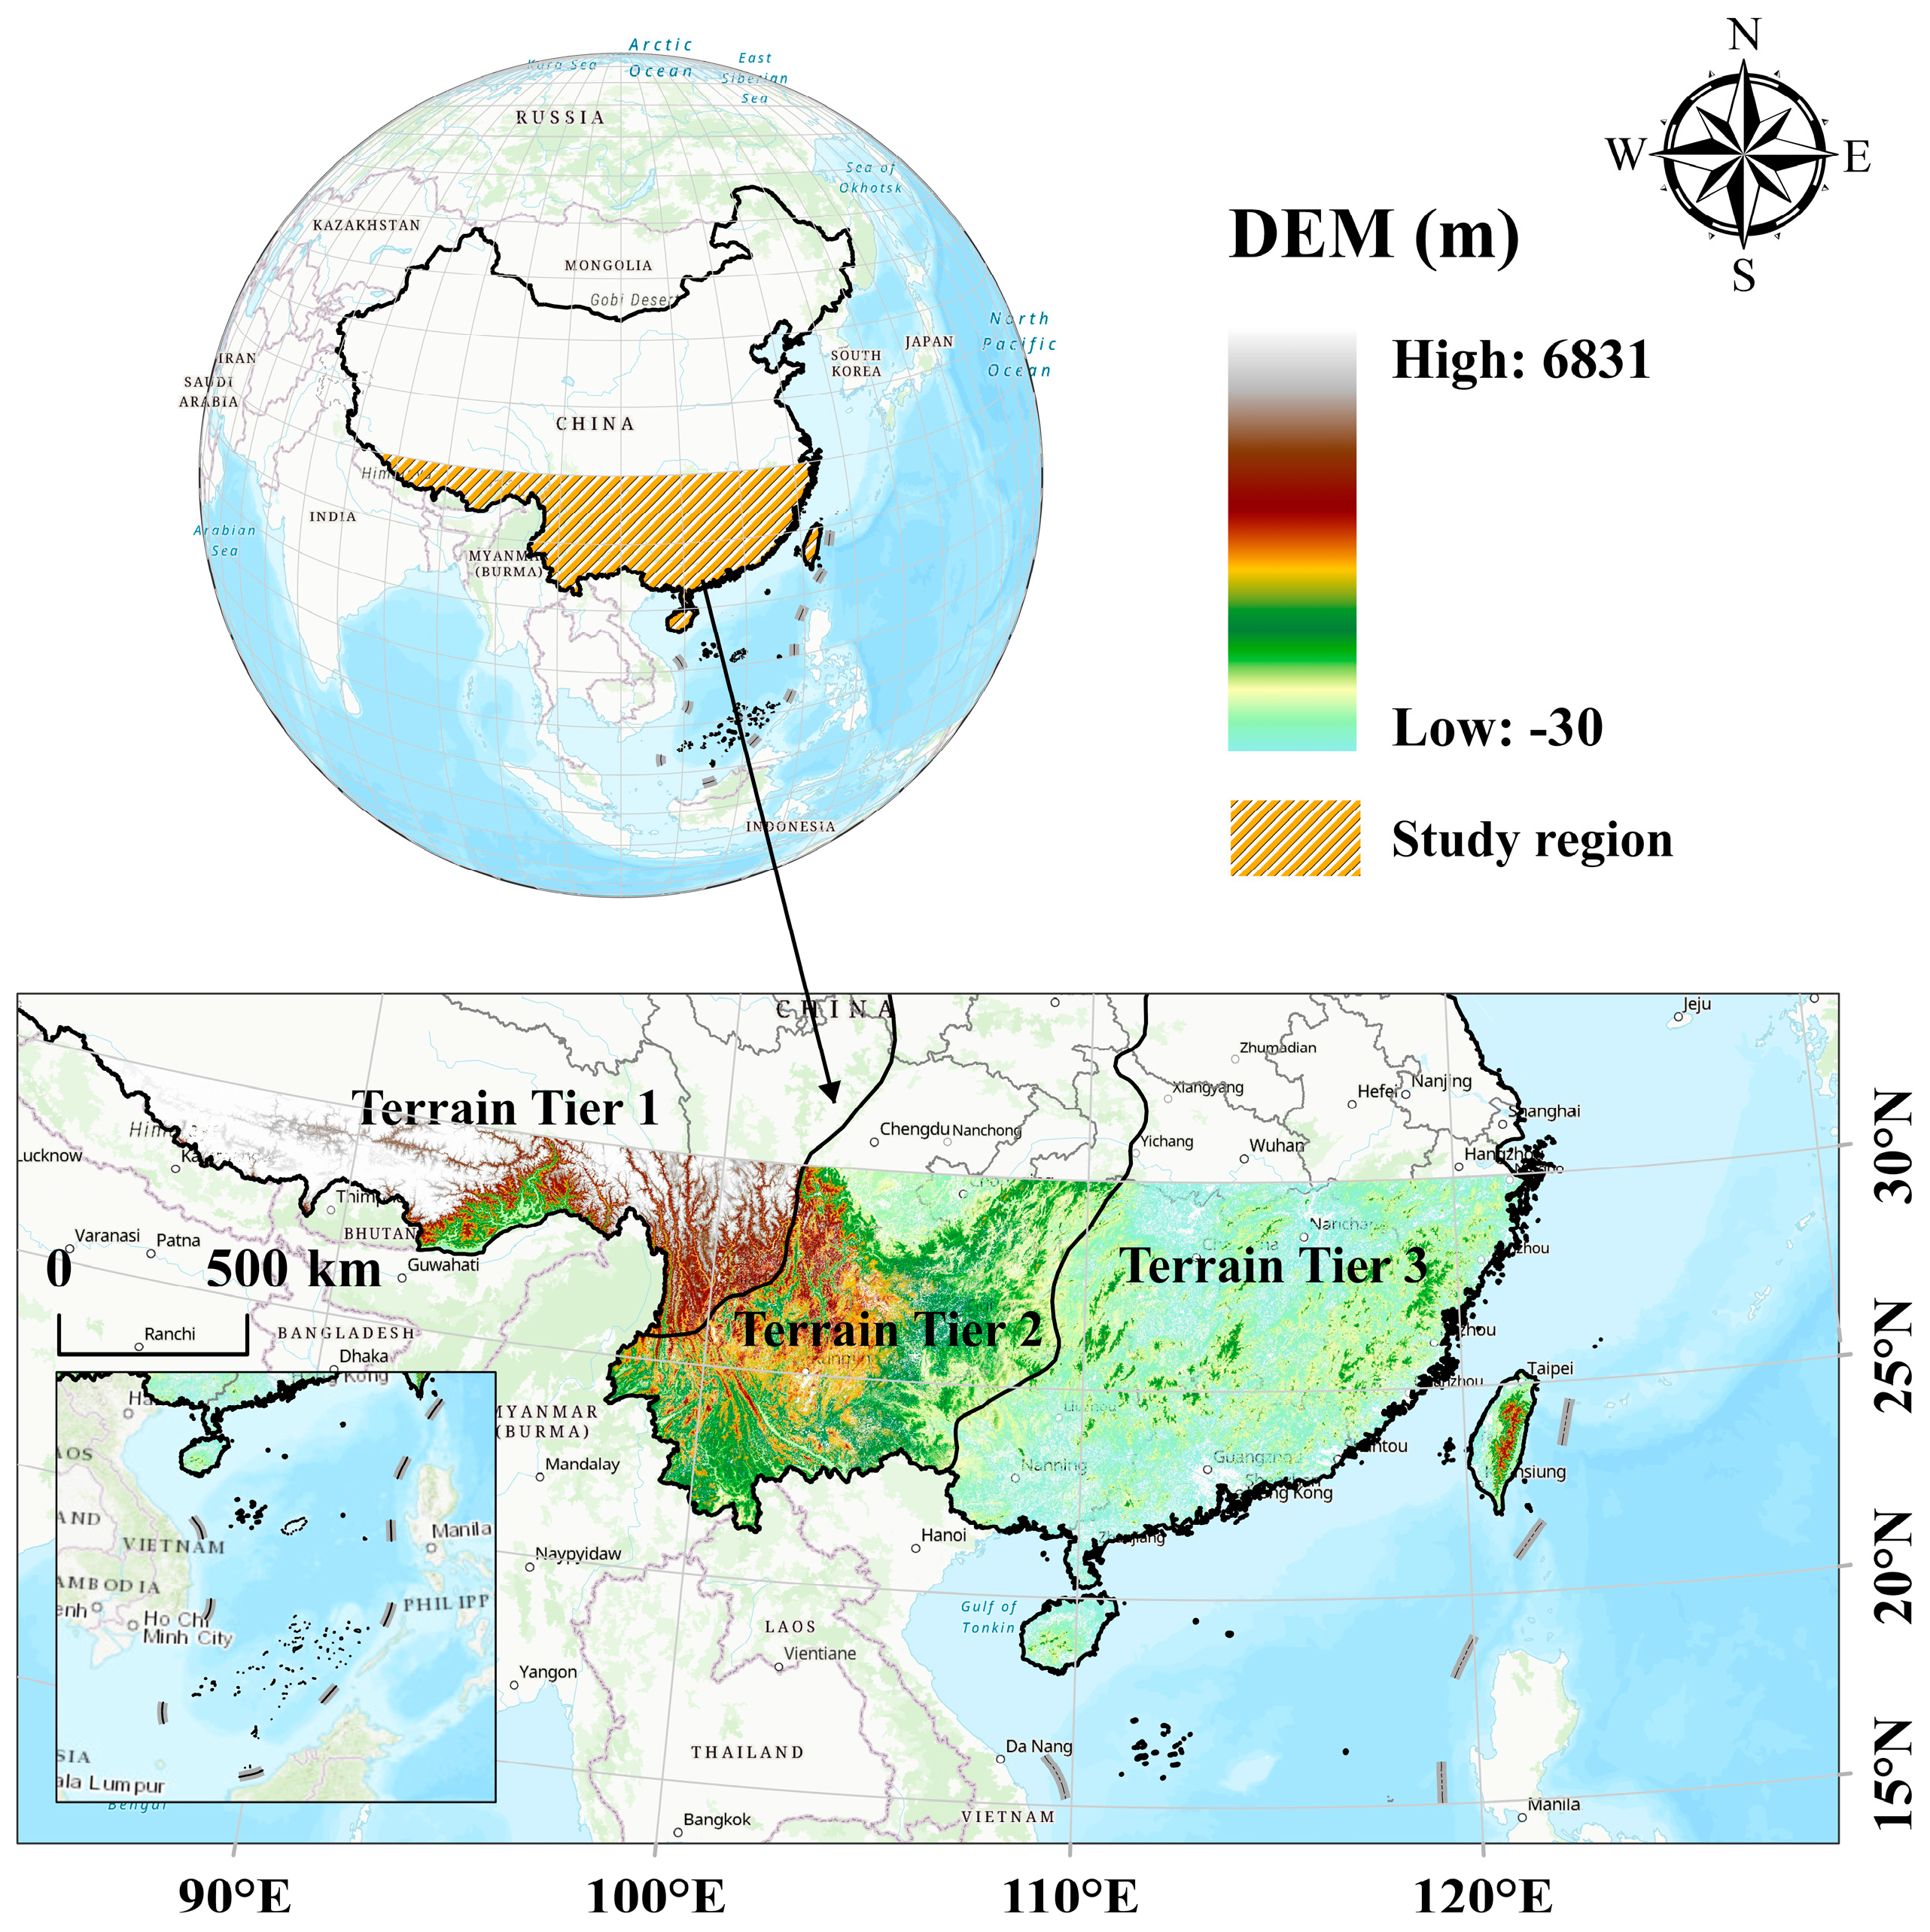
2.1. Study Area

The research area is from 15 to 30° N of the TCC (Figure 1), a typical subtropical monsoon climate, with an annual mean surface air temperature of 19.3 °C and precipitation of 1490 mm [33] and altitudes ranging from − 30 m to 6831 m. The proper hydrothermal resources in this area are conducive to vegetation growth, but the impact of severe natural disasters there, including typhoons, heavy rains, and heat waves, cannot be ignored.
In order to accurately analyze the response of vegetation greening to ENSO, we divided the study area into terrain tiers 1, 2, and 3 (i.e., T_1, T_2, and T_3) based on the three levels of terrain zoning in China. Plateaus with alpine meadows and desert vegetation dominate T_1. A complex topography with prominent karst landforms and a wide variety of vegetation is in T_2 [34]. In contrast, T_3 is interspersed with mountains and is hilly, with many human activities and an extensive distribution of unnatural forests [35].

2.2. Data Sources and Preprocessing

2.2.1. Remote Sensing Data

LAI is an indicator of vegetation greening. In this study, LAI was obtained from the Moderate Resolution Imaging Spectroradiometer (MODIS) provided by the United States Geological Survey (USGS) and preprocessed and downloaded at the Google Earth Engine (GEE) platform. Due to the changes in NOAA satellite orbits and the degradation of MODIS sensors, inconsistencies between pre−2000 and the present LAI products occurred [36]. Therefore, the LAI products of MOD15A2H with time intervals of 8 days and spatial resolution of 500 m during 2001–2018 were used in this study. They were then synthesized monthly and annually and resampled to 1 km for further processing and analysis.
To alleviate signal oversaturation in densely vegetated areas and increase sensitivity to vegetation’s physical and physiological processes in the Normalized Difference Vegetation Index (NDVI), we examined vegetation greening using kernel NDVI (kNDVI) [37]. The monthly and annual kNDVI was calculated using the MOD13A2 NDVI product (16 days, 1 km) and using the maximum value composites method, eliminating cloud pollution as much as possible.
Further, the annual MCD12Q1 Land Use/Land Cover (LULC) products from 2001 to 2018 were used to decompose our analysis into different vegetation types (Figure S1a). To eliminate anthropogenic influences on the research, we utilized the MCD12Q1 annual LULC data to identify land use pixels that were anthropogenically influenced (e.g., urban and farmland) at any point during the study period. It is worth noting that this does not classify forests that remained deforested for long periods during the study period as human-influenced pixels. Therefore, we used the global deforestation dataset [38] to identify any pixels that suffered forest loss. Nevertheless, this dataset also captures non-anthropogenic forest loss, like wildfires. The LULC for removing anthropogenic pixels is shown in Figure S1b.

2.2.2. Environmental Factors

In this study, the effects of precipitation (P), temperature (T), potential evapotranspiration (PET), and net radiation (NR) on vegetation greening during ENSO were considered. The monthly P, T, and PET (spatial resolution: 0.0083333°) were obtained from the National Earth System Science Data Center, National Science & Technology Infrastructure of China (http://www.geodata.cn). The production methods for the dataset are specified in Peng et al. [39] and Peng et al. [40]. We used the monthly NR datasets (8 days, 1 km) downloaded from the National Ecosystem Science Data Center, National Science & Technology Infrastructure of China (http://www.nesdc.org.cn). To align with the study’s temporal resolution, all datasets were resampled into monthly.

2.2.3. ENSO Index

We identified El Niño and La Niña through the bi-monthly Multivariate ENSO index (MEI.v2, downloaded from https://psl.noaa.gov/enso/mei/ accessed on 27 February 2025), which combined five marine meteorological elements (i.e., sea level pressure, sea surface temperature, 10 m zonal wind, 10 m meridional wind, and outgoing longwave radiation) to identify ENSO adequately [41]. A persistent ENSO event is recognized when the absolute value of the MEI exceeds 0.5 for more than 5 consecutive months. In the research, three ENSO events, La Niña in 2007–2009 and 2010–2012 and El Niño in 2015–2016, were finally identified that occurred between 2001 and 2018 based on historical data records [42]. In addition, MEI between 0.5 (−0.5) and 1 (−1) defines a weak El Niño (La Niña); MEI between 1 (−1) and 1.5 (−1.5) defines a moderate El Niño (La Niña); and MEI over 1.5 (−1.5) defines a strong El Niño (La Niña) [43]. The intensity of ENSO is shown in Table 1.

2.2.4. Vegetation Greening Analysis

The annually/monthly LAI and kNDVI were detrended separately to obtain pixel-by-pixel annual/monthly anomalies. Specifically, the anomalies were defined in the detrended time series of LAI/kNDVI.
R(t) = XT(t) − XP(t)
where R(t) is the monthly LAI/kNDVI anomaly; XT(t) is the time series of the monthly LAI/kNDVI; and XP(t) is the predicted value of LAI/kNDVI obtained by univariate linear regression.
We then compared the agreement between kNDVI anomalies and LAI anomalies to ensure the reliability of LAI in assessing vegetation greening. The test results show significant agreement between the two vegetation indices for further analysis (Figure S2 and Table S1). Finally, annual/monthly anomalies for the three ENSO events were analyzed by region and vegetation type. A one-sample t-test assessed the significance of the anomalies.

2.2.5. Environmental Factor Analysis

Similarly to LAI, the time series of monthly environmental factor anomalies were obtained after detrending. The sensitivity of vegetation greening to environmental factors was then assessed by selecting the optimal multiple regression model through relevant metrics (e.g., largest R2 and lowest Bayesian Information Criterion). We randomly combined the four environmental variables and then performed multiple regressions. Although the statistical analysis results suggest that the optimal model is a function of T, P, and PET (Table S2), the strong correlation between PET and T due to the Clausius–Clapeyron equation must be noted (Figure S3). Therefore, we chose NR as a predictor, i.e., the optimal model combination was T, P, and NR.
y = β + βTxT + βPxP + βNRxNR
where y is the monthly LAI anomaly; xi are the monthly anomaly environmental factors (i.e., T, P, and NR); and βi are the multiple regression coefficients, indicating the sensitivity of vegetation greening to each input environmental variable xi.
Further, the sensitivity explanation is used to more deeply understand the magnitude and direction of the impact of environmental variables on vegetation greening. Multiplying the monthly anomaly values of environmental variables by their respective sensitivities, which can quantify the contribution of each variable to the anomaly of vegetation greening, helps to clarify the specific impact mechanism of each factor on vegetation greening in different regions and ENSO phases.

3. Results

3.1. Asymmetric Response of Vegetation Greening to ENSO

There is an asymmetric response of vegetation greening to different phases of ENSO near the TCC. LAI increased and then decreased during La Niña II. In contrast, the vegetation significant green-up occurred during La Niña I and El Niño I (Figure 2a). The yearly trends of LAI anomalies in the different regions of the study area are the same as the overall trend, except for T_2 during La Niña 1, where the trend is the opposite of the other regions. Further, the asymmetric response of vegetation greening to ENSO is also obvious spatially. We observed intense vegetation browning near the TCC during La Niña II, whereas the effect of La Niña I and El Niño I on vegetation greening was relatively weak (Figure S2). Vegetation browning during La Niña II (i.e., LAI negative anomalies about 0.15) is twice as high as vegetation greening during El Niño I (i.e., LAI positive anomalies about 0.05) (Figure 2c). Notably, vegetation greening exhibited comparable responses to La Niña I (about 0.02) and El Niño I. However, vegetation greening during El Niño I is slightly stronger than La Niña I, which is attributable to the fact that T_2 are more green during El Niño I.
Forests were the main contributors to vegetation that greened or browned near the TCC. We found that the forest mean annual LAI anomalies were significantly larger than the non-forest during ENSO (Figure 2c). The boxplot distribution of the forest LAI anomalies (i.e., V_1) is generally similar to that of the study area (i.e., V_0). The non-forested data distributions are all concentrated, and the mean LAI anomalies are around 0 (Figure 2d). Furthermore, greening to ENSO across vegetation types is inconsistent. In the face of two La Niña events, forests and wetlands showed opposite greening trends, while other vegetation types consistently showed browning. During El Niño I, the remaining vegetation, except for shrubs, experienced green-up.

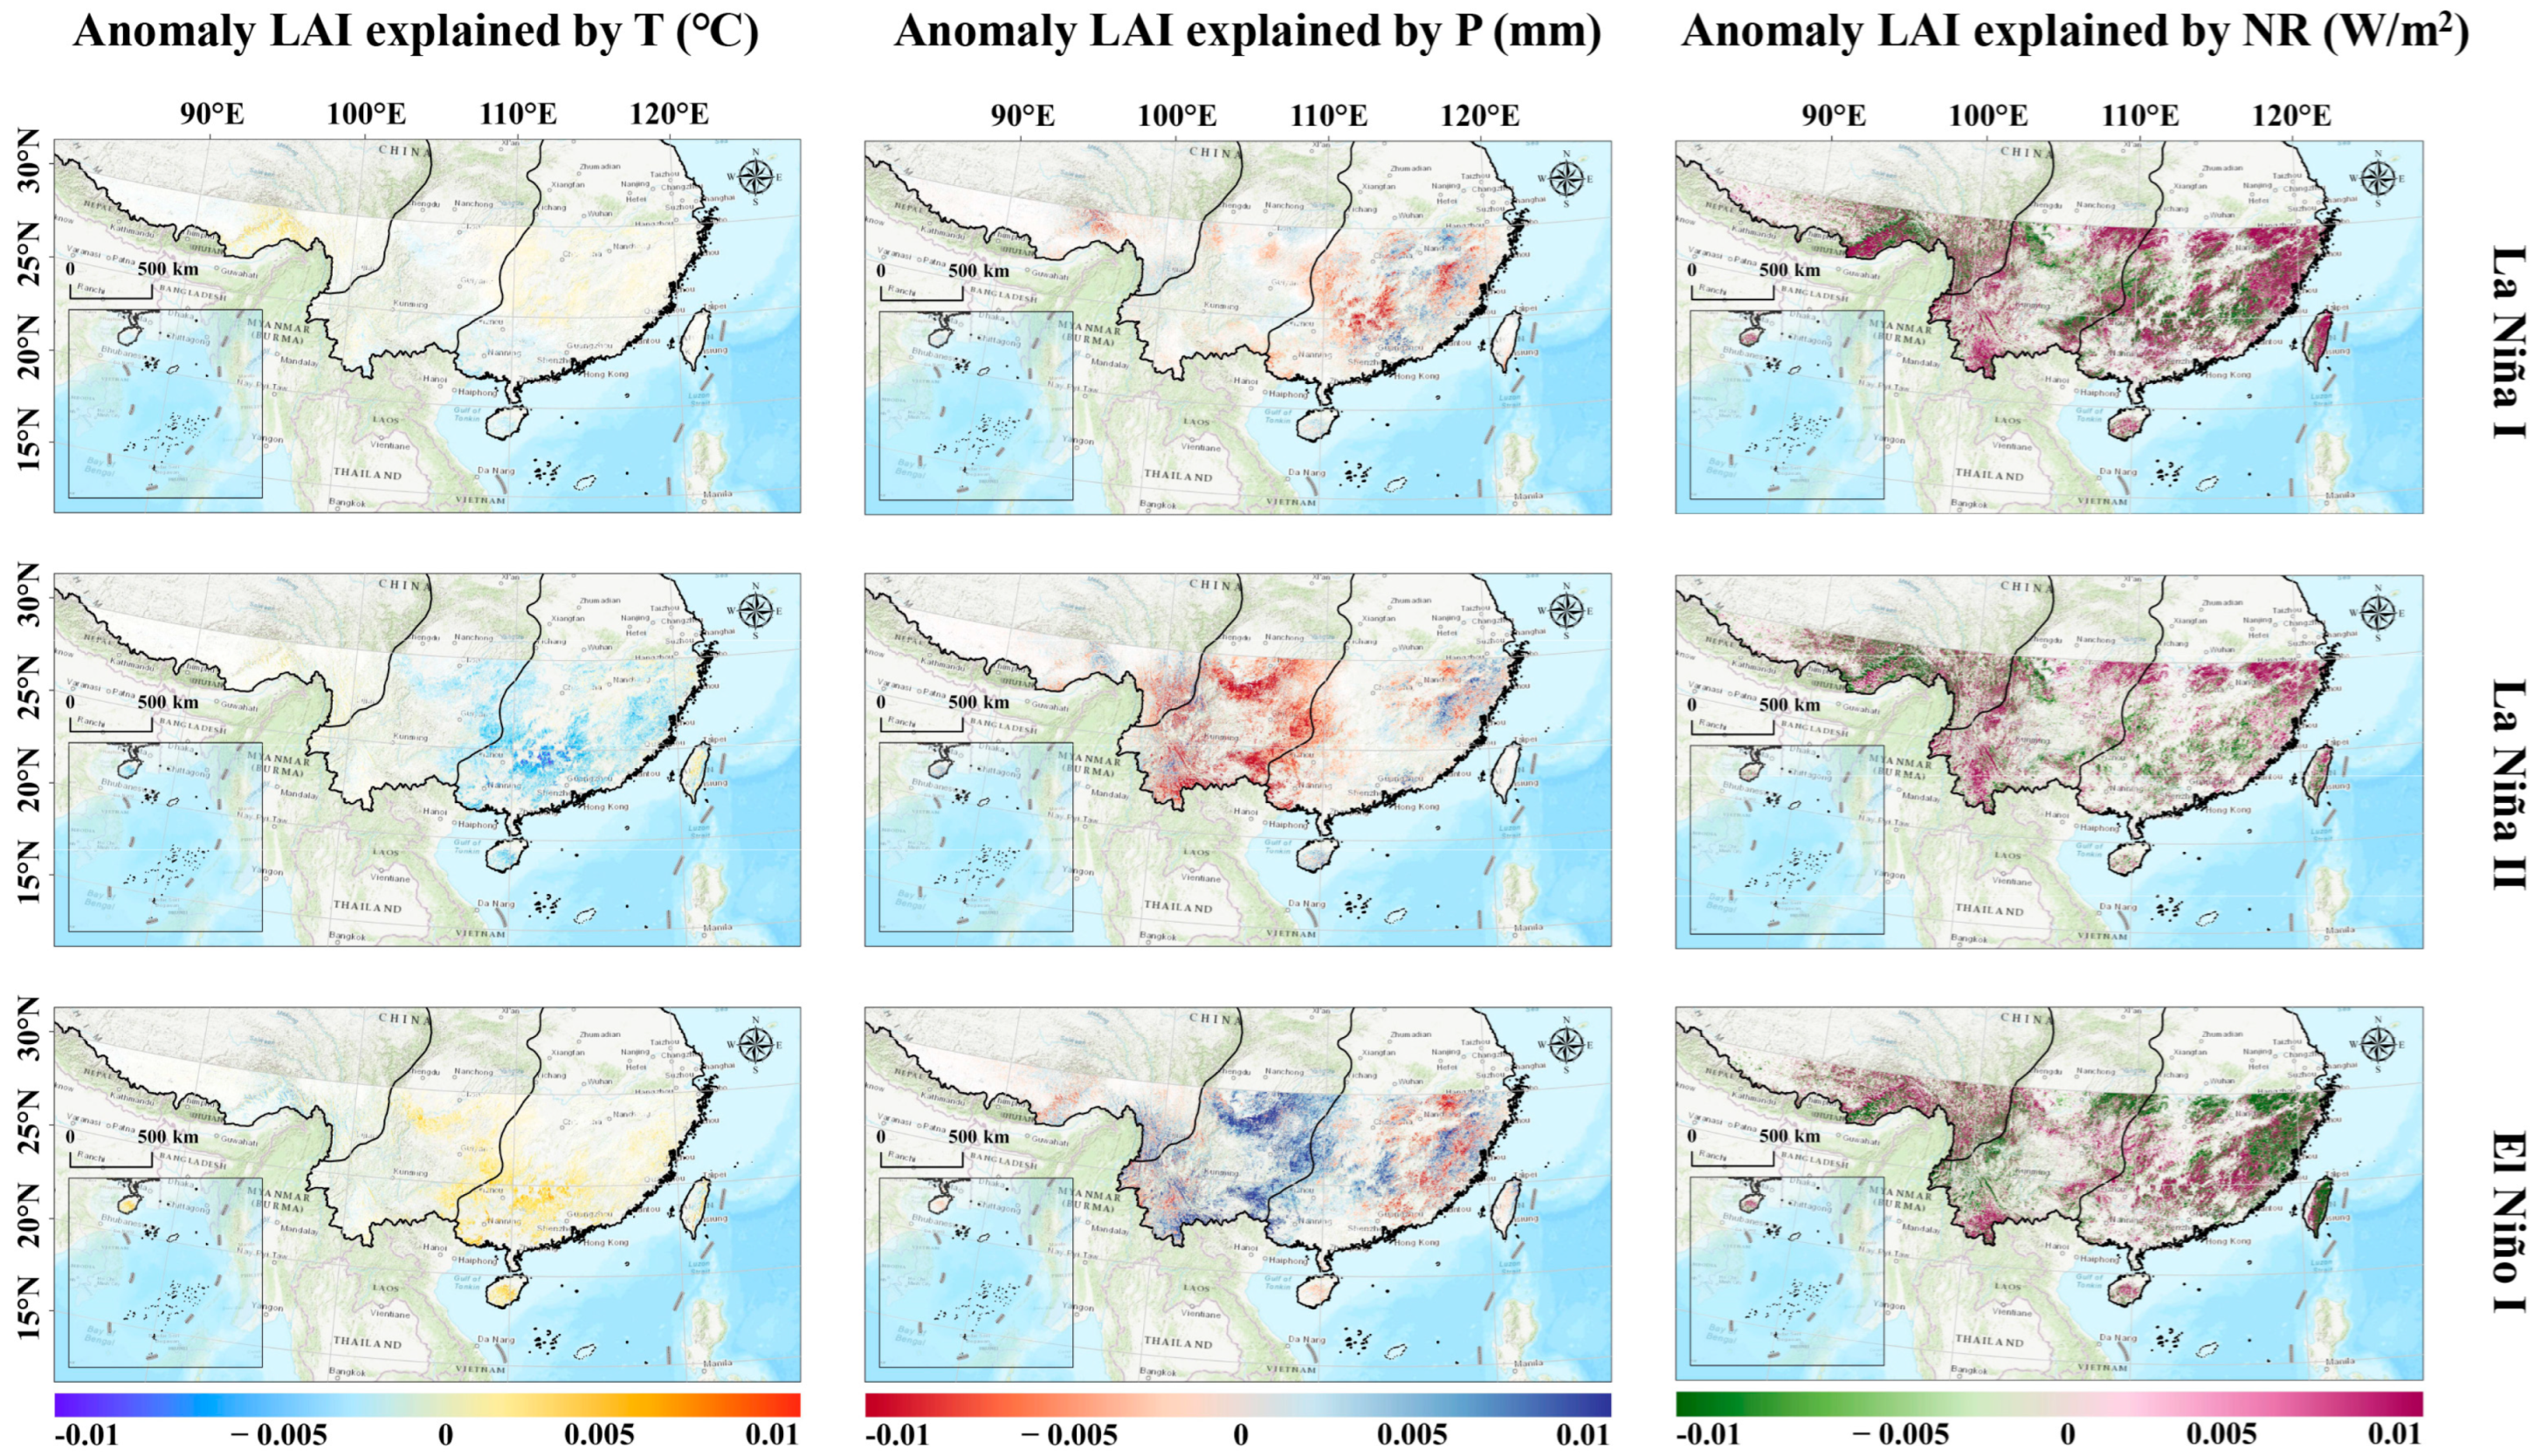
3.2. Spatial Variation in Drivers of Vegetation Greening near TCC

According to the robust estimates derived from the optimal regression model, there is significant spatial variation in the sensitivity of vegetation greening to environmental variables (Figure 3 and Figure S4). The results indicated that the sensitivity of greenness to P is the lowest near the TCC, with a more pronounced positive sensitivity only in T_2. Vegetation greening showed a significant positive sensitivity to T overall, especially in T_1. NR is a highly sensitive factor for vegetation greening, which extensively affects the vegetation dynamics in the study area.
Spatial heterogeneity among environmental variable anomalies was also evident in the three ENSO events (Figure 4). The distribution of T anomalies during two strong ENSO events is entirely opposite (Table S3), showing a significant meridional distribution. T anomalies gradually increased (decreased) from east to west during La Niña II (El Niño I). In particular, T anomalies in T_1 during La Niña I showed a severe decrease, with a slight decrease (increase) in T_2 (T_3). Both La Niña events caused a decrease in P anomalies, but La Niña I mainly affected T_1 and La Niña II affected a broader area. El Niño I increased P anomalies over the entire study area, which was particularly pronounced in T_3. In addition, NR anomalies show opposite scenarios between the different phases of the ENSO, decreasing during La Niña and increasing during El Niño. Further, the above observations are validated by the data statistics results (Figure S5).
In contrast to sensitivity, the results of the sensitivity interpretation suggested that T had the least impact on greening (Figure 5). Combined with monthly anomalies in environmental variables, we found strong spatial heterogeneity in the mechanism of vegetation greening near the TCC. As with changes in T anomalies, vegetation greening exhibited a typical meridional distribution during two strong ENSO events. A decrease (increase) in T anomalies drove slight vegetation browning (greening) during La Niña II (El Niño I). Although reduced P anomalies dominated vegetation browning in T_2 during La Niña II, the severe reduction in P anomalies in T_1 during La Niña I did not lead to significant vegetation browning. Similarly, the widespread increase in P anomalies during El Niño I did not contribute to the overall vegetation greening in the study area, and only the vegetation in T_2 experienced significant green-up. There was a clear negative feedback mechanism between NR and vegetation greening. The asymmetric response of vegetation greening to ENSO was thus mainly due to the difference in the regulation of climate factors by ENSO with different phases and intensities.

4. Discussion

In this study, we explored the response of vegetation greening to ENSO near the TCC based on a long time series LAI product, as well as datasets of environmental variables. We also analyzed the driving factors affecting vegetation greening using multiple regression models.
The most significant finding of this research is that vegetation greening near the TCC showed an asymmetric response in the face of three ENSO events during 2001–2018. The difference in vegetation greening was mainly attributed to ENSO’s asymmetric influence on climatic factors. For example, T_3 experienced a severe decrease in P anomalies during La Niña I but showed a dramatic increase during La Niña II. Wang et al. [14] demonstrated that differences in the control of precipitation and temperature by ENSO Central Pacific-type and Eastern Pacific-type of ENSO resulted in significant differences in LAI anomalies for terrestrial vegetation in the Western Pacific. In addition, the intensity of ENSO events has also contributed to climatic factors [44].
Several hypotheses are being proposed about how environmental variables drive vegetation greening. This research will discuss the mechanisms of vegetation greening based on the Terrestrial Biosphere Model (TBM). The framework links LAI to gross primary productivity (GPP), carbon use efficiency (CUE), and carbon allocation [45]. GPP represents all the carbon taken up by photosynthesis [46]. CUE represents the proportion of carbon that vegetation can use for biomass production, which is calculated by dividing net primary productivity (NPP, which denotes the remainder of GPP minus the carbon consumed by respiration) by GPP. Notably, it is generally accepted that the proportion of carbon assigned to leaves is constant in TBM. Hence, environmental variables mainly depend on regulating GPP and CUE to affect LAI vegetation.
According to the TBM, the main reasons for vegetation greening stems from two mechanisms: (1) the increase in GPP promotes leaf flush, and (2) more carbon is assigned to the leaves by increasing NPP. Previous studies reported that NPP and GPP involve different vegetation physiological processes, resulting in apparent variations in the effects of environmental variables [47]. In addition, several other mechanisms can also affect vegetation greening, such as adjusting the canopy structure or restructuring the age composition of the leaves to accommodate changes in light intensity [48,49]. Therefore, the mechanisms driving vegetation greening are complex and need to be analyzed on a case-by-case basis.
Vegetation greening/browning exhibited a positive correlation with T. The hypothesis may be higher/lower T–higher/lower GPP–higher/lower LAI. Specifically, when T did not exceed the optimum T (Top), vegetation NPP varied with T. Near the TCC, the T was not warmer than the Top of vegetation (the T in the study area is shown in Figure S6, and the Top for vegetation is referenced to Huang et al. [50]). At the same time, lower T also inhibits respiration to increase NPP, thereby enhancing CUE. Moreover, the smaller magnitude of T change (|T anomalies| < 0.4 °C) explained well why T exerted less influence on vegetation greening.
Likewise, P showed positive feedback with vegetation greening, which was only significant in T_2. This phenomenon was attributed to differences in landform types and precipitation patterns between Southwest (i.e., T_2) and South (i.e., T_3) China. As illustrated in Figure 4, P anomalies fluctuated dramatically in both T_2 and T_3 during the three ENSO events, but only the vegetation in T_2 experienced significant responses. Wang et al. [51] reported that vegetation in Southwest China suffered a more severe water crisis due to the unique geology of karst landscapes, which were more sensitive to P. Furthermore, the dry season in the South Asian monsoon region is longer than in the East Asian monsoon region [52], which results in less P in T_2 than T_3 (Figure S6), further rendering the vegetation in T_2 more sensitive to P. Our speculation was also supported by Zhang et al. [53] who revealed that vegetation sensitivity to P was increasing in arid regions around the globe.
Although radiation is a key driver of photosynthesis, its direct impact on vegetative respiration is negligible [54]. Therefore, lower NR results in less GPP, which reduces the amount of carbon allocated by vegetation to leaves, making the vegetation browner. Interestingly, NR exhibited a negative correlation with vegetation greening near the TCC. We speculated on two different scenarios regarding the relationship between vegetation and environmental factors. First, during La Niña, when NR decreased, vegetation improved its photosynthetic efficiency. It did this by adjusting the leaf attitude and even enhancing leaf flush. Second, during El Niño, NR increased, and this was accompanied by an enhancement in PET, as shown in Figure S7. In response, vegetation reduced transpiration. It achieved this by accelerating leaf abscission, which helped ensure an adequate amount of available water. Previous evidence on the effect of climatic factors on LAI also corroborates our inference [55]. For example, the significant increase in greenness of Amazonian forests during droughts observed by remote sensing was due to enhanced leaf flush [56,57]. Moreover, Liang and Ye [58] revealed that vegetation would respond to drought by reducing water evaporation by closing stomata and reducing leaf area (e.g., leaf abscission).
Moreover, LAI near the TCC showed no significant increasing trend from 2001 to 2018, contrasting with reported rises in NPP/GPP across Southern China [59,60]. This implies that LAI is not strongly correlated with vegetation carbon sinks, especially during ENSO [61]. Therefore, exploring the effect of ENSO on vegetation carbon sinks is also a worthwhile topic to be carried out in the context of the implementation of global carbon neutrality programs.
Despite the valuable insights gained from this study, it has some limitations and shortcomings. Firstly, although we used multiple datasets and regression models, the complex interactions among vegetation, climate, and soil factors may not be fully captured. For example, soil properties such as nutrient availability and texture can influence vegetation growth and its response to ENSO but were not comprehensively considered in this research. Secondly, our analysis was based on satellite-derived data, which may have certain uncertainties. The spatio-temporal resolution of the data might not be sufficient to accurately represent the fine-scale variations in vegetation greening and environmental factors. Additionally, the three ENSO events analyzed in this study are a relatively small sample size. Future research could incorporate a larger number of ENSO events over a longer time period to improve the generalizability of the results. Finally, while we focused on the impact of ENSO on vegetation greening, other climate events such as the Madden–Julian Oscillation (MJO) and the Pacific Decadal Oscillation (PDO) may also interact with ENSO and affect vegetation dynamics but were not included in this study.

5. Conclusions

This study revealed asymmetric vegetation greening responses to ENSO near the TCC, based on a long time series of remote sensing LAI products. Differences in the regulation of climate patterns by ENSO events of different phases and intensities contributed to this asymmetry. Vegetation browning during La Niña II was primarily driven by reduced T and P anomalies, whereas greening during La Niña I and El Niño I was predominantly associated with increased P anomalies. The research provides important insights into the impact of ENSO on vegetation greening in the near-tropics, especially as extreme ENSO becomes more frequent in the face of global warming. Meanwhile, this study offers actionable insights for designing region-specific vegetation management and climate adaptation strategies, crucial for safeguarding ecosystem stability and advancing sustainable development.

Supplementary Materials

The following supporting information can be downloaded at: https://www.mdpi.com/article/10.3390/rs17060977/s1.

Author Contributions

Conceptualization, C.Z.; methodology, C.Z.; software, C.Z.; validation, C.Z. and X.C.; formal analysis, C.Z.; investigation, C.Z. and X.C.; resources, S.C. and B.H.; data curation, X.C. and S.C.; writing—original draft preparation, C.Z. and X.C.; writing—review and editing, C.Z. and B.H.; visualization, C.Z. and X.C.; supervision, B.H.; project administration, S.C. and B.H.; funding acquisition, S.C. and B.H. All authors have read and agreed to the published version of the manuscript.

Funding

This research was funded by the project of Southern Marine Science and Engineering Guangdong Laboratory (Zhuhai) (Nos. SML2023SP217, SML2023SP219), the Ocean Negative Carbon Emissions (ONCE) program, and the “Nanling Team Plan” Project 2022 of Shaoguan (Double Carbon Spatial Big Data).

Data Availability Statement

Publicly available datasets were analyzed in this study. These data can be found at the following links: http://www.geodata.cn; http://www.nesdc.org.cn; and https://psl.noaa.gov/enso/mei/ accessed on 27 February 2025.

Acknowledgments

We thank the Platform for providing free data and the scholars who provided references.

Conflicts of Interest

Authors Shuisen Chen and Xingda Chen were employed by the company Shaoguan ShenBay Low Carbon Digital Technology Co., Ltd. The remaining authors declare that the research was conducted in the absence of any commercial or financial relationships that could be construed as a potential conflict of interest. The Shaoguan ShenBay Low Carbon Digital Technology Co., Ltd. had no role in the design of the study; in the collection, analyses, or interpretation of the data; in the writing of the manuscript, or in the decision to publish the results.

References

  1. L’Heureux, M.L.; Takahashi, K.; Watkins, A.B.; Barnston, A.G.; Becker, E.J.; Di Liberto, T.E.; Gamble, F.; Gottschalck, J.; Halpert, M.S.; Huang, B.; et al. Observing and Predicting the 2015/16 El Niño. Bull. Am. Meteorol. Soc. 2017, 98, 1363–1382. [Google Scholar] [CrossRef]
  2. Santoso, A.; McPhaden, M.J.; Cai, W. The Defining Characteristics of ENSO Extremes and the Strong 2015/2016 El Niño. Rev. Geophys. 2017, 55, 1079–1129. [Google Scholar] [CrossRef]
  3. Fedorov, A.V.; Philander, S.G. Is El Niño Changing? Science 2000, 288, 1997–2002. [Google Scholar] [CrossRef] [PubMed]
  4. Yeh, S.-W.; Kug, J.-S.; Dewitte, B.; Kwon, M.-H.; Kirtman, B.P.; Jin, F.-F. El Niño in a changing climate. Nature 2009, 461, 511–514. [Google Scholar] [CrossRef]
  5. Cai, W.; Santoso, A.; Wang, G.; Yeh, S.-W.; An, S.-I.; Cobb, K.M.; Collins, M.; Guilyardi, E.; Jin, F.-F.; Kug, J.-S.; et al. ENSO and greenhouse warming. Nat. Clim. Change 2015, 5, 849–859. [Google Scholar] [CrossRef]
  6. Satriawan, T.W.; Luo, X.; Tian, J.; Ichii, K.; Juneng, L.; Kondo, M. Strong Green-Up of Tropical Asia During the 2015/16 El Niño. Geophys. Res. Lett. 2024, 51, e2023GL106955. [Google Scholar] [CrossRef]
  7. Piao, S.; Wang, X.; Park, T.; Chen, C.; Lian, X.; He, Y.; Bjerke, J.W.; Chen, A.; Ciais, P.; Tømmervik, H.; et al. Characteristics, drivers and feedbacks of global greening. Nat. Rev. Earth Environ. 2020, 1, 14–27. [Google Scholar] [CrossRef]
  8. Samanta, A.; Ganguly, S.; Hashimoto, H.; Devadiga, S.; Vermote, E.; Knyazikhin, Y.; Nemani, R.R.; Myneni, R.B. Amazon forests did not green-up during the 2005 drought. Geophys. Res. Lett. 2010, 37, L05401. [Google Scholar] [CrossRef]
  9. Nunes, M.H.; Both, S.; Bongalov, B.; Brelsford, C.; Khoury, S.; Burslem, D.F.R.P.; Philipson, C.; Majalap, N.; Riutta, T.; Coomes, D.A.; et al. Changes in leaf functional traits of rainforest canopy trees associated with an El Niño event in Borneo. Environ. Res. Lett. 2019, 14, 085005. [Google Scholar] [CrossRef]
  10. Yue, C.; Ciais, P.; Bastos, A.; Chevallier, F.; Yin, Y.; Rödenbeck, C.; Park, T. Vegetation greenness and land carbon-flux anomalies associated with climate variations: A focus on the year 2015. Atmos. Chem. Phys. 2017, 17, 13903–13919. [Google Scholar] [CrossRef]
  11. Wigneron, J.-P.; Fan, L.; Ciais, P.; Bastos, A.; Brandt, M.; Chave, J.; Saatchi, S.; Baccini, A.; Fensholt, R. Tropical forests did not recover from the strong 2015–2016 El Niño event. Sci. Adv. 2020, 6, eaay4603. [Google Scholar] [CrossRef] [PubMed]
  12. Fan, L.; Cui, T.; Wigneron, J.-P.; Ciais, P.; Sitch, S.; Brandt, M.; Li, X.; Niu, S.; Xiao, X.; Chave, J.; et al. Dominant role of the non-forest woody vegetation in the post 2015/16 El Niño tropical carbon recovery. Glob. Change Biol. 2024, 30, e17423. [Google Scholar] [CrossRef] [PubMed]
  13. Erasmi, S.; Schucknecht, A.; Barbosa, M.P.; Matschullat, J. Vegetation Greenness in Northeastern Brazil and Its Relation to ENSO Warm Events. Remote Sens. 2014, 6, 3041–3058. [Google Scholar] [CrossRef]
  14. Wang, C.; Li, J.; Liu, Q.; Huete, A.; Li, L.; Dong, Y.; Zhao, J. Eastern-Pacific and Central-Pacific Types of ENSO Elicit Diverse Responses of Vegetation in the West Pacific Region. Geophys. Res. Lett. 2022, 49, e2021GL096666. [Google Scholar] [CrossRef]
  15. Hao, Y.; Hao, Z.; Feng, S.; Zhang, X.; Hao, F. Response of vegetation to El Niño-Southern Oscillation (ENSO) via compound dry and hot events in southern Africa. Glob. Planet. Change 2020, 195, 103358. [Google Scholar] [CrossRef]
  16. Doughty, R.; Xiao, X.; Qin, Y.; Wu, X.; Zhang, Y.; Moore, B. Small anomalies in dry-season greenness and chlorophyll fluorescence for Amazon moist tropical forests during El Niño and La Niña. Remote Sens. Environ. 2021, 253, 112196. [Google Scholar] [CrossRef]
  17. Park, S.-W.; Kim, J.-S.; Kug, J.-S.; Stuecker, M.F.; Kim, I.-W.; Williams, M. Two Aspects of Decadal ENSO Variability Modulating the Long-Term Global Carbon Cycle. Geophys. Res. Lett. 2020, 47, e2019GL086390. [Google Scholar] [CrossRef]
  18. Liu, J.; Bowman, K.W.; Schimel, D.S.; Parazoo, N.C.; Jiang, Z.; Lee, M.; Bloom, A.A.; Wunch, D.; Frankenberg, C.; Sun, Y.; et al. Contrasting carbon cycle responses of the tropical continents to the 2015–2016 El Niño. Science 2017, 358, eaam5690. [Google Scholar] [CrossRef]
  19. Wu, M.; Jiang, F.; Scholze, M.; Chen, D.; Ju, W.; Wang, S.; Kaminski, T.; Lu, Z.; Vossbeck, M.; Zheng, M. Regional Responses of Vegetation Productivity to the Two Phases of ENSO. Geophys. Res. Lett. 2024, 51, e2024GL108176. [Google Scholar] [CrossRef]
  20. Wang, Z.; Huang, M.; Gong, H.; Li, X.; Zhang, H.; Zhou, X. Increased tropical vegetation respiration is dually induced by El Niño and upper atmospheric warm anomalies. Sci. Total Environ. 2022, 818, 151719. [Google Scholar] [CrossRef]
  21. Green, J.K.; Ballantyne, A.; Abramoff, R.; Gentine, P.; Makowski, D.; Ciais, P. Surface temperatures reveal the patterns of vegetation water stress and their environmental drivers across the tropical Americas. Glob. Change Biol. 2022, 28, 2940–2955. [Google Scholar] [CrossRef] [PubMed]
  22. Zhao, Q.; Ma, X.; Yao, W.; Liu, Y.; Yao, Y. Anomaly Variation of Vegetation and Its Influencing Factors in Mainland China During ENSO Period. IEEE Access 2020, 8, 721–734. [Google Scholar] [CrossRef]
  23. Su, J.; Gou, X.; Hille Ris Lambers, J.; Zhang, D.D.; Zheng, W.; Xie, M.; Manzanedo, R.D. Increasing ENSO variability synchronizes tree growth in subtropical forests. Agric. For. Meteorol. 2024, 345, 109830. [Google Scholar] [CrossRef]
  24. Dewar, R.E.; Wallis, J.R. Geographical Patterning of Interannual Rainfall Variability in the Tropics and Near Tropics: An L-Moments Approach. J. Clim. 1999, 12, 3457–3466. [Google Scholar] [CrossRef]
  25. Ashton, P.; Zhu, H. The tropical-subtropical evergreen forest transition in East Asia: An exploration. Plant Divers. 2020, 42, 255–280. [Google Scholar] [CrossRef]
  26. Gonsamo, A.; Chen, J.M.; Lombardozzi, D. Global vegetation productivity response to climatic oscillations during the satellite era. Glob. Change Biol. 2016, 22, 3414–3426. [Google Scholar] [CrossRef]
  27. Zhu, J.; Zhang, M.; Zhang, Y.; Zeng, X.; Xiao, X. Response of Tropical Terrestrial Gross Primary Production to the Super El Niño Event in 2015. J. Geophys. Res. Biogeosci. 2018, 123, 3193–3203. [Google Scholar] [CrossRef]
  28. Wang, B.; Liu, J.; Kim, H.-J.; Webster, P.J.; Yim, S.-Y.; Xiang, B. Northern Hemisphere summer monsoon intensified by mega-El Niño/southern oscillation and Atlantic multidecadal oscillation. Proc. Natl. Acad. Sci. USA 2013, 110, 5347–5352. [Google Scholar] [CrossRef]
  29. Baeza, S.; Paruelo, J.M. Spatial and temporal variation of human appropriation of net primary production in the Rio de la Plata grasslands. ISPRS J. Photogramm. Remote Sens. 2018, 145, 238–249. [Google Scholar] [CrossRef]
  30. Zhang, M.; Yuan, N.; Lin, H.; Liu, Y.; Zhang, H. Quantitative estimation of the factors impacting spatiotemporal variation in NPP in the Dongting Lake wetlands using Landsat time series data for the last two decades. Ecol. Indic. 2022, 135, 108544. [Google Scholar] [CrossRef]
  31. Hu, L.; Andrews, A.E.; Thoning, K.W.; Sweeney, C.; Miller, J.B.; Michalak, A.M.; Dlugokencky, E.; Tans, P.P.; Shiga, Y.P.; Mountain, M.; et al. Enhanced North American carbon uptake associated with El Niño. Sci. Adv. 2019, 5, eaaw0076. [Google Scholar] [CrossRef] [PubMed]
  32. Luo, X.; Keenan, T.F.; Fisher, J.B.; Jiménez-Muñoz, J.-C.; Chen, J.M.; Jiang, C.; Ju, W.; Perakalapudi, N.-V.; Ryu, Y.; Tadić, J.M. The impact of the 2015/2016 El Niño on global photosynthesis using satellite remote sensing. Philos. Trans. R. Soc. B Biol. Sci. 2018, 373, 20170409. [Google Scholar] [CrossRef] [PubMed]
  33. Wu, Y.; Wu, Z. NPP Variability Associated with Natural and Anthropogenic Factors in the Tropic of Cancer Transect, China. Remote Sens. 2023, 15, 1091. [Google Scholar] [CrossRef]
  34. Li, Y.; Ye, S.; Luo, Y.; Yu, S.; Zhang, G. Relationship between species diversity and tree size in natural forests around the Tropic of Cancer. J. For. Res. 2023, 34, 1735–1745. [Google Scholar] [CrossRef]
  35. Guo, B.; Zang, W.; Luo, W. Spatial-temporal shifts of ecological vulnerability of Karst Mountain ecosystem-impacts of global change and anthropogenic interference. Sci. Total Environ. 2020, 741, 140256. [Google Scholar] [CrossRef]
  36. Jiang, C.; Ryu, Y.; Fang, H.; Myneni, R.; Claverie, M.; Zhu, Z. Inconsistencies of interannual variability and trends in long-term satellite leaf area index products. Glob. Change Biol. 2017, 23, 4133–4146. [Google Scholar] [CrossRef]
  37. Camps-Valls, G.; Campos-Taberner, M.; Moreno-Martínez, Á.; Walther, S.; Duveiller, G.; Cescatti, A.; Mahecha, M.D.; Muñoz-Marí, J.; García-Haro, F.J.; Guanter, L.; et al. A unified vegetation index for quantifying the terrestrial biosphere. Sci. Adv. 2021, 7, eabc7447. [Google Scholar] [CrossRef]
  38. Hansen, M.C.; Potapov, P.V.; Moore, R.; Hancher, M.; Turubanova, S.A.; Tyukavina, A.; Thau, D.; Stehman, S.V.; Goetz, S.J.; Loveland, T.R.; et al. High-Resolution Global Maps of 21st-Century Forest Cover Change. Science 2013, 342, 850–853. [Google Scholar] [CrossRef]
  39. Peng, S.; Ding, Y.; Liu, W.; Li, Z. 1 km monthly temperature and precipitation dataset for China from 1901 to 2017. Earth Syst. Sci. Data 2019, 11, 1931–1946. [Google Scholar] [CrossRef]
  40. Peng, S.; Ding, Y.; Wen, Z.; Chen, Y.; Cao, Y.; Ren, J. Spatiotemporal change and trend analysis of potential evapotranspiration over the Loess Plateau of China during 2011–2100. Agric. For. Meteorol. 2017, 233, 183–194. [Google Scholar] [CrossRef]
  41. Du, J.; Kimball, J.S.; Sheffield, J.; Velicogna, I.; Zhao, M.; Pan, M.; Fisher, C.K.; Beck, H.E.; Watts, J.D.; Wood, E.F. Synergistic Satellite Assessment of Global Vegetation Health in Relation to ENSO-Induced Droughts and Pluvials. J. Geophys. Res. Biogeosci. 2021, 126, e2020JG006006. [Google Scholar] [CrossRef]
  42. Zhang, C.; Luo, J.-J.; Li, S. Impacts of Tropical Indian and Atlantic Ocean Warming on the Occurrence of the 2017/2018 La Niña. Geophys. Res. Lett. 2019, 46, 3435–3445. [Google Scholar] [CrossRef]
  43. Chavda, D.; Li, J.; Farahmand, A. Assessing the influence of El Niño on the California precipitation regime during the satellite precipitation era. Hydrol. Process. 2024, 38, e15160. [Google Scholar] [CrossRef]
  44. Hoell, A.; Hoerling, M.; Eischeid, J.; Wolter, K.; Dole, R.; Perlwitz, J.; Xu, T.; Cheng, L. Does El Niño intensity matter for California precipitation? Geophys. Res. Lett. 2016, 43, 819–825. [Google Scholar] [CrossRef]
  45. Cui, E.; Huang, K.; Arain, M.A.; Fisher, J.B.; Huntzinger, D.N.; Ito, A.; Luo, Y.; Jain, A.K.; Mao, J.; Michalak, A.M.; et al. Vegetation Functional Properties Determine Uncertainty of Simulated Ecosystem Productivity: A Traceability Analysis in the East Asian Monsoon Region. Glob. Biogeochem. Cycles 2019, 33, 668–689. [Google Scholar] [CrossRef]
  46. Goulden, M.L.; McMillan, A.M.S.; Winston, G.C.; Rocha, A.V.; Manies, K.L.; Harden, J.W.; Bond-Lamberty, B.P. Patterns of NPP, GPP, respiration, and NEP during boreal forest succession. Glob. Change Biol. 2011, 17, 855–871. [Google Scholar] [CrossRef]
  47. Li, H.; Wu, Y.; Liu, S.; Xiao, J. Regional contributions to interannual variability of net primary production and climatic attributions. Agric. For. Meteorol. 2021, 303, 108384. [Google Scholar] [CrossRef]
  48. Myneni, R.B.; Yang, W.; Nemani, R.R.; Huete, A.R.; Dickinson, R.E.; Knyazikhin, Y.; Didan, K.; Fu, R.; Negrón Juárez, R.I.; Saatchi, S.S.; et al. Large seasonal swings in leaf area of Amazon rainforests. Proc. Natl. Acad. Sci. USA 2007, 104, 4820–4823. [Google Scholar] [CrossRef]
  49. Smith, M.N.; Stark, S.C.; Taylor, T.C.; Ferreira, M.L.; de Oliveira, E.; Restrepo-Coupe, N.; Chen, S.; Woodcock, T.; dos Santos, D.B.; Alves, L.F.; et al. Seasonal and drought-related changes in leaf area profiles depend on height and light environment in an Amazon forest. New Phytol. 2019, 222, 1284–1297. [Google Scholar] [CrossRef]
  50. Huang, M.; Piao, S.; Ciais, P.; Peñuelas, J.; Wang, X.; Keenan, T.F.; Peng, S.; Berry, J.A.; Wang, K.; Mao, J.; et al. Air temperature optima of vegetation productivity across global biomes. Nat. Ecol. Evol. 2019, 3, 772–779. [Google Scholar] [CrossRef]
  51. Wang, L.; Yue, Y.; Cui, J.; Liu, H.; Shi, L.; Liang, B.; Li, Q.; Wang, K. Precipitation sensitivity of vegetation growth in southern China depends on geological settings. J. Hydrol. 2024, 643, 131916. [Google Scholar] [CrossRef]
  52. Wu, R.; Chen, G. Contrasting Cloud Regimes and Associated Rainfall over the South Asian and East Asian Monsoon Regions. J. Clim. 2021, 34, 3663–3681. [Google Scholar] [CrossRef]
  53. Zhang, Y.; Gentine, P.; Luo, X.; Lian, X.; Liu, Y.; Zhou, S.; Michalak, A.M.; Sun, W.; Fisher, J.B.; Piao, S.; et al. Increasing sensitivity of dryland vegetation greenness to precipitation due to rising atmospheric CO2. Nat. Commun. 2022, 13, 4875. [Google Scholar] [CrossRef] [PubMed]
  54. Xi, X.; Liang, M.; Yuan, X. Increased atmospheric water stress on gross primary productivity during flash droughts over China from 1961 to 2022. Weather Clim. Extrem. 2024, 44, 100667. [Google Scholar] [CrossRef]
  55. Metcalfe, D.B.; Meir, P.; Aragão, L.E.O.C.; Lobo-do-Vale, R.; Galbraith, D.; Fisher, R.A.; Chaves, M.M.; Maroco, J.P.; da Costa, A.C.L.; de Almeida, S.S.; et al. Shifts in plant respiration and carbon use efficiency at a large-scale drought experiment in the eastern Amazon. New Phytol. 2010, 187, 608–621. [Google Scholar] [CrossRef]
  56. Lopes, A.P.; Nelson, B.W.; Wu, J.; de Alencastro Graça, P.M.L.; Tavares, J.V.; Prohaska, N.; Martins, G.A.; Saleska, S.R. Leaf flush drives dry season green-up of the Central Amazon. Remote Sens. Environ. 2016, 182, 90–98. [Google Scholar] [CrossRef]
  57. Janssen, T.; van der Velde, Y.; Hofhansl, F.; Luyssaert, S.; Naudts, K.; Driessen, B.; Fleischer, K.; Dolman, H. Drought effects on leaf fall, leaf flushing and stem growth in the Amazon forest: Reconciling remote sensing data and field observations. Biogeosciences 2021, 18, 4445–4472. [Google Scholar] [CrossRef]
  58. Liang, X.; Ye, Q. Integrating dehydration tolerance and avoidance in drought adaptation. J. Plant Ecol. 2024, 17, rtae073. [Google Scholar] [CrossRef]
  59. Deng, Y.; Wang, X.; Wang, K.; Ciais, P.; Tang, S.; Jin, L.; Li, L.; Piao, S. Responses of vegetation greenness and carbon cycle to extreme droughts in China. Agric. For. Meteorol. 2021, 298–299, 108307. [Google Scholar] [CrossRef]
  60. Xu, Y.; Lu, Y.-G.; Zou, B.; Xu, M.; Feng, Y.-X. Unraveling the enigma of NPP variation in Chinese vegetation ecosystems: The interplay of climate change and land use change. Sci. Total Environ. 2024, 912, 169023. [Google Scholar] [CrossRef]
  61. Yang, J.; Tian, H.; Pan, S.; Chen, G.; Zhang, B.; Dangal, S. Amazon drought and forest response: Largely reduced forest photosynthesis but slightly increased canopy greenness during the extreme drought of 2015/2016. Glob. Change Biol. 2018, 24, 1919–1934. [Google Scholar] [CrossRef]
Figure 1. The spatial location of the study region and DEM.
Remotesensing 17 00977 g001
Figure 2. (a) Annual anomalies LAI in TCC; (b) time series of annually anomalies LAI for each vegetation type in TCC; (c) boxplot of ENSO monthly LAI anomalies by regions; (d) boxplot of ENSO monthly LAI anomalies by vegetation types. T_0: entire study area; V_0: all vegetation types; V_1: forests; V_2: shrublands; V_3: wetlands; V_4: grasslands; V_5: barren. White dots represent average of monthly anomalies across each ENSO. All data met significance test (p < 0.05).
Remotesensing 17 00977 g002
Figure 3. Spatial distribution of sensitivity of vegetation greening to environmental variables (i.e., T: temperature; P: precipitation; NR: net radiation) based on 2001–2018 datasets.
Remotesensing 17 00977 g003
Figure 4. Monthly anomalies of environmental variables during ENSO.
Remotesensing 17 00977 g004
Figure 5. Sensitivity explanation of environmental variables to degree of vegetation greening.
Remotesensing 17 00977 g005
Table 1. Three ENSO events intensity classification from 2001 to 2018.
TypeBeginning and Ending TimeIntensity
La Niña IJune 2007~May 2009moderate
La Niña IIJune 2010~March 2012strong
El Niño IMay 2015~May 2016strong
Disclaimer/Publisher’s Note: The statements, opinions and data contained in all publications are solely those of the individual author(s) and contributor(s) and not of MDPI and/or the editor(s). MDPI and/or the editor(s) disclaim responsibility for any injury to people or property resulting from any ideas, methods, instructions or products referred to in the content.

