Article

R2SCAT-LPR: Rotation-Robust Network with Self- and Cross-Attention Transformers for LiDAR-Based Place Recognition

by
Weizhong Jiang
1,
Hanzhang Xue
2,
Shubin Si
1,3,
Liang Xiao
1,*,
Dawei Zhao
1,
Qi Zhu
1,
Yiming Nie
1 and
Bin Dai
1
1
Unmanned Systems Technology Research Center, Defense Innovation Institute, Beijing 100071, China
2
Test Center, National University of Defense Technology, Xi’an 710106, China
3
College of Intelligent Systems Science and Engineering, Harbin Engineering University, Harbin 150001, China
*
Author to whom correspondence should be addressed.
Remote Sens. 2025, 17(6), 1057; https://doi.org/10.3390/rs17061057
Submission received: 21 January 2025 / Revised: 9 March 2025 / Accepted: 15 March 2025 / Published: 17 March 2025

Abstract

:
LiDAR-based place recognition (LPR) is crucial for the navigation and localization of autonomous vehicles and mobile robots in large-scale outdoor environments and plays a critical role in loop closure detection for simultaneous localization and mapping (SLAM). Existing LPR methods, which utilize 2D bird’s-eye view (BEV) projections of 3D point clouds, achieve competitive performance in efficiency and recognition accuracy. However, these methods often struggle with capturing global contextual information and maintaining robustness to viewpoint variations. To address these challenges, we propose R2SCAT-LPR, a novel, transformer-based model that leverages self-attention and cross-attention mechanisms to extract rotation-robust place feature descriptors from BEV images. R2SCAT-LPR consists of three core modules: (1) R2MPFE, which employs weight-shared cascaded multi-head self-attention (MHSA) to extract multi-level spatial contextual patch features from both the original BEV image and its randomly rotated counterpart; (2) DSCA, which integrates dual-branch self-attention and multi-head cross-attention (MHCA) to capture intrinsic correspondences between multi-level patch features before and after rotation, enhancing the extraction of rotation-robust local features; and (3) a combined NetVLAD module, which aggregates patch features from both the original feature space and the rotated interaction space into a compact and viewpoint-robust global descriptor. Extensive experiments conducted on the KITTI and NCLT datasets validate the effectiveness of the proposed model, demonstrating its robustness to rotation variations and its generalization ability across diverse scenes and LiDAR sensors types. Furthermore, we evaluate the generalization performance and computational efficiency of R2SCAT-LPR on our self-constructed OffRoad-LPR dataset for off-road autonomous driving, verifying its deployability on resource-constrained platforms.

1. Introduction

Place recognition (PR) is a fundamental problem in robotics and computer vision, aiming to determine whether a robot or autonomous vehicle has revisited a known location by comparing current sensor data with a pre-existing database or map. This capability is essential for autonomous navigation tasks such as localization error correction, loop closure detection, and re-localization.
Among various PR approaches, visual-based and LiDAR-based methods are the most prominent [1]. Visual-based Place Recognition (VPR) leverages rich texture and color information but is highly sensitive to illumination changes, seasonal variations, and occlusions, which limits its reliability in large-scale outdoor environments, especially for autonomous vehicles or robots in outdoor navigation [2,3]. In contrast, LiDAR-based Place Recognition (LPR) benefits from precise geometric structure information, long-range perception, and accurate depth measurement, making it more robust to environmental changes and a preferred choice for mobile robot navigation in outdoor environments [4].
Deep learning has significantly advanced LPR by enabling robust feature extraction from 3D point clouds [5]. However, directly processing raw 3D point clouds is computationally expensive due to their unordered, sparse, and large-scale nature, limiting both efficiency and generalization across different LiDAR sensors and environments [6]. To improve computational efficiency, 2D projection-based methods have been widely adopted, including spherical and bird’s-eye view (BEV) projections. Spherical projection mitigates sparsity issues by converting 3D point clouds into range images, achieving promising results across various scenes [7,8]. However, it introduces scale and motion distortions, compromising geometric consistency [9]. In contrast, BEV projection preserves geometric structures, maintains stable scale and edge information, and has demonstrated superior generalization in LPR tasks [10]. These advantages make BEV-based approaches a more effective and scalable solution for robust place recognition.
Despite their advantages, existing BEV-based LPR methods primarily rely on CNNs for local feature extraction, which are inherently constrained by limited receptive fields, hindering their ability to capture global contextual information. Moreover, viewpoint variation remains a significant challenge as mobile robots may observe the same location from different perspectives [11]. BEVPlace++ [10], the current state-of-the-art BEV-based LPR model, enhances viewpoint robustness by designing a Rotation Equivariant Module (REM) and cascading it with NetVLAD [12] to generate rotation-invariant global feature descriptors. However, REM requires multiple fixed-angle rotations of the input BEV image, followed by the extraction of local features from each rotated sample using ResNet [13]. The N rotated feature maps are then reversed to their original orientation, and the final feature map is obtained by max-pooling these N feature maps. This design increases the computational cost of the model and does not fully exploit the deep relationships between the local feature tensors of the N samples.
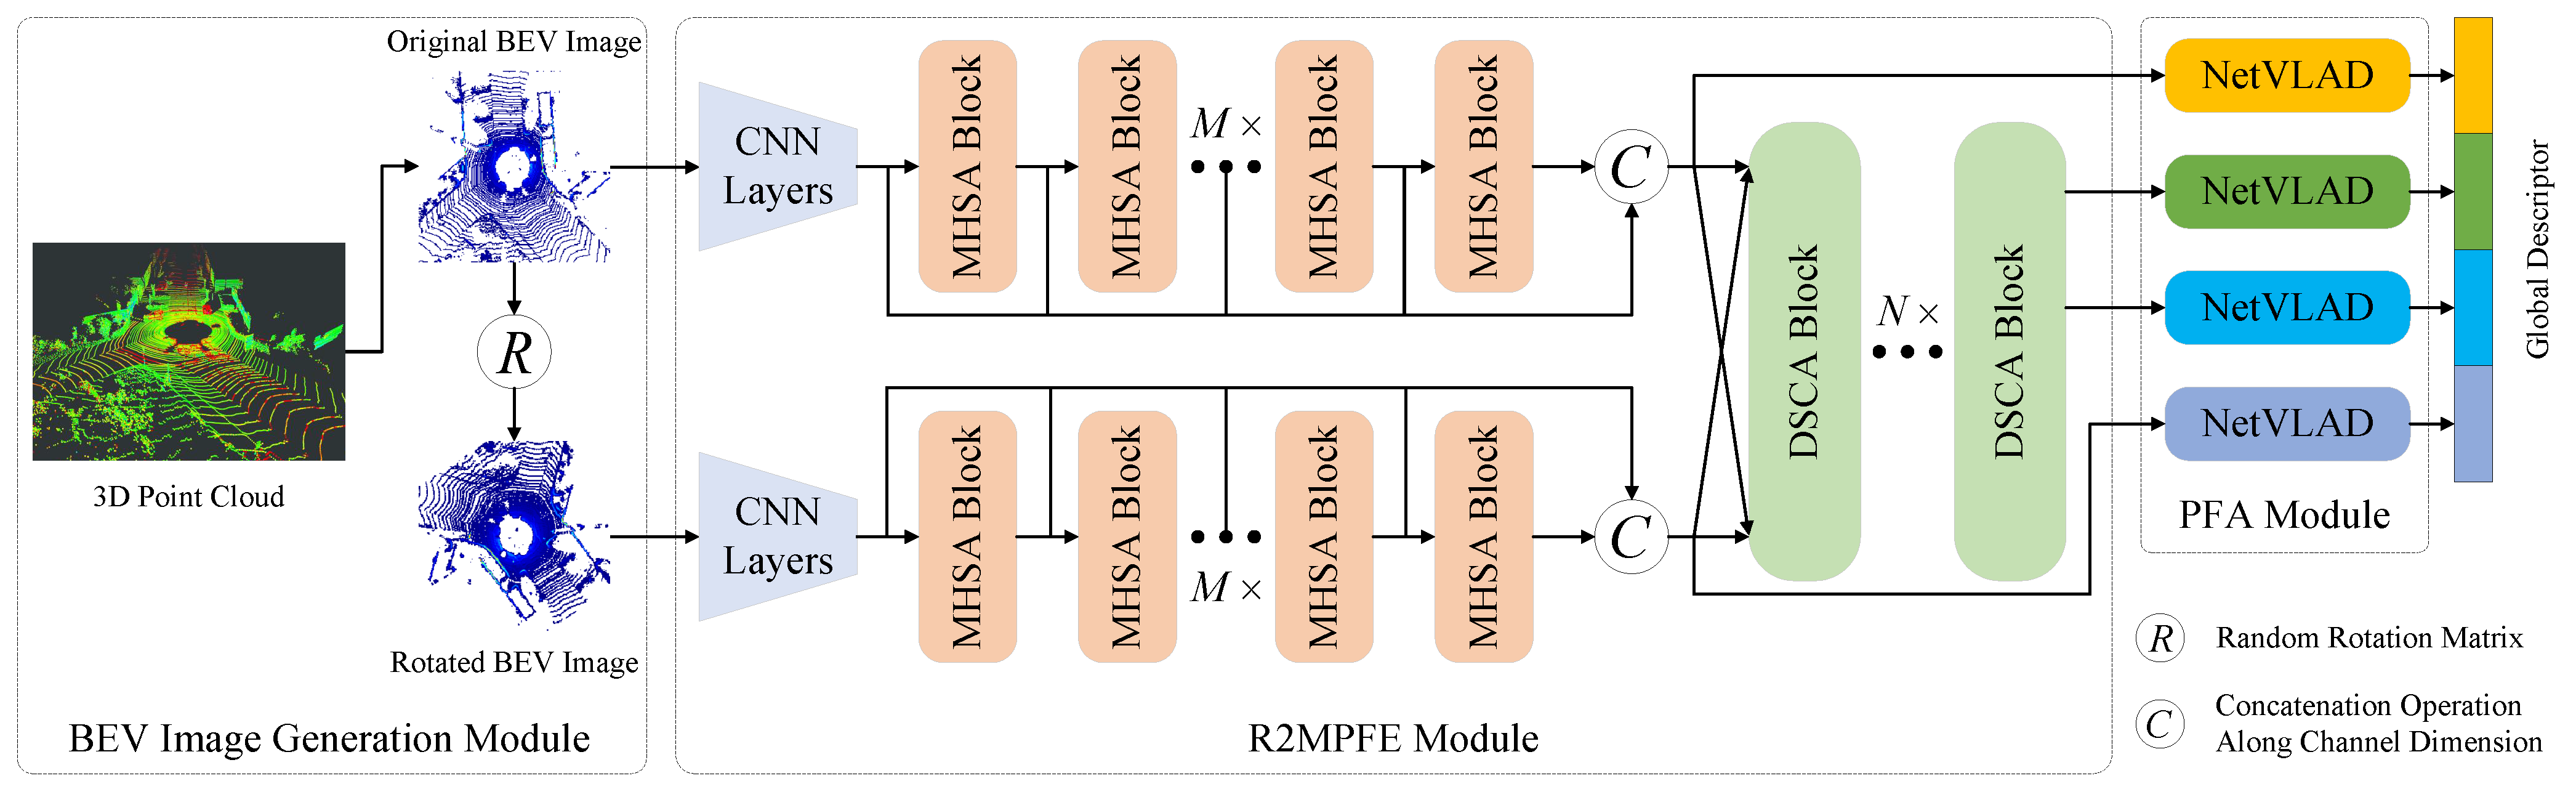
To address the aforementioned issues, this study proposes a local feature extraction method that leverages the MHSA [14] to extract patch features containing multi-level global spatial contextual information from BEV images of 3D point clouds, thereby overcoming the limitations of existing methods in capturing global contextual information. Furthermore, we observe that in various computer vision tasks, such as audio classification [15] and object detection [16], researchers frequently employ cross-attention to fuse features from different perspectives or cross modalities to enhance the classification or detection accuracy of models. Similarly, Joo et al. [17] utilized cross-attention to integrate spatial and intensity information from LiDAR to improve LPR performance. Inspired by these approaches, and aiming to enhance the robustness of the LPR model to viewpoint variations while avoiding increased computational burden, we applied a random rotation operation to the original BEV image and then separately encoded local features from both the original BEV image and its randomly rotated version. Subsequently, we correlated these two sets of local features using self-attention and MHCA [18], establishing deep relationships between high-dimensional patch features of the original BEV image and its rotated counterpart to extract rotation-robust local features. Finally, a combined NetVLAD layer was used to aggregate patch features from the original feature space and local features from the rotation interaction space into lightweight, compact, and viewpoint-robust global place feature descriptors.
The main contributions of this work are summarized as follows:
  • We propose the R2SCAT-LPR model, which integrates Transformers based on self-attention and cross-attention mechanisms to extract global feature descriptors containing multi-level global contextual information that are robust to rotation variations from 2D BEV images of 3D point clouds for LPR tasks.
  • We designed the R2MPFE module, which leverages cascaded MHSA blocks to extract patch features from BEV images, enhancing the model’s ability to capture global contextual information. By combining the outputs of each MHSA block, we constructed multi-level patch features that encompass both low-level fine-grained details and high-level semantic information.
  • We designed the DSCA module, which adopts a dual-branch structure composed of self-attention and MHCA. This module establishes intrinsic relationships between multi-level patch features corresponding to the original BEV image and its randomly rotated version, capturing local features robust to rotation changes.
  • Extensive experiments on three datasets validate the proposed model’s robustness to viewpoint variations, generalization capability, and practical deployability. The source code and pre-trained models will be released at https://github.com/shenhai911/r2scat-lpr.git, accessed on 9 March 2025.

2. Related Work

2.1. LPR Based on Handcrafted Features

M2DP [19] projects 3D point clouds onto multiple 2D planes based on the azimuth and elevation angles of the LiDAR sensor, constructing signature vectors from the point count and aggregating them into a 2D signature matrix. The global descriptor is generated through singular value decomposition (SVD). LiDAR Iris [20] encodes the height information of 3D point clouds into binary signature images using LoG-Gabor filtering and thresholding, achieving rotation invariance in the frequency domain. Scan Context [21] divides 3D point clouds into discrete grids based on azimuth and radial distance, assigning the maximum height within each grid to construct a 2D feature descriptor and calculating similarity using the sum of cosine distances between column vectors with the same indices. SSC [22] improved feature representation by using semantic information instead of elevation data when constructing the 2D Scan Context descriptor matrix. BoW3D [23] proposes a Bag-of-Words (BoW)-based 3D LiDAR loop closure detection method, leveraging pose-invariant Link3D [24] features to build the vocabulary to efficiently detect loop closures and refine 6-DoF poses at loop closure locations.
These methods construct feature descriptors using human-defined rules, which generally offer better interpretability. However, they often exhibit limited generalization capabilities and are highly sensitive to challenges such as viewpoint changes and occlusions [25]. In recent years, deep learning-based LPR methods have demonstrated significant advantages in accuracy and efficiency, gradually becoming the mainstream approach.

2.2. LPR Based on Deep Learning (DL-LPR)

Three-dimensional point clouds offer rich scene information, essential for DL-LPR. PointNetVLAD [5] utilizes PointNet [26] for local feature extraction but inherits its limitations, such as the inability to capture local geometric relationships. PCAN [27] adds an attention mechanism to improve feature discrimination, though it ignores point–neighborhood interactions and increases complexity. LPD-Net [28] enhances local feature extraction within the PointNet framework, capturing finer details. SOE-Net [29] incorporates direction encoding and self-attention to capture long-range dependencies, improving viewpoint robustness but at the cost of complexity. DAGC [30] maintains PointNet’s T-Net structure and adds dual attention mechanisms with residual graph convolutions for better feature–point relationships. PPT-Net [31] introduces a pyramid point Transformer to model multi-resolution spatial relationships among features. MinkLoc3D [32] and MinkLoc3Dv2 [33] use Feature Pyramid Networks (FPNs), with the latter enhancing performance through additional convolutions and attention mechanisms. TransLoc3D [34] incorporates Transformer modules for the adaptive processing of objects with varying sizes. LCDNet [35] combines fine-grained feature extraction from PointNet-like architectures with voxel-based methods. LoGG3D-Net [36] applies sparse point–voxel convolutional U-Net and local consistency loss to improve feature similarity. NDT-Transformer [37] reduces data volume with NDT representations, retaining key geometric information. CASSPR [38] fuses 3D point and voxel features using a cross-attention Transformer.
Although 3D point clouds and voxels capture more scene details, their unordered, sparse, and large-scale nature makes direct processing computationally expensive, limiting efficiency and generalization across different LiDAR sensors and environments [39]. In contrast, 2D projection-based LPR methods have shown satisfactory results in terms of efficiency, recognition accuracy, and generalization. Therefore, we adopted a 2D BEV projection-based solution in our approach.

2.3. Rotation-Robust Design in LPR

When a mobile robot operates in real-world environments, it may observe the same location from various viewpoints. Since different viewpoints provide distinct information, and the training data may not cover all possible perspectives, the model may fail to recognize the same location from different viewpoints. This phenomenon is referred to as the viewpoint variation problem [11]. To address this, recent works have explored rotation-invariant and rotation-robust designs. Chen et al. [7] transformed 3D point clouds into 2D range images through spherical projection for OverlapNet. OT [8] enhanced this by integrating yaw-rotation invariance and Transformer modules for improved spatiotemporal information extraction. Yin et al. [40,41] used multi-layer spherical projection to generate panoramic images and extract locally equivariant features via spherical convolution. Lu et al. [42] converted point clouds to 2D BEV representations and used the Radon transform to create the RING descriptor, further developing DeepRING [43] to reduce the effects of translation and rotation variations. DiSCO [44] leveraged spectral magnitude invariance in the frequency domain for rotation-invariant feature descriptors. Li et al. [3] combined semantic and geometric information to construct globally equivariant descriptors and designed RINet for rotation-invariant similarity prediction. BEVPlace [9] used group convolution for rotation-invariant feature extraction, while BEVPlace++ [10] introduced a rotation-equivariant module to aggregate global descriptors with rotation invariance.
However, in large-scale outdoor scenarios, these methods remain sensitive to viewpoint variations [45] and fail to fully leverage global contextual information to enhance model expressiveness. Therefore, in our model design, we employed self-attention and cross-attention mechanisms in the feature extraction module to capture both global context and rotation-robust features, thereby improving overall model performance.

3. Methodology

Figure 1 illustrates the overall architecture of our system, which primarily consists of three modules: the BEV image generation and rotation transformation module, the rotation-robust multi-level patch features extraction (R2MPFE) module, and the patch features aggregation (PFA) module. Given a 3D point cloud, a BEV image is first generated through 2D projection, followed by random rotation to obtain its rotated counterpart. The BEV inputs are processed using multi-layer convolutions, cascaded MHSA blocks, and dual-branch structures based on self-attention and cross-attention to extract patch features robust to rotation. Finally, a compact 1D global feature descriptor is generated by aggregating patch features with different attributes through a combined NetVLAD layer.

3.1. BEV Image Generation and Rotation Transformation Module

3.1.1. Original BEV Image Generation

In projection-based LPR methods, BEV projection offers a more detailed and comprehensive distribution of road elements compared to other projection methods. This enables global descriptors extracted from BEV images to provide a more stable representation of the scene’s geometric structure [10]. Building on this advantage, similar to [10], this work employed BEV images corresponding to 3D point clouds as input to our model.
Given a 3D point cloud P, where each point is denoted by  p i ( x , y , z ) , the corresponding BEV image  B I  is generated with dimensions  ( H , W ) . The pixel coordinates  ( u , v )  in  B I  corresponding to point  p i  are computed as follows:
u = W 2 + x r , v = H 2 y r 1 ,
where r is the projection resolution and  ·  denotes the floor function to ensure integer pixel coordinates. The pixel value at  ( u , v )  in  B I  reflects the number of points projected onto that location.

3.1.2. Random Rotated BEV Image Generation

In LPR tasks, viewpoint changes cause variations in the distribution of point clouds observed by the LiDAR sensor, posing challenges to model robustness. Mobile robots or autonomous vehicles typically adhere to the planar motion assumption when moving within local regions [10]. Based on this assumption, viewpoint changes in 3D space can be simplified as the rotation of 3D point clouds around the z-axis of the LiDAR coordinate system, which is equivalent to the rotation of the corresponding 2D BEV image around the axis perpendicular to the center of its plane. In this study, to obtain rotation-robust global feature descriptors, our model extracted patch features from both the original BEV image  B I  and its randomly rotated version  B R I , leveraging DSCA blocks to explore the intrinsic relationships between the two high-level feature tensors. The computation formula for  B R I  was as follows:
B R I = R × B I ,
where R represents the random rotation matrix. Given a random rotation angle  θ , the formula for R was as follows:
R = c o s ( θ ) s i n ( θ ) t x s i n ( θ ) c o s ( θ ) t y 0 0 1 ,
where  t x  and  t y  denote the translation offsets used to align the center of  B R I  and ensure that the dimensions of  B R I  match those of  B I . Their computation formulas were
t x = ( 1 c o s ( θ ) ) · c x s i n ( θ ) · c y , t y = s i n ( θ ) · c x + ( 1 c o s ( θ ) ) · c y ,
where  ( c x , c y ) = ( W 2 , H 2 )  represents the center point of  B I .

3.1.3. Problem Definition

After constructing the BEV data required for this study, we defined the LPR problem to be addressed. Let  D P = { P i i = 1 , , M }  represent a pre-collected database of 3D point clouds defined with respect to a fixed reference frame, and its corresponding BEV database can be represented as  D B = { B i I i = 1 , , M } , where each frame is geotagged with a Universal Transverse Mercator (UTM) coordinate at its centroid using GPS/INS. Given a query point cloud  Q P  and its BEV representation  B q I , the goal of the LPR task is to retrieve a point cloud  D P *  from  D P  that exhibits a structure similar to  Q P . To achieve this, we propose a neural network that learns a mapping function  f ( · )  to transform  B i I  into a fixed-size global feature descriptor  F B i I . The objective is to identify a BEV image  B I * D B  such that the Euclidean distance between the global descriptors  f ( B I * )  and  f ( B q I )  is minimized:
B I * = arg min B i I D B f ( B q I ) f ( B i I ) 2 = arg min B i I D B F B q I F B i I 2 ,
where  · 2  denotes the  2 -norm. The corresponding point cloud  D P *  is then determined based on  B I * .

3.2. Rotation-Robust Multi-Level Patch Feature Extraction Module

The 2D BEV image generated by the projection of 3D point clouds, along with its randomly rotated counterpart, are input into the rotation-robust multi-level patch feature extraction (R2MPFE) module to generate two high-dimensional local feature tensors, as shown in the middle part of Figure 1. This module consists of three components: CNN layers, a multi-layer multi-head self-attention (MHSA) module, and a multi-layer dual-branch self- and cross-attention (DSCA) module. The design of the first two components was inspired by [46].

3.2.1. CNN Layers

This module primarily consists of 8 convolution layers, whose connection relationships are illustrated in Figure 2. Among them,  C o n v 1 C o n v 4 , combined with  M a x P o o l i n g  operations, encode features from the BEV images, generating feature maps  F 1 F 4  while progressively reducing their spatial resolution compared to the original BEV images.  C o n v 5 C o n v 8 , combined with  F l a t t e n  operations, further process  F 1 F 4 , ultimately producing feature embeddings  S 1 S 4  with identical shapes, which are then concatenated along the channel dimension. According to the parameter settings in Table 1, the final output is a feature embedding S with a shape of  [ B , 196 , 128 ] , where B denotes the batch size. This process is analogous to the patch embedding operation in ViT [47], where a  224 × 224  BEV image is discretized into 196 tokens with a patch size of  7 × 7 , and each token has a feature dimension of 128. Unlike ViT, the feature embedding corresponding to each patch is composed of four feature embeddings with varying dimensions from low to high levels, thereby incorporating richer feature information, as shown in Figure 2.

3.2.2. Multi-Layer MHSA Module

MHSA is an extension of the self-attention mechanism and serves as a core component of the Transformer model [14]. By parallelizing multiple attention heads, MHSA captures diverse features from different subspaces within the sequence, thereby enhancing the model’s representational power. The fundamental computation unit in MHSA is Scale Dot-Product Attention (SDPA), as illustrated in Figure 3a. SDPA computes the relationships between the Query (Q), Key (K), and Value (V) to assign a weighted coefficient to each element in the sequence, dynamically generating a weighted output representation. The computation process is defined as follows [14]:
A ( Q , K , V ) = S o f t m a x ( Q K T d k ) V ,
where  d k  denotes the dimensionality of K. In the case of self-attention, Q, K, and V are typically derived from linear transformations of the same sequence. In contrast, in cross-attention, K and V are sourced from one sequence, while Q originates from a different sequence, establishing relationships between the two distinct sequences.
In our approach, we employed a multi-layer MHSA with shared weights to encode patch embeddings from the original and rotated BEV images. The outputs of each MHSA layer formed hierarchical patch features, which were concatenated to construct a local feature tensor that integrated features ranging from low-level details to high-level semantic information:
P F = C o n c a t e ( [ P F 1 , , P F M ] ) R N × M D ,
where  C o n c a t e  denotes the tensor concatenation operation along the channel dimension in our study, M represents the number of MHSA blocks, and N and D denote the length and feature dimension of the output features from each MHSA block, respectively.
The multi-layer MHSA module, combined with the frontend CNN layers, formed an architecture similar to ViT [47], providing functionality comparable to ViT. However, our design distinguishes itself by enabling easy access to the outputs of each MHSA block. Additionally, since our study did not involve classification tasks, we excluded the learnable  [ c l a s s ]  token used in the original ViT. Inspired by [46], spatial positional information was implicitly encoded in the patch embeddings through the frontend CNN layers, eliminating the need for explicit positional encoding as in the original ViT.

3.2.3. Multi-Layer DSCA Module

Cross-attention was originally designed to handle interactions between different input sequences. In this study, we combined it with self-attention to facilitate the interaction between the local features of the original BEV image and its rotated counterpart. Since the input BEV images were derived from the same point cloud and local features were extracted through a neural network with shared weights, the only difference lay in the rotation transformation. Therefore, the introduction of cross-attention enhanced the robustness of the front-end feature extraction network to rotation variations.
Specifically, for the multi-level patch features  P F  and  P F r  from the original and rotated images, we designed a dual-branch architecture with non-shared weights between identical modules, as shown in Figure 3b. Each branch consisted of a self-attention unit and a multi-head cross-attention (MHCA) block connected in series. The self-attention unit captured the internal long-range dependencies within the multi-layer patch features of  P F  and  P F r , while the MHCA block established associations between the patch features processed by self-attention.
( P F c , P F r c ) = D C A ( D S A ( P F , P F r ) ) ,
where  D S A  stands for dual self-attention,  D C A  denotes dual cross-attention, and c represents cross-attention.
Through these two parallel branches, the model achieved internal information association and the propagation of patch features before and after rotation. As a result, the obtained features  P F c  and  P F r c  incorporated both global contextual information from low-level to high-level (hierarchical) patch features and global dependencies between features before and after rotation. By stacking N DSCA blocks, the model effectively fused the intrinsic and extrinsic associations of multi-level patch features before and after rotation, thereby enhancing the robustness of local features to rotation variations.

3.3. Patch Features Aggregation Module

This module (PFA) aggregates the extracted multi-level patch features into a global feature descriptor that effectively characterizes place. As shown in Figure 1, the BEV image and its randomly rotated version were processed by the R2MPFE module, generating four local features:  P F P F r P F c , and  P F r c . Specifically,  P F  and  P F r  represent the multi-level patch features of the original BEV image and its randomly rotated counterpart, respectively, while  P F c  and  P F r c  denote the local features after interaction through the multi-layer DSCA module. These features exhibited distinct properties:  P F  and  P F r  corresponded to features in the original feature space, with their differences arising from the rotation transformation of the BEV image;  P F c  and  P F r c , on the other hand, represented features in the interaction space, containing information robust to rotation variations.
To fully leverage these local features, we employed four non-shared-weight gated NetVLAD layers [12] to aggregate the four types of features separately. The resulting four global feature descriptors were then concatenated to form the final global feature descriptor. Thanks to the proposed model design, this descriptor effectively maintains robustness to rotation variations. The schematic diagram of this part is detailed in the right section of Figure 1.

3.4. Loss Function

In this study, we employed the commonly used lazy triplet loss function [5] in LPR research for model training, which is formally defined as follows:
L l t ( T ) = max i ( [ m + δ p δ n i ] + ) ,
where  T = ( F B q I , { F B p I } , { F B n I } )  represents a training triplet. For a given query descriptor  F B q I , we used  k p  positive descriptors  { F B p I }  and  k n  negative descriptors  { F B n I } , respectively. The notation  [ · ] +  signifies the hinge loss, where m is a margin,  δ p  is the distance between the global feature descriptors of the query sample  B q  and its “positive” counterpart, and  δ n i  is the distance between  B i  and its i-th “negative” counterpart. It should be noted that with respect to the distinction between positive and negative samples, we considered a sample to be a positive sample if its geographical distance to the query sample was less than  ϵ  meters; otherwise, it was regarded as a negative sample.

4. Results

4.1. Datasets and Experimental Settings

4.1.1. Datasets

To validate the performance of the proposed model, we evaluated it on three datasets: KITTI [48], NCLT [49], and OffRoad-LPR. Specifically, the KITTI dataset was used for model training and standard testing, while the NCLT and OffRoad-LPR datasets were used to evaluate the model’s generalization capability. Table 2 summarizes some details of these datasets.
KITTI: This dataset contains 3D point clouds from a Velodyne HDL-64E LiDAR, with sequences 00-11, providing accurate ground-truth poses, suitable for training and evaluating LPR methods. Considering the large scale and numerous loop closures in sequences 00, 02, and 08, this study adopted the leave-one-out cross-validation strategy from RINet [3], using these three sequences as the test set and the remaining sequences for training. Sequence 08 included reverse loop closures, enabling evaluation of the model’s robustness to extreme viewpoint variations.
NCLT: This dataset consists of 3D point clouds captured by a Velodyne HDL-32 LiDAR, covering campus environments over a long period, making it ideal for evaluating the robustness of LPR models under variations in seasons, weather, lighting, and viewpoints. In this study, we followed the experimental setup outlined in [10], using sequences from “2012-01-15”, “2012-02-04”, “2012-03-17”, “2012-06-15”, “2012-09-28”, “2012-11-16”, and “2013-02-23” to assess the generalization ability of the model.
OffRoad-LPR: OffRoad-LPR is a custom-built dataset designed to evaluate the performance of LPR methods in large-scale off-road environments. It comprises two sequences: 00 and 01. The point clouds were collected with an RS-Ruby 128-line LiDAR from Robosense, with each point cloud frame precisely time-synchronized with its corresponding positioning data. The positioning data were provided by an RT-3000 high-precision integrated inertial navigation system from OXTS, ensuring centimeter-level positioning accuracy. Figure 4 presents the unmanned ground vehicle (UGV) and its sensor configuration used for data collection. It also shows the trajectory distribution along with representative LiDAR point clouds and images, which illustrate the typical terrain of the collection area.

4.1.2. Implementation Details

  • Hardware Configuration: We trained the models on a computing server with an Intel(R) Xeon(R) Gold 6354 CPU, 125GB of RAM, and a single NVIDIA A100 GPU with 40GB of VRAM. For the generalization performance experiments, all models were deployed on a vehicle-mounted computer equipped with an Intel i7-11800H CPU and an NVIDIA RTX 3070 GPU with 8GB of VRAM.
  • Data Processing: For BEV image generation, the grid resolution was  r = 0.2  m, with a maximum projection radius of  11.2  m. The resulting BEV images had a size of  224 × 224 .
  • Training Parameters: The model was trained from scratch using the strategy in Section 4.1.1. The Adam optimizer was used with an initial learning rate of 0.00001, dynamically adjusted using an exponential scheduler. The loss function parameter m was  0.3 , with  k p = 1  and  k n = 10 , respectively.
  • Model Parameters: In the R2MPFE module,  M = 6  MHSA blocks were used, each with four attention heads and an output feature dimension of 128. Other parameters followed the default values from [46]. The number of DSCA blocks was  N = 1 , with each MHCA having one attention head. The single NetVLAD block used 64 clusters, producing an output feature dimension of 64. The final global feature descriptor, obtained by concatenation, had a dimension of 256.

4.1.3. Evaluation Metrics

To comprehensively evaluate the performance differences between our model and other classical methods, we selected a series of quantitative and qualitative metrics.
(1) To evaluate place recognition performance and rotation robustness, we adopted the maximum  F 1  score as the quantitative metric, computed as follows:
P r e c i s i o n = T P T P + F P , R e c a l l = T P T P + F N , F 1 s c o r e = 2 × P r e c i s i o n × R e c a l l P r e c i s i o n + R e c a l l ,
where  T P F N T N , and  F P  represent true positives, false negatives, true negatives, and false positives, respectively. Additionally, we employed qualitative metrics such as the Precision–Recall (PR) curves, Top-1 retrieval along the trajectory, and feature maps to visually demonstrate the performance advantages of our model relative to other methods.
(2) To assess model generalization, we used the Recall@1 (Recall at top-1) as a quantitative metric on the NCLT dataset and the Recall@N (Recall at top-N) curve as a qualitative metric on the OffRoad-LPR dataset.

4.2. Place Recognition Performance Evaluation

In this section, we conduct both quantitative and qualitative comparisons of our method with several state-of-the-art approaches on multiple sequences of the KITTI dataset. The comparison methods include four classic handcrafted-based LPR methods (M2DP [19], SC [21], LI [20], SSC [22]) and nine learning-based LPR methods (PNV [5], DiSCO [44], SGPR [2], Locus [50], SC_LPR [51], OT [8], BEVPlace [9], BEVPlace++ [10]). Among the experimental results, OT, BEVPlace, and BEVPlace++ were reproduced by us, while the quantitative results for the remaining methods were obtained from publicly published academic papers.

4.2.1. Quantitative Results

Table 3 presents a comparison of the maximum  F 1  scores for place recognition on sequences 00, 02, and 08 of the KITTI dataset, comparing our model with other methods. In the table,  # 1  represents handcrafted-based methods,  # 2  denotes learning-based methods, and  # 3  indicates our proposed R2SCAT-LPR model.
As shown in Table 3, compared to handcrafted-based LPR methods, our model significantly outperformed the selected handcrafted-based methods on both individual sequences and average performance, with an average maximum  F 1  score 3.7% higher than the second-ranked SSC. In comparison with learning-based LPR methods, our selected comparison methods covered classic or state-of-the-art approaches based on 3D point clouds (PNV), sparse voxels (LoGG3D-Net), 2D projections (DiSCO, OT, BEVPlace, and BEVPlace++), and semantics (SGPR, Locus, and SC_LPR). Regardless of the method category, our model achieved higher maximum  F 1  scores on both individual sequences and their averages. Compared to the second-ranked metrics (underlined values in Table 3), our performance improved by 0.3%, 3.2%, 2.9%, and 2.7%, respectively. Although the state-of-the-art BEV projection-based LPR method, BEVPlace++, had performance similar to that of our method on sequence 00, our method surpassed it on the more challenging sequences 02 and 08 in terms of quantitative metrics.

4.2.2. Qualitative Results

PR Curves Analysis: Figure 5a–c present the PR curves of our model compared to OT [8], BEVPlace [9], and BEVPlace++ [10] on sequences 00, 02, and 08 of the KITTI dataset. The results indicate that across the three sequences, our model exhibited the slowest precision dropas recall increases, and its PR curve almost entirely covered those of other methods, demonstrating a clear advantage. BEVPlace++ ranked second in this regard, consistent with the quantitative results in Table 3.
Top-1 Retrieval Results Comparison: To visually illustrate the difference between our method and BEVPlace++ in actual place recognition performance, we plotted the Top-1 retrieval results along the trajectories of sequences 00, 02, and 08 of the KITTI dataset for both methods, as shown in Figure 6. In the figure, red, black, and blue points represent true positives, false negatives, and true negatives, respectively. Figure 6a,d show the detection results of BEVPlace++ and our R2SCAT-LPR on sequence 00, Figure 6b,e on sequence 02, and Figure 6c,f on sequence 08. It can be observed that while the detection results for both methods were similar on sequence 00, in certain trajectory segments of sequences 02 and 08, the number of false negatives (black points) in our method’s detection results was notably lower than that of BEVPlace++.

4.3. Viewpoint Variation Robustness Evaluation

To validate the robustness of the proposed model against viewpoint changes, we followed the testing strategy in SGPR [2] by applying random rotations to the point clouds from the KITTI dataset to simulate viewpoint variations. We then compared the place recognition performance of different methods on these randomly rotated sequences.

4.3.1. Quantitative Results

We performed random rotations around the z-axis of the point cloud coordinate system for sequences 00, 02, and 08 of the KITTI dataset, with rotation angles ranging from  0 360 , and generated corresponding BEV images. Table 4 presents the maximum  F 1  scores and their averages for place recognition on these sequences achieved by our model and other methods. According to the results in the table, the average maximum  F 1  scores of all methods on the randomly rotated sequences dropped to varying degrees. However, methods that incorporated rotation invariance or rotation robustness design (e.g., LI [20], SSC [22], BEVPlace [9], and BEVPlace++ [10]) exhibited relatively smaller performance drops.

4.3.2. Qualitative Results

Figure 5d–f show the PR curves of our R2SCAT-LPR model compared with BEVPlace [9] and BEVPlace++ [10] on the randomly rotated data of sequences 00, 02, and 08 from the KITTI dataset. The PR curves yielded conclusions consistent with Section 4.2.2 and aligned with the quantitative results in Table 4.
Additionally, we compared the local features encoded by BEVPlace, BEVPlace++, and our R2SCAT-LPR model from BEV images generated before and after rotating the same frame of point cloud, as illustrated in Figure 7. The local features displayed in the figure were extracted from the layers preceding the NetVLAD layer in all three models. We performed appropriate processing, such as merging, resizing, and normalization, on these features to ensure that the feature maps aligned with the size of the BEV images.
From the feature map comparisons in columns 2∼4 of Figure 7, it can be observed that the features extracted from rotated BEV images were generally consistent with those obtained by rotating the original BEV image features by the same angle. Among them, BEVPlace++ performed the best, followed by BEVPlace, while our method slightly underperformed on these two. However, our model focused more on the effective regions in the BEV images, and this capability was not degraded due to the rotation of the BEV images.

4.4. Generalization Performance Evaluation

To evaluate the generalization performance of our model across different scene types and LiDAR configurations, we trained the R2SCAT-LPR model exclusively on the KITTI dataset and assessed its performance on the NCLT [49] and OffRoad-LPR datasets.

4.4.1. Experiments on NCLT

Following BEVPlace++ [10], we constructed a place feature descriptor database using the “2012-01-1” sequence from the NCLT dataset and took sequences “2012-02-04”, “2012-03-17”, “2012-06-15”, “2012-09-28”, “2012-11-16”, and “2013-02-23” as query sequences. We compared the generalization performance of R2SCAT-LPR with M2DP [19], BoW3D [23], CVTNet [52], LoGG3D-Net [36], BEVPlace [9], and BEVPlace++ [10], using Recall@1 as the evaluation metric. The experimental results are presented in Table 5. As indicated, although the Recall@1 of R2SCAT-LPR on the “2012-02-04” and “2012-03-17” sequences was lower than that of BEVPlace++, it outperformed all other methods on the remaining sequences, achieving the best overall performance and surpassing the second-best method, BEVPlace++, by 2.0%.

4.4.2. Experiments on OffRoad-LPR

We constructed a place feature descriptor database using the “00” sequence from the OffRoad-LPR dataset and used the “01” sequence as the query sequence. We compared the generalization performance of our model with OT, BEVPlace, and BEVPlace++ on the OffRoad-LPR dataset and plotted the Recall@N curve to qualitatively compare the performance of different models, as shown in Figure 8. From the figure, it is evident that our model consistently achieved higher Recall@N values than the other comparison methods as N increased from 1 to 25, with a Recall@1 value exceeding other methods by more than 0.2.

4.5. Ablation Study

To validate the effectiveness of key modules and parameter settings in our model, we conducted a series of ablation studies on sequences 00, 02, and 08 of the KITTI dataset. The quantitative metrics used in all ablation experiments were the maximum  F 1  scores and their average for place recognition.

4.5.1. Ablation of the Effectiveness of the Rotation Enhancement Module Design

The rotation enhancement module is the key component enabling our model to extract rotation-robust global feature descriptors. It consists of two main parts: the Random Rotation Augmentation module (RA) for input BEV images and the Dual-branch self and cross attention module (DSCA). To validate the effectiveness of these two modules, we designed corresponding ablation experiments, and the results are presented in Table 6. Specifically,  # 3  represents the complete R2SCAT-LPR, including both the RA and DSCA modules;  # 1  denotes the removal of both the RA and DSCA modules from  # 3 , leaving the model with only a multi-level patch feature extraction module and a NetVLAD layer, referred to as R2SCAT-LPR-★;  # 2  indicates the removal of only the DSCA module from  # 3 , referred to as R2SCAT-LPR- , where the model retains two NetVLAD layers to aggregate features from the original BEV image and its randomly rotated version, respectively.
From the results in Table 6, the best performance was achieved only when both the RA and DSCA modules were present ( # 3 ), with an 11.4% improvement in overall performance compared to  # 1  and a 7.2% improvement compared to  # 2 . Furthermore, these two modules had a particularly significant impact on the place recognition performance in sequences 00 and 08, further validating the effectiveness of the designed rotation enhancement module.
Figure 9 visually compares the local features extracted by R2SCAT-LPR and its ablated versions, R2SCAT-LPR-★ and R2SCAT-LPR- , from the original BEV image and its randomly rotated counterpart. The figure shows that all three models could focus on regions rich in semantic information. However, the features of R2SCAT-LPR-★ and R2SCAT-LPR-  covered limited key regions and included more background areas. Additionally, when the input BEV image underwent rotation, the features of R2SCAT-LPR-★ and R2SCAT-LPR-  changed accordingly but exhibited noticeable differences compared to the features before rotation. In contrast, R2SCAT-LPR demonstrated the best performance, thereby proving the necessity of the RA and DSCA modules.

4.5.2. Ablation of the Number of MHSA and DSCA Blocks

We used M layers of cascaded MHSA blocks to extract patch features and concatenate the outputs of each MHSA block to form multi-level patch features. Subsequently, N layers of DSCA blocks were used to establish intrinsic relationships between multi-level patch features before and after random rotation. To investigate the impact of the number of MHSA and DSCA blocks on model performance, we designed ablation experiments with respect to M and N. In the experiments, M was set to 4 and 6, while N took values of 0, 1, 2, and 3. The results are shown in Table 7, where  # 1  refers to changing the value of M while keeping N constant and  # 2  refers to changing the value of N while keeping M constant. The results indicate that when  M = 6  and  N = 1 , the model achieved the best overall performance (96.4%), with optimal performance on sequences 00 and 08 of the KITTI dataset (93.7% and 96.9%, respectively). Furthermore, the results show that increasing the number of MHSA and DSCA blocks did not always improve performance, and the values of M and N needed to be balanced against model size, computational efficiency, and actual performance.

4.5.3. Ablation of the Number of Cross-Attention Heads in the DSCA Block

The DSCA module consists of a self-attention block and a multi-head cross-attention (MHCA) block. To explore the impact of the number of cross attention heads ( H c ) in MHCA of the DSCA block on model performance, we conducted experiments by keeping other parameters constant and setting  H c  to 1, 2, and 3. The results are shown in Table 8. The results indicate that the model performed best when  H c = 1 . Further increasing  H c  led to a decline in performance on individual sequences and average performance, particularly on sequences 02 and 08 of the KITTI dataset, where the performance drop was significant. Therefore, in the complete R2SCAT-LPR, we adopted  H c = 1 .

4.5.4. Ablation of the Number of NetVLAD Blocks

In the feature aggregation module, we used four gated NetVLAD layers to aggregate the four multi-level patch features output by the R2MPFE module into four 64-dimensional 1D feature descriptors, which were then concatenated to form a 256-dimensional global feature descriptor. To validate the impact of the number of NetVLAD layers (n) on model performance, we kept other parameters unchanged and set n to 1, 2, and 4. The results are shown in Table 9. Specifically, when  n = 1 , the four patch features from R2MPFE were concatenated into a single feature tensor and fed into the NetVLAD layer for aggregation. When  n = 2 , the  P F  and  P F r  outputs from R2MPFE were concatenated into  P F O  (representing local features in the original feature space), while  P F c  and  P F r c  are concatenated into  P F I  (representing local features in the interaction space). Then, two NetVLAD layers aggregated  P F O  and  P F I  into 128-dimensional feature descriptors, which were concatenated along the channel dimension. The experiment results show that the model achieved optimal performance in terms of both single-sequence and average performance only when  n = 4 , with a relatively small increase in model size compared to  n = 1  or  n = 2 . Therefore, we ultimately set  n = 4 .

4.5.5. Ablation of the Dimensionality of the Global Feature Descriptor

The dimensionality (D) of the global feature descriptor could affect model performance. In the LPR field, D is typically set to 256, but some methods, such as BEVPlace [9] and BEVPlace++ [10], set D to 8192 or other values. To evaluate the impact of D on model performance, we conducted experiments using four NetVLAD layers and set the final output dimension D to 256, 512, and 1024. The results are shown in Table 10. The results indicate that as D increased, model performance declined rather than improved. Additionally, increasing the dimensionality of the output features led to larger model sizes and higher computational costs. Therefore, considering both model performance and computational efficiency, and to ensure fair comparison with other methods, we ultimately set D to 256.

5. Discussion

This section provides an in-depth analysis and discussion of the experimental results.

5.1. Discussion of Place Recognition Performance

The quantitative results demonstrate that our R2SCAT-LPR model performs exceptionally well across multiple sequences of the KITTI dataset, significantly outperforming state-of-the-art handcrafted and learning-based methods in terms of maximum  F 1  scores on individual sequences as well as their averages. This confirms the superiority of our proposed model.
From the qualitative results, the comparison of PR curves and Top-1 retrieval results reveals that different methods performed significantly better on sequence 00 than on sequences 02 and 08. Sequence 08 primarily consisted of reverse loop closures, which were more challenging than those in sequence 00. Sequence 02, in addition to reverse loop closures, contained multiple geometrically similar repetitive scenes, further increasing the difficulty for the model’s feature representation capabilities. Our model outperformed the comparison methods on both metrics, as shown in Table 3, which visually demonstrates the superiority of our model’s performance. This was especially evident in its ability to reduce false negatives in complex scenes and improve place recognition accuracy.

5.2. Discussion of Viewpoint Variation Robustness

The quantitative results from the comparison experiments on randomly rotated sequences from the KITTI dataset highlight the importance of rotation-robust/invariant design in ensuring LPR model performance. Although our model experienced slightly greater degradation in average performance compared to BEVPlace and BEVPlace++, its maximum  F 1  scores for individual sequences, along with their averages, still surpassed all comparison methods, including BEVPlace and BEVPlace++, further confirming the effectiveness of our model’s rotation-robust design.
Qualitative results from the PR curve comparisons in Figure 5d–f reinforce our model’s superiority over the current best learning-based methods. The smaller differences between the features extracted by BEVPlace and BEVPlace++ from rotated BEV images, compared to those from the original BEV images rotated by the same angle (see Figure 7f with Figure 7i and Figure 7g with Figure 7j), were attributed to the rotation-invariant designs of BEVPlace and BEVPlace++. BEVPlace uses group convolutions combined with scale changes and rotation augmentation strategies, while BEVPlace++ covers rotation angles from  0  to  360 . In contrast, R2SCAT-LPR employs only a single random rotation augmentation, which enhances the model’s robustness to rotation variations and improves computational efficiency but limits its ability to achieve full rotation invariance, as reflected in the Cmp value differences in Table 4.
Additionally, the feature map comparisons show that R2SCAT-LPR places more emphasis on semantically rich regions of the scene (e.g., road edges, vehicles), thereby minimizing interference from background information. Combined with the quantitative metrics in Table 3 and Table 4, these results indicate that factors affecting overall model performance include not only rotation invariance but also the ability to capture global contextual information in a scene. R2SCAT-LPR compensates for the limitations of rotation-invariant design through a specially designed contextual information capture mechanism, leading to superior overall performance compared to other methods.

5.3. Discussion of Generalization Ability

We evaluated the generalization capability of the proposed model on the NCLT and OffRoad-LPR datasets. As shown in Table 2, the three datasets exhibited significant differences in both scene types and LiDAR types, leading to notable variations in point cloud distribution, which posed substantial challenges to the model’s generalization performance. Additionally, the NCLT dataset contained more loop closures, while the OffRoad-LPR scenes were larger in scale and featured terrain significantly different from the structured urban or campus traffic environments. The quantitative metrics in Table 5 and the qualitative results in Figure 8 indicate that R2SCAT-LPR demonstrates superior adaptability to different types of scenes and LiDAR sensors compared to other methods. However, in contrast to the near-saturated performance achieved on the KITTI dataset, there is still considerable room for improvement in R2SCAT-LPR’s performance on the NCLT and OffRoad-LPR datasets.

5.4. Discussion of Ablation Studies

The ablation experiments on the KITTI dataset show that the rotation augmentation module (RA and DSCA) is crucial for enhancing model performance. Removing these modules significantly degrades performance, particularly in complex scenes (e.g., sequences “02” and “08”). Furthermore, the number of MHSA and DSCA modules, the number of MHCA heads, and the number of NetVLAD layers all significantly impact model performance. These results indicate that a balanced configuration of modules and parameters can optimize model size, computational efficiency, and performance, ensuring the model’s practicality and reliability in real-world applications.

5.5. Discussion of Model’s Efficiency

We evaluated the runtime efficiency of the model on the OffRoad-LPR dataset. As described in Section 4.1.2, we deployed the model on a vehicle-mounted computer equipped with an Intel i7-11800H CPU and an NVIDIA RTX 3070 GPU with 8GB of VRAM. The model’s parameter scale, Floating Point Operations Per Second (FLOPs), feature encoding time for a single BEV image, and place recognition searching time are presented in Table 11. The data in the table indicate that OT achieved the highest efficiency, benefitting from its backbone network combining fully convolutional and Transformer architectures. In contrast, although BEVPlace had the smallest parameter scale, it required up to 25 data augmentation operations internally, resulting in the lowest computational efficiency. Compared to BEVPlace++, our model, despite having a larger parameter scale, significantly reduced data augmentation and feature extraction time by employing weight sharing and using only a single random rotation enhancement in the design for rotational robustness. As a result, the FLOPs of our model were lower than those of BEVPlace++, and the total processing time for a single BEV image was approximately 12.28 ms, meeting the real-time requirements of UGV platforms or robots. This demonstrates the strong deployment potential of our model.

6. Conclusions

In this work, we proposed a novel viewpoint-robust LPR model, R2SCAT-LPR, which incorporates self-attention and cross-attention mechanisms as its core components. In the local feature extraction stage, we designed the R2MPFE module, which utilizes cascaded MHSA blocks to extract patch features containing multi-level global contextual information from 2D BEV images of 3D point clouds. To enhance rotation robustness, we extracted additional multi-level patch features from the randomly rotated counterpart of the original BEV image using the weight-shared R2MPFE module. In the feature interaction phase, we constructed a dual-branch DSCA module based on self-attention and MHCA blocks to establish intrinsic relationships between multi-level patch features corresponding to the original BEV image and its randomly rotated version, capturing rotation-robust local features. In the feature aggregation phase, we employed four parallel NetVLAD blocks to aggregate multi-level patch features from the original feature space and local features from the rotation interaction space, concatenating the resulting descriptors into a compact global feature descriptor for place recognition. Experiments on the KITTI, NCLT, and OffRoad-LPR datasets validated the effectiveness of the model’s component designs and demonstrate its superiority over state-of-the-art methods in terms of place recognition accuracy and generalization performance.
However, our experiments revealed several limitations of our model and potential directions for future improvement: (1) Rotation Robustness Design: Experimental results on the KITTI dataset show that the model’s performance on sequence “00” nearly reached saturation, while there was still room for improvement on sequences “02” and “08”. This indicates that the current rotation-robust design has limitations compared to a more rigorous rotation-invariant design. Future work should focus on in-depth research into the design of rotation-invariant network architectures. (2) Model Generalization Ability: Although our model achieved significant performance improvements on multiple sequences of the KITTI dataset, its performance on the NCLT and OffRoad-LPR datasets still has considerable room for improvement. This suggests that the model’s generalization ability across different types of scenes and sensor configurations needs to be further enhanced, which will be an important direction for future research. (3) Model Efficiency: Although our model has a certain advantage in processing time compared to baseline methods, there is still room for optimization in terms of parameter size and FLOPs. Additionally, the brute-force search strategy adopted in the place recognition searching stage may have led to increased retrieval time as the scene scale grew. Therefore, exploring more lightweight model architectures and adopting more efficient retrieval strategies will be critical for future improvements.

Author Contributions

Conceptualization, W.J. and H.X.; methodology, W.J., H.X. and S.S.; software, W.J.; validation, W.J. and L.X.; formal analysis, W.J., H.X. and S.S.; investigation, W.J. and L.X.; resources, W.J., H.X. and D.Z.; data curation, W.J. and Q.Z.; writing—original draft preparation, W.J.; writing—review and editing, W.J., H.X., S.S., L.X., D.Z., Q.Z., Y.N. and B.D.; visualization, W.J. and H.X.; supervision, L.X., Y.N. and B.D.; project administration, Q.Z., Y.N. and B.D.; funding acquisition, L.X., D.Z., Q.Z., Y.N. and B.D. All authors have read and agreed to the published version of the manuscript.

Funding

This research was supported by some internal projects of the Defense Innovation Institution.

Data Availability Statement

The original contributions presented in this study are included in the article; further inquiries can be directed to the corresponding authors.

Conflicts of Interest

The authors declare no conflicts of interest.

Abbreviations

The following abbreviations are used in this manuscript:
LiDARLight Detection and Ranging
LPRLiDAR-based Place Recognition
BEVBird’s Eye View
R2SCATRotation-Robust Network with Self- and Cross-Attention Transformers
R2MPFERotation-Robust Multi-Level Patch Features Extraction
MHSAMulti Head Self-Attention
MHCAMulti Head Cross-Attention
DSCADual-Branch Self- and Cross-Attention
PFAPatch Feature Aggregation

References

  1. Yin, P.; Zhao, S.; Cisneros, I.; Abuduweili, A.; Huang, G.; Milford, M.; Liu, C.; Choset, H.; Scherer, S. General place recognition survey: Towards the real-world autonomy age. arXiv 2022, arXiv:2209.04497. [Google Scholar]
  2. Kong, X.; Yang, X.; Zhai, G.; Zhao, X.; Zeng, X.; Wang, M.; Liu, Y.; Li, W.; Wen, F. Semantic graph based place recognition for 3D point clouds. In Proceedings of the 2020 IEEE/RSJ International Conference on Intelligent Robots and Systems (IROS), Las Vegas, NV, USA, 25–29 October 2020; pp. 8216–8223. [Google Scholar]
  3. Li, L.; Kong, X.; Zhao, X.; Huang, T.; Li, W.; Wen, F.; Zhang, H.; Liu, Y. RINet: Efficient 3D LiDAR-based place recognition using rotation invariant neural network. IEEE Robot. Autom. Lett. 2022, 7, 4321–4328. [Google Scholar] [CrossRef]
  4. Cao, F.; Yan, F.; Wang, S.; Zhuang, Y.; Wang, W. Season-invariant and viewpoint-tolerant LiDAR place recognition in GPS-denied environments. IEEE Trans. Ind. Electron. 2020, 68, 563–574. [Google Scholar] [CrossRef]
  5. Uy, M.A.; Lee, G.H. PointNetVLAD: Deep point cloud based retrieval for large-scale place recognition. In Proceedings of the IEEE Conference on Computer Vision and Pattern Recognition (CVPR), Salt Lake City, UT, USA, 18–22 June 2018; pp. 4470–4479. [Google Scholar]
  6. Jiang, W.; Xue, H.; Si, S.; Min, C.; Xiao, L.; Nie, Y.; Dai, B. SG-LPR: Semantic-Guided LiDAR-Based Place Recognition. Electronics 2024, 13, 4532. [Google Scholar] [CrossRef]
  7. Chen, X.; Läbe, T.; Milioto, A.; Röhling, T.; Vysotska, O.; Haag, A.; Behley, J.; Stachniss, C. OverlapNet: Loop closing for LiDAR-based SLAM. arXiv 2021, arXiv:2105.11344. [Google Scholar]
  8. Ma, J.; Zhang, J.; Xu, J.; Ai, R.; Gu, W.; Chen, X. OverlapTransformer: An efficient and yaw-angle-invariant transformer network for LiDAR-based place recognition. IEEE Robot. Autom. Lett. 2022, 7, 6958–6965. [Google Scholar] [CrossRef]
  9. Luo, L.; Zheng, S.; Li, Y.; Fan, Y.; Yu, B.; Cao, S.Y.; Li, J.; Shen, H.L. BEVPlace: Learning LiDAR-based place recognition using bird’s eye view images. In Proceedings of the IEEE/CVF International Conference on Computer Vision (ICCV), Paris, France, 1–6 October 2023; pp. 8700–8709. [Google Scholar]
  10. Luo, L.; Cao, S.; Li, X.; Xu, J.; Ai, R.; Yu, Z.; Chen, X. BEVPlace++: Fast, Robust, and Lightweight LiDAR Global Localization for Unmanned Ground Vehicles. arXiv 2024, arXiv:2408.01841. [Google Scholar]
  11. Yin, H.; Xu, X.; Lu, S.; Chen, X.; Xiong, R.; Shen, S.; Stachniss, C.; Wang, Y. A survey on global lidar localization: Challenges, advances and open problems. Int. J. Comput. Vis. 2024, 132, 3139–3171. [Google Scholar] [CrossRef]
  12. Arandjelovic, R.; Gronat, P.; Torii, A.; Pajdla, T.; Sivic, J. NetVLAD: CNN architecture for weakly supervised place recognition. In Proceedings of the IEEE Conference on Computer Vision and Pattern Recognition (CVPR), Las Vegas, NV, USA, 26 June–1 July 2016; pp. 5297–5307. [Google Scholar]
  13. He, K.; Zhang, X.; Ren, S.; Sun, J. Deep residual learning for image recognition. In Proceedings of the IEEE Conference on Computer Vision and Pattern Recognition (CVPR), Las Vegas, NV, USA, 26 June–1 July 2016; pp. 770–778. [Google Scholar]
  14. Vaswani, A.; Shazeer, N.; Parmar, N.; Uszkoreit, J.; Jones, L.; Gomez, A.N.; Kaiser, Ł.; Polosukhin, I. Attention is all you need. Adv. Neural Inf. Process. Syst. (NIPS) 2017, 30, 5998–6008. [Google Scholar]
  15. Liu, Y.; Ong, N.; Peng, K.; Xiong, B.; Wang, Q.; Hou, R.; Khabsa, M.; Yang, K.; Liu, D.; Williamson, D.S.; et al. Mmvit: Multiscale multiview vision transformers. arXiv 2023, arXiv:2305.00104. [Google Scholar]
  16. Shen, J.; Chen, Y.; Liu, Y.; Zuo, X.; Fan, H.; Yang, W. ICAFusion: Iterative cross-attention guided feature fusion for multispectral object detection. Pattern Recognit. 2024, 145, 109913. [Google Scholar] [CrossRef]
  17. Joo, H.J.; Kim, J. IS-CAT: Intensity–Spatial Cross-Attention Transformer for LiDAR-Based Place Recognition. Sensors 2024, 24, 582. [Google Scholar] [CrossRef]
  18. Chen, C.F.R.; Fan, Q.; Panda, R. Crossvit: Cross-attention multi-scale vision transformer for image classification. In Proceedings of the IEEE/CVF International Conference on Computer Vision, Virtual, 11–17 October 2021; pp. 357–366. [Google Scholar]
  19. He, L.; Wang, X.; Zhang, H. M2DP: A novel 3D point cloud descriptor and its application in loop closure detection. In Proceedings of the 2016 IEEE/RSJ International Conference on Intelligent Robots and Systems (IROS), Daejeon, Republic of Korea, 9–14 October 2016; pp. 231–237. [Google Scholar]
  20. Wang, Y.; Sun, Z.; Xu, C.Z.; Sarma, S.E.; Yang, J.; Kong, H. LiDAR iris for loop-closure detection. In Proceedings of the 2020 IEEE/RSJ International Conference on Intelligent Robots and Systems (IROS), Virtual, 25–29 October 2020; pp. 5769–5775. [Google Scholar]
  21. Kim, G.; Kim, A. Scan Context: Egocentric spatial descriptor for place recognition within 3D point cloud map. In Proceedings of the 2018 IEEE/RSJ International Conference on Intelligent Robots and Systems (IROS), Madrid, Spain, 1–5 October 2018; pp. 4802–4809. [Google Scholar]
  22. Li, L.; Kong, X.; Zhao, X.; Huang, T.; Li, W.; Wen, F.; Zhang, H.; Liu, Y. SSC: Semantic scan context for large-scale place recognition. In Proceedings of the 2021 IEEE/RSJ International Conference on Intelligent Robots and Systems (IROS), Virtual, 27 September–1 October 2021; pp. 2092–2099. [Google Scholar]
  23. Cui, Y.; Chen, X.; Zhang, Y.; Dong, J.; Wu, Q.; Zhu, F. Bow3d: Bag of words for real-time loop closing in 3D lidar slam. IEEE Robot. Autom. Lett. 2022, 8, 2828–2835. [Google Scholar] [CrossRef]
  24. Cui, Y.; Zhang, Y.; Dong, J.; Sun, H.; Chen, X.; Zhu, F. LinK3D: Linear Keypoints Representation for 3D LiDAR Point Cloud. IEEE Robot. Autom. Lett. 2024, 9, 2128–2135. [Google Scholar] [CrossRef]
  25. Zou, X.; Li, J.; Wang, Y.; Liang, F.; Wu, W.; Wang, H.; Yang, B.; Dong, Z. PatchAugNet: Patch feature augmentation-based heterogeneous point cloud place recognition in large-scale street scenes. ISPRS J. Photogramm. Remote Sens. 2023, 206, 273–292. [Google Scholar] [CrossRef]
  26. Qi, C.R.; Su, H.; Mo, K.; Guibas, L.J. Pointnet: Deep learning on point sets for 3D classification and segmentation. In Proceedings of the IEEE Conference on Computer Vision and Pattern Recognition, Honolulu, HI, USA, 21–26 July 2017; pp. 652–660. [Google Scholar]
  27. Zhang, W.; Xiao, C. PCAN: 3D attention map learning using contextual information for point cloud based retrieval. In Proceedings of the IEEE/CVF Conference on Computer Vision and Pattern Recognition, Long Beach, CA, USA, 15–20 June 2019; pp. 12436–12445. [Google Scholar]
  28. Liu, Z.; Zhou, S.; Suo, C.; Yin, P.; Chen, W.; Wang, H.; Li, H.; Liu, Y.H. Lpd-net: 3D point cloud learning for large-scale place recognition and environment analysis. In Proceedings of the IEEE/CVF International Conference on Computer Vision, Seoul, Republic of Korea, 27 October–2 November 2019; pp. 2831–2840. [Google Scholar]
  29. Xia, Y.; Xu, Y.; Li, S.; Wang, R.; Du, J.; Cremers, D.; Stilla, U. SOE-Net: A self-attention and orientation encoding network for point cloud based place recognition. In Proceedings of the IEEE/CVF Conference on Computer Vision and Pattern Recognition, Virtual, 19–25 June 2021; pp. 11348–11357. [Google Scholar]
  30. Sun, Q.; Liu, H.; He, J.; Fan, Z.; Du, X. Dagc: Employing dual attention and graph convolution for point cloud based place recognition. In Proceedings of the 2020 International Conference on Multimedia Retrieval, Dublin, Ireland, 8–11 June 2020; pp. 224–232. [Google Scholar]
  31. Hui, L.; Yang, H.; Cheng, M.; Xie, J.; Yang, J. Pyramid point cloud transformer for large-scale place recognition. In Proceedings of the IEEE/CVF International Conference on Computer Vision (ICCV), Virtual, 11–17 October 2021; pp. 6098–6107. [Google Scholar]
  32. Komorowski, J. Minkloc3d: Point cloud based large-scale place recognition. In Proceedings of the IEEE/CVF Winter Conference on Applications of Computer Vision (WACV), Virtual, 5–9 January 2021; pp. 1790–1799. [Google Scholar]
  33. Komorowski, J. Improving point cloud based place recognition with ranking-based loss and large batch training. In Proceedings of the 2022 26th International Conference on Pattern Recognition (ICPR), Montreal, QC, Canada, 21–25 August 2022; pp. 3699–3705. [Google Scholar]
  34. Xu, T.X.; Guo, Y.C.; Li, Z.; Yu, G.; Lai, Y.K.; Zhang, S.H. TransLoc3D: Point cloud based large-scale place recognition using adaptive receptive fields. arXiv 2021, arXiv:2105.11605. [Google Scholar] [CrossRef]
  35. Cattaneo, D.; Vaghi, M.; Valada, A. Lcdnet: Deep loop closure detection and point cloud registration for lidar slam. IEEE Trans. Robot. 2022, 38, 2074–2093. [Google Scholar] [CrossRef]
  36. Vidanapathirana, K.; Ramezani, M.; Moghadam, P.; Sridharan, S.; Fookes, C. LoGG3D-Net: Locally guided global descriptor learning for 3D place recognition. In Proceedings of the 2022 International Conference on Robotics and Automation (ICRA), Philadelphia, PA, USA, 23–27 May 2022; pp. 2215–2221. [Google Scholar]
  37. Zhou, Z.; Zhao, C.; Adolfsson, D.; Su, S.; Gao, Y.; Duckett, T.; Sun, L. NDT-Transformer: Large-scale 3D point cloud localisation using the normal distribution transform representation. In Proceedings of the 2021 IEEE International Conference on Robotics and Automation (ICRA), Xi’an, China, 30 May–5 June 2021; pp. 5654–5660. [Google Scholar]
  38. Xia, Y.; Gladkova, M.; Wang, R.; Li, Q.; Stilla, U.; Henriques, J.F.; Cremers, D. Casspr: Cross attention single scan place recognition. In Proceedings of the IEEE/CVF International Conference on Computer Vision, Paris, France, 2–6 October 2023; pp. 8461–8472. [Google Scholar]
  39. Wu, T.; Fu, H.; Liu, B.; Xue, H.; Ren, R.; Tu, Z. Detailed analysis on generating the range image for lidar point cloud processing. Electronics 2021, 10, 1224. [Google Scholar] [CrossRef]
  40. Yin, P.; Wang, F.; Egorov, A.; Hou, J.; Zhang, J.; Choset, H. Seqspherevlad: Sequence matching enhanced orientation-invariant place recognition. In Proceedings of the 2020 IEEE/RSJ International Conference on Intelligent Robots and Systems (IROS), Las Vegas, NV, USA, 25–29 October 2020; pp. 5024–5029. [Google Scholar]
  41. Zhao, S.; Yin, P.; Yi, G.; Scherer, S. Spherevlad++: Attention-based and signal-enhanced viewpoint invariant descriptor. IEEE Robot. Autom. Lett. 2022, 8, 256–263. [Google Scholar] [CrossRef]
  42. Lu, S.; Xu, X.; Yin, H.; Chen, Z.; Xiong, R.; Wang, Y. One ring to rule them all: Radon sinogram for place recognition, orientation and translation estimation. In Proceedings of the 2022 IEEE/RSJ International Conference on Intelligent Robots and Systems (IROS), Kyoto, Japan, 23–27 October 2022; pp. 2778–2785. [Google Scholar]
  43. Lu, S.; Xu, X.; Tang, L.; Xiong, R.; Wang, Y. DeepRING: Learning roto-translation invariant representation for LiDAR based place recognition. In Proceedings of the 2023 IEEE International Conference on Robotics and Automation (ICRA), London, UK, 29 May–2 June 2023; pp. 1904–1911. [Google Scholar]
  44. Xu, X.; Yin, H.; Chen, Z.; Li, Y.; Wang, Y.; Xiong, R. Disco: Differentiable scan context with orientation. IEEE Robot. Autom. Lett. 2021, 6, 2791–2798. [Google Scholar] [CrossRef]
  45. Yuan, C.; Lin, J.; Liu, Z.; Wei, H.; Hong, X.; Zhang, F. BTC: A Binary and Triangle Combined Descriptor for 3D Place Recognition. IEEE Trans. Robot. 2024, 40, 1580–1599. [Google Scholar] [CrossRef]
  46. Wang, R.; Shen, Y.; Zuo, W.; Zhou, S.; Zheng, N. Transvpr: Transformer-based place recognition with multi-level attention aggregation. In Proceedings of the IEEE/CVF Conference on Computer Vision and Pattern Recognition, New Orleans, LA, USA, 18–24 June 2022; pp. 13648–13657. [Google Scholar]
  47. Dosovitskiy, A.; Beyer, L.; Kolesnikov, A.; Weissenborn, D.; Zhai, X.; Unterthiner, T.; Dehghani, M.; Minderer, M.; Heigold, G.; Gelly, S.; et al. An image is worth 16x16 words: Transformers for image recognition at scale. arXiv 2020, arXiv:2010.11929. [Google Scholar]
  48. Geiger, A.; Lenz, P.; Urtasun, R. Are we ready for autonomous driving? The kitti vision benchmark suite. In Proceedings of the 2012 IEEE Conference on Computer Vision and Pattern Recognition (CVPR), Providence, RI, USA, 16–21 June 2012; pp. 3354–3361. [Google Scholar]
  49. Carlevaris-Bianco, N.; Ushani, A.K.; Eustice, R.M. University of Michigan North Campus long-term vision and lidar dataset. Int. J. Robot. Res. 2016, 35, 1023–1035. [Google Scholar] [CrossRef]
  50. Vidanapathirana, K.; Moghadam, P.; Harwood, B.; Zhao, M.; Sridharan, S.; Fookes, C. Locus: LiDAR-based place recognition using spatiotemporal higher-order pooling. In Proceedings of the 2021 IEEE International Conference on Robotics and Automation (ICRA), Xi’an, China, 30 May–5 June 2021; pp. 5075–5081. [Google Scholar]
  51. Kong, D.; Li, X.; Xu, Q.; Hu, Y.; Ni, P. SC_LPR: Semantically consistent LiDAR place recognition based on chained cascade network in long-term dynamic environments. IEEE Trans. Image Process. 2024, 33, 2145–2157. [Google Scholar] [CrossRef] [PubMed]
  52. Ma, J.; Xiong, G.; Xu, J.; Chen, X. CVTNet: A cross-view transformer network for LiDAR-based place recognition in autonomous driving environments. IEEE Trans. Ind. Inform. 2023, 20, 4039–4048. [Google Scholar] [CrossRef]
Figure 1. Overview of the proposed R2SCAT-LPR architecture. It consists of a BEV image generation module, a shared-weight rotation-robust multi-level patch feature extraction module (R2MPFE), and a combined NetVLAD module, which aggregates patch features into a global feature descriptor for LPR (PFA). In the figure, different colors are used to distinguish neural network modules, where the four differently colored NetVLAD blocks indicate that they do not share weights, thereby generating independent global feature descriptors corresponding to each color.
Remotesensing 17 01057 g001
Figure 2. The structure of CNN layers for multi-level patch embedding.
Remotesensing 17 01057 g002
Figure 3. Dual self- and cross-attention unit for interacting multi-level patch features. (a) illustrates the architecture of the fundamental unit, Scale Dot-Product Attention, which underlies both self-attention and cross-attention mechanisms; (b) captures the intrinsic relationships between multi-level patch features of the original BEV image and its randomly rotated counterpart.
Remotesensing 17 01057 g003
Figure 4. Sequences and the recording platform of OffRoad-LPR dataset.
Remotesensing 17 01057 g004
Figure 5. The P–R curves on multiple sequences of original and rotated KITTI dataset.
Remotesensing 17 01057 g005
Figure 6. Qualitative performance at top-1 retrieval of BEVPlace++ and our R2SCAT-LPR models on multiple sequences of KITTI along the trajectories. Red: true positives, black: false negatives, blue: true negatives.
Remotesensing 17 01057 g006
Figure 7. Comparison of local features extracted by BEVPlace [9], BEVPlace++ [10], and R2SCAT-LPR from the original BEV image and its rotated counterpart. (a,e) show the original BEV image and its 90° counterclockwise rotated version, respectively. (bd) display the local features extracted by BEVPlace, BEVPlace++, and R2SCAT-LPR on the original BEV image. (fh) illustrate the local features extracted by the corresponding methods from the rotated image. (ik) present the features obtained by the counterclockwise rotation of (bd) by 90°.
Remotesensing 17 01057 g007
Figure 8. Place recognition results using OffRoad-LPR dataset sequence 00 as database and 01 as query.
Remotesensing 17 01057 g008
Figure 9. Comparison of local features extracted by R2SCAT-LPR and its ablation versions in original and random rotated BEV images. (a) represents the original BEV image; (e) is the result of a random rotation of (a). (bd) are the local features extracted by R2SCAT-LPR-★, R2SCAT-LPR- , and R2SCAT-LPR on the original image, respectively; (fh) are the local features extracted by the three models on the rotated image, respectively. R2SCAT-LPR-★ and R2SCAT-LPR-  are the ablation versions with the RA+DSCA modules and only the DSCA module removed, respectively (see  # 1  and  # 2  in Table 6).
Remotesensing 17 01057 g009
Table 1. The key parameters of the CNN layers for patch embedding.
OperatorChannels 1Kernel_SizeStridePaddingOut_Shape 2
Conv1(3, 64)311   64 × 112 × 112
Conv2(64, 128)311   128 × 56 × 56
Conv3(128, 256)311   256 × 28 × 28
Conv4(256, 512)311   512 × 14 × 14
Conv5(64, 32)880   32 × 14 × 14
Conv6(128, 32)440   32 × 14 × 14
Conv7(256, 32)220   32 × 14 × 14
Conv8(512, 32)110   32 × 14 × 14
MaxPooling-321-
Flatten(2, 3)---   32 × 196
1 “Channels” represents the (input channels, output channels). 2 “Out_shape” denotes the shape of the output tensor, where the “Out_shape” from rows 1 to 4 correspond to the shape of the output tensor after applying the MaxPooling layer combined with Conv1 to Conv4.
Table 2. Details of evaluation datasets.
DatasetKITTI [48]NCLT [49]OffRoad-LPR
LiDAR TypeVelodyne HDL-64EVelodyne HDL-32ERobosense Ruby-128
Scene TypeCity, CountryCampusOff-Road
No. of Sequences *1172
Trajectory Length5 km10 km17.5 km
* “No. of Sequences” refers to the number of sequences used for model training or evaluation, rather than the total number of sequences contained in the dataset.
Table 3. F 1  max scores on original KITTI dataset.
#Methods000208Mean
1M2DP [19]0.7080.7170.0730.499
SC [21]0.7500.7820.6070.713
LI [20]0.6680.7620.4780.636
SSC [22]0.9510.8910.9400.927
2PNV [5]0.7790.7270.0370.514
DiSCO [44]0.9640.8920.9030.920
LoGG3D-Net [36]0.9530.8880.8430.895
SGPR [2]0.8200.7510.7500.774
Locus [50]0.9570.7450.9000.867
SC_LPR [51]0.9000.8700.6500.807
OT [8]0.9520.8530.2560.687
BEVPlace [9]0.9790.9000.8940.924
BEVPlace++ [10]0.9830.9050.9230.937
3R2SCAT-LPR (Ours)0.9850.9370.9690.964
The best scores are marked in bold and the second-best scores are underlined.
Table 4. F 1  max scores on random rotated KITTI dataset around z-axis.
#Methods000208MeanCmp *
1M2DP [19]0.2760.2820.2010.253−0.246
SC [21]0.7190.7340.5460.666−0.047
LI [20]0.6670.7640.4700.634−0.002
SSC [22]0.9550.8890.9430.929−0.011
2PNV [5]0.0830.0900.0860.086−0.428
DiSCO [44]0.9600.8910.8920.914−0.006
SGPR [2]0.7720.7160.6780.722−0.052
Locus [50]0.9440.7260.8770.849−0.018
BEVPlace [9]0.9790.9000.8940.924−0.000
BEVPlace++ [10]0.9750.9120.9280.938−0.001
3R2SCAT-LPR (Ours)0.9840.9290.9590.957−0.007
* Cmp is the comparison with the standard results shown in Table 3.
Table 5. Generalization performance on dataset using Recall@1 metric on NCLT dataset.
Methods2012-02-042012-03-172012-06-152012-09-282012-11-162013-02-23Mean
M2DP [19]0.6320.5800.4240.4060.4930.2790.469
BoW3D [23]0.1490.1070.0650.0500.0520.0750.083
CVTNet [52]0.8920.8800.8120.7490.7710.8030.818
LoGG3D-Net [36]0.6990.1960.1100.0870.1090.2560.243
LCDNet [35]0.6050.5420.4420.3490.3170.1090.394
BEVPlace [9]0.9350.9270.8740.8780.8890.8620.894
BEVPlace++ [10]0.9530.9420.9020.8890.9130.8780.913
R2SCAT-LPR (Ours)0.9430.9340.9360.9280.9160.9430.933
The highest Recall@1 values are marked in bold, while the second-highest values are underlined.
Table 6. Ablation study on the effectiveness of the rotation enhancement module design using the  F 1  max scores metric.
#RADSCA000208Mean
1 0.9560.8840.8010.880
2 0.9720.8650.8380.892
30.9850.9370.9690.964
✓ indicates the use of the module; otherwise, the module is not used. The best scores are marked in bold, while the second-best scores are underlined.
Table 7. Ablation study on the number of MHSA and DSCA blocks using the  F 1  max scores metric.
#M 1N 2000208Mean
1410.9840.9330.9280.948
610.9850.9370.9690.964
2600.9720.8650.8380.892
620.9880.9240.8990.937
630.9870.9060.9440.946
1 M represents the number of MHSA blocks. 2 N denotes the number of DSCA blocks. Additionally, the best scores are marked in bold, while the second-best scores are underlined.
Table 8. Ablation study on the number of cross attention heads in MHCA of the DSCA block using the  F 1  max scores metric.
# H c  *000208Mean
110.9850.9370.9690.964
220.9840.9200.9440.949
330.9830.9170.8810.927
H c  represents the number of cross-attention heads in MHCA of the DSCA block. Additionally, the best scores are marked in bold, while the second-best scores are underlined.
Table 9. Ablation study on the number of NetVLAD blocks used for the aggregation of multi-level patch features evaluated using the  F 1  max scores metric.
#n *000208Mean
110.9800.8960.8950.924
220.9740.9140.8780.922
340.9850.9370.9690.964
* n represents the number of NetVLAD blocks. Additionally, the best scores are marked in bold, while the second-best scores are underlined.
Table 10. Ablation study on the dimensionality of the output global feature descriptor evaluated using the  F 1  max scores metric.
#D *000208Mean
12560.9850.9370.9690.964
25120.9860.9210.9440.950
310240.9890.9290.9570.958
* D represents the dimensionality of the final output global feature descriptor. Additionally, the best scores are marked in bold, while the second-best scores are underlined.
Table 11. Comparison of model parameters and computational efficiency. *
MethodsParams [MB]FLOPs [G]Descriptor Extraction Time [ms]Searching Time [ms]Total Time [ms]
OT [8]182.920.842.940.693.63
BEVPlace [9]2.1212.5437.921.6639.58
BEVPlace++ [10]13.5513.4820.990.7321.72
R2SCAT-LPR (Ours)132.535.8411.590.6912.28
* The time values in the table represent the processing time per frame.
Disclaimer/Publisher’s Note: The statements, opinions and data contained in all publications are solely those of the individual author(s) and contributor(s) and not of MDPI and/or the editor(s). MDPI and/or the editor(s) disclaim responsibility for any injury to people or property resulting from any ideas, methods, instructions or products referred to in the content.

