Article

Towards a New MAX-DOAS Measurement Site in the Po Valley: Aerosol Optical Depth and NO2 Tropospheric VCDs

by
Elisa Castelli
1,*,
Paolo Pettinari
1,
Enzo Papandrea
1,
Margherita Premuda
1,
Andrè Achilli
1,2,
Andreas Richter
3,
Tim Bösch
3,4,
Francois Hendrick
5,
Caroline Fayt
5,
Steffen Beirle
6,
Martina M. Friedrich
5,
Michel Van Roozendael
5,
Thomas Wagner
6 and
Massimo Valeri
7
1
National Research Council (CNR), Institute of Atmospheric Sciences and Climate (ISAC), Via Piero Gobetti 101, 40129 Bologna, Italy
2
Dipartimento di Fisica e Astronomia, Universitá di Bologna, Viale Berti Pichat 6/2, 40127 Bologna, Italy
3
Institute of Environmental Physics, University of Bremen, Otto-Hahn-Allee 1, 28359 Bremen, Germany
4
Alfred Wegener Institute, Helmholtz Centre for Polar and Marine Research, Am Handelshafen 12, 27570 Bremerhaven, Germany
5
Royal Belgian Institute for Space Aeronomy, Ringlaan-3, 1180 Brussels, Belgium
6
Max Planck Institute for Chemistry, Hahn-Meitner-Weg 1, 55128 Mainz, Germany
7
Serco Italia S.p.A.—Via Bernardino Alimena, 111-119, 00173 Rome, Italy
*
Author to whom correspondence should be addressed.
Remote Sens. 2025, 17(6), 1035; https://doi.org/10.3390/rs17061035
Submission received: 20 January 2025 / Revised: 28 February 2025 / Accepted: 6 March 2025 / Published: 15 March 2025

Abstract

:
Pollutants information can be retrieved from visible (VIS) and ultraviolet (UV) diffuse solar spectra exploiting Multi-AXis Differential Optical Absorption Spectroscopy (MAX-DOAS) instruments. In May 2021, the Italian research institute CNR-ISAC acquired and deployed a MAX-DOAS system SkySpec-2D. It is located in the “Giorgio Fea” observatory in San Pietro Capofiume (SPC), in the middle of the Po Valley, where it has constantly acquired zenith and off-axis diffuse solar spectra since the 1st October 2021. This work presents the retrieved tropospheric NO2 and aerosol extinction profiles (and their columns) derived from the MAX-DOAS measurements using the newly developed DEAP retrieval code. The code has been validated both using synthetic differential Slant Column Densities (dSCDs) from the Fiducial Reference Measurements for Ground-Based DOAS Air-Quality Observations (FRM4DOAS) project and real measured data. For this purpose, DEAP results are compared with the ones obtained with three state-of-the-art retrieval codes. In addition, an inter-comparison with satellite products from Sentinel-5P TROPOMI, for the tropospheric NO2 Vertical Column Densities (VCDs), and MODIS-MAIAC for the tropospheric Aerosol Optical Depth (AOD), is performed. We find a bias of −0.6 × 10¹⁵ molec/cm2 with a standard deviation of 1.8 × 10¹⁵ molec/cm2 with respect to Sentinel-5P TROPOMI for NO2 tropospheric VCDs and of 0.04 ± 0.08 for AOD with respect to MODIS-MAIAC data. The retrieved data show that the SPC measurement site is representative of the background pollution conditions of the Po Valley. For this reason, it is a good candidate for satellite validation and scientific studies over the Po Valley.

1. Introduction

Atmospheric constituents such as nitrogen oxides (NOx) can influence air quality and climate [1]. Nitrogen oxides are formed during the combustion process, partly from nitrogen compounds in fuel, but mainly from the direct combination of atmospheric oxygen and nitrogen in flames. Nitrogen oxides are also produced naturally by lightning and, to a small extent, by soil microbial processes [2]. Emissions by automobiles, trucks, various non-road vehicles (e.g., construction equipment, boats and other vehicles), as well as power plants, cement kilns, turbines and industrial boilers, are the primary anthropogenic sources of NOx [3]. The tropospheric NO2 plays an essential role in the formation of aerosol [4] and its photolysis is the most common pathway for ozone formation [5]. Its monitoring is therefore crucial, in particular in polluted regions.
Satellite instruments are widely used for monitoring the distribution of such pollutants on a global scale. They allow the investigation of phenomena in remote regions where ground-based monitoring cannot be performed. Ultraviolet-visible (UV-VIS) sensors (e.g., TROPOMI, [6]) are used to retrieve the Vertical Column Density (VCD), i.e., the vertically integrated concentration of NO2. This variable, listed by the Global Climate Observing System (GCOS) as a precursor of ozone and aerosols, is crucial to understand anthropogenic and natural production processes of NOx.
Despite their global coverage, satellite retrievals need to be validated due to the complex nature of the retrieval problem [7]. In particular, they require a priori information on the vertical profile of the retrieved trace gas, and the presence of clouds limits their measurement capability. Comparison with ground-based measurements allows quantification of the impact of assumptions and approximations on observed processes and scenarios that are part of the retrieved satellite products. The comparison of MAX-DOAS or Pandora and satellite results in several sites has been thoroughly investigated in previous works [8,9,10,11]. Multi-AXis DOAS (MAX-DOAS) instruments, exploiting the Differential Optical Absorption Spectroscopy (DOAS) technique [12,13], are widely used in polluted regions to retrieve vertical profiles of aerosol extinction, NO2 and other trace gases (e.g., refs. [14,15,16,17]). MAX-DOAS instruments can participate in the Fiducial Reference Measurements for Ground-Based DOAS Air-Quality Observations (FRM4DOAS, https://frm4doas.aeronomie.be (accessed on 5 March 2025), ref. [18]) project funded by the European Space Agency (ESA) for the homogenization of MAX-DOAS measurements and processing practices [19,20].
In Italy, the first MAX-DOAS instrument fully compliant with FRM4DOAS requirements is operated by the Consiglio Nazionale delle Ricerche-Istituto di Scienze dell’Atmosfera e del Clima (CNR-ISAC), and has been located at the “Giorgio Fea” meteorological observatory at San Pietro Capofiume (herein SPC), Bologna (Lat: 44.65°N, Lon: 11.62°E, Altitude: 11 m a.s.l.) since the 1 October 2021. The “Giorgio Fea” observatory is managed by the Agenzia Regionale per la Prevenzione, l’ Ambiente e l’ Energia (ARPAE, https://www.arpae.it/it/arpae/arpae, accessed on 5 March 2025) of Emilia Romagna. CNR-ISAC operates at SPC in the frame of a long-term agreement with ARPAE. At this site, ARPAE runs radar measurements and radio soundings. The site is equipped for in situ monitoring of trace gases and particulate matter. As the Mt. Cimone-Po Valley facility, it is part of the Aerosol, Clouds and Trace gases Research InfraStructure (ACTRIS). The description of the SkySpec-2D installed at SPC and its performance compared with MAX-DOAS and Pandora instruments are reported in [21], where the authors mainly focused on presenting the first NO2 total VCDs in the Po Valley retrieved from zenith sky spectra.
This paper focuses on analysing MAX-DOAS SPC measurements for retrieving NO2 tropospheric concentrations and aerosol extinction profiles and their corresponding tropospheric columns. To perform the retrieval, in the frame of the Instrument Data Evaluation and Analysis Service (IDEAS+) Quality Assurance for Earth Observation (QA4EO) service DOAS-BO ESA project, we developed and validated a dedicated code, named DOAS optimal Estimation Atmospheric Profile retrieval (DEAP). The code validation has been performed by exploiting both synthetic differential Slant Column Densities (dSCDs) provided by the FRM4DOAS community, and comparing the results obtained with DEAP on actual data with those obtained applying other retrieval codes such as the Bremen Optimal estimation REtrieval for Aerosols and trace gaseS (BOREAS) [22], the Mexican MAX-DOAS Fit (MMF) [23] and the MAinz Profile Algorithm (MAPA) [24]. MMF and MAPA are the codes selected for the centralized FRM4DOAS processing. The DEAP code is then applied to the first two years of SPC MAX-DOAS measurements. The resulting NO2 tropospheric VCDs and AODs are finally compared to collocated data from the Sentinel-5P TROPOspheric Monitoring Instrument (TROPOMI) [6] and the Moderate Resolution Imaging Spectroradiometer (MODIS) Multi-Angle Implementation of Atmospheric Correction (MAIAC) [25] satellite product.
The paper is structured as follows: Section 2 briefly describes the measurements used during this work, the code developed for the retrieval and the reference algorithms used for the code validation. The validation results as well as the comparisons between AODs and NO2 tropospheric VCDs from ground-based and satellite observations are given in Section 3. Discussions are reported in Section 4 and Conclusions in Section 5.

2. Materials and Methods

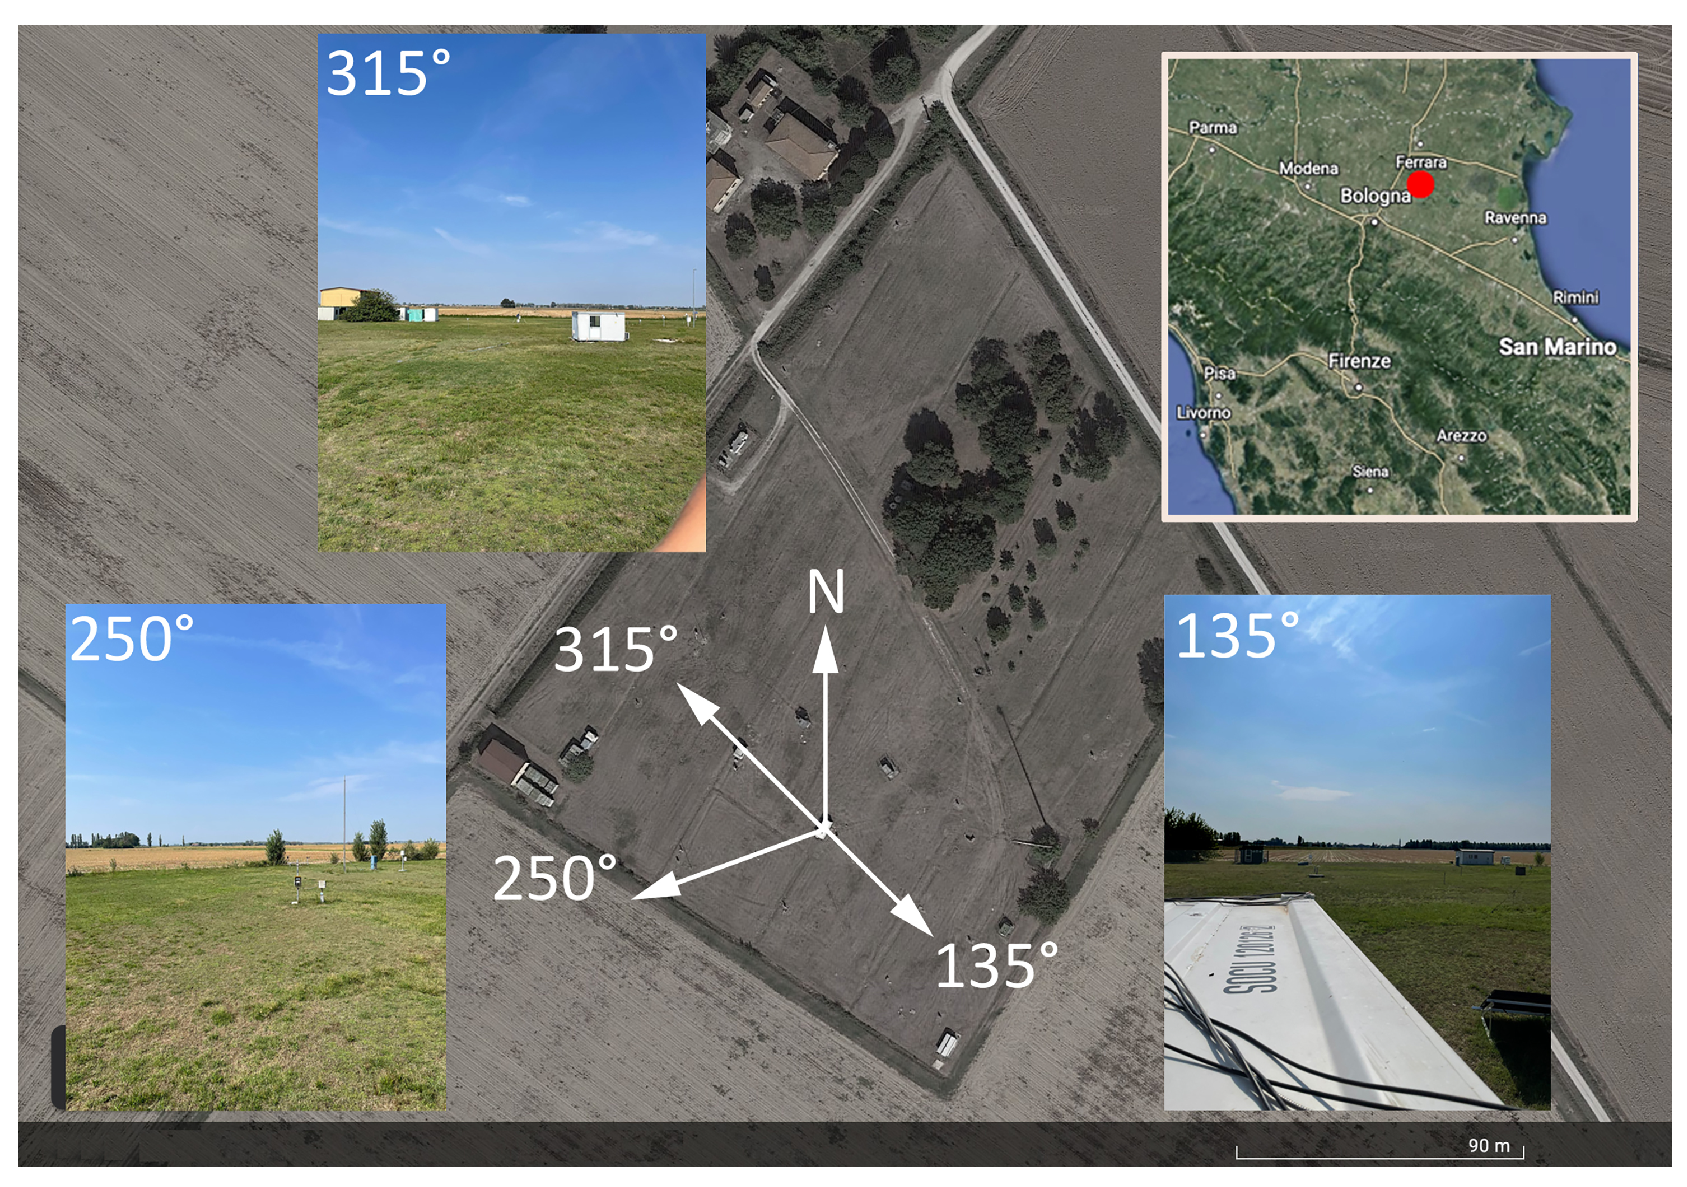
2.1. The SkySpec-2D MAX-DOAS Measurements at San Pietro Capofiume

The MAX-DOAS system installed at the “Giorgio Fea” meteorological station in SPC is a SkySpec-2D system developed by Airyx GmbH (before EnviMes) (https://airyx.de/wp-content/uploads/2024/09/SkySpec-2D.pdf (accessed on 5 March 2025)). This paper exploits its visible (VIS) MAX-DOAS spectra, acquired in the spectral region from approximately 410 nm to 550 nm. The system automatically starts to acquire atmospheric spectra every morning when the sun is 4° below the horizon, which represents a Solar Zenith Angle (SZA) position of 94°, according to our convention. Initially, it acquires only zenith-sky spectra. SkySpec-2D starts to perform MAX-DOAS measurements when the SZA becomes lower than 85°. In MAX-DOAS acquisition mode, the SkySpec-2D measures in three different azimuth directions (in our convention 0° corresponds to the North and then positive angles are measured moving clockwise up to 360°): 120°, 225° and 300° from the 1 October 2021 to the 23 March 2022, and 135°, 250° and 315° afterwards (Figure 1). The change in azimuth viewing directions was motivated by the fact that, having moved the telescope from the ground-level tripod to the top of the shelter, where the spectrometer is located, the availability of free lines of sight changed.
Following the minimum requirements of the FRM4DOAS network, the spectra are acquired at the following elevation angles: 1°, 2°, 3°, 5°, 10°, 30° and 90°. On average, the acquisition of one scan takes about 3 min and the number of scans measured in each azimuth direction during a day varies between about 50 in winter and 80 in summer. The VIS spectra are then analysed using the QDOAS version 3.4.6 (https://uv-vis.aeronomie.be/software/QDOAS/ (accessed on 5 March 2025)) software to retrieve the O4 and NO2 dSCDs and their errors due to the fit. For the QDOAS analysis of the MAX-DOAS spectra, we use the corresponding zenith sky measurement as the reference spectrum for each scan. The QDOAS set-up used in the analysis is reported in Table A2 of [21]. The O4 and NO2 dSCDs of each scan, relative to the mentioned elevation angles, are the input of the DEAP code. The SkySpec-2D spectra measured from SPC are delivered to the FRM4DOAS central processing.

2.2. Retrieval of Tropospheric Profiles

The DOAS international community has developed several codes for retrieving tropospheric vertical profiles from MAX-DOAS measurements. In the frame of the FRM4DOAS project, an effort was made to evaluate the performances of different retrieval codes and to select the ones more suitable for centralized processing [20]. The BOREAS, MMF and MAPA codes participated in this round-robin exercise, which included 8 codes (BOREAS, MMF, MAPA, BePRO, HEIPRO, PRIAM, MARK and NASA). The codes chosen were MMF and MAPA. The work presented in this paper used BOREAS, MMF and MAPA to validate the DEAP code. All of these codes are described in the following subsections.

2.2.1. The DEAP Retrieval Code and Set-Up

The DEAP code is an Optimal Estimation (OE) algorithm [27] developed at CNR-ISAC that, exploiting the SCIATRAN code [28] as a forward model, can retrieve tropospheric vertical profiles from MAX-DOAS measurements. The DEAP code does not need any spectral intensity input. It uses only the dSCDs of O4 and NO2 (or other gases) retrieved from spectra measured at the given elevation angles together with information on vertical elevation angles and relative azimuth angles. The retrieval is performed in two steps: one for aerosol extinction and one for gaseous profiles retrieval. The aerosol extinction retrieval is an iterative procedure that requires the calculation of the derivatives of O4 dSCDs with respect to the aerosol extinction profile. This calculation is performed through the use of the SCIATRAN version 4.1 Radiative Transfer Model (RTM).
The gaseous part requires only the simulation of Box-Air Mass Factors (box-AMFs, defined as the ratio of the partial slant column to the partial vertical column [13]) without the need for iterations since the retrieval of the gas profile is treated as a linear problem. For this reason, the gaseous part is faster than the aerosol one. First, DEAP retrieves the aerosol extinction profile from O4 dSCDs by exploiting the following iterative procedure (see Equation 5.35 of [27]):
x i + 1 = x i + ( K i T S y 1 K i + S 0 1 + λ D i ) 1 ( K i T S y 1 ( y y i ) S 0 1 ( x i x 0 ) )
where x i is the retrieved extinction profile at iteration i, x i + 1 is the retrieved profile at iteration i + 1 , x 0 is the a priori profile, K i is the Jacobian matrix, D i is a diagonal matrix, which contains the diagonal values of K i T S y 1 Ki, S0 is the a priori variance-covariance matrix (VCM), λ is the lambda of Marquardt damping factor, Sy is the dSCDs VCM matrix, yi is the vector containing the simulated O4 dSCDs and y is the vector of measured O4 dSCDs at different elevation angles. The derivatives of O4 dSCDs with respect to the aerosol profiles that compose the Jacobian matrix are calculated numerically with SCIATRAN.
The associated total error matrix is the sum of the retrieval and smoothing error matrices. The retrieval error matrix is defined as:
xerr r e t r = G i S y G i T
where G i is the gain matrix defined as:
G i = ( K i T S y 1 K i + S 0 1 + λ D i ) 1 K i T S y 1
while the smoothing error is:
xerr s m o o t h = ( A k I ) S 0 ( A k I ) T
where A k is the Averaging Kernel (AK) matrix defined as:
A k = ( K T S y 1 K i + S 0 1 + λ D i ) 1 K i T S y 1 K i
and I is the identity matrix.
The iterative method aims at minimizing the chi-square value, defined as:
χ 2 = ( y y i ) T S y 1 ( y y i ) + ( x x 0 ) T S 0 1 ( x x 0 )
After some trade-off considerations between speed and accuracy, we set a maximum number of 20 iterations. However, the iterative procedure can stop earlier if the χ 2 stops decreasing and the differences between the measured and simulated dSCDs, for each elevation angle, are lower than three times the dSCDs errors.
In the second step, the retrieved aerosol profile is used to calculate the trace gas box-AMFs, relative to each scanned elevation angle and to each vertical layer of the retrieval grid. Finally, the gaseous profiles are obtained using the following inversion scheme:
x g = x 0 + ( K T S y 1 K + S 0 1 ) 1 ( K T S y 1 ( y y g ) S 0 1 ( x i x 0 ) )
with the retrieval error computed as for the aerosol retrieval, with the only difference being that λ is null.
In Equation (7), xg is the retrieved profile, x0 is the a priori profile, K is the box-AMF matrix, S0 is the an priori VCM matrix, Sy is the dSCDs VCM matrix, yg are the simulated dSCDs and y is the vector containing the measured dSCDs of the gas at different elevation angles.
The a priori VCM matrix is composed using a percentage of the a priori profile in the diagonal elements and a correlation length for extra-diagonal terms (in this case 0.4 km for the aerosol and gas). We use 100% of the a priori extinction profile as a priori error for the retrieval of aerosol extinction and 100% of the a priori NO2 profile for the NO2 retrieval. The aerosol extinction a priori profile has an AOD value of 0.1 and decreases exponentially with altitude with a scale height of 1 km. The simulations for the retrieval are performed using a constant single scattering albedo of 0.92 and the Henyey–Greenstein phase function with an asymmetry factor of 0.68 [29].
For the NO2 a priori, we use an exponentially decreasing profile with a scale height of 1 km. The VCD of the NO2 a priori profile is 8 × 10¹⁵ molec/cm2. This value is within the ones that can be observed in the Po Valley, as can also be seen from TROPOMI data. A variation of ±25% in the NO2 a priori profile leads to a variation of only about ±1% in the retrieved VCDs.
The altitude retrieval grid, customizable by the user, is composed of equally spaced steps of 200 m from 0 to 3 km, for both the extinction and NO2 retrievals. The Marquardt λ is initially set to 0.1 and is updated at every iteration. If the iteration leads to a lower χ 2 , λ is divided by 1.2, and is increased by a factor of 2 otherwise.
These settings are used to retrieve aerosol extinction and NO2 profiles from SkySpec-2D MAX-DOAS VIS spectra from the 1 October 2021 to 30 September 2023. All the scans measured by the SkySpec-2D are processed with the DEAP code. The retrieved results are then filtered according to a two-step process. The first step relates to comparing the measured dSCDs and those simulated with the retrieved aerosol extinction and NO2 profiles. In particular, a profile is discarded if the difference between the simulated and measured dSCD is more than three times the dSCD error coming from the fit and if the percentage difference is more than 30% of the measured dSCD (for at least one of the elevation angles). Moreover, the NO2 profile is automatically discarded if the aerosol profile of the same scan is discarded.
Since the cloud impact on the spectra is not negligible [30], the second step has the purpose of filtering out cloudy measurements. Cloud filtering is based on a color index approach [31]. The color index approach is widely used for flagging cloud-contaminated MAX-DOAS measurements (e.g., refs. [18,30,32,33,34,35]). Other methods involve the effects of clouds on, e.g., radiance, O4 absorption and Ring effect [30]. The use of color index (CI) allows filtering of the cloudy data without the use of external information, using measured spectra only. In fact, the particles scattering effect on CI makes this indicator ideal for investigating cloud contamination. The color index is estimated as the ratio between the average radiance computed in the wavelength interval 410–415 nm and the one in the interval 545–550 nm. The retrieved profiles are flagged as cloudy if the zenith measurement of the relative MAX-DOAS scan, used as a reference for the QDOAS analysis, is cloudy or if clouds are present in the off-axis line of sights of the considered direction. The zenith reference spectrum is considered cloudy if the computed color index value is below the threshold of 1.2. We chose this threshold because the estimated distribution of the zenith color, shown in Figure 2, is bimodal with a transition region between the two distributions around the color index value of 1.2. We empirically verified that the left distribution, relative to the lower color indexes, represents the cloudy spectra. The threshold value of 1.2 has been chosen in order to filter out the heavily contaminated spectra without removing too much data from the dataset.
Setting a threshold color index for the off-axis spectra is a challenging task. Color indexes calculated from off-axis spectra present complex dependencies on solar zenith and azimuth angles and the aerosol load [32]. For this reason, we decided to exploit a qualitative method inferred from the simulations: clouds are present in the off-axis line of sights if the values of the color index derived from the spectra measured at the elevation angles of 3°, 5°, 10° and 30° are not sorted in ascending order.
Figure 3 shows an example of retrieved aerosol extinction and NO2 profiles for the 23 March 2023. No clouds are present. The AKs for these profiles are reported in Figure 4 as an example. As can be noticed, 2.2–2.9 degrees of freedom (DOFs, calculated as the trace of the AK matrix) are obtained for both profiles over 16 retrieved altitude values.
The retrieved aerosol extinction and NO2 profiles are then integrated along the vertical domain to obtain the AODs and the tropospheric NO2 VCDs.

2.2.2. MMF Description and Set-Up

The Mexican MAX-DOAS Fit (MMF, [23]) is an OE-based profiling algorithm. As a forward model, it uses VLIDORT version 2.7 [36]; however, only the intensity part of the Stokes vector is used. The layer input parameters for each atmospheric layer are calculated from temperature and pressure profiles, the trace gas concentration in each layer, and the aerosol properties. The latter are assumed to be equal in each layer, except for the partial AOD. The aerosol phase function uses the Henyey–Greenstein [29] phase function parametrization. Additional input parameters are the wavelength of the retrieval and the surface albedo.
As in DEAP, the retrieval algorithm comprises an aerosol extinction profile retrieval and a trace gas profile retrieval. The former constrains the aerosol extinction profile in the forward model of the trace gas retrieval. Since both retrievals work in logarithmic retrieval space, the problem is no longer linear, and therefore the inversion uses constrained damped least-square fitting with an optimal estimation regularization for both retrievals. Both the a priori and the covariance matrix are constructed; the latter uses 50% of the former on the diagonal and applies a correlation length of 200 m to calculate the off-diagonal entries, as described in [37]. The a priori AODs are set to 0.18, and the NO2 retrieval uses an a priori VCD of 9 × 10 15 molec/cm2. Both a priori profiles are exponentially decreasing with a scale height of 1 km. These choices are the default values within FRM4DOAS; no adaption for SPC has been performed.
The outputs of MMF consist of the aerosol extinction profiles, trace gas partial column profiles, their integrated quantities, the corresponding noise and smoothing errors, the averaging kernel, the degrees of freedom, and a quality flag for the retrieval. The quality flagging is based on the convergence of the algorithm, the root mean square of the difference between measured and simulated dSCDs, the degrees of freedom, and the stability of the retrieval.

2.2.3. MAPA Description and Set-Up

The MAPA v0.98 [24] is a profiling algorithm developed by the Max Planck Institute for Chemistry (MPIC). MAPA does not use OE, but is based on a parameterization approach: vertical profiles are parameterized by (1) the column (i.e., AOD for aerosols and VCD for trace gases), (2) the layer height, and (3) a shape parameter. Best matching parameters are determined by a least-squares fit of the observed vs. modelled dSCDs for an elevation angle sequence. The MAPA setup within the FRM4DOAS processing chain is the same as in [24].

2.2.4. BOREAS Description and Set-Up

The MAX-DOAS profile inversion algorithm BOREAS was developed at the Institute for Environmental Physics in Bremen, Germany [22]. The algorithm uses trace gas and O4 dSCD scans to retrieve vertical concentration and extinction profiles, respectively. The aerosol retrieval utilizes the Newton–Gauss algorithm including a Tikhonov smoothing term and minimizes the difference between measured and simulated differential slant optical thicknesses of the oxygen collision complex O4. The trace gas retrieval uses the iterative Levenberg–Marquardt algorithm. The retrieval grid is defined from 0 to 4 km in 100 m steps. The aerosol a priori profiles decrease exponentially with the altitude, with a scale height of 1.25 km and a ground extinction value of 0.18. The NO2 a priori profiles decrease exponentially with the altitude, with a scale height of 0.75 km and a ground concentration of 9 × 10¹⁰ molec/cm3. The a priori profile is scaled by the vertical column derived from the geometric approximation for the 30° elevation measurement. A constant single scattering albedo of 0.95 and a Henyey–Greenstein asymmetry factor of 0.7 are used.

2.3. Correlative Data

Satellite products validation is one of the principal applications of MAX-DOAS measurements [38]. In this work, we used satellite datasets for inter-comparisons with our retrievals. MODIS-MAIAC data were used to compare the AODs at 477 nm, while Sentinel-5P TROPOMI products were used to compare the NO2 tropospheric VCDs. Both satellite datasets are described in the following subsections.

2.3.1. MODIS-MAIAC

MODIS has been flying onboard the NASA Terra (descending node, about 10:30 equatorial crossing time) and Aqua (ascending node, about 13:30 equatorial crossing time) satellites since 2000 and 2002, respectively. MODIS observes the Earth, acquiring data in 36 spectral bands (from 0.4 μ m to 14.4 μ m), with a spatial resolution of about 1 km at nadir. AODs over land are retrieved through the Multi-Angle Implementation of the Atmospheric Correction (MAIAC) algorithm [39]. The MODIS-MAIAC AOD retrievals allow determination of the characteristics of fine aerosols and distinction between aerosol sources [40]. In this work, we use the MCD19A2 Version 6 Level 2 data product. This product contains, among other variables, the AODs at 470 nm together with AODs uncertainty and a quality flag (QA). Since MODIS-MAIAC AOD products are provided on a 1 × 1 km2 regular grid, for this analysis, we considered best quality (e.g., CloudMask = Clear and AdjacencyMask = Clear) AOD products corresponding to the grid cell containing the SPC site and maximum allowed time differences between MODIS and SkySpec-2D observations of ±15 min.

2.3.2. Sentinel-5P TROPOMI

TROPOMI has been flying onboard the Sentinel-5P satellite (ascending node 13:30) since October 2017. TROPOMI measures from the UV to the short-wave infrared (SWIR) spectral region at a spatial resolution of 3.5 × 7 (5.5) km2, exploiting four separate spectrometers. The Sentinel-5P TROPOMI products are described in [6,41]. As in [21], we use the OFFL NO2 products [42,43] having a combined quality assurance value (qa_value) higher than 0.75 [43]. A reprocessed version of the NO2 dataset named RPRO that has been produced using v2.4 is available up to 25 July 2022. From 17 July 2022 we used version 2.4, up to 12 March 2023, when v2.5 started.
As coincidence criteria, we considered (averaging them) Sentinel-5P TROPOMI data in a radius of 5 km around the SPC site and MAX-DOAS data within ±15 min from the Sentinel-5P TROPOMI overpass.
Sentinel-5P TROPOMI tropospheric NO2 VCDs are retrieved using the retrieval algorithm developed at KNMI [44]. The algorithm has three steps: (1) retrieval of the total NO2 slant column density, (2) separation of stratospheric and tropospheric contribution and (3) conversion of the tropospheric and stratospheric NO2 SCDs to VCDs. This conversion exploits vertically resolved AMFs calculated using NO2 vertical profiles from the TM5-MP model [45]. The TM5-MP model reports the NO2 profiles on a 1 × 1 latitude-longitude degree resolution. This resolution can smear out some fine structures. Several studies (e.g., ref. [46]) apply a correction to the Sentinel-5P TROPOMI columns, using more realistic NO2 profiles instead of the TM5-MP model ones. For example, they show that the use of daily median MAX-DOAS profiles, as Sentinel-5P TROPOMI a priori, improves the agreement between satellite and MAX-DOAS data.
In our work, to correct the tropospheric Sentinel-5P TROPOMI VCDs according to our MAX-DOAS profiles, we used the formula described in the Sentinel-5P user manual section 8.8 [43]:
V C D S A T T R O P M A X D O A S p r o = V C D S A T T R O P i c i i A K i T R O P c i
where V C D S A T T R O P M A X D O A S p r o is the TROPOMI corrected tropospheric VCD, V C D S A T T R O P is the original TROPOMI tropospheric VCD, c i contains the NO2 concentrations from the MAX-DOAS profile and A K i T R O P is the tropospheric AK with
A K i T R O P = 0
above tropopause level, and
A K i T R O P = A M F T O T A L A M F T R O P A K i T O T A L
below tropopause level. In Equation (10), A K i T O T A L is the total AK and A M F T O T A L and A M F T R O P are the total and tropospheric AMFs, respectively.
A M F T O T A L , A M F T R O P and A K i T O T A L are contained in the Level 2 Sentinel-5P TROPOMI files.

3. Results

3.1. DEAP Validation

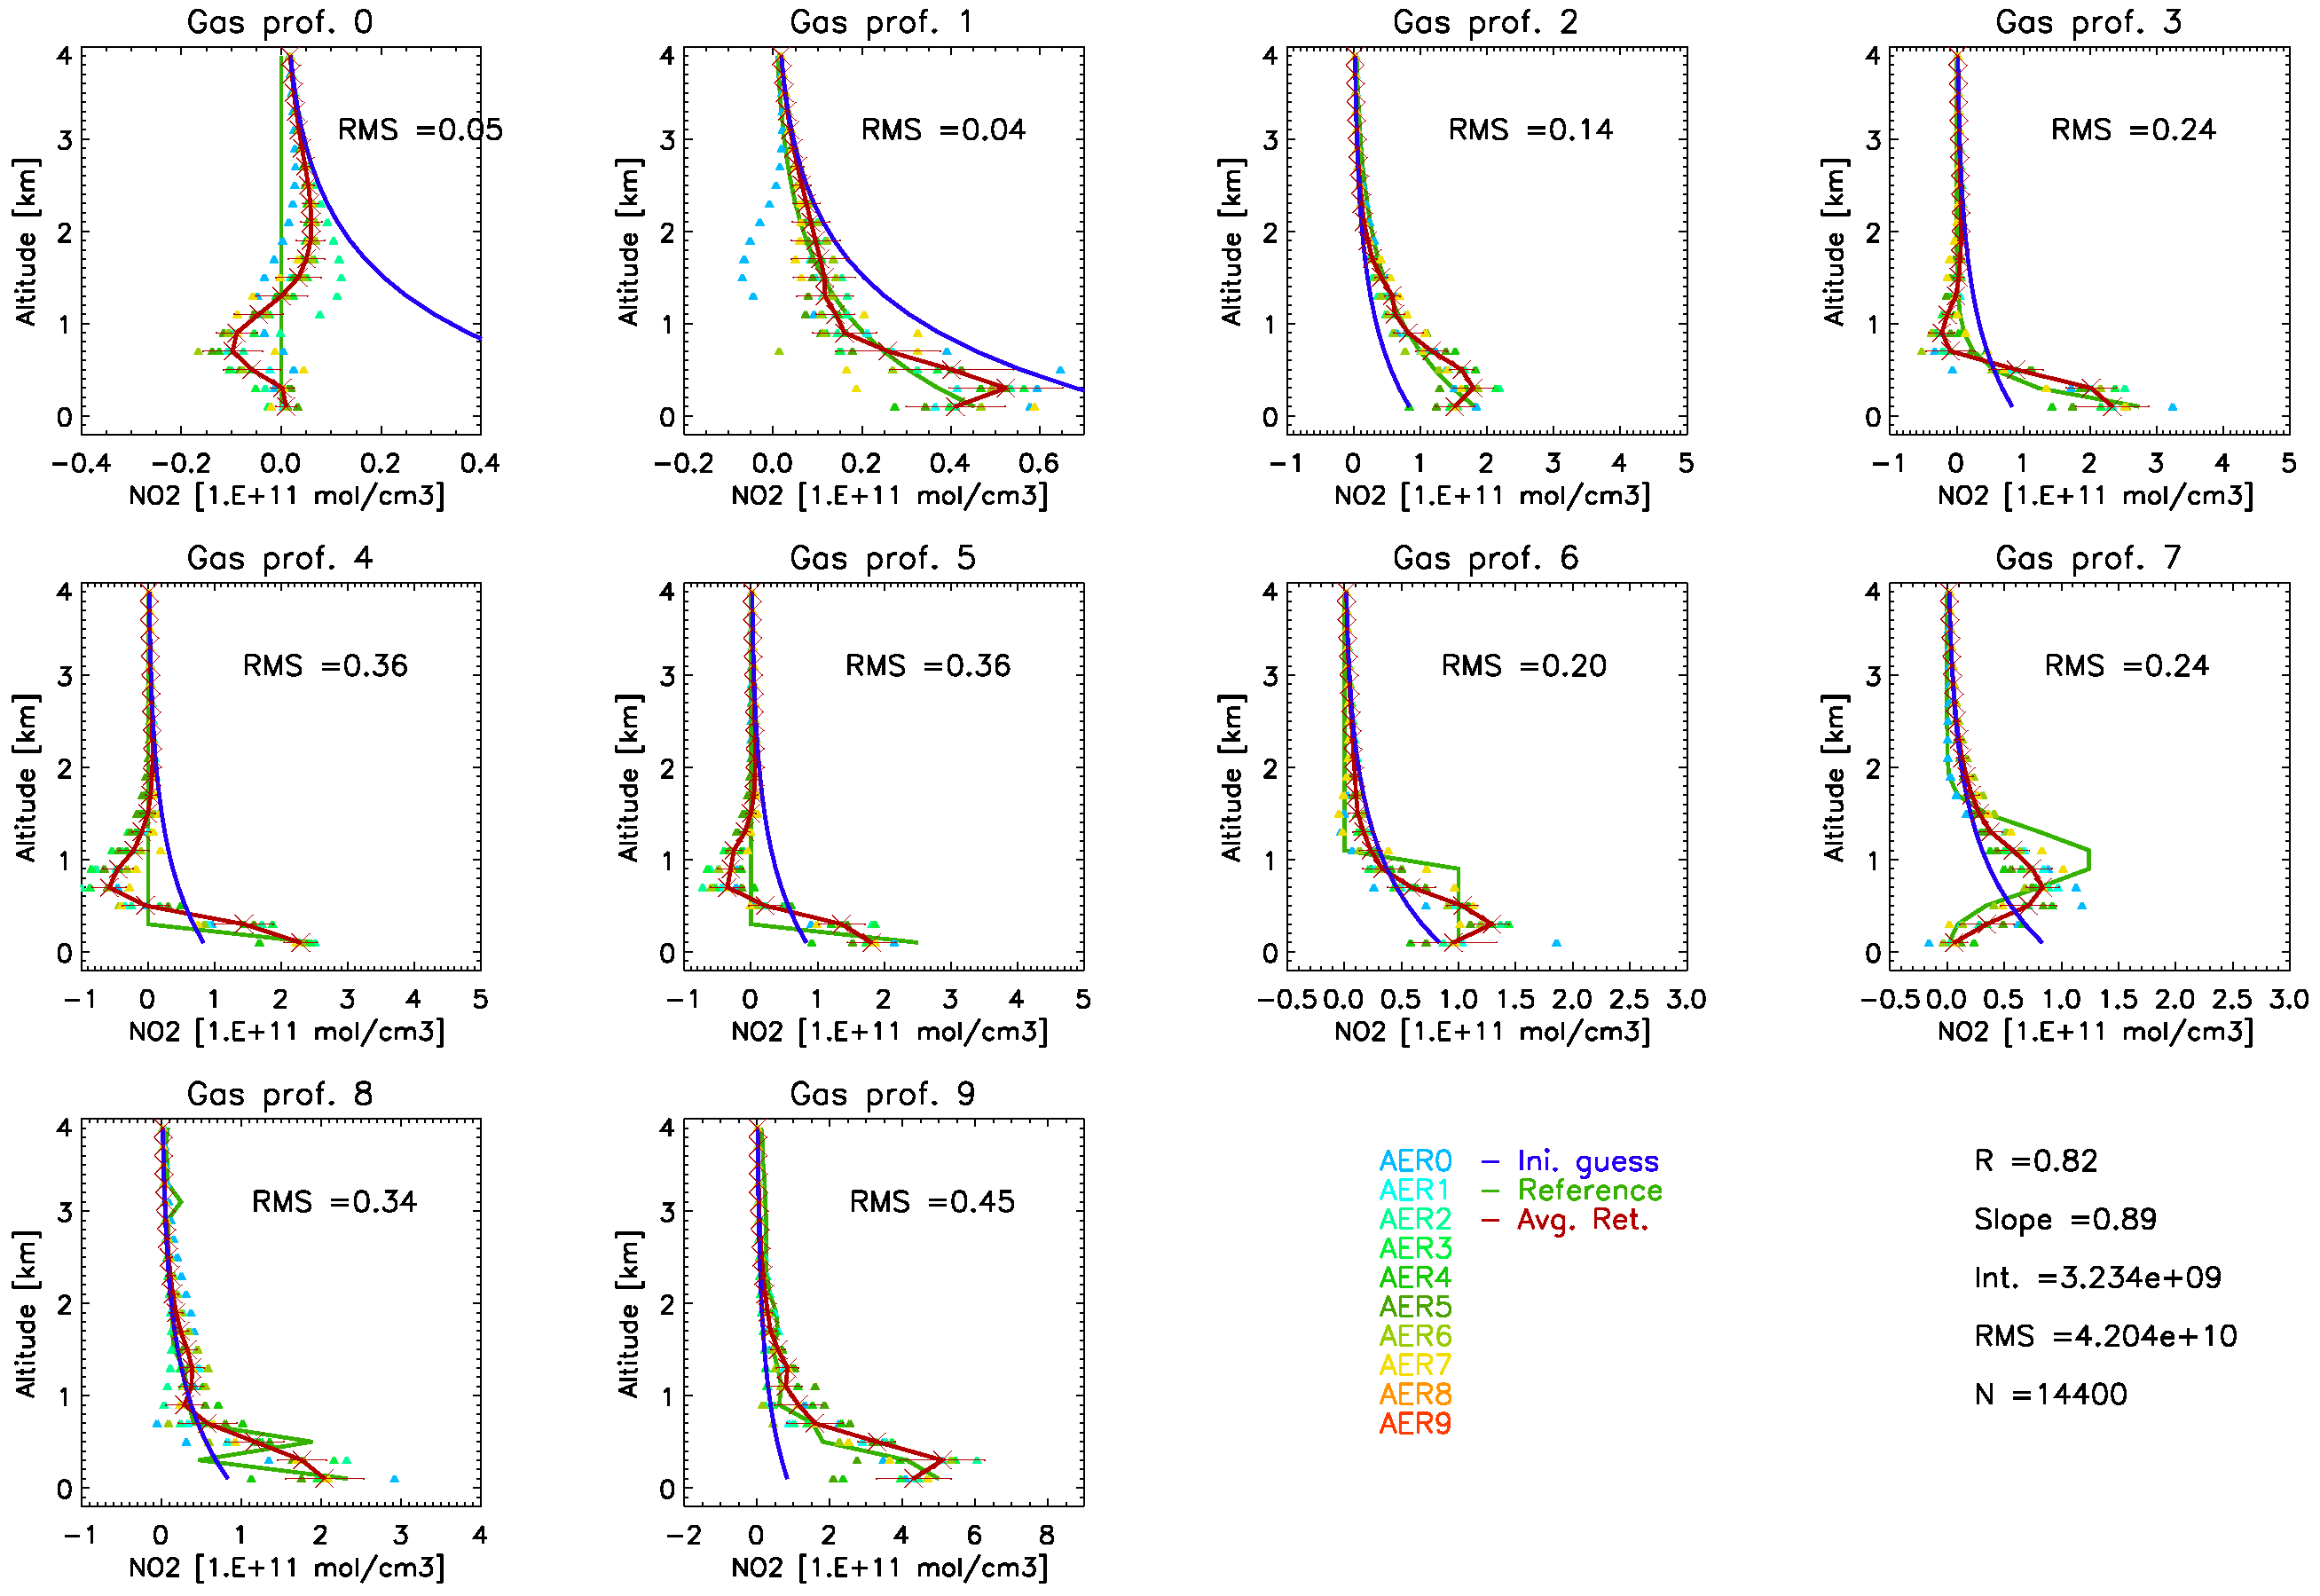
3.1.1. DEAP vs. MAPA, MMF and BOREAS with Synthetic dSCDs

Before processing the SPC MAX-DOAS dataset, the DEAP code was validated with synthetic dSCDs. In the frame of the FRM4DOAS activities, a dataset of synthetic dSCDs was used for a round-robin exercise [20]. This dataset, the used reference atmosphere and set-up, are freely available, and represent a valuable tool for the development of retrieval algorithms that exploit MAX-DOAS measurements. The package consists of a dataset of O4 (360 and 477 nm), NO2 and HCHO dSCDs and their corresponding errors simulated at nine elevation angles for a total of 990 different combinations of sun position, trace gas profiles and aerosol profiles. In this work, we used the dataset version with 5% noise added to account for possible atmospheric variabilities (then named “v1n”).
As reported in Table 8 of [47], we used O4 SCDs at 477 nm for aerosol retrievals and NO2 dSCDs at 460 nm for NO2 profiles. Eleven aerosol profiles were used to model the synthetic O4 SCDs. HCHO and NO2 dSCDs were modelled using the combination of 10 gas vertical profiles and 11 aerosol profiles (110 model atmospheres). For each atmospheric scenario we used the combinations of 3 SZA (40°, 60°, 80°) and 3 relative azimuth angles (RAA, 0°, 90°, 180°).
To be consistent with the results reported in Table 8 of [47], we did not use the dSCDs relative to the aerosol profiles 8, 9 and 10. All the retrieval settings that we used were the same as in reference [47]; this also means a different grid than our default grid (200 m spacing up to 4 km). To quantify the DEAP results, we calculated the correlation coefficient R, slope, intercept, RMS value of simulated (true) values and retrieved values. For the comparison, we used the MAPA (named MPIC-PAR-MC in [47]), MMF and BOREAS results taken from [47]. MAPA and MMF are the codes selected in the frame of FRM4DOAS for centralized processing. Here, we compare the aerosol extinction and NO2 concentrations at all the retrieval altitudes (Table 1), their surface values (Table 2) and their tropospheric integrated values (Table 3). The DOFs retrieved with DEAP compare well with respect to the MMF results in Figures 6 and 8 of [20], ranging from 1.01 to 3.08 for aerosol extinction to 1.16 to 2.88 for NO2 profiles.
Regarding the profile retrievals, DEAP shows quite good slope values, similar to MAPA, MMF and BOREAS. The correlation is always high, sometimes the highest among the codes (e.g., for aerosols). A good RMS is obtained, especially for the aerosol retrievals. Small differences with respect to the other codes are present in the number of valid data. DEAP, as BOREAS, presents worse correlations when comparing NO2 vertical profiles. Considering surface results (Table 2), we obtained slope values in between the ones of the other retrieval codes and a high correlation (0.95 for aerosols and 0.83 for NO2). The resulting tropospheric columns, in Table 3, from DEAP show a very high correlation (0.98, 0.99) and small RMS.
To better visualize the DEAP performances in retrieving tropospheric profiles, in the Appendix A, we report an overview of DEAP extinction and NO2 profiles obtained from synthetic dSCDs. For this exercise we repeat what was performed in [20], and Figure A1 and Figure A2 reproduce, as much as possible, Figures 12 and 14 of [20]. In our representation, we interpolate all the profiles on a common vertical grid of 0.1 km spacing that ranges from 0.1 to 3.9 km. For these examples, we do not apply any filtering. As can be seen, the DEAP code correctly reproduces the reference profiles under the majority of cases with a correlation of 0.93 for aerosols and 0.82 for NO2 profiles.
In conclusion, DEAP performs well and its results are entirely consistent with the state-of-the-art codes. Given that this is the first version of the code, the obtained results can be considered as satisfactory.

3.1.2. DEAP vs. MAPA, MMF and BOREAS with Real dSCDs

The validation of the DEAP code with synthetic dSCDs allowed the removal of possible code bugs. However, applying a retrieval code to actual measurements is always challenging because real measurement scenarios may contain features that are more difficult to reproduce than the simulated ones. As reported in Section 2, we routinely provide the SPC SkySpec-2D spectra to the FRM4DOAS project for centralized processing. In addition, the SkySpec-2D spectra have also been processed with the BOREAS code. For this reason, the SPC MAX-DOAS data were processed with all four retrieval codes in the period from the 1 October 2021 to the 9 March 2022. It must be taken into account that the dSCDs used as input for the four retrieval codes are not identical because the ones used for MAPA and MMF were produced by the FRM4DOAS central processing, which presents some small differences in the QDOAS settings compared to our home-made processing.
For the comparison, we considered the tropospheric AODs and NO2 VCDs measured at the azimuth direction 300°. Regarding the centralized processing data, we used MAPA version v0991 with free O4 scaling factor and MMF version 1.0. Moreover, for MAPA we considered only data having a quality flag equal to 0 (we removed the warning data), while for MMF we decided to also use data flagged as warning in order to have a significant population.
The results of the comparisons between the reference codes and DEAP, applied to the measured SCDs, are reported in Table 4. The correlations between DEAP and the other codes are always high (0.97–0.99) apart from the comparison of AOD with MAPA (0.70). This suggests that DEAP AODs are in good agreement with MMF and BOREAS and that MAPA AODs present very different behavior. Although the biases are minimal, DEAP underestimates the AODs compared to all the other codes by about 0.02. On the other hand, the DEAP NO2 VCDs are in good agreement with BOREAS and range between the MAPA and MMF values. Figure 5 and Figure 6 show the time series of AODs and NO2 tropospheric VCDs obtained from the SPC MAX-DOAS data with the four codes. The middle panel shows the differences between the other codes and DEAP, while the lower one reports the value of the UV color index (UV-CI) calculated as the ratio of the zenith sky spectra averaged in the 5 nm region around 330 nm divided by the one around the 390 nm. The color indexes calculated in the UV region are more sensitive to particles with respect to the one in the VIS, which we used for the cloud filtering, and thus to aerosol presence. The time series confirm the good performances of DEAP code in catching diurnal variation in AODs or NO2 tropospheric VCDs distributions. In particular, during clear sky days (e.g., on the 1, 2 and 9 March 2022 as shown by the UV-CI values) the agreement is very strong, especially for AODs. Additionally, lower AODs values are also retrieved on those days.
An example of the profiles retrieved from DEAP with respect to the other codes is given in Figure 7 for aerosol extinction and in Figure 8 for NO2 retrieved on the 9 March 2022 using measurement at 300° azimuth. The same filtering adopted in Figure 5 and Figure 6 is applied here. Although this is a qualitative comparison, it still highlights the performances of the DEAP code with respect to other algorithms: the main features and behaviour of aerosol extinction and NO2 distribution are well captured both in the vertical and in the time range. The aerosol profiles have a maximum near the ground from 9 to 12 a.m., while for NO2 the maximum values near the ground are reached slightly before or from 6 to 8 a.m. It is worth noticing that, in the case of NO2, similar features in the vertical structure of the profiles is found in all the codes at around 8 a.m., with higher values extending up to 0.4–0.6 km. The concentration retrieved from all the four codes is similar, with an exception being major differences found in the MAPA results for aerosol extinction at 0.4–0.6 km from 8 to 12 a.m.

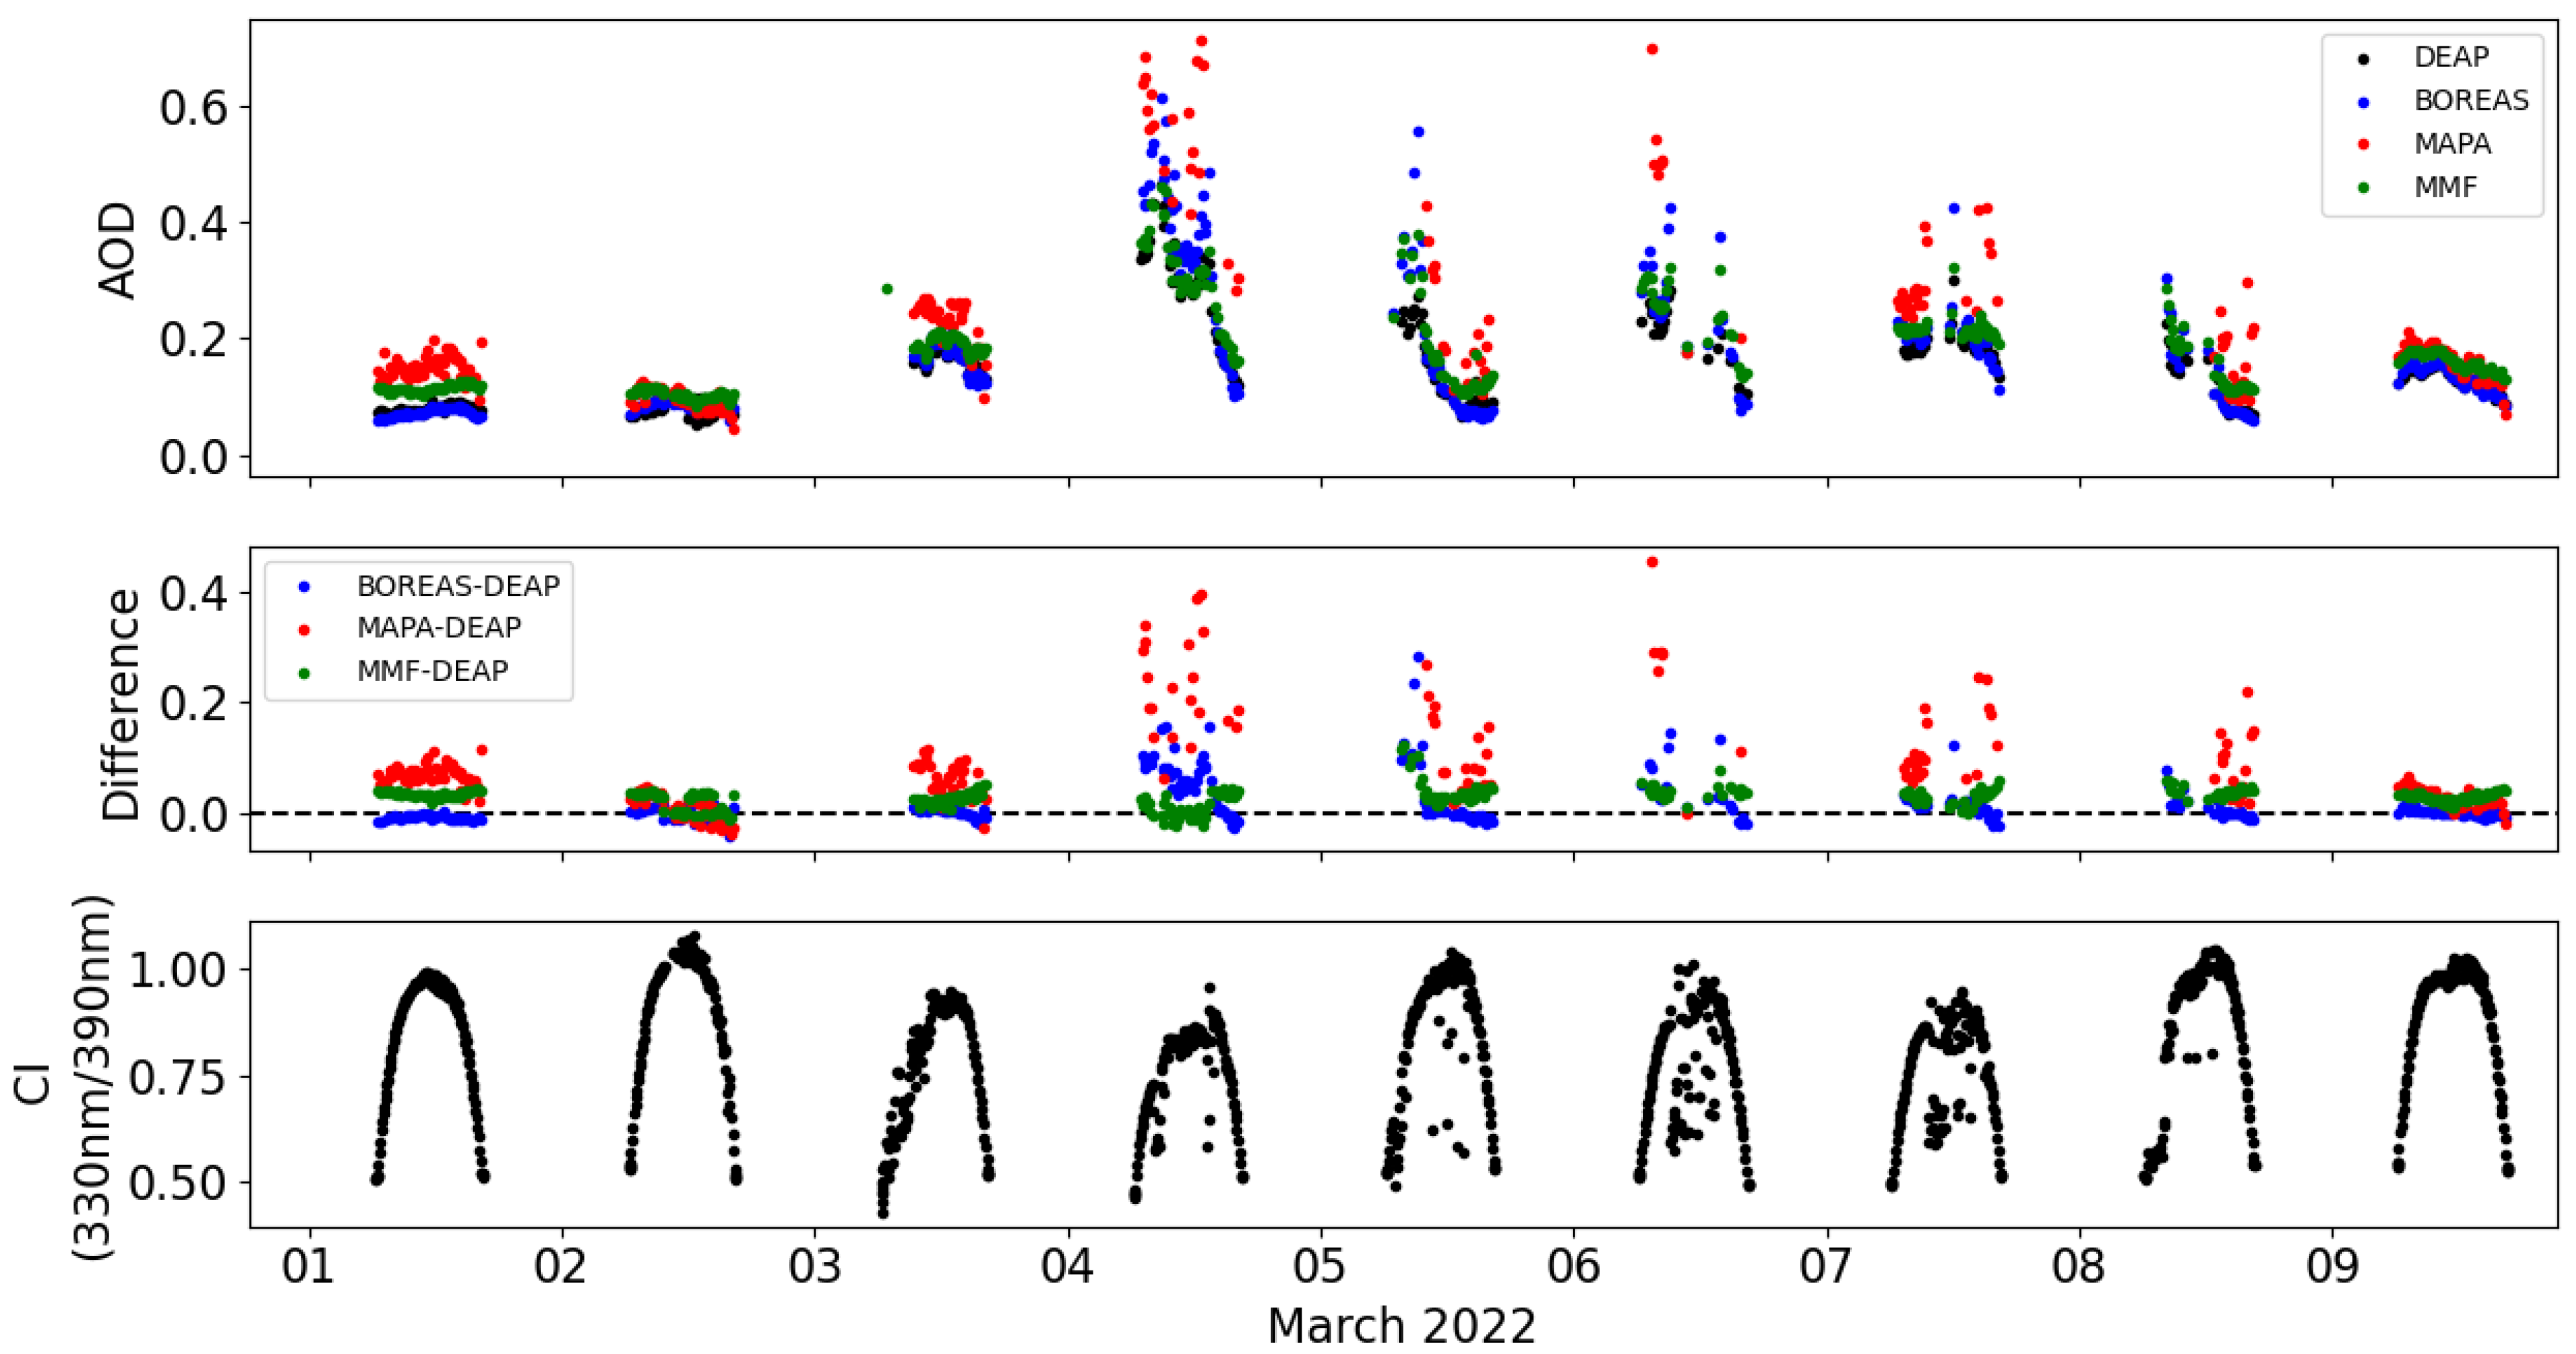
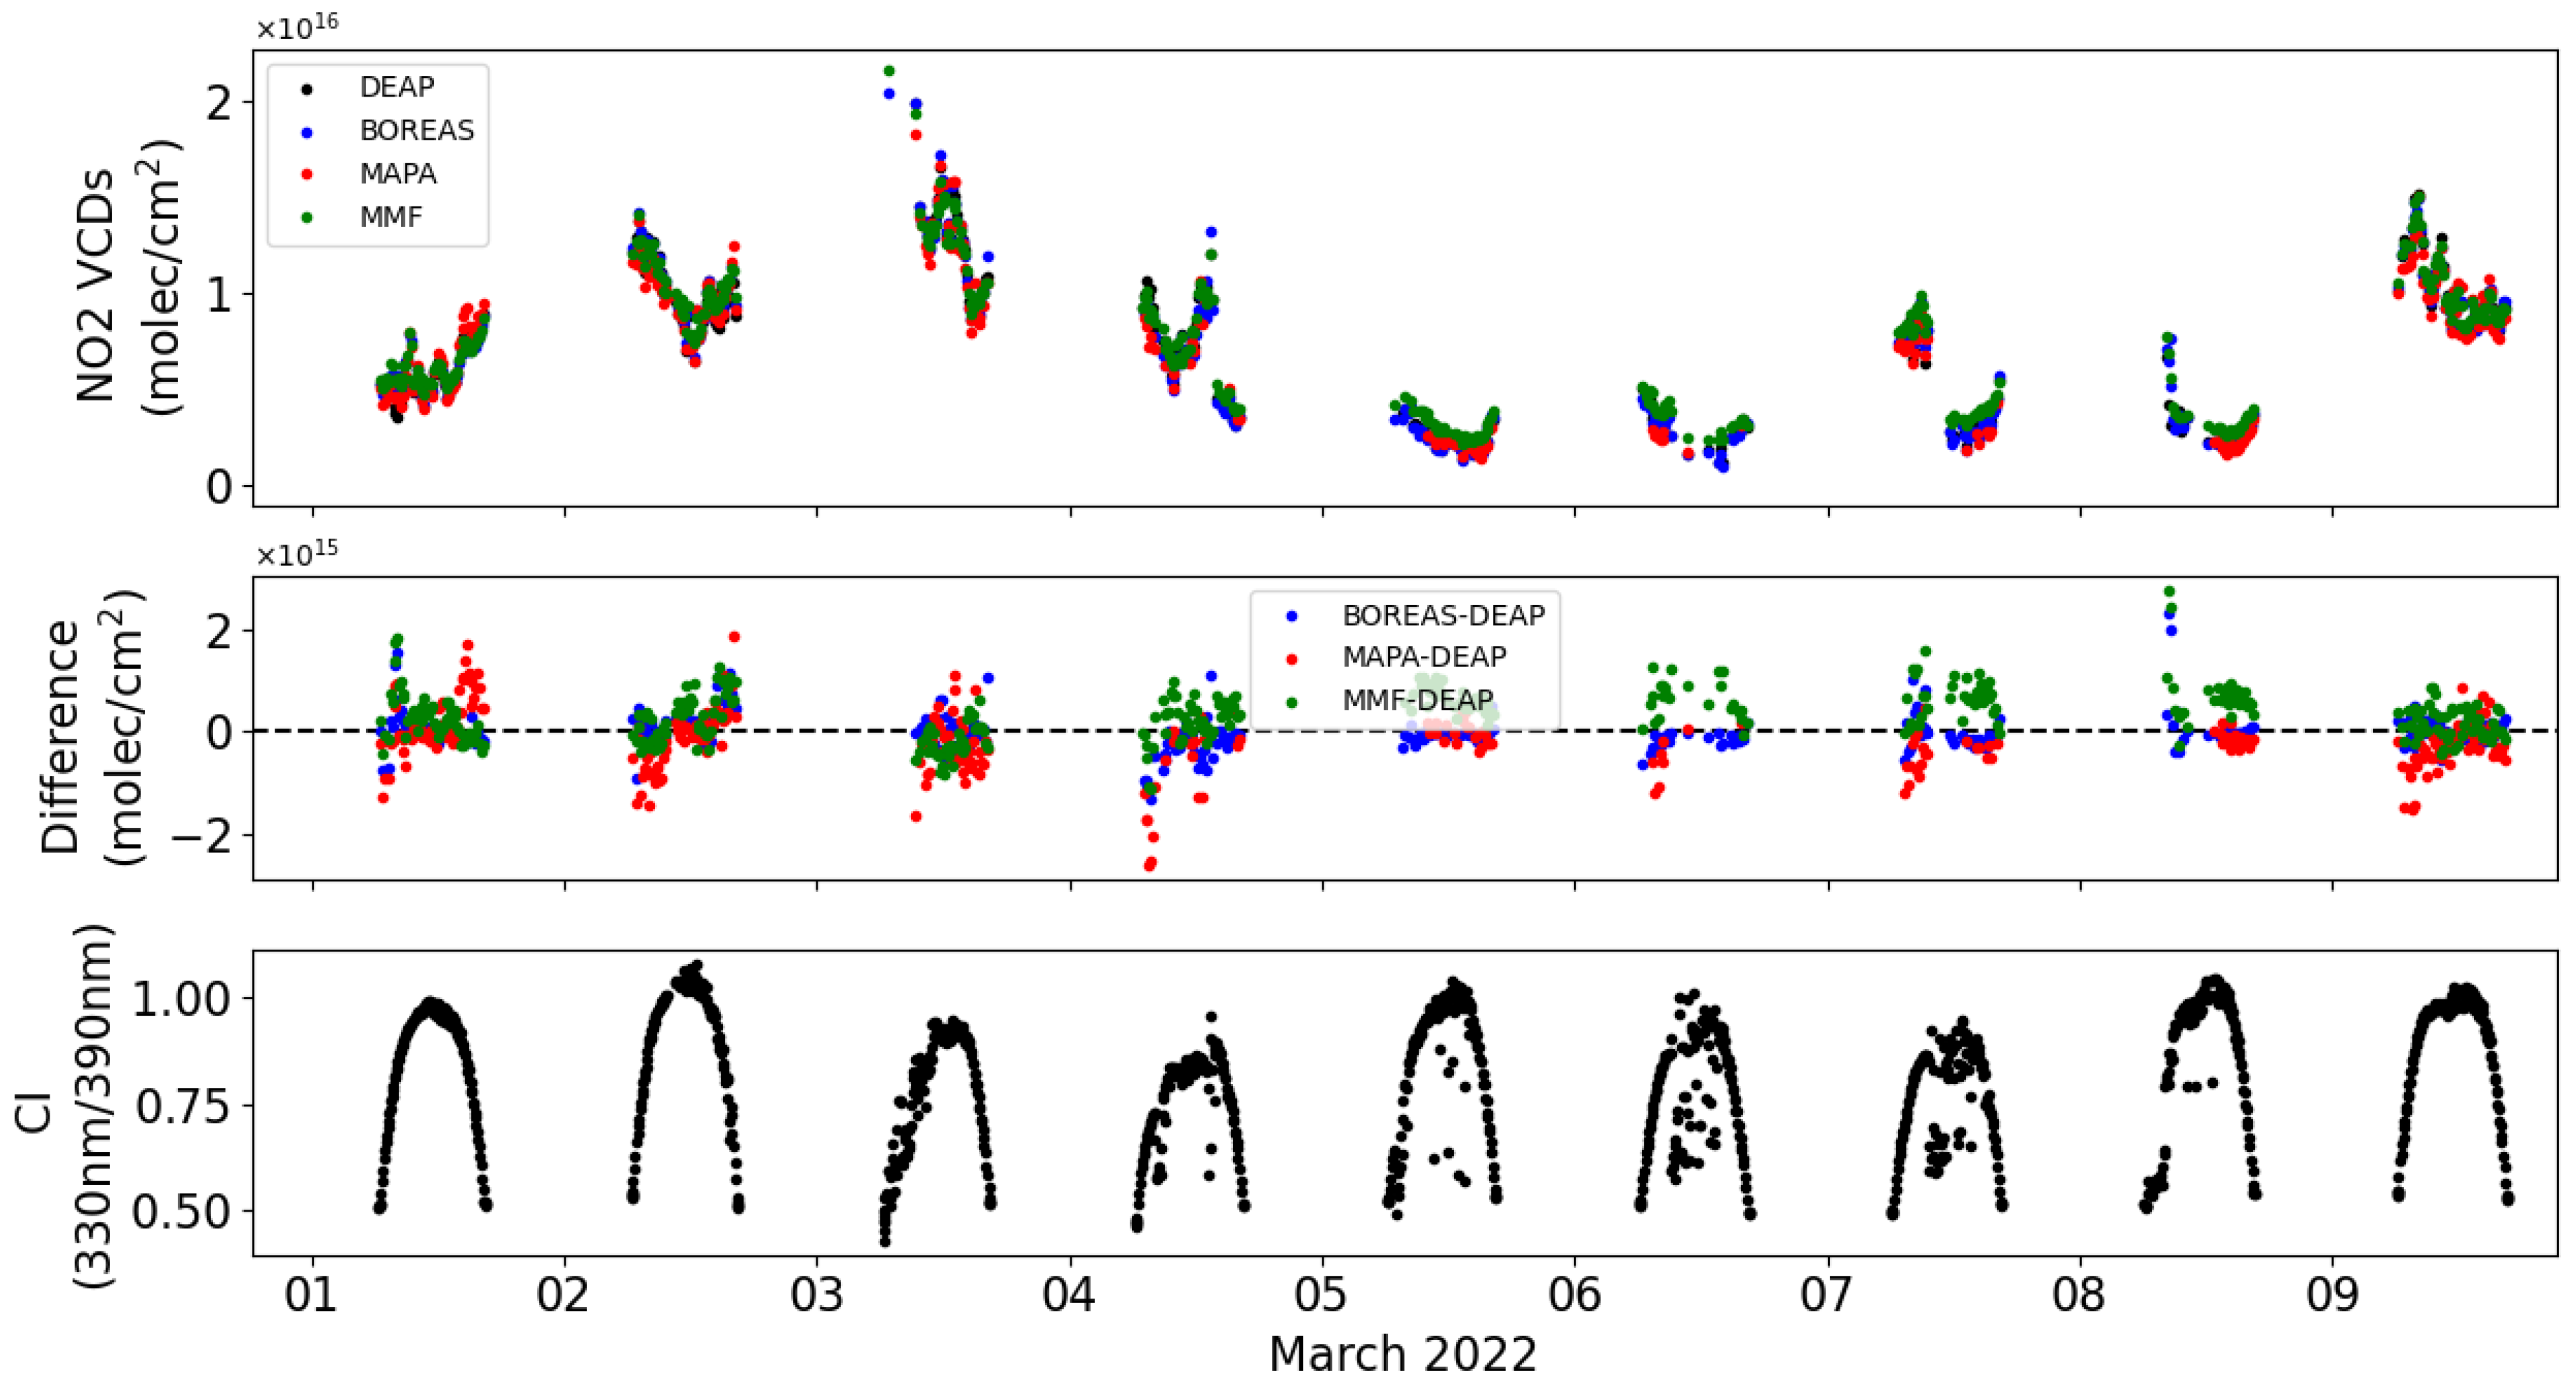
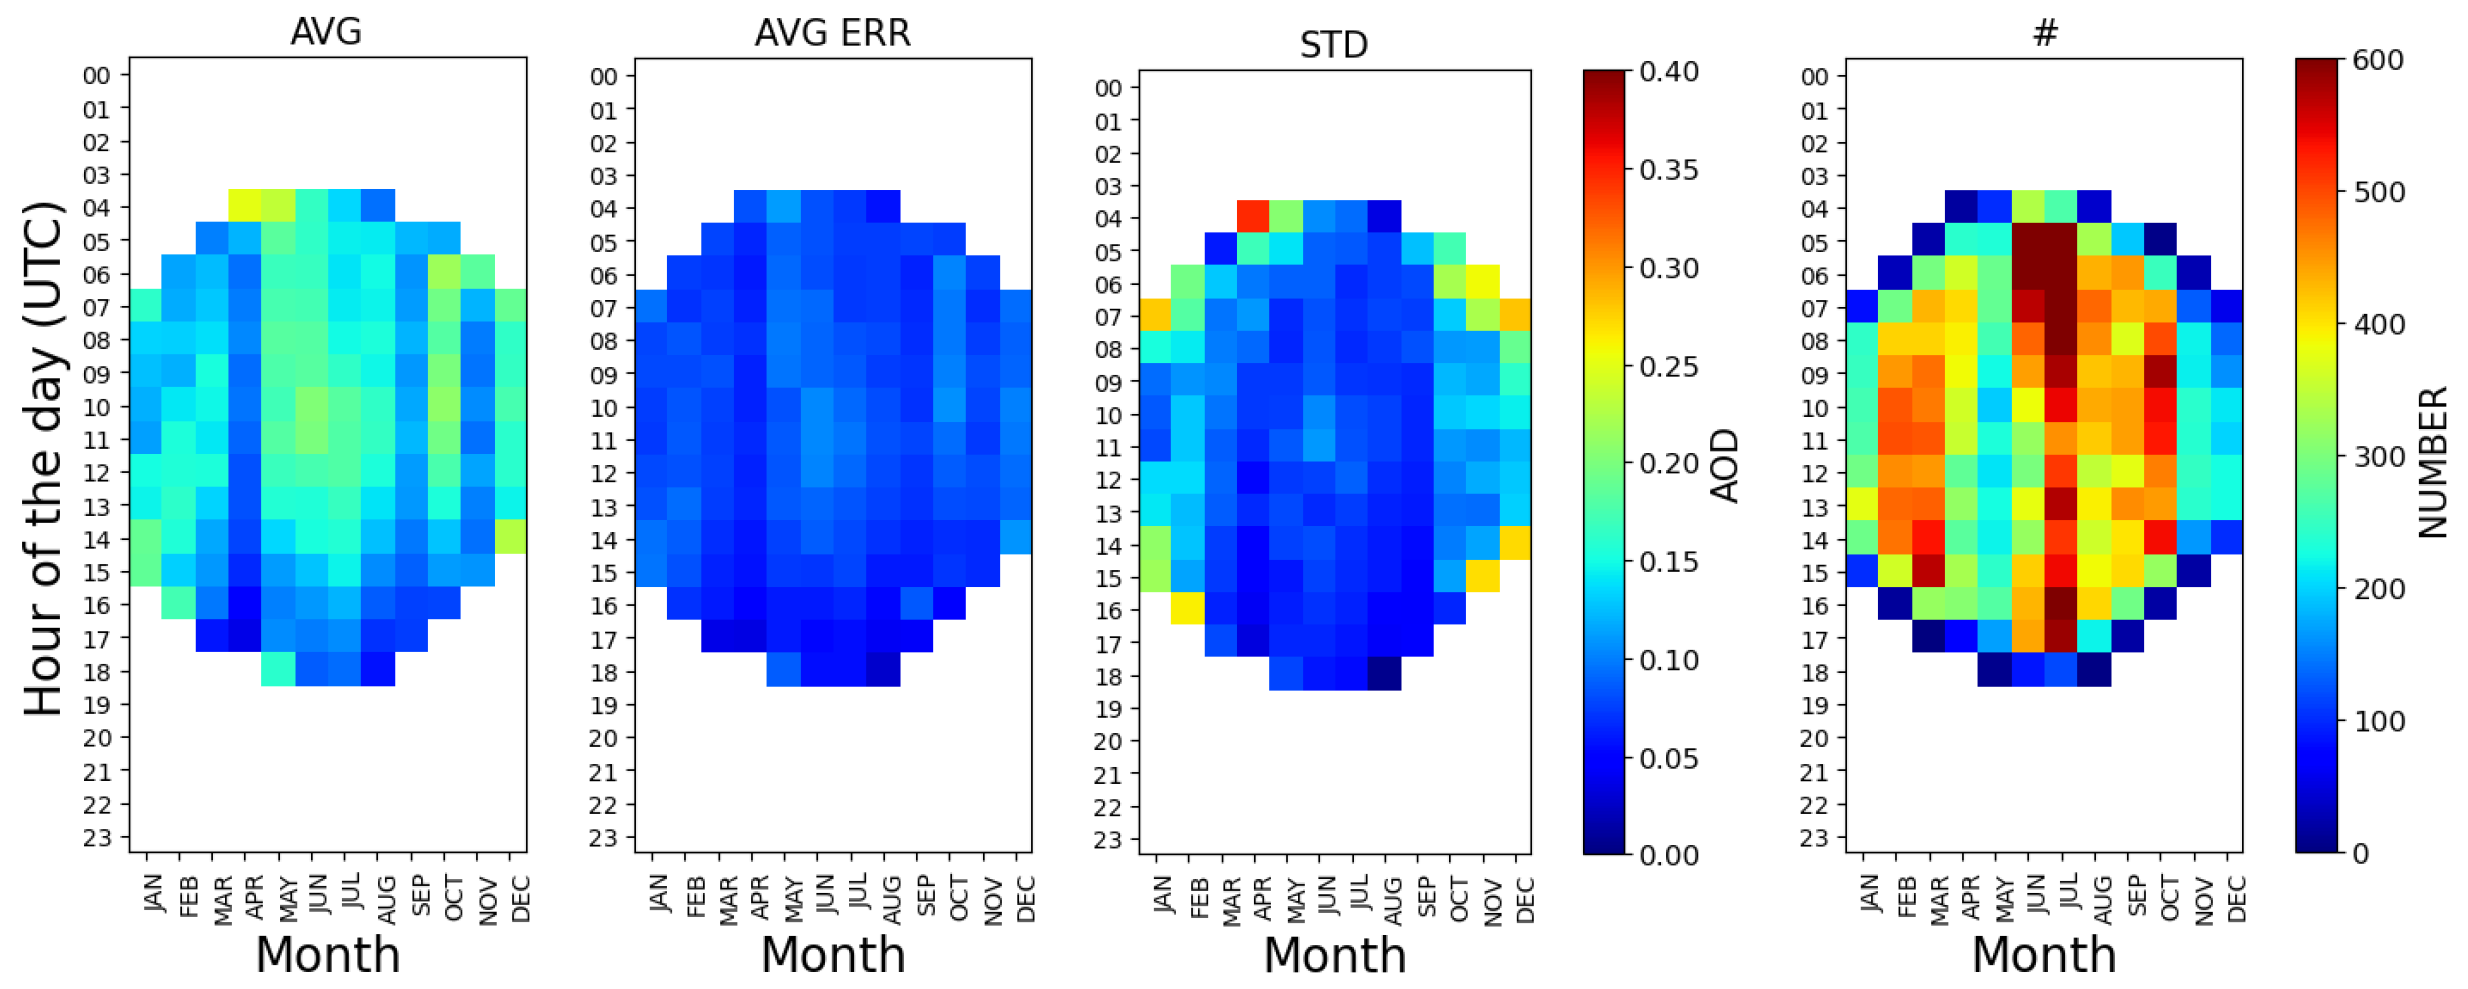
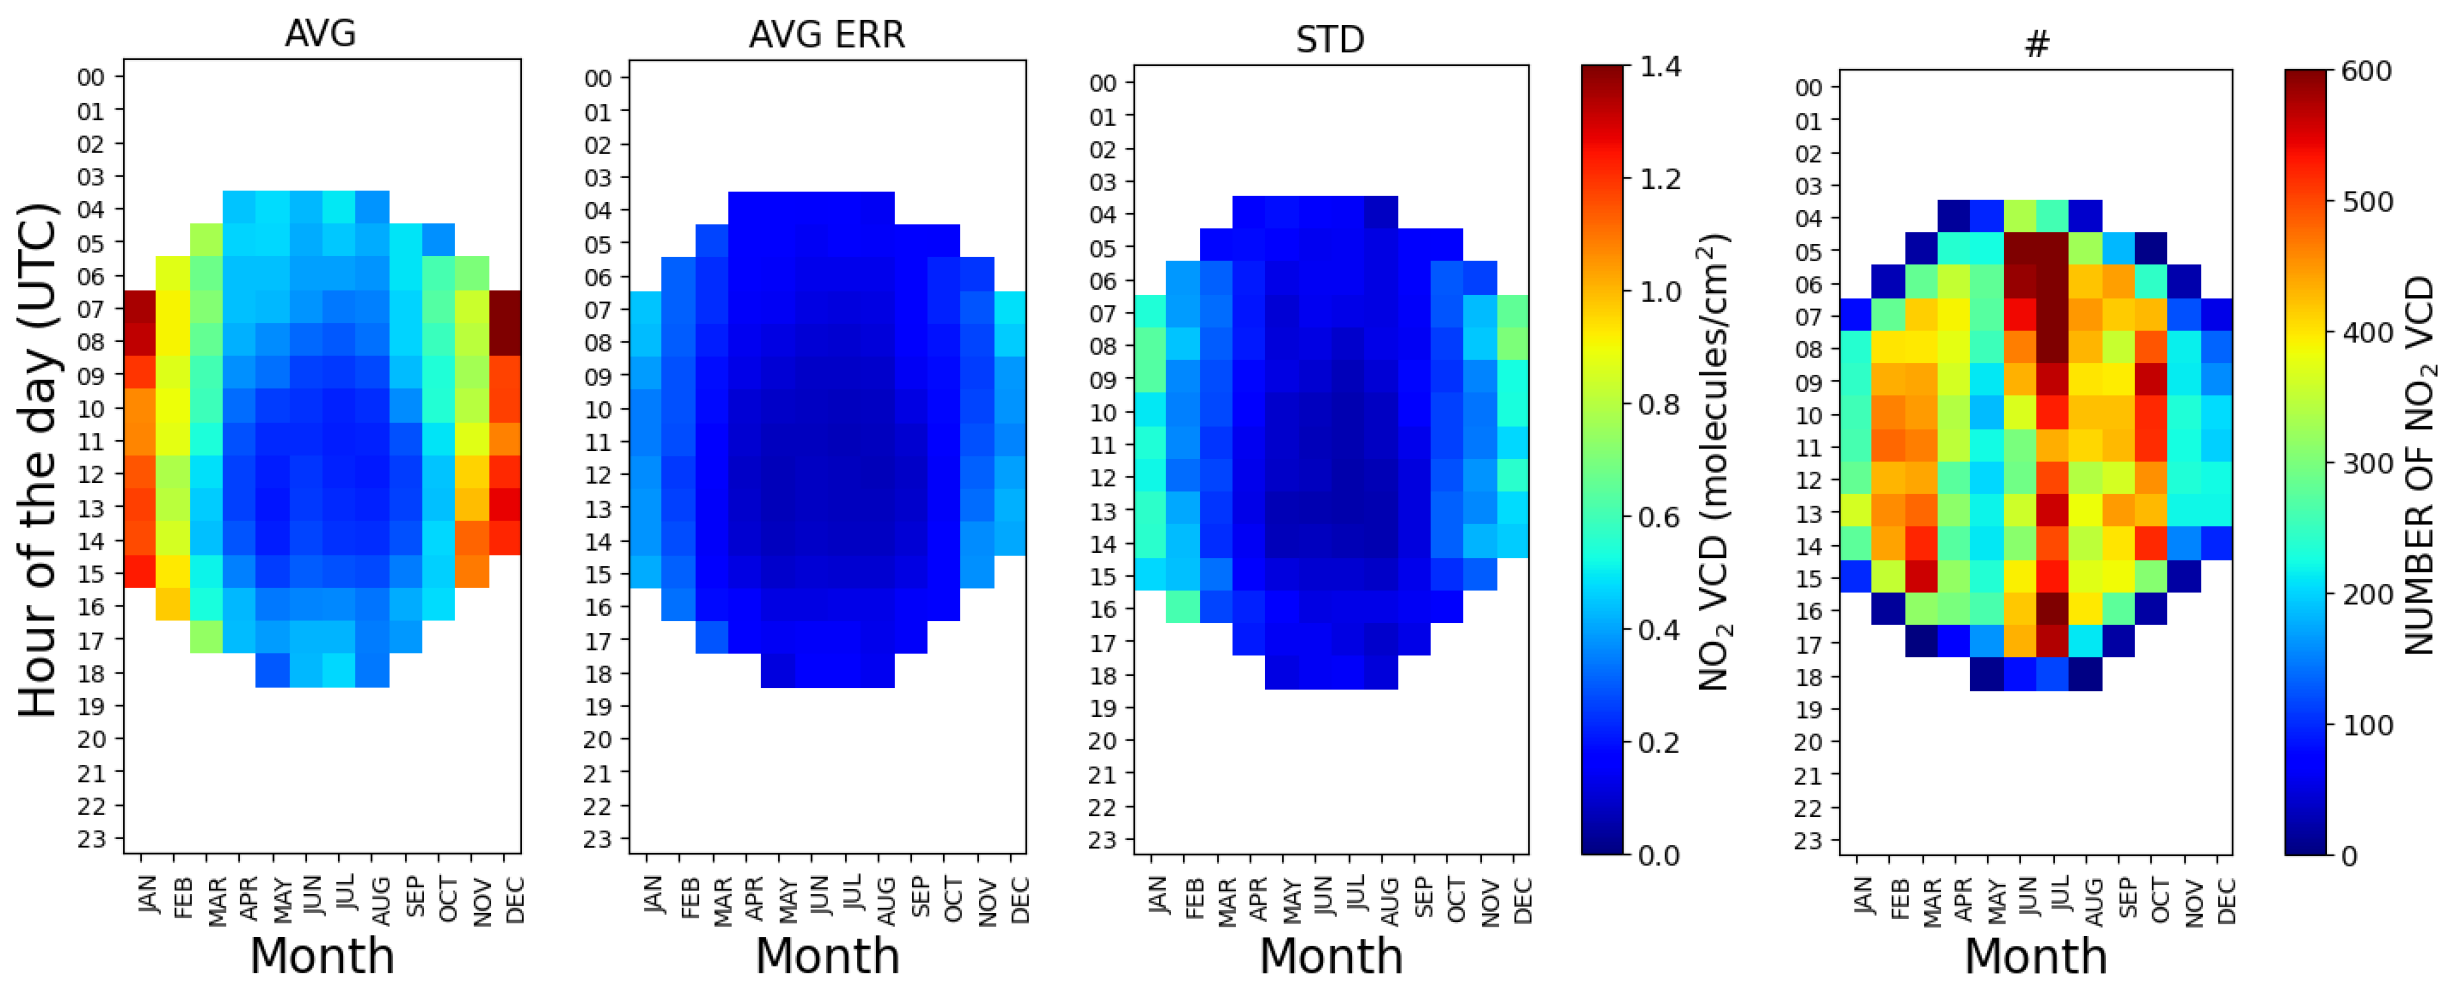
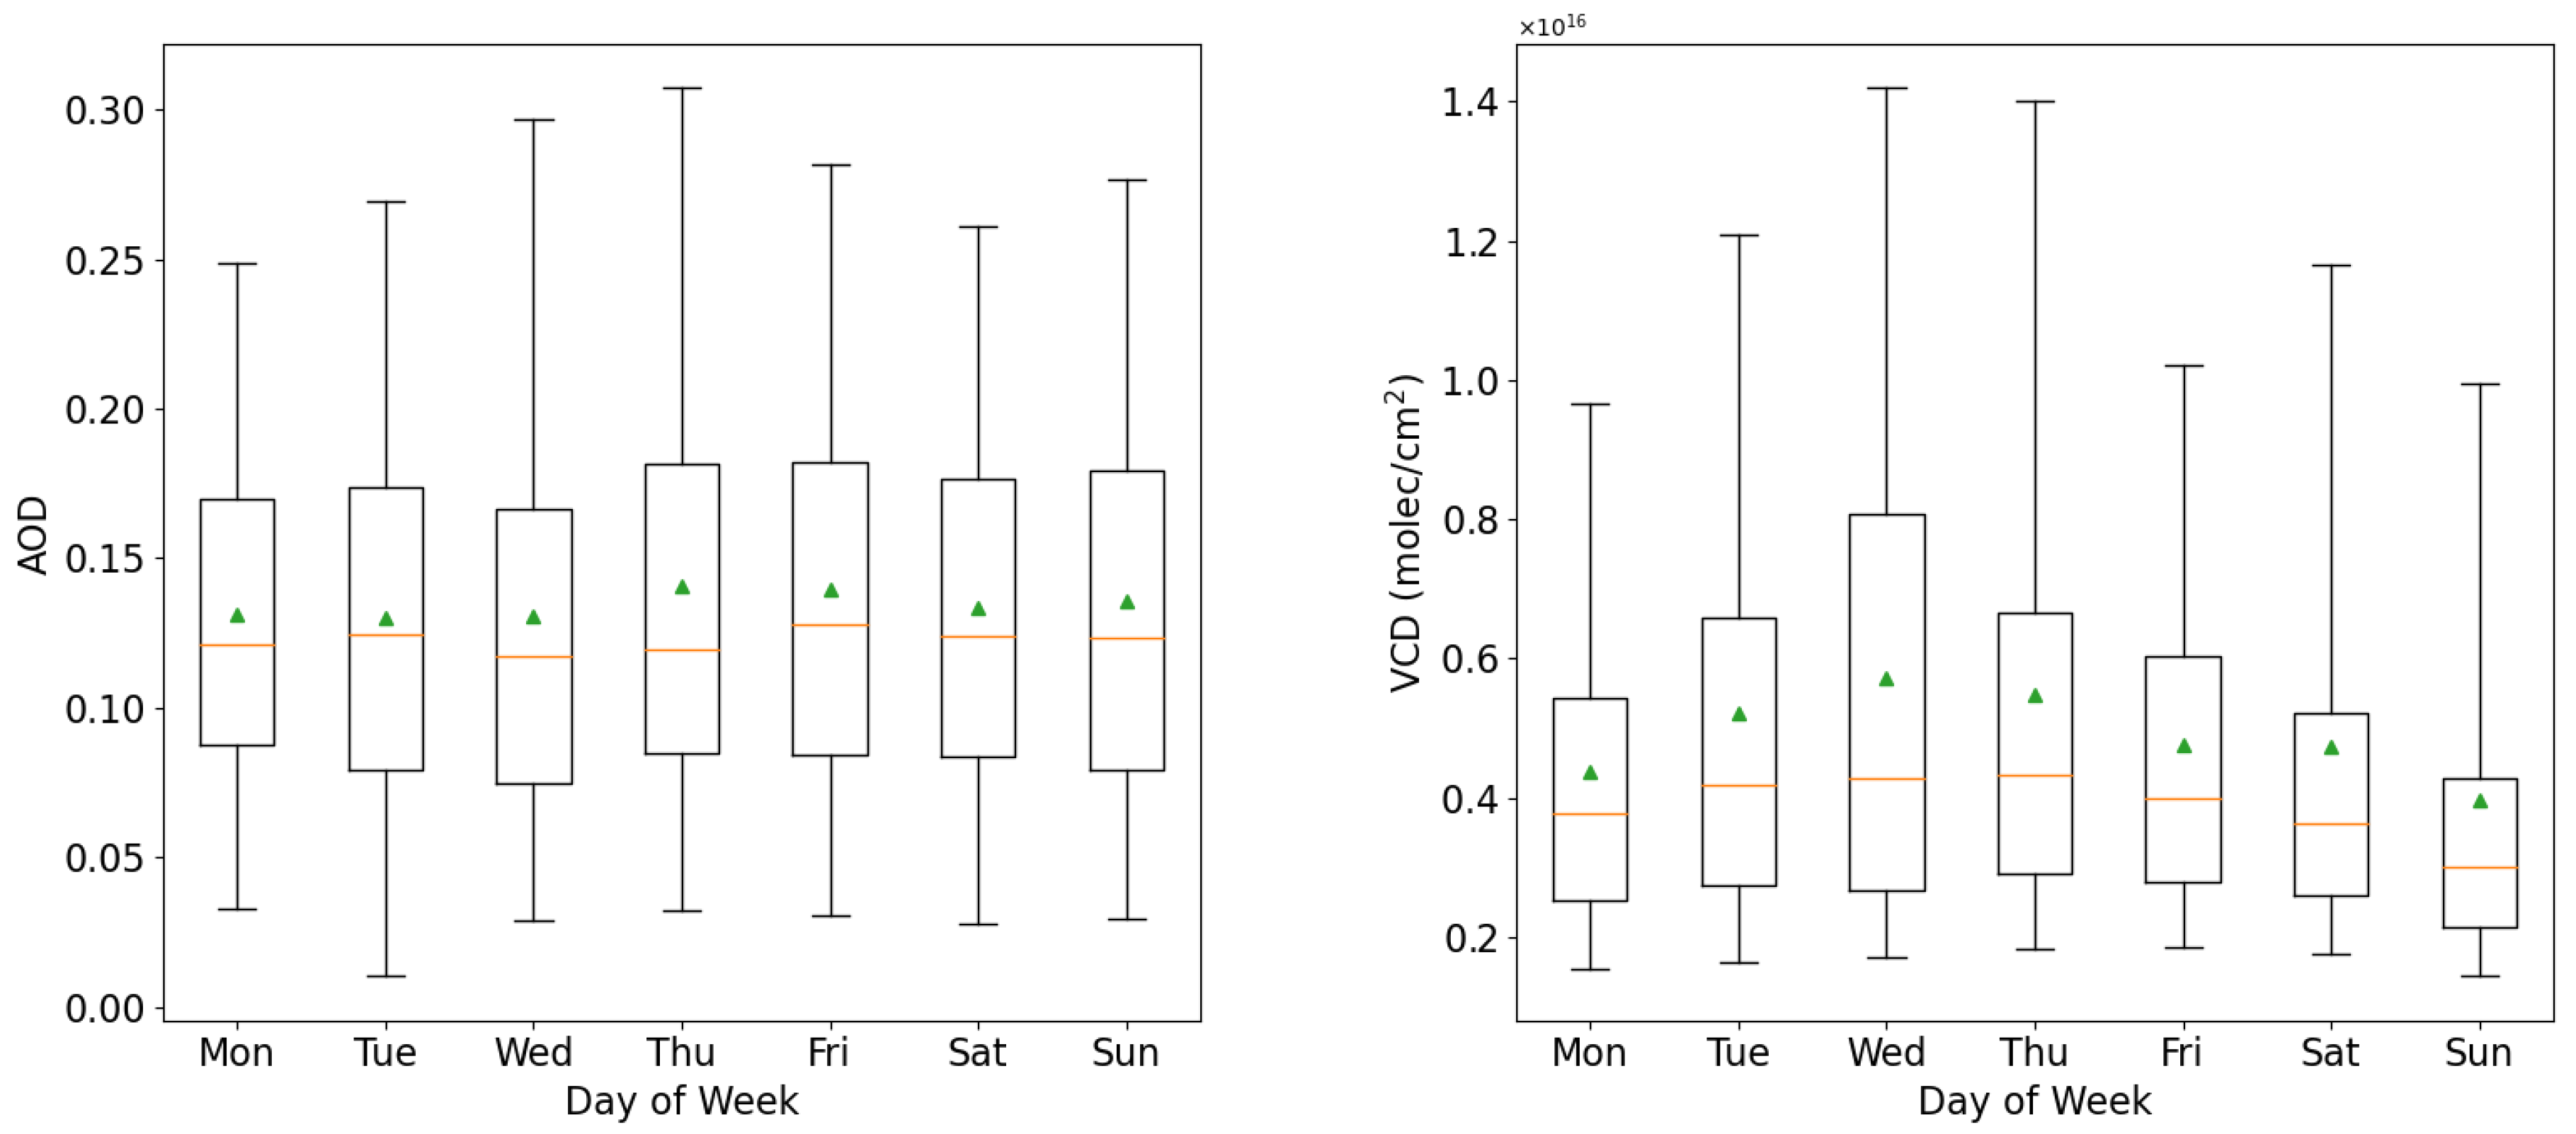
3.2. San Pietro Capofiume Dataset of NO2 Tropospheric VCDs and AODs

The DEAP code was applied to the first two years of SPC SkySpec-2D MAX-DOAS dSCDs, obtained with the QDOAS (settings in Table A2 of [21]) from the VIS spectra. A global overview of the dataset, as a function of months and time of the day, is given in Figure 9 for AODs at 477 nm, and in Figure 10 for NO2 tropospheric VCDs. The average values, errors, standard deviations and number of observations are reported in the four panels of each figure. We show the filtered results, even though the effect of residual clouds can still be present, particularly in the case of fog or very low clouds.
AOD values are generally higher during the summer with higher values usually present in the middle of the day. The average standard deviations are slightly larger in winter, probably due to residual cloud effects under fog conditions. The number of points is generally higher during spring/summer and lower during winter. This behavior is mainly due to the number of sunny days which is higher during summer. However, it is also evident that a lower number of points is present in May. This is due to an instrument failure in May 2022.
NO2 tropospheric VCDs show seasonal behavior. Higher values are found all day during winter. Due to photochemistry, values in the early morning and late afternoon are higher than the ones around noon. In winter, the NO2 distribution is more uniform due to more stable atmospheric conditions in the boundary layer, with the possible presence of a thermal inversion that inhibits the dispersion and enhances the fog probability. As for AODs, the standard deviations are higher in winter, probably due to unfiltered clouds/fog effects that produce some high values.
The weekly cycles of AODs and NO2 tropospheric VCDs are reported in Figure 11. The median values are the orange lines, the box limits represent the 25th and 75th percentiles, the whiskers are the 5th and 95th percentiles and the green triangles are the mean values. The AODs do not show any evident variations with the weekdays, with average and median values of about 0.14 and 0.13, respectively. On the other hand, the NO2 tropospheric VCDs show an evident weekly trend. They increase during the first days of the week, reaching the peak on Wednesday for the mean and on Thursday for the median, and tend to decrease during the second half of the week, reaching the minimum on Sunday. Indeed, the NO2 VCDs on Sunday are on average about 20% lower than the mean weekly VCDs.

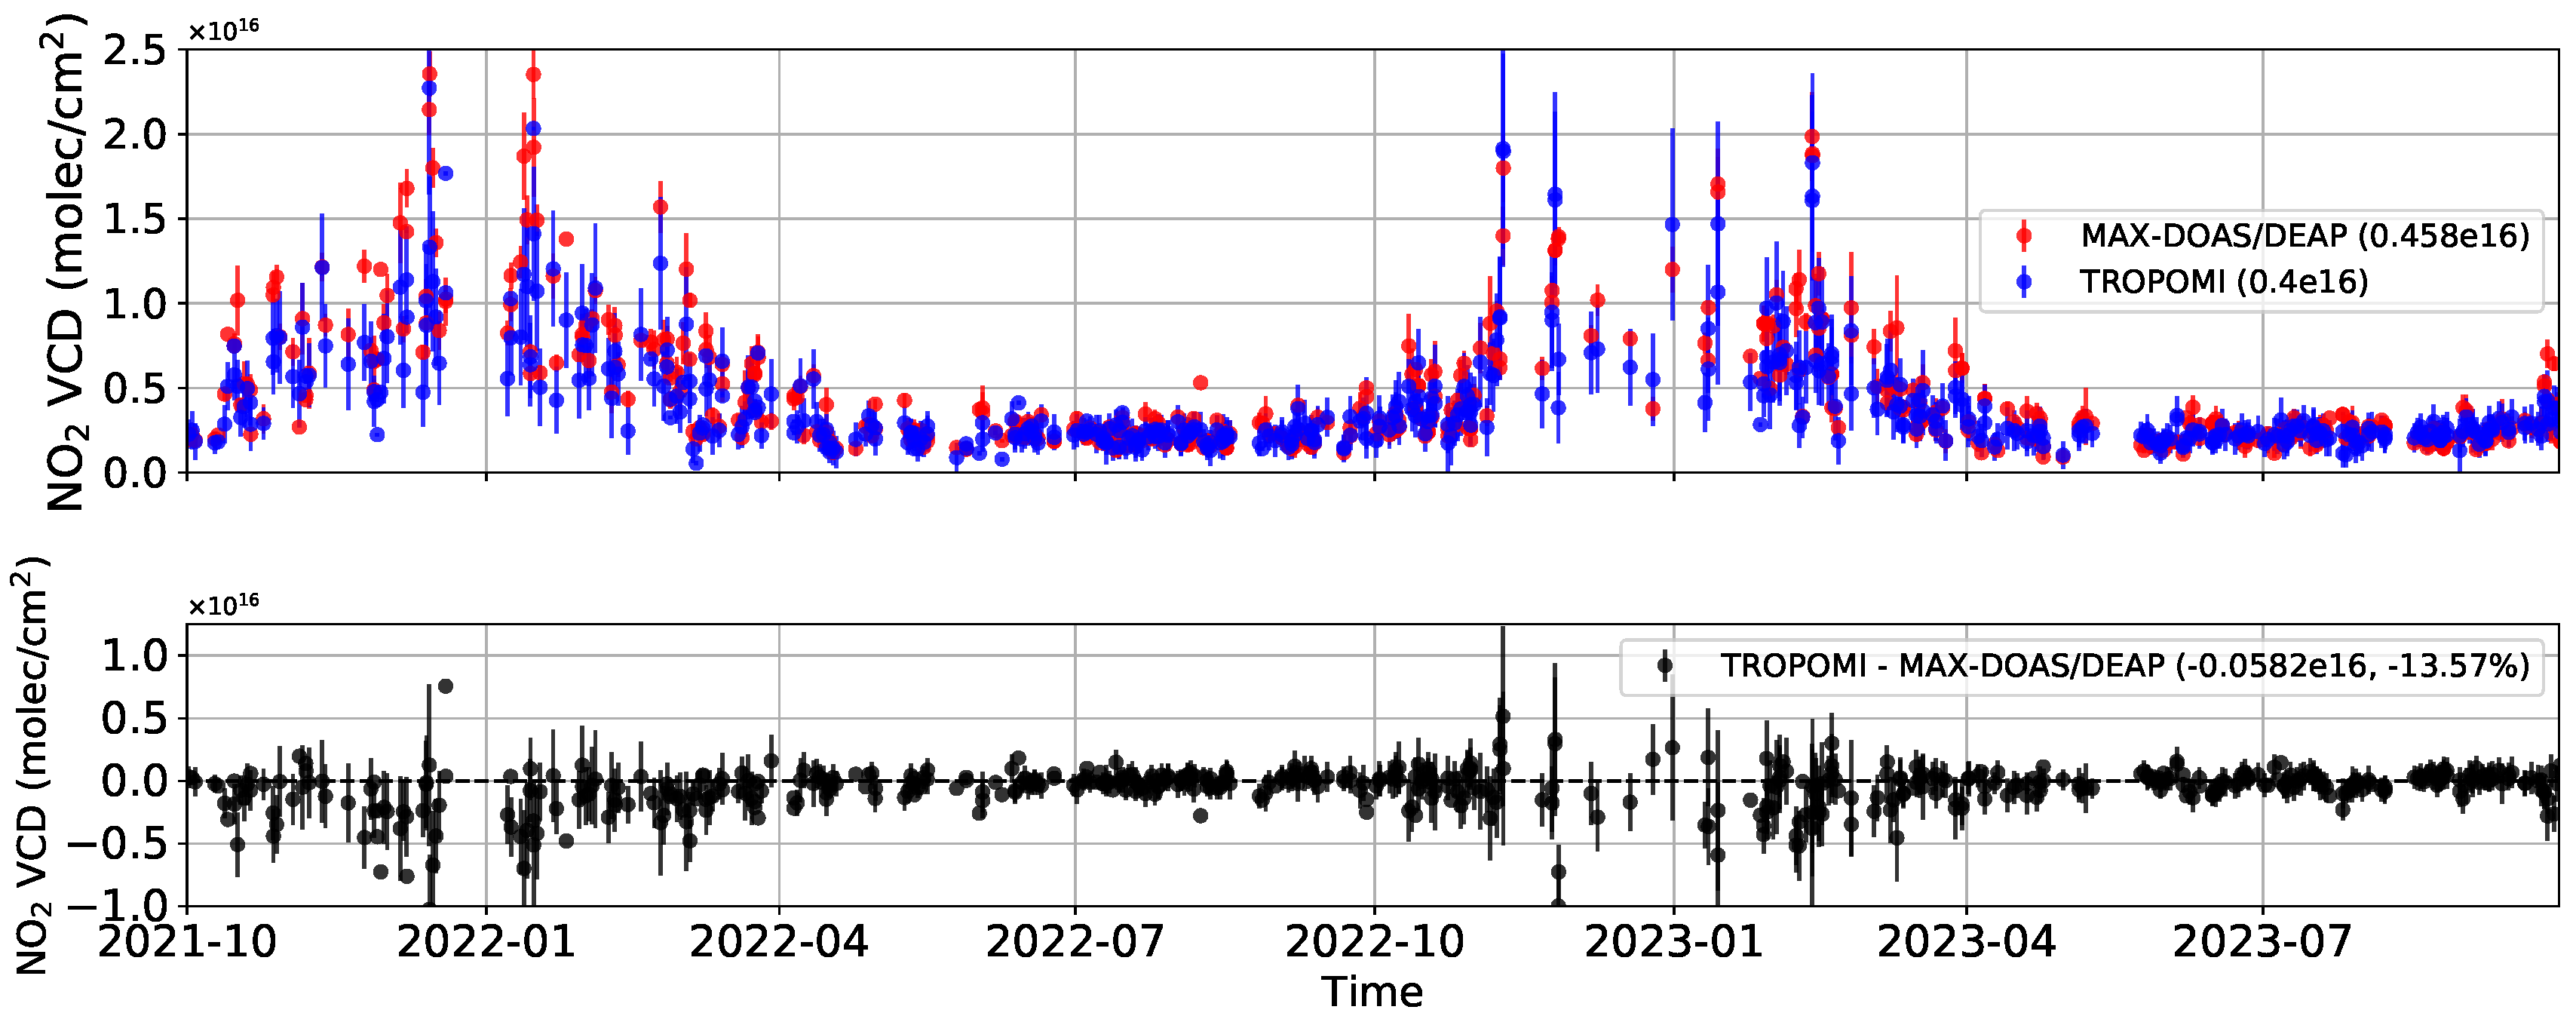
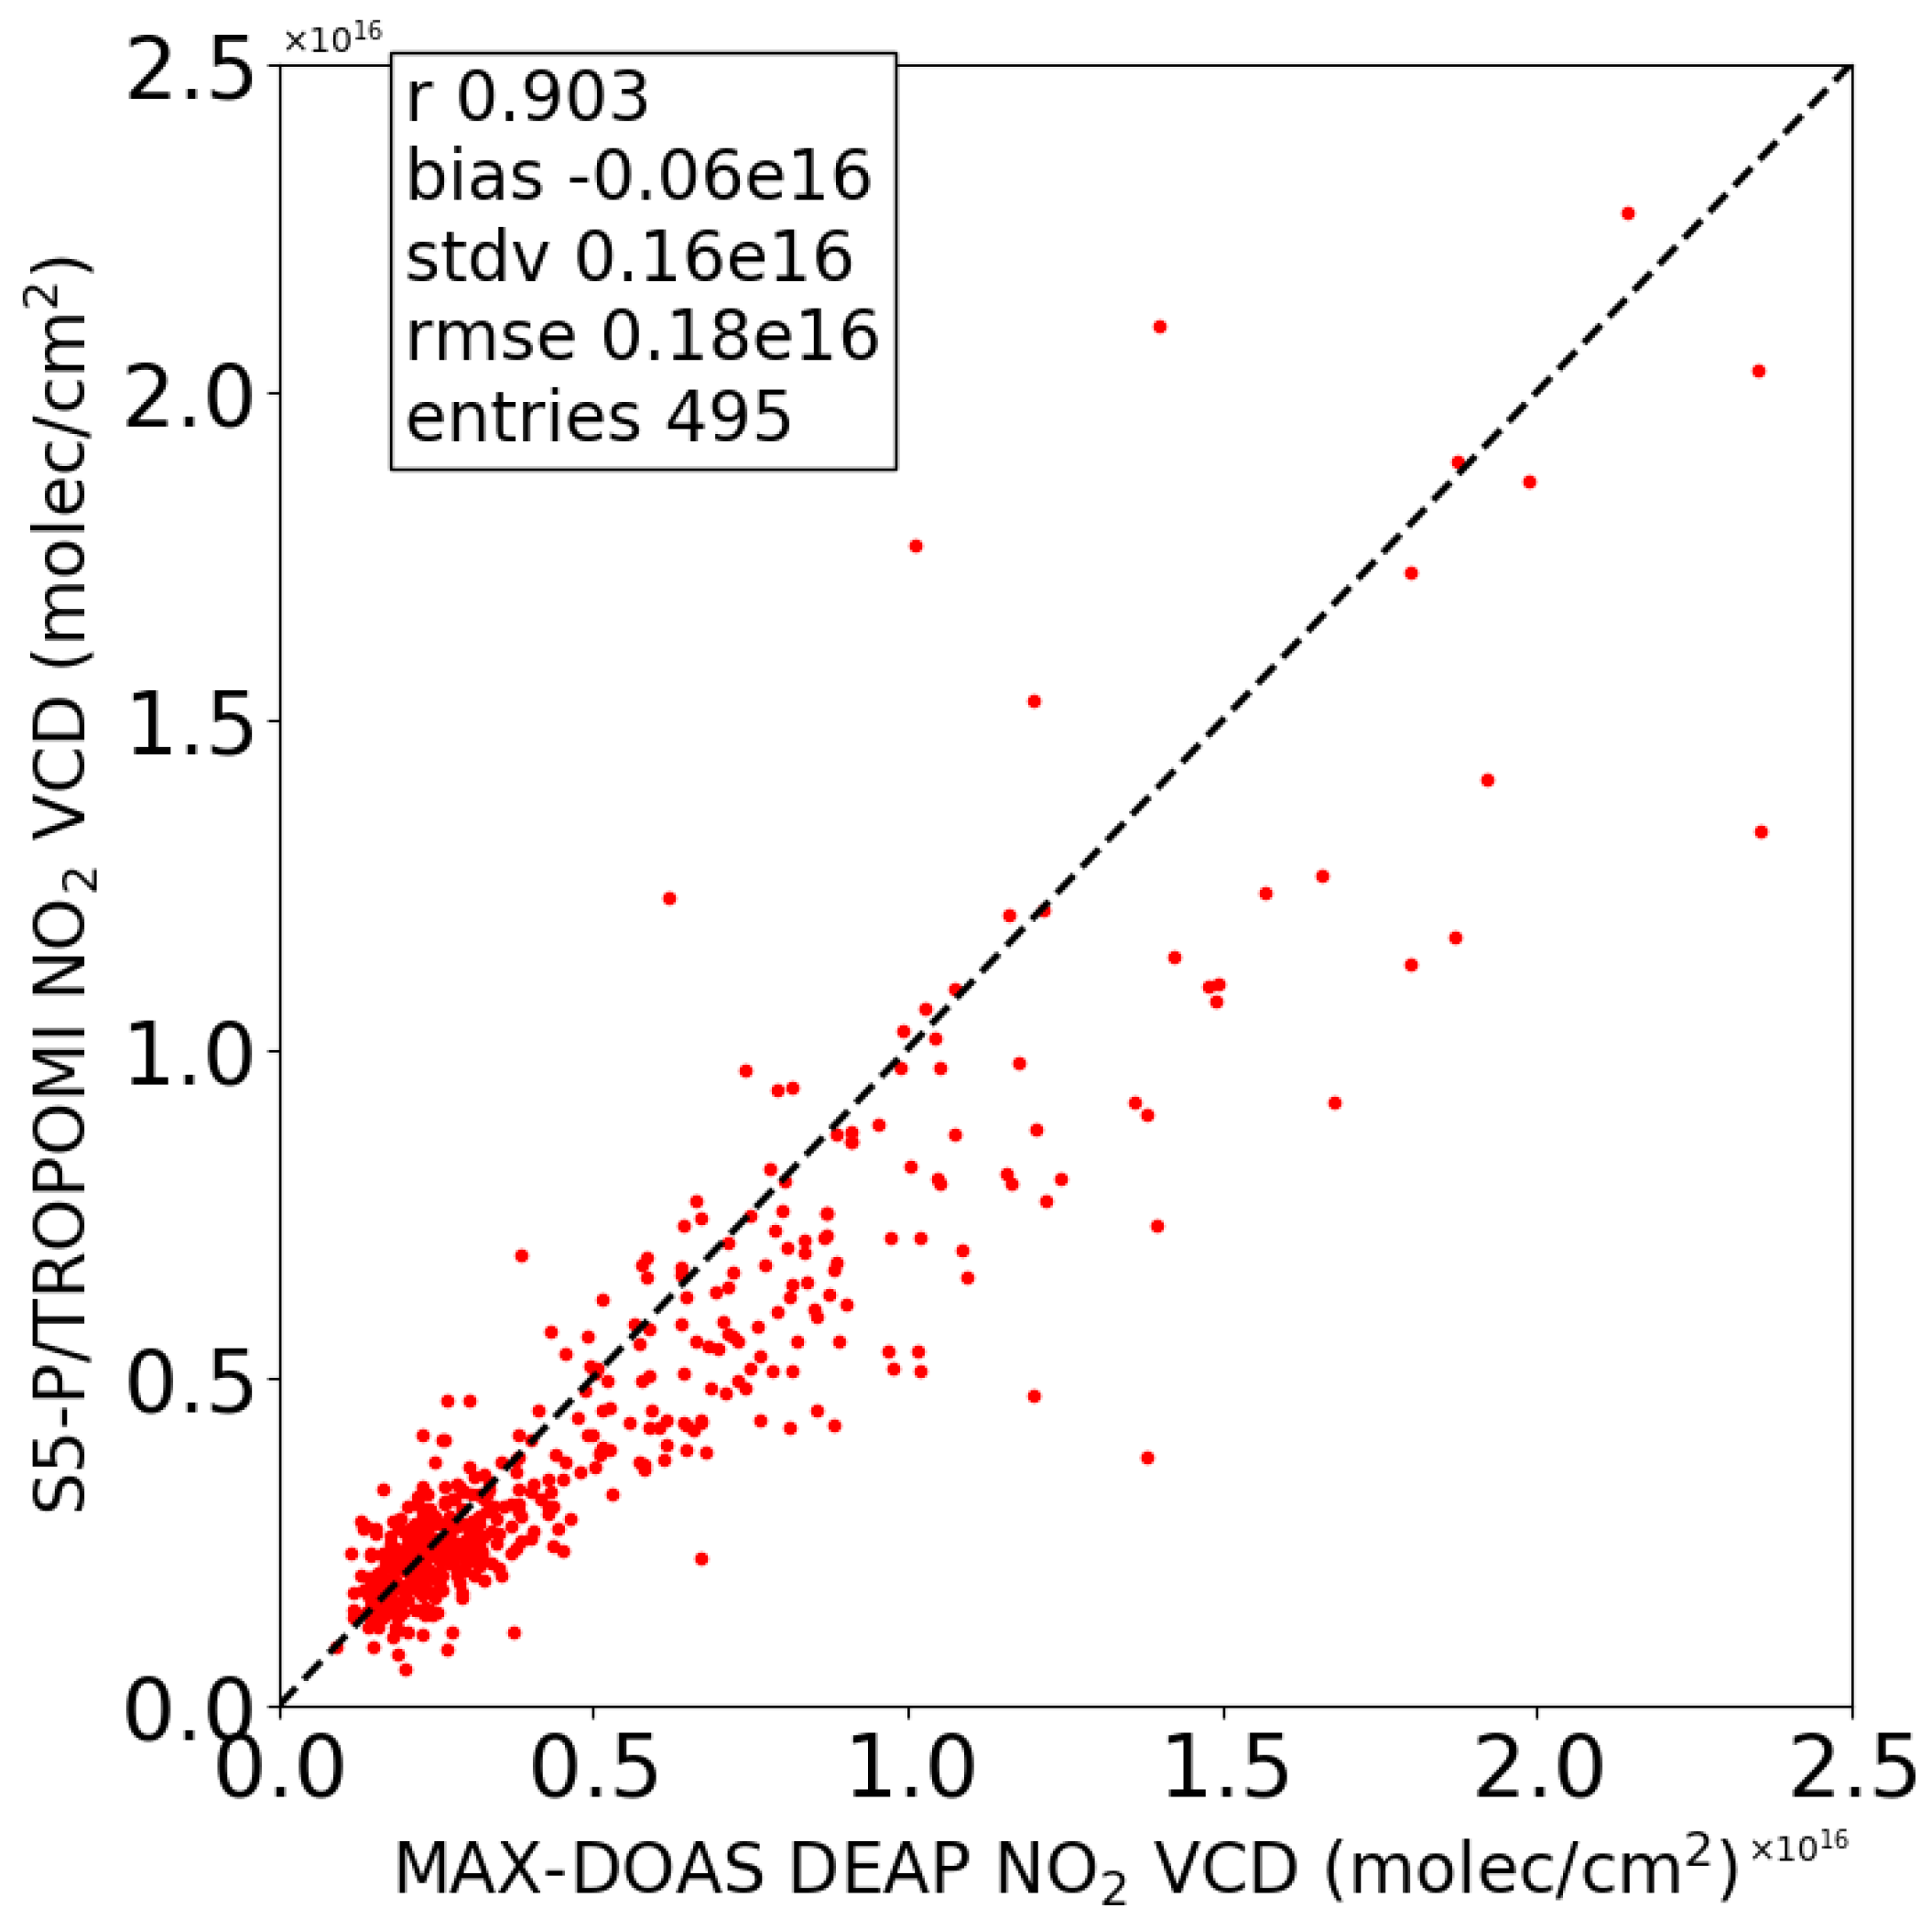
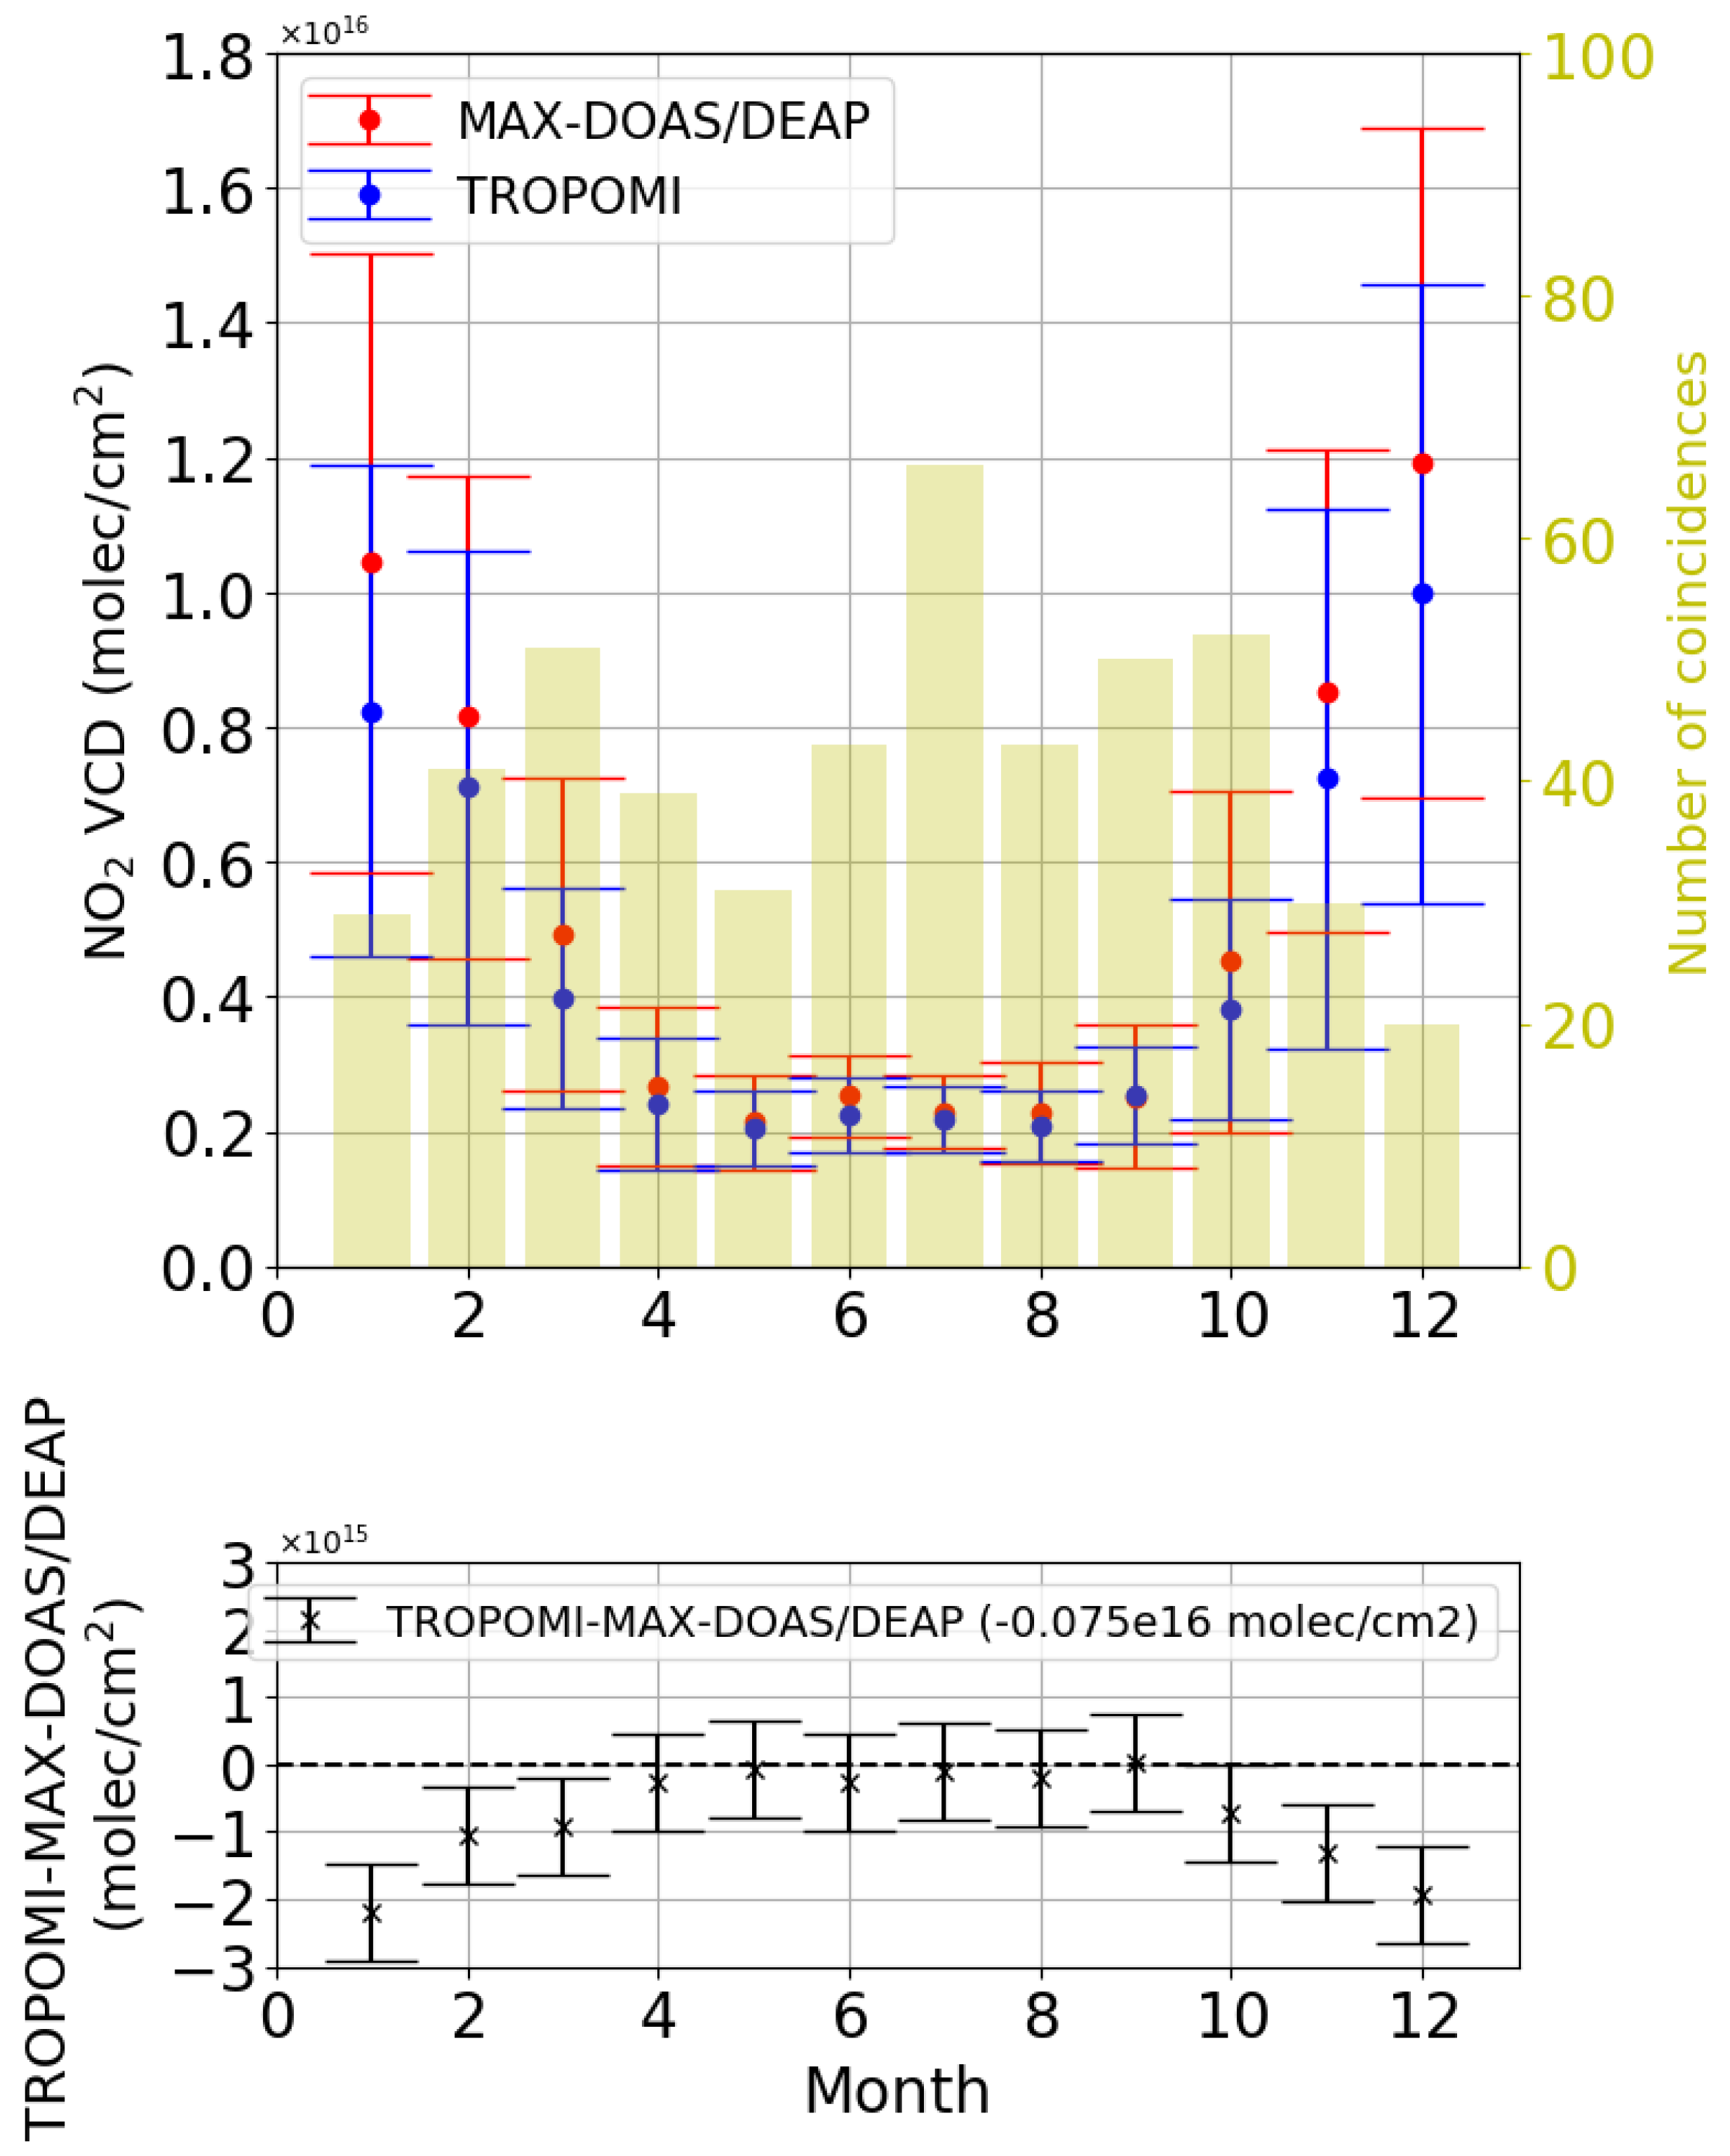
3.3. Inter-Comparison with Satellite Data

Validation of satellite data is one of the primary uses of MAX-DOAS instruments. While retrieved MAX-DOAS NO2 products (tropospheric and total columns) are considered a reference for satellite validation (e.g., refs. [9,48,49,50]), aerosol extinction retrievals are not. However, the quality of aerosol extinction retrievals also affects the quality of subsequent gaseous retrievals. For this reason, we compare the AODs obtained from the SkySpec-2D retrieved extinction profiles at 477 nm with the MODIS-MAIAC retrievals at 470 nm. As reported in Section 2.3, MODIS Terra equatorial overpass is at 10:30 while for Aqua it is at 13:30. The scatter plot between MODIS-MAIAC AODs in 1 × 1 km2 cell, containing the SPC site, and MAX-DOAS AODs, averaged within ±15 min from MODIS-MAIAC sensing time and considering all the three azimuth directions, is reported in Figure 12. The results show a good correlation of about 0.73, a bias of 0.037 and a standard deviation of about 0.08. About 69% of the points are in the range of MODIS MAIAC Expected Error (EE) of ±(0.05 + 0.15 × AOD). In general, MODIS-MAIAC AODs are larger than the DEAP ones.
Figure 13 shows the monthly behaviour of SkySpec-2D AODs compared to MODIS-MAIAC Aqua and Terra ones. In general, the seasonal behaviours of SkySpec-2D and MODIS-MAIAC are quite similar, with more significant differences in January, April and May. As shown in Figure 14, the hourly behaviours of SkySpec-2D and MODIS AODs are very similar with slightly higher values at the beginning of the day. It is interesting to note that, by using the two satellites (with different overpasses), part of the information on hourly AOD distribution can be recovered.
The validation of Sentinel-5P TROPOMI NO2 tropospheric VCDs is one of the targets of the FRM4DOAS network. Figure 15 shows the time series of SkySpec-2D NO2 tropospheric VCDs from MAX-DOAS scans in coincidence with Sentinel-5P TROPOMI data for the first two years of SkySpec-2D measurements. Their differences are also reported. For the coincidence, we considered the Sentinel-5P TROPOMI data averaged in a circle of 5 km radius around SPC and the MAX-DOAS cloud free data in the three azimuth directions averaged within ± 15 min around the Sentinel-5P TROPOMI overpass time. The Sentinel-5P TROPOMI and MAX-DOAS error bars represent the standard deviations of the averaged data. SkySpec-2D and Sentinel-5P TROPOMI show similar behaviour with higher values in winter and lower values in summer, as already reported in Figure 10. The bias is of the order of −14% (−6 × 10¹⁴ molec/cm2).
Similarly to Figure 12 and Figure 13, Figure 16 and Figure 17 presents the scatterplot of Sentinel-5P TROPOMI versus SkySpec-2D NO2 tropospheric VCDs and their monthly behaviour. NO2 VCDs are higher in autumn-winter and lower in spring-summer. SkySpec-2D VCDs are higher than the Sentinel-5P TROPOMI ones in autumn-winter. However, the correlation with Sentinel-5P TROPOMI is good (around 0.9) and the major differences are found for higher NO2 VCDs (above 0.5 × 10¹⁶ molec/cm2).
The underestimation of NO2 tropospheric VCDs in polluted regions by Sentinel-5P TROPOMI has already been documented. As reported in Section 2.3, Sentinel-5P TROPOMI tropospheric NO2 VCDs are retrieved using the retrieval algorithm developed at KNMI [44] and NO2 profiles from the TM5-MP model.
To correct the Sentinel-5P TROPOMI values according to Equation (8), we need the values of the SkySpec-2D NO2 retrieved profiles interpolated to Sentinel-5P TROPOMI AK altitude levels. For this work, we decided to average the SkySpec-2D profiles in a temporal range of ±15 min around the Sentinel-5P TROPOMI overpasses to reduce the standard deviations of the averaged points. We filtered out MAX-DOAS profiles as already explained in Section 2.2.1.
Figure 18 reports the comparison of NO2 tropospheric VCDs from SkySpec-2D and Sentinel-5P TROPOMI before and after the correction. As can be seen, the bias moves from slightly negative to slightly positive and the correlation slightly decreases from 0.90 to 0.87. The positive bias introduced by the correction is mainly due to the low values overestimated by Sentinel-5P TROPOMI. However, a better agreement exists for the high values with the ordinary least square slope increasing from 0.75 to 0.89.

4. Discussion

The starting point of our work was the development and validation of the retrieval code DEAP for MAX-DOAS aerosol extinction and NO2 tropospheric profiles. The availability of analogous results from two FRM4DOAS reference retrieval codes (MMF and MAPA) and from the state-of-the-art BOREAS algorithm was then exploited. The validation of the DEAP code with synthetic dSCDs showed that, for AODs, DEAP performs at least as good as MMF and MAPA in terms of slope, correlation and RMS, and worse in terms of intercept. Considering the NO2 tropospheric VCDs, the DEAP correlations and RMS are better than MMF and MAPA ones. However, the slope is worse, being too high. Regarding tropospheric profiles, the DEAP shows a correlation of 0.94 for aerosol extinction at 477 nm, and a low RMS of 0.05 and a correlation of 0.65 for NO2 tropospheric profiles. The DEAP code applied to actual data produces good results compared to MMF, MAPA and BOREAS. In particular, the DEAP AODs present low biases with respect to all three other codes but high correlations only with respect to MMF and BOREAS (higher than 0.97). The lower correlation and high standard deviation found with MAPA suggest that MAPA AODs are more scattered with respect to the other codes. Considering the NO2 tropospheric VCDs retrieved with real data, DEAP presents similar performances with respect to MAPA, MMF and BOREAS, with high correlations (about 0.99). Once the code was validated we exploited it over the two full years of measurements at SPC. The AOD diurnal cycle is in-line with the one observed in the past at SPC [51]. The AOD values are higher during the day and in the afternoon. The patterns are similar over the months with some oscillations due to different seasons. Regarding the weekly cycle, the results reported here highlight the absence of a weekly cycle in the AODs at SPC.
The tropospheric NO2 VCDs show higher values between October and March and lower smooth values from April to September. The observed seasonal cycle is the same as reported in [52] using Global Ozone Monitoring Experiment (GOME) data on the Lombardy from 1996 to 2002. Additionally, the observed values are similar to the ones reported in [52]. The weekly cycle we observed is weak, with Sunday values lower by about 20% with respect to Monday–Friday averages. In [52] they found average higher NO2 values and a stronger weekly cycle, with Sunday values significantly lower than those on the other days of the week. This difference is mainly related to the different locations. Indeed, although both SPC and Milan are located in the Po Valley, the NO2 concentrations around Milan are highly influenced by local emissions due to factories and traffic, which can present stronger weekly patterns. On the other hand, SPC is located in a rural area, where the anthropogenic emissions are lower than the background. In SPC, the accumulation of gaseous pollutants is favored by atmospheric stability, thermal inversions and weak winds, in particular during cold winter months, as in [53]. Our results at SPC show that the local NO2 production by traffic is far from the major production sources. Hence the SPC observatory is well representative of background conditions in the Po Valley.
Since the validation of satellite data is one of the primary uses of the MAX-DOAS retrievals, we also compared our results to data from MODIS-MAIAC and Sentinel-5P TROPOMI. Although MAX-DOAS measurements of aerosol extinction are not considered a reference for satellite validation, unlike MAX-DOAS NO2 and HCHO retrieved tropospheric and total VCDs, the quality of aerosol extinction profiles also affects the quality of the subsequent retrieval of gas profiles. For this reason, we have compared the results obtained with the DEAP code for aerosol extinction with MODIS-MAIAC results for Aqua and Terra satellites. In addition, we also compared the NO2 tropospheric VCDs obtained by DEAP with the one measured by Sentinel-5P TROPOMI. In general, the seasonal behaviour of SkySpec-2D and MAIAC is similar, with larger differences in March, April and May. The overall agreement is good with most points (about 69%) laying between MODIS-MAIAC EE. The possibility of exploiting two satellites (Terra and Aqua) with different overpass times allows us to compare our results over different times of the day. The MODIS-MAIAC data confirm the diurnal cycle observed by the MAX-DOAS instrument. We found a bias with respect to MODIS-MAIAC that is below 0.04. As expected, the SkySpec-2D NO2 tropospheric VCDs are higher than the Sentinel-5P TROPOMI ones, especially in autumn-winter when the NO2 tropospheric VCDs are higher. We found a bias of −0.6 × 10¹⁵ molec/cm2 with a standard deviation of 1.8 × 10¹⁵ molec/cm2 with respect to Sentinel-5P TROPOMI data. The underestimation of Sentinel-5P TROPOMI values has already been documented in [54]. The bias we found is slightly smaller than the one reported in [54] for MAX-DOAS stations with similar average NO2 VCDs. As said, the reported Sentinel-5P TROPOMI NO2 tropospheric VCDs underestimation in polluted regions has been attributed to the TM5-MP NO2 profiles used in Sentinel-5P TROPOMI data processing. Several works have suggested the correction of Sentinel-5P TROPOMI data through the use of Sentinel-5P TROPOMI AKs and MAX-DOAS profiles. Furthermore, in this work, the agreement between MAX-DOAS and Sentinel-5P TROPOMI was improved by applying the correction suggested in the Sentinel 5-P user manual section 8.8: the bias moved from slightly negative to slightly positive, and the slope moved from 0.72 to 0.87. In [55], the authors compared Sentinel-5P TROPOMI VCDs over Europe with the Copernicus Atmosphere Monitoring Service (CAMS) regional models, highlighting also in this case the Sentinel-5P TROPOMI NO2 underestimation. In addition, they replaced the TM5-MP profiles with the profiles generated with CAMS. The comparison of these “corrected” Sentinel-5P TROPOMI products with ground-based results showed an improvement in Sentinel-5P TROPOMI products. In particular, in the Po Valley, they show that the NO2 columns increase when using different a priori profiles. This result agrees with our test when using MAX-DOAS profiles as a priori. It is worth noting that replacing the a priori does not always improve the validation results [56].

5. Conclusions

This work presents the dataset of AODs and NO2 tropospheric VCDs retrieved from MAX-DOAS measurements performed at SPC with the SkySpec-2D instrument. The retrieval has been performed with DEAP, a retrieval code specifically developed and validated against state-of-the-art codes selected by the FRM4DOAS network. The DEAP code can be easily adapted to other instruments, like Pandora or other MAX-DOAS, if information on measuring geometries and used spectral range is provided together with SCDs.
The results we present here highlight the potential of the SPC observatory in providing a valuable insight into the background Po Valley conditions. This can be seen from the weekly cycle of both AODs and NO2 tropospheric VCDs, where no strong variations can be observed between the different days of the week and with a minimum in NO2 tropospheric VCDs on Sunday that is 20% lower than in the rest of the week. In addition, the tropospheric NO2 VCDs time series shows a strong seasonal cycle, with higher values in winter due to (a) the longer lifetime of NOx in winter and (b) larger emissions of NOx in winter combined with the stability of the atmosphere, and lower values in summer. The smooth behavior of the time variations reflects the absence of local sources near the observatory. Thus, the SPC MAX-DOAS site proves to be a valid candidate for validating the Sentinel-5P TROPOMI and future Sentinel-4 and 5 missions under the background pollution conditions of the Po Valley.
In 2022–2023 the “Giorgio Fea” observatory improved its remote sensing capabilities with the acquisition of AErosol RObotic NETwork (AERONET) compliant sun photometer (which started operating in February 2023) and a Raymetrics LIDAR (in the setting up phase), while an Automatic LIDAR/Ceilometer is operating on the site. The synergy of these instruments will be hopefully exploited in the future. The potentiality of this set of remote sensing and ground based measurements at SPC can play a crucial role in both satellite validation and scientific studies.

Author Contributions

Conceptualization, E.C., E.P., P.P. and M.V.; formal analysis, A.A., P.P., E.C. and E.P.; data curation, E.C. and P.P.; writing—original draft preparation, E.C., P.P., M.V., M.P., A.R., T.B., F.H., C.F., S.B., M.M.F., M.V.R., T.W. and E.P.; writing—review and editing, A.A., P.P., E.C., E.P. and M.V.; visualization, M.V., P.P., E.C. and E.P.; project administration, E.C. and M.V. All authors have read and agreed to the published version of the manuscript.

Funding

The SkySpec-2D system has been acquired under the project “Sviluppo delle Infrastrutture e Programma Biennale degli Interventi del Consiglio Nazionale delle Ricerche—Potenziamento Infrastrutturale: progetti di ricerca strategici per l’ente. Progetto 32—ASSE NORD Pianura Padana Mt. Cimone, Bologna, San Pietro Capofiume”. This work has been performed under the project IDEAS-QA4EO WPs-2250-2251: “DOAS-BO: Towards a new FRM4DOAS-compliant site” SERCO-IDEAS-QA4EO-BO/SUB27 CCN 007-IDEAS-QA4EO—Quality Assurance For Earth Observation-QA4EO/SER/SUB/27 CCN7, Instrument Data quality Evaluation and Assessment Service—Quality Assurance for Earth Observation (IDEAS-QA4EO) contract funded by ESA-ESRIN (n. 4000128960/19/I-NS).

Data Availability Statement

All data used in this work acquired by SkySpec-2D and retrieved with DEAP are available upon request to the authors. TROPOMI data are available through https://dataspace.copernicus.eu (accessed on 5 March 2025). MODIS data are accessible through https://ladsweb.modaps.eosdis.nasa.gov/search/ (accessed on 5 March 2025).

Acknowledgments

The authors gratefully acknowledge Francescopiero Calzolari from CNR-ISAC for his help in the installation of SkySpec-2D in SPC and Fabrizio Ravegnani from CNR-ISAC for sharing his DOAS experience with us, and Diego Catalanotti for his help in plotting AKs. The authors acknowledge the DOAS UV–VIS team at BIRA-IASB leaded by M. Van Roozendael for QDOAS and the SCIATRAN developers. SCIATRAN can be downloaded from https://www.iup.uni-bremen.de/sciatran/ (accessed on 5 March 2025).

Conflicts of Interest

Author Massimo Valeri is employed by Serco Italia S.p.A. The remaining authors declare that the research was conducted in the absence of any commercial or financial relationships that could be construed as a potential conflict of interest.

Abbreviations

The following abbreviations are used in this manuscript:
ACTRISAerosol, Clouds and Trace gases Research InfraStructure
AERONETAErosol RObotic NETwork
AODAerosol Optical Depth
ARPAEAgenzia Regionale per la Prevenzione, l’Ambiente e l’Energia
BOREASBremen Optimal estimation REtrieval for Aerosols and trace gaseS
box-AMFsBox-Air Mass Factors
CAMSCopernicus Atmosphere Monitoring Service
CIColor Index
CNR-ISACConsiglio Nazionale delle Ricerche-Istituto di Scienze dell’Atmosfera e del Clima
DEAPDOAS optimal Estimation Atmospheric Profile
DOASDifferential Optical Absorption Spectroscopy
DOFsDegrees Of Freedom
EEExpected Error
ESAEuropean Space Agency
FRM4DOASFiducial Reference Measurements for Ground-Based DOAS
GCOSGlobal Climate Observing System
GOMEGlobal Ozone Monitoring Experiment
IDEAS+QA4EOInstrument Data Evaluation and Analysis Service Quality Assurance for Earth Observation
MAIACMulti-Angle Implementation of Atmospheric Correction
MAPAMAinz Profile Algorithm
MAX-DOASMulti-AXis-DOAS
MODISModerate Resolution Imaging Spectroradiometer
MMFMexican MAX-DOAS Fit
MPICMax Planck Institute for Chemistry
RTMRadiative Transfer Model
SCDSlant Column Densitiy
SPCSan Pietro Capofiume
SZASolar Zenith Angle
TROPOMITROPOspheric Monitoring Instrument
UVUltraviolet
VCDVertical Column Densities
VCMvariance-covariance matrix
VISVisible

Appendix A

Figure A1. Aerosol extinction at 477 nm retrieved from synthetic dSCDs v1n for 9 different aerosol scenarios. The reference profile is reported in green, the initial guess in blue and the average retrieved profile in red (averaged over SZA and RAA). No data filtering has been applied here. This figure resembles one of the row of Figure 12 of [20]. We interpolate all the profiles on a vertical grid of 0.1 km spacing from 0.1 to 3.9 km.
Remotesensing 17 01035 g0a1
Figure A2. NO2 profiles retrieved from synthetic dSCDs v1n for 9 different gaseous scenarios. The reference profile is reported in green, the initial guess in blue and the average retrieved profile in red (averaged over SZA and RAA). Different colors correspond to profiles retrieved from different aerosols scenarios. No data filtering has been applied here. This figure resembles one of the row of Figure 14 of [20]. We interpolate all the profiles on a vertical grid of 0.1 km spacing from 0.1 to 3.9 km.
Remotesensing 17 01035 g0a2

References

  1. Fiore, A.M.; Naik, V.; Spracklen, D.V.; Steiner, A.; Unger, N.; Prather, M.; Bergmann, D.; Cameron-Smith, P.J.; Cionni, I.; Collins, W.J.; et al. Global air quality and climate. Chem. Soc. Rev. 2012, 41, 6663–6683. [Google Scholar] [CrossRef]
  2. Logan, J.A. Nitrogen oxides in the troposphere: Global and regional budgets. J. Geophys. Res. Ocean. 1983, 88, 10785–10807. [Google Scholar] [CrossRef]
  3. Olivier, J.; Bouwman, A.; Van der Hoek, K.; Berdowski, J. Global air emission inventories for anthropogenic sources of NOx, NH3 and N2O in 1990. Environ. Pollut. 1998, 102, 135–148. [Google Scholar] [CrossRef]
  4. Chan, A.; Chan, M.; Surratt, J.; Chhabra, P.; Loza, C.; Crounse, J.; Yee, L.; Flagan, R.; Wennberg, P.; Seinfeld, J. Role of aldehyde chemistry and NOx concentrations in secondary organic aerosol formation. Atmos. Chem. Phys. 2010, 10, 7169–7188. [Google Scholar] [CrossRef]
  5. Lelieveld, J.; Dentener, F.J. What controls tropospheric ozone? J. Geophys. Res. Atmos. 2000, 105, 3531–3551. [Google Scholar] [CrossRef]
  6. Veefkind, J.P.; Aben, I.; McMullan, K.; Forster, H.; de Vries, J.; Otter, G.; Claas, J.; Eskes, H.J.; de Haan, J.F.; Kleipool, Q.; et al. TROPOMI on the ESA Sentinel-5 Precursor: A GMES mission for global observations of the atmospheric composition for climate, air quality and ozone layer applications. Remote Sens. Environ. 2012, 120, 70–83. [Google Scholar] [CrossRef]
  7. Loew, A.; Bell, W.; Brocca, L.; Bulgin, C.E.; Burdanowitz, J.; Calbet, X.; Donner, R.V.; Ghent, D.; Gruber, A.; Kaminski, T.; et al. Validation practices for satellite-based Earth observation data across communities. Rev. Geophys. 2017, 55, 779–817. [Google Scholar] [CrossRef]
  8. Yombo Phaka, R.; Merlaud, A.; Pinardi, G.; Friedrich, M.M.; Van Roozendael, M.; Müller, J.F.; Stavrakou, T.; De Smedt, I.; Hendrick, F.; Dimitropoulou, E.; et al. Ground-based Multi-AXis Differential Optical Absorption Spectroscopy (MAX-DOAS) observations of NO2 and H2CO at Kinshasa and comparisons with TROPOMI observations. Atmos. Meas. Tech. 2023, 16, 5029–5050. [Google Scholar] [CrossRef]
  9. Chan, K.L.; Wiegner, M.; van Geffen, J.; De Smedt, I.; Alberti, C.; Cheng, Z.; Ye, S.; Wenig, M. MAX-DOAS measurements of tropospheric NO2 and HCHO in Munich and the comparison to OMI and TROPOMI satellite observations. Atmos. Meas. Tech. 2020, 13, 4499–4520. [Google Scholar] [CrossRef]
  10. Judd, L.M.; Al-Saadi, J.A.; Szykman, J.J.; Valin, L.C.; Janz, S.J.; Kowalewski, M.G.; Eskes, H.J.; Veefkind, J.P.; Cede, A.; Mueller, M.; et al. Evaluating Sentinel-5P TROPOMI tropospheric NO2 column densities with airborne and Pandora spectrometers near New York City and Long Island Sound. Atmos. Meas. Tech. 2020, 13, 6113–6140. [Google Scholar] [CrossRef]
  11. Ialongo, I.; Virta, H.; Eskes, H.; Hovila, J.; Douros, J. Comparison of TROPOMI/Sentinel-5 Precursor NO2 observations with ground-based measurements in Helsinki. Atmos. Meas. Tech. 2020, 13, 205–218. [Google Scholar] [CrossRef]
  12. Platt, U.; Stutz, J.; Platt, U.; Stutz, J. Differential Absorption Spectroscopy; Springer: Berlin/Heidelberg, Germany, 2008. [Google Scholar]
  13. Hönninger, G.; Von Friedeburg, C.; Platt, U. Multi axis differential optical absorption spectroscopy (MAX-DOAS). Atmos. Chem. Phys. 2004, 4, 231–254. [Google Scholar] [CrossRef]
  14. Wagner, T.; Dix, B.v.; Friedeburg, C.v.; Frieß, U.; Sanghavi, S.; Sinreich, R.; Platt, U. MAX-DOAS O4 measurements: A new technique to derive information on atmospheric aerosols—Principles and information content. J. Geophys. Res. Atmos. 2004, 109, D22205. [Google Scholar] [CrossRef]
  15. Irie, H.; Takashima, H.; Kanaya, Y.; Boersma, K.; Gast, L.; Wittrock, F.; Brunner, D.; Zhou, Y.; Van Roozendael, M. Eight-component retrievals from ground-based MAX-DOAS observations. Atmos. Meas. Tech. 2011, 4, 1027–1044. [Google Scholar] [CrossRef]
  16. Hendrick, F.; Müller, J.F.; Clémer, K.; Wang, P.; De Mazière, M.; Fayt, C.; Gielen, C.; Hermans, C.; Ma, J.; Pinardi, G.; et al. Four years of ground-based MAX-DOAS observations of HONO and NO2 in the Beijing area. Atmos. Chem. Phys. 2014, 14, 765–781. [Google Scholar] [CrossRef]
  17. Wang, Y.; Lampel, J.; Xie, P.; Beirle, S.; Li, A.; Wu, D.; Wagner, T. Ground-based MAX-DOAS observations of tropospheric aerosols, NO2, SO2 and HCHO in Wuxi, China, from 2011 to 2014. Atmos. Chem. Phys. 2017, 17, 2189–2215. [Google Scholar] [CrossRef]
  18. Van Roozendael, M.; Hendrick, F.; Friedrich, M.; Fayt, C.; Bais, A.; Beirle, S.; Bösch, T.; Navarro Comas, M.; Friess, U.; Karagkiozidis, D.; et al. Fiducial Reference Measurements for Air Quality Monitoring Using Ground-Based MAX-DOAS Instruments (FRM4DOAS). Remote Sens. 2024, 16, 4523. [Google Scholar] [CrossRef]
  19. Donner, S.; Kuhn, J.; Van Roozendael, M.; Bais, A.; Beirle, S.; Bösch, T.; Bognar, K.; Bruchkouski, I.; Chan, K.L.; Dörner, S.; et al. Evaluating different methods for elevation calibration of MAX-DOAS (Multi AXis Differential Optical Absorption Spectroscopy) instruments during the CINDI-2 campaign. Atmos. Meas. Tech. 2020, 13, 685–712. [Google Scholar] [CrossRef]
  20. Frieß, U.; Beirle, S.; Alvarado Bonilla, L.; Bösch, T.; Friedrich, M.M.; Hendrick, F.; Piters, A.; Richter, A.; Van Roozendael, M.; Rozanov, V.V.; et al. Intercomparison of MAX-DOAS vertical profile retrieval algorithms: Studies using synthetic data. Atmos. Meas. Tech. 2019, 12, 2155–2181. [Google Scholar] [CrossRef]
  21. Pettinari, P.; Castelli, E.; Papandrea, E.; Busetto, M.; Valeri, M.; Dinelli, B.M. Towards a New MAX-DOAS Measurement Site in the Po Valley: NO2 Total VCDs. Remote Sens. 2022, 14, 3881. [Google Scholar] [CrossRef]
  22. Bösch, T.; Rozanov, V.; Richter, A.; Peters, E.; Rozanov, A.; Wittrock, F.; Merlaud, A.; Lampel, J.; Schmitt, S.; De Haij, M.; et al. BOREAS—A new MAX-DOAS profile retrieval algorithm for aerosols and trace gases. Atmos. Meas. Tech. 2018, 11, 6833–6859. [Google Scholar] [CrossRef]
  23. Friedrich, M.M.; Rivera, C.; Stremme, W.; Ojeda, Z.; Arellano, J.; Bezanilla, A.; García-Reynoso, J.A.; Grutter, M. NO2 vertical profiles and column densities from MAX-DOAS measurements in Mexico City. Atmos. Meas. Tech. 2019, 12, 2545–2565. [Google Scholar] [CrossRef]
  24. Beirle, S.; Dörner, S.; Donner, S.; Remmers, J.; Wang, Y.; Wagner, T. The Mainz profile algorithm (MAPA). Atmos. Meas. Tech. 2019, 12, 1785–1806. [Google Scholar] [CrossRef]
  25. Salomonson, V.V.; Barnes, W.; Maymon, P.W.; Montgomery, H.E.; Ostrow, H. MODIS: Advanced facility instrument for studies of the Earth as a system. IEEE Trans. Geosci. Remote Sens. 1989, 27, 145–153. [Google Scholar] [CrossRef]
  26. Pettinari, P.; Valeri, M.; Papandrea, E.; Castelli, E.; Di Liberto, L.; Marinoni, A.; Decesari, S. Report on the MAX-DOAS Analysis Chain. Technical Report. 2023. Available online: https://zenodo.org/records/10033174 (accessed on 8 July 2024). [CrossRef]
  27. Rodgers, C.D. Inverse Methods for Atmospheric Sounding: Theory and Practice; World Scientific: London, UK, 2000; Volume 2. [Google Scholar]
  28. Rozanov, V.; Rozanov, A.; Kokhanovsky, A.A.; Burrows, J. Radiative transfer through terrestrial atmosphere and ocean: Software package SCIATRAN. J. Quant. Spectrosc. Radiat. Transf. 2014, 133, 13–71. [Google Scholar] [CrossRef]
  29. Henyey, L.G.; Greenstein, J.L. Diffuse radiation in the Galaxy. Astrophys. J. 1941, 93, 70–83. [Google Scholar] [CrossRef]
  30. Wagner, T.; Apituley, A.; Beirle, S.; Dörner, S.; Friess, U.; Remmers, J.; Shaiganfar, R. Cloud detection and classification based on MAX-DOAS observations. Atmos. Meas. Tech. 2014, 7, 1289–1320. [Google Scholar] [CrossRef]
  31. Gielen, C.; Van Roozendael, M.; Hendrick, F.; Pinardi, G.; Vlemmix, T.; De Bock, V.; De Backer, H.; Fayt, C.; Hermans, C.; Gillotay, D.; et al. A simple and versatile cloud-screening method for MAX-DOAS retrievals. Atmos. Meas. Tech. 2014, 7, 3509–3527. [Google Scholar] [CrossRef]
  32. Wagner, T.; Beirle, S.; Remmers, J.; Shaiganfar, R.; Wang, Y. Absolute calibration of the colour index and O4 absorption derived from Multi AXis (MAX-) DOAS measurements and their application to a standardised cloud classification algorithm. Atmos. Meas. Tech. 2016, 9, 4803–4823. [Google Scholar] [CrossRef]
  33. Sarkissian, A.; Pommereau, J.P.; Goutail, F. Identification of polar stratospheric clouds from the ground by visible spectrometry. Geophys. Res. Lett. 1991, 18, 779–782. [Google Scholar] [CrossRef]
  34. Sarkissian, A.; Pommereau, J.P.; Goutail, F.; Kyro, E. PSC and volcanic aerosol observations during EASOE by UV-visible ground-based spectrometry. Geophys. Res. Lett. 1994, 21, 1319–1322. [Google Scholar] [CrossRef]
  35. Enell, C.F.; Steen, Å.; Wagner, T.; Frieß, U.; Pfeilsticker, K.; Platt, U.; Fricke, K.H. Occurrence of polar stratospheric clouds at Kiruna. Ann. Geophys. 1999, 17, 1457–1462. [Google Scholar] [CrossRef]
  36. Spurr, R.J. VLIDORT: A linearized pseudo-spherical vector discrete ordinate radiative transfer code for forward model and retrieval studies in multilayer multiple scattering media. J. Quant. Spectrosc. Radiat. Transf. 2006, 102, 316–342. [Google Scholar] [CrossRef]
  37. Clemer, K.; Van Roozendael, M.; Fayt, C.; Hendrick, F.; Hermans, C.; Pinardi, G.; Spurr, R.; Wang, P.; De Maziere, M. Multiple wavelength retrieval of tropospheric aerosol optical properties from MAXDOAS measurements in Beijing. Atmos. Meas. Tech. 2010, 3, 863–878. [Google Scholar] [CrossRef]
  38. Pinardi, G.; Van Roozendael, M.; Hendrick, F.; Theys, N.; Abuhassan, N.; Bais, A.; Boersma, F.; Cede, A.; Chong, J.; Donner, S.; et al. Validation of tropospheric NO2 column measurements of GOME-2A and OMI using MAX-DOAS and direct sun network observations. Atmos. Meas. Tech. 2020, 13, 6141–6174. [Google Scholar] [CrossRef]
  39. Lyapustin, A.; Wang, Y.; Korkin, S.; Huang, D. MODIS collection 6 MAIAC algorithm. Atmos. Meas. Tech. 2018, 11, 5741–5765. [Google Scholar] [CrossRef]
  40. Mhawish, A.; Banerjee, T.; Sorek-Hamer, M.; Lyapustin, A.; Broday, D.M.; Chatfield, R. Comparison and evaluation of MODIS Multi-angle Implementation of Atmospheric Correction (MAIAC) aerosol product over South Asia. Remote Sens. Environ. 2019, 224, 12–28. [Google Scholar] [CrossRef]
  41. KNMI. Sentinel 5 Precursor/TROPOMI KNMI and SRON level 2 Input Output Data Definition. Technical Report S5PKNMI-L2-0009-SD, Koninklijk Nederlands Meteorologisch Instituut (KNMI), 2019. Issue 11.0.0. Available online: https://sentinel.esa.int/documents/247904/3119978/Sentinel-5P-Level-2-Input-Output-Data-Definition (accessed on 11 January 2020).
  42. Loyola, D.; Lutz, R.; Argyrouli, A.; Spurr, R. S5P/TROPOMI ATBD Cloud Products. S5P-DLR-L2-ATBD-400I Issue 2.2. Technical Report. 2020. Available online: https://sentiwiki.copernicus.eu/__attachments/1673595/S5P-DLR-L2-ATBD-400I%20-%20Sentinel-5P%20TROPOMI%20ATBD%20Clouds%202021%20-%202.3.pdf?inst-v=eb3ebc83-2add-4c9e-b1a4-216e51171ba4 (accessed on 5 March 2025).
  43. Eskes, H.; van Geffen, J.; Folkert, B.; Kai-Uwe, E.; Arnoud, A.; Mattia, P.; Maarten, S.; Pepijn, V.J.; Loyola, D. Sentinel-5 Precursor/TROPOMI Level 2 Product User Manual Nitrogendioxide. Technical Report, 2021. S5P-KNMI-L2-0021-MA, Koninklijk Nederlands Meteorologisch Instituut (KNMI), CI-7570-PUM, Issue 4.0.2. Available online: https://sentinels.copernicus.eu/documents/247904/2474726/Sentinel-5P-Level-2-Product-User-Manual-Nitrogen-Dioxide.pdf/ad25ea4c-3a9a-3067-0d1c-aaa56eb1746b?t=1637071405160 (accessed on 5 April 2022).
  44. van Geffen, J.; Boersma, K.F.; Eskes, H.; Sneep, M.; ter Linden, M.; Zara, M.; Veefkind, J.P. S5P TROPOMI NO2 slant column retrieval: Method, stability, uncertainties and comparisons with OMI. Atmos. Meas. Tech. 2020, 13, 1315–1335. [Google Scholar] [CrossRef]
  45. Williams, J.E.; Boersma, K.F.; Le Sager, P.; Verstraeten, W.W. The high-resolution version of TM5-MP for optimized satellite retrievals: Description and validation. Geosci. Model Dev. 2017, 10, 721–750. [Google Scholar] [CrossRef]
  46. Dimitropoulou, E.; Hendrick, F.; Pinardi, G.; Friedrich, M.M.; Merlaud, A.; Tack, F.; De Longueville, H.; Fayt, C.; Hermans, C.; Laffineur, Q.; et al. Validation of TROPOMI tropospheric NO2 columns using dual-scan multi-axis differential optical absorption spectroscopy (MAX-DOAS) measurements in Uccle, Brussels. Atmos. Meas. Tech. 2020, 13, 5165–5191. [Google Scholar] [CrossRef]
  47. FRM4DOAS. Deliverable D5: MAXDOAS Algorithm Round-Robin Definition and Results Document. Version: 5.0. Technical Report. 2018. Available online: https://frm4doas.aeronomie.be/ProjectDir/Deliverables/FRM4DOAS_D5_MAXDOAS_Algorithm_Round_Robin_Document_20180130_final.pdf (accessed on 30 January 2018).
  48. Pinardi, G.; Hendrick, F.; Clémer, K.; Lambert, J.; Bai, J.; Van Roozendael, M. On the use of the MAX-DOAS technique for the validation of tropospheric NO2 column measurements from satellite. In Proceedings of the Proceedings Eumetsat Conference, Darmstadt, Germany, 8–12 September 2008. [Google Scholar]
  49. Wang, Y.; Beirle, S.; Lampel, J.; Koukouli, M.; De Smedt, I.; Theys, N.; Li, A.; Wu, D.; Xie, P.; Liu, C.; et al. Validation of OMI, GOME-2A and GOME-2B tropospheric NO2, SO2 and HCHO products using MAX-DOAS observations from 2011 to 2014 in Wuxi, China: Investigation of the effects of priori profiles and aerosols on the satellite products. Atmos. Chem. Phys. 2017, 17, 5007–5033. [Google Scholar] [CrossRef]
  50. De Smedt, I.; Pinardi, G.; Vigouroux, C.; Compernolle, S.; Bais, A.; Benavent, N.; Boersma, F.; Chan, K.L.; Donner, S.; Eichmann, K.U.; et al. Comparative assessment of TROPOMI and OMI formaldehyde observations and validation against MAX-DOAS network column measurements. Atmos. Chem. Phys. 2021, 21, 12561–12593. [Google Scholar] [CrossRef]
  51. De Santis, L.V.; Tomasi, C.; Vitale, V. Characterization of Angstrom’s turbidity parameters in the Po Valley area for summer conditions of the atmosphere. Il Nuovo C. C 1994, 17, 407–430. [Google Scholar] [CrossRef]
  52. Ordonez, C.; Richter, A.; Steinbacher, M.; Zellweger, C.; Nuss, H.; Burrows, J.P.; Prevot, A.S.H. Comparison of 7 years of satellite-borne and ground-based tropospheric NO2 measurements around Milan, Italy. J. Geophys. Res. 2006, 111, 5310. [Google Scholar]
  53. Paglione, M.; Gilardoni, S.; Rinaldi, M.; Decesari, S.; Zanca, N.; Sandrini, S.; Giulianelli, L.; Bacco, D.; Ferrari, S.; Poluzzi, V.; et al. The impact of biomass burning and aqueous-phase processing on air quality: A multi-year source apportionment study in the Po Valley, Italy. Atmos. Chem. Phys. 2020, 20, 1233–1254. [Google Scholar] [CrossRef]
  54. Verhoelst, T.; Compernolle, S.; Pinardi, G.; Lambert, J.C.; Eskes, H.J.; Eichmann, K.U.; Fjæraa, A.M.; Granville, J.; Niemeijer, S.; Cede, A.; et al. Ground-based validation of the Copernicus Sentinel-5P TROPOMI NO2 measurements with the NDACC ZSL-DOAS, MAX-DOAS and Pandonia global networks. Atmos. Meas. Tech. 2021, 14, 481–510. [Google Scholar] [CrossRef]
  55. Douros, J.; Eskes, H.; van Geffen, J.; Folkert Boersma, K.; Compernolle, S.; Pinardi, G.; Blechschmidt, A.M.; Peuch, V.; Colette, A.; Veefkind, P. Comparing Sentinel-5P TROPOMI NO2 column observations with the CAMS regional air quality ensemble. Geosci. Model Dev. 2023, 16, 509–534. [Google Scholar] [CrossRef]
  56. Lange, K.; Richter, A.; Schönhardt, A.; Meier, A.C.; Bösch, T.; Seyler, A.; Krause, K.; Behrens, L.K.; Wittrock, F.; Merlaud, A.; et al. Validation of Sentinel-5P TROPOMI tropospheric NO2 products by comparison with NO2 measurements from airborne imaging DOAS, ground-based stationary DOAS, and mobile car DOAS measurements during the S5P-VAL-DE-Ruhr campaign. Atmos. Meas. Tech. 2023, 16, 1357–1389. [Google Scholar] [CrossRef]
Figure 1. Different views from SkySpec-2D at SPC in the three azimuth directions adopted for the MAX-DOAS measurements since the 23rd of March 2022. Image was reprinted with permission from [26] under CC BY 4.0 license.
Remotesensing 17 01035 g001
Figure 2. Color index distribution for the zenith-sky spectra measured from 1 October 2021 to 30 September 2023. The value 1.2 is used as threshold between clear and cloudy spectra.
Remotesensing 17 01035 g002
Figure 3. Aerosol extinction at 477 nm (left) and NO2 profiles (right) at the azimuth direction of 300° for 23 March 2022 as a function of altitude and time.
Remotesensing 17 01035 g003
Figure 4. AKs for aerosol extinction at 477 nm (left) and NO2 (right) for the 80th scan of the day 23 March 2022 at 13:45 UTC as a function of altitude. DOFs are reported as well.
Remotesensing 17 01035 g004
Figure 5. Comparison between AODs at 477 nm retrieved from SkySpec-2D MAX-DOAS measurements at 300° azimuth with DEAP (black), BOREAS (blue), MAPA (red) and MMF (green) during the first days of March 2022. The middle panel shows the difference between the other codes and DEAP. The plotted dots are filtered out as explained for the statistics computation. The lower panel reports the value of the UV-CI for each day.
Remotesensing 17 01035 g005
Figure 6. Comparison between NO2 tropospheric VCDs retrieved from SkySpec-2D MAX-DOAS measurements at 300° azimuth with DEAP (black), BOREAS (blue), MAPA (red) and MMF (green) during the first days of March 2022. The middle panel shows the difference between the other codes and DEAP. The plotted dots are filtered out as explained for the statistics computation. The lower panel reports the value of the UV-CI for each day.
Remotesensing 17 01035 g006
Figure 7. Aerosol extinction profiles retrieved at 477 nm using DEAP, BOREAS (top row), MMF and MAPA (bottom row) on the 9 March 2022. Only measurements at 300° azimuth are used.
Remotesensing 17 01035 g007
Figure 8. NO2 profiles retrieved using DEAP, BOREAS (top row), MMF and MAPA (bottom row) on the 9 March 2022. Only measurements at 300° azimuth are used.
Remotesensing 17 01035 g008
Figure 9. Average Tropospheric AODs retrieved from SkySpec-2D as a function of months and hours of the day, together with their retrieval errors, standard deviations and number of points (indicated with “#”).
Remotesensing 17 01035 g009
Figure 10. Average NO2 Tropospheric VCDs (×1016) retrieved from SkySpec-2D as a function of months and hours of the day, together with their retrieval errors (×1016), standard deviations (×1016) and number of points (indicated with “#”).
Remotesensing 17 01035 g010
Figure 11. Weekly distribution of the tropospheric AODs and NO2 VCDs. The box limits are the 25th and 75th percentiles, the whiskers are the 5th and the 95th percentiles, the orange bars are the median values and the green triangles are the averages.
Remotesensing 17 01035 g011
Figure 12. Scatterplot of MODIS-MAIAC (Aqua + Terra) AODs in 1 × 1 km2 cell containing SPC and SkySpec-2D AODs products averaged within ±15 min from the MODIS overpass considering all the three azimuth directions. The y = x lines and MODIS MAIAC EE envelopes ± (0.05 + 0.15 × AOD) are plotted as dashed lines. The values in the legend report the number of points within, above and below MAIAC EE.
Remotesensing 17 01035 g012
Figure 13. Monthly behaviour of the SkySpec-2D and MODIS Aqua + Terra MODIS-MAIAC AOD products. MODIS-MAIAC (red dots) and SkySpec-2D (blue dots) are reported in the upper panel. The number of monthly coincidences is also reported (yellow bars). In the lower panel, the monthly differences are reported (black crosses).
Remotesensing 17 01035 g013
Figure 14. Hourly distribution of AOD from SkySpec-2D and MODIS-MAIAC (Terra + Aqua). The same coincidence criteria as Figure 12 are applied. In the hourly plot, we report data only when more than one coincidence was found.
Remotesensing 17 01035 g014
Figure 15. Coincident NO2 tropospheric VCDs retrieved from SkySpec-2D MAX-DOAS measurements and Sentinel-5P TROPOMI data at SPC. For each satellite overpass, Sentinel-5P TROPOMI data within a circle of 5 km radius centered at SPC are averaged, while all filtered MAX-DOAS data along the three azimuth directions within ± 15 min from the overpass time are averaged. Error bars represent standard deviations.
Remotesensing 17 01035 g015
Figure 16. NO2 tropospheric VCDs from SkySpec-2D vs. Sentinel-5P TROPOMI at SPC.
Remotesensing 17 01035 g016
Figure 17. NO2 tropospheric VCDs from SkySpec-2D (red) and Sentinel-5P TROPOMI (blue) as a function of the month. The same coincidence criteria are applied as Figure 15.
Remotesensing 17 01035 g017
Figure 18. (Left) plot: NO2 tropospheric VCDs from SkySpec-2D vs. Sentinel-5P TROPOMI non-corrected (red dots). (Right) plot: Corrected for a priori profiles at SPC (red dots). The same coincidence criteria as Figure 15 and all azimuth directions are used. Red lines represent the linear fit of the data, dotted lines represent the y = x function.
Remotesensing 17 01035 g018
Table 1. Slope, intercept, correlation, RMS and number of points for MAPA, MMF, BOREAS and DEAP codes applied to synthetic dSCDs. Parameters are calculated for NO2 and aerosol extinction tropospheric profiles at 477 nm.
TroposphericProfiles– “v1n”
Aerosol 477 nm [km−1] NO2 [molec/cm3]
MAPA MMF BOREAS DEAP MAPA MMF BOREAS DEAP
Slope1.010.910.890.880.970.870.810.89
Intercept−0.000.0050.0080.0070.015 × 10 11 0.05 × 10 11 0.04 × 10 11 0.05 × 10 11
R0.890.890.910.940.850.840.660.65
RMS0.080.070.060.050.39 × 10 11 0.33 × 10 11 0.62 × 10 11 0.70 × 10 11
N10,54012,26012,92012,70010,22012,44011,80012,320
Table 2. Slope, intercept, correlation, RMS and number of points for MAPA, MMF, BOREAS and DEAP codes applied to synthetic dSCDs. Parameters are calculated for NO2 and aerosol extinction surface values at 477 nm.
SurfaceValues– “v1n”
Aerosol 477 nm [km−1] NO2 [molec/cm3]
MAPA MMF BOREAS DEAP MAPA MMF BOREAS DEAP
Slope1.030.970.850.900.880.900.470.91
Intercept0.0090.010.02−0.0090.12 × 10 11 0.21 × 10 11 0.14 × 10 11 −0.08 × 10 11
R0.870.910.970.950.820.900.520.83
RMS0.170.130.090.110.9 × 10 11 0.59 × 10 11 1.58 × 10 11 0.92 × 10 11
N527613646635511622590616
Table 3. Slope, intercept, correlation, RMS and number of points for MAPA, MMF, BOREAS and DEAP codes applied to synthetic dSCDs. Parameters are calculated for NO2 tropospheric columns and AODs at 477 nm.
TroposphericColumns– “v1n”
Aerosol 477 nm [km−1] NO2 [molec/cm3]
MAPA MMF BOREAS DEAP MAPA MMF BOREAS DEAP
Slope1.060.620.820.821.020.930.901.08
Intercept−0.0240.110.050.050.03 × 10160.12 × 10160.07 × 1016−0.04 × 10¹⁶
R0.900.920.880.980.960.980.970.99
RMS0.140.130.130.070.65 × 10160.31 × 10160.18 × 10160.20 × 1016
N527613646635511622590616
Table 4. Slope, intercept, correlation, RMS and number of points for the comparison of DEAP results with the ones obtained with MAPA, MMF and BOREAS on real SCDs measured in SPC at the azimuth direction 300°. Parameters are calculated for NO2 tropospheric columns and AODs at 477 nm.
Reference Codes vs. DEAP
AOD NO2 Tropospheric VCD [molec/cm2]
MAPA MMF BOREAS MAPA MMF BOREAS
Bias0.020.030.01−0.29 × 10150.14 × 1015−0.008 × 10¹⁵
RMS0.080.020.030.67 × 10150.75 × 10150.61 × 1015
R0.700.980.970.990.990.99
N198727962588189926812500
Disclaimer/Publisher’s Note: The statements, opinions and data contained in all publications are solely those of the individual author(s) and contributor(s) and not of MDPI and/or the editor(s). MDPI and/or the editor(s) disclaim responsibility for any injury to people or property resulting from any ideas, methods, instructions or products referred to in the content.

