
Satellite-Based Detection of Farmland Manuring Using Machine Learning Approaches


Abstract
1. Introduction
2. Materials and Methods
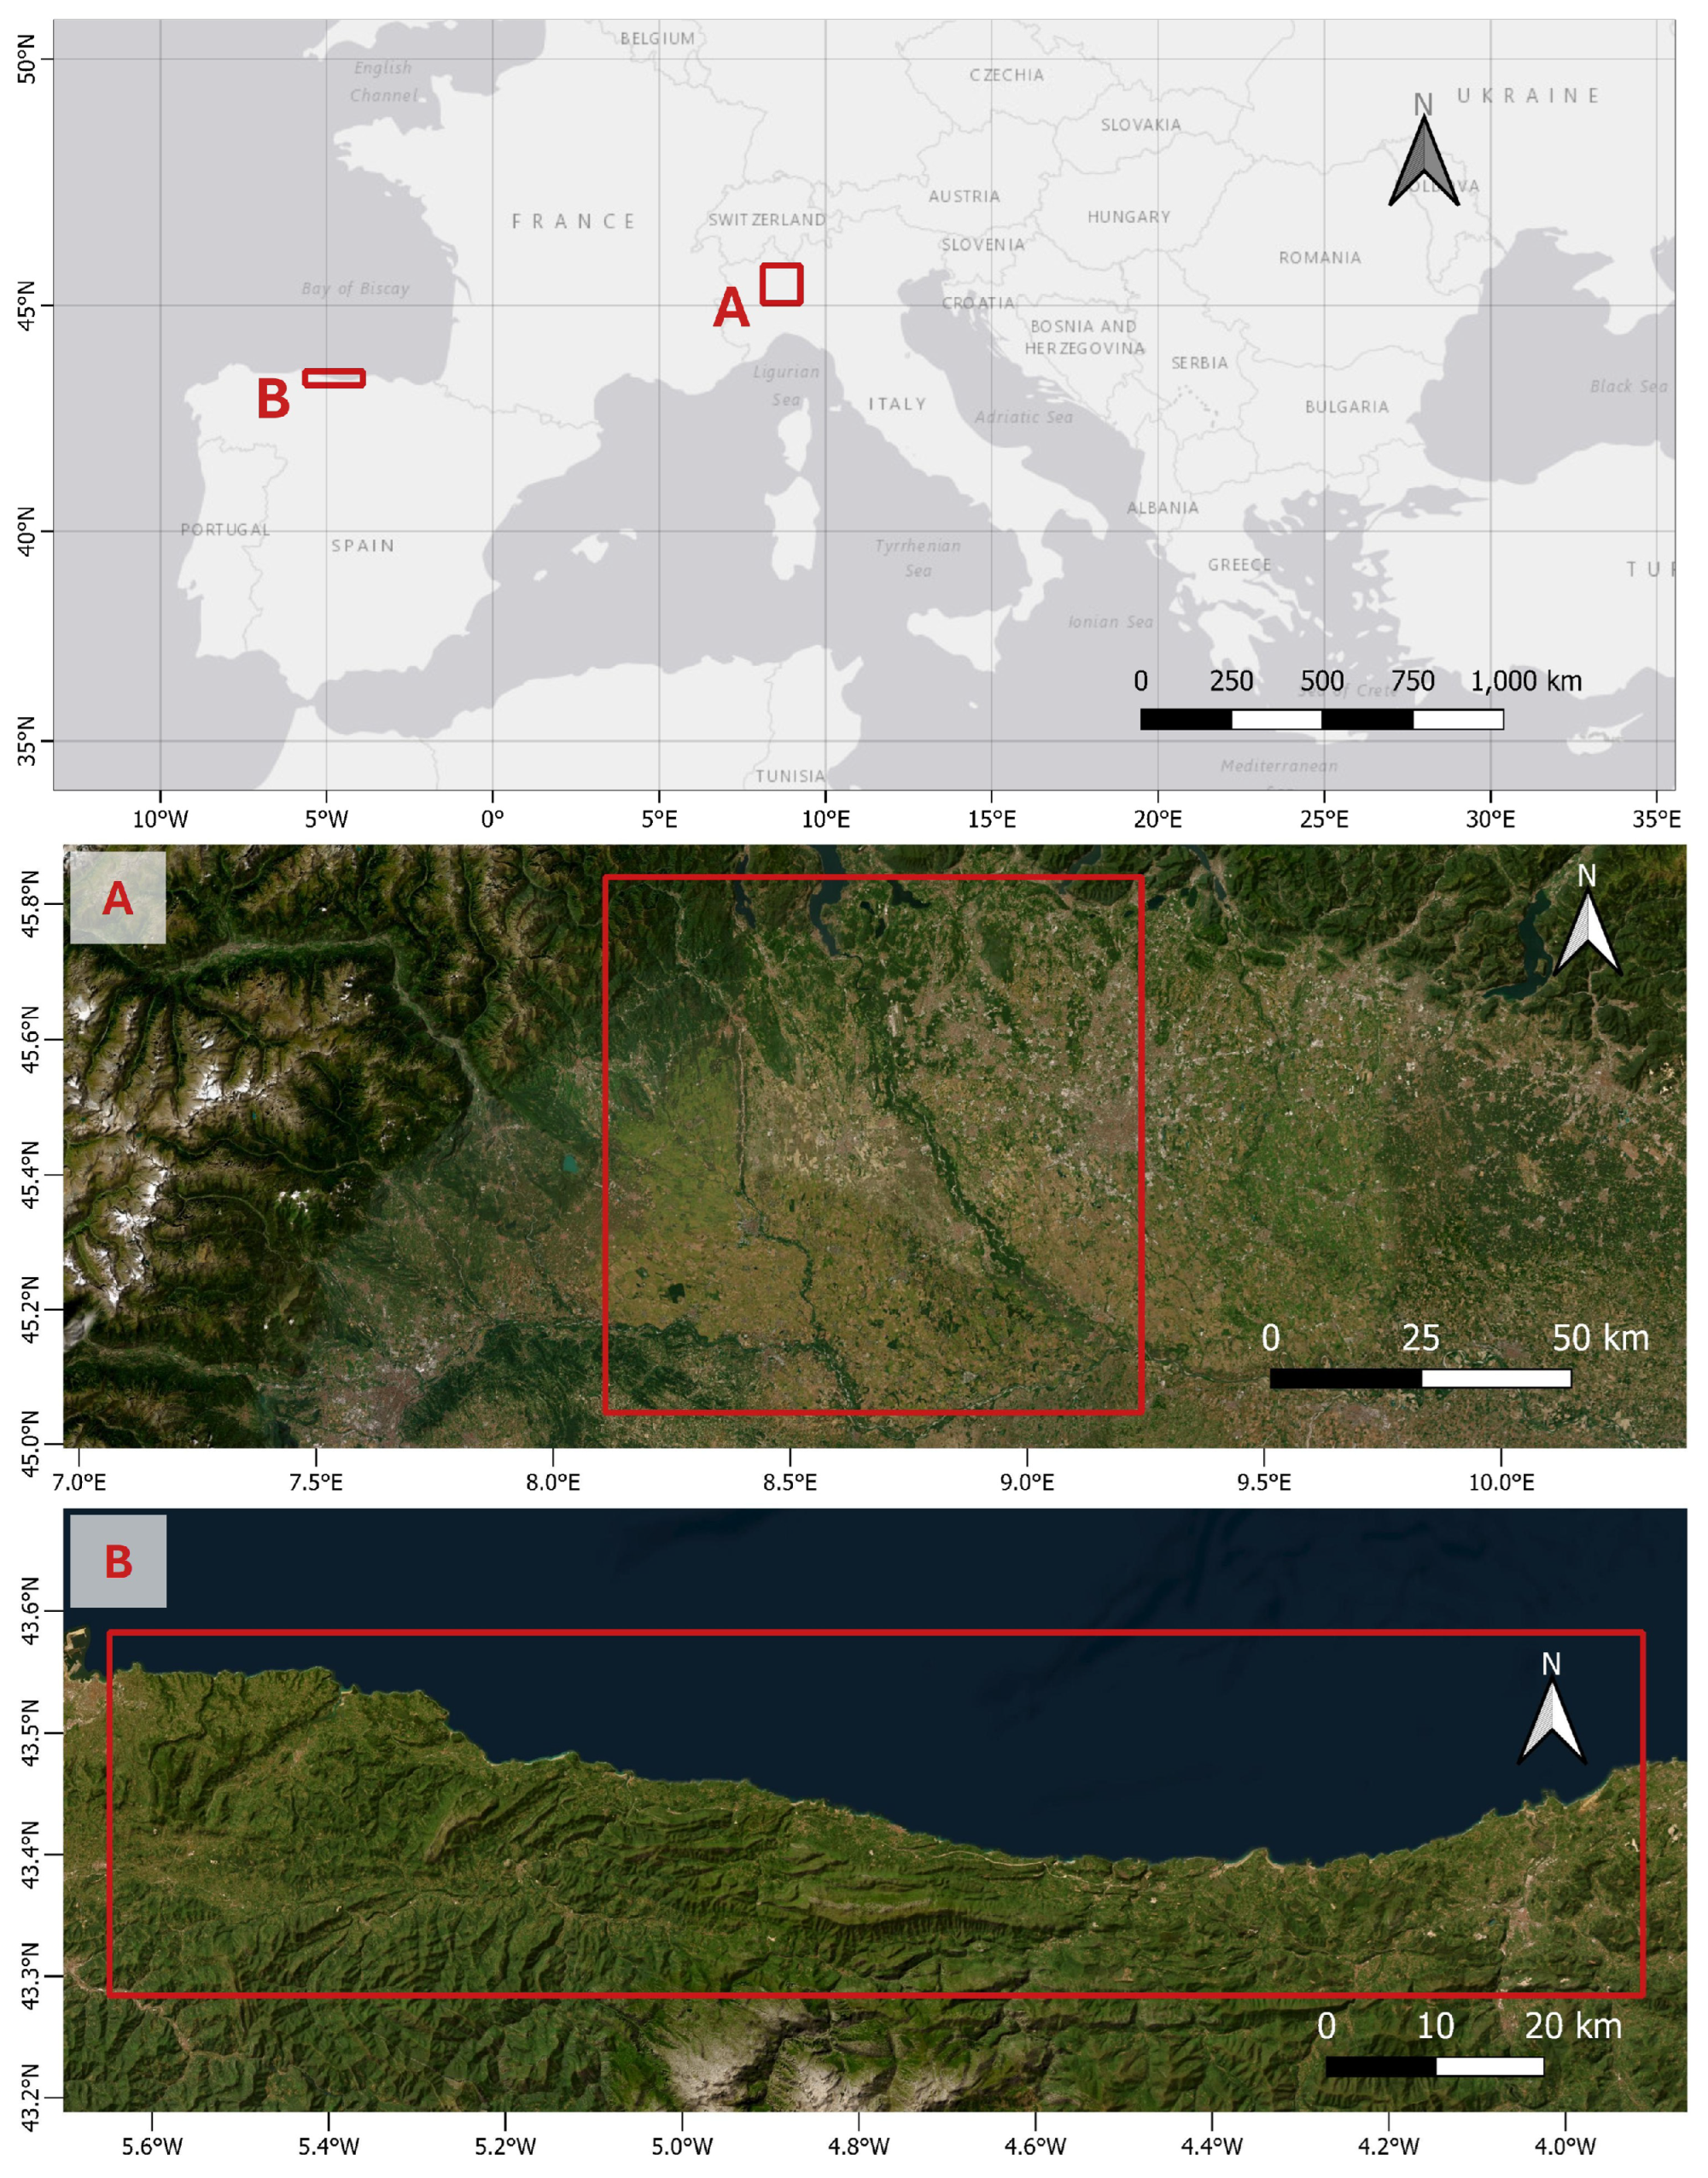
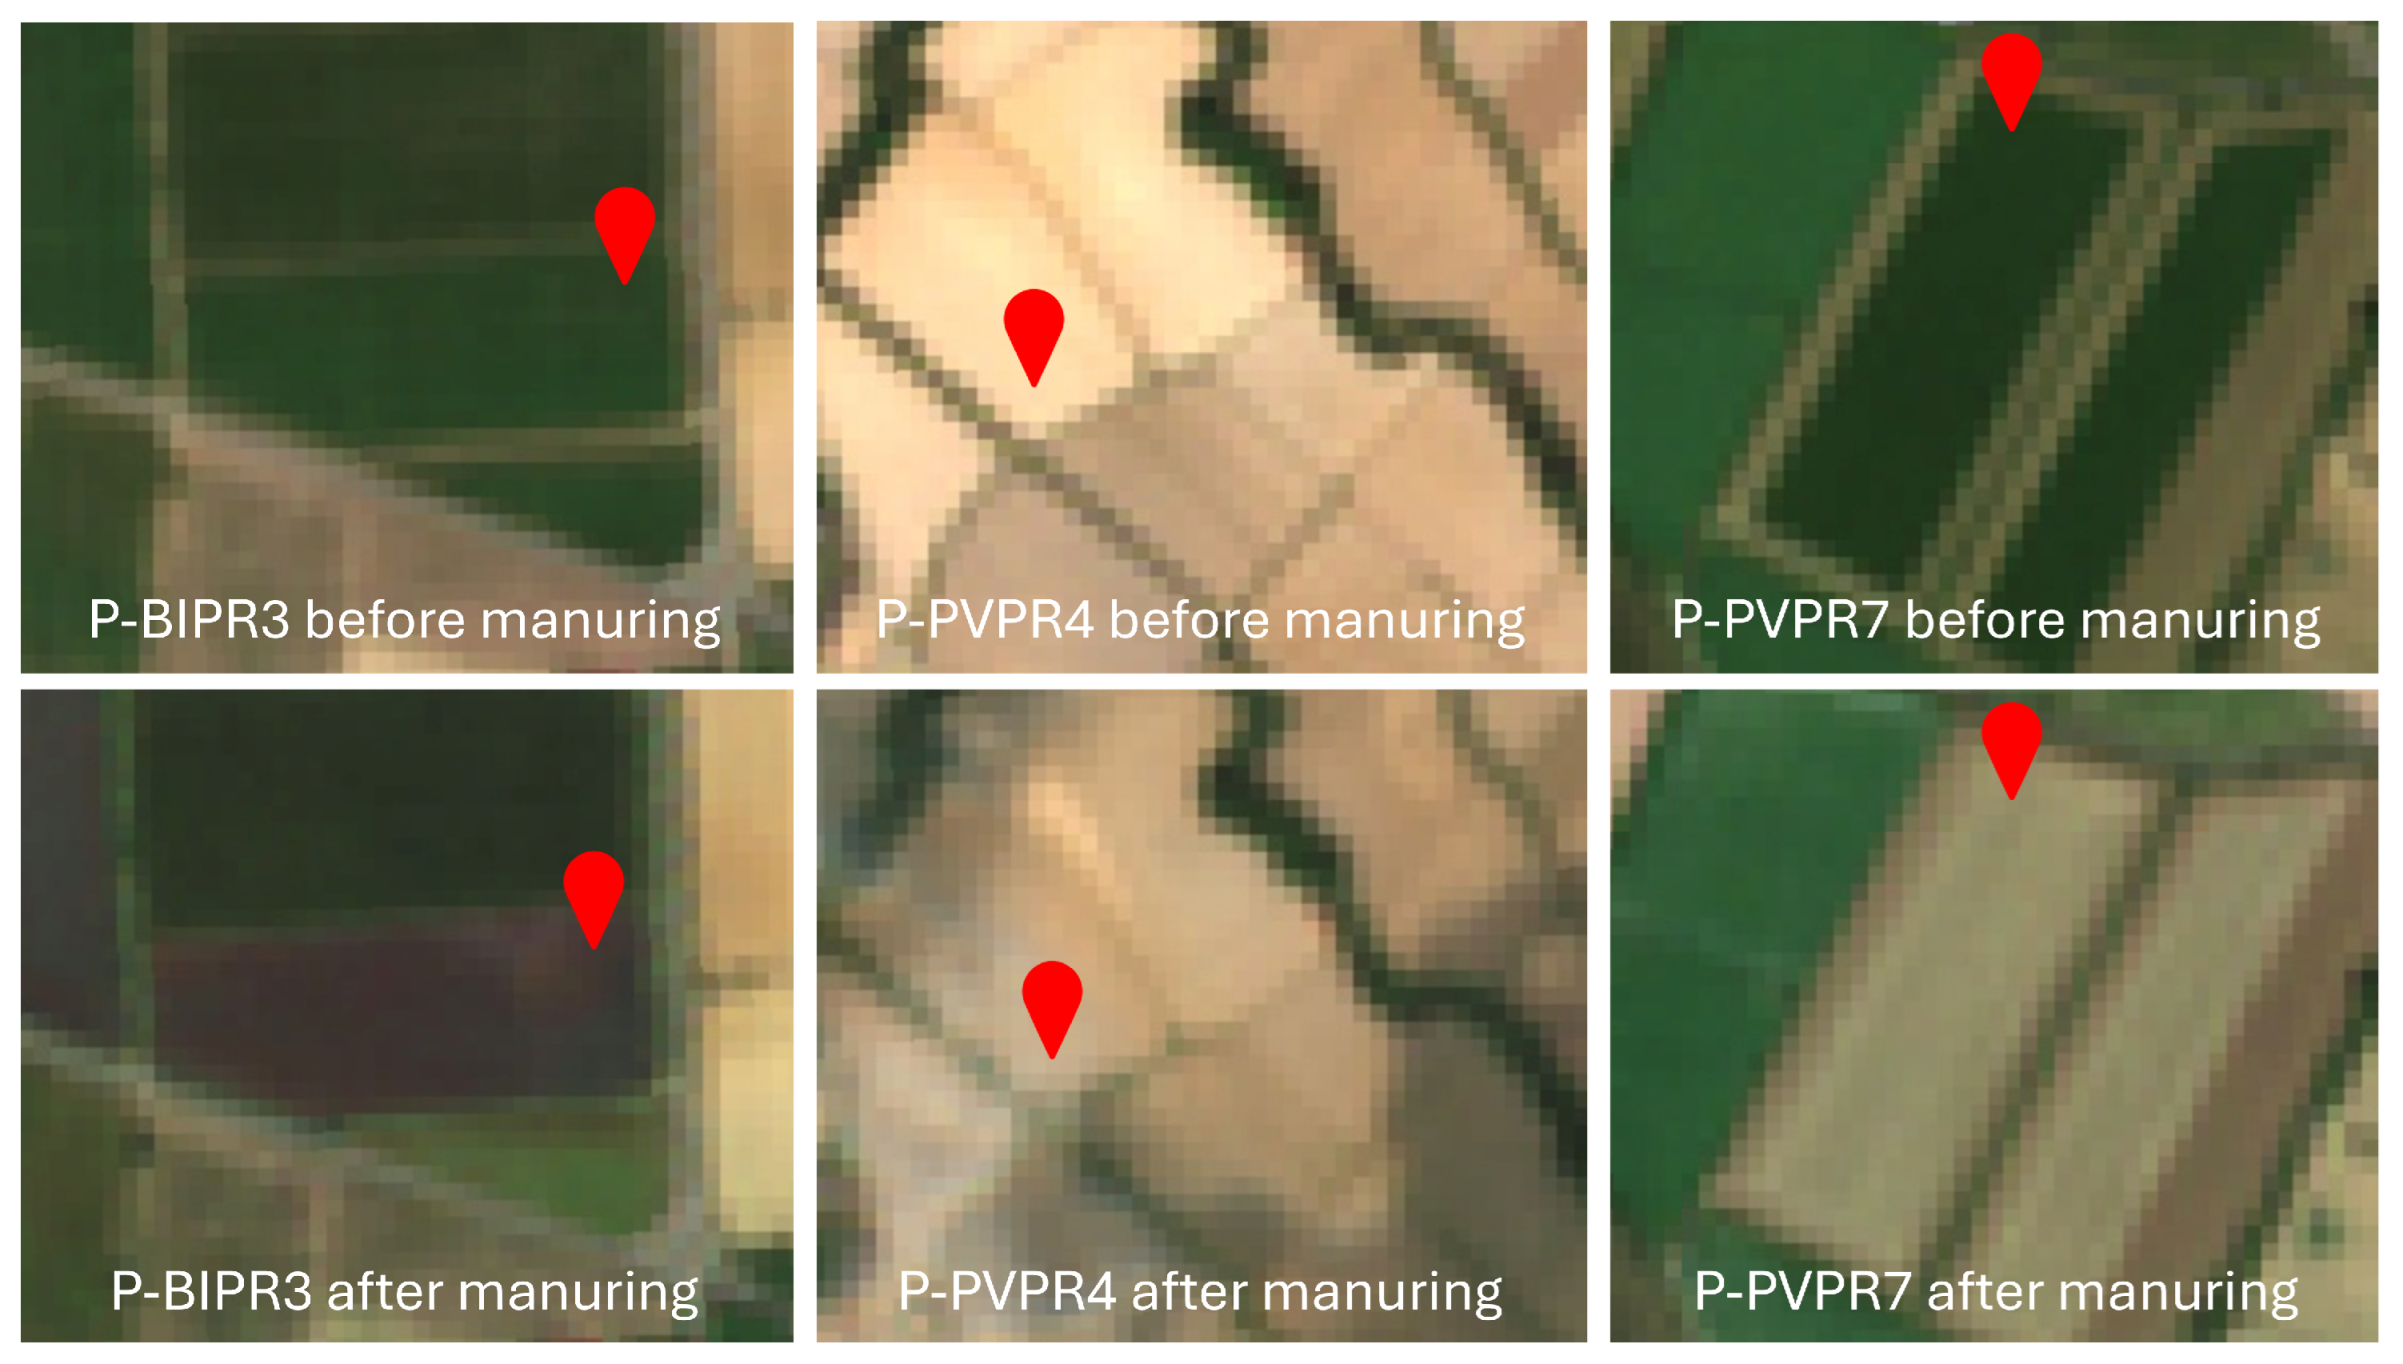
2.1. Ground Truth Data
2.2. Satellite Data
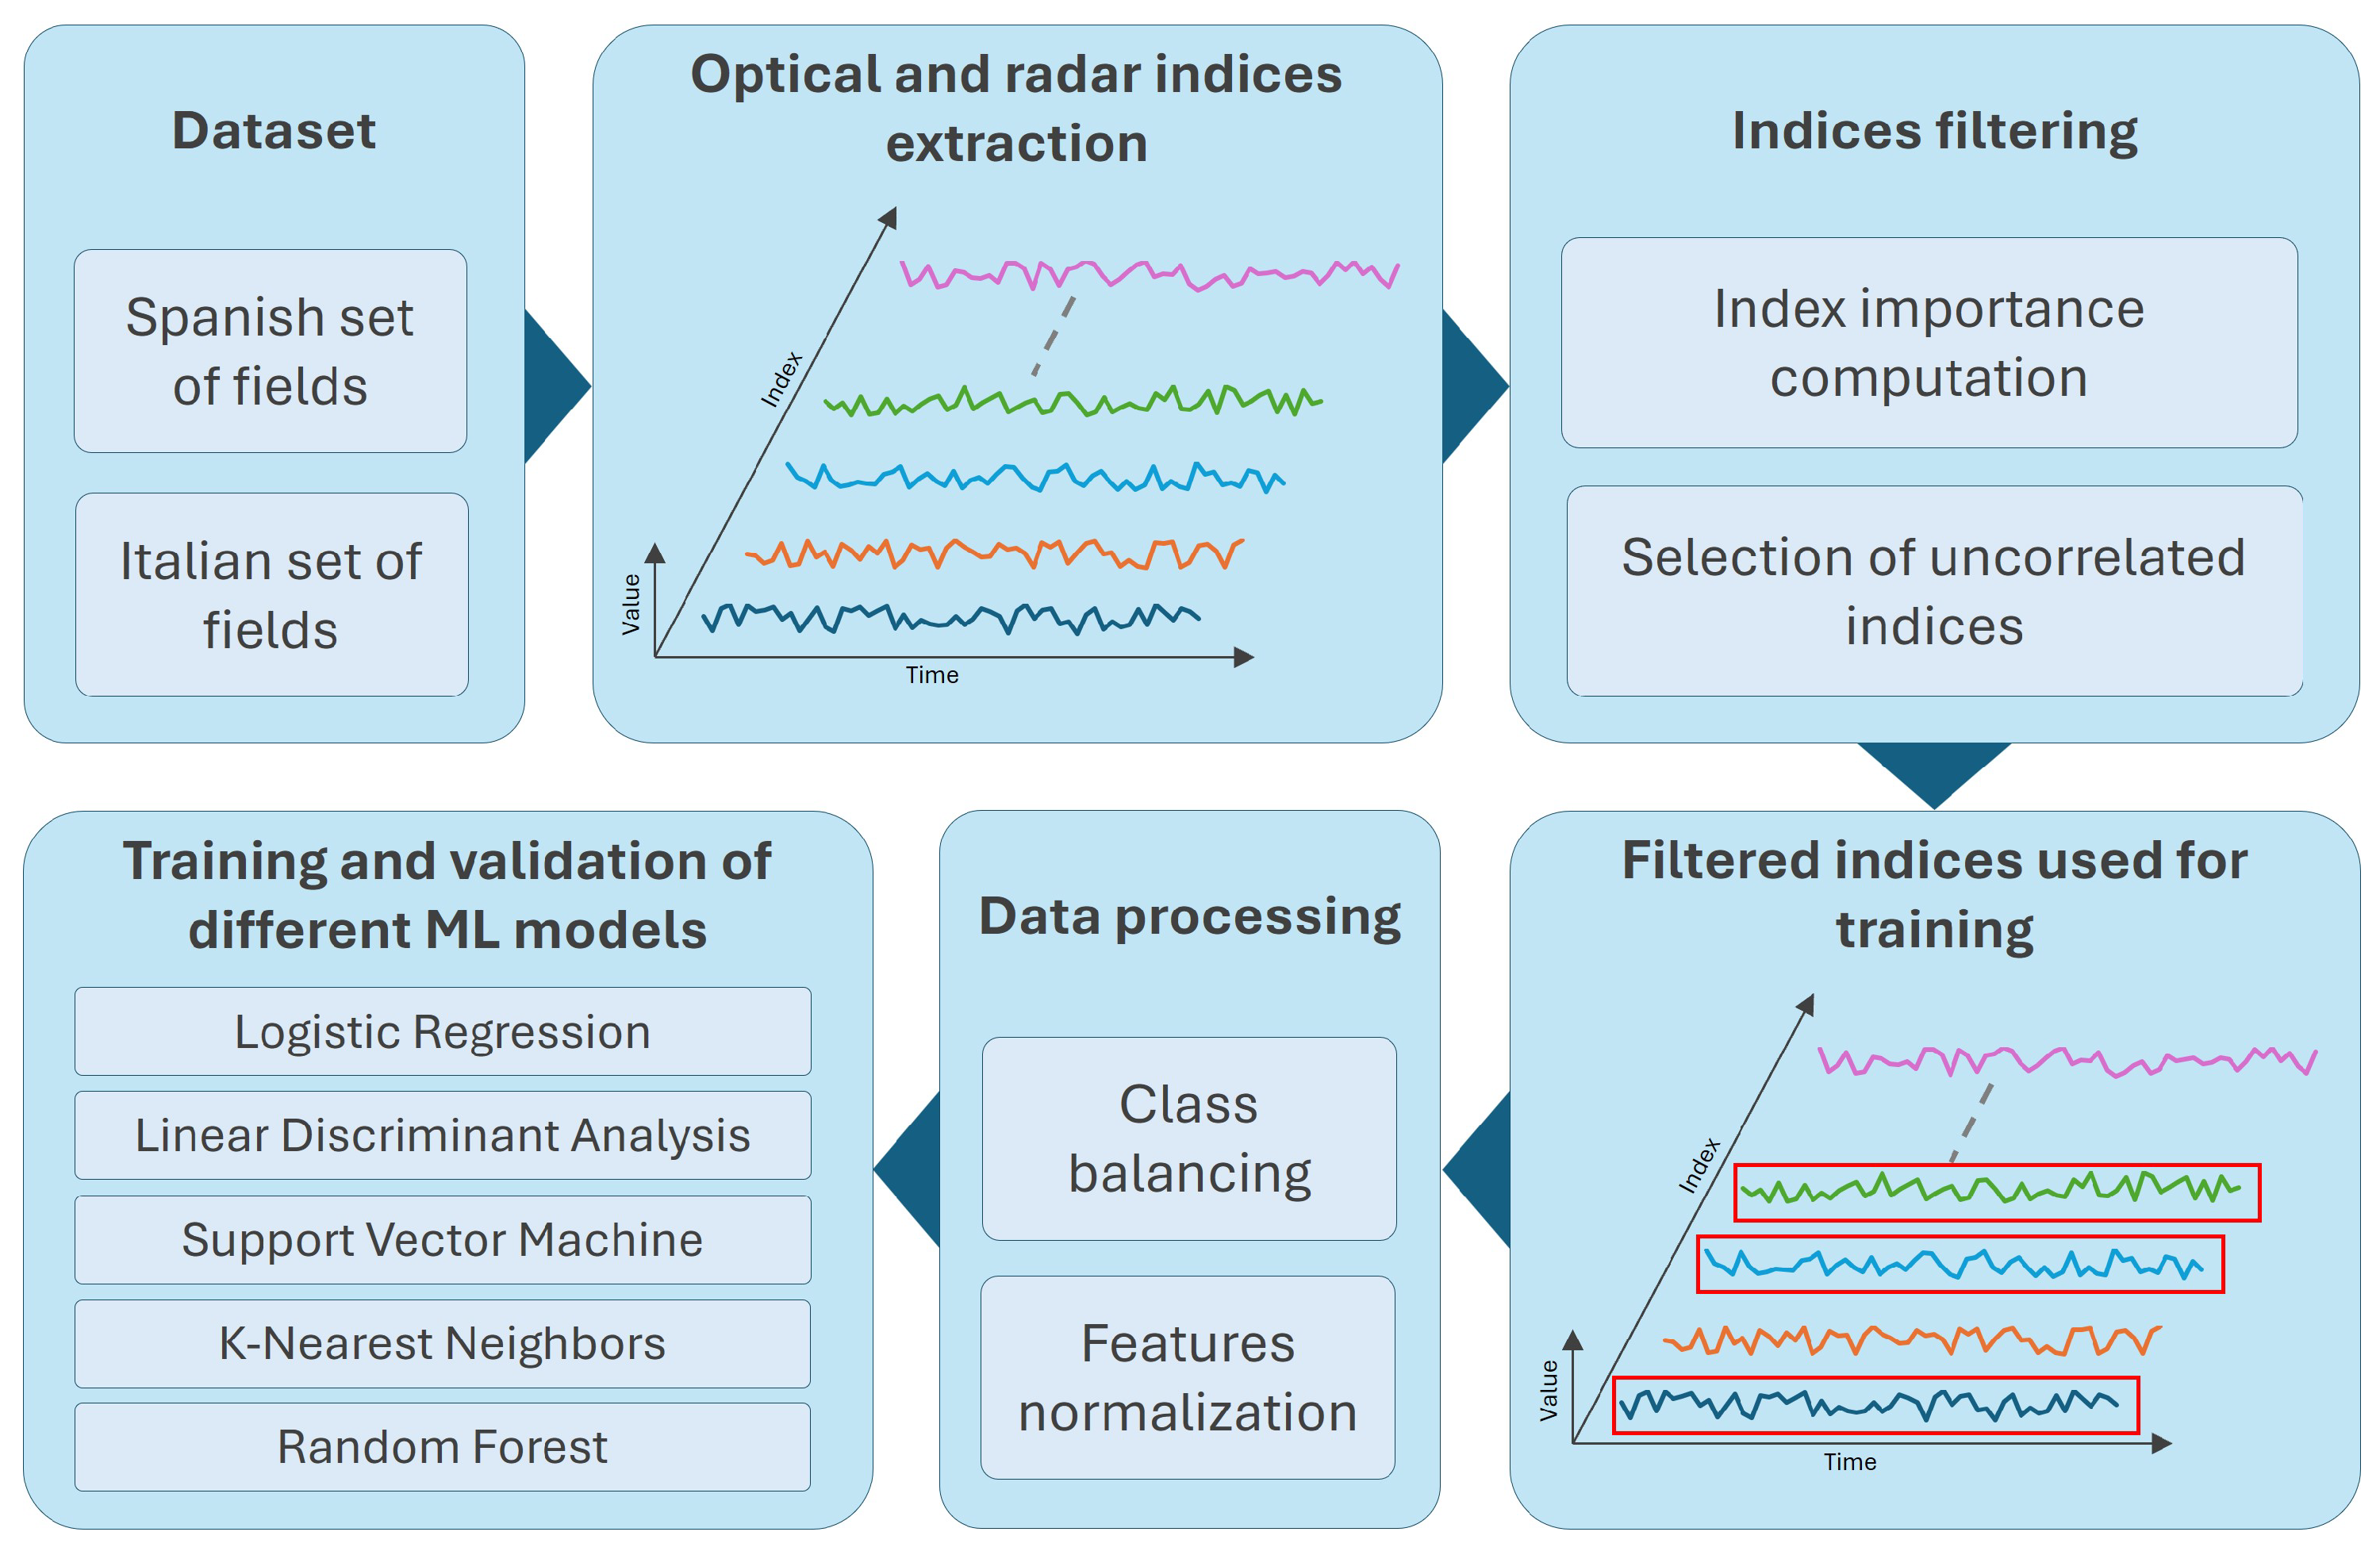
2.3. Methods
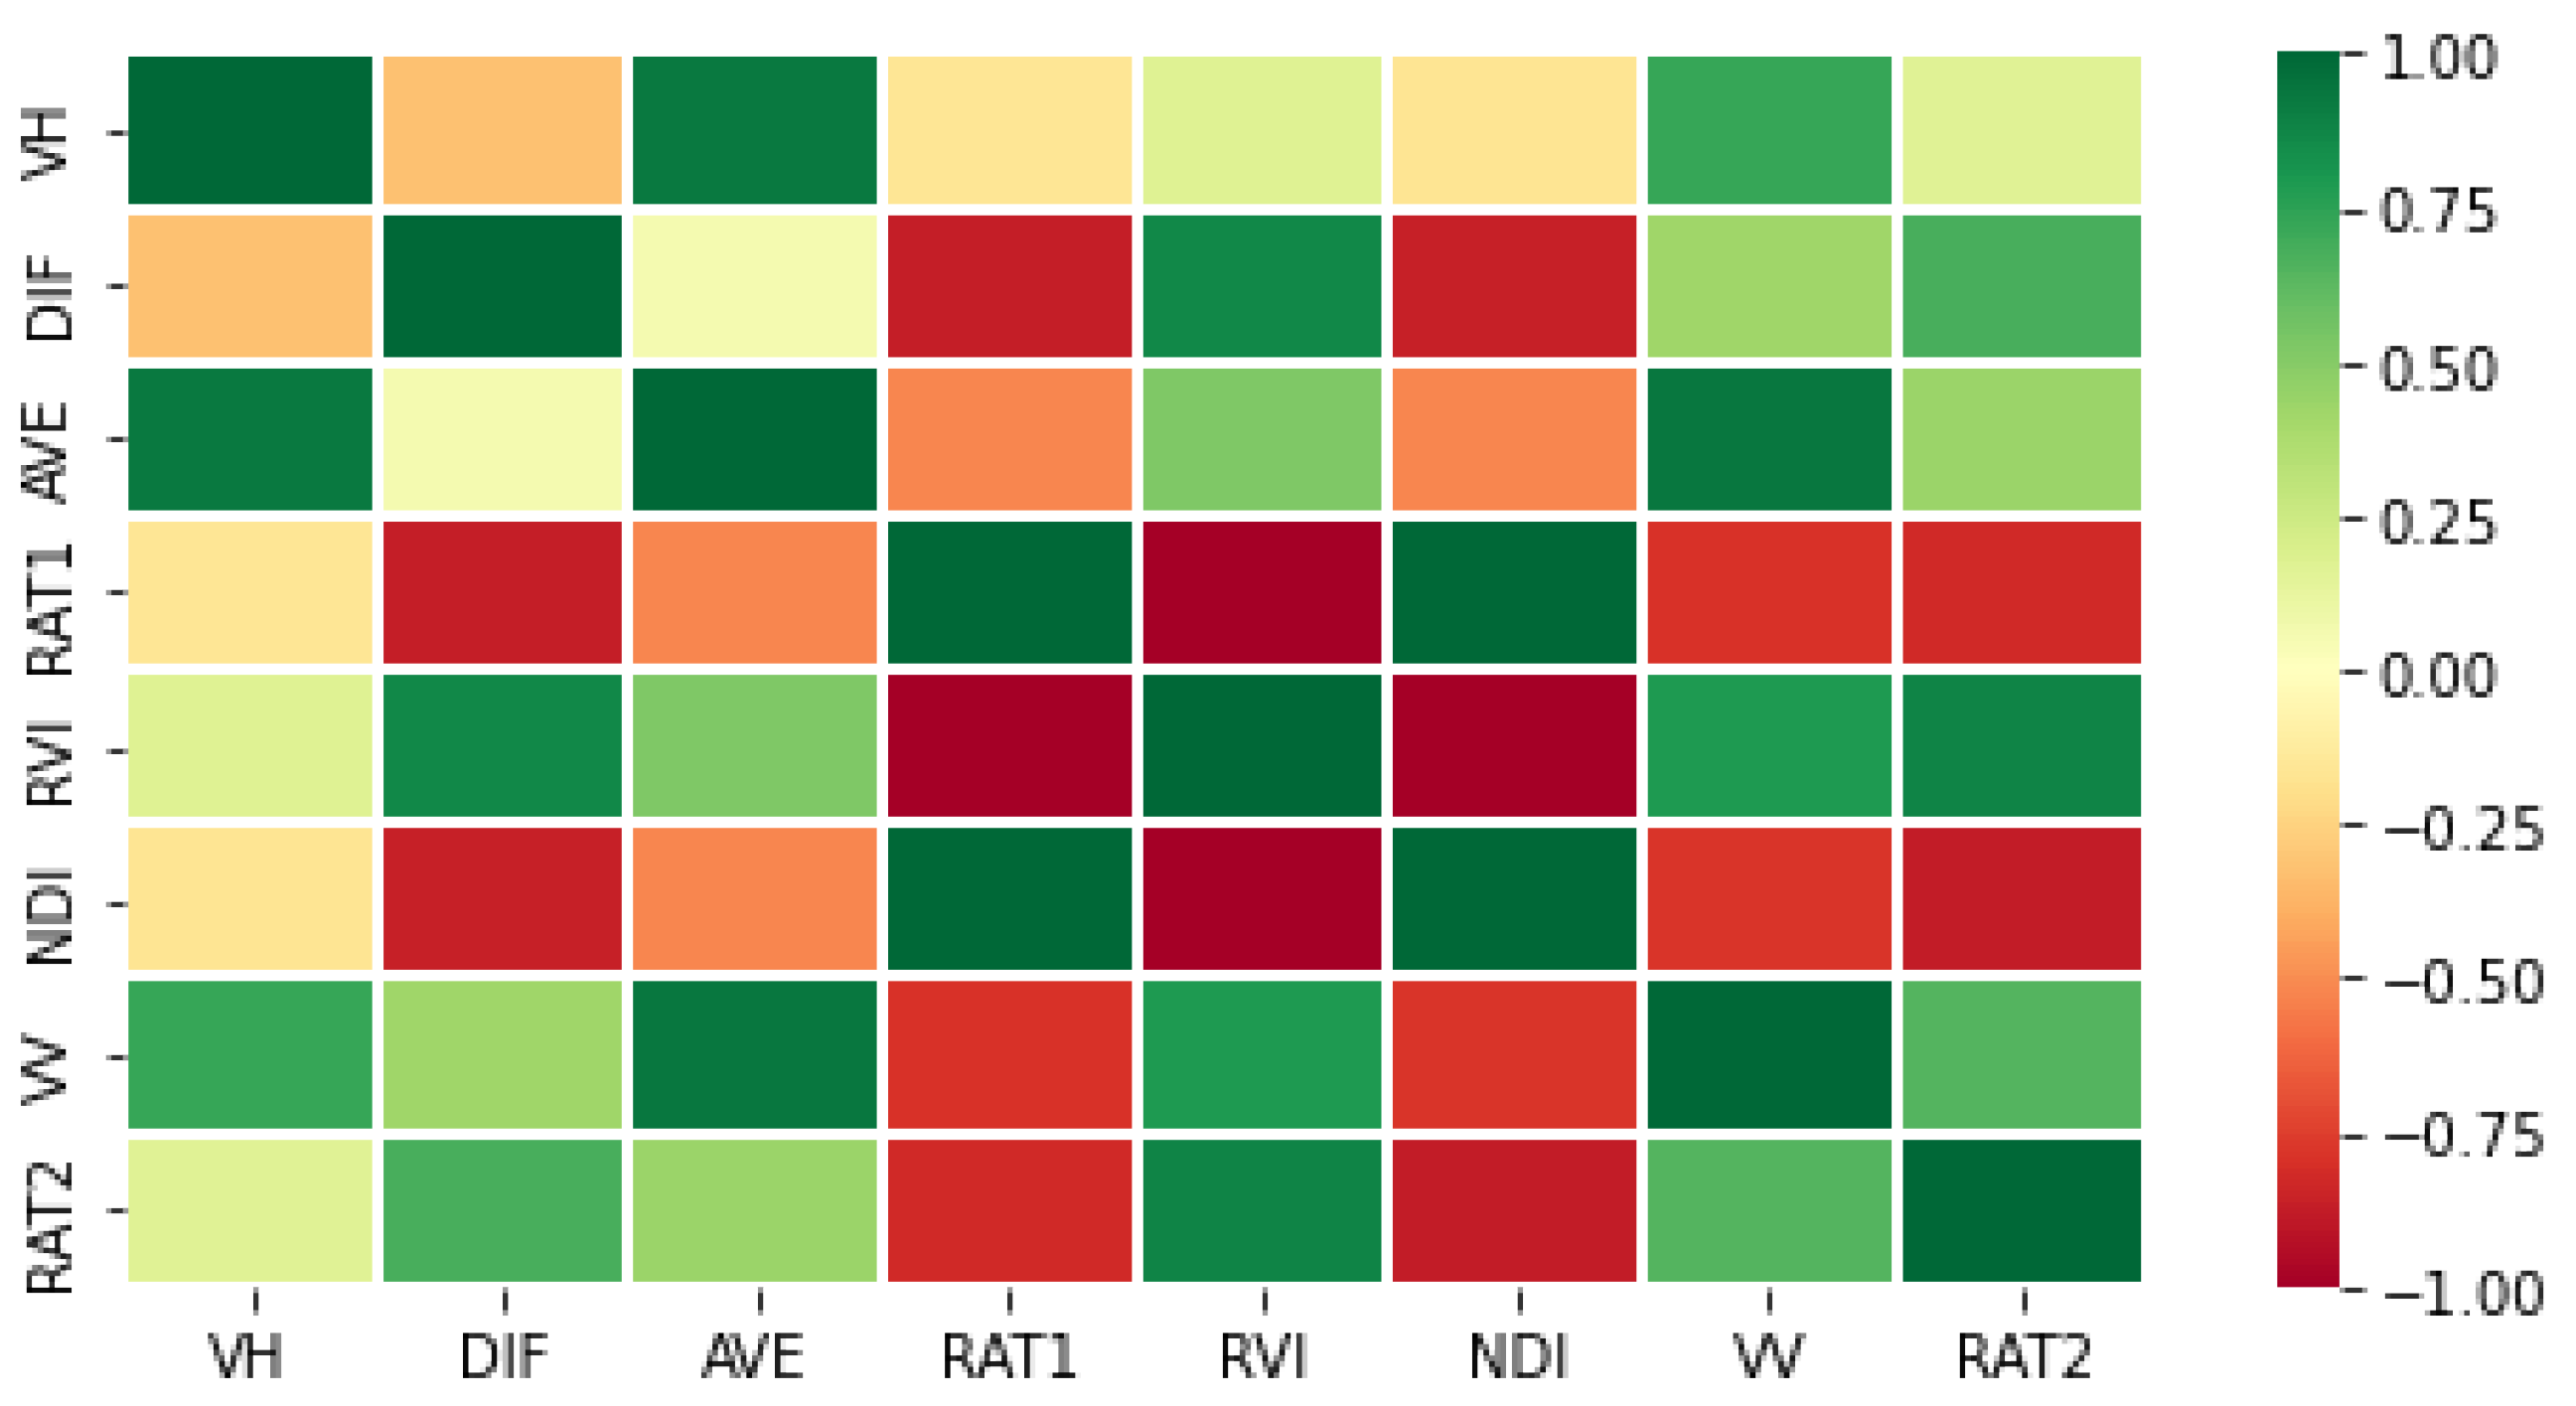
2.3.1. Correlation and Relevance Analysis
2.3.2. Class Balancing and Feature Normalization
- Logistic Regression: a classification method that predicts the probability of an outcome using a sigmoid function. It is effective for binary classification and applicable to multi-class problems, assuming a linear relationship between input variables and log-odds.
- Linear Discriminant Analysis (LDA): a technique that finds a linear combination of features to maximize class separability by projecting data onto a lower-dimensional space. It assumes normally-distributed classes with equal covariance matrices and helps prevent overfitting.
- K-Nearest Neighbors (K-NN) Classifier: this is non-parametric classifier that assigns class labels based on the majority vote of the K nearest neighbors. It does not assume a specific data distribution but is sensitive to the choice of K, which affects performance and the risk of overfitting.
- Support Vector Classifier (SVC): a model that identifies an optimal hyperplane to separate classes by maximizing the margin between them. It uses different kernel functions to handle both linear and non-linear separability, though its performance depends on careful tuning of hyperparameters.
- Random Forest Classifier: an ensemble learning method that constructs multiple decision trees and aggregates their predictions, enhancing robustness against overfitting. It effectively handles high-dimensional data and provides insights into feature importance, but requires careful hyperparameter tuning.
2.4. Further Experimental Details
3. Experimental Findings and Interpretation
3.1. Spanish Test Case
3.2. Italian Case Study
3.2.1. Cross-Validation, Spain to Italy
3.2.2. Training and Validating in Italy
3.2.3. Italy, Additional Dataset
3.2.4. Introduction of Thermal Data
4. Conclusions
5. Future Developments
Author Contributions
Funding
Data Availability Statement
Acknowledgments
Conflicts of Interest
References
- Food and Agriculture Organization (FAO) of the United Nations. Chapter 1. Economic Dimensions of Agriculture. In Statistical Yearbook—2022; FAO Statistics: Rome, Italy, 2022. [Google Scholar] [CrossRef]
- Cleland, J. World Population Growth: Past, Present and Future. Environ. Resour. Econ. 2013, 55, 543–554. [Google Scholar] [CrossRef]
- Chakravarty, S.; Ghosh, S.; Suresh, C.; Dey, A.; Shukla, G. Deforestation: Causes, Effects and Control Strategies; Intech: London, UK, 2012. [Google Scholar] [CrossRef]
- Hignett, T.P. History of chemical fertilizers. In Fertilizer Manual; Springer: Berlin/Heidelberg, Germany, 1985; pp. 3–10. [Google Scholar]
- Scherer, H.W.; Mengel, K.; Kluge, G.; Severin, K. Fertilizers Chapter 1: General. In Ullmann’s Encyclopedia of Industrial Chemistry; John Wiley and Sons, Ltd.: Hoboken, NJ. USA, 2009. [Google Scholar] [CrossRef]
- Kleinman, P.J.; Spiegal, S.; Liu, J.; Holly, M.; Church, C.; Ramirez-Avila, J. Managing Animal Manure to Minimize Phosphorus Losses from Land to Water. In Animal Manure; John Wiley and Sons, Ltd.: Hoboken, NJ, USA, 2020; pp. 201–228. [Google Scholar] [CrossRef]
- Kim, D.K.; Kaluskar, S.; Mugalingam, S.; Arhonditsis, G.B. Evaluating the relationships between watershed physiography, land use patterns, and phosphorus loading in the bay of Quinte basin, Ontario, Canada. J. Great Lakes Res. 2016, 42, 972–984. [Google Scholar] [CrossRef]
- Fahmy, F. Pollution Erodes fish Stocks and Livelihoods in Egyptian Lake. 2022. Available online: https://www.reuters.com/world/africa/pollution-erodes-fish-stocks-livelihoods-egyptian-lake-2022-09-01/ (accessed on 10 March 2025).
- EU Council Directive. 91/676/EEC of 12 December 1991 Concerning the Protection of Waters against Pollution Caused by Nitrates from Agricultural Sources. Off. J. L 375 EU 1991, 375, 12. Available online: https://faolex.fao.org/docs/pdf/eur19065.pdf (accessed on 10 March 2025).
- Tzilivakis, J.; Warner, D.; Green, A.; Lewis, K. A broad-scale spatial analysis of the environmental benefits of fertiliser closed periods implemented under the Nitrates Directive in Europe. J. Environ. Manag. 2021, 299, 113674. [Google Scholar] [CrossRef] [PubMed]
- Svoboda, J. Inspections in the agricultural practice from the Nitrate directive point of view. Acta Agric. Slov. 2006, 87, 155–158. [Google Scholar] [CrossRef]
- The European Commission Implementing Decision (EU) 2022/696. Available online: https://eur-lex.europa.eu/legal-content/EN/TXT/PDF/?uri=CELEX:32022D0696 (accessed on 10 March 2025).
- Mateo-Garcia, G.; Veitch-Michaelis, J.; Smith, L.; Oprea, S.; Schumann, G.; Gal, Y.; Baydin, A.; Backes, D. Towards global flood mapping onboard low cost satellites with machine learning. Sci. Rep. 2021, 11, 7249. [Google Scholar] [CrossRef]
- Jean, N.; Burke, M.; Xie, M.; Davis, W.M.; Lobell, D.B.; Ermon, S. Combining satellite imagery and machine learning to predict poverty. Science 2016, 353, 790–794. [Google Scholar] [CrossRef]
- Verma, P.; Patil, S. A Machine Learning Approach and Methodology for Solar Radiation Assessment Using Multispectral Satellite Images. Ann. Data Sci. 2021, 10, 907–932. [Google Scholar] [CrossRef]
- Girona, T.; Realmuto, V.; Lundgren, P. Large-scale thermal unrest of volcanoes for years prior to eruption. Nat. Geosci. 2021, 14, 396. [Google Scholar] [CrossRef]
- Cunha, M.; Marçal, A.; Silva, L. Very early prediction of wine yield based on satellite data from vegetation. Int. J. Remote Sens. 2013, 31, 3125–3142. [Google Scholar] [CrossRef]
- Fraternali, P.; Morandini, L.; González, S.L.H. Solid waste detection, monitoring and mapping in remote sensing images: A survey. Waste Manag. 2024, 189, 88–102. [Google Scholar] [CrossRef] [PubMed]
- Dodin, M.; Smith, H.D.; Levavasseur, F.; Hadjar, D.; Houot, S.; Vaudour, E. Potential of Sentinel-2 Satellite Images for Monitoring Green Waste Compost and Manure Amendments in Temperate Cropland. Remote Sens. 2021, 13, 1616. [Google Scholar] [CrossRef]
- Pedrayes, O.D.; Usamentiaga, R.; Trichakis, Y.; Bouraoui, F. Remote sensing for detecting freshly manured fields. Ecol. Inform. 2023, 75, 102006. [Google Scholar] [CrossRef]
- Dubbini, M.; Belluzzo, M.; Zanni Bertelli, V.; Pirola, A.; Tornato, A.; Alessandrini, C. The Identification of Manure Spreading on Bare Soil through the Development of Multispectral Indices from Sentinel-2 Data: The Emilia-Romagna Region (Italy) Case Study. Sensors 2024, 24, 4687. [Google Scholar] [CrossRef] [PubMed]
- Shea, K.; Schaffer-Smith, D.; Muenich, R.L. Using remote sensing to identify liquid manure applications in eastern North Carolina. J. Environ. Manag. 2022, 317, 115334. [Google Scholar] [CrossRef] [PubMed]
- Grandini, M.; Bagli, E.; Visani, G. Metrics for Multi-Class Classification: An Overview. arxViv 2020. [Google Scholar] [CrossRef]
- Diaz Pedrayes, O.; Usamentiaga, R. Satellite Imagery Dataset of Manure Application on Pasture Fields; Elvesier: Amsterdam, The Netherlands, 2022. [Google Scholar] [CrossRef]
- Territory and Civil Protection Department—Region of Lombardy. Destinazione d’Uso dei Suoli Agricoli e Forestali (DUSAF Database). Available online: https://www.dati.lombardia.it/Territorio/Dusaf-6-0-Uso-del-suolo-2018/7rae-fng6 (accessed on 10 March 2025).
- Marzi, D.; Dell’Acqua, F.; Trichakis, I. Assessing Compliance to EU Nitrate Pollution Regulations by Detecting Manure Applications in Time Series of Sentinel-2 Acquisitions. In Proceedings of the IGARSS 2023-2023 IEEE International Geoscience and Remote Sensing Symposium, Pasadena, CA, USA, 16–21 July 2023; pp. 3450–3453. [Google Scholar]
- Amato, F. ee-Satellites Python Library. Available online: https://pypi.org/project/ee-satellites/ (accessed on 10 March 2025).
- Amato, F. Revolutionize Your Satellite Data Acquisition with ee-Satellites. Available online: https://dev.to/amatofrancesco99/exciting-news-for-data-scientists-and-remote-sensing-enthusiasts-5g2g (accessed on 10 March 2025).
- Google. Sentinel-1 SAR GRD: C-Band Synthetic Aperture Radar Ground Range Detected, Log Scaling. Available online: https://developers.google.com/earth-engine/datasets/catalog/COPERNICUSS1GRD (accessed on 10 March 2025).
- Google. Sentinel-2 MSI: MultiSpectral Instrument, Level-2A. Available online: https://developers.google.com/earth-engine/datasets/catalog/COPERNICUSS2SR (accessed on 10 March 2025).
- Google. USGS Landsat 8 Collection 2 Tier 1 TOA Reflectance. Available online: https://developers.google.com/earth-engine/datasets/catalog/LANDSAT_LC08_C02_T1_TOA#description (accessed on 10 March 2025).
- Mohammed, R.; Rawashdeh, J.; Abdullah, M. Machine Learning with Oversampling and Undersampling Techniques: Overview Study and Experimental Results. In Proceedings of the 2020 11th International Conference on Information and Communication Systems (ICICS), Irbid, Jordan, 7–9 April 2020; pp. 243–248. [Google Scholar] [CrossRef]
- Venkatesh, B.; Anuradha, J. A Review of Feature Selection and Its Methods. Cybern. Inf. Technol. 2019, 19, 3. [Google Scholar] [CrossRef]
- Zou, X.; Hu, Y.; Tian, Z.; Shen, K. Logistic Regression Model Optimization and Case Analysis. In Proceedings of the 2019 IEEE 7th International Conference on Computer Science and Network Technology (ICCSNT), Dalian, China, 19–20 October 2019; pp. 135–139. [Google Scholar] [CrossRef]
- Tharwat, A.; Gaber, T.; Ibrahim, A.; Hassanien, A.E. Linear Discriminant Analysis: A Detailed Tutorial. AI Commun. 2017, 30, 169–190. [Google Scholar] [CrossRef]
- Awad, M.; Khanna, R.; Awad, M.; Khanna, R. Support vector machines for classification. In Efficient Learning Machines: Theories, Concepts, and Applications for Engineers and System Designers; Springer: Berlin/Heidelberg, Germany, 2015; pp. 39–66. [Google Scholar]
- Guo, G.; Wang, H.; Bell, D.; Bi, Y. KNN Model-Based Approach in Classification; Springer: Berlin/Heidelberg, Germany, 2004. [Google Scholar]
- Ali, J.; Khan, R.; Ahmad, N.; Maqsood, I. Random Forests and Decision Trees. Int. J. Comput. Sci. Issues (IJCSI) 2012, 9, 272–278. [Google Scholar]
- Yu, T.; Zhu, H. Hyper-Parameter Optimization: A Review of Algorithms and Applications. arXiv 2020. [Google Scholar] [CrossRef]
- Turing Portal. How and Where to Apply Feature Scaling in Python? Available online: https://www.turing.com/kb/how-and-where-to-apply-feature-scaling-in-python (accessed on 10 March 2025).
- Prusty, S.; Patnaik, S.; Dash, S. SKCV: Stratified K-fold cross-validation on ML classifiers for predicting cervical cancer. Front. Nanotechnol. 2022, 4, 972421. [Google Scholar] [CrossRef]


| Feature | Name | Sensor | Expression | Feature Importance Value |
|---|---|---|---|---|
| EOMI3 | Exogenous Organic Matter Index 3 | Sentinel-2 | 0.720542 | |
| RESNDI | SWIR-Red edge Normalized Difference Index | Sentinel-2 | 0.672114 | |
| SCI | Soil Composition Index | Sentinel-2 | 0.661566 | |
| EOMI1 | Exogenous Organic Matter Index 1 | Sentinel-2 | 0.628979 | |
| SDI | SWIR Difference Index | Sentinel-2 | 0.584395 | |
| VH | VH polarization | Sentinel-1 | VH only | 0.366449 |
| DIF | Difference | Sentinel-1 | 0.362870 | |
| AVE | Average | Sentinel-1 | 0.340196 | |
| RAT1 | Ratio 1 | Sentinel-1 | 0.312078 | |
| RVI | Radar Vegetation Index | Sentinel-1 | 0.305876 |
| Sentinel-2 | Sentinel-1 | ||||
|---|---|---|---|---|---|
| Model | Training Acc. | Test Acc. | Model | Training Acc. | Test Acc. |
| LR | 0.80 | 0.77 | LR | 0.52 | 0.52 |
| LDA | 0.86 | 0.84 | LDA | 0.51 | 0.50 |
| SVC | 0.90 | 0.88 | SVC | 0.67 | 0.64 |
| KNN | 0.82 | 0.80 | KNN | 0.67 | 0.62 |
| RFC | 0.85 | 0.83 | RFC | 0.70 | 0.52 |
| Predicted | |||
|---|---|---|---|
| Not Manured | Manured | ||
| Actual | Not manured | 199 | 27 |
| Manured | 14 | 5 | |
| Model | Train Acc. | Test Acc. |
|---|---|---|
| LR | 0.58 | 0.54 |
| LDA | 0.65 | 0.60 |
| SVC | 0.70 | 0.69 |
| KNN | 0.68 | 0.57 |
| RFC | 0.78 | 0.63 |
| Context | w/o Thermal | w/ Thermal | Improvement |
|---|---|---|---|
| Spain | 90% | 92% | +2% |
| Italy | 70% | 82% | +12% |
Disclaimer/Publisher’s Note: The statements, opinions and data contained in all publications are solely those of the individual author(s) and contributor(s) and not of MDPI and/or the editor(s). MDPI and/or the editor(s) disclaim responsibility for any injury to people or property resulting from any ideas, methods, instructions or products referred to in the content. |
© 2025 by the authors. Licensee MDPI, Basel, Switzerland. This article is an open access article distributed under the terms and conditions of the Creative Commons Attribution (CC BY) license (https://creativecommons.org/licenses/by/4.0/).
Share and Cite
Marzi, D.; Dell’Acqua, F. Satellite-Based Detection of Farmland Manuring Using Machine Learning Approaches. Remote Sens. 2025, 17, 1028. https://doi.org/10.3390/rs17061028
Marzi D, Dell’Acqua F. Satellite-Based Detection of Farmland Manuring Using Machine Learning Approaches. Remote Sensing. 2025; 17(6):1028. https://doi.org/10.3390/rs17061028
Chicago/Turabian StyleMarzi, David, and Fabio Dell’Acqua. 2025. "Satellite-Based Detection of Farmland Manuring Using Machine Learning Approaches" Remote Sensing 17, no. 6: 1028. https://doi.org/10.3390/rs17061028
APA StyleMarzi, D., & Dell’Acqua, F. (2025). Satellite-Based Detection of Farmland Manuring Using Machine Learning Approaches. Remote Sensing, 17(6), 1028. https://doi.org/10.3390/rs17061028