Abstract
This study improves the UAV-based detection of low-emission smoke by enhancing the dataset generation pipeline, addressing a key limitation of previous approaches, namely the lack of high-quality, automatically annotated datasets for small-scale chimney emissions. Traditional methods for smoke detection, including deep learning models trained on manually labeled images, suffer from inconsistency due to the transient nature of smoke and annotation subjectivity. To overcome this, we refine an existing motion-based annotation framework by integrating an LightGBM-based classifier, which filters out false positives caused by background motion. The proposed method was evaluated using a dataset of 634 stabilized UAV video sequences (10 s each), covering diverse environmental conditions, including winter scenes and oblique views. The improved pipeline generated 23,548 high-confidence training annotations, reducing false positives by 37% compared to the baseline motion-based approach. The trained YOLOv11 model achieved 0.98 precision and 0.91 recall on the refined dataset, significantly outperforming the previous version. Unlike prior UAV-based smoke detection studies, which primarily focus on large-scale wildfire smoke, this work targets low-intensity emissions from residential heating, ensuring the precise localization of individual pollution sources. By improving annotation quality and reducing manual labeling efforts, this study enables the more robust and scalable detection of urban air pollution sources, with potential applications in regulatory enforcement and environmental monitoring.
1. Introduction
1.1. Air Pollution and Its Impact on Public Health
Air pollution remains a major environmental and public health issue, contributing to respiratory and cardiovascular diseases. In Europe, it is responsible for approximately 400,000 premature deaths annually [1]. A significant portion of this pollution originates from low-emission sources, primarily residential heating systems using solid fuels such as coal and wood. These systems are a major source of particulate matter (PM2.5, PM10), as well as toxic compounds like benzo[a]pyrene and heavy metals [2,3]. In many regions, including Poland, air quality measurements frequently exceed the recommended safety thresholds during the heating season, highlighting the urgent need for more effective emission control strategies (Figure 1). Figure 2 illustrates the dominant sources of these pollutants, with residential heating playing a key role.
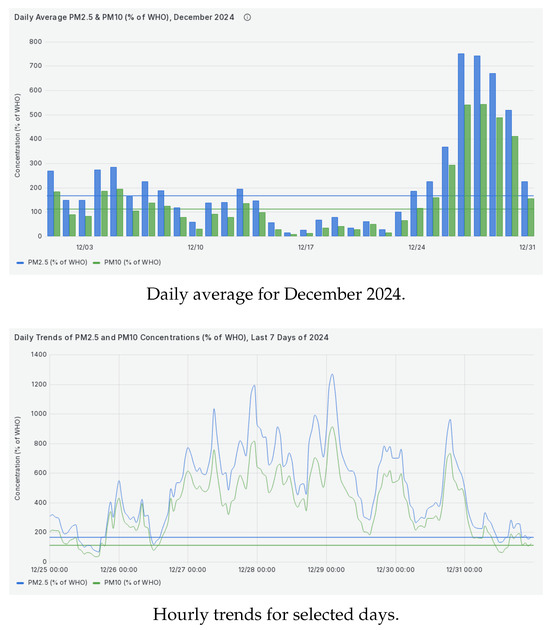
Figure 1.
Comparison of PM2.5 and PM10 concentrations in Zbrosławice Municipality, Tarnowskie Góry County, Silesian Voivodeship, Poland. Data are expressed as percentages of WHO guidelines (15 µg/m3 for PM2.5, 45 µg/m3 for PM10).
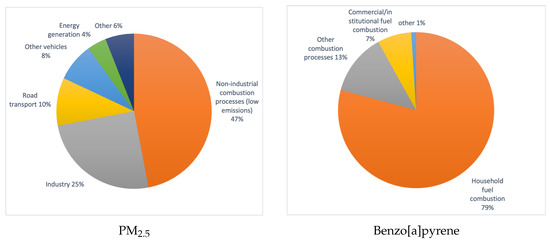
Figure 2.
Main sources of harmful pollutants in Poland—PM2.5 and benzo[a]pyrene in 2017.
Traditional air quality monitoring networks provide valuable information on pollution levels but offer limited insight into individual emission sources. This makes it difficult to enforce emission restrictions, particularly in regions where outdated heating systems continue to operate despite regulatory bans. Identifying active polluters is crucial for improving air quality and evaluating the effectiveness of emission control policies.
To achieve this goal, monitoring solutions must provide both high spatial resolution and the ability to detect individual emission sources. Traditional ground-based air quality monitoring networks fail in this regard, making aerial imaging a promising alternative. Among these methods, UAV-based monitoring has emerged as an effective tool for addressing these limitations, enabling the precise localization of polluters and supporting regulatory enforcement.
1.2. UAV-Based Detection of Low-Emission Sources
Unlike stationary monitoring stations, UAVs can dynamically survey large areas, capturing real-time visual data that allow for the direct identification of emission sources. Their ability to operate at varying altitudes and angles provides a unique advantage in distinguishing localized pollution events from background air quality trends. However, detecting low-emission smoke from residential heating presents unique challenges, requiring advanced computer vision techniques to differentiate smoke plumes from other environmental elements. The following section explores these challenges and the methodologies developed to overcome them.
UAV-based smoke detection has been extensively studied in the context of wildfire monitoring, where large-scale smoke plumes are the primary target [4,5]. However, detecting low-emission smoke from residential heating presents different challenges. Unlike wildfire smoke, chimney emissions are often subtle, short-lived, and influenced by weather conditions such as wind speed and turbulence. Additionally, urban and suburban environments introduce substantial background variability, with numerous elements—such as trees, rooftop structures, and even trash—potentially leading to false detections [6]. These factors necessitate detection methods specifically tailored to low-emission scenarios.
Unlike traditional air quality monitoring, which focuses on measuring pollutant concentrations, this study directly targets the identification of emission sources. The core challenge lies in detecting smoke specifically above rooftops, distinguishing it from other moving elements in the scene. This ensures that the detected emissions can be reliably attributed to individual heating systems, providing a means for the localized enforcement of air quality regulations.
A key limitation of many deep learning-based smoke detection methods is their reliance on large, manually annotated datasets, which are time-consuming and costly to create [7,8]. To address this issue, this study proposes an automated dataset generation framework that minimizes human intervention while ensuring high-quality annotations. By automating the dataset creation process, we provide a scalable solution that can be extended to other environmental monitoring applications requiring high-precision training data.
In previous work [6], a motion-based detection approach was used to identify smoke emissions and generate training datasets for deep learning models. While effective in isolating moving objects, this method was susceptible to false positives caused by background motion unrelated to emissions. In this study, we refine this approach by introducing a dataset generation pipeline that enhances annotation quality, thereby improving detection robustness while reducing manual labeling efforts.
1.3. Advances in Vision-Based Smoke Detection
Numerous solutions to the problem of smoke and fire detection can be found in the literature, but the vast majority focus on fire protection and forest fire detection. These methods typically rely on static cameras continuously recording image data, with algorithms designed to detect smoke or flames in open environments, such as forests or industrial sites.
However, the detection of smoke emissions from low-emission sources, such as residential heating systems, remains largely unexplored. Unlike wildfire smoke, which is often extensive and visible from a distance, chimney smoke is typically subtle, variable in appearance, and prone to blending with the background. This makes detection more challenging, especially in densely built environments. Existing object detection models, including convolutional neural networks (CNNs) and YOLO-based frameworks, have demonstrated effectiveness in recognizing smoke in general conditions, but their performance for detecting low-emission sources remains uncertain due to the unique challenges associated with small, transient, and low-contrast smoke plumes [4,6].
One of the key challenges in low-emission smoke detection is the lack of well-defined contours, making traditional segmentation-based approaches, such as U-Net or DeepLab, less effective. Unlike wildfire scenarios, where large, continuous plumes of smoke allow for accurate pixel-level classification, chimney emissions are often dispersed, influenced by turbulence, and difficult to separate from background elements [8]. These factors necessitate alternative detection strategies based on motion analysis and object detection.
Unmanned aerial vehicles (UAVs) equipped with high-resolution cameras further extend the capabilities of vision-based systems by providing flexible viewpoints and access to locations that are otherwise difficult to monitor. In our previous study [6], we introduced a motion-based approach to detect low-emission smoke and generate training data for deep learning models. However, the method suffered from a high rate of false positives due to non-smoke motion artifacts. The present study builds upon these findings, incorporating a refined feature-based classification step to improve detection accuracy while minimizing manual annotation efforts.
1.3.1. Rule-Based and Classical Approaches to Smoke Detection
Classical smoke detection methods primarily rely on rule-based techniques and traditional machine learning, often using motion analysis as a preliminary step. Key approaches include frame differencing, chrominance-based detection (smoke typically exhibits lower chromatic saturation), and background subtraction using Gaussian Mixture Models (GMMs) [9,10,11,12]. Additionally, motion estimation techniques such as optical flow [13] and block-based motion analysis—similar to those employed in video compression algorithms—have been widely explored [11,14].
Following motion-based pre-selection, classification techniques rely on features extracted from the physical properties of smoke. These include reduced saturation, a local loss of focus, and dynamic smoke behavior [11,15,16]. More advanced feature extraction techniques, such as Discrete Wavelet Transform (DWT) [9,12] and Discrete Cosine Transform (DCT) [14], have also been proposed to enhance classification accuracy. Furthermore, texture descriptors such as Local Binary Patterns (LBPs) [15,17,18] and their spatiotemporal extension, Local Binary Motion Patterns (LBMPs) [19], provide additional robustness in detecting smoke regions.
Despite their utility in controlled environments, classical methods struggle with real-world variability. Low chromatic saturation in outdoor conditions—especially during autumn and winter—significantly reduces the effectiveness of chrominance-based approaches. Similarly, background complexity and perspective changes challenge motion-based techniques. As a result, modern deep learning-based solutions have emerged as a more robust alternative, capable of generalizing across diverse conditions and minimizing false detections.
While these methods offer a degree of effectiveness in controlled environments, their reliance on handcrafted features limits their ability to generalize across diverse real-world conditions. This has led to the increasing adoption of deep learning approaches for smoke detection.
1.3.2. Deep Learning Approaches to Smoke Detection
In recent years, deep learning (DL) techniques have revolutionized smoke detection by addressing many of the limitations inherent in classical methods. Unlike rule-based approaches, which rely on predefined feature extraction and manual engineering, DL methods leverage large datasets to automatically learn features that are critical for smoke detection. These approaches have demonstrated superior accuracy and generalization, especially in complex and dynamic environments.
The main categories of DL methods for smoke detection include image classification, object detection, and semantic segmentation. Image classification approaches determine whether smoke or fire is present in an image. Early solutions employed architectures like AlexNet [20], GoogleNet [21], and VGG-Net [22], achieving promising results in identifying smoke in controlled scenarios [23,24,25].
Object detection methods go further by locating and labeling smoke or fire in an image, usually with bounding boxes. Popular object detection frameworks include two-stage algorithms, such as Faster R-CNN [26], and single-stage algorithms like YOLO [7,27] and SSD [28]. These methods have been extensively used for wildfire monitoring [4,5] and have shown great promise for detecting smoke in UAV video footage. Additionally, combining RGB and thermal imaging has further enhanced detection accuracy [29].
While semantic segmentation methods, such as U-Net and DeepLab, provide pixel-level smoke detection, their applicability to low-emission smoke remains limited due to the lack of distinct contours and the small scale of emissions. This study adopts an object detection approach combined with feature-based classification, aiming to improve accuracy while maintaining computational efficiency.
This study aims to develop an automated dataset generation framework for low-emission smoke detection, improving detection accuracy while reducing reliance on manual annotation. The approach is designed to be scalable and adaptable to real-world applications.
2. Materials and Methods
2.1. Overview of Low-Emission Smoke Detection
Detecting low-emission smoke, such as that produced by residential heating systems, presents distinct challenges compared to traditional smoke detection scenarios like wildfire monitoring. The smoke in these cases is often subtle, dispersed, and located in visually complex environments, making it difficult to differentiate from other moving elements such as pedestrians, vehicles, or vegetation affected by wind.
This study builds upon earlier work [6], enhancing the detection pipeline to address these challenges more effectively. The pipeline now integrates motion detection, rooftop localization, and binary classification to differentiate smoke from other moving objects. The introduction of a LightGBM-based binary classifier [30] significantly reduces false positives, improving detection robustness.
The updated methodology also involves substantial improvements to the dataset, ensuring better representation of diverse environmental conditions, including snow-covered scenes, oblique perspectives, and recordings from lightweight UAVs. These enhancements aim to provide a more comprehensive and adaptable solution for detecting low-emission smoke in real-world scenarios.
2.2. Image Acquisition and Initial Dataset Preparation
The dataset used in this study was collected between March 2019 and January 2024, focusing on the UAV-based monitoring of residential heating emissions under varying environmental conditions. The data acquisition methodology builds upon the approach described in our previous study [6], where flight planning, altitude selection, and initial dataset composition were analyzed.
- Data Collection Locations and Conditions
The primary data collection took place in Southern Poland (Silesian Voivodeship), covering both urban and suburban environments with diverse architectural structures and heating systems. The locations were selected based on known high-emission areas identified in regional air quality reports.
This study extends the previous dataset [6] by incorporating additional winter-time sequences, specifically addressing limitations related to snow-covered rooftops. The new recordings include UAV flights under various environmental conditions, such as
- Clear sky and overcast conditions—assessing visibility under different lighting;
- Temperature range from −10 °C to 15 °C—accounting for seasonal variations;
- Wind speeds up to approximately 10 m/s (gusts)—reflecting real-world variability while remaining within UAV operational limits;
- Snow-covered rooftops—included in the dataset to ensure the YOLO model can recognize rooftops under winter conditions.
- UAV Platforms and Flight Parameters
The UAV platforms and flight parameters used in this study align with those in [6], with additional refinements to expand dataset diversity. All UAV models used in this study were manufactured by DJI (Shenzhen, China). The key UAV models employed include
- DJI Mavic Air;
- DJI Mavic 2 Enterprise Dual—thermal imaging capabilities (not used in this work);
- DJI Air 2S—improved low-light performance;
- DJI Mini 4 Pro—lightweight, sub-250 g UAV for regulatory flexibility.
To improve robustness, the dataset incorporates oblique-view images (approx. 60° tilt angle) in addition to standard nadir (90°) recordings. This variation allows for a more comprehensive analysis of detection performance across different observation angles.
While different UAV platforms introduced minor variations in imaging characteristics, their impact on detection performance was limited. Differences in effective focal length influenced the coverage area per frame but did not significantly affect the final results. Variations in dynamic range and color representation across UAV models contributed to dataset diversity but did not disrupt the automated dataset generation process. However, stabilization performance varied between platforms, particularly in stronger wind conditions, where the smallest UAV (DJI Mini 4 Pro) exhibited occasional instability. Newer devices, such as the DJI Air 2S and DJI Mini 4 Pro, demonstrated superior low-light performance, enhancing detection reliability in suboptimal lighting conditions.
- Flight Parameters and Stability Considerations
Most flights were conducted at altitudes ranging from 100 to 120 m AGL, ensuring a sufficient field of view while minimizing privacy concerns. Lower flight altitudes (around 100 m and occasionally below) were used only in areas with local airspace restrictions. The maximum altitude was constrained by EU regulations, preventing flights above 120 m.
Wind conditions varied naturally, with most recordings taking place under moderate wind speeds (up to 5–6 m/s). While stronger gusts occasionally occurred, UAV stability was generally sufficient for image acquisition, except for the minor instability observed with the smallest UAV.
To enhance video stability, the dataset includes additional digital stabilization using the Enhanced Correlation Coefficient Maximization (ECC) algorithm [31]. This post-processing step minimizes motion artifacts caused by UAV drift, improving detection robustness.
These refinements ensure that the dataset remains representative of real-world operational conditions, accounting for variations in UAV platforms, imaging characteristics, and flight stability.
2.2.1. Dataset Components
The dataset preparation process is structured into three distinct components, each tailored to specific stages of model development and evaluation:
- Input Dataset:
Stabilized video sequences from stationary UAV recordings form the foundation of the pipeline, which is designed to generate training and validation datasets for the YOLO-based detector. While the onboard gimbal and drone stabilization systems mitigate minor movements during data acquisition, these measures are insufficient under windy conditions. To address this, an additional step of digital stabilization using the Enhanced Correlation Coefficient Maximization (ECC) algorithm [31] was applied. This stabilization ensures the precise alignment of frames, allowing the subsequent motion detection algorithms to function reliably.
The dataset consists of 634 stabilized video sequences, each with an average duration of approximately 10 s. Most sequences were recorded in 4 K resolution at 30 frames per second (4 K@30 Hz), providing high spatial and temporal resolution essential for accurate motion detection and object localization. The stabilized sequences encompass a diverse range of environmental conditions, including both nadir and oblique perspectives, as well as winter and non-winter scenarios. This ensures that the training and validation datasets accurately represent the variety of challenges faced in real-world applications.
All video sequences were processed through the pipeline to automatically generate comprehensive annotations, resulting in robust datasets for model development. These annotations serve as the foundation for the subsequent stages of the smoke detection pipeline.
- 2.
- Test Dataset:
To evaluate the final YOLO-based detector, a test dataset was created using manually annotated static images captured during UAV flights. These images encompass diverse environmental conditions, times of day, and perspectives, offering a robust basis for evaluating model performance. While the annotations were initially supported by an earlier version of the classifier, every bounding box was thoroughly verified by human annotators to ensure high-quality labels. However, as manual annotation is inherently subjective, there is a possibility of missed subtle smoke regions. The test dataset currently consists of 1019 high-resolution images, of which 863 contain at least 1 annotated smoke region, totaling 1215 ground-truth annotations.
- 3.
- Qualitative Validation Data:
For qualitative validation, dynamic video sequences were recorded during drone flights to observe the detector’s real-world performance. These sequences allow for visual assessments of how the YOLO-based detector performs in varying conditions, such as changing lighting, complex backgrounds, and different altitudes. While the quantitative analysis of these sequences is challenging due to the absence of consistent ground-truth annotations, qualitative evaluation offers valuable insights into the strengths and limitations of the model in operational scenarios.
Dataset Availability
The dataset containing input and test components is publicly available at Dataset Repository (OneDrive) (https://polslpl-my.sharepoint.com/:f:/g/personal/mszczepanski_polsl_pl/EoQ3DvKl9t5GjBeCmllD2dgBK29t-kO1s1DH-GR4UFuIJg?e=45shSE, accessed on 30 January 2025) for further research and replication. By providing open access to these resources, this study aims to encourage further advancements in low-emission smoke detection methodologies.
To ensure high-quality training data, the dataset was generated using an automated pipeline designed to minimize annotation inconsistencies and improve detection robustness. The following section details this process.
2.3. Automated Dataset Generation for Smoke Detection from Stationary UAV Sequences
Accurate smoke detection requires a well-annotated dataset that captures the variability of environmental conditions while minimizing labeling inconsistencies. Manual annotation, although effective for small datasets, is impractical for large-scale UAV footage, necessitating an automated pipeline to generate training data efficiently.
The dataset generation pipeline in this study extends our previous work [6] by improving annotation quality through an additional classification step. While the core structure remains unchanged, a LightGBM-based classifier has been introduced to refine the dataset by filtering out false positives. This enhancement significantly reduces annotation noise and ensures that only genuine smoke regions contribute to the final training set, improving the overall reliability of the detection model.
The pipeline consists of three key stages:
- Motion Detection: Temporal changes between video frames are analyzed to identify regions of interest (ROIs) that may contain smoke. This step serves as the initial filter, capturing moving elements that could potentially correspond to chimney emissions.
- Rooftop Localization: A pre-trained YOLO model is used to constrain the search space, ensuring that only motion regions appearing above rooftops are considered as potential smoke emissions. This significantly reduces false positives caused by moving objects such as vehicles, pedestrians, or vegetation.
- Binary Classification (new in this study): The final refinement stage introduces a LightGBM-based classifier that differentiates true smoke regions from other moving elements. This additional step enhances dataset accuracy, particularly in challenging conditions where motion-based and rooftop-based filtering alone are insufficient.
Motion detection and rooftop localization methods were originally selected in [6] based on their balance between computational efficiency and detection reliability. This study focuses on evaluating their performance in an expanded dataset while improving annotation quality through the classification stage. A schematic of the processing pipeline is shown in Figure 3, and the following sections describe each processing stage in detail, including refinements introduced in this work.
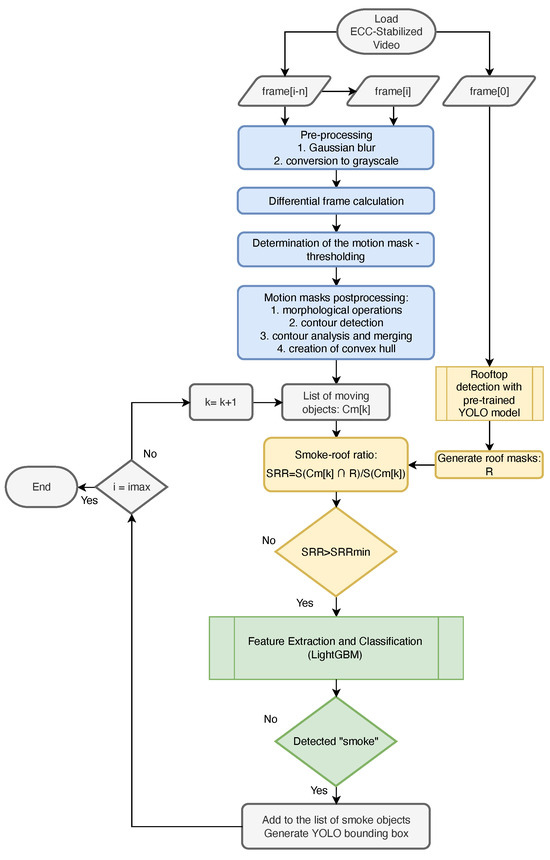
Figure 3.
Block diagram of the updated smoke detection pipeline, including motion detection, rooftop localization, and classification using LightGBM for enhanced accuracy in identifying low-emission smoke in video sequences.
2.3.1. Motion Detection and Initial Region Segmentation
The first stage of the pipeline, represented by the blue-highlighted blocks in Figure 3, involves detecting motion within stabilized video sequences. Due to the relatively slow dynamics of smoke, even under windy conditions, temporal gradients are calculated over a larger time window ( frames) to better capture subtle motion.
The selection of a 10-frame window was based on empirical observations of smoke dispersion, which occurs gradually compared to fast-moving objects such as vehicles or pedestrians. Shorter temporal windows proved insufficient for reliable detection, while longer ones increased computational complexity without noticeable improvements. The chosen value provides a balance between motion sensitivity and false positive reduction.
Motion detection and initial segmentation are key to isolating candidate smoke regions before applying additional filtering. This stage follows the method used in the original pipeline [6], which effectively captures slow-moving smoke while suppressing small, fast-moving objects. Below, we briefly describe the preprocessing, thresholding, and segmentation steps.
Preprocessing and Motion Mask Generation
The preprocessing steps enhance motion detection by reducing noise and highlighting temporal changes that are characteristic of smoke. The selected parameters were determined empirically based on dataset characteristics, such as image resolution and the expected scale of moving objects.
- Noise Reduction: Gaussian blurring () is applied to suppress high-frequency noise and reduce sensitivity to small, fast-moving elements (e.g., leaves, insects, or airborne debris). The kernel size was selected to balance noise suppression while preserving motion edges.
- Temporal Gradient Computation: Motion is detected by computing the absolute difference between luminance values of frames separated by n intervals:where , , and are the RGB channels of frame i. The temporal gradient is then calculated as
Thresholding and Morphological Processing
- Adaptive Thresholding: The temporal gradient images are binarized using adaptive thresholding:where represents a Gaussian smoothing operator () and is a subtraction factor. These parameters were selected based on empirical evaluation to ensure robust segmentation while minimizing noise-induced artifacts.
- Morphological Refinement and Contour Analysis: To improve the segmentation of motion regions:
- -
- Morphological operations (erosion and dilation) are applied using disk-shaped structuring elements to remove noise and fill small gaps:
- -
- Contour detection and filtering remove small or overly large regions. Adjacent contours are merged based on their proximity, and convex hulls are computed to ensure consistent motion masks.
Morphological operation parameters were chosen to match the expected sizes of smoke regions while preventing the excessive merging of independent detections. Empirical tuning ensured that the process was effective across different environmental conditions.
This process results in a set of coherent motion masks that accurately represent candidate regions for further processing.
2.3.2. Rooftop Localization
Given the objective of detecting smoke originating from residential chimneys, it is essential to localize rooftop areas in the video frames. For this purpose, a pre-trained YOLOv7 model [32], developed and fine-tuned in our earlier work [6], was employed to detect rooftops. The model was fine-tuned using a custom dataset of aerial images, ensuring the accurate localization of roofs under diverse conditions.
To determine whether a motion region overlaps significantly with a rooftop, a Smoke over Rooftop (SoR) index is calculated as follows:
where represents the area of a region, is the k-th motion region, and R denotes the rooftop region detected by YOLOv7. Only motion regions where are retained as potential smoke regions, meaning that at least 10% of the detected motion region must overlap with a rooftop area.
While this threshold helps retain valid chimney smoke detections near roof edges, it does not fully eliminate the inherent limitations of bounding box annotations. Complex roof geometries, partial occlusions (e.g., from trees or other structures), and inaccuracies in bounding box placement can still introduce false positives. These challenges arise regardless of the specific SoR threshold value, as they are a fundamental limitation of rectangular bounding boxes. To mitigate these issues, a classification step (Section 2.3.3) was introduced to refine detections by filtering non-smoke motion regions.
To optimize computational efficiency, rooftop detection is performed for a single frame per video sequence. Results are stored and reused across all processing stages, eliminating the need for repetitive calculations during runtime. By leveraging pre-computed rooftop masks, the pipeline ensures efficient and streamlined processing.
In the block diagram of the processing pipeline (Figure 3), the rooftop localization steps are highlighted in yellow, illustrating their role as a crucial filtering stage between motion detection and subsequent classification.
2.3.3. Binary Classification of Smoke Regions
Motivation and Input Data
The integration of a binary classifier into the detection pipeline addresses the key challenges identified during the development of earlier versions of the algorithm. The primary stages of this pipeline are presented in Figure 4, illustrating the flow from motion detection to rooftop localization and final smoke detection. While the detection of rooftops using the YOLOv7 model is effective in most scenarios, certain edge cases result in incorrect detections, leading to false positives. These edge cases arise due to issues such as irregular rooftop shapes, motion of dynamic objects within rooftop regions, and the inherent limitations of bounding box-based methods.
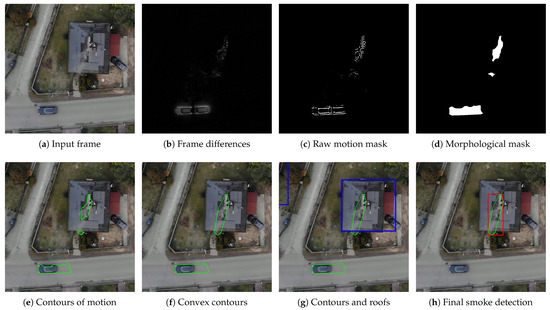
Figure 4.
Key stages of the smoke detection pipeline, illustrating the transformation from input frames to the final detection of smoke regions.
Many rooftops cannot be accurately represented with a rectangular bounding box (BB). For instance, rooftops with irregular shapes, such as “L” or “U”, or those oriented obliquely relative to the image axes, often result in bounding boxes that include large non-rooftop areas, such as streets, sidewalks, or lawns. This can lead to the incorrect inclusion of unrelated objects in the training dataset as smoke, ultimately affecting the performance of the YOLO-based detector.
Additionally, moving elements within detected rooftop regions—such as people working on roofs, birds flying overhead, or branches swayed by the wind—are occasionally misclassified as smoke regions. These cases pose significant challenges due to their motion patterns and occasional resemblance to smoke.
Even with advanced methods, such as oriented bounding boxes (OBBs) or precise rooftop segmentation, certain issues remain. Dynamic objects genuinely located on rooftops, such as workers or debris, can still cause false positives. Moreover, achieving perfect segmentation introduces significant complexity and computational cost, making it impractical for large-scale applications.
The examples of these challenging scenarios are presented in Figure 5. The figure highlights various types of false positives caused by the limitations of the original approach, such as misaligned bounding boxes, complex roof shapes, and dynamic objects within rooftop areas.
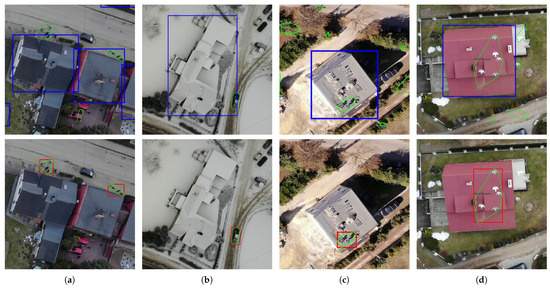
Figure 5.
Examples of challenging scenarios for the rooftop detection and smoke classification pipeline. Each column represents a specific challenge: (a) misaligned bounding boxes, (b) complex roof shapes, (c) people working on rooftops, and (d) birds flying over rooftops. The top row shows regions of motion contours overlaid with detected rooftop bounding boxes, while the bottom row illustrates regions incorrectly classified as smoke. All images are cropped from larger video frames to focus on relevant areas.
To mitigate these issues, a binary classifier was introduced to refine the annotations. This classifier leverages input data derived from cropped regions of video frames. Each region corresponds to a motion mask detected within rooftop bounding boxes. The available input data include the following:
- RGB frames: Cropped fragments of the original stabilized video frames, providing detailed color and texture information. These images represent the detected motion regions and serve as the primary visual context for classification.
- Difference frames: Temporal gradients computed over a window of 10 frames, highlighting motion dynamics within the detected regions. These frames emphasize changes over time, making them useful for identifying smoke’s characteristic movement patterns.
- “Precise” masks: Binary masks obtained through morphological processing, representing refined motion regions. These masks help isolate detected motion regions, such as smoke or other moving objects like cars, from the background. This enables a more focused evaluation of features such as saturation or hue, reducing the influence of irrelevant areas.
- Convex contour masks: Binary masks representing convex hulls of detected motion regions, providing a smoothed and generalized approximation of object shapes. Similar to “precise” masks, these masks can be used to constrain feature extraction to relevant areas. Their simplified shape makes them particularly useful for reducing noise introduced by irregular or fragmented motion contours.
Both types of masks, “precise” and convex contours, aim to limit feature extraction to motion regions while excluding irrelevant background information. By focusing on motion areas, they help evaluate properties directly related to the detected objects, such as color or texture. However, due to their limited precision and the variability they introduce, these masks were ultimately not used for feature extraction in the final implementation of the classifier.
The dataset used for training and validating the binary classifier consists of manually labeled samples divided into two categories: “smoke” and “non-smoke”. The training dataset contains a total of 4127 samples, with 2485 samples categorized as “smoke” and 1642 as “non-smoke”. To further evaluate the classifier’s performance during training, a separate validation dataset was prepared, consisting of 774 samples: 389 “smoke” and 385 “non-smoke”.
To ensure balanced representation and enhance robustness, additional non-smoke samples were included from areas outside detected rooftops. Moreover, the objects in the validation set were randomly sampled from video sequences that were not used during the training phase. This approach reduces the risk of overfitting and provides a more realistic evaluation of the classifier’s performance.
These input data represent different aspects of detected motion regions, enabling the classifier to leverage both spatial and dynamic features for improved discrimination. The data correspond to stages of the pipeline depicted in Figure 4 and Figure 5, illustrating both general processing and specific challenging cases. Importantly, these data are derived from the motion detection and rooftop localization stages, allowing for straightforward integration into the pipeline. An example of input data for smoke and non-smoke regions is shown in Figure 6.
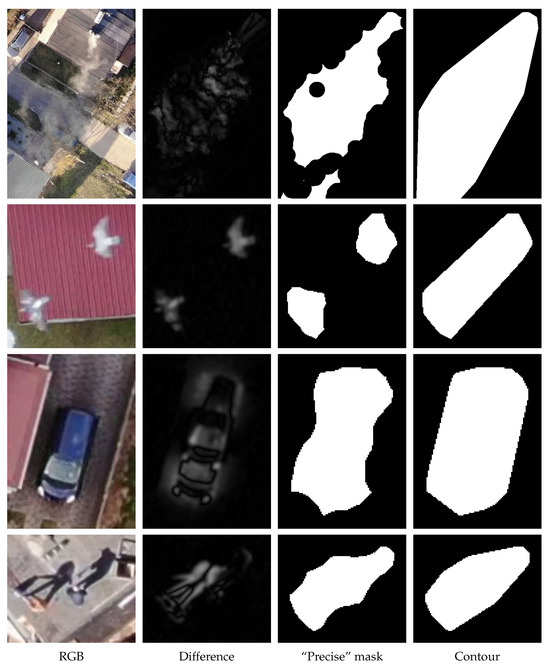
Figure 6.
Examples of input data used for the binary classification of smoke and non-smoke regions. Each row represents a distinct case: (top row) smoke, (second row) birds, (third row) car, (bottom row) people. The columns depict (1) cropped RGB fragments from input frames, (2) frame differences, (3) processed masks (after morphological operations), and (4) convex contour masks. This dataset was manually divided into two classes: smoke and non-smoke, providing the foundation for feature extraction and subsequent classification.
Feature Selection: Initial Set of Features
Regardless of the choice of classifier, an essential step in the classification process is the identification of features that effectively differentiate between smoke and non-smoke objects. Appropriate features should not only describe the relevant characteristics of smoke but also enable unambiguous classification.
The performance of a binary classifier heavily relies on the discriminative power of the features used for classification. In this work, features were extracted from the input data described in the previous section. The primary goal was to identify a subset of features capable of distinguishing between smoke and non-smoke regions with high accuracy, while minimizing computational complexity.
In the data available for classification, we possess both visual information from RGB frames and temporal data in the form of difference frames, which capture motion dynamics. To describe these data, various features tailored to the type of input were evaluated. For example, smoke in RGB images often causes a noticeable reduction in saturation and sharpness, while in the temporal domain, it exhibits characteristic patterns and textures (often resembling ripples). Similarly, objects in the non-smoke class, such as cars, trees, and bushes, present distinct visual and motion characteristics. For instance, cars often have saturated colors in RGB frames, while trees and bushes may appear green or yellow. Furthermore, many non-smoke objects display distinctive motion patterns. Figure 6 illustrates examples of such input data for both smoke and non-smoke classes.
Considering the characteristics of the input dataset, an initial set of features was proposed, which was subsequently tested and reduced. Some features are applicable to both visual and temporal domains, while others are specific to RGB information. The evaluated features include the following:
- GLCM-Based Features: Gray-Level Co-occurrence Matrix (GLCM) features, such as contrast and correlation, were computed for multiple directions and distances, capturing textural properties from difference and spatial frames.
- Entropy: Shannon entropy, a measure of randomness or complexity, was calculated for both RGB and difference frames, capturing variations within the regions.
- Blur Effect: A Laplacian-based metric was used to quantify blur of spatial or temporal frames.
- Statistical Measures: Mean and standard deviation of pixel intensities were extracted from both RGB and difference frames to capture basic statistical properties of the regions.
- Color Properties: Mean hue and saturation values were derived from RGB frames, capturing the dominant color characteristics of the regions.
- Mask-Based Features: Binary masks derived from motion regions (“precise” and convex contour variants) were initially considered to constrain feature extraction to the areas of detected motion. However, preliminary tests showed no significant improvement in classification performance, and these features were not included in the final model.
Each of these features was carefully selected based on its potential to discriminate between smoke and non-smoke regions. Their relevance and impact on classification performance were subsequently evaluated, forming the foundation for the final model.
Classifier Selection
The original version of the algorithm employed the Smoke over Rooftop (SoR) coefficient as a heuristic for classifying motion regions as smoke or non-smoke. While this approach provided reasonable performance in many scenarios, it exhibited notable limitations, particularly in cases involving imprecise rooftop segmentation or complex scenes with non-smoke objects, such as people, birds, or vegetation. These challenges highlighted the need for a more robust and adaptable solution.
To address these limitations, a classical binary classifier was introduced into the pipeline as an additional component to improve decision-making. The selected classifier is LightGBM [30], a state-of-the-art gradient boosting framework. LightGBM was chosen for its advantages, which include the following:
- Efficiency: LightGBM achieves fast training and inference times, making it suitable for iterative model development and potential real-time applications.
- Memory usage: The algorithm is optimized for low memory consumption, enabling scalability for larger datasets without excessive computational overhead.
- Accuracy: Gradient boosting is well suited for capturing complex feature interactions, leading to high predictive performance in tasks requiring nuanced decision-making.
LightGBM’s suitability for this application stems from its ability to handle datasets with high-dimensional features while maintaining computational efficiency. This makes it an ideal choice for integrating into the smoke detection pipeline, where rapid and accurate decision-making is critical. The following sections describe the feature extraction process and the training of the binary classifier in detail.
Threshold Optimization for Binary Classification
Binary classifiers often produce probabilities as output, representing the likelihood that a given sample belongs to a particular class. To convert these probabilities into definitive class labels, a threshold () must be defined. While the default threshold of 0.5 is commonly used, it may not yield optimal results for specific applications. In the context of smoke detection, tuning was crucial to achieving a desirable balance between minimizing false positives (FPs) and maintaining high recall for detecting smoke regions.
The threshold selection process is demonstrated using two different feature sets described later in this work: the full feature set (SET1) and the final reduced feature set (SET4).
Figure 7 presents the results of this analysis. Panels (a) and (b) illustrate the impact of varying on accuracy, precision, and false positives for the full feature set (SET1). Panels (c) and (d) provide the same analysis for the final reduced feature set (SET4). For both configurations, higher threshold values () substantially reduce false positives but at the cost of recall, as indicated by a drop in precision and accuracy at extreme values.
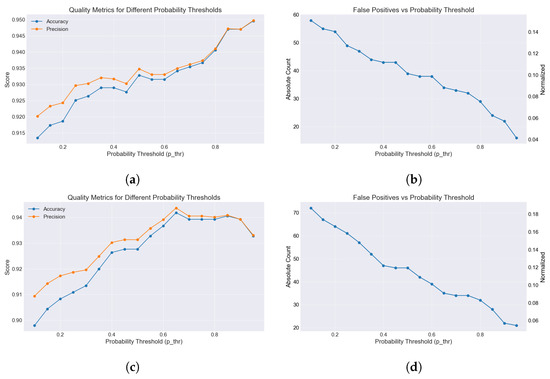
Figure 7.
Threshold analysis results for the binary classifier. Panels (a,b) show results for the full feature set, while panels (c,d) illustrate results for the final reduced feature set (SET4). The analysis demonstrates the trade-offs between accuracy, precision, and false positives across different thresholds.
While a threshold of minimizes false positives most effectively for both sets, it introduces a higher risk of false negatives, potentially missing critical smoke regions. Conversely, the default threshold () leads to a greater number of false positives, which could undermine the pipeline’s reliability. This trade-off is particularly evident in the confusion matrices (Figure 8), which show the classification outcomes for different thresholds for SET1. Additional analyses for SET4 showed similar trends, confirming the robustness of the selected threshold across both feature configurations.
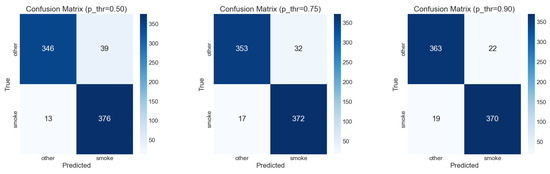
Figure 8.
Confusion matrices for the binary classifier at different decision thresholds (): (left) , (center) , and (right) . Higher thresholds reduce false positives but may lead to lower recall.
After analyzing these results, a conservative threshold of was selected as the optimal value for both feature sets. This decision balances reducing false positives while ensuring that genuine smoke regions are not missed. The consistency of this threshold across SET1 and SET4 demonstrates its robustness, regardless of the feature configuration used.
Feature Importance and Final Feature Selection
To optimize the performance of the LightGBM classifier, a feature importance analysis was conducted. Feature importance, as determined by LightGBM, measures the contribution of each feature to the predictive performance of the model. This analysis helps identify the most impactful features, eliminate redundant or less informative ones, and simplify the model to improve generalization and computational efficiency.
Analyzing the feature importance plot (Figure 9), it is evident that features derived from the analysis of difference frames (indicated by the _D segment within their names) dominate among the most important features. These include various GLCM-based textural features, as well as other measures extracted specifically from the temporal domain. Meanwhile, the most discriminative features overall are derived from RGB frames. Examples include Blur, Mean_Hue (calculated for regions with saturation ), and Mean_Saturation. Other notable features influencing the classifier’s performance are Shannon entropy and the standard deviation of pixel intensities. These features collectively capture essential spatial and dynamic characteristics, effectively distinguishing between smoke and non-smoke regions.
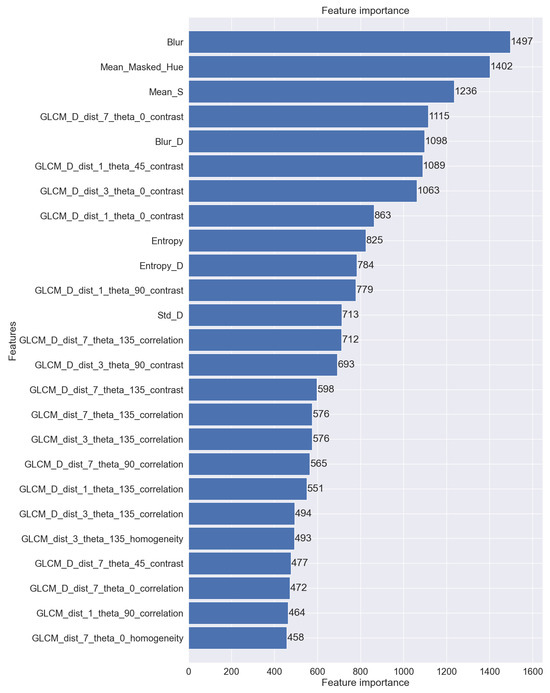
Figure 9.
Feature importance scores for the top 25 features based on the initial feature set. The LightGBM classifier highlights the most discriminative features for distinguishing smoke from non-smoke regions.
To address the limited contribution of GLCM features computed from spatial data, these features were excluded, leaving only GLCM features derived from difference frames. This reduction emphasizes temporal dynamics, which provide more meaningful patterns for identifying smoke. Restricting GLCM features to difference frames caused slight shifts in the importance ranking of the remaining features, as shown in Figure 10, where the dominance of temporal features became more pronounced.
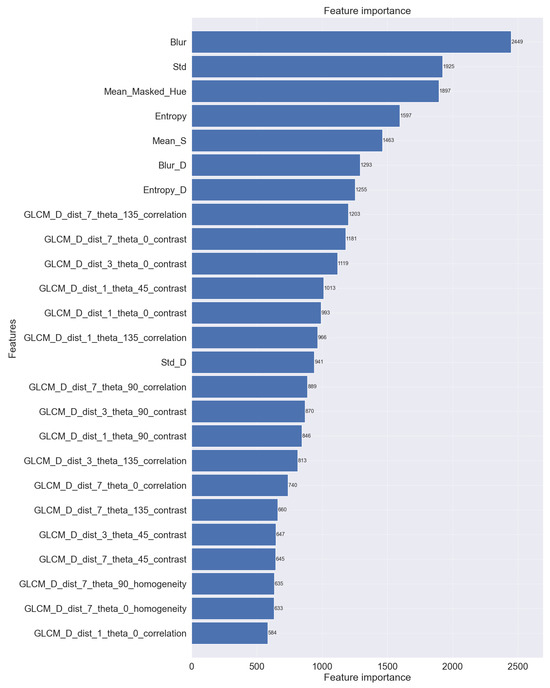
Figure 10.
Feature importance ranking after excluding GLCM features computed from RGB images. The ranking highlights the dominant role of GLCM features computed from difference frames, along with other key features such as blur and mean hue.
In the refined ranking (Figure 10), features such as Blur, Mean_Hue, and Mean_Saturation remain prominent, while several temporal features, including GLCM-based metrics, continue to play a significant role in classification. Further analyses of individual GLCM features derived from difference frames revealed that only two, namely contrast and correlation, consistently showed substantial impact. These two features were retained in the final feature set to strike a balance between classification performance and computational efficiency.
To evaluate the impact of feature reduction, four distinct feature sets were compared:
- SET1: All Features—Includes the complete set of features extracted from both RGB frames and difference frames. While this set achieves high accuracy (0.94) and precision (0.94), it also generates a relatively higher number of false positives (32).
- SET2: No Spatial GLCM—Excludes GLCM features derived from RGB frames, retaining only those from difference frames. Although precision slightly improves (0.94), accuracy remains almost unchanged (0.94) and the number of false positives increases slightly (36).
- SET3: Minimal Set Without GLCM—Removes all GLCM features, leading to a noticeable decline in accuracy (0.88) and precision (0.88), with false positives increasing to 46.
- SET4: Optimal Feature Set—Retains all features from RGB frames while removing spatial GLCM features and limiting GLCM features from difference frames to the two most impactful ones (contrast and correlation). This configuration achieves a balanced trade-off, maintaining accuracy (0.94) and precision (0.94) while slightly reducing the number of false positives (34).
The results, visualized in Figure 11, illustrate the trade-offs between accuracy, precision, and the number of false positives across different feature sets. Removing spatial GLCM features (SET2) reduced false positives without compromising performance, but excluding all GLCM features (SET3) caused a noticeable drop in accuracy and precision. The final feature set (SET4) strikes a balance by retaining both key RGB features and the most impactful temporal GLCM features.
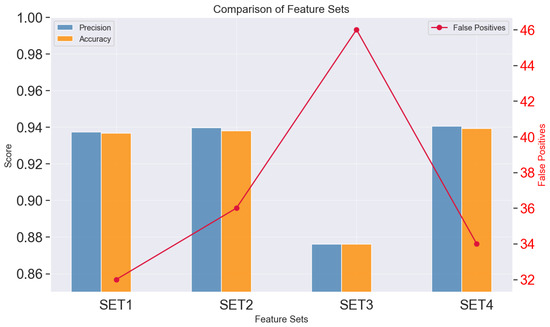
Figure 11.
Comparison of classification performance across different feature sets. Accuracy and precision are displayed on the left y-axis, while the number of false positives is presented on the right y-axis. The selected feature set (SET4) balances high classification quality with a minimal number of false positives.
In conclusion, the final feature set effectively balances classification quality with computational efficiency. By retaining only the most impactful features, SET4 ensures robust classification performance while minimizing false positives and computational overhead.
2.4. Final Dataset Preparation
The finalized dataset for the training and validation of the YOLO-based detector was constructed from the stabilized video sequences described earlier. It consists of 634 sequences, each approximately 10 s long, recorded at 4K resolution (30 Hz). The stabilization and preprocessing pipeline generated bounding box annotations for smoke and non-smoke regions. The dataset was split into training and validation subsets using an 80:20 ratio, ensuring sufficient data for training while maintaining robust evaluation capabilities. An independent test dataset, described in Section 2.2.1, is used for final model validation to ensure unbiased performance assessment.
2.4.1. Evaluation Datasets
To assess the impact of different components of the pipeline, three distinct datasets were prepared:
- Dataset 1: Baseline (Without Classifier)—This dataset corresponds to the configuration used in previous work [6], relying solely on motion detection and rooftop localization without the binary classifier. While the expanded input dataset includes new winter and oblique sequences, annotations were generated using the unrefined pipeline.
- Dataset 2: Optimized Pipeline (With Classifier, SET4, )—This dataset incorporates the binary classifier with the optimized feature set (SET4) and decision threshold . The classifier enhances annotation quality by filtering out false positives, particularly non-smoke motion regions, significantly improving dataset reliability.
- Dataset 3: Classifier Without Rooftop Verification—This configuration applies the binary classifier to all detected motion regions, bypassing the rooftop localization step. The dataset serves to analyze the contribution of rooftop verification to dataset quality and model performance.
Dataset Statistics
The dataset includes a total of 21,186 frames, with 16,948 frames allocated for training and 4238 frames reserved for validation. Each frame contains multiple annotations representing detected smoke and non-smoke regions. The dataset was processed under three configurations to evaluate the impact of different pipeline components on dataset quality and detector performance. A summary of the dataset statistics for each configuration is presented in Table 1.

Table 1.
Summary of dataset statistics for training and validation across different configurations.
2.5. YOLO Training Configuration
To build the final smoke detection model, we utilized the YOLOv8 framework with two base YOLO11 model configurations: nano (yolo11n) and small (yolo11s). These smaller models were selected to ensure potential real-time application capability while maintaining satisfactory detection performance.
Most hyperparameters, including optimizer settings and anchor box configurations, were left at their default values as provided in the YOLOv8 framework. The batch size was set dynamically (batch = 0.8), allowing the training process to adjust based on available GPU memory. This ensured optimal memory utilization without requiring manual adjustment.
Several modifications were introduced to better suit the characteristics of the dataset:
- Image Size: The input image resolution was set to pixels. This adjustment was necessary due to the small size of the smoke regions, as smaller resolutions () significantly degraded detection quality.
- Augmentations: Despite the high variability inherent to the training dataset, additional augmentations were applied. These included random rotations within and scaling by , both of which further improved the detector’s performance.
To prevent overfitting, training relied primarily on dataset augmentation and the use of an independent test set for evaluation. No explicit dropout or weight regularization techniques were applied beyond the default YOLOv8 settings.
Training was conducted over 100 epochs on a Palit NVIDIA RTX 4070 Ti SUPER GPU with 16 GB of VRAM (Palit Microsystems Ltd., New Taipei City, Taiwan). The nano model required approximately 7 h, while the small model completed training in 11 h. The progression of key training metrics for the nano model trained on Dataset 2 (Classifier SET4) is illustrated in Figure 12, showcasing the steady improvement in precision, recall, mAP@0.5, and mAP@0.5:0.9 across epochs.
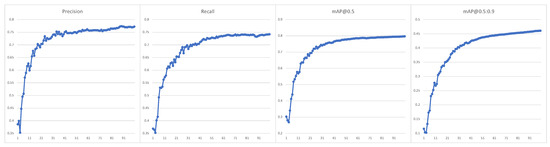
Figure 12.
Training progression for the YOLOv11-nano model using Dataset 2 (Classifier SET4). The figure illustrates key metrics: precision, recall, mAP@0.5, and mAP@0.5:0.9 across 100 epochs, showing the model’s convergence during training.
3. Results
3.1. Evaluation Setup
The goal of this evaluation is to assess the impact of different components of the dataset generation pipeline on the performance of the final smoke detection model. In particular, we analyze how the introduction of a classification step and modifications to the rooftop constraint affect detection accuracy and false positive rates.
To achieve this, we compare three versions of the YOLO-based smoke detector, each trained on a dataset generated using a different pipeline configuration:
- YOLO-Base—The baseline model, trained on Dataset 1, which relies solely on motion-based annotations without additional filtering. This dataset was generated using the original pipeline approach from [6] and serves as a reference point for evaluating the impact of the proposed modifications.
- YOLO-Class—The improved version, trained on Dataset 2, which incorporates a LightGBM-based classifier to filter out non-smoke objects and improve annotation quality. Motion regions are constrained to rooftops to focus on residential emissions, aligning with the intended application of the detector.
- YOLO-NoRoof—A classifier-based model trained on Dataset 3, where the rooftop constraint is removed, allowing the binary classifier to process all detected motion regions. This configuration enables the detection of a broader range of smoke sources, such as bonfires and industrial emissions.
The baseline model (YOLO-Base) provides a direct comparison to the previous approach [6], allowing us to measure the impact of the proposed enhancements.
In our experiments, each model was tested in two configurations: nano (‘_n’) and small (‘_s’). YOLOv11-nano is optimized for real-time applications, offering a lightweight architecture, while YOLOv11-small provides higher accuracy at the cost of increased computational requirements. All models were trained using transfer learning from YOLOv11 base models.
This section evaluates the performance of the proposed smoke detection pipeline in three stages. First, we assess model performance on automatically annotated training and validation datasets, comparing results across different dataset configurations. Second, we conduct an independent evaluation on a manually annotated test dataset, covering diverse environmental conditions, times of day, and perspectives. Finally, we present a qualitative assessment, illustrating model predictions in real-world scenarios, including challenging cases.
3.2. Validation Using Automatically Annotated Datasets
Table 2 presents the validation metrics for YOLOv11-nano and YOLOv11-small models trained on three dataset configurations. The datasets refined using the classifier (YOLO-Class) produced significantly higher-quality annotations, leading to notable improvements in precision, recall, and mAP for both model sizes.
Table 2.
Training performance of YOLO models across different dataset configurations.
The results demonstrate that the nano variant offers a lightweight solution suitable for real-time applications, whereas the small variant achieves higher detection accuracy at the cost of increased computational complexity. Models trained on YOLO-NoRoof show an increase in false positives due to the absence of the rooftop verification step, resulting in lower precision scores. However, this configuration allows for broader generalization to smoke sources beyond residential heating.
Given the nature of smoke regions, which are often irregular and fragmented, annotation inconsistencies are expected. Smoke plumes can be detected as multiple overlapping or partially connected bounding boxes rather than a single continuous region. To account for this, the IoU threshold in the Non-Maximum Suppression (NMS) step was set to 0.1, allowing the model to retain more detections in cases where smoke plumes exhibit internal variations. Additionally, evaluation metrics were computed using a custom approach with varying IoU thresholds for determining true positives, providing a more flexible assessment of detection performance.
Since standard evaluation methods may not fully capture the challenges of detecting diffuse and dynamically changing smoke plumes, we employed a custom precision–recall computation. This method assigns matches to ground-truth annotations based solely on the selected IoU threshold, without additional filtering mechanisms such as Non-Maximum Suppression (NMS). This results in higher performance metrics compared to those reported by the YOLO framework. However, to ensure consistency, the same evaluation procedure was applied across all tested models.
For mean Average Precision (mAP) calculations, we utilized the standard YOLOv8 evaluation pipeline, computing both mAP@0.5 and mAP@0.5:0.9. Since mAP is derived from multiple precision–recall curves at different confidence thresholds, it is not directly comparable to our custom precision and recall metrics, which use fixed IoU and confidence values. Nevertheless, mAP results provide a complementary measure of model performance across a range of detection thresholds.
Since the validation dataset is automatically labeled using the same pipeline as the training dataset, the reported performance metrics primarily reflect the model’s consistency within this specific framework rather than its true generalization ability. A more objective evaluation is performed in the next section using an independent, manually annotated test set.
3.3. Model Evaluation on an Independent Test Set
To ensure an unbiased evaluation, the performance of the YOLOv11 models was assessed using an independent, manually annotated test dataset. As described in Section 2.2.1, the test set consists of 1019 high-resolution images, of which 863 contain at least 1 annotated smoke region, totaling 1215 ground-truth annotations.
The dataset includes images captured under diverse environmental conditions, lighting variations, and UAV perspectives, ensuring a robust evaluation of real-world performance. Each annotation was manually verified to maintain high-quality labels. However, due to the inherent subjectivity of manual labeling, particularly for subtle and diffuse smoke patterns, some smoke regions may have been missed.
Table 3 presents the evaluation metrics for the trained YOLO-Base, YOLO-Class, and YOLO-NoRoof models in two size variants (_n and _s), tested on the independent, manually annotated test set. The key performance indicators, including precision, recall, mAP@0.5, and mAP@0.5:0.9, are reported for each configuration.
Table 3.
Test performance of YOLO-based models across different dataset configurations.
These results complement the validation analysis, providing an unbiased assessment of how the models generalize to real-world data. As in the validation set, the YOLO-Class variant improves precision by filtering out false positives, while YOLO-NoRoof achieves comparable recall while detecting a broader range of smoke sources.
Since object detection performance is sensitive to the choice of the IoU threshold used to determine true positives, an additional evaluation was conducted using a lower threshold of IoU = 0.1. This setting allows for more lenient matching between predicted and ground-truth smoke regions, which better accounts for the ambiguity of diffuse smoke boundaries. The results of this evaluation are presented in Table 4.
Table 4.
Performance of YOLO-based models on the test dataset at IoU = 0.1.
The results indicate that using a lower IoU threshold significantly reduces the number of false negatives while slightly increasing false positives. This behavior is expected given the nature of smoke detection, where bounding box placement can be subjective and diffuse regions may not always align perfectly with model predictions.
Overall, these results demonstrate that the model’s performance is influenced by both the choice of IoU threshold and dataset configuration. The next section further analyzes these findings in the context of real-world applications.
The results confirm that lowering the IoU threshold reduces false negatives while causing only a slight increase in false positives. This effect aligns with the nature of smoke detection, where bounding boxes may not always align perfectly with the diffuse and irregular structure of smoke plumes. While the test dataset provides a quantitative assessment of model performance, real-world deployment requires an additional evaluation of temporal consistency in video sequences. The following section explores this aspect by analyzing the detector’s performance on dynamic inputs.
3.4. Qualitative Evaluation on the Test Set
While the previous sections provided a numerical evaluation of the models, this section presents a qualitative assessment of their performance on selected test set samples. The examples highlight typical detection challenges, including false positives, false negatives, and annotation inconsistencies, and illustrate how different dataset configurations influence the models’ ability to detect smoke.
Figure 13 presents an example of a false positive detection where the YOLO-Base model incorrectly classifies people as smoke. This issue arises due to the reliance on motion-based annotations during training, which may introduce unintended biases. In contrast, the classifier-enhanced YOLO-Class model successfully eliminates these false detections by refining the training annotations.
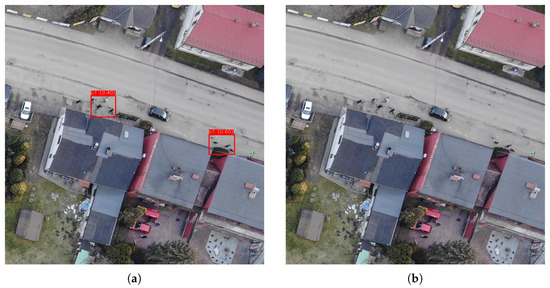
Figure 13.
False positives in YOLO-Base (a) misidentifying people as smoke, corrected in YOLO-Class (b).
Figure 14 highlights cases where the YOLO-NoRoof model, which does not restrict detections to rooftops, identifies smoke in broader contexts. In the first example, a small bonfire is detected as a smoke source. The YOLO-Class model does not detect this source, as bonfires were not included in the training dataset due to the rooftop-based constraint. Similarly, in the second case, a large smoke plume extends beyond the rooftop of a building. The YOLO-NoRoof model detects smoke even in regions that are not directly associated with buildings. In many cases, smoke from a single source disperses over a large area but does not form a continuous object. In the example shown, distinct plumes of smoke are visible, some of which are completely detached from rooftops. These structures exhibit the visual characteristics of smoke, yet they are not detected by the other models because similar patterns were excluded during training. This observation highlights an interesting property of the YOLO-NoRoof model: it has the potential to function as a general smoke detector. However, its effectiveness for broader use cases would require evaluation on an appropriate test dataset.
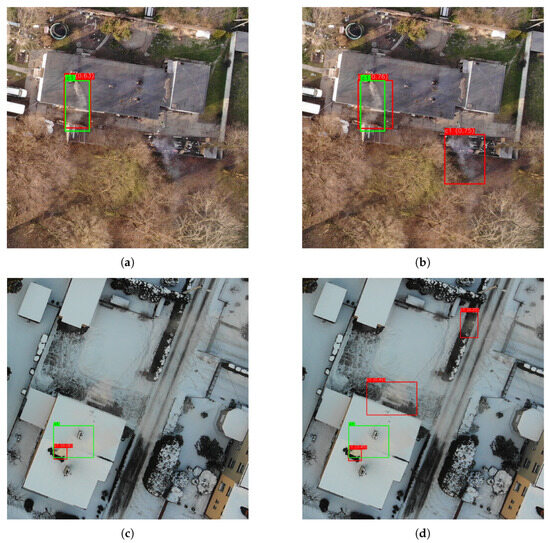
Figure 14.
Comparison of smoke detection capabilities: (a) the YOLO-Class model does not detect the bonfire; (b) the YOLO-NoRoof model correctly identifies it; (c) the YOLO-Class model detects only smoke above the roof; (d) the YOLO-NoRoof model also detects other visible smoke plumes. Detected objects are marked in red, while ground truth annotations are shown in green.
Figure 15 presents two additional cases illustrating the challenges of annotation consistency and detection errors. The first row shows an example where the YOLO-Base model detects both real smoke and false positives. The classifier-enhanced YOLO-Class model reduces these errors but also fails to detect some weaker smoke patterns. The second row shows a case where all models detected smoke, but the ground-truth annotations in the test set were missing, demonstrating an annotation inconsistency rather than a model error. Finally, the last case illustrates an issue with motion-based annotation under winter conditions, a common problem when snow-covered roofs minimize detectable movement, leading to missed detections in the training data.
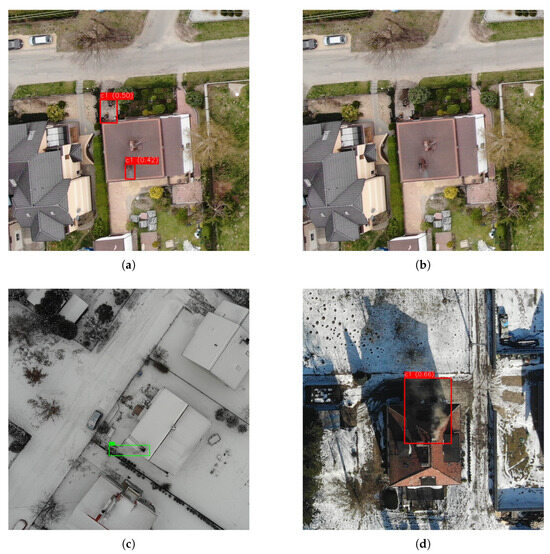
Figure 15.
Examples of false negatives and annotation inconsistencies: (a) false positives in YOLO-Base, (b) missed detections in YOLO-Class, (c) undetected smoke due to winter conditions, and (d) smoke detected by all models but missing ground-truth annotations.
3.5. Qualitative Validation on Video Sequences
In addition to the evaluation on static images, we analyzed the detector’s behavior in video sequences to assess its real-time performance and consistency across consecutive frames. The selected examples illustrate common challenges encountered in UAV-based smoke detection, including intermittent detections, viewpoint variations, and false positives.
This section focuses on presenting key detection challenges in video sequences rather than highlighting trivial detections or exhaustively searching for false negatives, which are undoubtedly present in various cases but can be difficult to identify without the aid of a detector. Some of the issues demonstrated here can be mitigated through appropriate post-processing techniques, improving overall detection stability and reliability in real-world applications.
3.5.1. Intermittent False Negatives in Video Sequences
Figure 16 presents examples of intermittent false negatives in UAV-based smoke detection. In the first case, captured from a nadir perspective, a secondary smoke source is occasionally missed due to its low contrast and blending with the background. Despite these omissions, the consistency of detections in adjacent frames suggests that simple interpolation techniques could effectively reconstruct the missing bounding boxes.
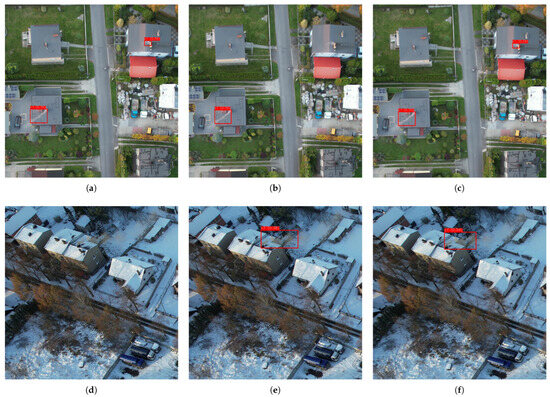
Figure 16.
Examples of intermittent false negatives in UAV-based smoke detection. The first sequence (a–c) shows a nadir view where a secondary smoke source is occasionally undetected but post-processing could interpolate the missing detections. The second sequence (d–f) illustrates a case where an oblique-view smoke plume is initially missed in the first frame but detected in subsequent ones.
In the second case, recorded from an oblique viewpoint, a distinct smoke plume is initially missed in the first frame but is correctly detected in the subsequent ones. This issue highlights the limitations of frame-by-frame detection, where minor variations in appearance or model confidence can cause isolated false negatives. Such cases can be mitigated through temporal post-processing techniques, improving stability in real-time applications.
3.5.2. Transient False Positives in Individual Frames
Although false positives were uncommon, they typically appeared in isolated frames rather than persisting throughout a sequence. Figure 17 presents an example where a chimney is momentarily misclassified as emitting smoke, despite the absence of visible emissions. Since these detections do not persist across consecutive frames, they could be effectively removed using a temporal filtering approach.
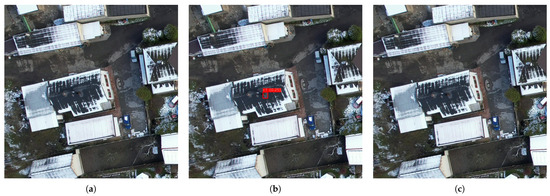
Figure 17.
Example of a transient false positive, where a chimney is mistakenly detected as emitting smoke in a single frame but not in subsequent ones. (a) Frame n: No smoke is detected. (b) Frame : A false positive detection of smoke near the chimney occurs. (c) Frame : No smoke is detected again, confirming the transient nature of the false detection.
3.5.3. Detection of Distant Smoke in Oblique Views
Figure 18 illustrates a case where the detector initially struggles to identify a distant smoke plume when viewed from a steep oblique angle. However, as the UAV moves closer, the detection confidence increases. This effect is likely due to the training dataset predominantly containing views at angles above 60°, which may limit generalization to lower oblique perspectives.
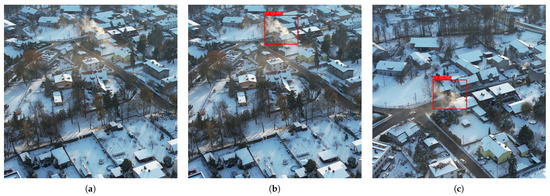
Figure 18.
Detection of distant smoke at an oblique angle. (a) Initially, the detector fails to recognize the plume. (b) As the UAV approaches, the detection confidence increases. (c) The plume is finally detected with higher confidence.
3.5.4. Summary of Video-Based Evaluation
The analysis of video sequences highlights the following key observations:
- Intermittent false negatives are primarily frame-dependent and can be mitigated through temporal interpolation.
- Smoke detection in oblique views generally improves as the UAV approaches the source, though steep angles remain challenging.
- False positives are infrequent and typically isolated, making them straightforward to filter.
- Winter conditions present challenges but do not significantly degrade performance in most cases.
These results demonstrate that the proposed detector is well suited for real-world applications, particularly when combined with basic post-processing techniques to enhance temporal consistency.
4. Discussion
The results of this study demonstrate the effectiveness of the proposed UAV-based smoke detection system, highlighting both its strengths and limitations. The evaluation on a manually annotated test set confirms that integrating a binary classifier into the dataset generation process significantly enhances detection precision while maintaining high recall. Furthermore, the qualitative analysis of video sequences offers valuable insights into real-world applicability and areas for potential refinement.
4.1. Impact of the New Data Generation Pipeline on Detection Performance
One of the key findings of this study is the substantial improvement in detection performance achieved through classifier-based dataset refinement. Compared to the baseline model, the YOLO-Class configuration significantly reduces false positives while maintaining a comparable recall. The test results suggest that this improvement is primarily due to the more effective filtering of non-smoke motion artifacts, which were prevalent in the original motion-based annotation pipeline.
However, the qualitative evaluation of video sequences indicates that while the classifier effectively eliminates many false detections, it may also introduce occasional false negatives, particularly for weak or diffuse smoke patterns.
4.2. Challenges in Oblique Views and Winter Conditions
Another critical aspect of the evaluation was assessing the model’s performance under different perspectives and environmental conditions. The results indicate that while detections generally improve as the UAV moves closer to the smoke source, this effect is most pronounced in oblique views. In such cases, the changing perspective enhances the visibility of smoke plumes, making them more distinct against the background. However, proximity alone is not the only contributing factor; smoke viewed from a steep oblique angle often exhibits different shape and texture characteristics compared to nadir views. This suggests that expanding the training dataset with more oblique examples could enhance generalization across different UAV flight angles, though it may also necessitate adjustments to the smoke detection framework for stabilized video sequences.
Winter conditions were also identified as a potential challenge, though their impact on detection performance was less severe than initially expected. The primary issue observed during winter flights was the reduced reliability of motion-based annotation due to snow-covered rooftops, which minimized contrast and movement, leading to weaker training signals. Despite this, the final detection model performed robustly in winter sequences, suggesting that YOLO-based smoke detection remains effective across seasonal variations. However, further improvements in dataset generation may be needed to ensure consistent training data quality in snow-covered environments.
4.3. Real-Time Feasibility and Temporal Consistency
Beyond static detection performance, real-time deployment is a critical factor for UAV-assisted monitoring. The efficiency of the proposed smoke detection pipeline is largely attributed to the use of YOLOv11-nano, a lightweight and optimized model designed for edge devices. As highlighted in [33], YOLO-based models, particularly their compact variants, have demonstrated strong performance on embedded platforms, making them suitable for real-time UAV applications.
Empirical testing confirmed that the proposed model achieves approximately 10 FPS on a MacBook M1 Pro and real-time performance on an Intel-based system equipped with an NVIDIA RTX 4070 Ti GPU. These results suggest that real-time operation is feasible when processing the video stream on a ground-based computer via standard UAV video transmission. However, direct onboard deployment on commercial UAVs, such as DJI platforms, remains limited due to restricted access to onboard SDKs. Future integration would require either support for custom model deployment on UAV processors or real-time transmission to an edge processing unit.
In addition to computational feasibility, maintaining temporal consistency is crucial for stable real-time detection. YOLO-based models operate on a frame-by-frame basis, which can lead to flickering detections. To address this, simple post-processing techniques such as temporal smoothing or interpolation can be applied to reduce intermittent false positives and false negatives. These refinements improve detection reliability, particularly in dynamic UAV-based scenarios where smoke patterns evolve gradually over time.
4.4. Limitations and Future Directions
Despite the promising results, certain limitations remain. First, the dataset used in this study was specifically designed for detecting chimney smoke, which was the primary objective of this work. However, the NoRoof model demonstrated potential for detecting more general smoke sources, such as industrial emissions or wildfires. A thorough evaluation of its performance in such scenarios would require further testing and likely an expansion of the training dataset to encompass a broader range of smoke appearances and environmental conditions.
Another limitation concerns the lack of extensive low-light data. While preliminary observations suggest that detection is feasible under reduced lighting conditions with newer UAVs, the available dataset is insufficient for a comprehensive evaluation. Since visual-spectrum cameras have limited effectiveness at night, particularly at the flight altitudes required for broader coverage, future studies could explore alternative sensing modalities, such as infrared or thermal imaging.
Additionally, adverse weather conditions, such as rain, snowfall, or strong winds, impose practical constraints on UAV-based monitoring. These factors not only restrict flight operations but also degrade image quality and detection performance. Addressing these challenges may require adaptations in both data acquisition strategies and model training to improve robustness in suboptimal conditions.
4.5. Implications for UAV-Based Environmental Monitoring
The findings of this study demonstrate the potential of UAV-based smoke detection for scalable and automated environmental monitoring. The proposed methodology reduces the reliance on manual annotation while maintaining high accuracy, making it applicable beyond residential heating emissions to detecting illegal waste burning, industrial emissions, and biomass combustion.
Furthermore, the annotation framework introduced in this work can be adapted to other object detection tasks involving dynamic elements with high variability, where manual labeling is particularly challenging. Potential applications extend to areas such as traffic monitoring, wildlife tracking, and industrial process control.
Real-time detection could also enhance regulatory efforts by enabling targeted air quality interventions. Integrating UAV-based smoke detection with ground-based air monitoring systems would provide a more comprehensive assessment of pollution sources. Additionally, deploying the model on a mobile platform could help operators identify emission sources in real time, improving situational awareness and response efficiency.
4.6. Summary of Key Findings
- The classifier-based dataset refinement significantly improves precision while maintaining recall.
- Oblique views and winter conditions pose challenges but do not substantially degrade detection performance.
- Temporal inconsistencies, such as intermittent false positives and false negatives, can be mitigated through post-processing.
- YOLOv11-nano-based models can operate in real time on high-performance hardware, making UAV-based real-time applications feasible.
- Expanding the dataset to include additional smoke sources could further enhance the generalization of the YOLO-NoRoof model. However, nighttime detection would require a fundamentally different approach, potentially incorporating infrared or thermal imaging.
- UAV-based smoke detection shows strong potential for air quality monitoring and regulatory enforcement applications.
These findings validate the effectiveness of the proposed approach in UAV-based smoke detection. Future work should focus on refining the dataset to improve generalization, particularly for non-residential smoke sources, and optimizing the model for real-world deployment scenarios to maximize its practical impact.
Funding
The research was funded by grant no 02/070/BK_25/0067 from the Silesian University of Technology—subsidy for the maintenance and development of research potential.
Data Availability Statement
The dataset used in this study, including input video sequences, annotated training data, test datasets, and trained YOLO models, is publicly available at Dataset Repository (OneDrive) (https://polslpl-my.sharepoint.com/:f:/g/personal/mszczepanski_polsl_pl/EoQ3DvKl9t5GjBeCmllD2dgBK29t-kO1s1DH-GR4UFuIJg?e=45shSE, accessed on 30 January 2025). This repository also includes the software used for data processing and model training. Additionally, the source code is available in a dedicated GitHub repository: Smoke-RS2025 (GitHub) (https://github.com/mszczepa/Smoke-RS2025, accessed on 2 March 2025).
Conflicts of Interest
The author declares no conflict of interest.
Abbreviations
The following abbreviations are used in this manuscript:
| AGL | Above Ground Level |
| BB | Bounding Box |
| CNN | Convolutional Neural Network |
| DWT | Discrete Wavelet Transform |
| ECC | Enhanced Correlation Coefficient Maximization |
| FN | False Negative |
| FP | False Positive |
| GMM | Gaussian Mixture Model |
| GLCM | Gray-Level Co-occurrence Matrix |
| IoU | Intersection over Union |
| LBP | Local Binary Patterns |
| mAP | mean Average Precision |
| NMS | Non-Maximum Suppression |
| OBB | Oriented Bounding Box |
| PM | Particulate Matter |
| RGB | Red, Green, Blue (color model) |
| ROI | Region of Interest |
| SDK | Software Development Kit |
| SoR | Smoke over Rooftop Index |
| SVM | Support Vector Machine |
| TP | True Positive |
| UAV | Unmanned Aerial Vehicle |
| WHO | World Health Organization |
| YOLO | You Only Look Once |
References
- Ortiz, A.G.; Guerreiro, C.; Soares, J. EEA Report No 09/2020 (Air Quality in Europe 2020); Annual report; The European Environment Agency: Copenhagen, Denmark, 2020. [Google Scholar]
- Program PAS dla Czystego Powietrza w Polsce; Presentation; Polish Smog Alert (PAS): Cracow, Poland, 2020.
- Bebkiewicz, K.; Chłopek, Z.; Chojnacka, K.; Doberska, A.; Kanafa, M.; Kargulewicz, I.; Olecka, A.; Rutkowski, J.; Walęzak, M.; Waśniewska, S.; et al. Krajowy Bilans Emisji SO2, NOX, CO, NH3, NMLZO, Pyłów, Metali Ciężkich i TZO za lata 1990–2019; Presentation; The National Centre for Emissions Management (KOBiZE): Warsaw, Poland, 2021. [Google Scholar]
- Saydirasulovich, S.N.; Mukhiddinov, M.; Djuraev, O.; Abdusalomov, A.; Cho, Y.I. An Improved Wildfire Smoke Detection Based on YOLOv8 and UAV Images. Sensors 2023, 23, 8374. [Google Scholar] [CrossRef] [PubMed]
- Mukhiddinov, M.; Abdusalomov, A.B.; Cho, J. A Wildfire Smoke Detection System Using Unmanned Aerial Vehicle Images Based on the Optimized YOLOv5. Sensors 2022, 22, 9384. [Google Scholar] [CrossRef] [PubMed]
- Szczepański, M. Vision-Based Detection of Low-Emission Sources in Suburban Areas Using Unmanned Aerial Vehicles. Sensors 2023, 23, 2235. [Google Scholar] [CrossRef] [PubMed]
- Jiao, Z.; Zhang, Y.; Mu, L.; Xin, J.; Jiao, S.; Liu, H.; Liu, D. A yolov3-based learning strategy for real-time uav-based forest fire detection. In Proceedings of the 2020 Chinese Control and Decision Conference (CCDC), Hefei, China, 22–24 August 2020; pp. 4963–4967. [Google Scholar]
- Ronneberger, O.; Fischer, P.; Brox, T. U-net: Convolutional networks for biomedical image segmentation. In Proceedings of the Medical Image Computing and Computer-Assisted Intervention–MICCAI 2015: 18th International Conference, Munich, Germany, 5–9 October 2015; Proceedings, Part III 18. Springer: Berlin/Heidelberg, Germany, 2015; pp. 234–241. [Google Scholar]
- Xu, Z.; Xu, J. Automatic Fire Smoke Detection Based on Image Visual Features. In Proceedings of the International Conference on Computational Intelligence and Security Workshops (CISW 2007), Harbin, China, 15–19 December 2007; pp. 316–319. [Google Scholar]
- Chunyu, Y.; Jun, F.; Jinjun, W.; Yongming, Z. Video Fire Smoke Detection Using Motion and Color Features. Fire Technol. 2010, 46, 651–663. [Google Scholar] [CrossRef]
- Yuan, F. A fast accumulative motion orientation model based on integral image for video smoke detection. Pattern Recognit. Lett. 2008, 29, 925–932. [Google Scholar] [CrossRef]
- Calderara, S.; Piccinini, P.; Cucchiara, R. Smoke Detection in Video Surveillance: A MoG Model in the Wavelet Domain. In Proceedings of the Computer Vision Systems: 6th International Conference, ICVS 2008, Santorini, Greece, 12–15 May 2008; Gasteratos, A., Vincze, M., Tsotsos, J.K., Eds.; Springer: Berlin/Heidelberg, Germany, 2008; pp. 119–128. [Google Scholar]
- Kolesov, I.; Karasev, P.; Tannenbaum, A.; Haber, E. Fire and smoke detection in video with optimal mass transport based optical flow and neural networks. In Proceedings of the 2010 IEEE International Conference on Image Processing, Hong Kong, China, 26–29 September 2010; pp. 761–764. [Google Scholar] [CrossRef]
- Gubbi, J.; Marusic, S.; Palaniswami, M. Smoke detection in video using wavelets and support vector machines. Fire Saf. J. 2009, 44, 1110–1115. [Google Scholar] [CrossRef]
- Olivares-Mercado, J.; Toscano-Medina, K.; Sánchez-Perez, G.; Hernandez-Suarez, A.; Perez-Meana, H.; Sandoval Orozco, A.L.; García Villalba, L.J. Early Fire Detection on Video Using LBP and Spread Ascending of Smoke. Sustainability 2019, 11, 3261. [Google Scholar] [CrossRef]
- Panchanathan, S.; Zhao, Y.; Zhou, Z.; Xu, M. Forest Fire Smoke Video Detection Using Spatiotemporal and Dynamic Texture Features. J. Electr. Comput. Eng. 2015, 2015, 706187. [Google Scholar] [CrossRef]
- Xu, G.; Zhang, Y.; Zhang, Q.; Lin, G.; Wang, J. Deep domain adaptation based video smoke detection using synthetic smoke images. Fire Saf. J. 2017, 93, 53–59. [Google Scholar] [CrossRef]
- Yuan, F. Video-based smoke detection with histogram sequence of LBP and LBPV pyramids. Fire Saf. J. 2011, 46, 132–139. [Google Scholar] [CrossRef]
- Favorskaya, M.; Pyataeva, A.; Popov, A. Verification of Smoke Detection in Video Sequences Based on Spatio-temporal Local Binary Patterns. Procedia Comput. Sci. 2015, 60, 671–680. [Google Scholar] [CrossRef]
- Krizhevsky, A.; Sutskever, I.; Hinton, G.E. ImageNet Classification with Deep Convolutional Neural Networks. Commun. ACM 2017, 60, 84–90. [Google Scholar] [CrossRef]
- Szegedy, C.; Liu, W.; Jia, Y.; Sermanet, P.; Reed, S.; Anguelov, D.; Erhan, D.; Vanhoucke, V.; Rabinovich, A. Going deeper with convolutions. In Proceedings of the 2015 IEEE Conference on Computer Vision and Pattern Recognition (CVPR), Boston, MA, USA, 7–12 June 2015; pp. 1–9. [Google Scholar] [CrossRef]
- Simonyan, K.; Zisserman, A. Very deep convolutional networks for large-scale image recognition. arXiv 2014, arXiv:1409.1556. [Google Scholar]
- Srinivas, K.; Dua, M. Fog Computing and Deep CNN Based Efficient Approach to Early Forest Fire Detection with Unmanned Aerial Vehicles. In Proceedings of the Inventive Computation Technologies; Smys, S., Bestak, R., Rocha, Á., Eds.; Springer International Publishing: Cham, Switzerland, 2020; pp. 646–652. [Google Scholar]
- Lee, W.; Kim, S.; Lee, Y.T.; Lee, H.W.; Choi, M. Deep neural networks for wild fire detection with unmanned aerial vehicle. In Proceedings of the 2017 IEEE International Conference on Consumer Electronics (ICCE), Las Vegas, NV, USA, 8–10 January 2017; pp. 252–253. [Google Scholar] [CrossRef]
- Chen, Y.; Zhang, Y.; Xin, J.; Wang, G.; Mu, L.; Yi, Y.; Liu, H.; Liu, D. UAV Image-based Forest Fire Detection Approach Using Convolutional Neural Network. In Proceedings of the 2019 14th IEEE Conference on Industrial Electronics and Applications (ICIEA), Xi’an, China, 19–21 June 2019; pp. 2118–2123. [Google Scholar] [CrossRef]
- Ren, S.; He, K.; Girshick, R.; Sun, J. Faster R-CNN: Towards Real-Time Object Detection with Region Proposal Networks. IEEE Trans. Pattern Anal. Mach. Intell. 2017, 39, 1137–1149. [Google Scholar] [CrossRef]
- Jiao, Z.; Zhang, Y.; Xin, J.; Mu, L.; Yi, Y.; Liu, H.; Liu, D. A deep learning based forest fire detection approach using UAV and YOLOv3. In Proceedings of the 2019 1st International conference on industrial artificial intelligence (IAI), Shenyang, China, 23–27 July 2019; pp. 1–5. [Google Scholar]
- Lin, T.Y.; Goyal, P.; Girshick, R.; He, K.; Dollár, P. Focal loss for dense object detection. In Proceedings of the IEEE International Conference On Computer Vision, Venice, Italy, 22–29 October 2017; pp. 2980–2988. [Google Scholar]
- Alexandrov, D.; Pertseva, E.; Berman, I.; Pantiukhin, I.; Kapitonov, A. Analysis of machine learning methods for wildfire security monitoring with an unmanned aerial vehicles. In Proceedings of the 2019 24th conference of open innovations association (FRUCT), Moscow, Russia, 8–12 April 2019; pp. 3–9. [Google Scholar]
- Ke, G.; Meng, Q.; Finley, T.; Wang, T.; Chen, W.; Ma, W.; Ye, Q.; Liu, T.Y. LightGBM: A Highly Efficient Gradient Boosting Decision Tree. In Proceedings of the Advances in Neural Information Processing Systems, Long Beach, CA, USA, 4–9 December 2017; Volume 30, pp. 3146–3154. [Google Scholar]
- Evangelidis, G.; Psarakis, E. Parametric Image Alignment Using Enhanced Correlation Coefficient Maximization. IEEE Trans. Pattern Anal. Mach. Intell. 2008, 30, 1858–1865. [Google Scholar] [CrossRef]
- Wang, C.Y.; Bochkovskiy, A.; Liao, H.Y.M. YOLOv7: Trainable bag-of-freebies sets new state-of-the-art for real-time object detectors. arXiv 2022, arXiv:2207.02696. [Google Scholar]
- Lazarevich, I.; Grimaldi, M.; Kumar, R.; Mitra, S.; Khan, S.; Sah, S. YOLOBench: Benchmarking Efficient Object Detectors on Embedded Systems. arXiv 2023, arXiv:2307.13901. [Google Scholar]
Disclaimer/Publisher’s Note: The statements, opinions and data contained in all publications are solely those of the individual author(s) and contributor(s) and not of MDPI and/or the editor(s). MDPI and/or the editor(s) disclaim responsibility for any injury to people or property resulting from any ideas, methods, instructions or products referred to in the content. |
© 2025 by the author. Licensee MDPI, Basel, Switzerland. This article is an open access article distributed under the terms and conditions of the Creative Commons Attribution (CC BY) license (https://creativecommons.org/licenses/by/4.0/).