Abstract
Straw incorporation (SI) is a key strategy for promoting sustainable agriculture. It aims to mitigate environmental pollution caused by straw burning and enhances soil organic matter content, which increases crop yields. Consequently, the accurate and efficient monitoring of SI is crucial for promoting sustainable agricultural practices and effective management. In this study, we employed the Google Earth Engine (GEE) to analyze time-series Sentinel-2 data with the Mann–Kendall (MK) algorithm. This approach enabled the extraction and spatial distribution retrieval of SI regions in a representative household mode area in Northeast China. Among the eight tillage indices analyzed, the simple tillage index (STI) exhibited the highest inversion accuracy, with an overall accuracy (OA) of 0.85. Additionally, the bare soil index (BSI) achieved an overall accuracy of 0.84. In contrast, the OA of the remaining indices ranged from 0.28 to 0.47, which were significantly lower than those of the STI and BSI. This difference indicated the limited performance of the other indices in retrieving SI. The high accuracy of the STI is primarily attributed to its reliance on the bands B11 and B12, thereby avoiding potential interference from other spectral bands. The geostatistical analysis of the SI distribution revealed that the SI rate in the household mode area was 36.10% in 2022 in the household mode area. Regions A, B, C, and D exhibited SI rates of 34.76%, 33.05%, 57.88%, and 22.08%, respectively, with SI mainly concentrated in the eastern area of Gongzhuling City. Furthermore, the study investigated the potential impacts of household farming practices and national policies on the outcomes of SI implementation. Regarding state subsidies, the potential returns from SI per hectare of cropland in the study area varied from RMB −65 to 589. This variation indicates the importance of higher subsidies in motivating farmers to adopt SI practices. Sentinel-2 satellite imagery and the MK test were used to effectively monitor SI practices across a large area. Future studies will aim to integrate deep learning techniques to improve retrieval accuracy. Overall, this research presents a novel perspective and approach for monitoring SI practices and provides theoretical insights and data support to promote sustainable agriculture.
1. Introduction
The United Nations World Population Prospects 2022 report stated that the global population surpassed 8 billion in November 2022 and is projected to reach 10.4 billion by 2080 [1]. In 2023, food prices significantly increased by 60% to 100% compared with 2021 levels, owing to the ongoing Russia–Ukraine conflict and higher agricultural input costs [2]. Global food demand is anticipated to increase by 50% to 60% between 2019 and 2050. However, the capacity to meet this demand may be severely limited by the impacts of wars and pandemics [3]. Additionally, ~25% of the world’s land has undergone or is currently facing severe degradation due to hydraulic and wind erosion and physical, chemical, and economic factors. This degradation directly affects 250 million people and indirectly affects 1 billion people [4,5,6]. With urban expansion, it is estimated that 50% to 63% of urban growth will occur on existing farmland. Straw incorporation (SI), a key component of conservation tillage, can balance the entire K2O and part of P2O5 and N in fertilizers. This practice significantly improves soil quality and reduces air pollution caused by straw burning [7]. Research has shown that SI can increase soil organic carbon (SOC) content by 13.97% and crop yields by 8.2% to 24.2% through the addition of available nitrogen, phosphorus, potassium, and other trace elements to the soil [7,8,9]. Conservation tillage can be categorized into straw mulching and SI. Straw mulching increases the availability of phosphorus, nitrogen, and potassium in the soil, while SI enhances SOC, total nitrogen, and total potassium content [10]. Compared with traditional tillage methods, SI can significantly increase grain yields by 6.0% to 9.1% and reduce greenhouse gas emission intensity by 4.3% to 11.87% [11]. Additionally, SI outperforms traditional tillage methods in reducing soil erosion due to rainfall and runoff, enhancing soil erosion resistance and increasing soil organic matter (SOM) content by 67.5% and total nitrogen content by 61.3% [12,13].
Black soil is highly suitable for crop cultivation, owing to its high fertility and thick humus layer [14]. Northeast China is one of the world’s three largest black soil regions, covering ~2.64 × 10⁵ km2, and serves as the country’s primary grain production area. This region accounts for over 30% of China’s total maize and nearly 50% of its total soybean output [15,16,17]. Furthermore, these black soil areas generate over 100 million tons of corn straw annually [18]. However, high-intensity agricultural practices, land use changes, and intensive cultivation have contributed to soil loss from arable land in Northeastern China, resulting in a total loss of 44.28 gigatons between 1953 and 2012 [19,20]. The black soil in Northeastern China is currently facing severe soil erosion, with organic matter content decreasing annually by an average of 1.5% to 2.6% in the northern region and 0.5% to 0.7% in the southern region [21,22,23]. Implementing conservation tillage alongside SI is essential for fostering sustainable development in these regions. Recent studies primarily investigate the impact of SI on mitigating soil erosion, boosting SOM levels, and improving crop yields [24]. However, the comprehensive macro-level monitoring of SI remains underexplored. Effectively elucidating the impacts of SI requires monitoring its spatial and temporal distribution on a macro scale. This monitoring is vital for informing future conservation tillage policies and agricultural planning. Therefore, developing an efficient and accurate method for monitoring SI is crucial.
Currently, domestic and international scholars have mainly analyzed SI in straw mulching. Crop residue cover, a key parameter in straw mulching, is described as the percentage of crop straw over a specific standardized area [25]. Traditional monitoring methods primarily consist of the photographic and the line transect method [26]. Despite the accuracy of these methods, they are time-consuming and costly, which limits their large-scale application [27]. Remote sensing technology serves as a reliable and scientific tool for rapidly and accurately assessing straw coverage. Xiang et al. [25] developed a partial least squares-based maize residue cover (MRC) estimation model that incorporated tillage indices and texture features. The model achieved an accuracy of 0.783. Similarly, Wang et al. [28] used UAV hyperspectral data and satellite data to construct a ground–airborne–satellite integrated model based on a convolutional neural network. The model achieved a straw coverage estimation accuracy of 0.67. Li et al. [26] constructed an MRC remote sensing inversion model by analyzing the correlation between MRC data and the normalized difference tillage index (NDTI). The model exhibited an accuracy of 0.81. According to these findings, the estimated average MRC value in Northeast China for 2022 was 2.3%. Therefore, remote sensing technology provides a convenient and rapid method for the large-scale and synchronous acquisition of spatial and temporal heterogeneity in regional straw coverage. Monitoring surface changes using time-series remote sensing data has emerged as a key technique, yielding considerable results in phenology monitoring and land cover classification [29,30]. Time-series analysis effectively captures vegetation phenology, facilitating accurate land cover classification and natural disaster monitoring [31]. Moon et al. [32] combined time-series data obtained from a sustained development model with MODIS surface phenology measurements to predict greening time and inter-annual changes, achieving a prediction accuracy of 0.7. Chen et al. [33] achieved a high urban land cover classification accuracy of 92.31% by integrating time-series, spectral, angular, and topographic features from the Landsat 8 Operational Land Imager (OLI), China Environment 1A series, Advanced Spaceborne Thermal Emission and Reflection (ASTER) digital elevation model data. Veh et al. [34] used a random forest classifier to analyze Landsat time-series imagery from 1988 to 2016. The analysis successfully detected glacial lake flood hazards in the Himalayan region, achieving an accuracy of 91%. Among the various time-series analysis techniques, the Mann–Kendall (MK) algorithm is widely used for identifying trends and change points in time series, owing to its robustness against outliers. This method has found widespread use in remote sensing research [35]. Zhang et al. [36] introduced a wetland classification method that integrated the MK test with automatic sample extraction techniques, multi-source products, satellite time-series images, and a hierarchical classification strategy. This method achieved an overall accuracy of 86.44% and a Kappa coefficient of 0.822. A wetland classification method that combined the MK test with automated sample extraction was introduced, resulting in an OA of 86.44%. Lin et al. [37] utilized the MK test to analyze Landsat time-series data and remotely sensed eco-indices for the rapid monitoring of ecological changes in urbanized islands. However, research utilizing this method to detect SI remains limited.
The efficient processing of large-scale and high spatial-temporal resolution data requires tools with robust computational capabilities and easy data access [38]. GEE is a cloud-based platform for processing geospatial information. GEE offers users access to more than 40 years of remote sensing data, facilitating extensive monitoring tasks and remote sensing analysis [39,40]. The introduction of GEE has significantly enhanced the ability of scholars to conduct research over extensive spatial scales and long temporal spans. The platform offers complimentary access to more than 100 varieties of satellite remote sensing data and their derived products. The dataset comprises Sentinel-1 Synthetic Aperture Radar (SAR) data, with a six-day revisit interval and 10 m spatial resolution [41], Sentinel-2 optical data, with a five-day revisit interval and 10 m spatial resolution [42], and Landsat optical data, with a 16-day revisit interval and 30 m spatial resolution [43,44]. Additionally, the platform provides other satellite data, such as MODIS [45]. The GEE platform allocates computing resources based on user needs and large store datasets, enabling large-scale computation, online geographic information monitoring, and the analysis of remote sensing data [26]. However, owing to the lack of corresponding remote sensing models, no research has been reported on the use of the GEE platform for remote sensing inversion studies related to SI.
In agricultural production in Northeast China, the attitudes of farmers toward SI vary based on the scale of their operations. Large-scale farmers, including state-owned farms (collectively referred to as the “farm mode”), often prioritize the long-term benefits of their farmland and have the necessary resources to implement SI. These farmers focus their efforts during specific periods. In contrast, small-scale farmers (the “household mode”) are more influenced by policies when opting for certain decisions and timings in the implementation of SI, leading to a relatively lower proportion of SI implementation and more scattered execution times [46]. In Heilongjiang, China, SI on farms is typically conducted shortly after crop harvesting, which is coordinated by farm managers [47]. Conversely, the household mode, the predominant production method in Northeast China [48], differs considerably from the farm mode. The farm mode benefits from standardized management practices and larger farmland, making it highly effective for maximizing economic efficiency. In contrast, the household mode is characterized by smaller fragmented farmland plots, a lack of unified production management, and smaller farmland areas [49]. Li et al. [50] demonstrated that the farm mode exhibited similar layout characteristics and consistent agricultural management practices, making it highly suitable for remote sensing detection. However, the household mode is characterized by considerable variability in the timing of SI implementation and a more dispersed spatial distribution, in stark contrast with the farm mode.
This study utilized the GEE platform with Sentinel-2 imagery, employing the MK test algorithm to develop an SI monitoring model tailored to the household farming systems. The model was used to conduct the remote sensing inversion of SI in the study area, and the spatiotemporal distribution characteristics of SI under this mode were explored. The research objectives of this study are as follows: (1) to explore the applicability of the MK test algorithm and the GEE platform for the remote sensing inversion of SI in household mode; (2) to evaluate the impact of various tillage indices, such as the STI, BSI, and NDTI, on the accuracy of SI inversion; and (3) to analyze the spatiotemporal distribution characteristics of SI in household farming systems and identify its influencing factors. Overall, this study establishes a scientific basis for the application of remote sensing monitoring technology in conservation tillage and offers data support for agricultural production management and policy-making, thereby promoting sustainable agricultural development.
2. Materials and Methods
2.1. Study Area
The study area is located in Gongzhuling City within the Songnen Plain of Jilin Province, Northeast China. The Songnen Plain, shaped by the alluvial deposits of the Songhua and Nen rivers, spans from 121°20′ E to 128°25′ E and 43°36′ N to 49°30′ N [51]. The region experiences a temperate continental monsoon climate, with an average annual temperature of 2 °C to 6 °C and precipitation between 350 and 800 mm, over 80% of which falls from June to August [52]. The Songnen Plain is one of China’s largest grain-producing regions, contributing ~11.5% to its total grain output [53]. Gongzhuling City lies in the southern part of the Songnen Plain at coordinates from 124°02′E to 125°18′E and 43°11′N to 44°09′N, covering an area of 4058 square kilometers [54]. In October 2022, Gongzhuling had 319,300 hectares of grain crops, resulting in an annual grain output of 3 million tons, ranking it among the top five commercial grain-producing regions in China [55]. Gongzhuling, located in the world-renowned “Golden Corn Belt”, features a corn cultivation area of 292,100 hectares, which comprises 95% of its total grain crop area [56].
In recent years, the Songnen Plain has faced severe soil erosion, owing to prolonged intensive cultivation and the increasing effects of wind and water erosion processes, resulting in a 0.5% annual decline in the SOM content [57,58,59,60]. Straw, rich in trace elements, can increase SOC by 67.5% and total nitrogen by 61.3% [13]. The implementation of SI practices can further mitigate the decline in soil fertility, thereby promoting soil health and sustainable agricultural development [61].
In Northeast China’s agricultural production, two common agricultural modes are the household mode and the farm mode, which differ considerably in management practice, scale, and market strategies. The study area, positioned within the Songnen Plain, is a typical region of the household mode, characterized by a smaller per capita farmland. According to the Jilin Statistical Yearbook, the per capita farmland in Gongzhuling is 0.32 hectares per person (http://tjj.jl.gov.cn/tjsj/tjnj/2023/ml/indexc.htm (accessed on 11 October 2024)). According to the Statistical Yearbook of Heilongjiang, the Sanjiang Plain, mainly characterized by the farm mode, has a per capita farmland of 1.29 hectares per person, which is 4.09 times the study area (https://tjj.hlj.gov.cn/tjjnianjian/2023/zk/indexch.htm (accessed on 11 October 2024)). Therefore, the rapid and accurate inversion of SI and the mapping of its spatial distribution in Gongzhuling are crucial for implementing conservation tillage in household mode regions and developing regional agricultural management plans. To further examine the spatial distribution of SI in the study area and explore the potential limiting factors affecting SI inversion accuracy, this study classified the area into four sub-regions (A, B, C, and D) based on soil moisture data obtained from 20 September to 30 October 2022 (Figure 1). Among these sub-regions, Region A exhibited the lowest average soil moisture value of 0.26, while the other three regions (B, C, and D) had higher average soil moisture values of 0.30. Specifically, Region D demonstrated a relatively uniform soil moisture distribution, while the variance of soil moisture in Region B was 1.1 times that of Region C and 50 times that of Region D.
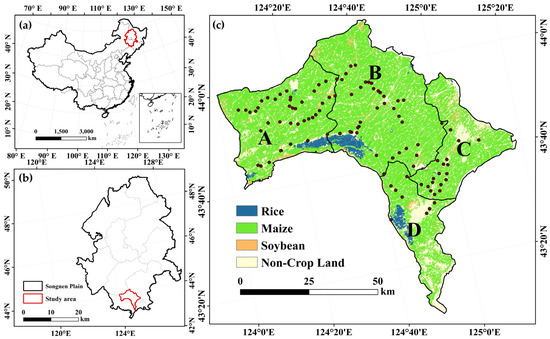
Figure 1.
(a) Map of China illustrating the location of the Songnen Plain; (b) location of the study area within the Songnen Plain; (c) spatial distribution of validation points (black dots), crop types, and soil moisture-based sub-regions (A~D) within the study area.
2.2. Data Source
2.2.1. Sentinel-2 Remotely Sensed Data
GEE is a global imagery and geographic information system analysis platform that provides powerful tools for earth observation and environmental analysis. GEE integrates petabytes of satellite observation data stored in the cloud, including datasets from the Sentinel series, Landsat series, and MODIS [62]. This platform enables users to access and process data directly in the cloud, thereby eliminating the need for local storage. GEE utilizes distributed computing principles, providing considerable data processing capabilities to enable users to efficiently and intuitively process the necessary satellite data on the platform [40].
The Sentinel-2 satellite comprises 12 spectral bands (Table S1) that cover the visible to near-infrared range, making it suitable for monitoring various environmental changes, including vegetation, land use, water quality, and atmospheric composition [63,64,65]. The satellite features spatial resolutions of 10, 20, and 60 m, providing detailed surface information, with each observation covering a swath width of 290 km. The two Sentinel-2 satellites have a revisit period of five days, enabling the monitoring of rapidly changing surface features. Consequently, Sentinel-2 can rapidly acquire large-scale remote sensing data, which significantly reduces the time and cost associated with data collection.
Sentinel-2 satellite data on the GEE platform were used to retrieve the spatial distribution of SI in the study area for 2022. Remote sensing imagery was acquired between 1 September and 31 December 2022, using atmospherically corrected surface reflectance products composed of 120 images (https://developers.google.com/earth-engine/datasets/catalog/COPERNICUS_S2_SR_HARMONIZED (accessed on 14 October 2024)), which were directly obtained from GEE. The Sentinel-2 Level-2A products are generated on the GEE platform using the SEN2COR processor [66]. Previous studies have demonstrated that the atmospheric correction method is highly effective, achieving a coefficient of determination greater than 0.90, an RMSE of less than 0.04, and a relative error in bottom-of-atmosphere reflectance of only 2–3% [67]. The QA60 band of Sentinel-2 was used to filter and process the raw images, ensuring high-quality, cloud-free images suitable for inversion needs.
2.2.2. Crop Type Data
You et al. [68] utilized the random forest algorithm, Sentinel-2 data, and a hierarchical mapping strategy to generate spatial distribution maps of corn, rice, and soybean in Northeast China from 2017 to 2019. This approach achieved an accuracy range of 0.81–0.86. To mitigate the interference from non-agricultural land use types on the inversion results, this study used the 2019 crop type data for Northeast China.
2.2.3. Soil Moisture Data
Owing to the potential impact of soil moisture on the inversion results of the selected indices, this study utilized soil moisture retrieval data to classify the study area into four sub-regions and to investigate factors affecting SI inversion. The soil moisture data were obtained from the Soil Moisture Active Passive (SMAP) mission, launched by the National Aeronautics and Space Administration (NASA) on 31 January 2015 [69]. The mission aims to produce global soil moisture maps through the combination of passive L-band radiometry with active L-band radar technology. SMAP provides four levels of data products, ranging from L1 to L4 [70]. These data products are accessible through NASA’s official website (https://smap.jpl.nasa.gov/data/ (accessed on 14 October 2024)).
SMAP data have been extensively applied in areas including drought monitoring and evaluating vegetation water content [71,72,73]. In this study, the high spatial resolution, three-hourly SMAP Level 4 surface and root zone soil moisture geophysical data product (SPL4SMGP) was selected [74]. SPL4SMGP has a spatial resolution of 9 km and covers the entire range from 180°W to 180°E. Soil moisture values range from 0 (completely dry) to 1 (fully saturated) [75]. The data for this study were collected between 1 September and 31 December 2022.
2.2.4. Field Data
Field sampling in the study area was conducted from 8 to 10 November 2022, and a total of 95 validation points were established (Figure 1). To ensure data accuracy and representativeness, these points were evenly distributed across the main agricultural fields, capturing various agricultural environments. A five-point sampling method was used for the SI survey (Figure 2). Validation points were carefully selected to avoid locations near roads, villages, and potential obstructions such as trees and utility poles, thereby enhancing the accuracy of the SI remote sensing inversion. At the center of each selected validation area, five square sampling pits were excavated, each with a side length of 0.5 m. These pits were strategically positioned along the diagonals of a 10 m × 10 m area, which effectively represented a validation zone consistent with the pixel size of the Sentinel-2 imagery. If all five sampling pits contained straw, the farmland at the validation site would undergo SI, facilitating an accurate evaluation of farmland management practices. To support the analysis and replication of the study, the GPS coordinates of each validation point were recorded, and field photographs were captured to confirm consistency between the remotely sensed imagery and ground observations.
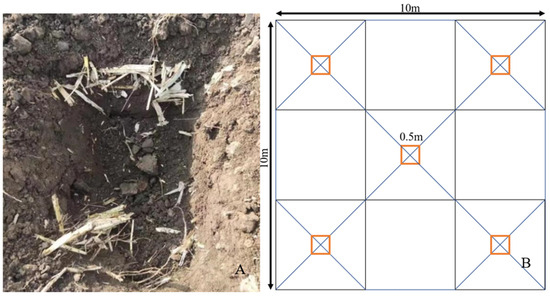
Figure 2.
(A) Photograph of a sampling pit captured on 8 November 2022 in the study area. (B) Illustration of the five-point sampling method.
2.3. Methods
2.3.1. Spectral Indices
Spectral indices are valuable tools in remote sensing analysis used to calculate ratios or differences between various spectral bands to extract specific information [76]. Straw-related indices, a key component of spectral indices, have been extensively used in remote sensing inversion [77]. The cellulose and lignin in straw exhibit distinct spectral absorption characteristics near the 2100 nm wavelength, which is closely associated with straw [78,79]. During SI, the land surface transitions from straw-covered to soil-covered. Remote sensing technology provides a unique perspective for observing changes in straw characteristics throughout the SI process. Owing to the specific spectral properties of straw indices, eight spectral indices closely associated with Sentinel-2 bands 11 and 12 were selected for this study (Table 1). These spectral indices exhibited a considerable correlation with straw coverage [25,80]. This finding provides strong theoretical support for the construction of the SI inversion model.

Table 1.
Summary of satellite optical cultivation indices.
2.3.2. MK Test
Trend analysis has received considerable attention in time-series studies across various fields, including agriculture, meteorology, hydrology, and air quality. Parametric methods require certain assumptions, such as homoscedasticity and other prior conditions. In contrast, non-parametric trend analysis methods are more flexible and reliable, making them preferable for various applications [87]. The MK algorithm, a widely used non-parametric method, was first introduced by Mann (1945) and Kendall [88,89]. The MK test has been widely used in remote sensing-based time series analyses [87,90]. A key advantage of the MK test is its resilience to a small number of outliers, which have minimal effect on the analysis results [91,92,93]. Therefore, this study utilized the MK test to analyze the distribution of SI in the study area. The MK test methodology is described as follows:
For a time series with n valid images, an ordered list Smk is constructed:
where and represent two valid images captured at adjacent times in the same region, and sgn denotes a sign function used to analyze the increase or decrease in time series. The variable serves as an adjustable threshold for SI inversion, with its range defined by . Given the complexity of the SI process, this study employed multiple threshold values (0, 0.05, 0.10, 0.15, and 0.20) to model different SI scenarios, with the optimal result selected for subsequent analysis. indicates an increase in the time series during this period. signifies no change in the time series during this period. indicates a decrease in the time series. Therefore, the local values of the function were analyzed to determine the increase or decrease in the time series at specific points and assess their overall impact on the entire time series [94]. The variance of the function is calculated as follows:
The range of the Z-statistic in the MK test is defined as in the following equation:
The statistical data UFK (forward trend statistic) and UBK (backward trend statistic) is expressed as follows:
General rules of significance testing were applied using a specific significance level and a critical value [95]. If the value fluctuates within the critical range, the changes in the trend of the data and the mutation are not statistically significant. However, if exceeds the critical point, the trend in the analyzed data becomes statistically significant, indicating the presence of a mutation point. If the lines and intersect within the critical range, the time corresponding to the intersection point marks the onset of the mutation [96].
2.4. Accuracy Assessment
To evaluate the accuracy of the inversion results and compare the sensitivity of various indices to SI, a confusion matrix was constructed. The following accuracy assessment metrics were derived: (1) OA, the proportion of correctly classified samples out of the total samples; (2) producer accuracy (PA), the proportion of correctly classified samples within a specific category relative to the total samples in that category; and (3) user accuracy (UA), the proportion of correctly classified samples within a specific category relative to the total samples classified as that category [97]. The formulas for calculating these accuracy metrics are as follows:
Here, TP represents true positives, in which the model correctly classifies a sample as positive. TN denotes true negatives, in which the model accurately identifies a sample as negative. FP represents false positives, in which the model incorrectly classifies a negative sample as positive. FN represents false negatives, in which the model inaccurately classifies a positive sample as negative.
3. Results
3.1. Validation of SI Inversion Accuracy
To evaluate the accuracy and sensitivity of the eight straw-related spectral indices in SI inversion, a confusion matrix was developed. The detailed evaluation results are provided in Table 2. The confusion matrix results revealed that the STI exhibited the highest OA of 0.85, followed by the BSI with an OA of 0.84. The STI achieved the highest PA of 0.97, while the BSI had a UA of 0.87. The OA for the remaining indices ranged from 0.28 and 0.47, indicating generally lower performance. The high OA of the STI can be attributed to the reduced spectral reflectance of crop residues in the 1600 to 2100 nm wavelength range, while the reflectance of soil remained relatively stable in this range. The STI utilized spectral information from 1600 to 2100 nm [98]. In contrast, other spectral indices incorporated additional band information, which may interfere with SI inversion, leading to a lower OA. The BSI was designed to enhance the monitoring of bare soil surfaces based on soil characteristics [99]. The SI process involved integrating crop residues into the soil using specialized machinery, resulting in surface transitions through stages of crop cover, residue cover, and bare soil. This progression was evident as a change in the bare soil appearance. Consequently, detecting change points in the BSI time series is crucial for inferring the spatial distribution characteristics of SI.
Table 2.
Confusion matrix results for the eight tillage indices.
To determine the timing of change points in the STI time series, a plot was created using 47 validation points that have undergone SI (Figure 3). The intersection of two curves and within the confidence interval indicates the time at which the change occurred.
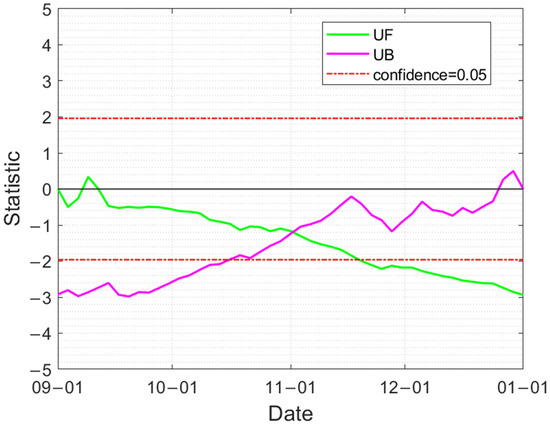
Figure 3.
Visualization of MK test results for the STI time series.
represents the metric for the positive trend in the time series, while denotes the negative trend. indicates a sustained decrease in the time series, while signifies a significant increase in the time series. The intersection of and for the STI within the confidence interval indicates a change point. This change occurred on 25 October 2022, resulting in a decrease in STI values. To determine the average time of SI in the study area, two standard false-color images (composed of bands 8, 4, and 3) were generated from 20 October 2022 to 4 November 2022 (Figure 4). These images indicated that SI at the validation points occurred between 20 to 27 October 2022 and 4 November 2022. The change point detected by the MK test was consistent with the observations from the standard false-color images.
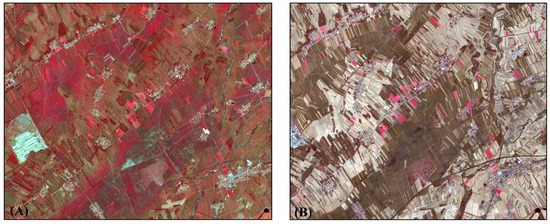
Figure 4.
(A) Pre-SI image captured on 20 October 2022; (B) post-SI image captured on 4 November 2022. In these images, the red band corresponds to Band 8, the green band represents Band 4, and the blue band denotes Band 3.
3.2. Analysis of SI Spatial Distribution in the Study Area
This study generated a remote sensing inversion map for SI in the study area (Figure 5). In this map, orange areas indicate regions where SI occurred, gray areas represent regions without SI, and white areas denote non-arable land. To analyze the spatial distribution of tillage practices, this study utilized crop type data from Northeast China in 2019 and conducted a regional geostatistical analysis using the geostatistical module in ArcGIS v10.7. The results revealed that the proportions of SI in Regions A, B, C, and D were 34.76%, 33.05%, 57.88%, and 22.08%, respectively, with an average SI proportion of 36.10% across typical household mode regions.
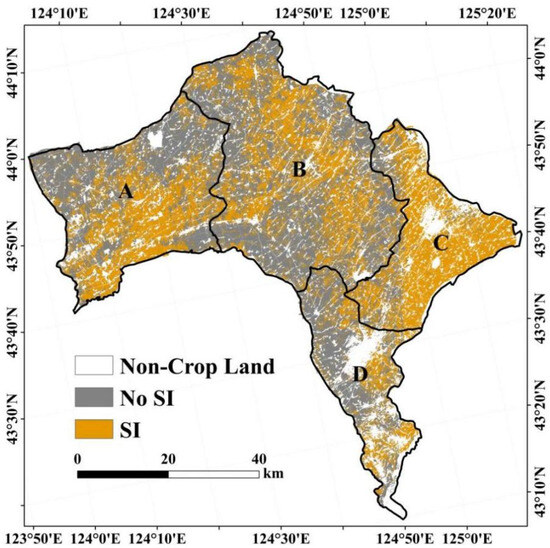
Figure 5.
Spatial distribution of SI remote sensing inversion and soil moisture-based sub-regions (A~D) from 1 September 2022 to 31 December 2022.
Wang et al. [100] indicated that the implementation of SI is influenced by various factors, including black soil thickness, the availability of agricultural machinery, production costs, and farmer awareness. SI technology often requires the incorporation of straw into the soil at a depth of 20 to 30 cm. Notably, the thickness of the black soil layer in the study area decreases from north to south [101]. This variation can affect the effectiveness of SI implementation, as regions with thinner black soil layers may not achieve the desired soil improvement, owing to inadequate SI.
Additionally, the study area exhibits a low availability of SI machines [102], which limits the widespread use of SI technology among local farmers. The shortage of agricultural machinery complicates SI implementation and may increase associated costs, causing some farmers to hesitate when adopting this technology. SI implementation requires additional labor, machinery, and time, all of which contribute to increasing production costs [46]. If these increased costs exceed the anticipated benefits, farmers may be reluctant to implement SI. Furthermore, the maintenance and operational costs of machinery can impose a financial burden on farmers.
Farmer awareness of new technologies directly influences their willingness to adopt these innovations. If farmers lack knowledge about SI technology, they may hesitate to adopt it, owing to uncertainty and perceived risks [103]. Therefore, education and information dissemination are crucial for promoting the adoption of SI among farmers. Elucidating the benefits of SI technology to farmers can increase the likelihood of its adoption. According to the Jilin Daily, areas with SI implementation are mainly concentrated in the northeastern and northern regions of the study area [104], consistent with the SI spatial distribution results obtained in this study. These findings suggest that the MK test method based on GEE is effective for detecting SI implementation across extensive areas. This approach provides a new scientific method for promoting conservation tillage.
3.3. Correlation Analysis Between Spectral Indices and SI
The MK test method was applied to time-series imagery, along with 95 validation points, to investigate correlations between the STI, the BSI, and rainfall with SI. Forty-seven randomly selected sampling points, confirmed to have undergone SI implementation, were used for this analysis. The STI, BSI, and rainfall data for these points were averaged for further evaluation. Figure 6 illustrates the time-series variations in the STI, BSI, and rainfall in SI-treated regions between 1 September and 31 December 2022.
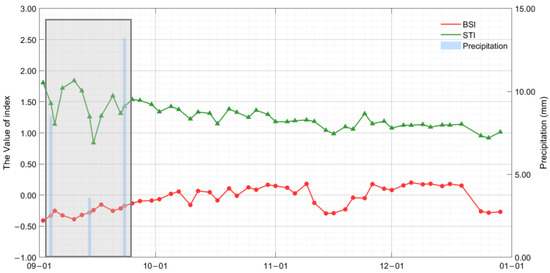
Figure 6.
Time series of STI and BSI spectral indices and the corresponding rainfall data for specific dates.
The gray boxes in Figure 6 highlight three considerable rainfall events, with recorded precipitation levels of 8.54, 3.58, and 13.2 mm. After these rainfall events, the STI and BSI exhibit notable changes. This indicates that rainfall may considerably influence SI and soil properties. An increase in the STI can reflect improvements in soil structure and organic matter content, while a decrease in the BSI suggests a reduction in the bare soil area. These changes serve as positive indicators of enhanced soil health and land management practices.
To further investigate the impact of rainfall on spectral indices, we utilized the function to assess the variation characteristics of the time-series spectral indices. The results obtained from this function were used to identify trends over a specific period. A positive value indicates an increase in the spectral index, a value of zero denotes stability in the index, and a negative value signifies a decrease in the index. Therefore, the function reveals the nature of changes at specific points in the time series and elucidates the overall impact of these changes on the entire sequence [94].
Table 3 provides a comprehensive overview of the relationship between meteorological conditions and the values of the STI and BSI from 1 September to 31 December 2022. The analysis of Table 4 and Figure 6 revealed that considerable changes in spectral indices often occurred during or within one to two days after rainfall events. This observation indicates that these changes may be directly induced by rainfall. Although these changes were evident in the short term, they did not exert lasting effects on the overall trends of the spectral indices.
Table 3.
Weather conditions in the study area and Smk values for the BSI and STI.
Table 4.
Impact of subsidies on profits from SI implementation.
Particularly, the data in Table 4 indicated that most values remained at zero during rainfall events, except for an anomalous increase to 2 for the BSI on 30 September. This suggests that in most cases, the time series did not exhibit considerable changes during these periods. This finding indicates the transient nature of the impact of rainfall on spectral indices and highlights the importance of distinguishing between short-term anomalies and long-term changes in the analysis.
Although rainfall events can trigger immediate adjustments in spectral indices, these changes did not affect their long-term trends. This indicates that the STI and BSI remained stable and reliable indicators for evaluating SI. From 11 November, snow cover gradually accumulated in the study area, leading to a decrease in the BSI and STI [105].
4. Discussion
4.1. Comparative Analysis of BSI and STI Inversion Results
The BSI has an OA of 0.84, which is comparable to that of the STI, ranking it second among the eight spectral indices evaluated (Table 3). The STI is recognized as a critical index for identifying residue cover, which accounts for its high inversion accuracy [106]. In contrast, the BSI mainly characterizes soil changes [107] and has been rarely applied in remote sensing inversions related to SI. SI implementation involves changes in straw and soil. Particularly, the residue that originally covered the soil surface is removed during SI, leading to variations in straw indices such as the STI. Regarding the soil, areas previously covered with residues are re-exposed through SI implementation, which is reflected in BSI.
Both approaches—tracking changes in straw and soil—can potentially yield high inversion accuracy for SI. To investigate the factors contributing to the high accuracy of the BSI, this study compared the responsiveness of the BSI and STI to the SI process. The spatial distribution of SI inferred from the BSI (Figure 7) illustrates the BSI-based remote sensing inversion results.
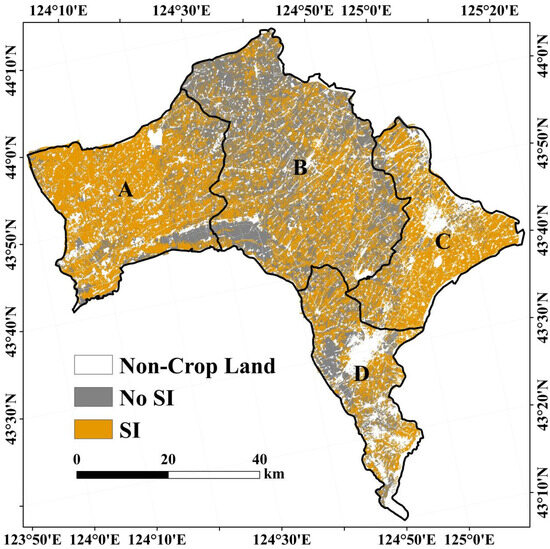
Figure 7.
BSI remote sensing inversion results and soil moisture-based sub-regions (A~D) from 1 September 2022 to 31 December 2022.
Figure 7 presents the BSI-based SI inversion results, with white-marked areas indicating regions where SI has occurred. In 2022, the SI inversion results derived from the BSI were mainly concentrated in Regions A, B, and C within the study area. A statistical analysis of the SI inversion results across the study area was conducted using the geostatistical tools in ArcGIS 10.8. The findings revealed that the SI coverage based on the BSI reached 46.85%, which was 10.75% higher than that determined by the STI-based SI model.
Notably, the SI area in Region A, as derived from the BSI and STI, was 27,900 and 47,500 hectares, respectively. This indicates that the area derived from the STI was 1.7 times larger than that derived from the BSI. Previous research has suggested that BSI performance is influenced by soil composition, soil moisture, and surrounding vegetation. Moreover, the behavior of the BSI varies between humid and arid regions [108,109,110]. In the study area, soil moisture is likely the most influential factor affecting the BSI inversion results. Additionally, this study generated a soil moisture slope change map covering the period from 20 September to 31 October 2022. Figure 8 illustrates the analysis of the relationship between soil moisture variations, SI, and the potential impact on the BSI.
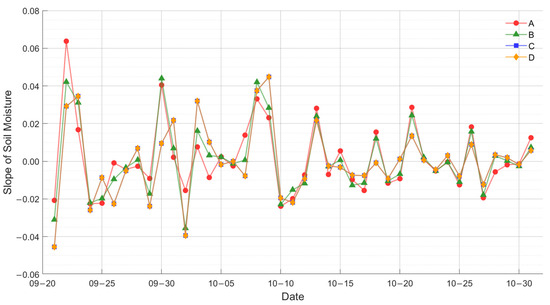
Figure 8.
Soil moisture slope in zones A~D of the study area from 20 September 2022 to 30 October 2022.
Between 1 September and 31 December 2022, Regions A, B, C, and D exhibited average soil moisture levels of 0.26, 0.30, 0.30, and 0.30, respectively. Notably, Region A exhibited a significantly lower average soil moisture than the other three regions. According to local household surveys, the primary SI implementation occurred between 20 September and 30 October, during which the average soil moisture levels in each region were 0.25, 0.29, 0.28, and 0.28, respectively. At this time, the soil moisture in Region A was only 86.21% of that in Region B and 89.29% of the levels in Regions C and D. Additionally, Region A exhibited a significantly higher rate of soil moisture change than the other regions, which was 1.67 times that of Region B and 4.45 times those of Regions C and D.
This indicates that during the SI period, Region A maintained lower levels of soil moisture but exhibited significantly greater variations in soil moisture content compared with the other three regions. Previous studies have shown that the BSI is particularly sensitive to environmental factors, including soil moisture [109,111]. Therefore, the relatively lower soil moisture in Region A may account for the significantly larger SI area calculated using the BSI compared with the STI. This further contributed to the higher accuracy of the BSI in this region compared with the STI.
4.2. Impact of Household Mode on SI
4.2.1. Influence of Policy Factors
Owing to regional specificities and variations in the cultivation choices of farmers, effective crop residue management and utilization are particularly crucial for agricultural production [112,113]. In the study area, farmers often depend on traditional practices without scientific guidance or methods, as confirmed by Cui et al. [114]. To promote the rational use of crop residues, the government has increasingly recognized their value as a recyclable resource. China has implemented five strategies for the comprehensive utilization of crop residues, including converting them into chemical raw materials, animal feed, biofertilizers, industrial fuels, and building materials [115].
To mitigate the environmental pollution caused by straw burning, the Chinese government enacted the “Air Pollution Prevention and Control Law of the People’s Republic of China”, which explicitly prohibits open-air straw burning and imposes fines on violators. This measure has effectively reduced straw burning and promoted the comprehensive utilization of straw [116]. In 2020, the Ministry of Agriculture of China introduced the “Action Plan for the Conservation Tillage of Black Soil in Northeast China (2020–2025)”, which advocates for conservation tillage practices, including SI [117]. In 2021, the central government released the “National Black Soil Conservation Project Implementation Plan (2021–2025)” to protect and restore black soil through conservation tillage measures, including SI, and to establish effective long-term protective plans [118]. Owing to the implementation of these policies, the proportion of SI in China has increased by 26.4%, while the use of chemical fertilizers has decreased by 8% [119]. Overall, policy considerations play a critical role in guiding decision-making regarding the management and utilization of crop residues in agricultural production.
4.2.2. Influence of Economic Factors
In 1980, Popkin [120] introduced the “Rational Peasant Theory”, which indicates that farmers, as rational economic actors, carefully evaluate the marginal benefits and marginal costs when deciding whether to invest in SI. According to the theory, farmers aim to maximize operational profits and minimize risks. Therefore, farmers are likely to implement SI only if the expected benefits outweigh the associated costs [121]. Notably, the methods used for crop residue management and utilization considerably affect agricultural output and household economic returns [122]. Recent studies have indicated that despite a high level of interest and positive attitudes among farmers toward SI, a considerable gap persists between their intentions and practice [123,124]. For example, in the provinces of Hubei, Anhui, and Hebei, 85.5% of farmers expressed a strong willingness to adopt SI, but the actual implementation rate was only 58.2% [125]. This gap indicates the potential difference between theory and practice, highlighting the need for further investigation.
Mechanized straw mulching is considered as the most direct method for utilizing straw resources. After crop harvest, farmers typically chop the straw into smaller pieces and spread it evenly across the fields [126]. Due to the complexities of secondary processes such as crushing and burying, which can affect economic returns, many farmers prefer using rotary tillers for cultivation or simply covering the fields with straw to save time and reduce costs [127]. However, SI implementation requires finely chopping straw and incorporating it into the soil at a depth of 20–38 cm, which often necessitates the use of large agricultural machinery, leading to increased time and capital expenditures [13]. Compared with other countries, China exhibits relatively lower adoption rates for straw crushers, no-till machines, and deep-plowing machines, with slower growth in these areas [102].
In 2019, Hou et al. [128] conducted a survey on farms specializing in corn cultivation within the Northeast China Agricultural Reclamation Systems. The results revealed that, although using or renting crushers and rotary tillers for SI significantly reduces labor costs, the expenses associated with purchasing or renting machinery can lead to increased overall costs [128]. Moreover, Yang et al. [129] suggested that implementing SI and deep plowing resulted in an average increase of RMB 1500 per hectare in farming costs.
In typical regions such as the study area, characterized by the household farming mode, subsidies for SI range from RMB 750 to 1050 per hectare [117]. Wang et al. revealed that SI can significantly increase grain yields by 6.0% to 9.1%. According to the Statistical Yearbook of Jilin and corn prices from the fall season of 2022, the expected benefits from SI are estimated to range between RMB 685 and 1039, as shown in Table 4
Despite the considerable benefits of SI, farmers may hesitate to adopt SI practices if the total subsidies and revenues do not cover the associated costs (Table 4). Financial support is crucial for motivating farmers to adopt new practices, particularly as the benefits of SI—such as improved soil health, enhanced soil fertility, reduced soil erosion, and lower carbon emissions—may take longer to materialize compared with conventional practices. Notably, the meta-analysis indicates that SI can increase SOC by up to 23.7% and reduce N₂O emissions by 12.3–14.3%. By quantifying these climate benefits, farmers could participate in carbon markets, generating additional revenue through carbon credits and thereby offsetting the initial adoption costs [11,130]. Therefore, government subsidy policies are crucial in promoting SI, as they directly influence the production decisions of farmers [131].
Farm mode can reduce their per unit production costs, owing to their size, thereby achieving economies of scale [132]. Larger farms can utilize agricultural machinery more efficiently, further reducing production costs per unit area [133]. For example, Youyi Farm in Heilongjiang Province, Northeast China, achieved an SI rate of 80% in 2021 (https://www.ifuhua.com.cn/policySea/policyDetail/1527222321426134609 (accessed on 15 October 2024)). In contrast, the SI rate in the study area, characterized by the household farming mode, was only 36.10%. Studies have shown that the farm mode exhibits a higher cost tolerance, with its SI strategy involving the deep burial of straw, which enhances soil porosity and oxygen diffusion, thereby promoting the activity of methane-oxidizing bacteria and reducing CH4 emissions. In contrast, the SI strategy in the household mode leads to straw accumulation in shallow soil layers, accelerating anaerobic decomposition, increasing CH4 emissions, and resulting in unstable yields due to restricted root growth [134]. Compared to the household mode, the SI practices in the farm mode have the potential to simultaneously increase rice yields by 15.73% and reduce greenhouse gas emissions by 25.54% [134,135]. This indicates the notable impact of agricultural management modes on SI implementation within the study area.
4.3. Limitations and Prospects
This study introduces a rapid and effective remote sensing method that provides more accurate and comprehensive data on SI, thereby enhancing relevant agricultural management practices. Although the proposed method can successfully invert SI implementation in typical household modes, the study has certain limitations and areas for improvement.
The “salt-and-pepper” noise phenomenon observed in the inversion results negatively affects the accuracy of SI monitoring. Xu et al. [136] indicated that in uniformly managed farmland, SI applications are consistent, making the occurrence of the “salt-and-pepper” phenomenon inconsistent with actual conditions. To address this issue, the object-oriented classification (OOC) method effectively mitigates the phenomenon by segmenting the image into homogeneous regions [137]. Additionally, transfer learning not only reduces the ‘salt-and-pepper’ effect but also lowers the computational cost and workload associated with manually acquiring ground truth samples. Furthermore, it enhances the prediction speed of the UNet++ pruning network [138]. Future research will focus on adopting deep convolutional neural network techniques, such as HRNet and improved PSPNet methods and dilation and erosion techniques, to optimize inversion results [139,140].
Confusion matrices have long been used as a tool for evaluating classification accuracy. These matrices quantify overall accuracy, user accuracy, producer accuracy, and various coefficient metrics by cross-tabulating remotely sensed classification outputs with field-collected reference data [141]. However, the inherent uncertainties associated with this method have been questioned by some researchers. The reliability of a confusion matrix depends on the accuracy and representativeness of the ground truth data; if the ground truth data are erroneous or incomplete, the evaluation derived from the confusion matrix may be biased, potentially compromising the assessment of classification accuracy [142,143]. To address these issues, we plan to employ more advanced and accurate evaluation metrics in our future research to further analyze the results.
This study considered only a single spectral index for SI inversion and did not thoroughly explore the potential benefits of spectral index synergy. Spectral index synergy, which combines remote sensing data from different bands, can provide a more comprehensive representation of complex surface conditions [144,145]. In specific SI application scenarios, spectral index synergy can effectively capture the interactions and differences between soil, vegetation, and straw. For example, some spectral indices are sensitive to SI and soil moisture, while others may considerably respond to soil moisture. By integrating these indices, researchers could achieve more robust and accurate SI inversion results. However, studies have shown that many composite features, particularly those derived from simple mathematical operations, tend to be redundant and fail to fully capture the complex relationship between crop residue and soil surface roughness. This redundancy can hinder the accurate representation of soil surface characteristics, and as a result, simplistic index fusion methods may compromise the accuracy of inversion [146]. Future research should focus on a detailed comparison and analysis of different spectral index combinations for SI inversion to achieve optimal results. Simultaneously, we will place a strong emphasis on monitoring the spatial distribution of SI over extended time series, investigating its effects on soil quality, crop yield, environmental sustainability, and other related factors. The research and application of spectral index synergy present new methods for the remote monitoring of SI and enhancing the value of remote sensing data in agricultural and environmental management.
5. Conclusions
The household mode in Northeast China greatly influences agricultural productivity but faces soil erosion and reduced fertility, owing to intensive farming practices. Implementing SI can enhance soil nutrient levels, reduce fertilizer reliance, improve grain yields, and lower greenhouse gas emissions. Therefore, the effective remote sensing monitoring of SI distribution is crucial for policymakers and agricultural practitioners. This study selected eight spectral indices closely related to SI and utilized the MK test method on the GEE platform to analyze trends in time series. Based on the observed trends in SI, SI data were retrieved across the study area. Furthermore, the most suitable spectral indices for monitoring SI were identified through validation with field-measured data. Therefore, the study investigated the spatiotemporal distribution patterns of SI in the study area. From the analysis of the results, the following conclusions can be drawn:
The remote sensing inversion of SI based on the GEE platform and the MK algorithm exhibited high applicability and accuracy in household farming. SI data were successfully retrieved over a large-scale area through MK trend analysis on Sentinel-2 remote sensing images using the GEE platform. The OA of SI in the study area, obtained through the STI inversion, was 0.85. This indicates the effectiveness and accuracy of the GEE-based MK algorithm for monitoring SI within the household farming mode.
Regarding remote sensing retrieval for the household mode, the STI and BSI indices achieved high accuracy, while the other six spectral indices exhibited lower accuracy. The comparison of SI retrieval accuracy among the eight spectral indices revealed that the STI and BSI indices achieved overall OAs of 0.85 and 0.84, respectively. In contrast, the remaining six indices exhibited lower OA values ranging from 0.28 to 0.47. This suggests that the high accuracy of the STI index was mainly due to its reliance on information from only the B11 and B12 bands, which minimized potential interference from other bands. Moreover, the BSI index, a key indicator of bare soil changes, effectively reflected SI implementation, contributing to its OA value of 0.84.
Geostatistical analysis revealed that the SI rate in the study area was 36.10%. Particularly, Regions A, B, C, and D exhibited SI rates of 34.76%, 33.05%, 57.88%, and 22.08%, respectively. These findings indicate that SI implementation was mainly concentrated in the eastern part of the study area, while the southern region had the lowest SI rate. In household farming, the implementation of SI was considerably influenced by economic and policy factors. From an economic perspective, the profitability of farming notably influenced the decisions of farmers regarding SI implementation. Farmers were likely to adopt SI only if the anticipated benefits and state subsidies exceeded the associated costs. In the study area, the potential revenue from SI per hectare of farmland ranged from RMB −65 to 589, indicating that higher subsidies were crucial for motivating farmers to implement SI practices. From a policy perspective, strict prohibitions on straw burning and associated fines for violations effectively mitigated this practice, thereby promoting SI implementation. Therefore, government subsidies and policy guidance are crucial for motivating farmers to adopt SI practices.
Overall, this study introduces a new approach for monitoring SI and supporting regional agricultural development through large-scale remote sensing inversion. Despite the “salt-and-pepper” phenomenon observed in the retrieval results obtained from the MK test, future research will focus on incorporating deep learning techniques to improve the accuracy of remote sensing retrieval. Additionally, future studies will explore the integration of spectral indices in SI retrieval to further enhance the effectiveness of remote sensing data in agricultural and environmental management.
Supplementary Materials
The following supporting information can be downloaded at https://www.mdpi.com/article/10.3390/rs17050933/s1, Table S1: Summary of Sentinel-2 band parameters.
Author Contributions
Conceptualization, J.L. and J.D.; methodology, J.L. and W.Z.; software, J.L. and W.Z.; validation, K.S. (Kaishan Song) and K.S. (Kewen Shao); formal analysis, W.Y.; investigation, J.L., W.Y., and Y.H.; resources, K.S. (Kaishan Song) and K.Z.; data curation, J.Q.; writing—original draft preparation, J.L. and W.Z.; writing—review and editing, J.D.; visualization, Z.L. and C.Z.; supervision, J.D. project administration, J.D.; funding acquisition, J.D. All authors have read and agreed to the published version of the manuscript.
Funding
The National Key Research and Development Program of China [grant number 2021YFD1500103-2]; the Science and Technology Project for Black Soil Granary [grant number XDA28080501]; and the Common Application Support Platform for National Civil Space Infrastructure Land Observation Satellites [grant number 2017-000052-73-01-001735]. Moreover, sincere gratitude is extended to the editor and the anonymous reviewers who provided professional comments for this paper. Finally, the author would especially like to thank Charlesworth Author Services for their support and feedback regarding the proofreading of this work.
Data Availability Statement
The data presented in this study are available on request from the corresponding author. The data are not publicly available due to privacy/ethical restrictions.
Conflicts of Interest
The authors declare no conflicts of interest.
References
- Song, Y.; Zhang, B.; Wang, J.; Kwek, K. The impact of climate change on China’s agricultural green total factor productivity. Technol. Forecast. Soc. Chang. 2022, 185, 122054. [Google Scholar] [CrossRef]
- Alexander, P.; Arneth, A.; Henry, R.; Maire, J.; Rabin, S.; Rounsevell, M.D.A. High Energy and Fertilizer Prices Are More Damaging than Food Export Curtailment from Ukraine and Russia for Food Prices, Health and the Environment. Nat. Food 2022, 4, 84–95. [Google Scholar] [CrossRef]
- Falcon, W.P.; Naylor, R.L.; Shankar, N.D. Rethinking Global Food Demand for 2050. Popul. Dev. Rev. 2022, 48, 921–957. [Google Scholar] [CrossRef]
- Borrelli, P.; Lugato, E.; Montanarella, L.; Panagos, P. A New Assessment of Soil Loss Due to Wind Erosion in European Agricultural Soils Using a Quantitative Spatially Distributed Modelling Approach. Land Degrad. Dev. 2017, 28, 335–344. [Google Scholar] [CrossRef]
- Prăvălie, R.; Săvulescu, I.; Patriche, C.; Dumitraşcu, M.; Bandoc, G. Spatial Assessment of Land Degradation Sensitive Areas in Southwestern Romania Using Modified MEDALUS Method. CATENA 2017, 153, 114–130. [Google Scholar] [CrossRef]
- Zhu, Q.; Guo, X.; Guo, J.; Wu, J.; Ye, Y.; Cai, W.; Liu, S. The Quality Attribute of Watershed Ecosystem Is More Important than the Landscape Attribute in Controlling Erosion of Red Soil in Southern China. Int. Soil Water Conserv. Res. 2022, 10, 507–517. [Google Scholar] [CrossRef]
- Ma, L.; Kong, F.; Wang, Z.; Luo, Y.; Lv, X.; Zhou, Z.; Meng, Y. Growth and Yield of Cotton as Affected by Different Straw Returning Modes with an Equivalent Carbon Input. Field Crops Res. 2019, 243, 107616. [Google Scholar] [CrossRef]
- Yin, H.; Zhao, W.; Li, T.; Cheng, X.; Liu, Q. Balancing Straw Returning and Chemical Fertilizers in China: Role of Straw Nutrient Resources. Renew. Sustain. Energy Rev. 2018, 81, 2695–2702. [Google Scholar] [CrossRef]
- Wang, Y.; Wu, P.; Mei, F.; Ling, Y.; Qiao, Y.; Liu, C.; Leghari, S.J.; Guan, X.; Wang, T. Does Continuous Straw Returning Keep China Farmland Soil Organic Carbon Continued Increase? A Meta-Analysis. J. Environ. Manag. 2021, 288, 112391. [Google Scholar] [CrossRef]
- Huang, T.; Yang, N.; Lu, C.; Qin, X.; Siddique, K.H.M. Soil Organic Carbon, Total Nitrogen, Available Nutrients, and Yield under Different Straw Returning Methods. Soil Tillage Res. 2021, 214, 105171. [Google Scholar] [CrossRef]
- Wang, L.; Qin, T.; Liu, T.; Guo, L.; Li, C.; Zhai, Z. Inclusion of Microbial Inoculants with Straw Mulch Enhances Grain Yields from Rice Fields in Central China. Food Energy Secur. 2020, 9, e230. [Google Scholar] [CrossRef]
- Liu, H.Q.; Yang, J.H.; Liu, C.X.; Diao, Y.F.; Ma, D.P.; Li, F.H.; Rahma, A.E.; Lei, T.W. Flow Velocity on Cultivated Soil Slope with Wheat Straw Incorporation. J. Hydrol. 2020, 584, 124667. [Google Scholar] [CrossRef]
- Wu, G.; Ling, J.; Zhao, D.-Q.; Xu, Y.-P.; Liu, Z.-X.; Wen, Y.; Zhou, S.-L. Deep-Injected Straw Incorporation Improves Subsoil Fertility and Crop Productivity in a Wheat-Maize Rotation System in the North China Plain. Field Crops Res. 2022, 286, 108612. [Google Scholar] [CrossRef]
- Yao, Q.; Liu, J.; Yu, Z.; Li, Y.; Jin, J.; Liu, X.; Wang, G. Three years of biochar amendment alters soil physiochemical properties and fungal community composition in a black soil of northeast China. Soil Biol. Biochem. 2017, 110, 56–67. [Google Scholar] [CrossRef]
- Li, H.; Yao, Y.; Zhang, X.; Zhu, H.; Wei, X. Changes in Soil Physical and Hydraulic Properties Following the Conversion of Forest to Cropland in the Black Soil Region of Northeast China. CATENA 2021, 198, 104986. [Google Scholar] [CrossRef]
- Dong, Y.; Wu, Y.; Qin, W.; Guo, Q.; Yin, Z.; Duan, X. The Gully Erosion Rates in the Black Soil Region of Northeastern China: Induced by Different Processes and Indicated by Different Indexes. CATENA 2019, 182, 104146. [Google Scholar] [CrossRef]
- Wu, X.; Yang, Y.; He, T.; Wang, Y.; Wendroth, O.; Liu, B. Mechanical Sowing Alters Slope-Scale Spatial Variability of Saturated Hydraulic Conductivity in the Black Soil Region of Northeast China. CATENA 2022, 212, 106115. [Google Scholar] [CrossRef]
- Quan, Z.; Li, S.; Zhu, F.; Zhang, L.; He, J.; Wei, W.; Fang, Y. Fates of 15N-Labeled Fertilizer in a Black Soil-Maize System and the Response to Straw Incorporation in Northeast China. J. Soils Sediments 2018, 18, 1441–1452. [Google Scholar] [CrossRef]
- Xie, Y.; Lin, H.; Ye, Y.; Ren, X. Changes in Soil Erosion in Cropland in Northeastern China over the Past 300 Years. CATENA 2019, 176, 410–418. [Google Scholar] [CrossRef]
- Zheng, H.; Liu, W.; Zheng, J.; Luo, Y.; Li, R.; Wang, H.; Qi, H. Effect of Long-Term Tillage on Soil Aggregates and Aggregate-Associated Carbon in Black Soil of Northeast China. PLoS ONE 2018, 13, e0199523. [Google Scholar] [CrossRef]
- Wang, X.; Jia, Z.; Liang, L.; Zhao, Y.; Yang, B.; Ding, R.; Wang, J.; Nie, J. Changes in Soil Characteristics and Maize Yield under Straw Returning System in Dryland Farming. Field Crops Res. 2018, 218, 11–17. [Google Scholar] [CrossRef]
- Wang, Y.; Wang, S.; Adhikari, K.; Wang, Q.; Sui, Y.; Xin, G. Effect of Cultivation History on Soil Organic Carbon Status of Arable Land in Northeastern China. Geoderma 2019, 342, 55–64. [Google Scholar] [CrossRef]
- Han, X.; Zou, W. Effects and Suggestions of Black Soil Protection and Soil Fertility Increase in Northeast China. Bull. Chin. Acad. Sci. 2018, 33, 206–212. [Google Scholar]
- Kan, Z.-R.; Wang, Z.; Chen, W.; Virk, A.L.; Li, F.-M.; Liu, J.; Xue, Y.; Yang, H. Soil Organic Carbon Regulates CH4 Production through Methanogenic Evenness and Available Phosphorus under Different Straw Managements. J. Environ. Manag. 2023, 328, 116990. [Google Scholar] [CrossRef] [PubMed]
- Xiang, X.; Du, J.; Jacinthe, P.-A.; Zhao, B.; Zhou, H.; Liu, H.; Song, K. Integration of Tillage Indices and Textural Features of Sentinel-2A Multispectral Images for Maize Residue Cover Estimation. Soil Tillage Res. 2022, 221, 105405. [Google Scholar] [CrossRef]
- Li, J.; Yu, W.; Du, J.; Song, K.; Xiang, X.; Liu, H.; Zhang, Y.; Zhang, W.; Zheng, Z.; Wang, Y.; et al. Mapping Maize Tillage Practices over the Songnen Plain in Northeast China Using GEE Cloud Platform. Remote Sens. 2023, 15, 1461. [Google Scholar] [CrossRef]
- Najafi, P.; Navid, H.; Feizizadeh, B.; Eskandari, I.; Blaschke, T. Fuzzy Object-Based Image Analysis Methods Using Sentinel-2A and Landsat-8 Data to Map and Characterize Soil Surface Residue. Remote Sens. 2019, 11, 2583. [Google Scholar] [CrossRef]
- Wang, S.; Guan, K.; Zhang, C.; Zhou, Q.; Wang, S.; Wu, X.; Jiang, C.; Peng, B.; Mei, W.; Li, K.; et al. Cross-Scale Sensing of Field-Level Crop Residue Cover: Integrating Field Photos, Airborne Hyperspectral Imaging, and Satellite Data. Remote Sens. Environ. 2023, 285, 113366. [Google Scholar] [CrossRef]
- Tian, J.; Zhu, X.; Wan, L.; Collin, M. Impacts of Satellite Revisit Frequency on Spring Phenology Monitoring of Deciduous Broad-Leaved Forests Based on Vegetation Index Time Series. IEEE J. Sel. Top. Appl. Earth Obs. Remote Sens. 2021, 14, 10500–10508. [Google Scholar] [CrossRef]
- Woodcock, C.E.; Loveland, T.R.; Herold, M.; Bauer, M.E. Transitioning from Change Detection to Monitoring with Remote Sensing: A Paradigm Shift. Remote Sens. Environ. 2020, 238, 111558. [Google Scholar] [CrossRef]
- Zeng, L.; Wardlow, B.D.; Xiang, D.; Hu, S.; Li, D. A Review of Vegetation Phenological Metrics Extraction Using Time-Series, Multispectral Satellite Data. Remote Sens. Environ. 2020, 237, 111511. [Google Scholar] [CrossRef]
- Moon, M.; Seyednasrollah, B.; Richardson, A.D.; Friedl, M.A. Using Time Series of MODIS Land Surface Phenology to Model Temperature and Photoperiod Controls on Spring Greenup in North American Deciduous Forests. Remote Sens. Environ. 2021, 260, 112466. [Google Scholar] [CrossRef]
- Chen, B.; Huang, B.; Xu, B. Multi-Source Remotely Sensed Data Fusion for Improving Land Cover Classification. ISPRS J. Photogramm. Remote Sens. 2017, 124, 27–39. [Google Scholar] [CrossRef]
- Veh, G.; Korup, O.; Roessner, S.; Walz, A. Detecting Himalayan Glacial Lake Outburst Floods from Landsat Time Series. Remote Sens. Environ. 2018, 207, 84–97. [Google Scholar] [CrossRef]
- Maffei, C.; Lindenbergh, R.; Menenti, M. Combining Multi-Spectral and Thermal Remote Sensing to Predict Forest Fire Characteristics. ISPRS J. Photogramm. Remote Sens. 2021, 181, 400–412. [Google Scholar] [CrossRef]
- Zhang, X.; Liu, L.; Zhao, T.; Chen, X.; Lin, S.; Wang, J.; Mi, J.; Liu, W. GWL_FCS30: A Global 30 m Wetland Map with a Fine Classification System Using Multi-Sourced and Time-Series Remote Sensing Imagery in 2020. Earth Syst. Sci. Data 2023, 15, 265–293. [Google Scholar] [CrossRef]
- Lin, L.; Hao, Z.; Post, C.J.; Mikhailova, E.A. Monitoring Ecological Changes on a Rapidly Urbanizing Island Using a Remote Sensing-Based Ecological Index Produced Time Series. Remote Sens. 2022, 14, 5773. [Google Scholar] [CrossRef]
- Kumar, L.; Mutanga, O. Google Earth Engine Applications since Inception: Usage, Trends, and Potential. Remote Sens. 2018, 10, 1509. [Google Scholar] [CrossRef]
- Tamiminia, H.; Salehi, B.; Mahdianpari, M.; Quackenbush, L.; Adeli, S.; Brisco, B. Google Earth Engine for Geo-Big Data Applications: A Meta-Analysis and Systematic Review. ISPRS J. Photogramm. Remote Sens. 2020, 164, 152–170. [Google Scholar] [CrossRef]
- Gorelick, N.; Hancher, M.; Dixon, M.; Ilyushchenko, S.; Thau, D.; Moore, R. Google Earth Engine: Planetary-Scale Geospatial Analysis for Everyone. Remote Sens. Environ. 2017, 202, 18–27. [Google Scholar] [CrossRef]
- Mullissa, A.; Vollrath, A.; Odongo-Braun, C.; Slagter, B.; Balling, J.; Gou, Y.; Gorelick, N.; Reiche, J. Sentinel-1 SAR Backscatter Analysis Ready Data Preparation in Google Earth Engine. Remote Sens. 2021, 13, 1954. [Google Scholar] [CrossRef]
- Mahdianpari, M.; Salehi, B.; Mohammadimanesh, F.; Homayouni, S.; Gill, E. The First Wetland Inventory Map of Newfoundland at a Spatial Resolution of 10 m Using Sentinel-1 and Sentinel-2 Data on the Google Earth Engine Cloud Computing Platform. Remote Sens. 2018, 11, 43. [Google Scholar] [CrossRef]
- Huang, H.; Chen, Y.; Clinton, N.; Wang, J.; Wang, X.; Liu, C.; Gong, P.; Yang, J.; Bai, Y.; Zheng, Y.; et al. Mapping Major Land Cover Dynamics in Beijing Using All Landsat Images in Google Earth Engine. Remote Sens. Environ. 2017, 202, 166–176. [Google Scholar] [CrossRef]
- Deines, J.M.; Kendall, A.D.; Crowley, M.A.; Rapp, J.; Cardille, J.A.; Hyndman, D.W. Mapping Three Decades of Annual Irrigation across the US High Plains Aquifer Using Landsat and Google Earth Engine. Remote Sens. Environ. 2019, 233, 111400. [Google Scholar] [CrossRef]
- Kong, D.; Zhang, Y.; Gu, X.; Wang, D. A Robust Method for Reconstructing Global MODIS EVI Time Series on the Google Earth Engine. ISPRS J. Photogramm. Remote Sens. 2019, 155, 13–24. [Google Scholar] [CrossRef]
- Lu, H.; Hu, L.; Zheng, W.; Yao, S.; Qian, L. Impact of household land endowment and environmental cognition on the willingness to implement straw incorporation in China. J. Clean. Prod. 2020, 262, 121479. [Google Scholar] [CrossRef]
- Xue, X.; Ma, Y.; Chen, C. Research on the Corn Straw Return Mode and Key Machinery Selection in Agricultural Farms. Master’s Thesis, Heilongjiang Bayi Agricultural University, Daqing, China, 2020. [Google Scholar] [CrossRef]
- Wang, S.; Yin, C.; Li, F.; Richel, A. Innovative incentives can sustainably enhance the achievement of straw burning control in China. Sci. Total Environ. 2023, 857, 159498. [Google Scholar] [CrossRef]
- Qi, Y.; Hou, Y.; Li, Y.; Li, L.; Zhang, J.; Chang, Y.; Zhu, D. The price gap between state-owned and collective farmlands: Evidence from Xinjiang and Heilongjiang, China. Land Use Policy 2023, 124, 106460. [Google Scholar] [CrossRef]
- Lee, C.; De Vries, W.T. Bridging the Semantic Gap between Land Tenure and EO Data: Conceptual and Methodological Underpinnings for a Geospatially Informed Analysis. Remote Sens. 2020, 12, 255. [Google Scholar] [CrossRef]
- Yang, H.; Wang, H.; Fu, G.; Yan, H.; Zhao, P.; Ma, M. A Modified Soil Water Deficit Index (MSWDI) for Agricultural Drought Monitoring: Case Study of Songnen Plain, China. Agric. Water Manag. 2017, 194, 125–138. [Google Scholar] [CrossRef]
- Li, B.; Huang, F.; Qin, L.; Qi, H.; Sun, N. Spatio-Temporal Variations of Carbon Use Efficiency in Natural Terrestrial Ecosystems and the Relationship with Climatic Factors in the Songnen Plain, China. Remote Sens. 2019, 11, 2513. [Google Scholar] [CrossRef]
- Yu, W.; Zhang, L.; Zhang, H.; Jiang, L.; Zhang, A.; Pan, T. Effect of Farmland Expansion on Drought over the Past Century in Songnen Plain, Northeast China. J. Geogr. Sci. 2020, 30, 439–454. [Google Scholar] [CrossRef]
- Zhao, R.; He, P.; Xie, J.; Johnston, A.M.; Xu, X.; Qiu, S.; Zhao, S. Ecological Intensification Management of Maize in Northeast China: Agronomic and Environmental Response. Agric. Ecosyst. Environ. 2016, 224, 123–130. [Google Scholar] [CrossRef]
- Zhang, J.; Wang, J.; Chen, S.; Wang, M.; Tang, S.; Zhao, W. Integrated Risk Assessment of Agricultural Drought Disasters in the Major Grain-Producing Areas of Jilin Province, China. Land 2023, 12, 160. [Google Scholar] [CrossRef]
- Wang, R.; Zhang, J.; Wang, C.; Guo, E. Characteristic Analysis of Droughts and Waterlogging Events for Maize Based on a New Comprehensive Index through Coupling of Multisource Data in Midwestern Jilin Province, China. Remote Sens. 2019, 12, 60. [Google Scholar] [CrossRef]
- Li, H.; Zhu, H.; Qiu, L.; Wei, X.; Liu, B.; Shao, M. Response of Soil OC, N and P to Land-Use Change and Erosion in the Black Soil Region of the Northeast China. Agric. Ecosyst. Environ. 2020, 302, 107081. [Google Scholar] [CrossRef]
- Xu, X.; Chen, S.; Xu, Z.; Yu, Y.; Zhang, S.; Dai, R. Exploring Appropriate Preprocessing Techniques for Hyperspectral Soil Organic Matter Content Estimation in Black Soil Area. Remote Sens. 2020, 12, 3765. [Google Scholar] [CrossRef]
- Zhao, P.; Li, S.; Wang, E.; Chen, X.; Deng, J.; Zhao, Y. Tillage Erosion and Its Effect on Spatial Variations of Soil Organic Carbon in the Black Soil Region of China. Soil Tillage Res. 2018, 178, 72–81. [Google Scholar] [CrossRef]
- Zhang, M.; Liu, H.; Zhang, M.; Yang, H.; Jin, Y.; Han, Y.; Tang, H.; Zhang, X.; Zhang, X. Mapping Soil Organic Matter and Analyzing the Prediction Accuracy of Typical Cropland Soil Types on the Northern Songnen Plain. Remote Sens. 2021, 13, 5162. [Google Scholar] [CrossRef]
- Lu, H.; Chen, Y.; Zhang, P.; Huan, H.; Xie, H.; Hu, H. Impacts of farmland size and benefit expectations on the utilization of straw resources: Evidence from crop straw incorporation in China. Soil Use Manag. 2022, 38, 929–939. [Google Scholar] [CrossRef]
- Mondal, P.; McDermid, S.S.; Qadir, A. A Reporting Framework for Sustainable Development Goal 15: Multi-Scale Monitoring of Forest Degradation Using MODIS, Landsat and Sentinel Data. Remote Sens. Environ. 2020, 237, 111592. [Google Scholar] [CrossRef]
- Panigada, C.; Tagliabue, G.; Zaady, E.; Rozenstein, O.; Garzonio, R.; Di Mauro, B.; De Amicis, M.; Colombo, R.; Cogliati, S.; Miglietta, F.; et al. A New Approach for Biocrust and Vegetation Monitoring in Drylands Using Multi-Temporal Sentinel-2 Images. Prog. Phys. Geogr. Earth Environ. 2019, 43, 496–520. [Google Scholar] [CrossRef]
- Karra, K.; Kontgis, C.; Statman-Weil, Z.; Mazzariello, J.C.; Mathis, M.; Brumby, S.P. Global Land Use/Land Cover with Sentinel 2 and Deep Learning. In Proceedings of the 2021 IEEE International Geoscience and Remote Sensing Symposium IGARSS, Brussels, Belgium, 11 July 2021; pp. 4704–4707. [Google Scholar]
- Caballero, I.; Navarro, G. Monitoring cyanoHABs and Water Quality in Laguna Lake (Philippines) with Sentinel-2 Satellites during the 2020 Pacific Typhoon Season. Sci. Total Environ. 2021, 788, 147700. [Google Scholar] [CrossRef] [PubMed]
- Handbook, S.U.; Tools, E. Sentinel-2 User Handbook. In ESA Standard Document; European Space Agency: Paris, France, 2015; Volume 1, pp. 1–64. [Google Scholar]
- Sola, I.; García-Martín, A.; Sandonís-Pozo, L.; Álvarez-Mozos, J.; Pérez-Cabello, F.; González-Audícana, M.; Montorio Llovería, R. Assessment of Atmospheric Correction Methods for Sentinel-2 Images in Mediterranean Landscapes. Int. J. Appl. Earth Obs. Geoinform. 2018, 73, 63–76. [Google Scholar] [CrossRef]
- You, N.; Dong, J.; Huang, J.; Du, G.; Zhang, G.; He, Y.; Yang, T.; Di, Y.; Xiao, X. The 10-m Crop Type Maps in Northeast China during 2017–2019. Sci. Data 2021, 8, 41. [Google Scholar] [CrossRef]
- Das, N.N.; Entekhabi, D.; Dunbar, R.S.; Colliander, A.; Chen, F.; Crow, W.; Jackson, T.J.; Berg, A.; Bosch, D.D.; Caldwell, T.; et al. The SMAP mission combined active-passive soil moisture product at 9 km and 3 km spatial resolutions. Remote Sens. Environ. 2018, 211, 204–217. [Google Scholar] [CrossRef]
- Reichle, R.H.; Liu, Q.; Koster, R.D.; Ardizzone, J.V.; Colliander, A.; Crow, W.T.; De Lannoy, G.J.; Kimball, J.S. Soil Moisture Active Passive (SMAP) Project Assessment Report for Version 6 of the L4_SM Data Product. Tech. Rep. Ser. Glob. Model. Data Assim. 2018, 52, 1–67. [Google Scholar]
- Mishra, A.; Vu, T.; Veettil, A.V.; Entekhabi, D. Drought monitoring with soil moisture active passive (SMAP) measurements. J. Hydrol. 2017, 552, 620–632. [Google Scholar] [CrossRef]
- Farahani, A.; Moradikhaneghahi, M.; Ghayoomi, M.; Jacobs, J.M. Application of Soil Moisture Active Passive (SMAP) Satellite Data in Seismic Response Assessment. Remote Sens. 2022, 14, 4375. [Google Scholar] [CrossRef]
- Cosh, M.H.; White, W.A.; Colliander, A.; Jackson, T.J.; Prueger, J.H.; Hornbuckle, B.K.; Hunt, E.R.; McNairn, H.; Powers, J.; Walker, V.A. Estimating vegetation water content during the soil moisture active passive validation experiment 2016. J. Appl. Remote Sens. 2019, 13, 014516. [Google Scholar] [CrossRef]
- Reichle, R.H.; Ardizzone, J.V.; Kim, G.-K.; Lucchesi, R.A.; Smith, E.B.; Weiss, B.H. Soil Moisture Active Passive (SMAP) Mission Level 4 Surface and Root Zone Soil Moisture (L4_SM) Product Specification Document; Global Modeling and Assimilation Office, Earth Sciences Division, NASA Goddard Space Flight Center: Greenbelt, MD, USA, 2022. [Google Scholar]
- Tian, Y.; Xiong, L.; Xiong, B.; Zhuang, R. A Prior Estimation of the Spatial Distribution Parameter of Soil Moisture Storage Capacity Using Satellite-Based Root-Zone Soil Moisture Data. Remote Sens. 2019, 11, 2580. [Google Scholar] [CrossRef]
- Seifi, M.; Ahmadi, A.; Neyshabouri, M.-R.; Taghizadeh-Mehrjardi, R.; Bahrami, H.-A. Remote and Vis-NIR Spectra Sensing Potential for Soil Salinization Estimation in the Eastern Coast of Urmia Hyper Saline Lake, Iran. Remote Sens. Appl. Soc. Environ. 2020, 20, 100398. [Google Scholar] [CrossRef]
- Liu, W.; Liu, Y.; Liu, G.; Xie, R.; Ming, B.; Yang, Y.; Guo, X.; Wang, K.; Xue, J.; Wang, Y. Estimation of Maize Straw Production and Appropriate Straw Return Rate in China. Agric. Ecosyst. Environ. 2022, 328, 107865. [Google Scholar] [CrossRef]
- Daughtry, C.S. Discriminating Crop Residues from Soil by Shortwave Infrared Reflectance. Agron. J. 2001, 93, 125–131. [Google Scholar] [CrossRef]
- Castaldi, F.; Chabrillat, S.; Don, A.; Van Wesemael, B. Soil Organic Carbon Mapping Using LUCAS Topsoil Database and Sentinel-2 Data: An Approach to Reduce Soil Moisture and Crop Residue Effects. Remote Sens. 2019, 11, 2121. [Google Scholar] [CrossRef]
- Cai, W.; Zhao, S.; Wang, Y.; Peng, F.; Heo, J.; Duan, Z. Estimation of Winter Wheat Residue Coverage Using Optical and SAR Remote Sensing Images. Remote Sens. 2019, 11, 1163. [Google Scholar] [CrossRef]
- Van Deventer, A.P.; Ward, A.D.; Gowda, P.H.; Lyon, J.G. Using Thematic Mapper Data to Identify Contrasting Soil Plains and Tillage Practices. Photogramm. Eng. Remote Sens. 1997, 63, 87–93. [Google Scholar]
- McNairn, H.; Protz, R. Mapping Corn Residue Cover on Agricultural Fields in Oxford County, Ontario, Using Thematic Mapper. Can. J. Remote Sens. 1993, 19, 152–159. [Google Scholar] [CrossRef]
- Jin, X.; Ma, J.; Wen, Z.; Song, K. Estimation of Maize Residue Cover Using Landsat-8 OLI Image Spectral Information and Textural Features. Remote Sens. 2015, 7, 14559–14575. [Google Scholar] [CrossRef]
- Qi, J.; Marsett, R.; Heilman, P.; Bieden-bender, S.; Moran, S.; Goodrich, D.; Weltz, M. RANGES Improves Satellite-Based Information and Land Cover Assessments in Southwest United States. Eos Trans. Am. Geophys. Union 2002, 83, 601. [Google Scholar] [CrossRef]
- Sullivan, D.G.; Truman, C.C.; Schomberg, H.H.; Endale, D.M.; Strickland, T.C. Evaluating Techniques for Determining Tillage Regime in the Southeastern Coastal Plain and Piedmont. Agron. J. 2006, 98, 1236–1246. [Google Scholar] [CrossRef]
- Rikimaru, A.; Roy, P.S.; Miyatake, S. Tropical Forest Cover Density Mapping. Trop. Ecol. 2002, 43, 39–47. [Google Scholar]
- Wang, F.; Shao, W.; Yu, H.; Kan, G.; He, X.; Zhang, D.; Ren, M.; Wang, G. Re-Evaluation of the Power of the Mann-Kendall Test for Detecting Monotonic Trends in Hydrometeorological Time Series. Front. Earth Sci. 2020, 8, 14. [Google Scholar] [CrossRef]
- Mann, H.B. Nonparametric Tests against Trend. Econom. J. Econom. Soc. 1945, 13, 245–259. [Google Scholar] [CrossRef]
- Kendall, M.G. Rank Correlation Methods, 4th ed.; Charles Griffin & Company Limited: London, UK, 1984. [Google Scholar]
- Collaud Coen, M.; Andrews, E.; Bigi, A.; Martucci, G.; Romanens, G.; Vogt, F.; Vuilleumier, L. Effects of the Prewhitening Method, the Time Granularity, and the Time Segmentation on the Mann–Kendall Trend Detection and the Associated Sen’s Slope. Atmos. Meas. Tech. 2020, 13, 6945–6964. [Google Scholar] [CrossRef]
- Güçlü, Y.S. Multiple Şen-Innovative Trend Analyses and Partial Mann-Kendall Test. J. Hydrol. 2018, 566, 685–704. [Google Scholar] [CrossRef]
- Gadedjisso-Tossou, A.; Adjegan, K.I.; Kablan, A.K.M. Rainfall and Temperature Trend Analysis by Mann-Kendall Test and Significance for Rainfed Cereal Yields in Northern Togo. Science 2020, 2, 17. [Google Scholar]
- Güçlü, Y.S. Improved Visualization for Trend Analysis by Comparing with Classical Mann-Kendall Test and ITA. J. Hydrol. 2020, 584, 124674. [Google Scholar] [CrossRef]
- Xu, H.; Wang, Y.; Guan, H.; Shi, T.; Hu, X. Detecting Ecological Changes with a Remote Sensing Based Ecological Index (RSEI) Produced Time Series and Change Vector Analysis. Remote Sens. 2019, 11, 2345. [Google Scholar] [CrossRef]
- Liu, S.; Wu, Y.; Xu, G.; Cheng, S.; Zhong, Y.; Zhang, Y. Characterizing the 2022 Extreme Drought Event over the Poyang Lake Basin Using Multiple Satellite Remote Sensing Observations and In Situ Data. Remote Sens. 2023, 15, 5125. [Google Scholar] [CrossRef]
- Qu, W.; Jin, Z.; Zhang, Q.; Gao, Y.; Zhang, P.; Chen, P. Estimation of Evapotranspiration in the Yellow River Basin from 2002 to 2020 Based on GRACE and GRACE Follow-On Observations. Remote Sens. 2022, 14, 730. [Google Scholar] [CrossRef]
- Wickham, J.; Stehman, S.V.; Sorenson, D.G.; Gass, L.; Dewitz, J.A. Thematic Accuracy Assessment of the NLCD 2016 Land Cover for the Conterminous United States. Remote Sens. Environ. 2021, 257, 112357. [Google Scholar] [CrossRef] [PubMed]
- Hively, W.D.; Shermeyer, J.; Lamb, B.T.; Daughtry, C.T.; Quemada, M.; Keppler, J. Mapping Crop Residue by Combining Landsat and WorldView-3 Satellite Imagery. Remote Sens. 2019, 11, 1857. [Google Scholar] [CrossRef]
- Mzid, N.; Pignatti, S.; Huang, W.; Casa, R. An Analysis of Bare Soil Occurrence in Arable Croplands for Remote Sensing Topsoil Applications. Remote Sens. 2021, 13, 474. [Google Scholar] [CrossRef]
- Wang, S.; Wang, Z.; Heinonsalo, J.; Zhang, Y.; Liu, G. Soil Organic Carbon Stocks and Dynamics in a Mollisol Region: A 1980s–2010s Study. Sci. Total Environ. 2022, 807, 150910. [Google Scholar] [CrossRef]
- Niu, R.; Zhu, C.; Jiang, G.; Yang, J.; Zhu, X.; Li, L.; Shen, F.; Jie, X.; Liu, S. Variations in Soil Nitrogen Availability and Crop Yields under a Three-Year Annual Wheat and Maize Rotation in a Fluvo-Aquic Soil. Plants 2023, 12, 808. [Google Scholar] [CrossRef]
- Wang, S.; Huang, X.; Zhang, Y.; Yin, C.; Richel, A. The effect of corn straw return on corn production in Northeast China: An integrated regional evaluation with meta-analysis and system dynamics. Resour. Conserv. Recycl. 2021, 167, 105402. [Google Scholar] [CrossRef]
- Jiang, W.; Yan, T.; Chen, B. Impact of Media Channels and Social Interactions on the Adoption of Straw Return by Chinese Farmers. Sci. Total Environ. 2021, 756, 144078. [Google Scholar] [CrossRef]
- Jilin Daily Gongzhuling City, Jilin Province: Creating a Modern Agriculture Sample in the “Golden Corn Belt”. Available online: https://www.163.com/dy/article/H9P9OHJM05509UST.html (accessed on 15 January 2024).
- Barnes, M.L.; Yoder, L.; Khodaee, M. Detecting Winter Cover Crops and Crop Residues in the Midwest US Using Machine Learning Classification of Thermal and Optical Imagery. Remote Sens. 2021, 13, 1998. [Google Scholar] [CrossRef]
- Memon, M.S.; Chen, S.; Niu, Y.; Zhou, W.; Elsherbiny, O.; Liang, R.; Du, Z.; Guo, X. Evaluating the Efficacy of Sentinel-2B and Landsat-8 for Estimating and Mapping Wheat Straw Cover in Rice–Wheat Fields. Agronomy 2023, 13, 2691. [Google Scholar] [CrossRef]
- Vaudour, E.; Gomez, C.; Lagacherie, P.; Loiseau, T.; Baghdadi, N.; Urbina-Salazar, D.; Loubet, B.; Arrouays, D. Temporal mosaicking approaches of Sentinel-2 images for extending topsoil organic carbon content mapping in croplands. Int. J. Appl. Earth Obs. Geoinf. 2021, 96, 102277. [Google Scholar] [CrossRef]
- Rasul, A.; Balzter, H.; Ibrahim, G.; Hameed, H.; Wheeler, J.; Adamu, B.; Ibrahim, S.; Najmaddin, P. Applying Built-Up and Bare-Soil Indices from Landsat 8 to Cities in Dry Climates. Land 2018, 7, 81. [Google Scholar] [CrossRef]
- Yue, J.; Tian, J.; Tian, Q.; Xu, K.; Xu, N. Development of soil moisture indices from differences in water absorption between shortwave-infrared bands. ISPRS J. Photogramm. Remote Sens. 2019, 154, 216–230. [Google Scholar] [CrossRef]
- Zhao, H.; Yang, G.; Tong, D.Q.; Zhang, X.; Xiu, A.; Zhang, S. Interannual and Seasonal Variability of Greenhouse Gases and Aerosol Emissions from Biomass Burning in Northeastern China Constrained by Satellite Observations. Remote Sens. 2021, 13, 1005. [Google Scholar] [CrossRef]
- Nguyen, C.T.; Chidthaisong, A.; Kieu Diem, P.; Huo, L.-Z. A Modified Bare Soil Index to Identify Bare Land Features during Agricultural Fallow-Period in Southeast Asia Using Landsat 8. Land 2021, 10, 231. [Google Scholar] [CrossRef]
- Ji, C.; Cheng, K.; Nayak, D.; Pan, G. Environmental and Economic Assessment of Crop Residue Competitive Utilization for Biochar, Briquette Fuel and Combined Heat and Power Generation. J. Clean. Prod. 2018, 192, 916–923. [Google Scholar] [CrossRef]
- Jia, W.; Qin, W.; Zhang, Q.; Wang, X.; Ma, Y.; Chen, Q. Evaluation of Crop Residues and Manure Production and Their Geographical Distribution in China. J. Clean. Prod. 2018, 188, 954–965. [Google Scholar] [CrossRef]
- Cui, Z.; Zhang, H.; Chen, X.; Zhang, C.; Ma, W.; Huang, C.; Zhang, W.; Mi, G.; Miao, Y.; Li, X.; et al. Pursuing Sustainable Productivity with Millions of Smallholder Farmers. Nature 2018, 555, 363–366. [Google Scholar] [CrossRef]
- Sun, M.; Xu, X.; Wang, C.; Bai, Y.; Fu, C.; Zhang, L.; Fu, R.; Wang, Y. Environmental Burdens of the Comprehensive Utilization of Straw: Wheat Straw Utilization from a Life-Cycle Perspective. J. Clean. Prod. 2020, 259, 120702. [Google Scholar] [CrossRef]
- Ren, J.; Yu, P.; Xu, X. Straw Utilization in China—Status and Recommendations. Sustainability 2019, 11, 1762. [Google Scholar] [CrossRef]
- Wang, Y.-J.; Wang, N.; Huang, G.Q. How Do Rural Households Accept Straw Returning in Northeast China? Resour. Conserv. Recycl. 2022, 182, 106287. [Google Scholar] [CrossRef]
- Tang, Z.; Song, W.; Zou, J. The Early Effect of Black Land Protection Plan in Northeast China on Industrial Pollution Using Synthetic Control Method. Land 2022, 11, 585. [Google Scholar] [CrossRef]
- Liu, W.; Zhang, G.; Wang, X.; Lu, F.; Ouyang, Z. Carbon Footprint of Main Crop Production in China: Magnitude, Spatial-Temporal Pattern and Attribution. Sci. Total Environ. 2018, 645, 1296–1308. [Google Scholar] [CrossRef]
- Popkin, S. The Rational Peasant: The Political Economy of Peasant Society. Theory Soc. 1980, 9, 411–471. [Google Scholar] [CrossRef]
- He, J.; Zhou, W.; Guo, S.; Deng, X.; Song, J.; Xu, D. Effect of Land Transfer on Farmers’ Willingness to Pay for Straw Return in Southwest China. J. Clean. Prod. 2022, 369, 133397. [Google Scholar] [CrossRef]
- Lu, X.; Lu, X. Tillage and crop residue effects on the energy consumption, input–output costs and greenhouse gas emissions of maize crops. Nutr. Cycl. Agroecosys. 2017, 108, 323–337. [Google Scholar] [CrossRef]
- Qi, Y.; Zhang, J.; Chen, X.; Li, Y.; Chang, Y.; Zhu, D. Effect of Farmland Cost on the Scale Efficiency of Agricultural Production Based on Farmland Price Deviation. Habitat Int. 2023, 132, 102745. [Google Scholar] [CrossRef]
- Zhang, T.; Zhang, F.; Li, J.; Xie, Z.; Chang, Y. Unraveling Patterns, Causes, and Nature-Based Remediation Strategy for Non-Grain Production on Farmland in Hilly Regions. Environ. Res. 2024, 252, 118982. [Google Scholar] [CrossRef]
- He, J.; Zhou, W.; Qing, C.; Xu, D. Learning from parents and friends: The influence of intergenerational effect and peer effect on farmers’ straw return. J. Clean. Prod. 2023, 393, 136143. [Google Scholar] [CrossRef]
- Jin, H.; Hongwen, L.I.; Haitao, C.; Caiyun, L.U.; Qingjie, W. Research progress of conservation tillage technology and machine. Nongye Jixie Xuebao Trans. Chin. Soc. Agric. Mach. 2018, 49, 1–19. [Google Scholar]
- Tang, H.; Xu, C.; Xu, W.; Xu, Y.; Xiang, Y.; Wang, J. Method of straw ditch-buried returning, development of supporting machine and analysis of influencing factors. Front. Plant Sci. 2022, 13, 967838. [Google Scholar] [CrossRef] [PubMed]
- Hou, L.; Chen, X.; Kuhn, L.; Huang, J. The effectiveness of regulations and technologies on sustainable use of crop residue in Northeast China. Energy Econ. 2019, 81, 519–527. [Google Scholar] [CrossRef]
- Yang, X.; Cheng, L.; Huang, X.; Zhang, Y.; Yin, C.; Lebailly, P. Incentive mechanism to promote corn stalk return sustainably in Henan, China. Sci. Total Environ. 2020, 738, 139775. [Google Scholar] [CrossRef] [PubMed]
- Meng, X.; Meng, F.; Chen, P.; Hou, D.; Zheng, E.; Xu, T. A Meta-Analysis of Conservation Tillage Management Effects on Soil Organic Carbon Sequestration and Soil Greenhouse Gas Flux. Sci. Total Environ. 2024, 954, 176315. [Google Scholar] [CrossRef]
- Huang, X.; Cheng, L.; Chien, H.; Jiang, H.; Yang, X.; Yin, C. Sustainability of returning wheat straw to field in Hebei, Shandong and Jiangsu provinces: A contingent valuation method. J. Clean. Prod. 2019, 213, 1290–1298. [Google Scholar] [CrossRef]
- Lu, H.; Xie, H.; He, Y.; Wu, Z.; Zhang, X. Assessing the Impacts of Land Fragmentation and Plot Size on Yields and Costs: A Translog Production Model and Cost Function Approach. Agric. Syst. 2018, 161, 81–88. [Google Scholar] [CrossRef]
- Li, W.; Wei, X.; Zhu, R.; Guo, K. Study on Factors Affecting the Agricultural Mechanization Level in China Based on Structural Equation Modeling. Sustainability 2018, 11, 51. [Google Scholar] [CrossRef]
- Li, Z.; Lin, Y.; Kan, Z.-R.; Rehman, S.U.; Din, A.M.U.; Li, F.-M.; Zhang, S.; Wu, P.; Ding, Y.; Xu, C.; et al. Straw Management Adopted by Large Farms Sustains Grain Yield but Mitigates Greenhouse Gas Emissions. Field Crops Res. 2024, 312, 109409. [Google Scholar] [CrossRef]
- Shang, Q.; Cheng, C.; Wang, J.; Luo, K.; Zeng, Y.; Yang, X. Net Global Warming Potential, Greenhouse Gas Intensity and Carbon Footprint as Affected by Different Tillage Systems from Chinese Double-Cropping Paddy Fields. Soil Tillage Res. 2021, 209, 104947. [Google Scholar] [CrossRef]
- Xu, Y.; Wu, L.; Xie, Z.; Chen, Z. Building Extraction in Very High Resolution Remote Sensing Imagery Using Deep Learning and Guided Filters. Remote Sens. 2018, 10, 144. [Google Scholar] [CrossRef]
- Arasumani, M.; Bunyan, M.; Robin, V.V. Opportunities and Challenges in Using Remote Sensing for Invasive Tree Species Management, and in the Identification of Restoration Sites in Tropical Montane Grasslands. J. Environ. Manag. 2021, 280, 111759. [Google Scholar] [CrossRef] [PubMed]
- Wang, L.; Wang, J.; Liu, Z.; Zhu, J.; Qin, F. Evaluation of a Deep-Learning Model for Multispectral Remote Sensing of Land Use and Crop Classification. Crop J. 2022, 10, 1435–1451. [Google Scholar] [CrossRef]
- Zhong, Y.; Wang, J.; Zhao, J. Adaptive Conditional Random Field Classification Framework Based on Spatial Homogeneity for High-Resolution Remote Sensing Imagery. Remote Sens. Lett. 2020, 11, 515–524. [Google Scholar] [CrossRef]
- Hu, A.; Chen, S.; Wu, L.; Xie, Z.; Qiu, Q.; Xu, Y. WSGAN: An Improved Generative Adversarial Network for Remote Sensing Image Road Network Extraction by Weakly Supervised Processing. Remote Sens. 2021, 13, 2506. [Google Scholar] [CrossRef]
- Foody, G.M. Status of Land Cover Classification Accuracy Assessment. Remote Sens. Environ. 2002, 80, 185–201. [Google Scholar] [CrossRef]
- Foody, G.M. Explaining the Unsuitability of the Kappa Coefficient in the Assessment and Comparison of the Accuracy of Thematic Maps Obtained by Image Classification. Remote Sens. Environ. 2020, 239, 111630. [Google Scholar] [CrossRef]
- Feizizadeh, B.; Darabi, S.; Blaschke, T.; Lakes, T. QADI as a New Method and Alternative to Kappa for Accuracy Assessment of Remote Sensing-Based Image Classification. Sensors 2022, 22, 4506. [Google Scholar] [CrossRef]
- Guo, L.; Sun, X.; Fu, P.; Shi, T.; Dang, L.; Chen, Y.; Linderman, M.; Zhang, G.; Zhang, Y.; Jiang, Q. Mapping Soil Organic Carbon Stock by Hyperspectral and Time-Series Multispectral Remote Sensing Images in Low-Relief Agricultural Areas. Geoderma 2021, 398, 115118. [Google Scholar] [CrossRef]
- Ticehurst, C.; Teng, J.; Sengupta, A. Development of a Multi-Index Method Based on Landsat Reflectance Data to Map Open Water in a Complex Environment. Remote Sens. 2022, 14, 1158. [Google Scholar] [CrossRef]
- Zhang, W.; Yu, Q.; Tang, H.; Liu, J.; Wu, W. Conservation Tillage Mapping and Monitoring Using Remote Sensing. Comput. Electron. Agric. 2024, 218, 108705. [Google Scholar] [CrossRef]
Disclaimer/Publisher’s Note: The statements, opinions and data contained in all publications are solely those of the individual author(s) and contributor(s) and not of MDPI and/or the editor(s). MDPI and/or the editor(s) disclaim responsibility for any injury to people or property resulting from any ideas, methods, instructions or products referred to in the content. |
© 2025 by the authors. Licensee MDPI, Basel, Switzerland. This article is an open access article distributed under the terms and conditions of the Creative Commons Attribution (CC BY) license (https://creativecommons.org/licenses/by/4.0/).