
Phenology-Optimized Drought Index Reveals the Spatio-Temporal Patterns of Vegetation Health and Its Attribution on the Loess Plateau


Abstract

1. Introduction
2. Materials
2.1. Study Area
2.2. Data Sources
2.2.1. EVI and LST Data
2.2.2. NPP Data
2.2.3. Topographic Data
2.2.4. Climate Data
2.2.5. Land Use Data
2.2.6. Soil Texture Data
2.2.7. Human Activity Data
3. Methods
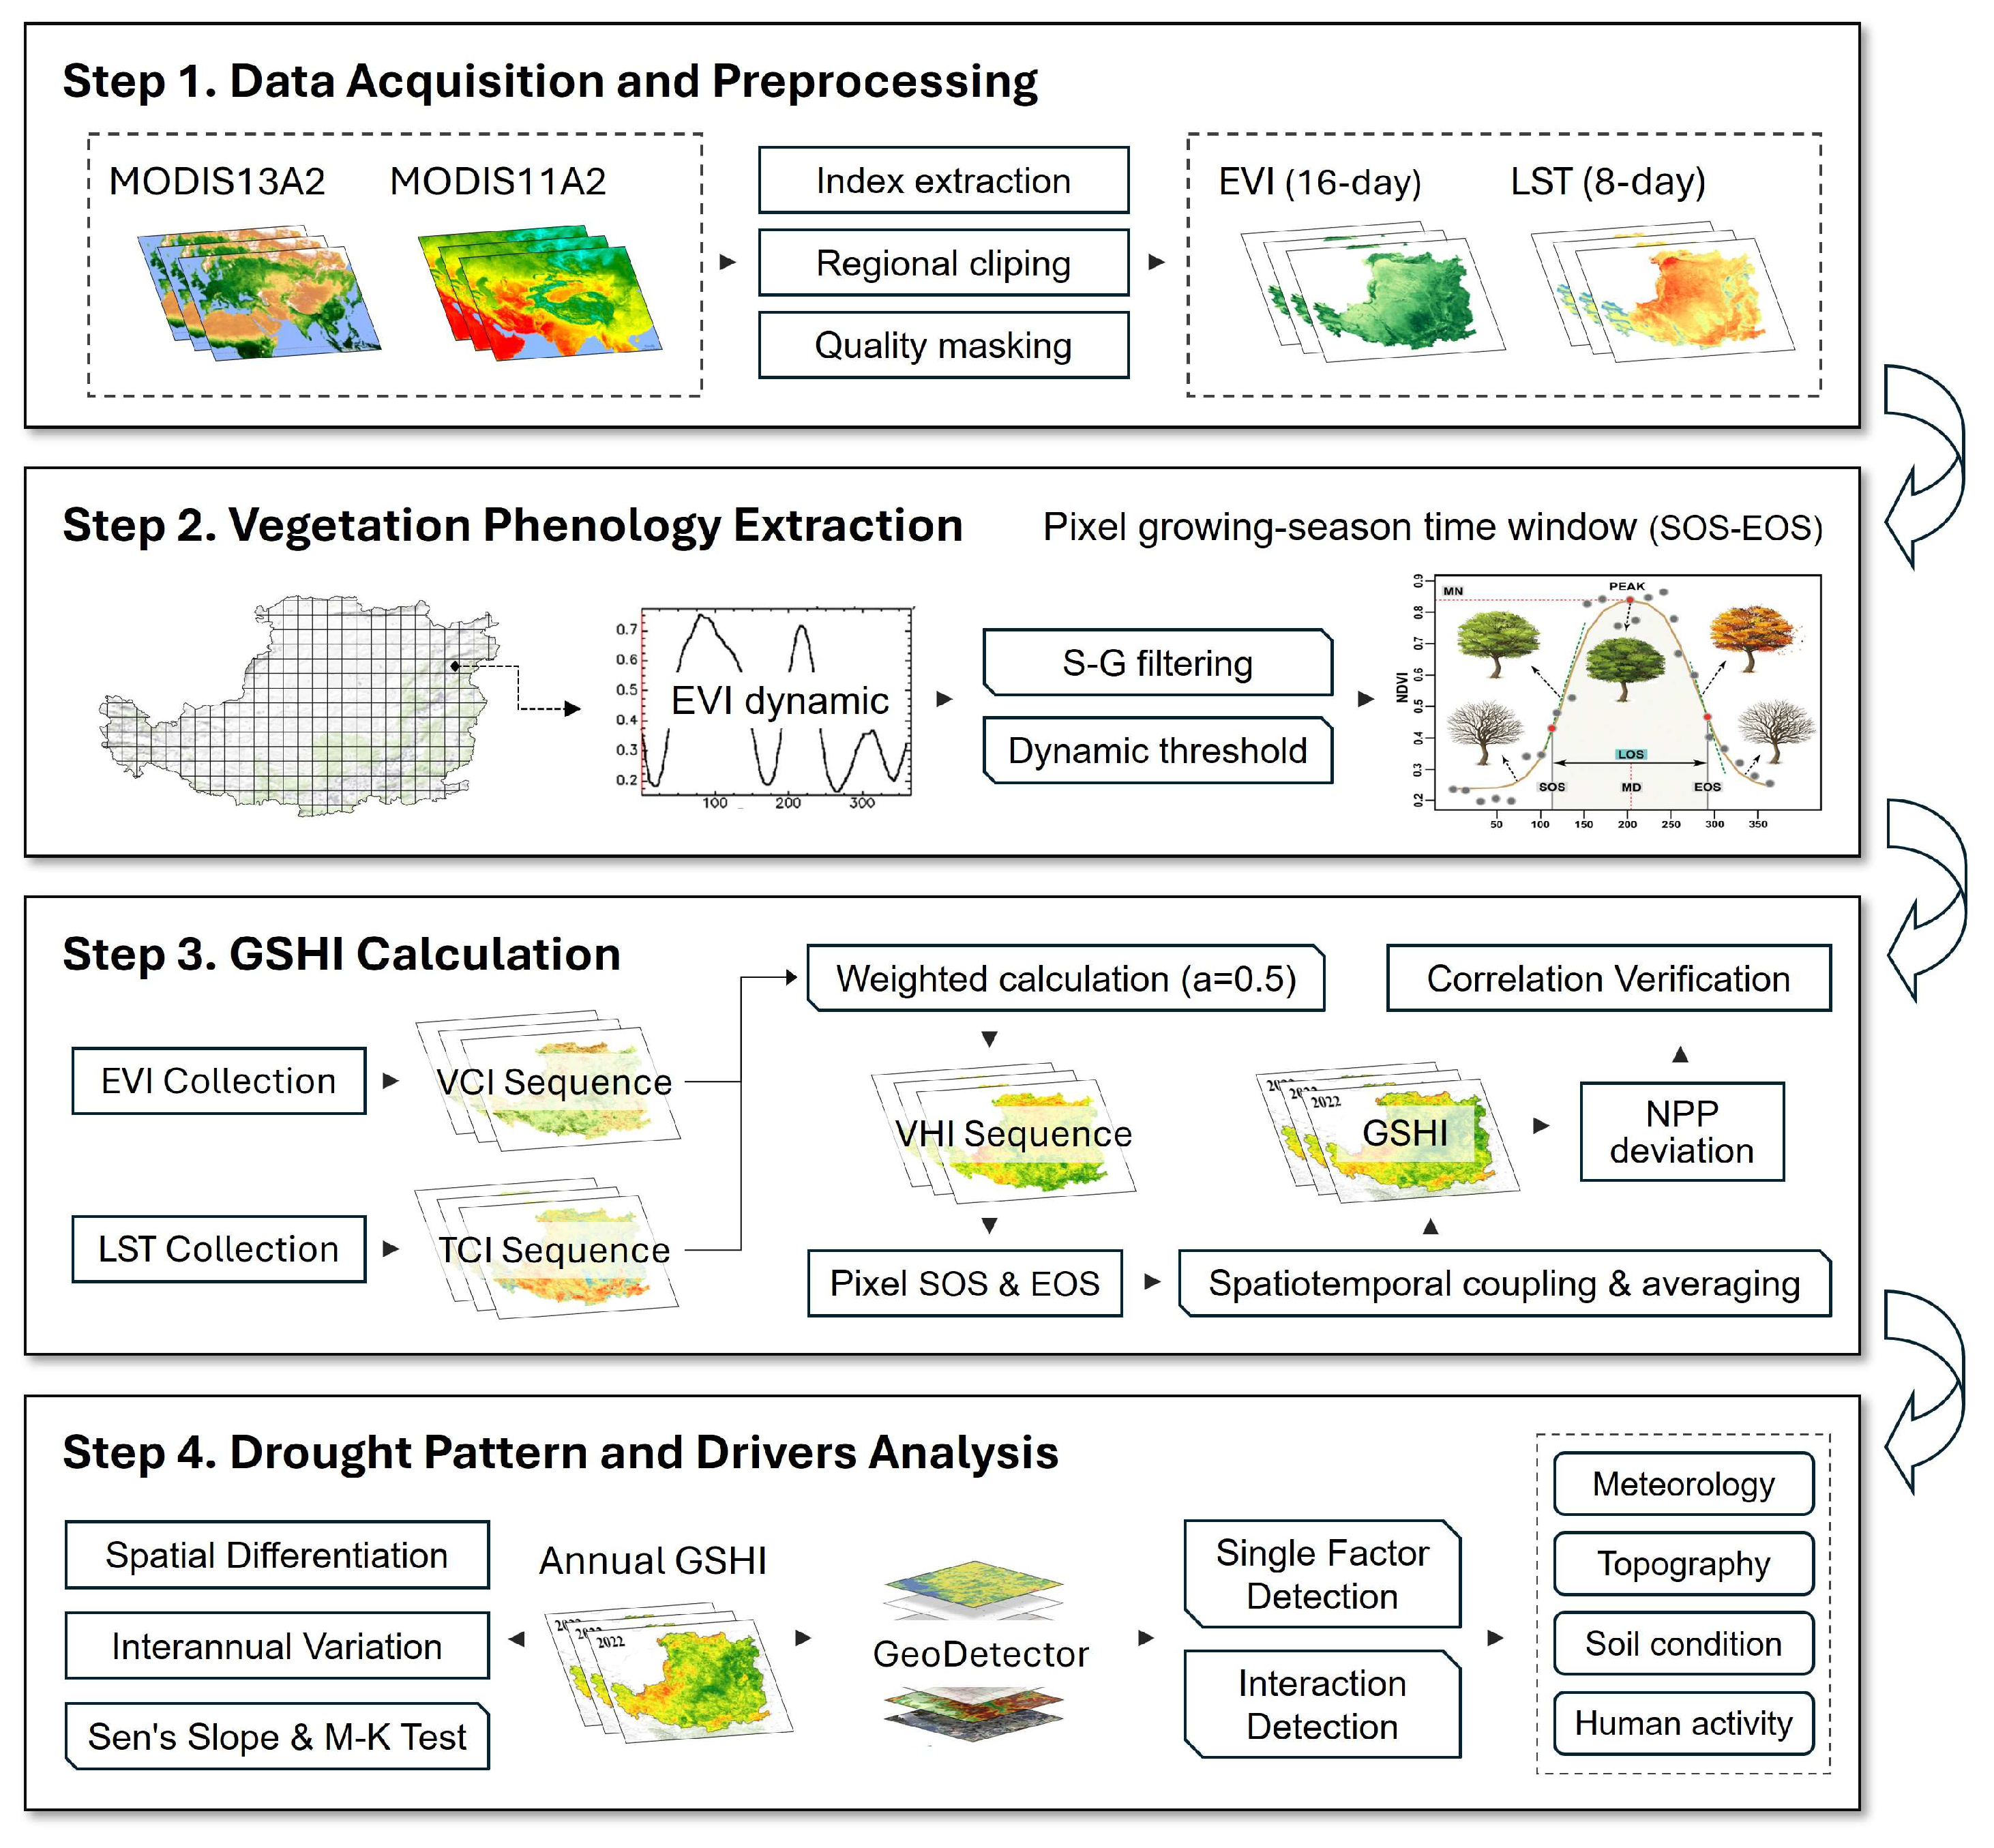
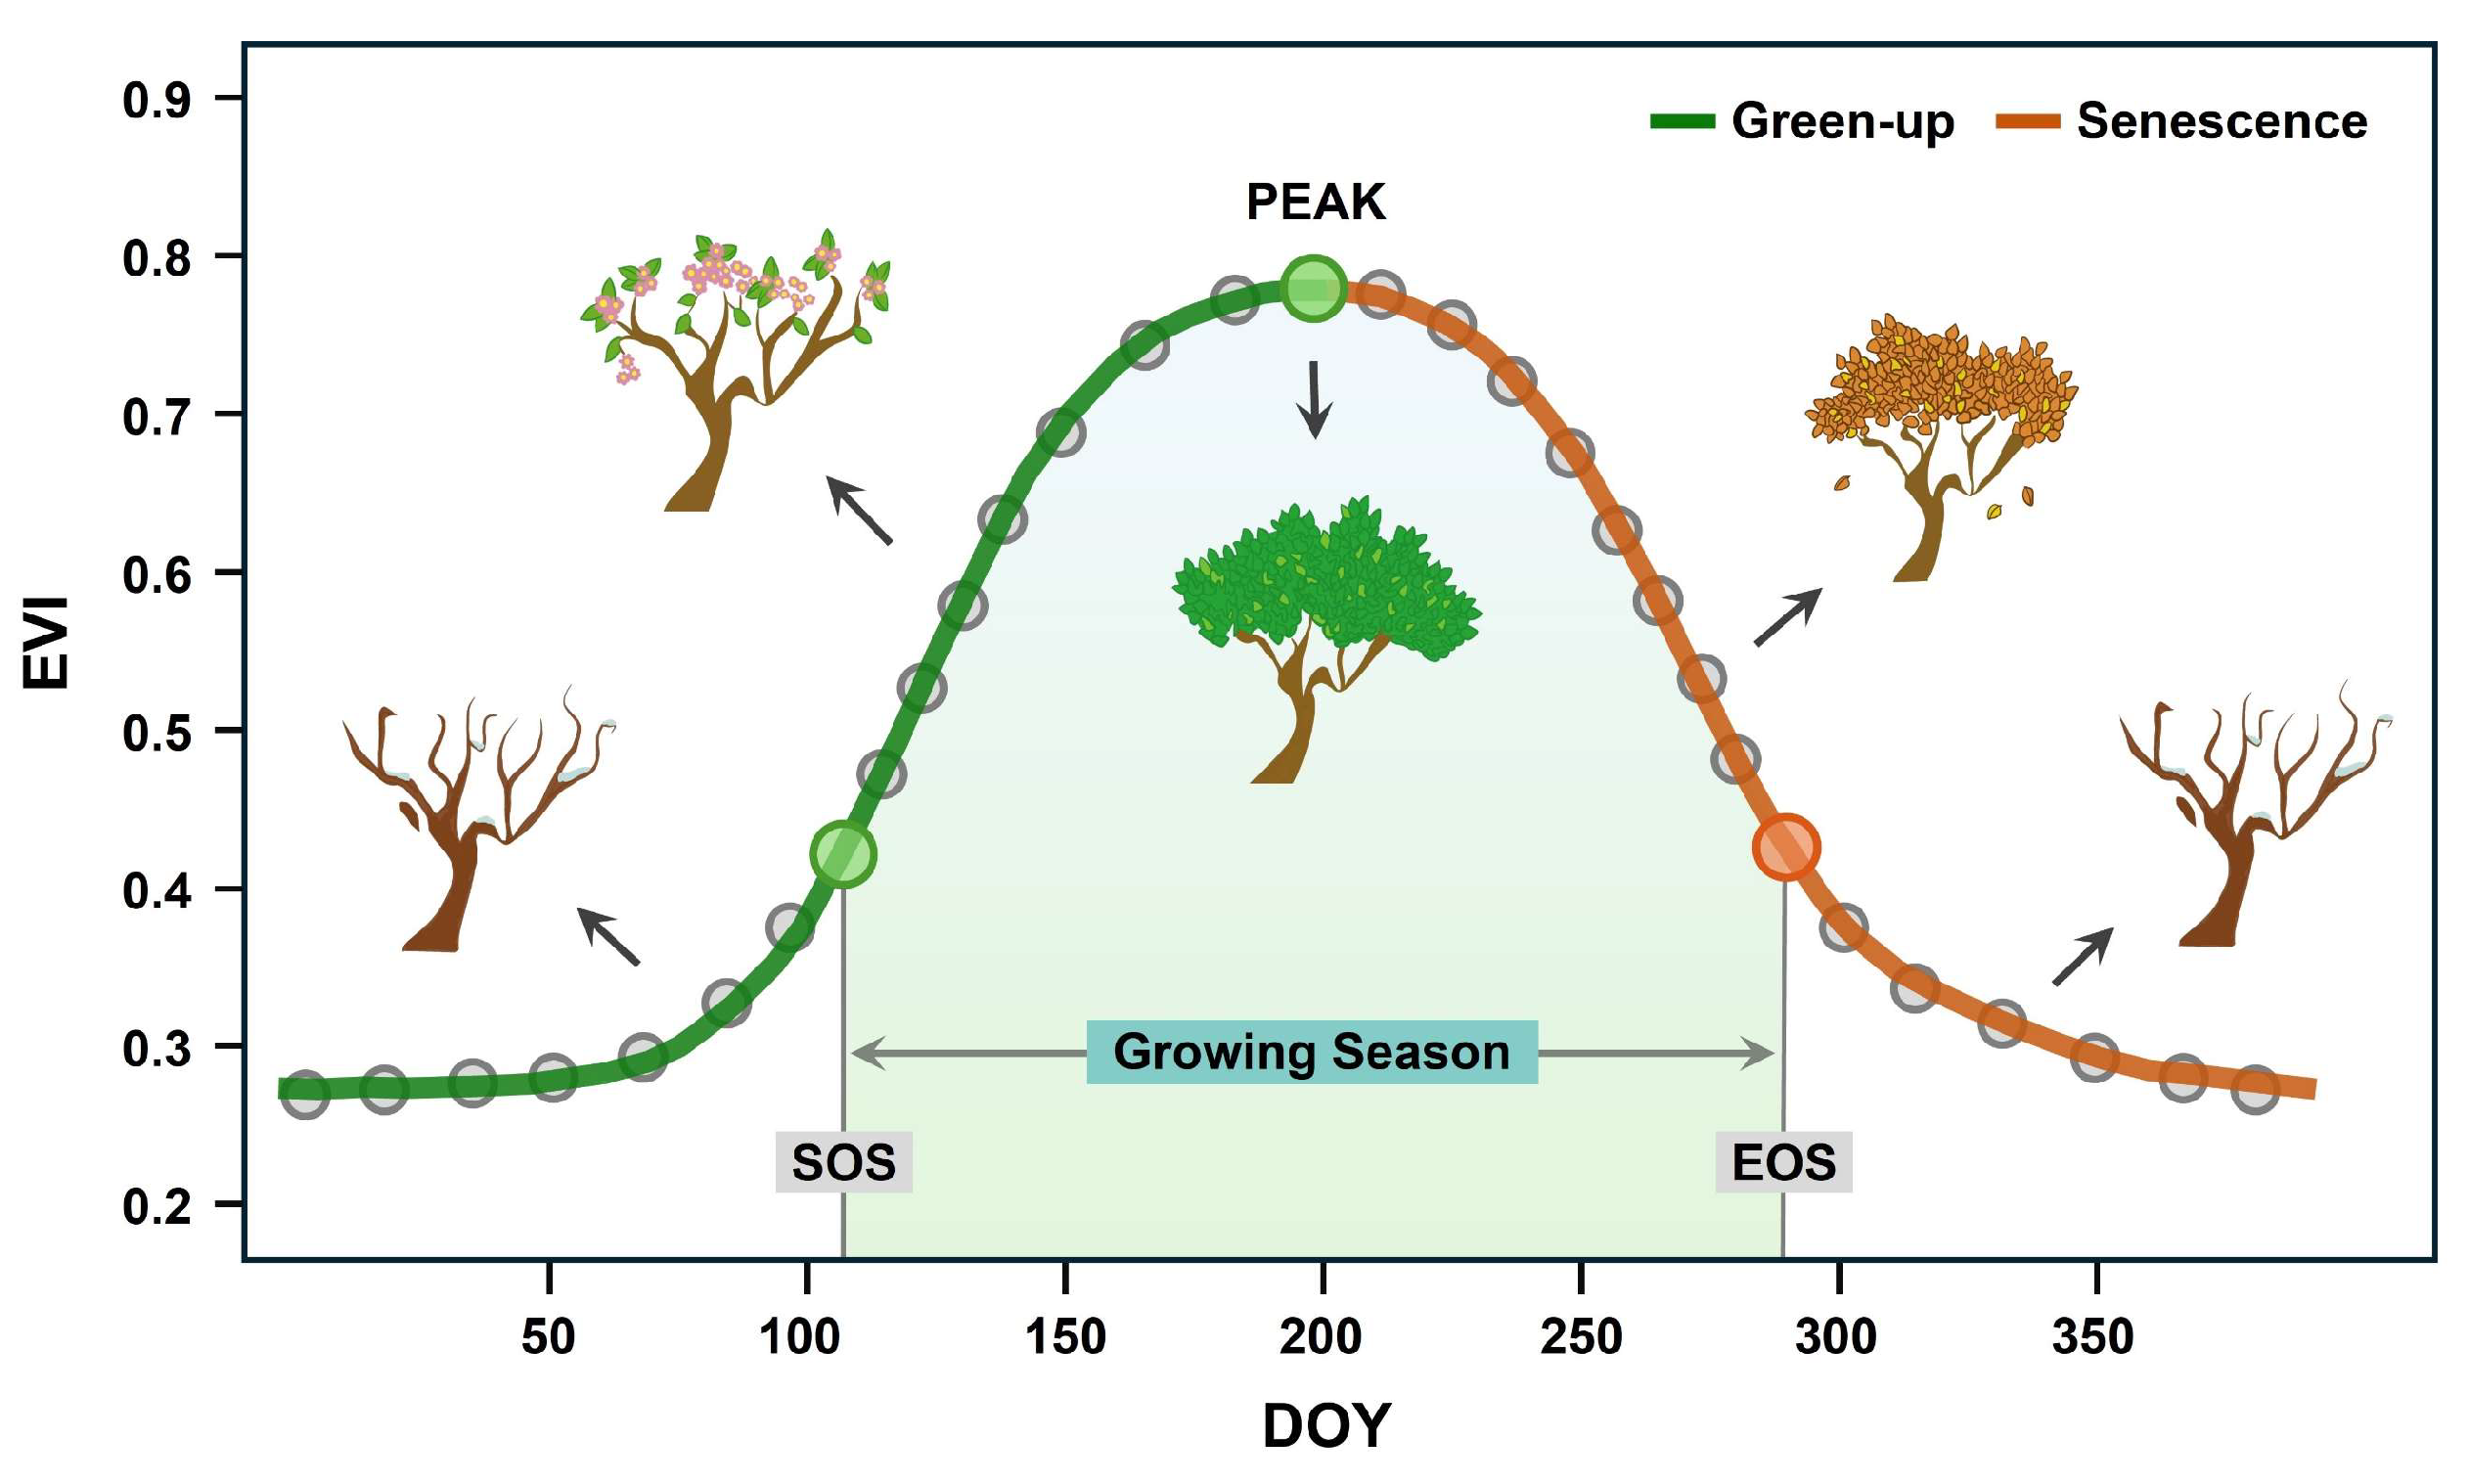
3.1. Data Smoothing and Phenology Extraction
- (1)
- Time series smoothing: Original MODIS-EVI time series data contain inherent noise and necessitate smoothing. The S–G filter is a data-smoothing algorithm that employs local polynomial least squares fitting, effectively removing high-frequency noise in time series while preserving the waveform characteristics of the data [48]. The algorithm for the S–G filter is described as follows:where is the original EVI value, is the filtered EVI value, is the coefficient of the -th EVI value of the filter, is the index of the original EVI series, is the size of the smoothing window (), and is the half-width of the window. This study used a third-order polynomial S–G filter algorithm with a window width of 6 to smooth the original EVI time series. Ultimately, while maintaining the overall morphology of the vegetation growth process, daily temporal continuity was achieved.
- (2)
- Extraction of the key time-points of phenology: The start of season (SOS) and the end of season (EOS) are two key nodes describing the vegetation growing season (Figure 3). This study used the dynamic threshold method to obtain the annual SOS and EOS of each pixel. Specifically, based on the maximum and minimum values of the smoothed EVI time series, the time point when the EVI exceeds 20% of the current amplitude (the difference between EVImax and EVImin) is the SOS, and the time point when it drops to 80% of the current amplitude is the EOS.
- (3)
- Defining the vegetation growing season: The period between SOS and EOS is defined as the vegetation growing season. Considering the differences in phenological periods of different regions and vegetation types, this study determined the growing season time window for each year on a pixel-wise basis.
3.2. Growing Season Health Index (GSHI)
- (1)
- Based on the extracted information of the SOS and EOS, the vegetation growing season time range of each pixel for each year is determined.
- (2)
- Using the original MODIS EVI 16-day and LST 8-day composite product data, we first averaged two 8-day LST composites to match the temporal resolution of EVI. Then, the VCI, TCI, and VHI of each 16-day period are calculated, respectively. The specific calculation methods are as follows:where , , and represent the -th pixel, the -th 16-day time period, and the -th year, respectively; max and min represent the multi-year maximum and minimum values of the corresponding pixel; represents the weight factor, which is generally fixed at 0.5 in practical applications [20].
- (3)
- For each pixel, the day of year (DOY) interval corresponding to the vegetation growing window (SOS to EOS) is matched, the VHI subset during the growing season is extracted from the VHI time series within the DOY interval, and its average value is calculated to obtain the GSHI of the pixel:where represents the value of pixel in year ; represents the -th value within the growing season time range of pixel ; and are the Julian days corresponding to the start and end dates of the growing season of pixel , respectively; is the Julian day corresponding to the -th value; is the total number of series within the growing season of pixel .
- (4)
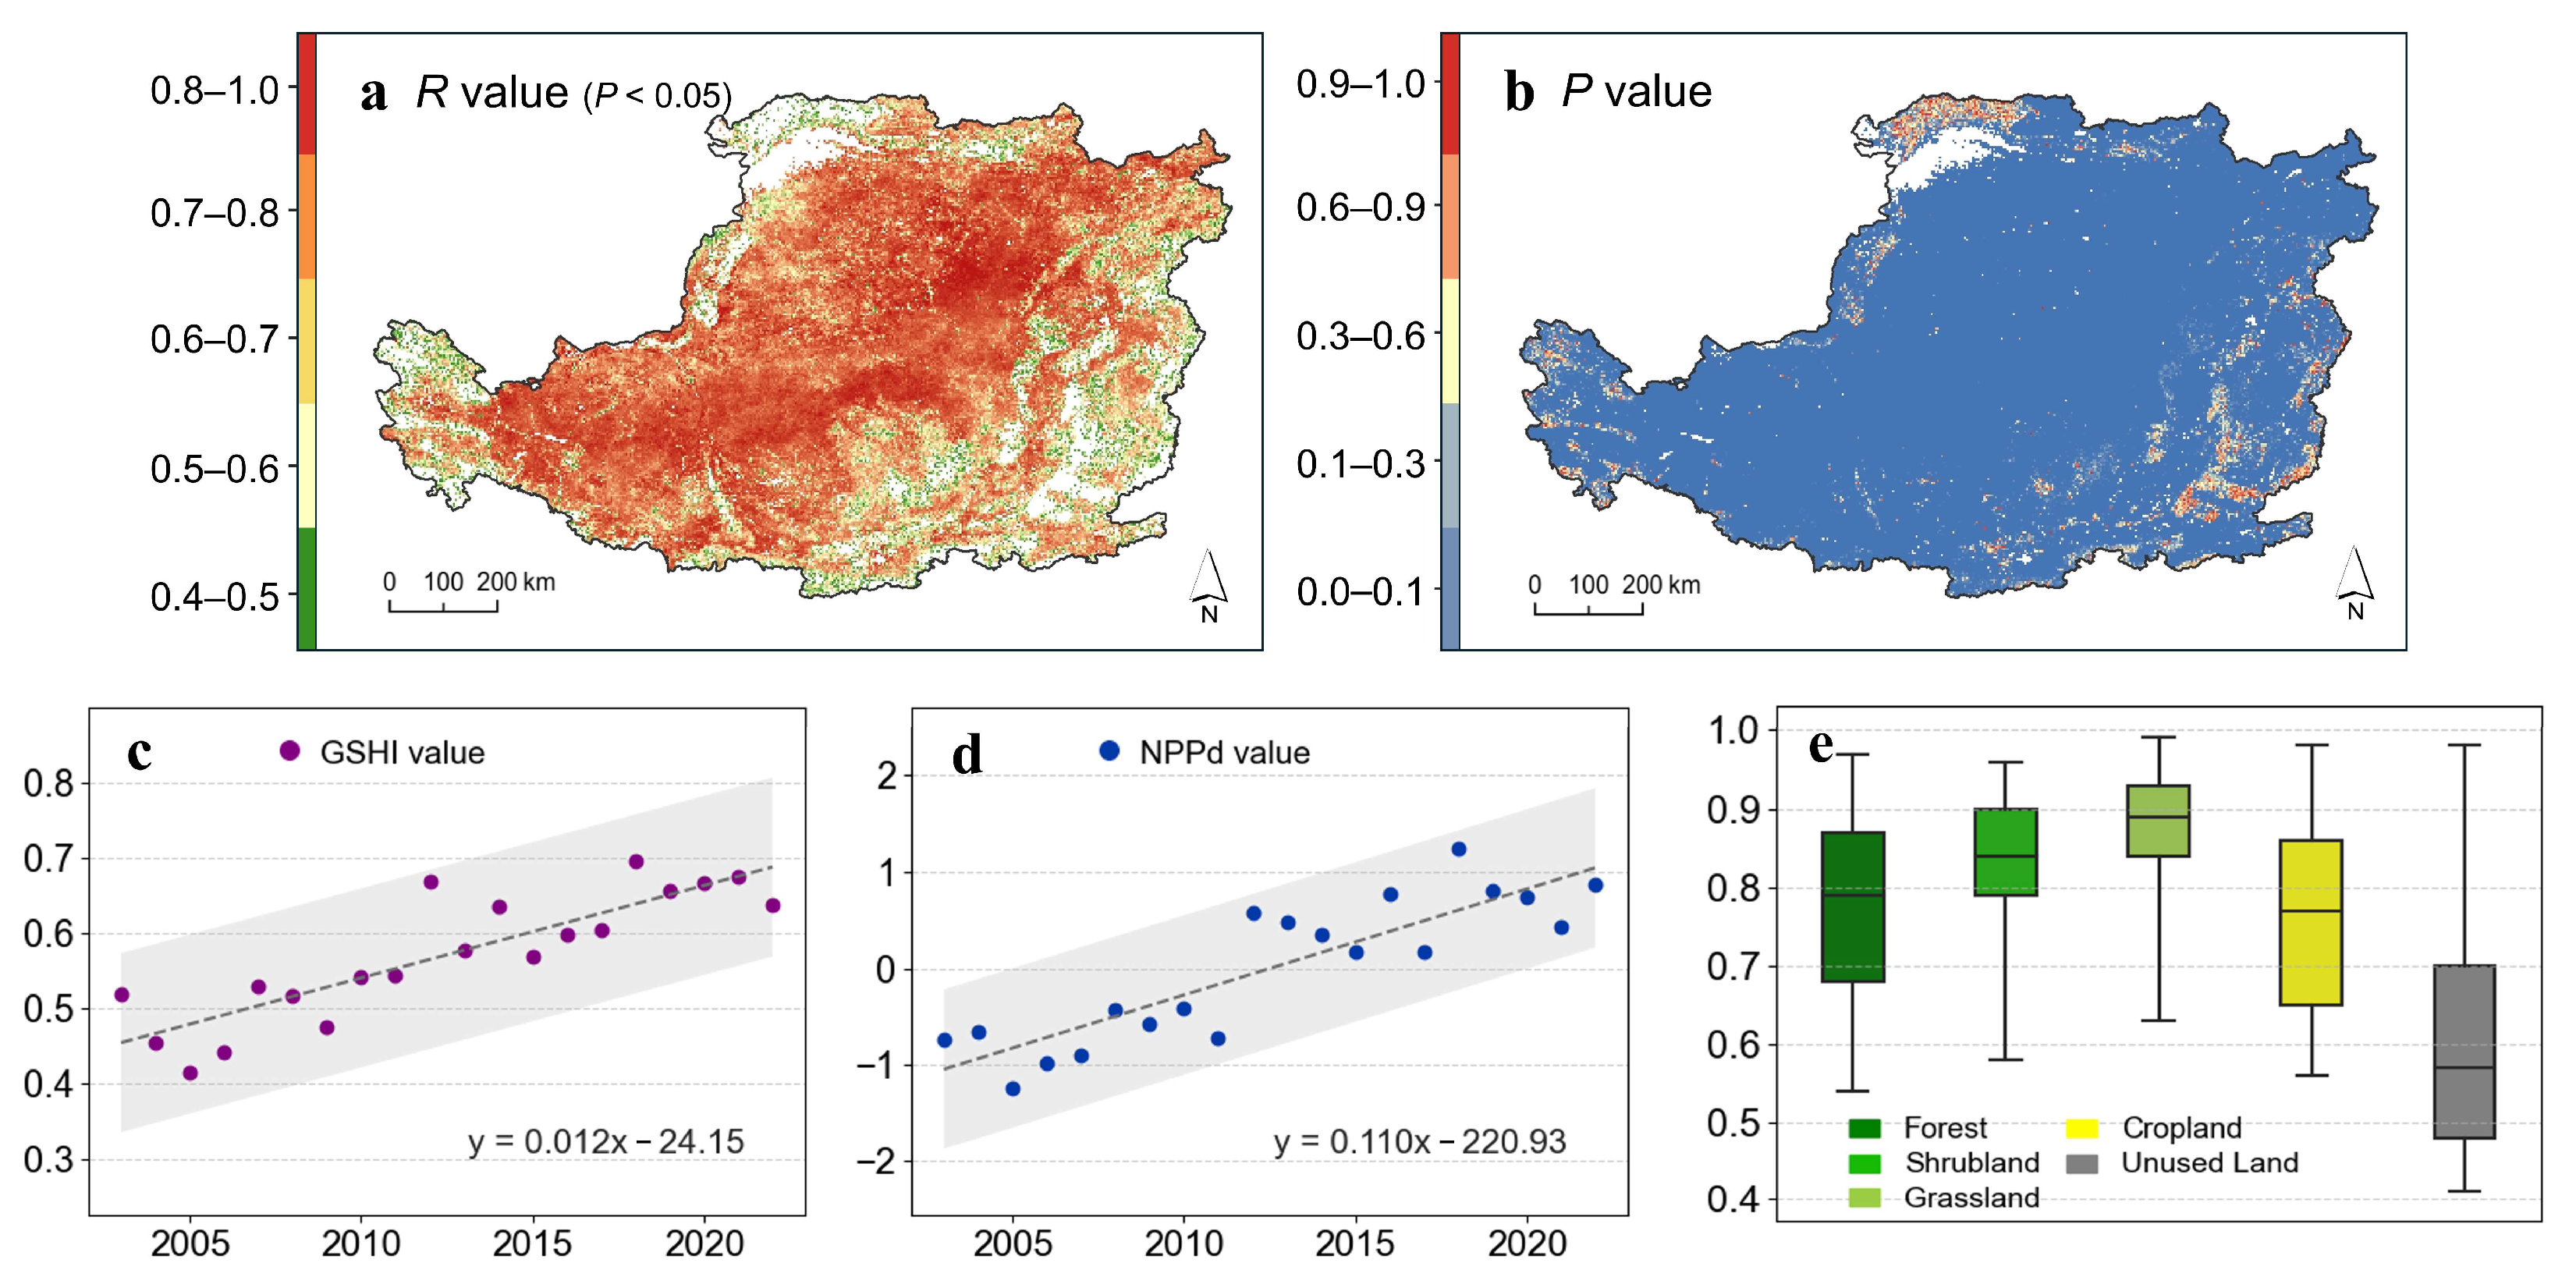
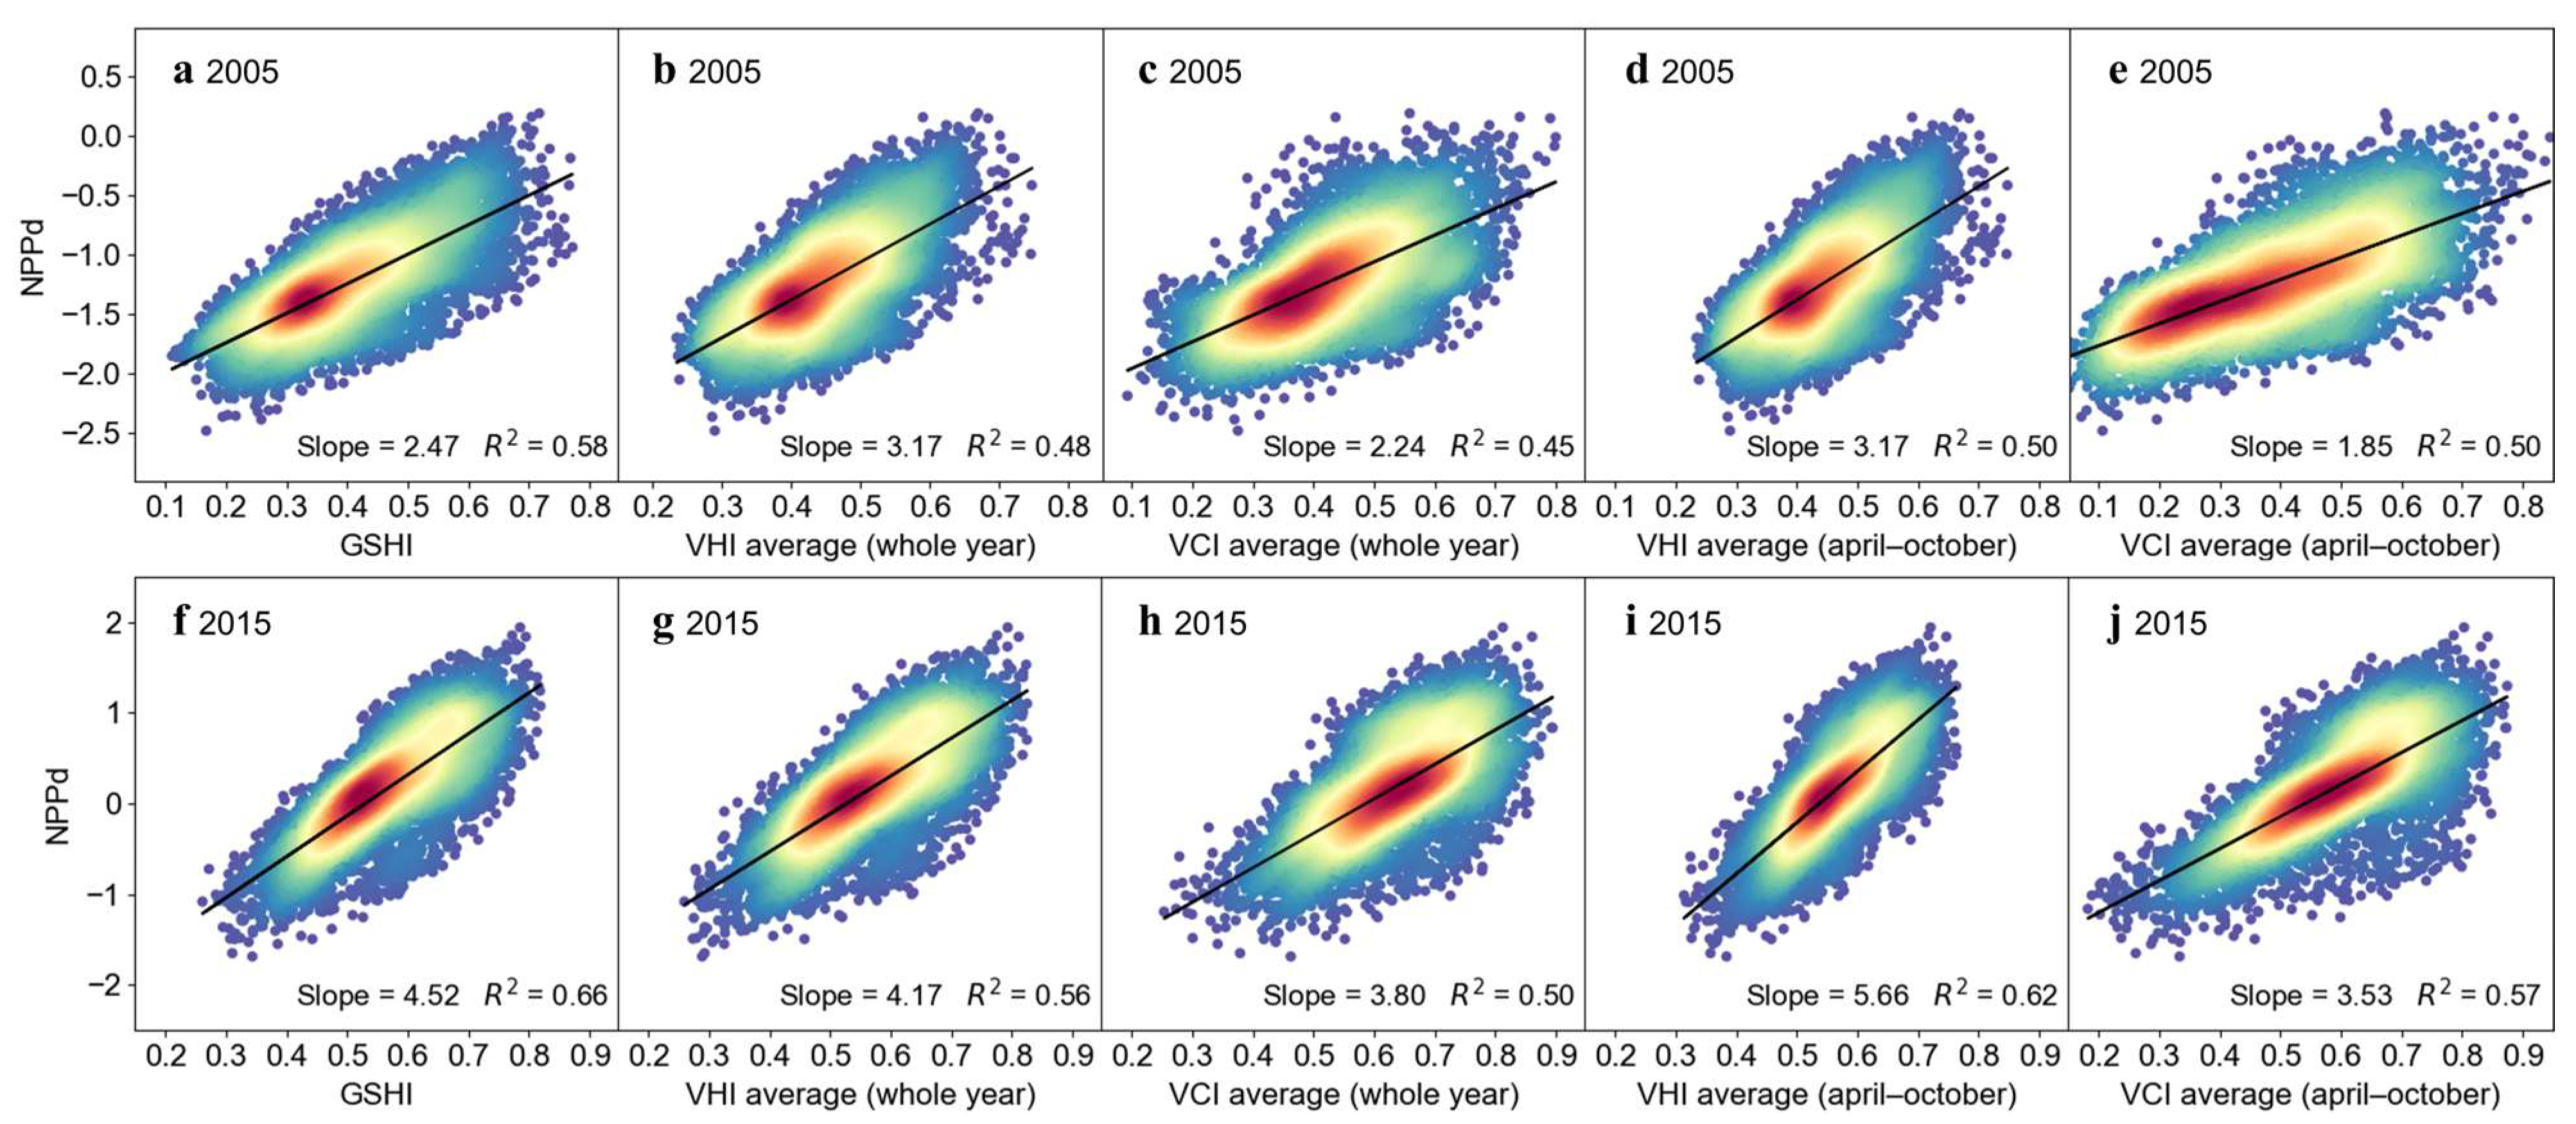
3.3. Validation of GSHI for Vegetation Drought Representation
3.4. Frequency Analysis
3.5. Sen and Mann–Kendall
3.6. OPGD Model
- (1)
- Optimal parameter selection. The discretization processing of continuous data by the geographical detector needs to be set manually, which is influenced by inaccurate discretization and human subjective factors. Based on this, the OPGD model combines different discretization methods and levels for continuous variables and uses the discretization parameter corresponding to the highest explanatory power as the optimum [52].
- (2)
- Factor and interaction detection. The single-factor detection and two-factor interaction detection in the geographical detector are employed to detect spatial stratified heterogeneity of influencing factors and discover the underlying drivers of drought. The principle is as follows:where indicates the relative contribution of the examined factor, bounded between 0 and 1, with higher values suggesting stronger contributions; stands for the predictor variable or its categorical level; and denote the sample count in stratum and total sample size, respectively; and reflect the variance within stratum and across the entire dataset, respectively; and represent the aggregated within-strata variance and total variance sum, respectively. Table 2 outlines the criteria for classifying interaction patterns.
4. Results
4.1. Spatio-Temporal Pattern of Vegetation Phenology
4.2. Reliability Evaluation of the GSHI
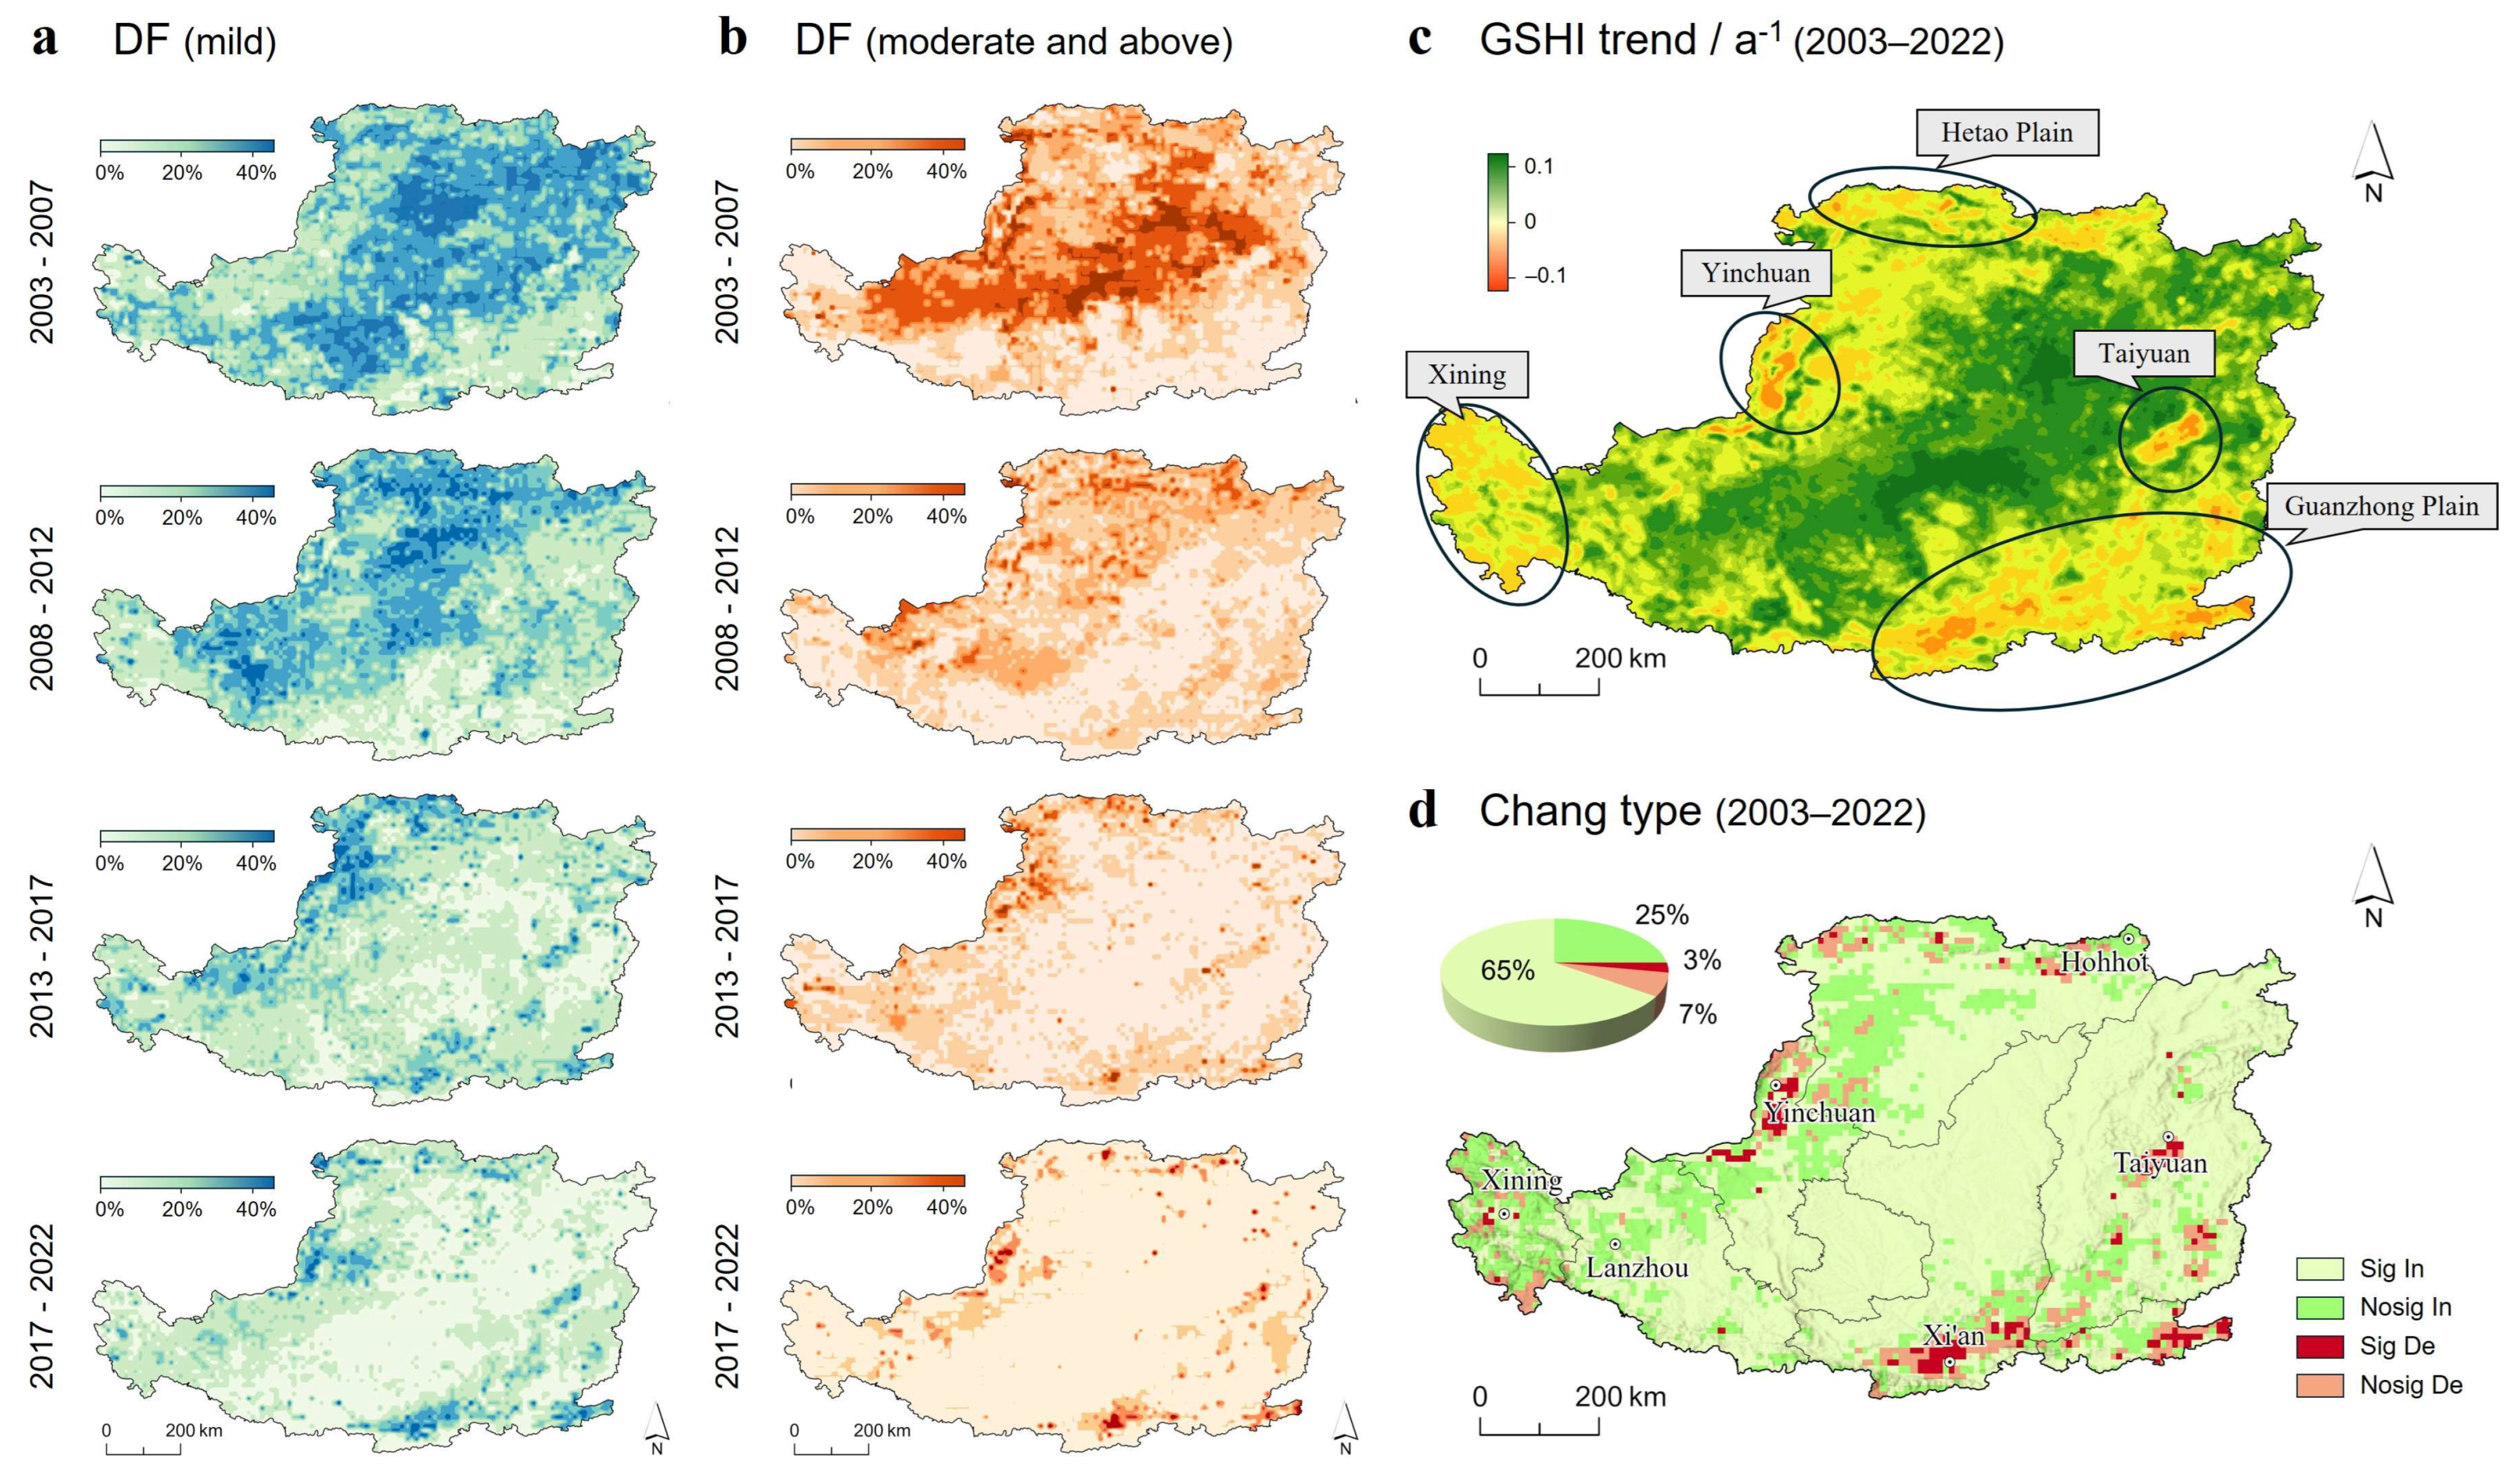
4.3. Spatio-Temporal Pattern of Growing Season Drought
4.3.1. Spatial Distribution Characteristics
4.3.2. Interannual Variation Characteristics
4.3.3. Drought Frequency
4.3.4. Drought Trend
4.4. Driving Mechanisms of Drought During the Growing Season
4.4.1. Optimal Discretization Results of Detection Factors
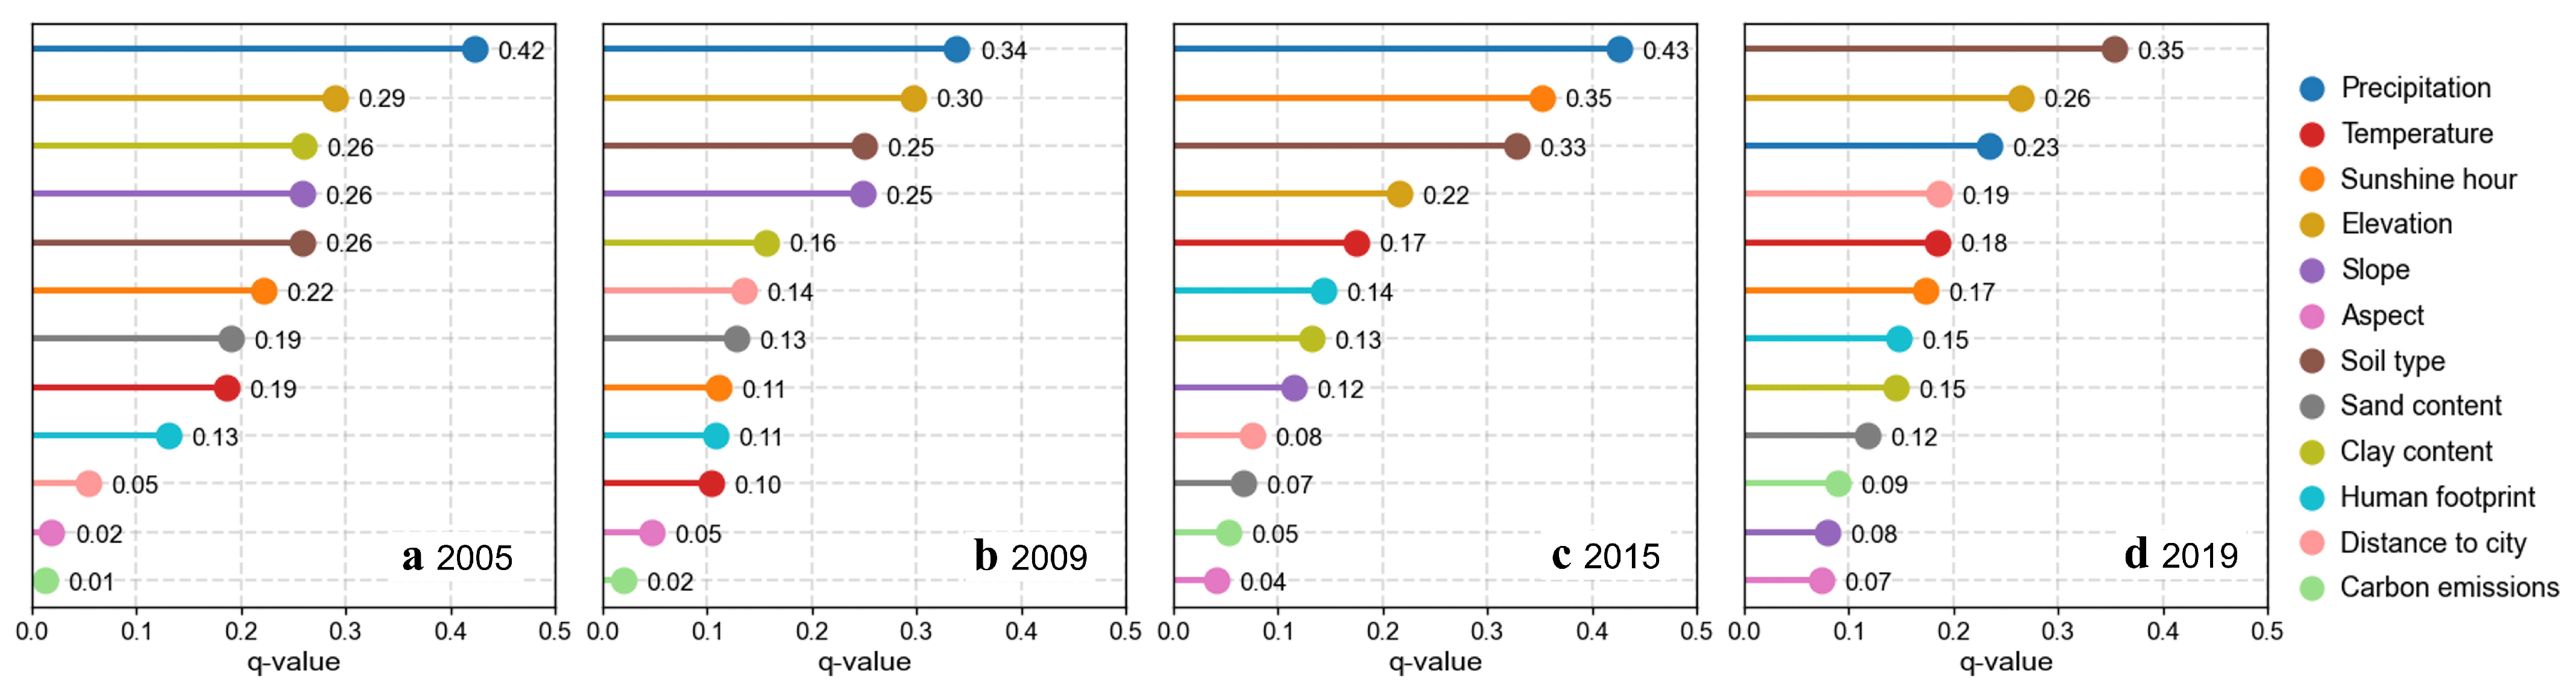
4.4.2. Single-Factor Detection
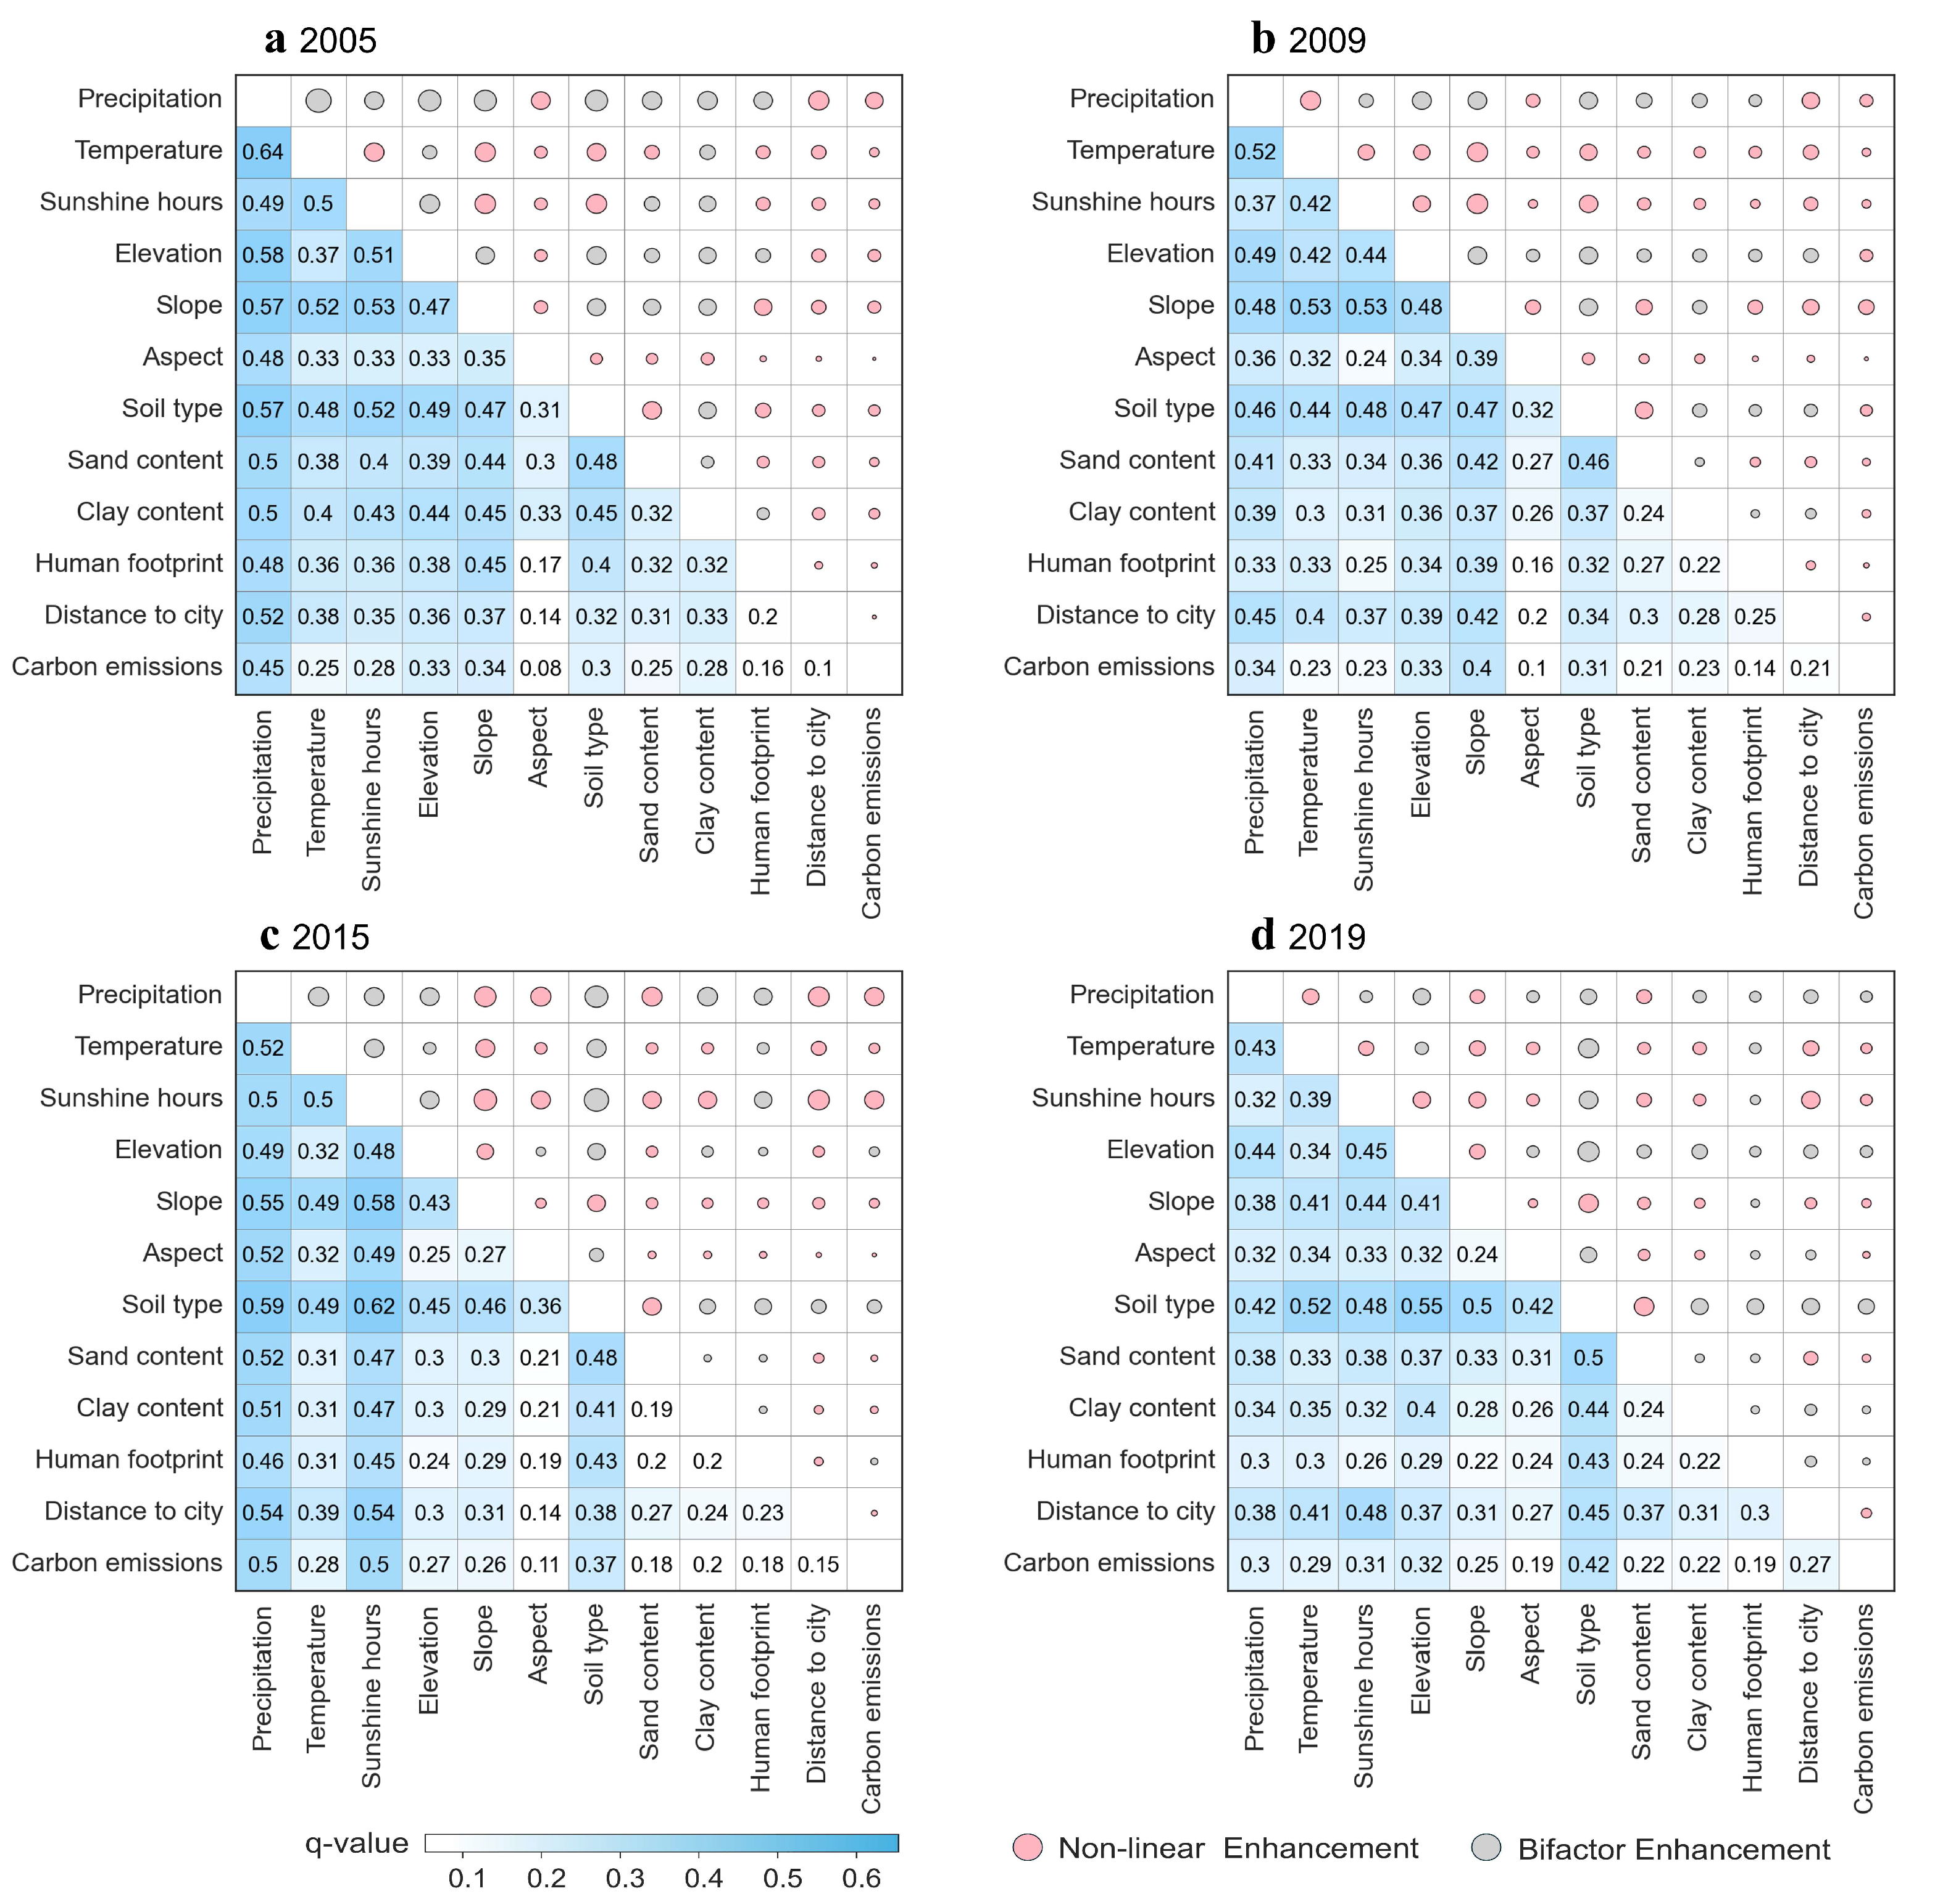
4.4.3. Multi-Factor Interactions
5. Discussion
5.1. Analysis of the GSHI’s Performance and Applicability
5.2. Vegetation Drought Change Characteristics on the LP
5.3. Influence Mechanism of Growing Season Drought
5.4. Limitations and Future Works
- (1)
- The temporal uncertainty of remote sensing vegetation index time series data affects the representativeness of the GSHI. To reduce the influence of clouds, atmosphere, and other factors, commonly used vegetation index (such as EVI and NDVI) time series data have undergone maximum value composite (MVC) processing, assigning the vegetation index value to a multi-day composite period (such as 16 days). However, this leads to the degradation of temporal information, causing the extracted phenological parameters (such as SOS and EOS) to deviate from the actual phenological periods. Previous studies have shown that the root mean square error of this deviation can reach 10 days [69]. Future research needs to fully consider the uncertainty of vegetation index time series and explore data sources and phenology extraction algorithms with more precise temporal information to improve the reliability of vegetation drought assessment.
- (2)
- The analysis of drought driving factors needs to move from correlation to causality. There are complex feedback interactions between drought and vegetation, and this causal relationship involves multiple factors, requiring the use of causal relationship discovery techniques [70]. Traditional correlation analysis methods (including the OPGD used in this study) cannot determine the direction of causal connections. Clarifying the causal relationship between drought and various influencing factors and their action paths will deepen the understanding of the occurrence and development mechanisms of regional drought. This is of great value for improving the foresight of drought prediction, early warning, and risk management.
- (3)
- The timing and duration of drought occurrence affect the degree of vegetation damage and recovery ability, and this impact may vary with phenological stages [71]. Based on the current research, future studies can further refine the division of vegetation growth stages and set differentiated weights for the drought vulnerability of different phenological stages to construct a more refined drought risk assessment model. This will not only help improve the sensitivity and accuracy of depicting drought but also provide important references for formulating stage-specific drought regulation measures.
- (4)
- The spatial resolution limits the ability of the GSHI to capture localized drought drivers. While MODIS’s 500 m–1 km resolution supports regional-scale analysis, higher-resolution imagery (e.g., 10–30 m Landsat/Sentinel-2) could better resolve localized drought. However, such datasets face challenges in maintaining long-term temporal continuity and robustness due to cloud contamination and shorter observational records. Future work should prioritize balancing spatial detail with temporal consistency through advanced gap-filling algorithms or multi-sensor fusion to enhance drought monitoring precision.
6. Conclusions
- (1)
- The spatio-temporal differentiation of LP vegetation phenology is significant, showing good consistency with climatic gradients. At the regional scale, phenological changes are evident, with SOS earlier in the southeast and later in the northwest, and large interannual variability; the spatial distribution in EOS is mainly manifested as later in the south than in the north.
- (2)
- The vegetation drought during growing season at LP exhibits significant spatial differentiation characteristics, with an overall pattern of higher in the northwest than in the southeast. The early 21st century was a high-incidence period of drought, and the frequency and intensity of drought in natural vegetation areas have generally weakened after 2010, but localized drought phenomena in urban areas have become increasingly severe due to urbanization. Different vegetation types respond differently to drought, with forest ecosystems having higher drought resistance and stability than farmlands and grasslands.
- (3)
- The spatial differentiation of drought during the growing season is influenced by a combination of meteorological, topographic, soil, and human activity factors. Precipitation serves as a critical factor governing regional drought patterns, with the interaction of water and heat conditions exhibiting the most pronounced effect on drought intensification. Topography and soil also play essential roles by regulating water redistribution and vegetation growth, thus impacting drought patterns. In recent years, the intensity of human activities has shown an upward trend.
- (4)
- Incorporating vegetation phenology into drought assessment enables a more comprehensive and accurate depiction of the interannual impact of drought on vegetation, which is of great value for improving the scientific and precise nature of regional ecological protection and health assessment.
Author Contributions
Funding
Data Availability Statement
Conflicts of Interest
Abbreviations
| CWSI | Crop Water Stress Index |
| DEM | Digital Elevation Model |
| DOY | Day of Year |
| EOS | End of Season |
| EVI | Enhanced Vegetation Index |
| GEE | Google Earth Engine |
| GSHI | Growing Season Health Index |
| HWSD | Harmonized World Soil Database |
| LP | Loess Plateau |
| LST | Land Surface Temperature |
| MODIS | Moderate Resolution Imaging Spectroradiometer |
| MK | Mann–Kendall Test |
| NPP | Net Primary Productivity |
| NPPd | Net Primary Productivity Deviation |
| OPGD | Optimal Parameters-based Geographical Detector |
| PDSI | Palmer Drought Severity Index |
| QC | Quality Control |
| S-G | Savitzky–Golay Filter |
| SOS | Start of Season |
| SPEI | Standardized Precipitation Evapotranspiration Index |
| SPI | Standardized Precipitation Index |
| TCI | Temperature Condition Index |
| TVDI | Temperature Vegetation Dryness Index |
| UEMM | Urban Expansion and Migration Model |
| VCI | Vegetation Condition Index |
| VHI | Vegetation Health Index |
| WGS84 | World Geodetic System 1984 |
References
- West, H.; Quinn, N.; Horswell, M. Remote Sensing for Drought Monitoring & Impact Assessment: Progress, Past Challenges and Future Opportunities. Remote Sens. Environ. 2019, 232, 111291. [Google Scholar] [CrossRef]
- Zhang, J.; Mu, Q.; Huang, J. Assessing the Remotely Sensed Drought Severity Index for Agricultural Drought Monitoring and Impact Analysis in North China. Ecol. Indic. 2016, 63, 296–309. [Google Scholar] [CrossRef]
- Wu, J.; Zhao, A.; Liu, X.; Zhang, Q.; Yao, R.; Mu, Q. Meteorological and Hydrological Drought on the Loess Plateau, China: Evolutionary Characteristics, Impact, and Propagation. J. Geophys. Res. Atmos. 2018, 123, 11569–11584. [Google Scholar] [CrossRef]
- Liu, Z.; Wang, Y.; Shao, M.; Jia, X.; Li, X. Spatiotemporal Analysis of Multiscalar Drought Characteristics Across the Loess Plateau of China. J. Hydrol. 2016, 534, 281–299. [Google Scholar] [CrossRef]
- Agarwal, V.; Akyilmaz, O.; Shum, C.K.; Feng, W.; Garg, S.; Haritashya, U.; Syed, T.H. Machine Learning Based Spatiotem-poral Downscaling of Satellite Gravimetry Groundwater Storage Variations in North China Plain. SSRN 2025. Available online: https://ssrn.com/abstract=5105509 (accessed on 26 February 2025).
- Zhang, B.; Wu, P.; Zhao, X.; Wang, Y.; Wang, J.; Shi, Y. Drought Variation Trends in Different Subregions of the Chinese Loess Plateau Over the Past Four Decades. Agric. Water Manag. 2012, 115, 167–177. [Google Scholar] [CrossRef]
- Stagge, J.H.; Tallaksen, L.M.; Gudmundsson, L.; Van Loon, A.F.; Stahl, K. Candidate Distributions for Climatological Drought Indices (SPI and SPEI). Int. J. Climatol. 2015, 35, 4027–4040. [Google Scholar] [CrossRef]
- Dai, A. Characteristics and Trends in Various Forms of the Palmer Drought Severity Index during 1900–2008. J. Geophys. Res. 2011, 116, D12115. [Google Scholar] [CrossRef]
- AghaKouchak, A.; Farahmand, A.; Melton, F.S.; Teixeira, J.; Anderson, M.C.; Wardlow, B.D.; Hain, C.R. Remote Sensing of Drought: Progress, Challenges and Opportunities. Rev. Geophys. 2015, 53, 452–480. [Google Scholar] [CrossRef]
- Zhong, W.; Mei, X.; Niu, F.; Fan, X.; Ou, S.; Zhong, S. Fusing Social Media, Remote Sensing, and Fire Dynamics to Track Wildland-Urban Interface Fire. Remote Sens. 2023, 15, 3842. [Google Scholar] [CrossRef]
- Ma, Z.; Sun, P.; Zhang, Q.; Yao, R. Remote Sensing Drought Monitoring of North China Based on MODIS Data. Sci. Geogr. Sin. 2022, 42, 152–162. [Google Scholar] [CrossRef]
- Liu, W.T.; Kogan, F.N. Monitoring Regional Drought Using the Vegetation Condition Index. Int. J. Remote Sens. 1996, 17, 2761–2782. [Google Scholar] [CrossRef]
- Kogan, F.N. Application of Vegetation Index and Brightness Temperature for Drought Detection. Adv. Space Res. 1995, 15, 91–100. [Google Scholar] [CrossRef]
- Zhong, S.; Sun, Z.; Di, L. Characteristics of Vegetation Response to Drought in the CONUS Based on Long-Term Remote Sensing and Meteorological Data. Ecol. Indic. 2021, 127, 107767. [Google Scholar] [CrossRef]
- Xu, Z.; Zhong, S.; Di, L.; Gao, F.; Zhang, Y. Trends in Global Vegetative Drought from Long-Term Satellite Remote Sensing Data. IEEE J. Sel. Top. Appl. Earth Obs. Remote Sens. 2020, 13, 815–826. [Google Scholar] [CrossRef]
- Yue, Z.; Mei, X.; Xu, Z.; Zhong, S. A Literature Review of Study on Remote Sensing Drought Monitoring System. In Proceedings of the 2024 12th International Conference on Agro-Geoinformatics (Agro-Geoinformatics), Novi Sad, Serbia, 15–18 July 2024; pp. 1–6. [Google Scholar] [CrossRef]
- Yue, Z.; Mei, X.; Zhong, S. Implementation of an Automated Vegetation Drought Monitoring System Based on Long-Term Satellite Remote Sensing. In Proceedings of the 2023 11th International Conference on Agro-Geoinformatics (Agro-Geoinformatics), Wuhan, China, 25–28 July 2023; pp. 1–6. [Google Scholar] [CrossRef]
- Yue, Z.; Mei, X.; Zhong, S.; Xu, Z. Spatiotemporal Patterns and Driving Factors of Growing Season Drought on the Loess Plateau. In Proceedings of the 2024 12th International Conference on Agro-Geoinformatics (Agro-Geoinformatics), Novi Sad, Serbia, 15–18 July 2024; pp. 1–6. [Google Scholar] [CrossRef]
- Kogan, F.N. Global Drought Watch from Space. Bull. Am. Meteorol. Soc. 1997, 78, 621–636. [Google Scholar] [CrossRef]
- Kogan, F.N. Operational Space Technology for Global Vegetation Assessment. Bull. Am. Meteorol. Soc. 2001, 82, 1949–1964. [Google Scholar] [CrossRef]
- Gao, X.; Zhao, Q.; Zhao, X.; Wu, P.; Pan, W.; Gao, X.; Sun, M. Temporal and Spatial Evolution of the Standardized Precipitation Evapotranspiration Index (SPEI) in the Loess Plateau under Climate Change from 2001 to 2050. Sci. Total Environ. 2017, 595, 191–200. [Google Scholar] [CrossRef]
- Guo, M.; She, D.; Zhang, L.; Leng, G.; Wen, Z.; Dodd, I.C.; Cai, W. Attribution of Trends in Meteorological Drought During 1960–2016 over the Loess Plateau, China. J. Geogr. Sci. 2021, 31, 1123–1139. [Google Scholar] [CrossRef]
- Li, M.; Ge, C.; Deng, Y.; Zhang, Q.; Sun, P.; Yao, R. Meteorological and Agricultural Drought Characteristics and Their Relationship Across the Loess Plateau. Sci. Geogr. Sin. 2020, 40, 2105–2114. [Google Scholar] [CrossRef]
- Wang, Y.; Shi, H.; Jiang, Y.; Wu, Y.; Gao, Y.; Ding, C. Spatio-Temporal Variation of Drought Characteristics and Its Influencing Factors in Loess Plateau Based on TVDI. Trans. Chin. Soc. Agric. Mach. 2023, 54, 184–195. [Google Scholar] [CrossRef]
- Liu, L.; Wu, J.; Li, C.; Chang, X. Spatial and Temporal Distributions of Drought on the Loess Plateau During the Growing Seasons of 2001–2020. Acta Prataculturae Sin. 2024, 33, 28–36. [Google Scholar] [CrossRef]
- Ge, C.; Sun, S.; Yao, R.; Sun, P.; Li, M.; Bian, Y. Long-term Vegetation Phenology Changes and Response to Multi-scale Meteorological Drought on the Loess Plateau, China. J. Hydrol. 2022, 614, 128605. [Google Scholar] [CrossRef]
- Chen, W.; Yao, R.; Sun, P.; Zhang, Q.; Singh, V.P.; Sun, S.; AghaKouchak, A.; Ge, C.; Yang, H. Drought Risk Assessment of Winter Wheat at Different Growth Stages in Huang-Huai-Hai Plain Based on Nonstationary Standardized Precipitation Evapotranspiration Index and Crop Coefficient. Remote Sens. 2024, 16, 1625. [Google Scholar] [CrossRef]
- Fu, B.; Wang, S.; Liu, Y.; Liu, J.; Liang, W.; Miao, C. Hydrogeomorphic Ecosystem Responses to Natural and Anthropogenic Changes in the Loess Plateau of China. Annu. Rev. Earth Planet. Sci. 2017, 45, 223–243. [Google Scholar] [CrossRef]
- Li, M.; Yang, Q.; Zong, S.; Wang, G.; Zhang, D. Understanding the Spatiotemporal Dynamics of Vegetation Drought and Its Time-Lag Link with Teleconnection Factors on the Loess Plateau. J. Hydrol. Reg. Stud. 2024, 53, 101778. [Google Scholar] [CrossRef]
- Wu, J.; Miao, C.; Wang, Y.; Duan, Q.; Zhang, X. Contribution Analysis of the Long-Term Changes in Drought Characteristics of the Yellow River Basin. Atmos. Res. 2017, 199, 15–24. [Google Scholar] [CrossRef]
- Zhao, D.; Xu, M.; Liu, G.; Ma, L.; Zhang, S.; Xiao, T.; Peng, G. Effect of Vegetation Type on Microstructure of Soil Aggregates on the Loess Plateau, China. Agric. Ecosyst. Environ. 2017, 242, 1–8. [Google Scholar] [CrossRef]
- Feng, X.; Fu, B.; Piao, S.; Wang, S.; Ciais, P.; Zeng, Z.; Lü, Y.; Zeng, Y.; Li, Y.; Jiang, X.; et al. Revegetation in China’s Loess Plateau Is Approaching Sustainable Water Resource Limits. Nat. Clim. Change 2016, 6, 1019–1022. [Google Scholar] [CrossRef]
- Didan, K. MODIS/Terra Vegetation Indices 16-Day L3 Global 250 m SIN Grid V061. NASA EOSDIS Land Processes DAAC. 2021. Available online: https://lpdaac.usgs.gov/products/mod13q1v061/ (accessed on 14 August 2024).
- Wan, Z.; Hook, S.; Hulley, G. MODIS/Terra Land Surface Temperature/Emissivity Daily L3 Global 1 km SIN Grid V061. NASA EOSDIS Land Processes DAAC. 2021. Available online: https://doi.org/10.5067/MODIS/MOD11A1.061 (accessed on 14 August 2024).
- Tan, J.; Che, T.; Wang, J.; Liang, J.; Zhang, Y.; Ren, Z. Reconstruction of the Daily MODIS Land Surface Temperature Product Using the Two-Step Improved Similar Pixels Method. Remote Sens. 2021, 13, 1671. [Google Scholar] [CrossRef]
- Running, S.W.; Nemani, R.R.; Heinsch, F.A.; Zhao, M.; Reeves, M.; Hashimoto, H. A Continuous Satellite-Derived Measure of Global Terrestrial Primary Production. Bioscience 2004, 54, 547–560. [Google Scholar] [CrossRef]
- Cao, D.; Zhang, Y.; Peng, S.; Luo, Y. Projected Increases in Global Terrestrial Net Primary Productivity Loss Caused by Drought Under Climate Change. Earth’s Future 2022, 10, e2022EF002681. [Google Scholar] [CrossRef]
- NASA Jet Propulsion Laboratory. NASADEM Merged DEM Global 1 arc Second V001. NASA EOSDIS Land Processes DAAC. 2020. Available online: https://doi.org/10.5067/MEaSUREs/NASADEM/NASADEM_HGT.001 (accessed on 14 August 2024).
- ESSDC, Earth System Science Data Center of China, National Science & Technology Infrastructure of China. Available online: https://www.geodata.cn (accessed on 14 August 2024).
- Friedl, M.A.; Sulla-Menashe, D.; Tan, B.; Schneider, A.; Ramankutty, N.; Sibley, A.; Huang, X. MODIS Collection 5 Global Land Cover: Algorithm Refinements and Characterization of New Datasets. Remote Sens. Environ. 2010, 114, 168–182. [Google Scholar] [CrossRef]
- LP DAAC. MCD12Q1 v006: MODIS/Terra+Aqua Land Cover Type Yearly L3 Global 500 m SIN Grid. NASA EOSDIS Land Processes DAAC. 2024. Available online: https://doi.org/10.5067/MODIS/MOD17A3HGF.061 (accessed on 14 August 2024).
- FAO, IIASA. Harmonized World Soil Database Version 2.0. Rome and Laxenburg. 2023. Available online: https://doi.org/10.4060/cc3823en (accessed on 14 August 2024).
- Mu, H.W.; Li, X.C.; Wen, Y.N.; Huang, J.X.; Du, P.J.; Su, W.; Miao, S.X.; Geng, M.Q. A Global Record of Annual Terrestrial Human Footprint Dataset from 2000 to 2018. Sci. Data 2022, 9, 176. [Google Scholar] [CrossRef]
- Crippa, M.; Guizzardi, D.; Pagani, F.; Banja, M.; Muntean, M.; Schaaf, E.; Becker, W.; Monforti-Ferrario, F.; Quadrelli, R.; Risquez Martin, A.; et al. GHG Emissions of All World Countries; Publications Office of the European Union: Luxembourg, 2023. [Google Scholar] [CrossRef]
- Gong, Z.; Ge, W.; Guo, J.; Liu, J. Satellite Remote Sensing of Vegetation Phenology: Progress, Challenges, and Opportunities. ISPRS J. Photogramm. Remote Sens. 2024, 217, 149–164. [Google Scholar] [CrossRef]
- Henebry, G.M.; de Beurs, K.M. Remote Sensing of Land Surface Phenology: A Prospectus. In Phenology: An Integrative Environmental Science; Schwartz, M.D., Ed.; Springer: Dordrecht, The Netherlands, 2013; pp. 385–411. [Google Scholar] [CrossRef]
- Tan, B.; Zhang, X.; Townshend, J.; Moder, F.; Huang, D. An Enhanced TIMESAT Algorithm for Estimating Vegetation Phenology Metrics from MODIS Data. IEEE J. Sel. Top. Appl. Earth Obs. Remote Sens. 2010, 4, 361–371. [Google Scholar] [CrossRef]
- Cai, Z.; Jönsson, P.; Eklundh, L.; Jin, H.; Liu, Z.; Yang, J. Performance of Smoothing Methods for Reconstructing NDVI Time-series and Estimating Vegetation Phenology from MODIS Data. Remote Sens. 2017, 9, 1271. [Google Scholar] [CrossRef]
- Yagci, A.L.; Di, L.; Deng, M. The Effect of Land-cover Change on Vegetation Greenness-based Satellite Agricultural Drought Indicators: A Case Study in the Southwest Climate Division of Indiana, USA. Int. J. Remote Sens. 2013, 34, 6947–6968. [Google Scholar] [CrossRef]
- Yagci, A.L.; Di, L.; Deng, M. The Effect of Corn–Soybean Rotation on the NDVI-based Drought Indicators: A Case Study in Iowa, USA, Using Vegetation Condition Index. GIScience Remote Sens. 2015, 52, 290–314. [Google Scholar] [CrossRef]
- Chen, T.; Werf, G.R.; Jeu, R.A.M.; Wang, G.; Dolman, A.J. A Global Analysis of the Impact of Drought on Net Primary Productivity. Hydrol. Earth Syst. Sci. 2013, 17, 3885–3894. [Google Scholar] [CrossRef]
- Song, Y.; Wang, J.; Ge, Y.; Xu, C. An Optimal Parameters-based Geographical Detector Model Enhances Geographic Characteristics of Explanatory Variables for Spatial Heterogeneity Analysis: Cases with Different Types of Spatial Data. GISci. Remote Sens. 2020, 57, 593–610. [Google Scholar] [CrossRef]
- Zhou, W.; Li, J.; Yue, T. Remote Sensing Monitoring and Evaluation of Degraded Grassland in China; Springer Nature Singapore Private Ltd.: Singapore, 2020. [Google Scholar] [CrossRef]
- Chiang, F.; Mazdiyasni, O.; AghaKouchak, A. Evidence of Anthropogenic Impacts on Global Drought Frequency, Duration, and Intensity. Nat. Commun. 2021, 12, 2754. [Google Scholar] [CrossRef]
- Hua, T.; Wang, X.; Zhang, C.; Lang, L.; Li, H. Responses of Vegetation Activity to Drought in Northern China. Land Degrad. Dev. 2017, 28, 1913–1921. [Google Scholar] [CrossRef]
- Wu, C.; Zhong, L.; Yeh, P.J.F.; Gong, Z.; Lv, W.; Chen, B.; Zhou, J.; Li, J.; Wang, S. An Evaluation Framework for Quantifying Vegetation Loss and Recovery in Response to Meteorological Drought Based on SPEI and NDVI. Sci. Total Environ. 2023, 906, 167632. [Google Scholar] [CrossRef]
- Zaehle, S.; Wigneron, J.P.; Bastos, A.; Yang, H. Land-cover and Management Modulation of Ecosystem Resistance to Drought Stress. EGUsphere 2023, 2023, 1–31. [Google Scholar] [CrossRef]
- Feng, X.; Fu, B.; Lu, N.; Zeng, Y.; Wu, B. How Ecological Restoration Alters Ecosystem Services: An Analysis of Carbon Sequestration in China’s Loess Plateau. Sci. Rep. 2013, 3, 2846. [Google Scholar] [CrossRef]
- Fan, X.; Qu, Y.; Zhang, J.; Bai, E. China’s Vegetation Restoration Programs Accelerated Vegetation Greening on the Loess Plateau. Agric. For. Meteorol. 2024, 350, 109994. [Google Scholar] [CrossRef]
- Huang, S.; Wang, S.; Gan, Y.; Wang, C.; Horton, D.E.; Li, C.; Zhang, X.; Niyogi, D.; Xia, J.; Chen, N. Urbanization Exacerbates Extreme Drought in Almost Half of Cities Worldwide. Nat. Cities 2024, 1, 543–544. [Google Scholar] [CrossRef]
- Wu, G.; Chen, J.; Shi, X.; Kim, J.S.; Xia, J.; Zhang, L. Impacts of Global Climate Warming on Meteorological and Hydrological Droughts and Their Propagations. Earth’s Future 2022, 10, e2021EF002542. [Google Scholar] [CrossRef]
- Ionova, E.; Likhovidova, V.; Lobunskaya, I. Drought and Hydrothermal Humidity Factor as One of the Criteria to Estimate Its Intensity Degree (Literature Review). Grain Econ. Russ. 2020, 6, 18–22. [Google Scholar] [CrossRef]
- Jiang, P.; Zhang, X.; Zhou, L.; Li, F.; Zhou, Z.; Liu, W. Diverse Response of Vegetation Growth to Multi-time-scale Drought Under Different Soil Textures in China’s Pastoral Areas. J. Environ. Manag. 2020, 274, 110992. [Google Scholar] [CrossRef] [PubMed]
- Wang, S.; Fu, B.; Piao, S.; Lü, Y.; Ciais, P.; Feng, X.; Wang, Y. Reduced Sediment Transport in the Yellow River Due to Anthropogenic Changes. Nat. Geosci. 2016, 9, 38–41. [Google Scholar] [CrossRef]
- Zhao, W.; Xu, L.; Liu, X.; Song, G.; Wei, Z.; Li, X.; Li, F. Deciphering the Influence of Climate Change and Human Activities on the Drought Propagation. J. Hydrol. Reg. Stud. 2024, 51, 1016. [Google Scholar] [CrossRef]
- Zeng, Y.; Fang, N.; Shi, Z. Effects of Human Activities on Soil Organic Carbon Redistribution at an Agricultural Watershed Scale on the Chinese Loess Plateau. Agric. Ecosyst. Environ. 2020, 303, 107112. [Google Scholar] [CrossRef]
- Ye, L.; Fang, L.; Shi, Z.; Deng, L.; Tan, W. Spatio-temporal Dynamics of Soil Moisture Driven by ‘Grain for Green’ Program on the Loess Plateau, China. Agric. Ecosyst. Environ. 2019, 269, 204–214. [Google Scholar] [CrossRef]
- Zhang, W.; Zhang, W.; Ji, J.; Chen, C. Urban Ecological Quality Assessment Based on Google Earth Engine and Driving Factors Analysis: A Case Study of Wuhan City, China. Sustainability 2024, 16, 3598. [Google Scholar] [CrossRef]
- Thayn, J.B.; Price, K.P. Julian Dates and Introduced Temporal Error in Remote Sensing Vegetation Phenology Studies. Int. J. Remote Sens. 2008, 29, 6045–6049. [Google Scholar] [CrossRef]
- Lu, J.; Sun, P.; Ge, C.; Yao, R.; Wang, H.; Chen, W. Response of Vegetation to Drought in the Source Region of the Yangtze and Yellow Rivers Based on Causal Analysis. Remote Sens. 2024, 16, 630. [Google Scholar] [CrossRef]
- Zhang, Q.; Kong, D.; Singh, V.P.; Shi, P. Response of Vegetation to Different Time-Scales Drought across China: Spatiotemporal Patterns, Causes and Implications. Glob. Planet. Change 2017, 152, 1–11. [Google Scholar] [CrossRef]


| Level | Type | GSHI Value |
|---|---|---|
| D0 | No drought | ≥0.45 |
| D1 | Mild drought | [0.35, 0.45) |
| D2 | Moderate drought | [0.25, 0.35) |
| D3 | Severe drought | [0.15, 0.25) |
| D4 | Extreme drought | <0.15 |
| Interaction Type | Judgment Criteria |
|---|---|
| Non-linear Weakening | |
| Non-linear Attenuation | |
| Bi-factor Enhancement | |
| Mutually Independent | |
| Non-linear Enhancement |
| Category | Detection Factor | 2005 | 2009 | 2015 | 2019 | ||||
|---|---|---|---|---|---|---|---|---|---|
| Method | Classes | Method | Classes | Method | Classes | Method | Classes | ||
| Meteorology | Precipitation | sd | 6 | sd | 6 | sd | 6 | sd | 6 |
| Temperature | qt | 9 | sd | 8 | nb | 8 | sd | 9 | |
| Sunshine hours | sd | 9 | sd | 8 | sd | 9 | sd | 9 | |
| Topography | Elevation | sd | 6 | sd | 6 | sd | 6 | sd | 6 |
| Slope | sd | 9 | sd | 9 | sd | 9 | sd | 9 | |
| Aspect | - | - | - | - | - | - | - | - | |
| Underlying surface | Soil type | - | - | - | - | - | - | - | - |
| Sand content | sd | 9 | sd | 9 | sd | 9 | qt | 9 | |
| Clay content | nb | 9 | nb | 9 | nb | 9 | nb | 8 | |
| Human activities | Human footprint | sd | 6 | sd | 6 | sd | 6 | sd | 6 |
| Distance to city | sd | 9 | sd | 9 | sd | 9 | sd | 9 | |
| Carbon emissions | qt | 7 | qt | 8 | qt | 8 | qt | 9 | |
Disclaimer/Publisher’s Note: The statements, opinions and data contained in all publications are solely those of the individual author(s) and contributor(s) and not of MDPI and/or the editor(s). MDPI and/or the editor(s) disclaim responsibility for any injury to people or property resulting from any ideas, methods, instructions or products referred to in the content. |
© 2025 by the authors. Licensee MDPI, Basel, Switzerland. This article is an open access article distributed under the terms and conditions of the Creative Commons Attribution (CC BY) license (https://creativecommons.org/licenses/by/4.0/).
Share and Cite
Yue, Z.; Zhong, S.; Wang, W.; Mei, X.; Huang, Y. Phenology-Optimized Drought Index Reveals the Spatio-Temporal Patterns of Vegetation Health and Its Attribution on the Loess Plateau. Remote Sens. 2025, 17, 891. https://doi.org/10.3390/rs17050891
Yue Z, Zhong S, Wang W, Mei X, Huang Y. Phenology-Optimized Drought Index Reveals the Spatio-Temporal Patterns of Vegetation Health and Its Attribution on the Loess Plateau. Remote Sensing. 2025; 17(5):891. https://doi.org/10.3390/rs17050891
Chicago/Turabian StyleYue, Zichen, Shaobo Zhong, Wenhui Wang, Xin Mei, and Yunxin Huang. 2025. "Phenology-Optimized Drought Index Reveals the Spatio-Temporal Patterns of Vegetation Health and Its Attribution on the Loess Plateau" Remote Sensing 17, no. 5: 891. https://doi.org/10.3390/rs17050891
APA StyleYue, Z., Zhong, S., Wang, W., Mei, X., & Huang, Y. (2025). Phenology-Optimized Drought Index Reveals the Spatio-Temporal Patterns of Vegetation Health and Its Attribution on the Loess Plateau. Remote Sensing, 17(5), 891. https://doi.org/10.3390/rs17050891