Abstract
Utilizing daily data gathered from 63 meteorological stations across Sichuan Province between 1970 and 2022, this study investigates the spatial and temporal shifts in extreme precipitation patterns, alongside the connections between changes in extreme precipitation indices (EPIs) and the underlying drivers, such as geographic characteristics and atmospheric circulation influences, within the region. The response of precipitation to these factors was examined through various methods, including linear trend analysis, the Mann–Kendall test, cumulative anomaly analysis, the Pettitt test, R/S analysis, Pearson correlation analysis, and wavelet transformation. The findings revealed that (1) Sichuan Province’s EPIs generally show an upward trend, with the simple daily intensity index (SDII) demonstrating the most pronounced increase. Notably, the escalation in precipitation indices was more substantial during the summer months compared to other seasons. (2) The magnitude of extreme precipitation variations showed a rising pattern in the plateau regions of western and northern Sichuan, whereas a decline was observed in the central and southeastern basin areas. (3) The number of days with precipitation exceeding 5 mm (R5mm), 10 mm (R10mm), and 20 mm (R20mm) all exhibited a significant change point in 2012, surpassing the 95% significance threshold. The future projections for EPIs, excluding consecutive dry days (CDDs), align with historical trends and suggest a continuing possibility of an upward shift. (4) Most precipitation indices, with the exception of CDDs, demonstrated a robust positive correlation with longitude and a negative correlation with both latitude and elevation. Except for the duration indicators (CDDs, CWDs), EPIs generally showed a gradual decrease with increasing altitude. (5) Atmospheric circulation patterns were found to have a substantial impact on extreme precipitation events in Sichuan Province, with the precipitation indices showing the strongest associations with the Atlantic Multidecadal Oscillation (AMO), the Sea Surface Temperature of the East Central Tropical Pacific (Niño 3.4), and the South China Sea Summer Monsoon Index (SCSSMI). Rising global temperatures and changes in subtropical high pressure in the western Pacific may be deeper factors contributing to changes in extreme precipitation. These insights enhance the understanding and forecasting of extreme precipitation events in the region.
1. Introduction
Since the dawn of the 21st century, the world has witnessed a marked escalation in the frequency and severity of catastrophic weather phenomena, both on a global scale and within regional contexts. This alarming trend is predominantly attributed to the far-reaching impacts of climate change, which has significantly altered the dynamics of our planet’s atmospheric and environmental systems. These events impose profound and far-reaching consequences on human societies and ecosystems [1]. Furthermore, as climate change continues to exacerbate these conditions, the occurrence and intensity of extreme weather events are not only persisting but also escalating at an alarming rate [2]. As such, it is imperative to conduct a comprehensive analysis of the changing dynamics of extreme weather events and their driving mechanisms across both global and regional contexts. Among the various manifestations of extreme weather, extreme precipitation stands out as a particularly significant and impactful phenomenon. It frequently triggers a cascade of natural disasters, such as floods, landslides, mudslides, and droughts, which collectively result in substantial economic losses and environmental degradation [3,4]. Understanding the shifts in extreme precipitation patterns is vital for forecasting the likelihood and intensity of extreme weather events. This knowledge is instrumental in developing effective strategies to mitigate the detrimental effects associated with these phenomena [5,6,7,8].
The analysis of extreme weather phenomena frequently employs EPIs established by the Expert Team on Climate Change Detection and Indices (ETCCDI). These indices are derived from precipitation datasets through methodologies that include duration-based metrics, absolute values, and percentiles, serving as standard frameworks for evaluating climatic variability. For instance, Alexander et al. [9] utilized precipitation data from satellite-derived daily and next-day measurements to explore trends and variability in EPIs. Similarly, Zhao et al. [10] investigated projections for ten EPIs across North America, highlighting an anticipated intensification of drought conditions in southern regions during the 21st century. In another study, Guo et al. [11] analyzed 14 EPIs in northeastern China, revealing marked patterns of warming and aridification. These studies collectively demonstrate the power of combining various statistical approaches and modeling techniques to investigate extreme weather trends across different temporal and geographic contexts.
Recent research has consistently demonstrated a global escalation in the magnitude, intensity, frequency, and duration of extreme precipitation events across numerous countries and regions. This trend is a clear indication of the profound impact of climate change on our planet’s hydrological cycle [12,13]. However, different regions exhibit distinct patterns of extreme precipitation, influenced by a combination of local topography, climate conditions, and other environmental factors, such as Japan, India, Europe, North America, and Canada [4,14,15,16,17]. In China, the observed patterns of extreme precipitation largely align with global trends, but with unique regional characteristics [18,19]. Over recent years, China has experienced several severe precipitation events, including the 2016 Yangtze River floods [20], the catastrophic Zhengzhou rainfall event of 20 July 2021 [21], and the 2020 southern China floods [22], all of which resulted in significant loss of life and property. China’s complex terrain, diverse climatic conditions, and spatial heterogeneity of precipitation have led to distinct regional characteristics of extreme precipitation [23,24,25,26]. Sichuan Province is located in southwest China and has a complex terrain with geomorphic features that transition from high altitude in the west to low altitude in the east, including plains, hills, plateaus, and other terrains. The west is mountainous and the east is plains. Extreme precipitation events may cause severe floods, soil erosion, and landslides, threatening human life and property safety. Global warming increases the water vapor content of the atmosphere, thereby increasing the potential risk of extreme precipitation, especially in mountainous areas that are sensitive and vulnerable to climate change. Therefore, studying the spatial distribution and changes in extreme precipitation in Sichuan Province is of great significance to the government’s formulation of flood control, drought relief, and water resource protection policies.
Atmospheric circulation is a crucial determinant of regional precipitation dynamics, exerting profound influence over variations in rainfall across China. Understanding these patterns is essential for unraveling the complex interactions between climate change and extreme precipitation events [27]. Tao et al. [28] highlighted three predominant oceanic modes as key drivers shaping terrestrial precipitation trends and multidecadal fluctuations. These modes encompass global warming, the Atlantic Multidecadal Oscillation (AMO), and the Interdecadal Pacific Oscillation (IPO), as further corroborated by Ouyang et al. [29]. During warm phases of El Niño and the Pacific Decadal Oscillation (PDO), much of China experiences a decline in precipitation and runoff, while La Niña and cold PDO phases are typically associated with increased rainfall. Nonetheless, these trends are marked by notable regional and seasonal disparities. In addition to these large-scale climate modes, several other indicators have been linked to extreme precipitation anomalies across China. Indicators such as the South China Sea Subtropical High-Intensity Index (SCSSHII), the Western Pacific Warm Pool Strength Index (WPWPSI), and the North Atlantic Oscillation Index (NAO) have been linked to extreme precipitation anomalies across China [30,31]. Despite the progress in this area, limited research has delved into the persistence of extreme precipitation events and the interrelationships among these indices, highlighting an urgent need to unravel their localized impacts within China’s diverse climatic regions. Analyzing the spatial and temporal variability in extreme precipitation, alongside its geographic and atmospheric drivers in Sichuan Province, is pivotal to deciphering regional climate change trends.
Research on extreme precipitation has primarily focused on the analysis of spatiotemporal changes in extreme precipitation, extreme precipitation prediction, and the geographical and climatic factors that influence it. However, despite the growing body of literature, there remains a significant gap in the study of extreme precipitation trends in Sichuan Province. Most studies focus on the analysis of spatiotemporal changes in extreme precipitation and the climatic factors that affect it, such as Li et al. [32], and a few focus on the analysis of spatiotemporal changes in extreme precipitation and its future predictions, such as Yang et al. [33]. Despite progress in this regard, there is limited research on the persistence of extreme precipitation events and the relationship between these indices, so there is an urgent need to reveal their local impacts in different climate regions of Sichuan Province. By conducting a detailed analysis of the spatiotemporal variability of extreme precipitation in Sichuan and its geographical and atmospheric drivers, we can gain crucial insights into regional climate change trends. These insights are essential for developing informed strategies for disaster risk reduction and enhancing climate resilience.
This study aims to fill these gaps by focusing on the following key objectives: (1) exploring interannual trends, seasonal fluctuations, abrupt transitions, and the persistence of future extreme precipitation changes in Sichuan Province between 1970 and 2022; (2) evaluating the influence of EPIs on regional precipitation patterns in Sichuan; and (3) assessing the interplay between geographic features, atmospheric circulation, and extreme precipitation events.
2. Study Area, Data, and Methods
2.1. Study Area
Sichuan Province, situated in the southwestern region of China, encompasses the upper reaches of the Yangtze River. It spans an area of approximately 486,000 square kilometers, with geographic coordinates ranging from 97°21′ to 108°33′ east longitude and 26°03′ to 34°19′ north latitude. The province exhibits remarkable diversity in its terrain and climate, characterized by landforms including basins, plateaus, and mountain ranges. The Sichuan Basin, located in the central subtropical region, experiences a humid subtropical climate with average annual temperatures between 16 °C and 18 °C and yearly precipitation of 1000–1200 mm [32]. In contrast, the mountainous areas in southwest Sichuan fall within a subtropical semi-humid climate zone, where annual temperatures vary from 12 °C to 20 °C and precipitation levels range from 900 to 1200 mm, with distinct wet and dry seasons. Meanwhile, the high-altitude mountains in the northwest exhibit a plateau alpine climate, featuring vertical climatic variation, average yearly temperatures of 4 °C to 12 °C, and annual precipitation between 500 and 900 mm. These diverse geographic and climatic conditions endow Sichuan Province with a unique ecological environment but also make it susceptible to extreme weather events. Therefore, examining the patterns of extreme precipitation variations and their influencing factors is of significant importance.
2.2. Data
The data sources and methodologies employed in this research are summarized in Table 1. The precipitation dataset includes daily records from Sichuan Province, covering the period from 1970 to 2022 [34]. Meteorological stations with substantial missing data were excluded, while minor gaps were addressed through interpolation using the inverse distance weighting method [35]. Ultimately, 63 meteorological stations with high-quality data and even spatial coverage were selected. Figure 1 illustrates the geomorphological features and the spatial distribution of meteorological stations across Sichuan Province. To explore the link between global climate indices and extreme precipitation events in Sichuan, 7 atmospheric circulation indices were selected, considering the broader context of global climate dynamics and regional atmospheric circulation patterns [36,37,38]. The temperature and pressure data used to study the deep changes in atmospheric circulation come from the European Centre for Medium-Range Weather Forecasts (ECMWF) atmospheric reanalysis data (ERA5-Land). Data analysis was performed using Python 3.10.15, and spatial visualizations were created with ArcGIS Desktop 10.8 (https://developers.arcgis.com/python/latest/, accessed on 11 January 2025). Based on meteorological conventions and the geographical characteristics of the study area, the year was categorized into four seasons: spring (March–May), summer (June–August), autumn (September–November), and winter (December–February).

Table 1.
Data descriptions and sources.

Figure 1.
Geomorphological types and meteorological station distribution of Sichuan Province. L: Low-elevation, M: Mid-elevation, H-M: High-to-mid elevation, H: High-elevation, E: Extreme-elevation.
2.3. Methods
The main workflow of this paper is as follows. The EPIs data were collected and calculated from 63 precipitation stations. The indices are categorized into intensity, frequency, duration, precipitation totals, and extreme thresholds. Secondly, various statistical analysis methods were applied to the EPIs data to derive their spatiotemporal patterns and transformations. Subsequently, the EPIs data were analyzed for correlations with total precipitation (PRCPTOT), geographical factors, and atmospheric circulation factors. Based on the results of the correlation analysis, AMO and Niño 3.4, identified as having the strongest correlations with the EPIs, were selected from the atmospheric circulation factors. Crossed wavelet transform (XWT) and wavelet coherence analysis (WTC) were then employed to investigate their periodic influences on the EPIs.
2.3.1. Definition of EPIs
Extreme precipitation is often characterized internationally through the extreme precipitation indices (EPIs) established by the Expert Team on Climate Change Detection and Indices (ETCCDI) (https://www.wcrp-climate.org/etccdi (accessed on 10 November 2024)). These EPIs reflect changes in the intensity, frequency, and duration of extreme climatic events, and have become an important tool for evaluating and tracking the pattern of extreme precipitation and their impacts on the environment and society [25,39]. This study aims to comprehensively assess the multidimensional characteristics (intensity, frequency, and persistence) of extreme precipitation to avoid single-indicator bias, and the selected ETCCDI indices are all international common indices to avoid one-sided analysis. To avoid redundancy, seven EPIs were selected in this study, covering the intensity (SDII, RX1day), frequency (R20mm), duration (CDD, CWD), total amount (PRCPTOT), and extreme thresholds (R95P) of extreme precipitation, which are defined as shown in Table 2. The remaining thresholds (e.g., R5mm, R10mm) and methods (e.g., RX5day) are moved to the Appendix A Table A2 for reference because the trends are highly similar.
Table 2.
Definitions of EPIs.
2.3.2. Linear Trend Analysis and M-K Significance Test
Ordinary Least Squares (OLS) [19,40] is employed to evaluate trends in the EPIs. The slope of the regression equation represents the direction and magnitude of the trend, with the climate tendency rate determined by multiplying the slope by 10. A positive slope indicates an upward trend, while a negative slope reflects a downward trend in the index. The rate of change is conveyed by the absolute value of the slope. The Mann–Kendall (M-K) test [41,42] is a widely used nonparametric method for identifying trend significance in time series analysis, owing to its robustness against outliers and its independence from specific data distribution assumptions [43,44]. The M-K trend significance test is represented by the statistical parameter Z. The sign of Z indicates the direction of the trend: Z > 0 represents an increasing trend, while Z < 0 represents a decreasing trend. The absolute value of Z reflects the significance of the trend: the larger the absolute value, the more pronounced the trend. Common significance levels are 0.05 and 0.01, corresponding to passing the 95% and 99% confidence thresholds, respectively. In this study, the significance of the trend is evaluated at the 95% confidence level (p < 0.05), and it is considered to have passed the test when |Z| ≥ 1.96 [45].
2.3.3. Cumulative Anomaly Method and Pettitt Test
The cumulative anomaly method [46] is widely used in time series analysis to detect abrupt changes and identify abnormal patterns. This technique constructs a transformed series by summing the deviations of each data point from the series mean. A cumulative anomaly curve is then generated, where statistically significant inflection points are interpreted as potential change points. The Pettitt test [47,48] is a nonparametric method used to detect mutation points within time series. When the test statistic for a specific point satisfies p < 0.05, it suggests the presence of a significant mutation point in the series [49]. In this study, both methods are employed to identify potential mutation points, and their results are integrated to identify the final mutation points.
2.3.4. R/S Analysis
The R/S analysis, a statistical technique first introduced by the British hydrologist H.E. Hurst [50], has been extensively applied to investigate long-term dependencies and self-similarity within time series. A central outcome of R/S analysis is the computation of the Hurst exponent H, where D = 2 − H. The Hurst parameter H ranges between 0 and 1, and its interplay with D is instrumental in characterizing the persistence or anti-persistence of time series trends. When 0 < H < 0.5 and D > 1.5, the time series is categorized as anti-persistent, with smaller H values signifying stronger anti-persistence. In contrast, if H = 0.5 and D = 1.5, the time series behaves as if it is completely uncorrelated, resembling a random walk. For 0.5 < H < 1 and D < 1.5, the time series demonstrates persistent behavior, with larger H values corresponding to stronger persistence. A scenario where H = 1 and D = 1 signifies a perfectly correlated time series.
2.3.5. Pearson Correlation Analysis and Wavelet Transform
Pearson correlation analysis [51] serves as a simple yet powerful statistical approach to assess the linear association between datasets. The Pearson correlation coefficient, which ranges from −1 to 1, indicates both the magnitude and direction of the relationship. A negative coefficient (less than 0) signifies an inverse relationship, whereas a positive value (greater than 0) reflects a direct relationship. The strength of this association increases as the absolute value of the coefficient approaches 1, implying a stronger linear dependency between the variables. In this research, Pearson correlation analysis is utilized to analyze the connections among geographical attributes, atmospheric circulation patterns, annual precipitation indices, and EPIs. To delve deeper into the temporal and energy-specific associations, the crossed wavelet transform (XWT) [52] is applied, offering insights into correlations within high-energy regions. Simultaneously, wavelet coherence analysis (WTC) [53] is used to identify correlations in low-energy domains and to investigate localized relationships between the two sequences. In this study, XWT and WTC are employed to reveal the periodic behaviors and intricate interconnections between EPIs and circulation factors across the research area.
3. Results
3.1. Changes in EPIs
3.1.1. Trend Changes in EPIs
The linear trends of the EPIs are presented in Figure 2, with the corresponding statistical results summarized in Table 3. Figure 3 showcases the spatial distribution characteristics of EPIs across Sichuan Province spanning the period from 1970 to 2022. The M-K significance test was used to determine the trend of change at the site.
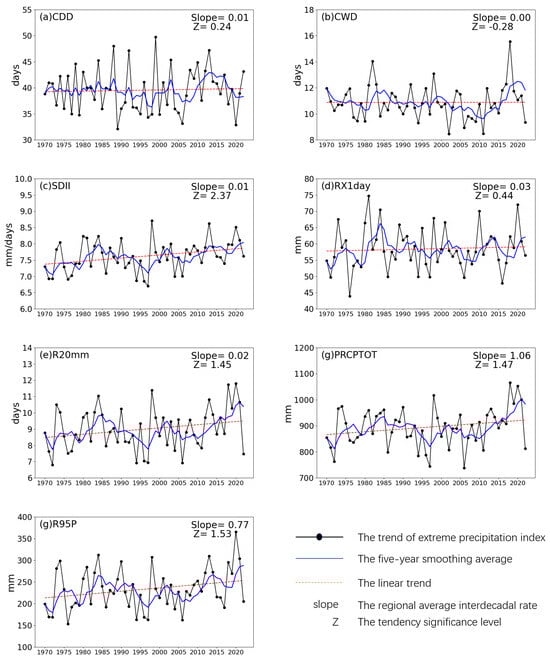
Figure 2.
Linear trends and five-year moving averages of EPIs. (a) Linear trend of CDD. (b) Linear trend of CWD. (c) Linear trend of SDII. (d) Linear trend of RX1day. (e) Linear trend of R20mm. (f) Linear trend of PRCPTOT. (g) Linear trend of R95P.
Table 3.
Results of statistical analysis of trends in the number of stations for EPIs in Sichuan Province, 1970–2022.

Figure 3.
Spatial distribution patterns of sites in EPIs and mean annual precipitation distribution. (a) Spatial distribution of CDD. (b) Spatial distribution of CWD. (c) Spatial distribution of SDII. (d) Spatial distribution of RX1day. (e) Spatial distribution of R20mm. (f) Spatial distribution of PRCPTOT. (g) Spatial distribution of R95P. (h) Average annual precipitation distribution.
CDDs is a key indicator for assessing drought characteristics, Its core is to quantify the duration of no effective precipitation. The CDDs showed an increasing trend that was statistically insignificant overall. Nevertheless, the five-year sliding average curve indicated a noticeable upward shift after 2005 (Figure 2a). Among the evaluated stations, 36 (57%) displayed an upward trend, of which 7 (11%) exhibited a statistically significant positive trend (p < 0.05). Conversely, 27 stations (43%) showed a declining trend, with only 3 (5%) of these demonstrating a statistically significant decrease (Table 3). As shown in Figure 3h, the annual average precipitation in Sichuan Province generally shows a trend of gradually increasing from northwest to southeast. At the same time, the stations with an increasing trend in CDDs are mainly distributed in the southeastern part of Sichuan Province (Figure 3a), among which the growth rate is the highest in the southeast corner of the study area. On the other hand, the stations with a decreasing trend are mainly concentrated in the western and northern parts of Sichuan Province. Therefore, the precipitation in the study area has a trend of gradually shifting from the southeast to the northwest.
CWDs, as a precipitation persistence indicator, reflects the temporal continuity characteristics of extreme precipitation events. Overall CWDs shows a non-significant trend; however, the five-year sliding average curve highlights notable upward shifts in 1980 and 2015 (Figure 2b). The number of stations exhibiting increasing and decreasing trends was nearly balanced, with one station showing no discernible trend. All stations with increasing trends displayed statistically insignificant variations, while statistically significant decreases were recorded at only 4 stations (6%) showing downward trends (Table 3). Stations with increasing trends in CWDs were predominantly situated in the central region of Sichuan Province, whereas those with decreasing trends were mainly clustered in the southeastern part (Figure 3b). Combining Figure 3 with the spatial distribution model of CDDs, it can better illustrate the trend of precipitation from decreasing to increasing in Sichuan Province from the southeast to the northwest.
The SDII is an indicator to measure the intensity of precipitation; the long-term regional trend of the SDII demonstrated a pronounced upward trajectory, with a marked surge in precipitation intensity occurring during 1997–1998 (Figure 2c). Both the linear trend analysis and the Mann–Kendall (MK) significance test (Table 3) revealed that 53 stations (84%) experienced an upward trend in precipitation intensity, with 8 stations (13%) showing statistically significant increases. Conversely, 10 stations (16%) displayed a declining trend. The spatial distribution of the SDII indicated a notable increase in precipitation intensity, particularly in the western regions of Sichuan Province (Figure 3c). Stations with rising trends were scattered throughout most of the study area, excluding the plains surrounding Chengdu, where precipitation intensity exhibited a decreasing trend. In the southeast region, where precipitation is decreasing, the intensity of precipitation on rainy days is increasing.
RX1day denotes the maximum single-day maximum precipitation in a year, reflecting the severity of heavy rainfall over a short period of time. As shown in Figure 2d, the overall regional trends of the index show a statistically insignificant upward trend. Specifically, RX1day shows a continuous increase between 1976 and 1981. Table 3 shows that 44 sites (69%) showed an increasing trend in RX1day precipitation, with 4 sites (6%) reaching statistical significance (p < 0.05). In contrast, 19 sites (31%) showed a decreasing trend, of which only 1 site (2%) reached statistical significance (p < 0.05). The spatial distribution pattern in Figure 3d shows that most of the RX1day in the study area showed an increasing trend, and the stations with decreasing trends were mainly concentrated in the urban areas around Chengdu, which may be related to the geographic conditions of Chengdu, which is a plains area.
R20mm denotes the number of days in a year with daily precipitation of 20 mm or more, and is used to measure the frequency of extreme heavy precipitation events; similar indices are R5mm and R10mm. R20mm shows a statistically insignificant increasing trend between 1970 and 2022 (Figure 2e), and the five-year sliding average curves show significant fluctuations and phase differences, with an overall “falling-rising-falling” pattern. As shown in Table 3, 43 sites (68%) showed an increasing trend, with 9 sites (14%) exceeding the 95% significance threshold. In contrast, 20 sites (31%) showed a decreasing trend, of which only 1 site (1%) was statistically significant, and 1 site had no significant trend.The spatial distribution patterns of R5 mm, R10 mm, and R20 mm (Appendix A Figure A1) indicate that the frequency of days with annual precipitation exceeding 5 mm, 10 mm, and 20 mm has mainly decreased in the southeastern part of Sichuan Province. In contrast, the northwestern region shows a clear increasing trend.
PRCPTOT denotes the total annual precipitation, which is used to measure the overall accumulation of precipitation throughout the year. Although it does not directly reflect the intensity of extreme events, it provides overall information on the distribution of precipitation and is positively correlated with other indices of precipitation extremes (e.g., R95P, SDII, etc.). As observed through the five-year moving average curve, PRCPTOT shows a statistically negligible upward trend and the regional pattern exhibits moderate oscillations (Figure 2f). As shown in Table 3, 47 sites (75%) showed an upward trend, with 11 sites (18%) reaching the 95% confidence level. In contrast, 16 sites (25%) showed a decreasing trend, but none of them reached the statistical significance level. The spatial distribution of PRCPTOT (Figure 3f) and the distribution of the mean annual rainfall in Sichuan Province (Figure 3h) indicate that the sites with an increasing trend are mainly concentrated in the northwestern part of Sichuan Province, while those with a decreasing trend are mainly concentrated in the southeastern region. The future distribution of precipitation in Sichuan Province may show a trend of shifting from the southeastern region to the northwestern region.
R95P represents the cumulative total of all precipitation events with daily precipitation exceeding the 95th percentile value for the region during a given time period, reflecting the total volume or intensity of extreme heavy precipitation. The long-term regional trend in R95P (Figure 2g) shows a statistically insignificant upward pattern. Based on the five-year moving average curve, R95P shows higher variability and a more pronounced overall upward trajectory. As shown in Table 3, both the linear trend analysis and the M-K significance test indicate that for R95P, 48 sites (76%) show an upward trend, with 9 sites (14%) reaching statistical significance, while the remaining sites show a downward trend and lack statistical significance. The spatial distribution (Figure 3g) shows that sites with increasing trends in R95P were distributed in most parts of Sichuan Province. The stations with obvious upward trends are mainly concentrated in the western and northern regions, while the extreme precipitation in the vicinity of Chengdu shows a decreasing trend.
In general, extreme precipitation in Sichuan Province shows significant spatial and temporal variability during the period 1970–2022, with an overall trend of enhanced precipitation in the northwest and weakened precipitation in the southeast. The northwestern part of the province will face the pressure of increasing extreme precipitation, the southeastern part of the province will need to guard against the risk of drought, and the Chengdu Plain will be characterized by local climate regulation. The distribution of precipitation shows a trend of “southeast to northwest shift”, with aridification in the southeast and humidification in the northwest, which may be affected by the adjustment of atmospheric circulation or local topography. This shift may exacerbate the uneven distribution of water resources in the region, requiring attention to the synergistic risks of flooding in the northwest and drought in the southeast.
3.1.2. Seasonal Changes in EPIs
Figure 4 provides an overview of the seasonal mean linear trends and corresponding significance tests for EPIs, where significance tests was performed using the M-K significance test. The figure depicts the seasonal variation trajectories of these indices across Sichuan Province from 1970 to 2022. Over the last 53 years, the linear trends suggest a marginal, statistically insignificant increase in precipitation across all seasons—spring, summer, autumn, and winter. Nevertheless, the spatial and temporal distribution of precipitation remains highly uneven, with summer demonstrating markedly higher trends in the EPIs compared to other seasons. This phenomenon reflects intensified wet conditions during summer and heightened aridity in other seasons, amplifying the likelihood of summer flooding and droughts during non-summer months. Among the indices, the R95P metric exhibits the most pronounced upward trend in summer, increasing by 0.57 mm per decade. Conversely, the CDD index indicates a negligible downward trend in spring, with a reduction rate of 0.01 mm per decade. However, neither of these trends achieves statistical significance at the 0.05 confidence level in any season, implying that seasonal-scale fluctuations in extreme precipitation metrics lack statistical robustness.


Figure 4.
Seasonally averaged linear trends in EPIs. (a) Seasonal trends of CDD. (b) Seasonal trends of CWD. (c) Seasonal trends of SDII. (d) Seasonal trends of RX1day. (e) Seasonal trends of R20mm. (f) Seasonal trends of PRCPTPT. (g) Seasonal trends of R95P. (green: Spring, blue: Summer, yellow: Autumn, black: Winter).
3.1.3. Mutational Analysis of EPIs
Figure 5 shows the cumulative anomaly curves derived from the cumulative anomaly method, and Table 4 details the possible mutation points calculated by the Pettitt test (the complete EPIs mutation curve graph and mutation point table can be found in the Appendix A Table A3 and Figure A2). Significance tests for mutation points were performed using the rank-sum test and the discretized U statistic. The recent trends in the CWD, RX1day, and R20mm indices have been on the upward trend, reflecting a longer wetter period, an increase in the intensity of daily precipitation, and an increase in multiple extreme precipitation events. As shown in Figure 5, the positive anomalies of these indices are evident in the early 2000s and late 2010s, indicating an increase in the frequency and intensity of extreme precipitation during this period. The results show that R5mm, R10mm, and R20mm, which pass the 95% significance threshold, all have mutation points in 2012. Similarly, RX5day, R95P, and R99P—metrics representing extreme multi-day precipitation and high percentile annual precipitation—showed large increases in the late 2010s. Although the mutation points for RX5day and R99P did not meet the 95% significance criterion, mutations were observed primarily between 2005 and 2015, which are consistent with the increasing frequency of extreme weather events under global climate change. In contrast, the CDD index showed variability in the late 1980s and late 2010s, indicating a decrease in the number of consecutive drought days during these time periods. This decrease may be associated with an increase in precipitation events and a broader shift in climatic conditions towards wetter conditions.

Figure 5.
Cumulative anomaly maps for EPIs. (a) Cumulative mutation map of CDD. (b) Cumulative mutation map of CWD. (c) Cumulative mutation map of SDII. (d) Cumulative mutation map of RX1day. (e) Cumulative mutation map of R20mm. (f) Cumulative mutation map of PRCPTOT. (g) Cumulative mutation map of R95P.
Table 4.
List of mutation sites.
3.1.4. Future Trends in EPIs
The R/S analytical approach was employed to evaluate the persistence characteristics of EPIs. While the methodology effectively identifies historical pattern persistence, it is important to note that these projections do not account for potential nonlinear interactions with evolving emission scenarios. This limitation warrants caution when interpreting the temporal trajectories. The calculation results of the EPIs are shown in Table 5. The analysis reveals that six of the seven EPIs exhibit H > 0.5 with D < 1.5 (Table 5), suggesting a higher probability of continuing historical intensification trends for extreme precipitation parameters. The exception, CDDs (H = 0.457, D = 1.543), shows weaker persistence characteristics, which may indicate greater susceptibility to external forcings. These patterns tentatively suggest that, without substantial climate mitigation, the region could face compounding risks: intensified wet extremes (R95P, RX1day) coexisting with marginally increasing dry spells (CDDs). To strengthen these preliminary findings, future work should couple persistence analysis with scenario-based climate modeling.
Table 5.
Analysis of future trends in EPIs.
3.2. EPIs Correlation Analysis
3.2.1. Correlation of EPIs with PRCPTOT
The correlation coefficients among the seven extreme precipitation indices (EPIs) were calculated using Pearson correlation analysis, and significance testing was performed with the t-test. The results are shown in Figure 6. The correlation coefficient value between the index measuring the frequency of extreme precipitation, represented by R20mm, and the precipitation total index, PRCPTOT, is 0.93, which is significantly higher than the correlation coefficient values between the other indices and PRCPTOT, showing a correlation that significantly exceeds the other indices. This strong correlation suggests that R20mm in particular has experienced a significant increase during the period 1970–2022, which may have led to an increase in the interannual precipitation variability in Sichuan Province. The close relationship between these indices further highlights the importance of understanding extreme precipitation trends for better climate modeling and water resource management in the region.
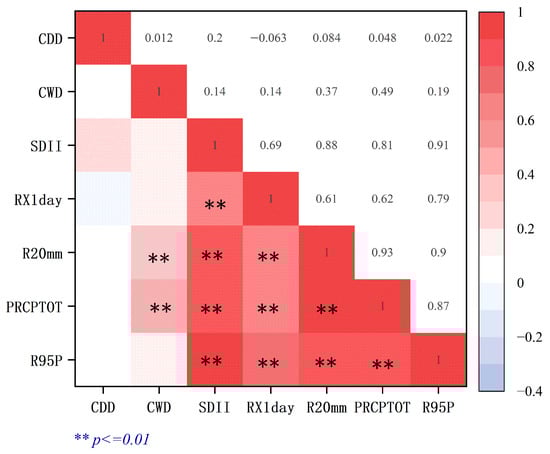
Figure 6.
Correlation between EPIs and PRCPTOT.
3.2.2. Influence of Geographic Factors on EPIs
The effects of geographic attributes (longitude, latitude, and elevation) on the variability of EPIs in Sichuan Province were analyzed using Pearson correlation analysis, as summarized in Figure 7. The t-test was used to determine the significance of the correlation coefficients. The results reveal that several indices, including RX1day and R95P, exhibit significant positive correlations with longitude, while indices with negative correlations are predominantly CDDs and CWDs. This implies that regions in eastern Sichuan experience more frequent precipitation events and fewer droughts, which is consistent with the basin zone’s humid climatic conditions. Furthermore, most precipitation indices show negative correlations with latitude, suggesting that extreme precipitation events occur more frequently in the southern regions of Sichuan Province (lower latitudes). These findings are consistent with the spatial patterns of EPIs depicted in Figure 3. This could be attributed to the stronger influence of the summer southwest monsoons in the southern region, which transports substantial moisture and leads to increased precipitation amount and intensity. Thirdly, the negative correlation between elevation and CDDs indicates that droughts are more severe in high-elevation areas, such as the plateau zone in western Sichuan Province. This is likely because precipitation in these areas is obstructed by mountain topography, making sustained precipitation difficult to form. Additionally, lower temperatures reduce the likelihood of water vapor condensation. The significant negative correlation between elevation and extreme precipitation intensity, such as RX1day, indicates that precipitation intensity is higher in the lower elevations of Sichuan Province (e.g., the basin zone). High air humidity and the enclosed nature of the lower terrain in these areas facilitate water vapor accumulation, rendering them susceptible to heavy precipitation events. For elevations up to 1000 m, the correlation between elevation and precipitation indices is negative and weak. However, EPIs are more strongly correlated with the 1000–2000 m elevation range. The number of stations in this range, however, is insufficient to represent the indices accurately. Above 2000 m, elevation is either uncorrelated or slightly negatively correlated with EPIs, suggesting that such events occur less frequently at higher elevations.
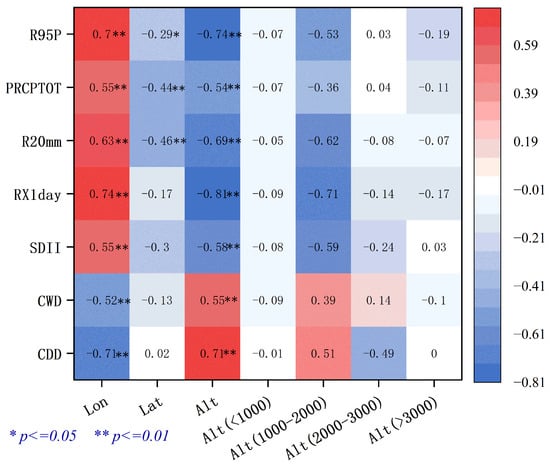
Figure 7.
Pearson correlation coefficients of geographic factors on EPIs.
In order to conduct a more detailed analysis, we further studied the relationship between the altitude of the study area and EPIs, and the fitting curve was fitted using a third-order polynomial, as shown in Figure 8. The intensity, frequency, total amount, and extreme threshold of EPIs generally decrease with increasing altitude, among which R5mm first increases slightly with altitude, reaches a peak at around 3000 m, and then gradually decreases. The CDD index representing drought shows a trend of gradually increasing with altitude, which is consistent with the fact that the plateau has less rainfall and longer drought time. The continuous wetness index CWDs remains generally stable with changes in altitude, without obvious fluctuations. It is worth noting that the indices SDII, RX1day, and RX5day representing the intensity of EPIs have all changed from a downward trend to an upward trend after an altitude of 3500, indicating that although the rainfall will decrease in ultra-high altitude areas, the intensity of extreme precipitation will not decrease significantly, and attention should be paid to disaster prevention and mitigation work in ultra-high-altitude areas.
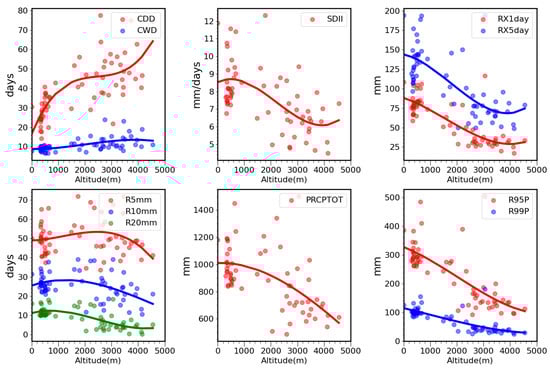
Figure 8.
Distribution by altitude and fitting curve.
3.2.3. Influence of Meteorological Factors on EPIs
Figure 9 illustrates the Pearson correlation analysis results between EPIs and atmospheric circulation factors for the period 1970–2022; the t-test was used to determine the significance of the correlation coefficients. The associations between EPIs and the NAO, PDO, AO, EASMI, SOI, and MEI are relatively weak, implying that these circulation drivers exert minimal impact on extreme precipitation variability in the Sichuan Basin. Conversely, stronger associations are detected between EPIs and the AMO, Niño 3.4, and SCSSMI. The AMO reflects a long-term climatic oscillation characterized by natural fluctuations in North Atlantic sea surface temperatures (SSTs), which profoundly influence global climatic patterns. This analysis reveals a positive correlation between the AMO and all EPIs, except CDDs. Of particular note, AMO demonstrates a statistically significant positive relationship (p < 0.05) with the SDII, while correlations with other indices achieve high significance (p < 0.01). These results suggest that elevated SSTs in the North Atlantic are closely linked to the increased occurrence and intensity of extreme precipitation events within Sichuan Province. The Niño 3.4 index, indicative of SST deviations from the annual mean within a specific equatorial Pacific region, serves as a critical predictor of global climatic anomalies such as precipitation, droughts, and cyclonic activity. As depicted in Figure 9, the Niño 3.4 index displays negative correlations with all EPIs, with the relationships involving RX5day and PRCPTOT surpassing the 0.01 significance threshold. This pattern implies that during El Niño phases (characterized by elevated Niño 3.4 values), the amount, frequency, and intensity of extreme precipitation in Sichuan Province tend to decline. Conversely, La Niña episodes (low Niño 3.4 values) correspond to heightened precipitation levels and an increased frequency of extreme precipitation events. The SCSSMI, which quantifies the strength of summer monsoon winds over the South China Sea, represents a vital indicator of precipitation dynamics across East and Southeast Asia. As shown in Figure 9, negative correlations are observed between the SCSSMI and several EPIs, particularly SDII and RX1day. This finding suggests that more intense monsoon winds in the South China Sea may contribute to a decrease in the frequency or magnitude of extreme precipitation events. A plausible explanation for this phenomenon is that robust monsoon winds enhance the uniformity of water vapor transport or broaden rainfall distribution, thereby mitigating the likelihood of localized extreme precipitation occurrences.
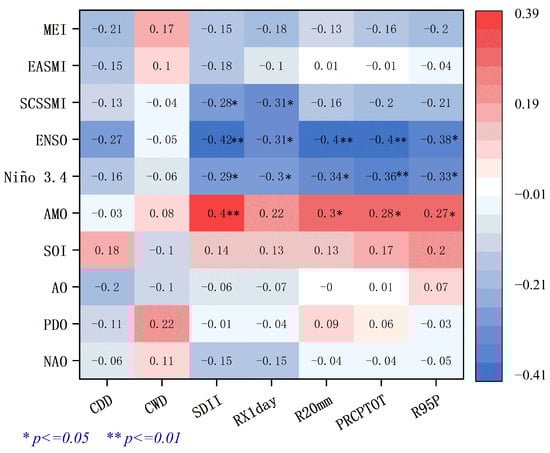
Figure 9.
Correlation of EPIs with atmospheric circulation patterns, 1970–2022.
Figure 9 highlights the pronounced impact of the AMO and Niño 3.4 indices on precipitation patterns and EPIs in Sichuan Province between 1970 and 2022. To delve deeper into these interactions, this study utilizes crossed wavelet transform (XWT) and wavelet coherence (WTC) techniques to explore the relationships and periodic behaviors linking precipitation with atmospheric circulation factors. Figure 10 and Figure 11 depict regions delineated by thin arcs, representing statistically significant wavelet power spectrum values, while areas outside these arcs are deemed non-significant. The thick contours in the plots identify regions surpassing the 95% confidence level, as determined by the red noise significance test. The directional arrows embedded within the figures convey phase dynamics, illustrating the lead-lag connections between the variables. Arrows pointing to the right signify a synchronized (in-phase) relationship, whereas those pointing to the left indicate an anti-phase connection. Upward arrows suggest that the EPI trails the circulation factor, while downward arrows imply that the index precedes the circulation factor [26].
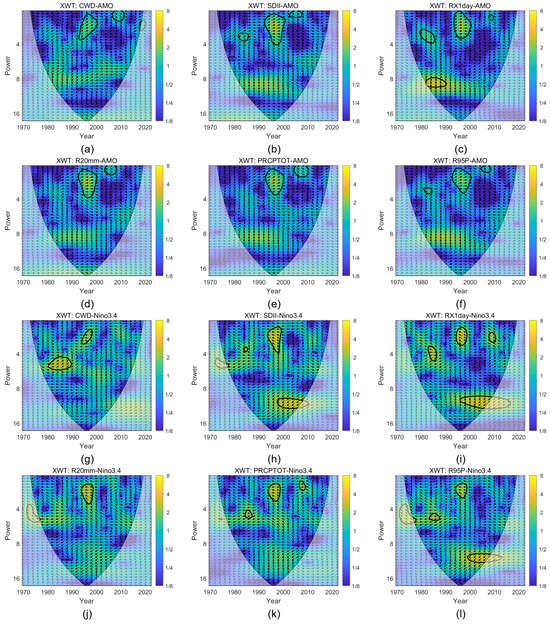
Figure 10.
The periodic relationships between AMO and Niño 3.4 and precipitation by using XWT. (a–f) are the results of XWT between CWD, SDII, RX1day, R20mm, PRCPTOT, and R95P and AMO respectively. (g–l) are the results of XWT between CWD, SDII, RX1day, R20mm, PRCPTOT, and R95P and Niño 3.4 respectively.
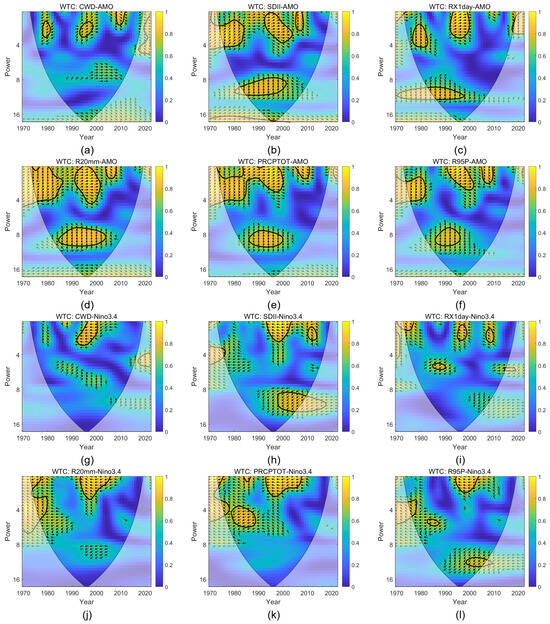
Figure 11.
The periodic relationships between AMO and Niño 3.4 and precipitation by using WTC. (a–f) are the results of WTC between CWD, SDII, RX1day, R20mm, PRCPTOT, and R95P and AMO respectively. (g–l) are the results of WTC between CWD, SDII, RX1day, R20mm, PRCPTOT, and R95P and Niño 3.4 respectively.
Figure 10 illustrates that the vectors symbolizing the AMO and the EPIs within the resonant region are oriented to the right, signifying a notable positive correlation. In contrast, the vectors corresponding to Niño 3.4 and the EPIs in the resonant region are directed to the left, indicating a pronounced negative correlation. This observation aligns with the findings of the Pearson correlation analysis presented in Figure 9. Furthermore, the arrows representing the AMO in other resonant regions predominantly point upward, implying that variations in the EPIs tend to lag behind those of the AMO. On the other hand, the arrows associated with Niño 3.4 in other resonant regions primarily point downward, suggesting that changes in the EPIs generally precede those in Niño 3.4.
PRCPTOT is the most important evaluation index among EPIs, as depicted in Figure 10e. Two strong resonance regions exist between AMO and PRCPTOT, namely the 0.4–3.6a period from 1993 to 2000 and the 0–1.6a period from 2004 to 2010. Figure 11e, based on WTC analysis, reveals a strong positive correlation between AMO and PRCPTOT, with the correlation strength varying over time. Notable changes are observed in both the high-frequency (short cycle) and low-frequency (long cycle) bands. Additionally, during 1993–2000, the arrows point to the upper right, indicating a significant positive correlation between total annual precipitation and AMO, with multi-time-scale characteristics. Specifically, annual precipitation changes lagged behind AMO during 1993–2000 but led AMO during 2004–2010. As shown in Figure 10k, three strong resonance regions are identified between Niño 3.4 and PRCPTOT, namely the 4–4.8a period from 1984 to 1987, the 1.2–3.2a period from 1994 to 1999, and the 0.8–2a cycle. The arrows point to the left in all three periods, indicating that total annual precipitation is significantly negatively correlated with Niño 3.4. Figure 11k, based on WTC analysis, demonstrates a strong negative correlation between Niño 3.4 and PRCPTOT, with the correlation strength varying over time, particularly in the high-frequency (short period) band.
As shown in Figure 10d and the results in the Appendix A, the AMO and R5mm, R10mm, and R20mm exhibit similar resonant regions, specifically within the 0.4–4-year range from 1993 to 2000 and the 0–1.5-year range from 2005 to 2010. Additionally, AMO and R5mm, R10mm, and R20mm also exhibit similar resonant regions within the low-frequency band, with a statistically significant positive correlation between them. R5mm, R10mm, and R20mm serve as indicators for assessing humidity levels within the precipitation index. These findings collectively indicate that temporal variations in the AMO have a significant impact on regional humidity levels. The results showed that the impact of Niño 3.4 on R5mm, R10mm, and R20mm within both high-frequency and low-frequency bands is minimal and sporadic. Overall, a statistically significant negative correlation is observed during the period from 1990 to 2010.
In order to further explore the physical mechanism of the long-term trend of atmospheric circulation factors affecting extreme precipitation in Sichuan Province, the long-term trends of temperature and total precipitation in the study area are calculated using the data from 1970–2022 in the ERA5-Land to briefly analyze the deeper mechanism behind the trend changes of EPIs. Figure 12a shows that there are significant spatial differences in temperature changes in Sichuan Province and the surrounding regions. Low-latitude regions (e.g., 20°N∼25°N) may show a weak warming trend (−2.0∼0.222 K), while mid-to-high-latitude regions (e.g., 30°N∼37.5°N) show a more pronounced warming trend, and the most significant warming may be centered in the northern part of the Sichuan Basin and the surrounding plateau (e.g., near 35°N). The significant warming in the mid-to-high-latitude regions is directly related to the enhanced surface radiative forcing due to the increase of greenhouse gases, which is consistent with the regional response model of global warming reported by the IPCC. Meanwhile, the Chengdu Plain is at the eastern edge of the Tibetan Plateau, where warm and humid air is lifted by topography, leading to heat redistribution and mitigating the warming in the Chengdu Plain region. Figure 12b shows that the precipitation change in Sichuan Province is characterized by “west increasing and east decreasing”; the precipitation in the Tibetan Plateau area increases significantly, while the precipitation change in the plain area in the transition zone is close to equilibrium. Jiang et al. [54] concluded the western Pacific sub-high extends to the northwest, so that the warm and humid moisture penetrates deep into the southwest edge, and the warm and humid air lifts up under the effect of topography, releasing unstable energy and inducing extreme precipitation. At the same time, the weakening of the East Asian monsoon also reduces the summer wind water vapor transport in the eastern Sichuan area, leading to a decrease in precipitation. In general, under climate change, the northwest extension of the western Pacific sub-high and rising temperatures may be the main reason for the precipitation in the Sichuan area to show a “west increase and east decrease”. Although the total amount of rainfall in the east Sichuan plateau region is low, we still need to pay attention to the extreme precipitation risk brought about by the increase in precipitation.
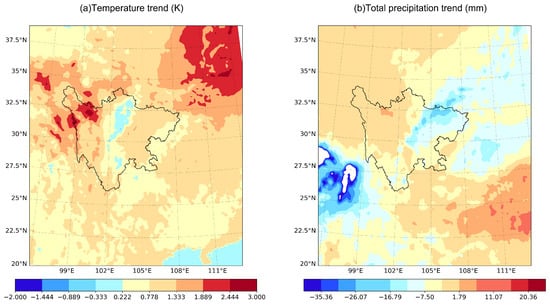
Figure 12.
(a) Changes in mean annual temperature, 1970–2022. (b) Changes in mean annual total precipitation, 1970–2022.
4. Discussion
This research investigates the spatiotemporal dynamics of precipitation in Sichuan Province over the past 53 years (1970–2022). Temporally, the EPIs demonstrate an overall upward trend during the study period, consistent with the findings of Li et al. [32], with notable variability in precipitation changes. To analyze mutations, the cumulative anomaly method and the Pettitt test were utilized to identify abrupt change points in annual and extreme precipitation patterns. The Pettitt test revealed that most extreme precipitation mutations occurred around 2012, whereas a significant mutation in the SDII was identified in 1998. Spatially, the majority of stations in Sichuan Province exhibited an upward trend in the EPIs, while stations showing a downward trend were predominantly located in the central and southwestern regions. The CDD index, indicative of regional aridity, revealed that stations with increasing trends were primarily distributed in the southeastern areas of the province, whereas those with decreasing trends were concentrated in the western and northern regions. This spatial distribution suggests that consecutive dry days are more prolonged in the southeastern region compared to the northwestern area. Notably, the EPIs in the central and southwestern parts of Sichuan Province displayed a declining trend.
Geographic factors play a critical role in shaping the distribution and intensity of precipitation. As shown in Figure 7, with the exception of CDDs, most precipitation indices exhibit significant correlations with geographic variables: positively with longitude and negatively with latitude and elevation. Specifically, regions at higher longitudes, lower latitudes, and lower elevations experience greater precipitation and more intense precipitation extremes. This spatial pattern indicates a general increase in precipitation from west to east across Sichuan Province, as the eastern part of the Sichuan Basin is closer to the ocean, where moist air masses drive higher precipitation levels. However, Figure 3 highlights contrasting trends, which are likely influenced by climate change and anthropogenic activities. While extreme precipitation in eastern regions is declining, high-latitude and high-altitude areas in the west and north show increasing trends. Climate warming has intensified atmospheric water vapor content, elevating the likelihood of extreme precipitation. This effect is particularly pronounced in high-latitude regions, where climate warming has a stronger impact [55]. Moreover, the northern and northwestern parts of Sichuan, situated near the westerly wind belt’s periphery, are increasingly influenced by variations in westerly airflow, leading to a rise in extreme precipitation events. Conversely, the central and southwestern regions, under the influence of subtropical high pressure, experience heightened alternation between dry and wet periods, which may mitigate the intensity of extreme precipitation [56]. Urbanization further complicates these dynamics. The central and western areas, as major urban hubs, are subject to the urban heat island effect, which can suppress localized heavy rainfall events [57].
The El Niño–Southern Oscillation (ENSO), typically measured using indices such as the Multivariate ENSO Index (MEI) and Niño 3.4, is one of the most significant drivers of air–sea interactions on interannual time scales. Extensive research [58] has demonstrated that ENSO profoundly impacts precipitation anomalies across much of China. This study reveals a negative correlation between ENSO and EPIs, as indicated by statistical analyses. In Southwest China, including Sichuan Province, El Niño events reduce water vapor availability, thereby decreasing precipitation [59]. This occurs because the warming of Pacific Ocean waters enhances the western Pacific subtropical high, redirecting moist airflows toward Southeast Asia. Wang et al. [8] highlighted the spatial and temporal variability in ENSO’s influence on precipitation extremes, while Zhang et al. [60] suggested that tropical cyclones have a more substantial impact on precipitation extremes in inland China than ENSO, particularly during El Niño or La Niña years. Furthermore, Lv et al. [61] noted a stronger correlation between ENSO events and drought occurrences in regions closer to the ocean. Zhang et al. [62] observed that ENSO primarily increases winter and spring precipitation in eastern China. ENSO also exerts a significant influence on the East Asian monsoon (EAM), including both the summer (EASM) and winter (EAWM) monsoons, shaping precipitation and temperature patterns across East Asia. It modulates both the strengthening and weakening phases of the EASM, with notable decadal variations in its interactions with EASM and EAWM [63]. During El Niño events, changes in the North Pacific anticyclone circulation weaken the EAWM, leading to widespread positive temperature anomalies across China. In contrast, La Niña events produce the opposite effect [64]. This study underscores ENSO, as quantified by the Niño 3.4 and MEI indices, as a pivotal atmospheric circulation pattern influencing EPIs in Sichuan Province from 1970 to 2022.
The Atlantic Multidecadal Oscillation (AMO) exhibits a pronounced positive association with both total precipitation and extreme rainfall events in Sichuan Province. According to Knight et al. [65], the warm phase of the AMO, characterized by heightened sea surface temperatures in the North Atlantic, alters global atmospheric circulation and strengthens the Asian summer monsoons, thereby facilitating increased moisture transport to Sichuan and intensifying precipitation. Similarly, Zhu et al. [66] identified southwest China as a transitional zone influenced by interdecadal temperature variability originating from both the North Atlantic and Asian regions. However, these climatic influences have likely diminished in recent years due to the intensification of anthropogenic activities. Further exploration is necessary to comprehensively understand the AMO’s role in shaping precipitation patterns in Sichuan Province.
Extreme precipitation events are predominantly concentrated in the summer months within Sichuan Province. This study identifies a notable negative correlation between summer monsoon indices (EASMI and SCSSMI) and variations in EPIs in Sichuan Province, observed at both annual and seasonal scales from 1960 to 2017. Previous research has documented a weakening trend in the East Asian summer monsoon (EASM) since the late 1970s [67,68]. During periods of a weakened EASM, the southwestern winds associated with the western Pacific anticyclone transport moisture from the South China Sea to the Yangtze River Basin, leading to an escalation in extreme precipitation events. This study reaffirms that the EASMI and SCSSMI negatively influence extreme precipitation in Sichuan Province, with the weakening of the summer monsoon index exacerbating such events. Concurrently, rising temperatures elevate the atmosphere’s saturation vapor pressure [69], enabling greater moisture retention and intensifying precipitation during extreme events [70]. Furthermore, Sichuan Province’s unique geographical location and complex topography amplify these effects.
This research primarily emphasizes the spatial and temporal dynamics of extreme precipitation across Sichuan Province on an interannual scale, while also examining its associated influencing factors. Future investigations could delve deeper into these factors at finer temporal resolutions, such as seasonal or monthly scales. Furthermore, the circulation factors analyzed in this study are confined to a selection of commonly utilized variables, excluding others like the Atlantic sea surface temperature (SST: Atlantic) and the monsoon index, which merit detailed exploration in subsequent studies. The regional patterns of extreme precipitation events are shaped by a multifaceted interplay of factors, including anthropogenic activities, land use changes, and variations in sea surface temperature [71]. Future studies should undertake a more comprehensive examination of how these drivers influence extreme precipitation events in Sichuan Province.
5. Conclusions
This paper utilizes daily precipitation records from 63 meteorological stations across Sichuan Province spanning the period from 1970 to 2022. This study analyzes the characteristics of extreme precipitation events and explores the relationships between geographic factors, atmospheric circulation patterns, and variations in extreme precipitation. The key conclusions are as follows:
- (1)
- On the time scale studied, the precipitation indices in Sichuan Province, except for CWDs, show different degrees of increasing trends during the 1970–2022 period, with the SDII showing the most significant increase (p < 0.05). The increasing trends of these precipitation indices were notably larger in summer than in other seasons, with the R95P index showing the largest increase in summer at a rate of 0.57 mm per decade.
- (2)
- The cumulative anomaly method and the Pettitt test identified 2012 as the change point for the R5mm, R10mm, and R20mm indices, all of which passed the 95% significance threshold. R/S analysis revealed that the Hurst indices for all EPIs, except for CDDs, exceeded 0.5, indicating persistence. Considering historical trends in Sichuan Province, the future trajectories of the remaining EPIs are expected to align with past patterns, exhibiting an overall increasing trend. Consequently, Sichuan Province is likely to encounter heightened risks of heavy rainfall and flooding events in the future.
- (3)
- On a spatial scale, some of the extreme precipitation indices (e.g., R95P) in the Chengdu region show significant decreasing trends, and this phenomenon is particularly prominent in the spatial distribution. Although the increase in the number of consecutive drought days (CDDs) is more significant in southeastern Sichuan, and the total precipitation amount (PRCPTOT) in the whole region generally shows an increasing trend, the decrease in extreme precipitation events in Chengdu still needs to be emphasized. This result suggests that there is spatial heterogeneity in the response of different precipitation indicators in the context of regional climate change: the enhanced trend of precipitation in the northwest is obvious, while extreme precipitation in the Chengdu Plain shows the opposite decreasing characteristics. It is recommended that such regional differences be adequately considered in climate adaptation planning, especially the impacts of decreasing precipitation extremes on urban flood control and water resource management.
- (4)
- Correlation analysis reveals that most indices are significantly positively correlated with total precipitation (p < 0.01), except for CDDs, which shows a weak correlation with total precipitation. Among these indices, R20mm has the most pronounced effects on total precipitation.
- (5)
- Regarding geographic factors, most precipitation indices are significantly positively correlated with longitude, negatively correlated with latitude, and negatively correlated with elevation, except for CDDs. This pattern implies that precipitation generally increases from west to east and decreases as one moves northward in Sichuan Province, likely because the eastern part of the Sichuan Basin is closer to the ocean. Drought conditions are more severe at higher altitudes (e.g., the plateau zone in western Sichuan Province), possibly because mountainous terrain obstructs precipitation formation and because cooler temperatures reduce the likelihood of water vapor condensation.
- (6)
- Concerning meteorological influences, stronger correlations are observed between EPIs and factors such as the AMO, Niño 3.4, and SCSSMI. In Sichuan Province, precipitation intensity exhibits a tendency to rise alongside elevated sea surface temperatures in the North Atlantic Ocean. Conversely, as summer wind intensity over the South China Sea strengthens, the occurrence or severity of extreme precipitation events appears to diminish.
Author Contributions
L.B.: Supervision, Project Administration, and Funding Acquisition. T.L.: Conceptualization, Methodology, Software, Formal Analysis, Investigation, Resources, Writing—Review and Editing, Visualization, and Project Administration. A.S.: Conceptualization, Methodology, and Writing—Original Draft Preparation. D.L.: Software and Visualization. All authors have read and agreed to the published version of the manuscript.
Funding
This research was funded by the Key Research and Development Program of Sichuan Province (Grant No. 2023YFS0435).
Data Availability Statement
The data sources used in this paper have been described in Section 2.
Conflicts of Interest
The authors declare that they have no known competing financial interests or personal relationships that could have appeared to influence the work reported in this paper.
Appendix A
Table A1.
Abbreviations and their full form that appear more than once in this paper.
Table A1.
Abbreviations and their full form that appear more than once in this paper.
| Abbreviation | Full Form |
|---|---|
| L | Low-elevation |
| M | Mid-elevation |
| H-M | High-to-mid elevation |
| H | High-elevation |
| E | Extreme-elevation |
| EPIs | Extreme Precipitation Indices |
| WCRP | World Climate Research Program |
| ETCCDI | Expert Team on Climate Change Detection and Indices |
| ECMWF | European Centre for Medium-Range Weather Forecasts |
| PSL | NOAA Physical Sciences Laboratory |
| NAO | North Atlantic Oscillation |
| PDO | Pacific Decadal Oscillation |
| AO | Arctic Oscillation |
| AMO | Atlantic Multidecadal Oscillation |
| Niño 3.4 | East Central Tropical Pacific SST |
| SOI | Southern Oscillation Index |
| MEI | Multivariate ENSO Index |
| EASMI | East Asian Summer Monsoon Index |
| SCSSMI | South China Sea Summer Monsoon Index |
| ENSO | El Niño–Southern Oscillation |
| EASM | East Asian summer monsoon |
| SST | Sea Surface Temperature |
| OLS | Ordinary Least Squares |
| M-K | Mann–Kendall |
| XWT | Crossed Wavelet Transform |
| WTC | Wavelet Coherence Analysis |
Table A2.
Complete definitions of the 11 EPIs.
Table A2.
Complete definitions of the 11 EPIs.
| Number | Indices | Description Name | Definition | Units |
|---|---|---|---|---|
| 1 | CDD | Consecutive dry days | Maximum number of consecutive days when RR < 1 mm | days |
| 2 | CWD | Consecutive wet days | Maximum number of consecutive days when RR ≥ 1 mm | days |
| 3 | SDII | Simple daily intensity index | Annual total precipitation divided by the number of wet days (defined as precipitation ≥ 1 mm) in a year | mm/days |
| 4 | RX1day | Max 1-day precipitation amount | Monthly maximum 1-day precipitation | mm |
| 5 | RX5day | Max 5-day precipitation amount | Monthly maximum consecutive 5-day precipitation | mm |
| 6 | R5mm | Number of days above 5 mm | Annual count of days when precipitation ≥ 5 mm | days |
| 7 | R10mm | Number of heavy precipitation days | Annual count of days when precipitation ≥ 10 mm | days |
| 8 | R20mm | Number of very heavy precipitation days | Annual count of days when precipitation ≥ 20 mm | days |
| 9 | PRCPTOT | Annual total wet-day precipitation | Annual total precipitation on wet days (RR ≥ 1 mm) | mm |
| 10 | R95P | Very wet days | Annual total precipitation when daily precipitation > 95th percentile | mm |
| 11 | R99P | Extremely wet days | Annual total precipitation when daily precipitation > 99th percentile | mm |
Table A3.
Complete list of mutation points.
Table A3.
Complete list of mutation points.
| Indices | CDD | CWD | SDII | RX1day | RX5day | R5mm | R10mm | R20mm | PRCPTOT | R95P | R99P |
|---|---|---|---|---|---|---|---|---|---|---|---|
| Point of Mutation | 2008 (p > 0.05) | 2016 (p > 0.05) | 1998 | 1980 (p > 0.05) | 2007 (p > 0.05) | 2012 | 2012 | 2012 | 2012 | 2009 | 2009 (p > 0.05) |

Figure A1.
Complete site map. (a) Spatial distribution of CDD. (b) Spatial distribution of CWD. (c) Spatial distribution of SDII. (d) Spatial distribution of RX1day. (e) Spatial distribution of RX5day. (f) Spatial distribution of R5mm. (g) Spatial distribution of R10mm. (h) Spatial distribution of R20mm. (i) Spatial distribution of PRCPTOT. (j) Spatial distribution of R95P. (k) Spatial distribution of R99P. (l) Average annual precipitation distribution.


Figure A2.
Complete cumulative mutation map of EPIs. (a) Cumulative mutation map of CDD. (b) Cumulative mutation map of CWD. (c) Cumulative mutation map of SDII. (d) Cumulative mutation map of RX1day. (e) Cumulative mutation map of RX5day. (f) Cumulative mutation map of R5mm. (g) Cumulative mutation map of R10mm. (h) Cumulative mutation map of R20mm. (i) Cumulative mutation map of PRCPTOT. (j) Cumulative mutation map of R95P. (k) Cumulative mutation map of R99P.

References
- Morss, R.E.; Wilhelmi, O.V.; Meehl, G.A.; Dilling, L. Improving societal outcomes of extreme weather in a changing climate: An integrated perspective. Annu. Rev. Environ. Resour. 2011, 36, 1–25. [Google Scholar] [CrossRef]
- Kron, W.; Löw, P.; Kundzewicz, Z.W. Changes in risk of extreme weather events in Europe. Environ. Sci. Policy 2019, 100, 74–83. [Google Scholar] [CrossRef]
- Grotjahn, R.; Black, R.; Leung, R.; Wehner, M.F.; Barlow, M.; Bosilovich, M.; Gershunov, A.; Gutowski, W.J.; Gyakum, J.R.; Katz, R.W. North American extreme temperature events and related large scale meteorological patterns: A review of statistical methods, dynamics, modeling, and trends. Clim. Dyn. 2016, 46, 1151–1184. [Google Scholar] [CrossRef]
- Mukherjee, S.; Aadhar, S.; Stone, D.; Mishra, V. Increase in extreme precipitation events under anthropogenic warming in India. Weather Clim. Extrem. 2018, 20, 45–53. [Google Scholar] [CrossRef]
- Vogel, E.; Donat, M.G.; Alexander, L.V.; Meinshausen, M.; Ray, D.K.; Karoly, D.; Meinshausen, N.; Frieler, K. The effects of climate extremes on global agricultural yields. Environ. Res. Lett. 2019, 14, 054010. [Google Scholar] [CrossRef]
- Bouwer, L.M. Observed and projected impacts from extreme weather events: Implications for loss and damage. In Loss and Damage from Climate Change: Concepts, Methods and Policy Options; Springer: Berlin/Heidelberg, Germany, 2019; pp. 63–82. [Google Scholar]
- Brunet, G.; Parsons, D.B.; Ivanov, D.; Lee, B.; Bauer, P.; Bernier, N.B.; Bouchet, V.; Brown, A.; Busalacchi, A.; Flatter, G.C. Advancing weather and climate forecasting for our changing world. Bull. Am. Meteorol. Soc. 2023, 104, E909–E927. [Google Scholar] [CrossRef]
- Wang, L.; Chen, S.; Zhu, W.; Ren, H.; Zhang, L.; Zhu, L. Spatiotemporal variations of extreme precipitation and its potential driving factors in China’s North-South Transition Zone during 1960–2017. Atmos. Res. 2021, 252, 105429. [Google Scholar] [CrossRef]
- Alexander, L.V.; Fowler, H.J.; Bador, M.; Behrangi, A.; Donat, M.G.; Dunn, R.; Funk, C.; Goldie, J.; Lewis, E.; Rogé, M. On the use of indices to study extreme precipitation on sub-daily and daily timescales. Environ. Res. Lett. 2019, 14, 125008. [Google Scholar] [CrossRef]
- Zhao, J.; Gan, T.Y.; Zhang, G.; Zhang, S. Projected changes of precipitation extremes in North America using CMIP6 multi-climate model ensembles. J. Hydrol. 2023, 621, 129598. [Google Scholar] [CrossRef]
- Guo, E.; Zhang, J.; Wang, Y.; Quan, L.; Zhang, R.; Zhang, F.; Zhou, M. Spatiotemporal variations of extreme climate events in Northeast China during 1960–2014. Ecol. Indic. 2019, 96, 669–683. [Google Scholar] [CrossRef]
- Sun, Q.; Zhang, X.; Zwiers, F.; Westra, S.; Alexander, L.V. A global, continental, and regional analysis of changes in extreme precipitation. J. Clim. 2021, 34, 243–258. [Google Scholar] [CrossRef]
- Du, H.; Alexander, L.V.; Donat, M.G.; Lippmann, T.; Srivastava, A.; Salinger, J.; Kruger, A.; Choi, G.; He, H.S.; Fujibe, F. Precipitation from persistent extremes is increasing in most regions and globally. Geophys. Res. Lett. 2019, 46, 6041–6049. [Google Scholar] [CrossRef]
- Nayak, S.; Dairaku, K.; Takayabu, I.; Suzuki-Parker, A.; Ishizaki, N.N. Extreme precipitation linked to temperature over Japan: Current evaluation and projected changes with multi-model ensemble downscaling. Clim. Dyn. 2018, 51, 4385–4401. [Google Scholar] [CrossRef]
- Zeder, J.; Fischer, E.M. Observed extreme precipitation trends and scaling in Central Europe. Weather. Clim. Extrem. 2020, 29, 100266. [Google Scholar] [CrossRef]
- Picard, C.J.; Winter, J.M.; Cockburn, C.; Hanrahan, J.; Teale, N.G.; Clemins, P.J.; Beckage, B. Twenty-first century increases in total and extreme precipitation across the Northeastern USA. Clim. Chang. 2023, 176, 72. [Google Scholar] [CrossRef]
- Vincent, L.A.; Mekis, É. Changes in daily and extreme temperature and precipitation indices for Canada over the twentieth century. In Data, Models and Analysis; Routledge: Lodon, UK, 2019; pp. 61–77. [Google Scholar]
- Gu, X.; Ye, L.; Xin, Q.; Zhang, C.; Zeng, F.; Nerantzaki, S.D.; Papalexiou, S.M. Extreme precipitation in China: A review on statistical methods and applications. Adv. Water Resour. 2022, 163, 104144. [Google Scholar] [CrossRef]
- Shi, J.; Cui, L.; Wen, K.; Tian, Z.; Wei, P.; Zhang, B. Trends in the consecutive days of temperature and precipitation extremes in China during 1961–2015. Environ. Res. 2018, 161, 381–391. [Google Scholar] [CrossRef] [PubMed]
- Cheng, X.; Wan, H.; Huang, S.; Li, C.; Zhang, H. Lessons learned from the 2016 Yangtze River flood in Anhui province, China. Int. J. River Basin Manag. 2018, 16, 307–314. [Google Scholar] [CrossRef]
- Guo, X.; Cheng, J.; Yin, C.; Li, Q.; Chen, R.; Fang, J. The extraordinary Zhengzhou flood of 7/20, 2021: How extreme weather and human response compounding to the disaster. Cities 2023, 134, 104168. [Google Scholar] [CrossRef]
- Wei, K.; Ouyang, C.; Duan, H.; Li, Y.; Chen, M.; Ma, J.; An, H.; Zhou, S. Reflections on the catastrophic 2020 Yangtze River Basin flooding in southern China. Innovation 2020, 1, 100038. [Google Scholar] [CrossRef] [PubMed]
- Wei, F.; Liu, D.; Liang, Z.; Wang, Y.; Shen, J.; Wang, H.; Zhang, Y.; Wang, Y.; Li, S. Spatial heterogeneity and impact scales of driving factors of precipitation changes in the Beijing-Tianjin-Hebei region, China. Front. Environ. Sci. 2023, 11, 1161106. [Google Scholar] [CrossRef]
- Du, H.; Xia, J.; Yan, Y.; Lu, Y.; Li, J. Spatiotemporal Variations of Extreme Precipitation in Wuling Mountain Area (China) and Their Connection to Potential Driving Factors. Sustainability 2022, 14, 8312. [Google Scholar] [CrossRef]
- Zhang, H.; Zhang, R.; Ju, Q.; Kong, G.; Xie, Y.; He, J.; Huang, Y. Analysis of extreme precipitation variation characteristics and the influencing factors in the Yunnan-Guizhou Plateau Region, China. Sustainability 2023, 15, 14735. [Google Scholar] [CrossRef]
- Li, Z.; Yang, H.; Jia, M. Factors Affecting the Spatiotemporal Variation of Precipitation in the Songhua River Basin of China. Water 2024, 16, 2. [Google Scholar] [CrossRef]
- Wei, W.; Zou, S.; Duan, W.; Chen, Y.; Li, S.; Zhou, Y. Spatiotemporal variability in extreme precipitation and associated large-scale climate mechanisms in Central Asia from 1950 to 2019. J. Hydrol. 2023, 620, 129417. [Google Scholar] [CrossRef]
- Tao, L.; Liang, X.S.; Cai, L.; Zhao, J.; Zhang, M. Relative contributions of global warming, AMO and IPO to the land precipitation variabilities since 1930s. Clim. Dyn. 2021, 56, 2225–2243. [Google Scholar] [CrossRef]
- Ouyang, R.; Liu, W.; Fu, G.; Liu, C.; Hu, L.; Wang, H. Linkages between ENSO/PDO signals and precipitation, streamflow in China during the last 100 years. Hydrol. Earth Syst. Sci. 2014, 18, 3651–3661. [Google Scholar] [CrossRef]
- Li, B.; Chen, Y.; Chen, Z.; Xiong, H.; Lian, L. Why does precipitation in northwest China show a significant increasing trend from 1960 to 2010? Atmos. Res. 2016, 167, 275–284. [Google Scholar] [CrossRef]
- Zhao, G.; Mu, X.; Hörmann, G.; Fohrer, N.; Xiong, M.; Su, B.; Li, X. Spatial patterns and temporal variability of dryness/wetness in the Yangtze River Basin, China. Quat. Int. 2012, 282, 5–13. [Google Scholar] [CrossRef]
- Li, J.; Zhao, Y.; Iqbal, J. Variation patterns of extreme precipitation and relation to ocean-atmospheric climate in Sichuan province China from 1961 to 2017. Theor. Appl. Climatol. 2019, 137, 3009–3026. [Google Scholar] [CrossRef]
- Yang, X.y.; Zhang, S.b.; Lyu, Y.q.; Zhao, Y.; Lyu, S.h. Characteristics and future projections of summer extreme precipitation in Sichuan Province, China. J. Mt. Sci. 2020, 17, 1696–1711. [Google Scholar] [CrossRef]
- Han, J.; Miao, C.; Gou, J.; Zheng, H.; Zhang, Q.; Guo, X. A new daily gridded precipitation dataset for the Chinese mainland based on gauge observations. Earth Syst. Sci. Data 2023, 15, 3147–3161. [Google Scholar] [CrossRef]
- Zhang, Q.; Singh, V.P.; Li, J.; Chen, X. Analysis of the periods of maximum consecutive wet days in China. J. Geophys. Res. Atmos. 2011, 116, D23106. [Google Scholar] [CrossRef]
- Cao, F.; Gao, T.; Dan, L.; Ma, Z.; Chen, X.; Zou, L.; Zhang, L. Synoptic-scale atmospheric circulation anomalies associated with summertime daily precipitation extremes in the middle–lower reaches of the Yangtze River Basin. Clim. Dyn. 2019, 53, 3109–3129. [Google Scholar] [CrossRef]
- Gao, J.; Zhang, Y.; Li, X.; Li, H.; Gao, Z.; Ji, M. The Extreme Rainfall Characteristics and Terrace Greenhouse Erosion Control in Climate Change and Human Impact in Hilly and Gully Region of the Loess Plateau in China. In Proceedings of the Climate Change Impacts on Hydrological Processes and Sediment Dynamics: Measurement, Modelling and Management: The Proceedings of The Second International Young Scientists Forum on Soil and Water Conservation and ICCE Symposium 2018, Moscow, Russia, 27–31 August 2018; Springer: Berlin/Heidelberg, Germany, 2018; pp. 43–46. [Google Scholar]
- Zhang, Q.; Zheng, Y.; Singh, V.P.; Luo, M.; Xie, Z. Summer extreme precipitation in eastern China: Mechanisms and impacts. J. Geophys. Res. Atmos. 2017, 122, 2766–2778. [Google Scholar] [CrossRef]
- Zhang, Y.; Chu, X.; Yang, S.; Guo, C. Climate change in north Xinjiang in recent 56 years. Arid Zone Res. 2019, 36, 212–219. [Google Scholar]
- Ding, Z.; Wang, Y.; Lu, R. An analysis of changes in temperature extremes in the Three River Headwaters region of the Tibetan Plateau during 1961–2016. Atmos. Res. 2018, 209, 103–114. [Google Scholar] [CrossRef]
- Mann, H.B. Nonparametric tests against trend. Econom. J. Econom. Soc. 1945, 13, 245–259. [Google Scholar] [CrossRef]
- Kendall, M.G. Rank Correlation Methods, 4th ed.; Griffin: London, UK, 1948. [Google Scholar]
- Du, H.; Xia, J.; Zeng, S. Regional frequency analysis of extreme precipitation and its spatio-temporal characteristics in the Huai River Basin, China. Nat. Hazards 2014, 70, 195–215. [Google Scholar] [CrossRef]
- Song, X.; Zhang, J.; Zou, X.; Zhang, C.; AghaKouchak, A.; Kong, F. Changes in precipitation extremes in the Beijing metropolitan area during 1960–2012. Atmos. Res. 2019, 222, 134–153. [Google Scholar] [CrossRef]
- Liu, S.; Huang, S.; Huang, Q.; Xie, Y.; Leng, G.; Luan, J.; Song, X.; Wei, X.; Li, X. Identification of the non-stationarity of extreme precipitation events and correlations with large-scale ocean-atmospheric circulation patterns: A case study in the Wei River Basin, China. J. Hydrol. 2017, 548, 184–195. [Google Scholar] [CrossRef]
- Han, Y.; Tian, X. Significant increase in humidity since 2003 in Qinghai Province, China: Evidence from annual and seasonal precipitation. Environ. Monit. Assess. 2023, 195, 1549. [Google Scholar] [CrossRef]
- Barbu, N.; Burada, C.; Stefan, S.; Georgescu, F. Changes in the large-scale atmospheric circulation over Romania between 1961 and 2010 on seasonal basis. Acta Geophys. 2016, 64, 510–520. [Google Scholar] [CrossRef][Green Version]
- Uliana, E.M.; Silva, D.D.d.; Uliana, E.M.; Rodrigues, B.S.; Corrêdo, L.d.P. Análise de tendência em séries históricas de vazão e precipitação: Uso de teste estatístico não paramétrico. Rev. Ambiente Água 2015, 10, 82–88. [Google Scholar]
- Zhang, Y.; Li, C.; Wang, L.; Wu, L.; Wei, J. Application and comparison of several test methods for changepoints diagnosis in streamflow variations. Water Resour. Hydro. Eng 2020, 51, 38–47. [Google Scholar]
- Hurst, H.E. Long-term storage capacity of reservoirs. Trans. Am. Soc. Civ. Eng. 1951, 116, 770–799. [Google Scholar] [CrossRef]
- Li, X.; Zhang, K.; Gu, P.; Feng, H.; Yin, Y.; Chen, W.; Cheng, B. Changes in precipitation extremes in the Yangtze River Basin during 1960–2019 and the association with global warming, ENSO, and local effects. Sci. Total. Environ. 2021, 760, 144244. [Google Scholar] [CrossRef]
- Szolgayova, E.; Parajka, J.; Blöschl, G.; Bucher, C. Long term variability of the Danube River flow and its relation to precipitation and air temperature. J. Hydrol. 2014, 519, 871–880. [Google Scholar] [CrossRef]
- Rathinasamy, M.; Agarwal, A.; Sivakumar, B.; Marwan, N.; Kurths, J. Wavelet analysis of precipitation extremes over India and teleconnections to climate indices. Stoch. Environ. Res. Risk Assess. 2019, 33, 2053–2069. [Google Scholar] [CrossRef]
- Jiang, R.; Cui, X.; Lin, J.; Tian, J. 40-year statistics of warm-season extreme hourly precipitation over Southwest China. J. Appl. Meteorol. Climatol. 2023, 62, 1891–1908. [Google Scholar] [CrossRef]
- Gimeno, L.; Dominguez, F.; Nieto, R.; Trigo, R.; Drumond, A.; Reason, C.J.; Taschetto, A.S.; Ramos, A.M.; Kumar, R.; Marengo, J. Major mechanisms of atmospheric moisture transport and their role in extreme precipitation events. Annu. Rev. Environ. Resour. 2016, 41, 117–141. [Google Scholar] [CrossRef]
- Zhao, Y. A study on the heavy-rain-producing mesoscale convective system associated with diurnal variation of radiation and topography in the eastern slope of the western Sichuan plateau. Meteorol. Atmos. Phys. 2015, 127, 123–146. [Google Scholar] [CrossRef]
- Vujovic, S.; Haddad, B.; Karaky, H.; Sebaibi, N.; Boutouil, M. Urban heat island: Causes, consequences, and mitigation measures with emphasis on reflective and permeable pavements. CivilEng 2021, 2, 459–484. [Google Scholar] [CrossRef]
- Tong, S.; Li, X.; Zhang, J.; Bao, Y.; Bao, Y.; Na, L.; Si, A. Spatial and temporal variability in extreme temperature and precipitation events in Inner Mongolia (China) during 1960–2017. Sci. Total. Environ. 2019, 649, 75–89. [Google Scholar] [CrossRef]
- Zhai, P.; Yu, R.; Guo, Y.; Li, Q.; Ren, X.; Wang, Y.; Xu, W.; Liu, Y.; Ding, Y. The strong El Niño of 2015/16 and its dominant impacts on global and China’s climate. J. Meteorol. Res. 2016, 30, 283–297. [Google Scholar] [CrossRef]
- Zhang, Q.; Gu, X.; Li, J.; Shi, P.; Singh, V.P. The impact of tropical cyclones on extreme precipitation over coastal and inland areas of China and its association to ENSO. J. Clim. 2018, 31, 1865–1880. [Google Scholar] [CrossRef]
- Lv, A.; Fan, L.; Zhang, W. Impact of ENSO events on droughts in China. Atmosphere 2022, 13, 1764. [Google Scholar] [CrossRef]
- Zhang, Y.; Zhou, W.; Wang, X.; Wang, X.; Zhang, R.; Li, Y.; Gan, J. IOD, ENSO, and seasonal precipitation variation over Eastern China. Atmos. Res. 2022, 270, 106042. [Google Scholar] [CrossRef]
- Li, S.; Ni, M.; Mao, R.; Bush, R.T. Riverine CO2 supersaturation and outgassing in a subtropical monsoonal mountainous area (Three Gorges Reservoir Region) of China. J. Hydrol. 2018, 558, 460–469. [Google Scholar] [CrossRef]
- Wu, J.; Liu, Q.; Cui, Q.; Xu, D.; Wang, L.; Shen, C.; Chu, G.; Liu, J. Shrinkage of East Asia Winter Monsoon associated with increased ENSO events since the mid-Holocene. J. Geophys. Res. Atmos. 2019, 124, 3839–3848. [Google Scholar] [CrossRef]
- Knight, J.R.; Folland, C.K.; Scaife, A.A. Climate impacts of the Atlantic multidecadal oscillation. Geophys. Res. Lett. 2006, 33, L17706. [Google Scholar] [CrossRef]
- Zhu, L.; Cooper, D.J.; Han, S.; Yang, J.; Zhang, Y.; Li, Z.; Zhao, H.; Wang, X. Influence of the atlantic multidecadal oscillation on drought in northern Daxing’an Mountains, Northeast China. Catena 2021, 198, 105017. [Google Scholar] [CrossRef]
- Liu, H.; Zhou, T.; Zhu, Y.; Lin, Y. The strengthening East Asia summer monsoon since the early 1990s. Chin. Sci. Bull. 2012, 57, 1553–1558. [Google Scholar] [CrossRef]
- Chen, D.; Zhou, F.; Dong, Z.; Zeng, A.; Ou, T.; Fang, K. A tree-ring δ18O based reconstruction of East Asia summer monsoon over the past two centuries. PLoS ONE 2020, 15, e0234421. [Google Scholar] [CrossRef] [PubMed]
- Trenberth, K.E. Changes in precipitation with climate change. Clim. Res. 2011, 47, 123–138. [Google Scholar] [CrossRef]
- Sharma, A.; Wasko, C.; Lettenmaier, D.P. If precipitation extremes are increasing, why aren’t floods? Water Resour. Res. 2018, 54, 8545–8551. [Google Scholar] [CrossRef]
- Seneviratne, S.I.; Zhang, X.; Adnan, M.; Badi, W.; Dereczynski, C.; Luca, A.D.; Ghosh, S.; Iskandar, I.; Kossin, J.; Lewis, S. Weather and Climate Extreme Events in a Changing Climate; Cambridge University Press: Cambridge, UK, 2021. [Google Scholar]


Disclaimer/Publisher’s Note: The statements, opinions and data contained in all publications are solely those of the individual author(s) and contributor(s) and not of MDPI and/or the editor(s). MDPI and/or the editor(s) disclaim responsibility for any injury to people or property resulting from any ideas, methods, instructions or products referred to in the content. |
© 2025 by the authors. Licensee MDPI, Basel, Switzerland. This article is an open access article distributed under the terms and conditions of the Creative Commons Attribution (CC BY) license (https://creativecommons.org/licenses/by/4.0/).