Abstract
Space resources are of economic and strategic value. Infrared (IR) remote sensing, unaffected by geography and weather, is widely used in weather forecasting and defense. However, detecting small IR targets is challenging due to their small size and low signal-to-noise ratio, and the resulting low detection rates (DRs) and high false alarm rates (FRs). Existing algorithms struggle with complex backgrounds and clutter interference. This paper proposes an adaptive differential event detection method for space-based aerial target observation, tailored to the characteristics of target motion. The proposed IR differential event detection mechanism uses trigger rate feedback to dynamically adjust thresholds for strong, dynamic radiation backgrounds. To accurately extract targets from event frames, a lightweight target detection network is designed, incorporating an Event Conversion and Temporal Enhancement (ECTE) block, a Spatial-Frequency Domain Fusion (SFDF) block, and a Joint Spatial-Channel Attention (JSCA) block. Extensive experiments on simulated and real datasets demonstrate that the method outperforms state-of-the-art algorithms. To advance research on IR event frames, this paper introduces SITP-QLEF, the first remote-sensing IR event dataset designed for dim and moving target detection. The algorithm achieves an mAP@0.5 of 96.3%, an FR of 4.3 , and a DR of 97.5% on the SITP-QLEF dataset, proving the feasibility of event detection for small targets in strong background scenarios.
1. Introduction
Research on infrared small target detection (IRSTD) has been a hot topic in remote sensing. Ground-based air defense systems are limited in detection range due to the curvature of the Earth and terrain. IR remote sensing, which does not rely on a response mechanism, allows for wide-area, all-weather, and round-the-clock detection, making it an effective method for detecting aerial targets. Aerial target surveillance is an essential space-based task for both public and military applications. However, infrared (IR) aerial targets present significant challenges because of their weak energy, small size, and limited texture, which result from long-range detection and atmospheric attenuation. When the radiation and size of targets closely resemble background clutter, the signal-to-noise ratio (SNR) and target–background contrast become too low to achieve a high detection rate (DR) and a low false alarm rate (FR). Researchers have addressed the challenges through advancements in detection mechanisms, sensors, optics, and processing algorithms.
1.1. Event-Triggered Vision Mechanism
Conventional frame-based IR detection methods face inherent limitations in moving-object detection tasks. Sensors operate in a periodic sampling mode, which leads to the loss of partial information. Additionally, global imaging generates significant redundancy from static backgrounds, creating challenges in storage capacity, data transmission bandwidth, and signal processing speed. Inspired by nature, various biomimetic vision techniques have been applied in the field of IRSTD. Researchers suggest that biomimetic vision systems can enhance moving target detection by mimicking the physiological structures and operational mechanisms of biological vision systems [1]. Examples include visual attention in human eyes [2], motion sensitivity in frog eyes [3,4], and the wide field-of-view perception in compound eyes [5,6]. Leveraging bio-vision features has emerged as a promising approach to overcoming the limitations of traditional IR detection methods.
Some biomimetic vision systems can selectively enhance targets of interest while suppressing irrelevant background information. For instance, frogs detect and prey on insects based on the size and motion of targets, ignoring static surroundings. Research has shown that a specific cell in the frog’s visual system, known as a moving-edge detector, responds exclusively to light variations [7]. Inspired by dynamic vision, neuromorphic vision sensors, which are triggered by logarithmic light variations, offer advantages such as high temporal resolution, low latency, and a wide dynamic range [8,9,10]. Event-triggered sensors are widely used in applications such as autonomous driving [11,12,13] and drone obstacle avoidance [14,15,16]. These sensors are primarily employed for observing large moving targets, with relatively limited research focused on detecting small targets in dynamic backgrounds.
When the light variation exceeds a certain threshold, these event-triggered vision systems output events that include the triggered pixel’s position, timestamp, and polarity. Threshold selection is critical but often involves pre-set or manual adjustments, limiting flexibility and adaptability.
1.2. Deep Learning-Based Infrared Small Target Detection Algorithm
Over the past few decades, various IRSTD algorithms have been developed, including filter-based methods [17,18,19,20,21,22,23], local information-based methods [24,25,26,27], data structure-based methods [28,29,30,31,32], and deep learning (DL) methods [33,34]. While classic detection algorithms offer real-time capabilities, their performance tends to be unstable in complex backgrounds.
Neural networks are highly effective for feature extraction, and their robustness and stability have led to the widespread application of DL methods in IRSTD. DL-based detection algorithms are broadly categorized into two-stage and single-stage detection approaches. In two-stage detection, region proposals are first generated and then classified and refined for bounding box regression using Convolutional Neural Networks (CNNs). This approach is highly accurate and well-suited for complex detection tasks. Representative algorithms include Fast R-CNN [35], FPN [36], and Cascade-RCNN [37]. Single-stage detection, on the other hand, simplifies the process by directly predicting target classes and bonding box locations from the input image or feature map. This method is computationally efficient and fast. Notable algorithms include SSD [38] and RetinaNet [39]. YOLO, one of the most popular single-stage networks, has become a crucial baseline for target detection due to its speed and efficiency. It uses a CNN to predict the potential target location in a single forward pass [40,41,42]. The detection network proposed in this paper builds upon and enhances the latest YOLO11 architecture. DETR, an end-to-end detection model based on transformers, eliminates the need for a non-maximum suppression (NMS) block. However, it faces challenges such as slow convergence and high computational complexity [43]. RT-DETR addresses these issues by improving both accuracy and speed, resolving the latency problems caused by NMS, and enabling real-time detection [44]. Additionally, by incorporating a generative adversarial network (GAN), researchers have refined feature extraction by leveraging structural correlations between targets of varying sizes. This approach connects the network to detection heads, such as YOLO, to achieve efficient detection of small targets [45]. DL methods, known for their robustness in dynamic scenes, face challenges due to limited datasets and hardware compatibility, particularly in IR remote sensing, where capturing image sequences of small moving targets is difficult.
To perceive space-based aerial targets and adapt to complex variations in highly dynamic IR radiation environments, this paper introduces an adaptive threshold IR differential event detection mechanism inspired by biomimetic dynamic vision sensing. The core of IR differential event detection lies in selective perception, which enables data compression without losing motion information, thereby eliminating the need for large-scale network architectures and extensive computations. For remote sensing scenarios, a lightweight target detection network based on event frames is proposed to address the challenge of detecting distant, dim, moving targets. The main contributions of this work are summarized as follows.
- 1.
- An adaptive IR differential event detection mechanism based on trigger rate feedback is proposed. Unlike global imaging, the event-triggered paradigm is highly sensitive to motion and objects with radiation fluctuations over short temporal intervals.
- 2.
- This paper designs and releases the first IR event datasets for space-based dim small target detection, including event frames and corresponding ground truth (GT) labels. The dataset simulates real satellite platform jitter, with the camera operating in staring mode for aerial target detection scenarios. The backgrounds are derived from images captured by the Qilu Satellite-2 (QLSAT-2) long-wave infrared (LWIR) camera, with a ground resolution of 14 m at 500 km. The aerial targets are modeled using two-dimensional Gaussian fitting, reflecting real motion information and grayscale variations. To advance research on IR event detection, the proposed dataset addresses the current lack of publicly available datasets.
- 3.
- A lightweight network is developed for IR target event detection. Based on the adaptive IR differential event detection mechanism, an Event Conversion and Temporal Enhancement (ECTE) block is constructed to convert traditional image sequences into sparse IR event frames with temporal accumulation. The backbone incorporates a Spatial-Frequency Domain Fusion (SFDF) block to integrate features from both domains. Additionally, a Joint Spatial-Channel Attention (JSCA) block in the neck introduces spatial and channel attention mechanisms. Experimental results demonstrate that the proposed method outperforms several state-of-the-art (SOTA) algorithms on both public and synthetic datasets.
The rest of this paper is organized as follows. Section 2 introduces the IR differential event detection mechanism and the lightweight detection network for space-based aerial targets in detail. Section 3 presents the experimental results and comparisons. Finally, Section 4 presents the conclusions and discussions.
2. Method
This paper introduces a novel IR differential event detection mechanism that dynamically adjusts the threshold by leveraging the event-triggered rate, balancing the detection rate and false trigger rate. Furthermore, a lightweight target detection network is proposed for IR event frames.
2.1. Modeling Mechanism of Adaptive Infrared Differential Event Trigger
An IR differential event trigger outputs events when the radiation change at a pixel exceeds a specified contrast threshold. This mechanism focuses on regions with IR radiation variations, such as moving objects or bright spots on the ground, while disregarding stationary scenes. The primary goal of IRSTD is to identify targets quickly and accurately. By selectively ignoring non-critical features, computational complexity and data volume are reduced, providing an efficient foundation for fast and effective target detection.
2.1.1. Infrared Differential Event Detection
The photocurrent per pixel of an IR sensor is defined as
where is the pixel’s position; is the photon radiant flux; is the quantum efficiency; e is the electron charge; is spectral radiant flux per pixel; is the band; h is Planck’s constant; and c is the velocity of light under vacuum. The temporal change in the photocurrent per pixel is expressed as
When the variation in photocurrent exceeds the contrast threshold C, the differential event sensor outputs the IR event stream , which includes the pixel’s location, timestamp, and event polarity:
where N is the number of events. The polarity indicates the direction of change in the IR radiation:
Since IR differential event detection responds to relative changes in radiation, the radiation at the initial moment is used as a reference, and the initial threshold is set as a constant. The reference radiation, which is used to determine whether an event is triggered, is the radiation value at the current moment, and thus changes dynamically.
2.1.2. Event-Triggered Rate Feedback
As defined in Section 2.1.1, the IR differential event sensor triggers events based on a set threshold and changes in radiation. In practical moving target observations, factors such as time, weather, platform movement, and other variables make it challenging to maintain a stable background within the camera’s field of view. This instability can lead to the triggering of irrelevant events from the dynamic background. Additionally, contrast thresholds should be dynamically adjusted to suit different detection tasks. To address these challenges, this paper proposes a trigger rate feedback mechanism that dynamically adjusts the contrast threshold. This approach enables the system to adapt to dynamic scenarios while maintaining a balance between detection performance and the probability of false triggers. The trigger rate is defined as
where is the total number of events on the focal plane array (FPA) and is the total number of pixels on the FPA.
The trigger rate interval is for different detection tasks. If the current trigger rate falls within the preset interval, the threshold remains unchanged. If the trigger rate exceeds , the threshold is increased, and if the trigger rate falls below , the threshold is decreased by modifying the adaptive coefficient . If , then . If , then . is an adjustable constant, set to 0.5 in this paper. The threshold is updated to
where and are the mean and standard deviation of light intensity variations in the image, and represents the image region. The threshold intervals and adaptive coefficients can be determined empirically. The updated threshold is then set as the trigger threshold for the next iteration, and a new trigger rate is calculated to determine whether further adjustments are necessary. This process is repeated in a loop until the observation is complete. Asynchronous event streams are integrated over consistent time intervals to construct and output IR event frames. Each pixel in the IR event frame contains only positive or negative polarity information, significantly reducing the data volume while effectively preserving critical spatio-temporal information.
2.2. Lightweight Target Detection Algorithm Based on Event Frames
IR differential event detection effectively eliminates a significant amount of static redundant information, producing outputs that include target events, dynamic background events, and noise. Background events arise from the relative motion of the platform and variations in the radiation of ground bright spots, while noise originates from the intrinsic noise of the sensor and detection system. The goal of this section is to accurately extract the target events of interest from the IR event frames.
2.2.1. Network Architecture
Given the simple data structure and reduced data volume of event frames, efficient detection performance can be achieved without relying on a complex or bulky model. As illustrated in Figure 1, the network is modified and refined based on the YOLO11 architecture to accommodate the characteristics of event frames. It consists of four main components: the ECTE, backbone, neck, and head. The ECTE converts traditional image sequences into event frames and enhances them temporally. The backbone network processes the input event frames to generate meaningful representations. The neck further refines and enhances the features, capturing more complex and high-level information. The head calculates the predictions and produces the final detection results, including target classification and localization.
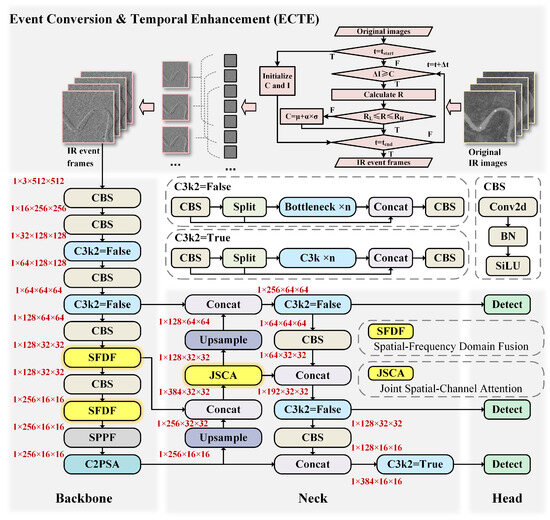
Figure 1.
Overall network structure.
The backbone network is the core of the entire architecture, integrating CBS, C3k2, SPPF, and C2PSA blocks to achieve efficient and robust feature extraction. The CBS block, consisting of two-dimensional convolution (Conv2d), Batch Normalization (BN), and the Sigmoid Linear Unit (SiLU) activation function, ensures stable and effective processing of tensor features. The C3k2 block, based on the Cross Stage Partial (CSP) network, dynamically adjusts its structure: it operates as a bottleneck block in “false” mode and as a C3k block in “true” mode. The SPPF block optimizes pooling operations to reduce computational complexity and adapt to multi-scale objectives by employing multiple small pooling layers to process feature maps and integrating their outputs into a unified representation. Additionally, the C2PSA block enhances feature extraction by incorporating Pointwise Spatial Attention (PSA), leveraging a multi-head attention mechanism and Feed Forward Networks (FFNs) for improved performance. To fully exploit the spatial and frequency domain characteristics of targets in event frames, this paper introduces the Spatial-Frequency Domain Fusion (SFDF) block, which combines the channel attention mechanism with the backbone network to further enhance feature extraction capabilities.
The neck network acts as a bridge between the backbone and the head, consisting mainly of the CBS, C3k2, and the JSCA block introduced in this paper. Its primary function is to refine the features extracted by the backbone while reducing the number of feature map channels, thereby accelerating model inference. By fusing and enhancing the feature maps generated by the backbone, the neck network significantly improves the model’s generalization capability and performance.
The head network processes the feature maps generated in previous stages to predict the final object coordinates. It outputs bounding boxes at three different scales based on the feature maps from the neck and classifies the objects within these boxes, effectively predicting both the location and type of targets. The loss functions used include bounding box loss, classification loss, and distribution focal loss. The following sections provide a detailed explanation of the three novel blocks introduced in this paper.
2.2.2. ECTE Block
The adaptive differential event-triggered mechanism described in Section 2.1 is used to design the ECTE block, as shown in Figure 1. The processing paradigms for conventional images and IR event frames differ considerably. In traditional IR images, space-based aerial targets typically follow a Gaussian distribution. Variations in factors such as temperature and emissivity result in differences in the radiometric characteristics of both the target and the background, which manifest as positive or negative contrasts in the grayscale image.
An IR event frame includes the position of a moving target at both the current and previous moments, resulting in a geometrically similar distribution of positive and negative polarities within the target event region. If the target’s IR radiation exceeds that of its surroundings, the event polarity at the next moment is positive; otherwise, it is negative. Therefore, the radiation difference between the target and the background can be inferred from the event polarity.
However, compared to traditional images, event frames lack grayscale and texture details. To enhance the features and energy of the target, and thus improve detection accuracy, this paper accumulates multiple event frames to highlight the target’s motion trajectory. The accumulated event frame, which combines data from five consecutive frames, serves as the input for the subsequent target detection network. The algorithm is summarized in Algorithm 1.
| Algorithm 1 Event conversion and temporal enhancement |
|
2.2.3. SFDF Block
The SFDF block is a crucial component of the backbone network, designed to enhance feature extraction by integrating spatial and frequency domain information. It employs a CSP structure with two convolution layers to improve gradient flow, extracting deeper information while preserving shallow features. As illustrated in Figure 2, the input feature map undergoes an initial convolution and is split into two branches. One branch undergoes a series of feature extraction steps, while the other bypasses these steps and directly connects to the output of the first branch. The two branches are then recombined with the unsplit portion of the input and passed through the final convolution block.
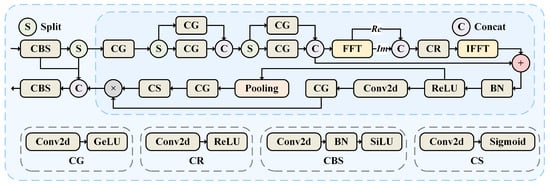
Figure 2.
SFDF block structure.
Given that IR event frames contain spatial and potentially temporal domain information, the SFDF block introduces frequency domain information into the process. This integration allows the block to effectively combine high- and low-frequency features, facilitating the efficient capture of global information.
The Discrete Fourier Transform (DFT) is widely used in digital signal processing. The one-dimensional DFT (1-D DFT) is defined as
where x is the finite length sequence and . The Inverse Discrete Fourier Transform (IDFT) is defined as
To perform the two-dimensional DFT (2-D DFT) on an image of this size, the rows and columns need to be transformed using the 1-D DFT separately. The 2-D DFT and its inverse transform are defined as
where is the spatial domain of the image, and the exponential term is the basis function corresponding to each point in the Fourier domain.
To enhance the algorithm’s computational speed, the SFDF computes the 2-D DFT of the real part using the Fast Fourier Transform (FFT), separating the real and imaginary components and combining them effectively:
where , is the frequency domain feature, Re and Im denote the extraction of the real and imaginary parts, respectively. is the connection function. Convolution, BN, and ReLU operations are applied sequentially to . The number of channels is adjusted to recombine the frequency domain features into complex numbers. After applying the Inverse Fast Fourier Transform (IFFT), the resulting feature vectors are fused with the original spatial-domain features through a residual connection:
where denotes the 2-D IFFT. The channel attention mechanism highlights the importance of individual channels by assigning weights, enhancing significant channels while suppressing redundant ones. The tensor is processed sequentially through a pooling layer, a dimensionality-reducing pointwise convolution, and an activation function to generate the weights. These weights are then applied to the original tensor, resulting in the final output.
2.2.4. JSCA Block
As shown in Figure 3, the JSCA block builds upon the CSP structure. After passing through the CBS block, the feature map is split into three branches. One branch remains unprocessed, while the other two undergo a series of feature extraction operations. The “CBS × 2” in Figure 3 indicates two consecutive CBS blocks. The outputs from these branches are then fused with the unprocessed branch to enhance feature representation and improve detection performance.
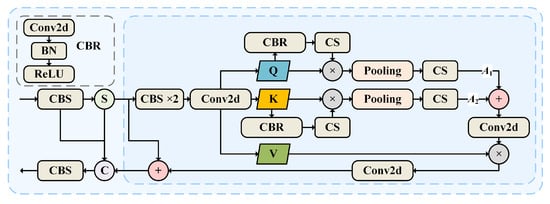
Figure 3.
JSCA block structure.
The attention mechanism is expressed as
where Q is the query, which is related to the current location; K is the key, which stores each position of the feature; and V is the value, which contains the actual information. calculates the similarity between Q and K. is the dimension size, and is the scaling factor to prevent the values from being too large. The normalized attention weights, calculated using the Softmax activation function, are used to weigh V. Based on the attention mechanism, the following features are obtained by separation:
where X is the input vector; , , and are trainable weighted matrices.
The attention weights are then calculated by processing Q and K through spatial and channel attention blocks in series. The resulting weights are subsequently fused. The spatial attention block computes weights across the spatial dimensions of the feature map and consists of the CBR and CS blocks. As shown in Figure 3, the CBR block sequentially includes Conv2d, BN, and the ReLU activation function for feature extraction. The advantages of the CBR block lie in enhancing image feature representation and improving training stability and convergence speed. Additionally, by introducing non-linearity and capturing local information, the model’s flexibility and accuracy are further improved. The weighted feature vectors are processed through average pooling, Conv2d, and Sigmoid layers to generate channel weight coefficients. The attention weights of Q and K, denoted as and , are fused and then combined with V through a convolutional layer by weighting and summation:
where A represents the fused attention weight and O denotes the output. A dropout strategy is employed to randomly deactivate neurons, ensuring the network remains sparse and mitigating overfitting. Finally, the weighted features are integrated with the branch to produce the output. By utilizing the JSCA block, each output element incorporates contextual information from other elements.
3. Experiments
3.1. Dataset Preparation
This study uses both real and synthetic datasets for training and testing. The parameters of the six datasets are detailed in Table 1. The training datasets are generated by combining real background images with simulated aerial targets. The background data are sourced from on-orbit remote sensing IR images, while the aerial targets are simulated using a two-dimensional Gaussian model that reflects realistic motion trajectories and grayscale variations. The camera is simulated to operate in staring mode. As shown in Table 1, Dataset 1 contains 11,600 images, Dataset 2 contains 13,400 images, Dataset 3 contains 13,400 images, Dataset 4 contains 399 images, Dataset 5 contains 169 images, and Dataset 6 contains 399 images.

Table 1.
The parameters of datasets.
The Society of Photo-Optical Instrumentation Engineers (SPIE) defines small targets as those occupying less than 0.15% of the entire image. Dataset 1 has an image resolution of 512 × 512 pixels, with target sizes set to 11 × 11 pixels. Each scene contains 1–3 targets, moving at a speed of 1–1.4 pixels per frame. The SNR is defined as the ratio of the target’s central grayscale value to the standard deviation of the image grayscale, with the mean SNR set to 2. To simulate relatively stationary observation conditions, platform jitter is set to subpixel levels. The background data are derived from images captured by an on-orbit MWIR camera, encompassing various background types such as cityscapes, clouds, sea, and land. The dataset consists of 58 scene sequences, each containing 200 frames.
In Datasets 2 and 3, the background data are derived from the QLSAT-2 high-resolution optical camera, the core payload of QLSAT-2 developed by the Shanghai Institute of Technical Physics (SITP). The QLSAT-2 long-wave infrared (LWIR) camera has a ground resolution of 14 m at an altitude of 500 km. Both datasets use real remote sensing LWIR images as backgrounds, including scenes such as cities, land, and clouds. In real scenarios, a satellite platformingjitter follows a distribution with a standard deviation of approximately 0.004°, resulting in platform speeds set between zero and three pixels per frame. The original imaging size of the targets in Dataset 2 is 11 × 11 pixels, with a mean SNR of 4. In Dataset 3, the target size is 5 × 5 pixels, and the mean SNR is also set to 4.
Datasets 4 and 6 are sourced from the public NUDT-SIRST dataset, which features moving UAVs in a sky background [46]. The MWIR image size is 256 × 256 pixels. Dataset 4 contains 399 frames, with two targets, an average motion speed of 0.4 pixels per frame, and an average SNR of 4.34. Dataset 6 includes 399 frames, with two targets, an average speed of 0.5 pixels per frame, and an average SNR of 3.75.
Dataset 5 comprises real remote sensing data captured by the QLSAT-2 LWIR camera, focusing on a civil aircraft near a civilian airport in staring mode. The target size in Dataset 5 is 5 × 5 pixels, with a mean SNR ranging from 2 to 5. The average target velocity is 0.63 pixels per frame, while the platform velocity ranges from one to two pixels per frame.
The trigger rate is set within the range of 3–10% for Dataset 1, 5–10% for Datasets 2, 3, and 5, and 2–8% for Datasets 4 and 6. The testing showed that accumulating five event frames yielded the best performance.
The simulation datasets (Datasets 1, 2, and 3) are divided into training, validation, and test sets with an 8:1:1 ratio. To evaluate the model’s generalizability, real IR image sequences are used for testing.
To further advance research in IR event processing algorithms, this paper includes Dataset 3, named SITP-QLEF, as an IR event frame dataset.
3.2. Evaluation Metrics
The commonly used evaluation metrics for target detection are precision and recall:
where is true positive, is false positive, and is false negative. The F1 score is defined as
Since target detection involves both classification and localization tasks, the Intersection over Union (IoU) metric is employed to compare the predicted and true target regions. IoU is defined as follows:
where is the area of the predicted bounding box, and is the area of the ground truth bounding box. The IoU ranges from 0 to 1, with values closer to 1 indicating higher prediction accuracy. When the IoU exceeds a specified threshold, the detection is considered positive. In practical scenarios, precision and recall often trade off against each other. To evaluate the overall balance between these two metrics, the mean average precision (mAP) is employed, which serves as a crucial metric in DL-based target detection tasks:
where m represents the number of classes, and refers to the average precision, calculated as the area under the precision–recall curve. The paper uses mAP@0.5 and mAP@0.5:0.95 as evaluation metrics. The mAP@0.5 denotes the mAP at an IoU threshold of 0.5, while the mAP@0.5:0.95 represents the mAP averaged over IoU thresholds ranging from 0.5 to 0.95, in increments of 0.05.
DR and FR are widely used evaluation metrics and are calculated as follows:
where represents the number of correctly detected targets, is the total number of true targets, refers to the number of incorrectly detected targets, and denotes the total number of pixels in the detected image. This paper evaluates the model’s processing speed using parameters such as parameter count (PC), floating point operations (FLOPs), inference time, and frames per second (FPS).
3.3. Quantitative Results
To evaluate the performance of the proposed network, comparisons were made with SOTA data-driven target detection algorithms, including RT-DETR-l, YOLOv8n, YOLOv8s-worldv2, YOLOv9t, YOLOv10n, and YOLO11n. Each algorithm was trained on Datasets 1, 2, and 3, and subsequently tested on Datasets 4, 5, and 6. Experiments were conducted on an Intel(R) Core(TM) i9-14900HX 2.20 GHz CPU and an NVIDIA GeForce RTX 4060 Laptop GPU. All algorithms were trained for 200 epochs, with an early stopping strategy employed to mitigate overfitting. The optimizer for the proposed network was stochastic gradient descent (SGD) with a learning rate of 0.01. The best-performing results are highlighted in bold within the tables.
In Dataset 1, the detection scene remains relatively stationary relative to the detector. Despite the complex remote sensing background, the adaptive event-triggered mechanism effectively suppresses the background, leading to fewer background events and minimal interference with target detection. Notably, the SNR of the targets in Dataset 1 is lower than in other datasets, yet this does not impact the overall detection performance. Even when the targets are embedded in a complex background, the proposed algorithm successfully detects dim aerial targets, demonstrating its robust capability in capturing weak and moving targets. As shown in Table 2, the proposed method significantly outperforms other algorithms on Dataset 1. It achieves an mAP@0.5 of 96.8%, representing an improvement of 8.28% over the latest YOLO11n. The mAP@0.5:0.95 reaches 85.2%, the highest among the compared algorithms, with a substantial improvement of 33.13% over YOLO11n. The method also demonstrates superior performance in other metrics, achieving a mean F1 score of 93.6%, surpassing the SOTA benchmarks. Additionally, when the FR is 7 , the DR of this method reaches 97.1%. With only 2.9 M parameters, 6.6 G FLOPs, a 2.4 ms inference time, and a frame rate of 285.1 FPS, this method not only ranks highly in computational efficiency, but also delivers exceptional target detection performance, far surpassing the other compared algorithms. It can be concluded that this algorithm is effective in accurately detecting dim, moving targets in relatively static and complex scenes.
Table 2.
The test results on Dataset 1.
Datasets 4 and 6 were used to evaluate the performance of the model trained on Dataset 1. The backgrounds in Datasets 4 and 6 consist of sky scenes, leading to fewer triggered background events. As a result, the model trained on Dataset 1 transfers effectively to Datasets 4 and 6. Since the target SNR in Dataset 4 is higher than in Dataset 6, the overall detection performance in Dataset 4 surpasses that in Dataset 6. In real detection scenarios, the camera platform may undergo maneuvers to track the target accurately, resulting in a sharp increase in triggered events and abrupt changes in the shape of target events. Consequently, the test results on real datasets tend to be lower than those on synthetic datasets. Nevertheless, the proposed algorithm demonstrates good stability. As shown in Table 3, the proposed method achieves an mAP@0.5 of 94.9%, reflecting a 12.31% improvement over YOLO11n and a performance 7.41 times higher than YOLOv8n. The mAP@0.5:0.95 reaches 65.3%, representing an 81.39% improvement over YOLO11n and a remarkable 36.69-fold increase compared to YOLOv8n. Furthermore, the proposed method achieves an F1 score of 90.2%, which is 13.72% higher than YOLO11n and 4.1 times greater than YOLOv8n. When the FR is 1.2 , the DR reaches 94.6%. In Dataset 6, the F1 score is 77.9%, and the DR is 83.9%. As shown in Table 4, the mAP@0.5 is 80.4%, which is 2.05 times larger than that of YOLOv8s-worldv2 and 1.08 times higher than that of YOLOv10n. The proposed algorithm outperforms the compared algorithms in mAP@0.5, F1 score, and DR on real Datasets 4 and 6, emphasizing its superiority in stability and adaptability to varying backgrounds.
Table 3.
The test results on Dataset 4.
Table 4.
The test results on Dataset 6.
To simulate real detection conditions, Dataset 2 increased the platform’s movement speed, leading to background events that capture edge information. Table 5 highlights the superior performance of the proposed method on Dataset 2. The mAP@0.5 achieved by this method is 96.5%, surpassing YOLOv9t by 25.65% and YOLOv8n by 6.75%. Additionally, the mAP@0.5:0.95 reaches 89.8%, which is 61.8% higher than YOLOv9t and 31.29% greater than RT-DETR-l. The method also achieves an F1 score of 96.2%, outperforming YOLOv9t by 20.68% and YOLOv8n by 11.39%. These results demonstrate that as the platform’s motion speed increases, the proposed model exhibits excellent adaptability, effectively and accurately extracting target events from background events.
Table 5.
The test results on Dataset 2.
Compared to Dataset 2, the targets in Dataset 3 are smaller, resulting in fewer triggered target events. As a consequence, the detection performance on Dataset 3 is slightly lower than that on Dataset 2; however, the proposed algorithm still demonstrates good detection performance. As shown in Table 6, when detecting a target with an original SNR of 4 and a size of 5 × 5 pixels under platform jitter conditions, the proposed algorithm achieves an mAP@0.5 of 96.3%, an mAP@0.5:0.95 of 75.6%, and an F1 score of 93.0%, outperforming all other algorithms. Additionally, the DR reaches 97.5% when the FR is 4.3 . This suggests that the algorithm is capable of adapting to small-sized moving target detection tasks under platform jitter conditions.
Table 6.
The test results on Dataset 3.
The background data for Datasets 3 and 5 come from the same satellite payload. Dataset 3 simulates a target detection scenario with the camera in staring mode, where the target size, motion speed, and other parameters are similar to those in Dataset 5. Theoretically, the training results from Dataset 3 should transfer well to Dataset 5. However, the experimental results show that only the proposed algorithm and YOLOv8s-worldv2 demonstrate good stability and generalization when applied to Dataset 5. When the model trained on Dataset 3 was tested using Dataset 5, as shown in Table 7, the proposed method achieved an mAP@0.5 of 95%, an mAP@0.5:0.95 of 54.9%, and an F1 score of 88.6%, significantly surpassing the performance of other algorithms. Notably, the DR reaches 100% when the FR is 2 .
Table 7.
The test results on Dataset 5.
Based on the above analysis, due to the proposed algorithm’s strong background adaptability and considering the scarcity of remote sensing image sequences, future work can involve extensive training on synthetic datasets followed by transferring the trained model to real datasets for application.
As illustrated in Figure 4, the proposed algorithm demonstrates the best comprehensive performance. It not only surpasses other algorithms in terms of mAP, P, and R, but also exhibits notable advantages in model parameters and computational complexity. These results confirm that the algorithm is well-suited for a variety of complex environments, showcasing strong generalization capabilities as well as stable and efficient target detection performance.
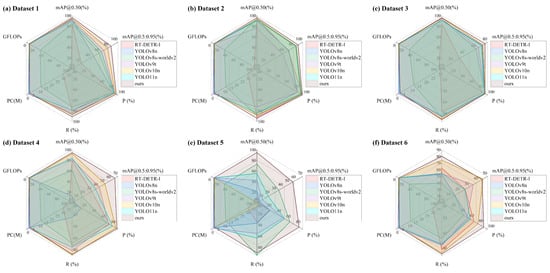
Figure 4.
Visualization of algorithm performance.
3.4. Visual Results
Figure 5 shows the target event detection results of various algorithms, with scenes from Datasets 1 to 6 displayed in sequence, two scenes per dataset. Figure 5a presents the original images alongside zoomed-in views of the true targets. The backgrounds in Datasets 4 and 6 consist of the sky and clouds, while the backgrounds in the other datasets feature real IR remote sensing scenes, such as land, cities, and rivers. These complex backgrounds introduce considerable clutter, which challenges the accuracy of target detection.
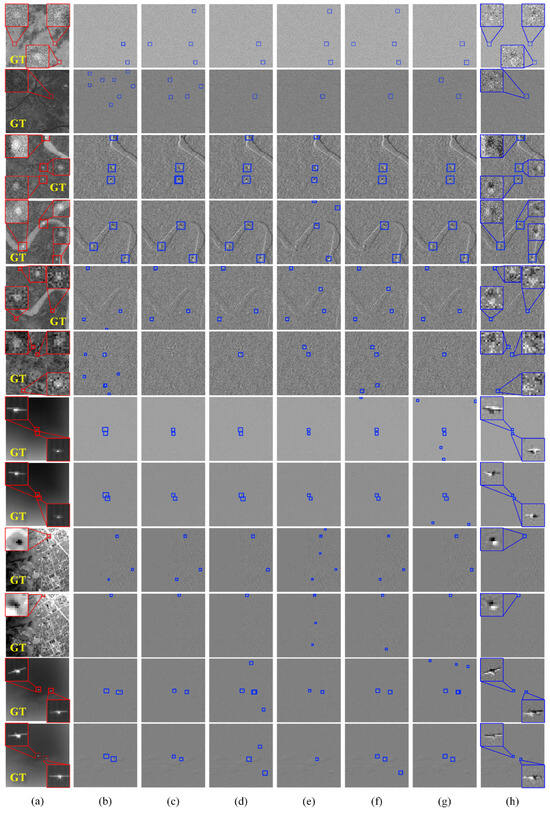
Figure 5.
Visualization of detection results. (a) Original IR images and GT labels; (b) RT-DETR-l; (c) YOLOv8n, (d) YOLOv8s-worldv2; (e) YOLOv9t; (f) YOLOv10n; (g) YOLO11n; (h) ours.
By converting the original images into event frames, the intricate background textures are effectively suppressed, leaving only the objects with motion or grayscale changes. In Datasets 1, 4, and 6, where the platform remains relatively stationary, most events in the event frames correspond to target events. However, in Datasets 2 and 3, platform motion introduces distinct background edges in the event frames. Among the various backgrounds, urban scenes generate the most events, which increases the FR. The zoomed-in views of the target events in Figure 5h reveal a polarity distribution in the target event regions, reflecting the motion trajectories of the targets. As shown in Figure 5h, the proposed algorithm accurately detects the positions of all targets, demonstrating robust adaptability to complex backgrounds.
3.5. Ablation Experiment
To comprehensively evaluate the impact of each component on detection performance, ablation experiments were conducted on Datasets 1, 2, and 3. In Table 8, A refers to the method of converting traditional images to event frames, B represents the temporal accumulation enhancement of event frames, C denotes the JSCA block, and D denotes the SFDF block.
Table 8.
The results of ablation experiments.
As shown in Table 8, directly converting the original images into event frames and inputting them into the benchmark network results in a decrease in detection performance. However, when five-frame cumulative event frames are used as input, the FR decreases significantly across all datasets, while the DR exceeds 90%. The five-frame accumulation method produces the best performance for this network.
Furthermore, incorporating the JSCA block into the neck of the network reduces the FR by 17.59% on Dataset 1 and increases the DR by 6.02%. On Datasets 2 and 3, the DR improves by 5.09% and 3.41%, respectively, with only a slight increase in FR. This demonstrates that applying the Joint Spatial-Channel Attention mechanism significantly enhances the network’s feature extraction capability. Adding the SFDF block to the backbone further improves performance, with a 59.22% decrease in FR and a 1.08% increase in DR on Dataset 3, highlighting the effectiveness of incorporating frequency domain information for enhanced detection accuracy.
The ablation experiments underscore the critical role of event-frame conversion and accumulation in improving network performance. Additionally, integrating frequency domain information and attention mechanisms significantly enhances the network’s feature extraction ability and overall stability.
4. Conclusions
To address the space-based detection of aerial targets, this paper proposes an IR adaptive differential event detection method for perceiving dim, moving targets at long distances. An adaptive event-triggered mechanism converts traditional images into sparse event frames, suppressing complex backgrounds and reducing redundancy. Additionally, a target detection network based on event frames is proposed. Experimental results validate the algorithm’s robustness in dynamic scenes, achieving a lightweight design with high detection accuracy. The following conclusions and discussions are presented:
- 1.
- In space-based IR staring mode, for a dim target of 11 × 11 pixels and a mean SNR of 2, the method achieves an mAP@0.5 of 96.8%, a DR of 97.1%, and an FR of 7 . On the NUDT-SIRST dataset, the method achieves an mAP@0.5 of 94.9%, a DR of 94.6%, and an FR of 1.2 . For targets of 11 × 11 pixels with a mean SNR of 4 and a platform speed under 3 pixels per frame, the mAP@0.5 is 96.5%, DR is 95.5%, and FR is 2.4 . For targets of 5 × 5 pixels with a mean SNR of 4 and platform jitter under 3 pixels per frame, the mAP@0.5 is 96.3%, DR is 97.5%, and FR is 4.3 . On a real remote sensing dataset, the method achieves an mAP@0.5 of 95%, a DR of 100%, and an FR of 2 , outperforming SOTA algorithms.
- 2.
- Since event-based neuromorphic vision for space-based IR aerial target detection is still in its early stages, this paper introduces and provides the first public event-frame dataset for remote sensing aerial target detection.
- 3.
- This paper explores an adaptive IR differential event-triggered mechanism and proposes an Event Conversion and Temporal Enhancement (ECTE) block. IR images require no pre-processing (e.g., non-uniformity correction or bad pixel compensation), improving data processing efficiency. The mechanism will be integrated into hardware, with a detection prototype developed in the future. The proposed network processes both event frames and traditional IR images, and its lightweight design makes it suitable for resource-constrained devices, enabling future implementation.
- 4.
- The proposed network performs target detection solely on event frames, achieving good accuracy. However, its detection capability has limited potential for improvement, likely due to insufficient target features. In the future, we plan to combine high-frequency event frames with low-frequency traditional image sequences to enhance feature extraction and improve detection accuracy for dim, small targets.
Author Contributions
Conceptualization, P.R. and L.G.; methodology, L.G. and X.C; software, L.G.; validation, L.G., C.G. and F.L.; formal analysis, C.G.; investigation, F.L.; resources, P.R.; data curation, Y.S.; writing—original draft preparation, L.G.; writing—review and editing, P.R. and X.C.; visualization, L.G.; supervision, X.C.; project administration, P.R.; funding acquisition, P.R. and X.C. All authors have read and agreed to the published version of the manuscript.
Funding
This research was supported by National Natural Science Foundation of China (Grant No. 62175251), Talent Plan of Shanghai Branch, Chinese Academy of Sciences (CASSHB-QNPD-2023-007), National Key Research and Development Program of China (No. 2021YFA0715501), and Innovation Project of Shanghai Institute of Technical Physics of the Chinese Academy of Sciences (No. CX-435).
Data Availability Statement
The SITP-QLEF dataset is available at https://github.com/Joyce-Lan88/SITP-QLEF.
Conflicts of Interest
The authors declare no conflicts of interest.
References
- Loconsole, M.; Ferrante, F.; Giacomazzi, D.; De Agrò, M. Independence and synergy of spatial attention in the two visual systems of jumping spiders. J. Exp. Biol. 2024, 227. [Google Scholar] [CrossRef] [PubMed]
- Itti, L.; Koch, C.; Niebur, E. A model of saliency-based visual attention for rapid scene analysis. IEEE Trans. Pattern Anal. Mach. Intell. 1998, 20, 1254–1259. [Google Scholar] [CrossRef]
- Nishio, K.; Yonezu, H.; Furukawa, Y. Analog integrated circuit for motion detection with simple-shape recognition based on frog vision system. Opt. Rev. 2007, 14, 271–281. [Google Scholar] [CrossRef]
- Fu, H.; Li, D.; Zhang, X. Research on moving object detection based on frog’s eyes. In Proceedings of the 2008 International Conference on Optical Instruments and Technology: Optical Systems and Optoelectronic Instruments, Beijing, China, 16–19 November 2008; SPIE: Bellingham, WA, USA, 2009; Volume 7156, pp. 326–334. [Google Scholar]
- Xi, X.; Jun, H.; Yan, Z. Design of large field of view and high-resolution compound eye optical system. J. Appl. Opt. 2024, 45, 314–320. [Google Scholar] [CrossRef]
- Zhang, L.; Zhan, H.; Liu, X.; Cao, H.; Xing, F.; You, Z. A planar compound eye based microsystem for high precision 3D perception. PhotoniX 2024, 5, 21. [Google Scholar] [CrossRef]
- Lettvin, J.Y.; Maturana, H.R.; McCulloch, W.S.; Pitts, W.H. What the frog’s eye tells the frog’s brain. Proc. IRE 1959, 47, 1940–1951. [Google Scholar] [CrossRef]
- Posch, C.; Serrano-Gotarredona, T.; Linares-Barranco, B.; Delbruck, T. Retinomorphic event-based vision sensors: Bioinspired cameras with spiking output. Proc. IEEE 2014, 102, 1470–1484. [Google Scholar] [CrossRef]
- Gallego, G.; Delbrück, T.; Orchard, G.; Bartolozzi, C.; Taba, B.; Censi, A.; Leutenegger, S.; Davison, A.J.; Conradt, J.; Daniilidis, K.; et al. Event-based vision: A survey. IEEE Trans. Pattern Anal. Mach. Intell. 2020, 44, 154–180. [Google Scholar] [CrossRef]
- Cazzato, D.; Bono, F. An Application-Driven Survey on Event-Based Neuromorphic Computer Vision. Information 2024, 15, 472. [Google Scholar] [CrossRef]
- Chen, G.; Cao, H.; Conradt, J.; Tang, H.; Rohrbein, F.; Knoll, A. Event-based neuromorphic vision for autonomous driving: A paradigm shift for bio-inspired visual sensing and perception. IEEE Signal Process. Mag. 2020, 37, 34–49. [Google Scholar] [CrossRef]
- Shariff, W.; Dilmaghani, M.S.; Kielty, P.; Moustafa, M.; Lemley, J.; Corcoran, P. Event Cameras in Automotive Sensing: A Review. IEEE Access 2024, 12, 51275–51306. [Google Scholar] [CrossRef]
- Zhou, B.; Jiang, J. Deep Event-based Object Detection in Autonomous Driving: A Survey. arXiv 2024, arXiv:2405.03995. [Google Scholar]
- Dimitrova, R.S.; Gehrig, M.; Brescianini, D.; Scaramuzza, D. Towards low-latency high-bandwidth control of quadrotors using event cameras. In Proceedings of the 2020 IEEE International Conference on Robotics and Automation (ICRA), Paris, France, 31 May–31 August 2020; IEEE: Piscataway, NJ, USA, 2020; pp. 4294–4300. [Google Scholar]
- Schlack, T.; Pawlowski, L.; Ashok, A. Hybrid event and frame-based system for target detection, tracking, and identification. In Proceedings of the Unconventional Imaging, Sensing, and Adaptive Optics 2023, San Diego, CA, USA, 21–24 August 2023; SPIE: Bellingham, WA, USA, 2023; Volume 12693, pp. 303–311. [Google Scholar]
- Cai, X.; Xu, J.; Deng, K.; Lan, H.; Wu, Y.; Zhuge, X.; Yang, Z. TrinitySLAM: On-board Real-time Event-image Fusion SLAM System for Drones. ACM Trans. Sens. Networks 2024, 20, 1–22. [Google Scholar] [CrossRef]
- Tom, V.T.; Peli, T.; Leung, M.; Bondaryk, J.E. Morphology-based algorithm for point target detection in infrared backgrounds. In Proceedings of the Signal and Data Processing of Small Targets 1993, Orlando, FL, USA, 12–14 April 1993; SPIE: Bellingham, WA, USA, 1993; Volume 1954, pp. 2–11. [Google Scholar]
- Deshpande, S.D.; Er, M.H.; Venkateswarlu, R.; Chan, P. Max-mean and max-median filters for detection of small targets. In Proceedings of the Signal and Data Processing of Small Targets 1999, Denver, CO, USA, 19–23 July 1999; SPIE: Bellingham, WA, USA, 1999; Volume 3809, pp. 74–83. [Google Scholar]
- Fan, X.; Xu, Z.; Zhang, J.; Huang, Y.; Peng, Z. Dim small targets detection based on self-adaptive caliber temporal-spatial filtering. Infrared Phys. Technol. 2017, 85, 465–477. [Google Scholar] [CrossRef]
- Wu, H.; Meng, Y.; Niu, B.; Ren, J.; Shen, M. A Novel Self-Adaptive Vehicle Segmentation Method in Traffic Video with Symmetric Frame Difference Constraints. In Proceedings of the 2023 8th International Conference on Image, Vision and Computing (ICIVC), Dalian, China, 27–29 July 2023; IEEE: Piscataway, NJ, USA, 2023; pp. 337–342. [Google Scholar]
- Lei, L.; Zhijian, H. Infrared dim target detection technology based on background estimate. Infrared Phys. Technol. 2014, 62, 59–64. [Google Scholar] [CrossRef]
- Wang, X.; Peng, Z.; Zhang, P.; He, Y. Infrared small target detection via nonnegativity-constrained variational mode decomposition. IEEE Geosci. Remote Sens. Lett. 2017, 14, 1700–1704. [Google Scholar] [CrossRef]
- Moradi, S.; Moallem, P.; Sabahi, M.F. Fast and robust small infrared target detection using absolute directional mean difference algorithm. Signal Process. 2020, 177, 107727. [Google Scholar] [CrossRef]
- Chen, C.P.; Li, H.; Wei, Y.; Xia, T.; Tang, Y.Y. A local contrast method for small infrared target detection. IEEE Trans. Geosci. Remote Sens. 2013, 52, 574–581. [Google Scholar] [CrossRef]
- Wei, Y.; You, X.; Li, H. Multiscale patch-based contrast measure for small infrared target detection. Pattern Recognit. 2016, 58, 216–226. [Google Scholar] [CrossRef]
- Han, J.; Yu, Y.; Liang, K.; Zhang, H. Infrared small-target detection under complex background based on subblock-level ratio-difference joint local contrast measure. Opt. Eng. 2018, 57, 103105. [Google Scholar] [CrossRef]
- Chen, L.; Chen, X.; Rao, P.; Guo, L.; Huang, M. Space-based infrared aerial target detection method via interframe registration and spatial local contrast. Opt. Lasers Eng. 2022, 158, 107131. [Google Scholar] [CrossRef]
- Gao, C.; Meng, D.; Yang, Y.; Wang, Y.; Zhou, X.; Hauptmann, A.G. Infrared patch-image model for small target detection in a single image. IEEE Trans. Image Process. 2013, 22, 4996–5009. [Google Scholar] [CrossRef] [PubMed]
- Liu, T.; Yang, J.; Li, B.; Xiao, C.; Sun, Y.; Wang, Y.; An, W. Nonconvex tensor low-rank approximation for infrared small target detection. IEEE Trans. Geosci. Remote Sens. 2021, 60, 5614718. [Google Scholar] [CrossRef]
- Luo, Y.; Li, X.; Chen, S.; Xia, C.; Zhao, L. IMNN-LWEC: A novel infrared small target detection based on spatial–temporal tensor model. IEEE Trans. Geosci. Remote Sens. 2022, 60, 5004022. [Google Scholar] [CrossRef]
- Wu, F.; Yu, H.; Liu, A.; Luo, J.; Peng, Z. Infrared small target detection using spatiotemporal 4-D tensor train and ring unfolding. IEEE Trans. Geosci. Remote Sens. 2023, 61, 5002922. [Google Scholar] [CrossRef]
- Sun, X.; Yu, Y.; Cheng, Q. Low-rank Multimodal Remote Sensing Object Detection with Frequency Filtering Experts. IEEE Trans. Geosci. Remote. Sens. 2024, 62, 5637114. [Google Scholar] [CrossRef]
- Zhao, M.; Li, W.; Li, L.; Hu, J.; Ma, P.; Tao, R. Single-frame infrared small-target detection: A survey. IEEE Geosci. Remote Sens. Mag. 2022, 10, 87–119. [Google Scholar] [CrossRef]
- Chen, S.; Ji, L.; Zhu, J.; Ye, M.; Yao, X. SSTNet: Sliced spatio-temporal network with cross-slice ConvLSTM for moving infrared dim-small target detection. IEEE Trans. Geosci. Remote. Sens. 2024, 62, 5000912. [Google Scholar] [CrossRef]
- Ren, S.; He, K.; Girshick, R.; Sun, J. Faster R-CNN: Towards real-time object detection with region proposal networks. IEEE Trans. Pattern Anal. Mach. Intell. 2016, 39, 1137–1149. [Google Scholar] [CrossRef]
- Lin, T.Y.; Dollár, P.; Girshick, R.; He, K.; Hariharan, B.; Belongie, S. Feature pyramid networks for object detection. In Proceedings of the IEEE Conference on Computer Vision and Pattern Recognition, Honolulu, HI, USA, 21–26 July 2017; pp. 2117–2125. [Google Scholar]
- Cai, Z.; Vasconcelos, N. Cascade R-CNN: High quality object detection and instance segmentation. IEEE Trans. Pattern Anal. Mach. Intell. 2019, 43, 1483–1498. [Google Scholar] [CrossRef]
- Liu, W.; Anguelov, D.; Erhan, D.; Szegedy, C.; Reed, S.; Fu, C.Y.; Berg, A.C. Ssd: Single shot multibox detector. In Proceedings of the Computer Vision—ECCV 2016: 14th European Conference, Amsterdam, The Netherlands, 11–14 October 2016; Proceedings, Part I 14. Springer: Berlin/Heidelberg, Germany, 2016; pp. 21–37. [Google Scholar]
- Ross, T.Y.; Dollár, G. Focal loss for dense object detection. In Proceedings of ICCV 2017 (Proceedings of the IEEE International Conference on Computer Vision), Venice, Italy, 22–29 October 2017; pp. 2980–2988. [Google Scholar]
- Cheng, T.; Song, L.; Ge, Y.; Liu, W.; Wang, X.; Shan, Y. Yolo-world: Real-time open-vocabulary object detection. In Proceedings of the IEEE/CVF Conference on Computer Vision and Pattern Recognition, Seattle, WA, USA, 18–24 June 2024; pp. 16901–16911. [Google Scholar]
- Wang, C.Y.; Yeh, I.H.; Mark Liao, H.Y. Yolov9: Learning what you want to learn using programmable gradient information. In Proceedings of the 18th European Conference on Computer Vision, Milan, Italy, September 29–October 4 2024; Springer: Berlin/Heidelberg, Germany, 2025; pp. 1–21. [Google Scholar]
- Wang, A.; Chen, H.; Liu, L.; Chen, K.; Lin, Z.; Han, J.; Ding, G. Yolov10: Real-time end-to-end object detection. arXiv 2024, arXiv:2405.14458. [Google Scholar]
- Carion, N.; Massa, F.; Synnaeve, G.; Usunier, N.; Kirillov, A.; Zagoruyko, S. End-to-end object detection with transformers. In Proceedings of the European Conference on Computer Vision, Glasgow, UK, 23–28 August 2020; Springer: Berlin/Heidelberg, Germany, 2020; pp. 213–229. [Google Scholar]
- Zhao, Y.; Lv, W.; Xu, S.; Wei, J.; Wang, G.; Dang, Q.; Liu, Y.; Chen, J. Detrs beat yolos on real-time object detection. In Proceedings of the IEEE/CVF Conference on Computer Vision and Pattern Recognition, Seattle, WA, USA, 16–22 June 2024; pp. 16965–16974. [Google Scholar]
- Wang, H.; Qian, H.; Feng, S. GAN-STD: Small target detection based on generative adversarial network. J. Real-Time Image Process. 2024, 21, 65. [Google Scholar] [CrossRef]
- Hui, B.; Song, Z.; Fan, H.; Zhong, P.; Hu, W.; Zhang, X.; Ling, J.; Su, H.; Jin, W.; Zhang, Y.; et al. A dataset for infrared detection and tracking of dim-small aircraft targets under ground/air background. China Sci. Data 2020, 5, 291–302. [Google Scholar] [CrossRef]
Disclaimer/Publisher’s Note: The statements, opinions and data contained in all publications are solely those of the individual author(s) and contributor(s) and not of MDPI and/or the editor(s). MDPI and/or the editor(s) disclaim responsibility for any injury to people or property resulting from any ideas, methods, instructions or products referred to in the content. |
© 2025 by the authors. Licensee MDPI, Basel, Switzerland. This article is an open access article distributed under the terms and conditions of the Creative Commons Attribution (CC BY) license (https://creativecommons.org/licenses/by/4.0/).