Author Contributions
Methodology, C.L.; Software, C.L.; Validation, C.L. and Z.Y.; Resources, C.L.; Data curation, C.L., Z.H., Z.Y. and M.C.; Writing—original draft, C.L.; Writing—review & editing, K.G., H.C. and Z.Z.; Visualization, Z.Y. All authors have read and agreed to the published version of the manuscript.
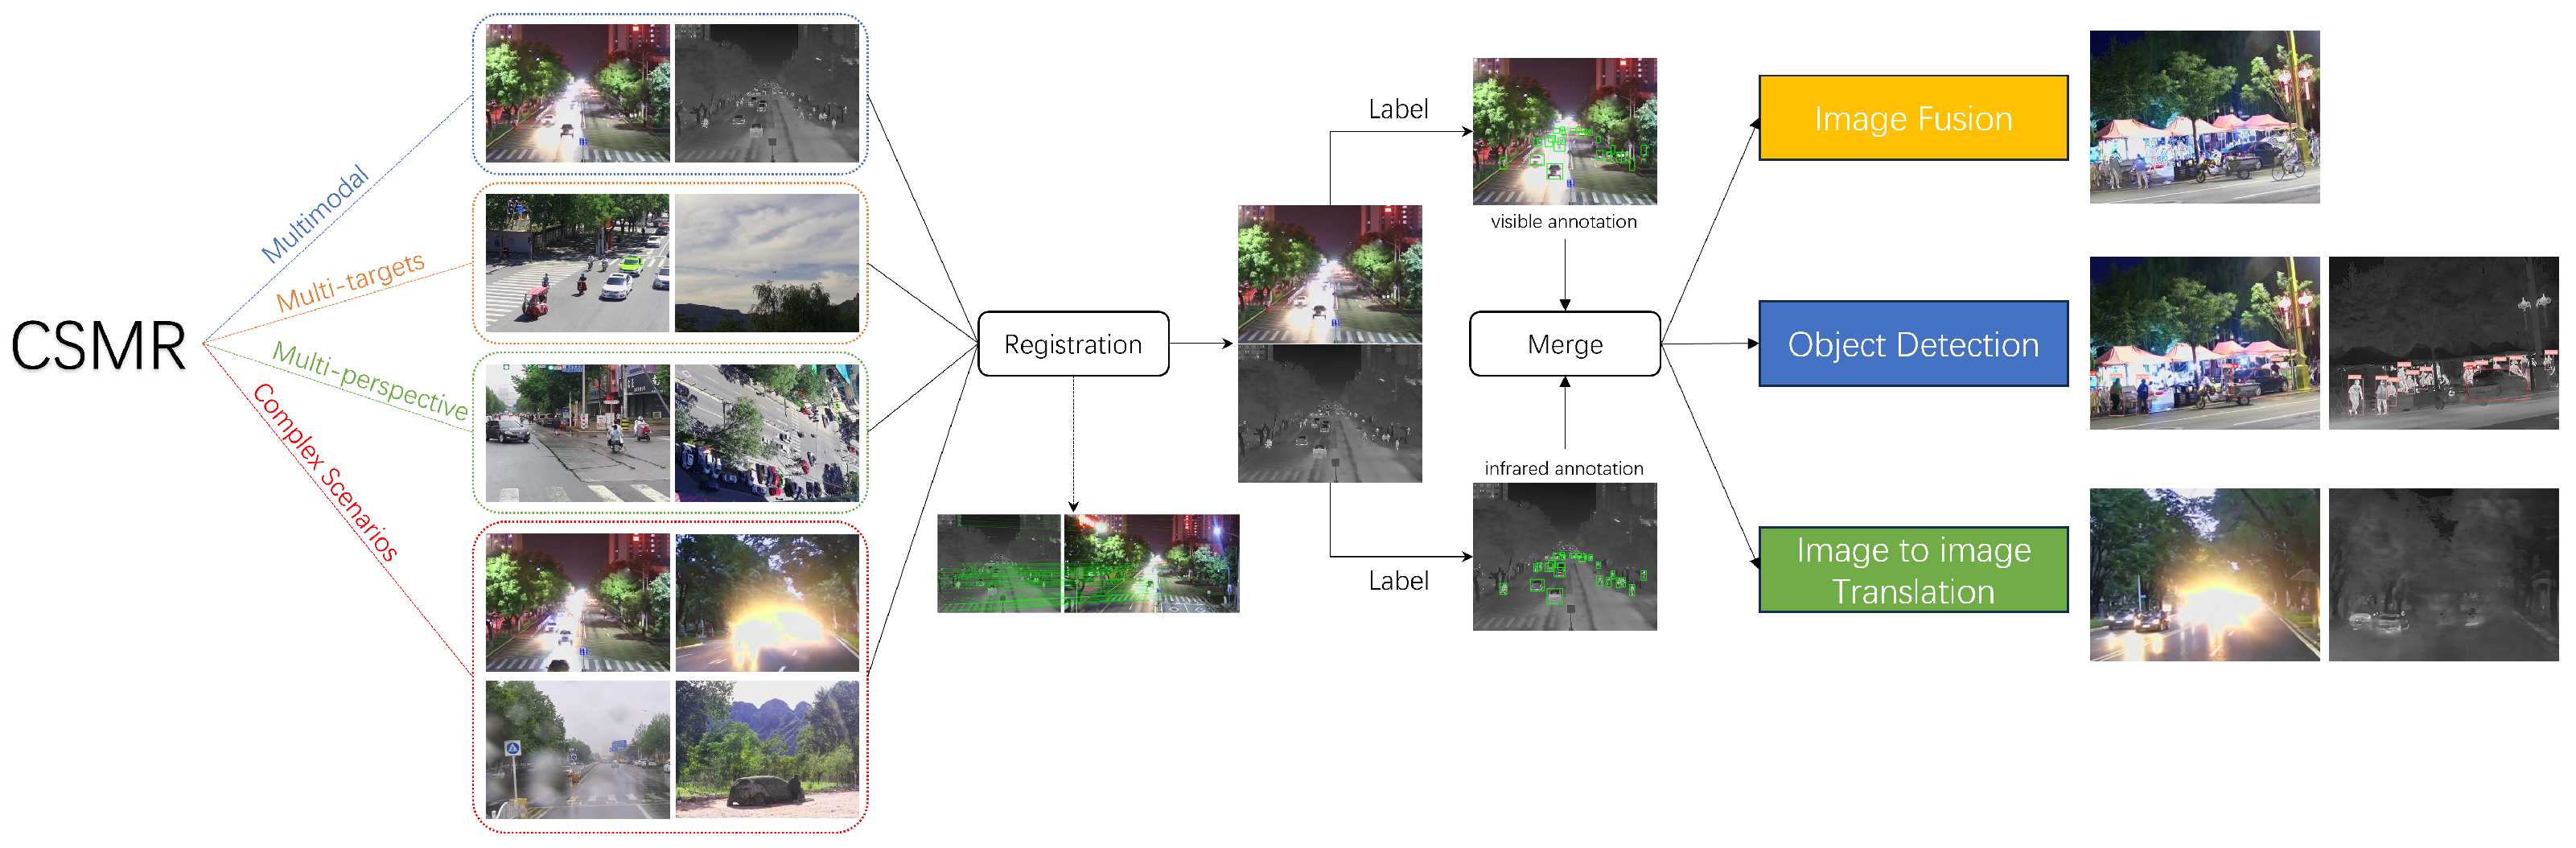
Figure 1.
The structure of our CSMR dataset. The original images first need to be registered and labeled. We test our dataset on three visual tasks: image fusion, object detection, and image-to-image translation.
Figure 1.
The structure of our CSMR dataset. The original images first need to be registered and labeled. We test our dataset on three visual tasks: image fusion, object detection, and image-to-image translation.
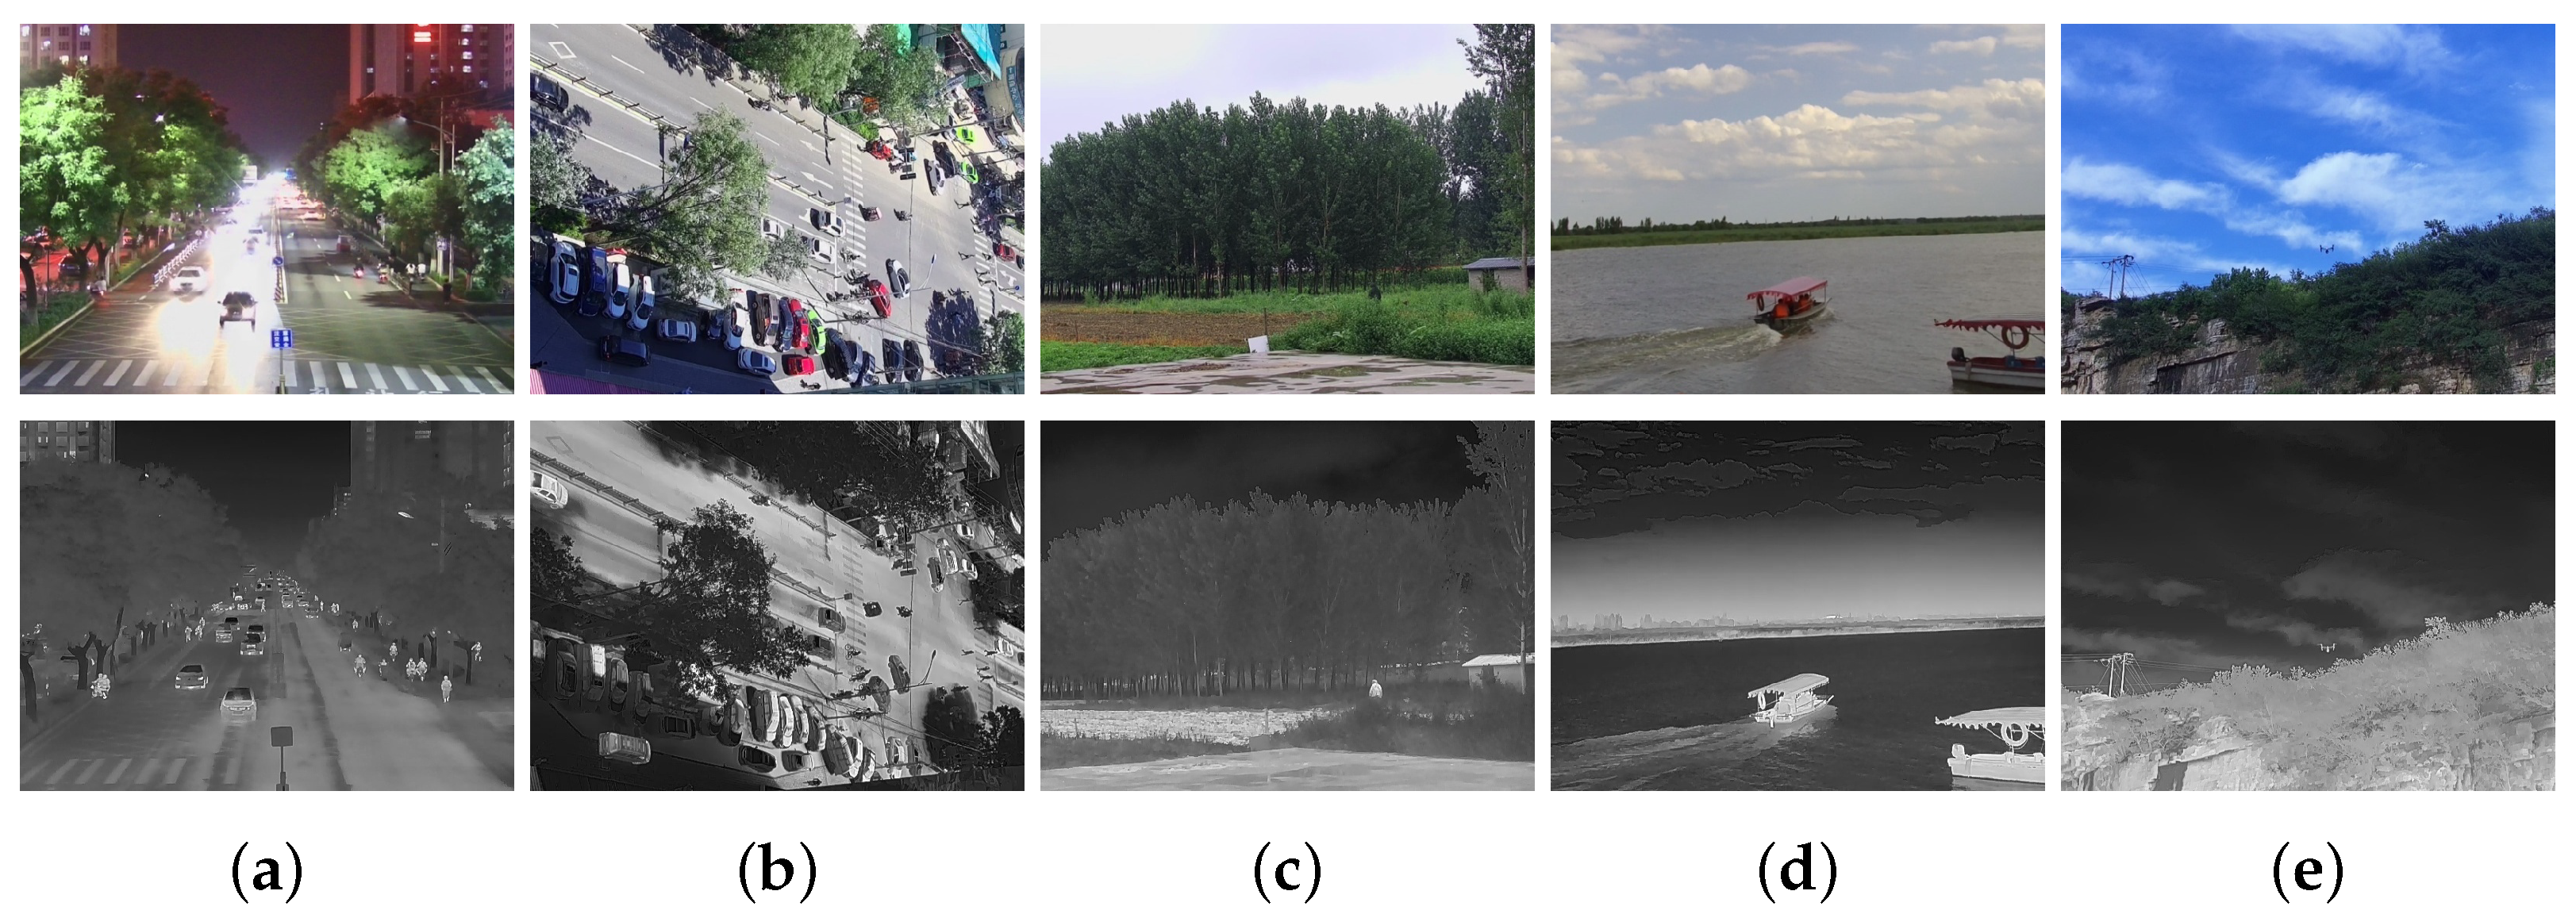
Figure 2.
Examples of the related datasets. The first row corresponds to the visible-light images and the second row corresponds to the infrared images. From left to right: (a) TNO, (b) OSU, (c) CVC-14, (d) KAIST, (e) FLIR, (f) LLVIP.
Figure 2.
Examples of the related datasets. The first row corresponds to the visible-light images and the second row corresponds to the infrared images. From left to right: (a) TNO, (b) OSU, (c) CVC-14, (d) KAIST, (e) FLIR, (f) LLVIP.
Figure 3.
Our collection equipment contains a binocular camera platform and a portable computer.
Figure 3.
Our collection equipment contains a binocular camera platform and a portable computer.
Figure 4.
Cameras for image collection.
Figure 4.
Cameras for image collection.
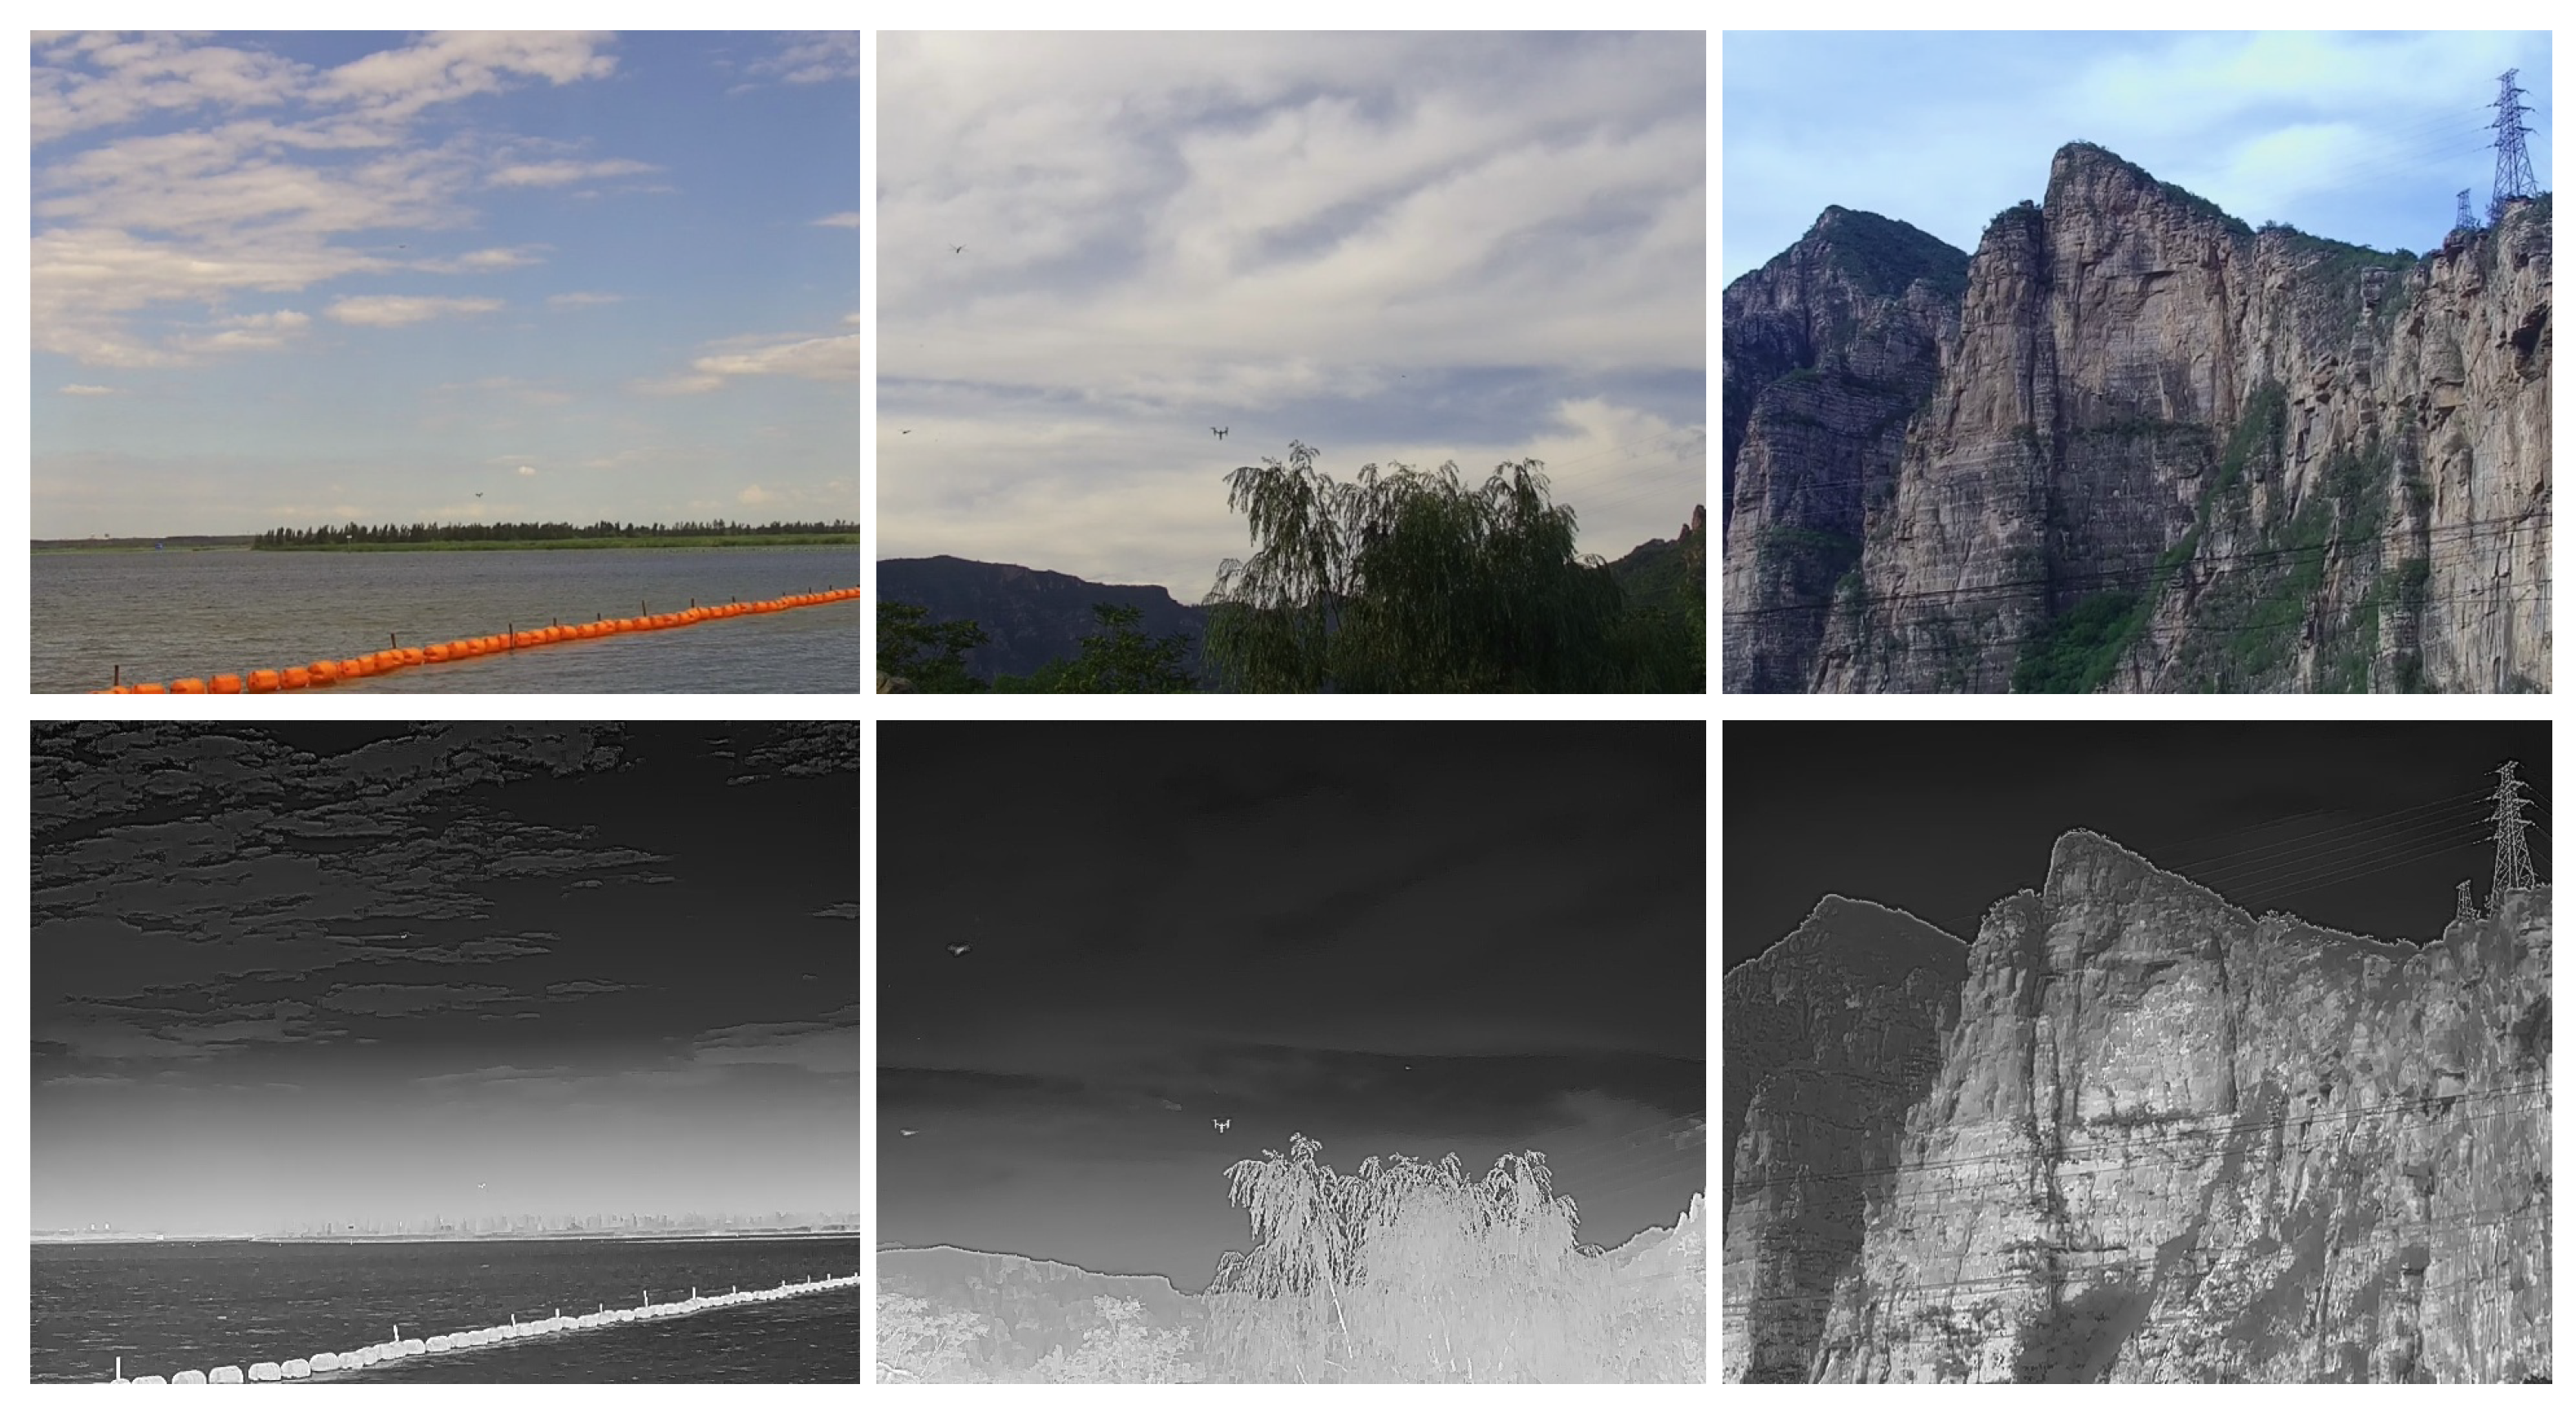
Figure 5.
Examples of the scenarios. The first row corresponds to the visible-light images and the second row corresponds to the infrared images. From left to right: (a) street at night, (b) intersection from top-down perspective, (c) disguised person in field, (d) waterside, (e) drone in sky.
Figure 5.
Examples of the scenarios. The first row corresponds to the visible-light images and the second row corresponds to the infrared images. From left to right: (a) street at night, (b) intersection from top-down perspective, (c) disguised person in field, (d) waterside, (e) drone in sky.
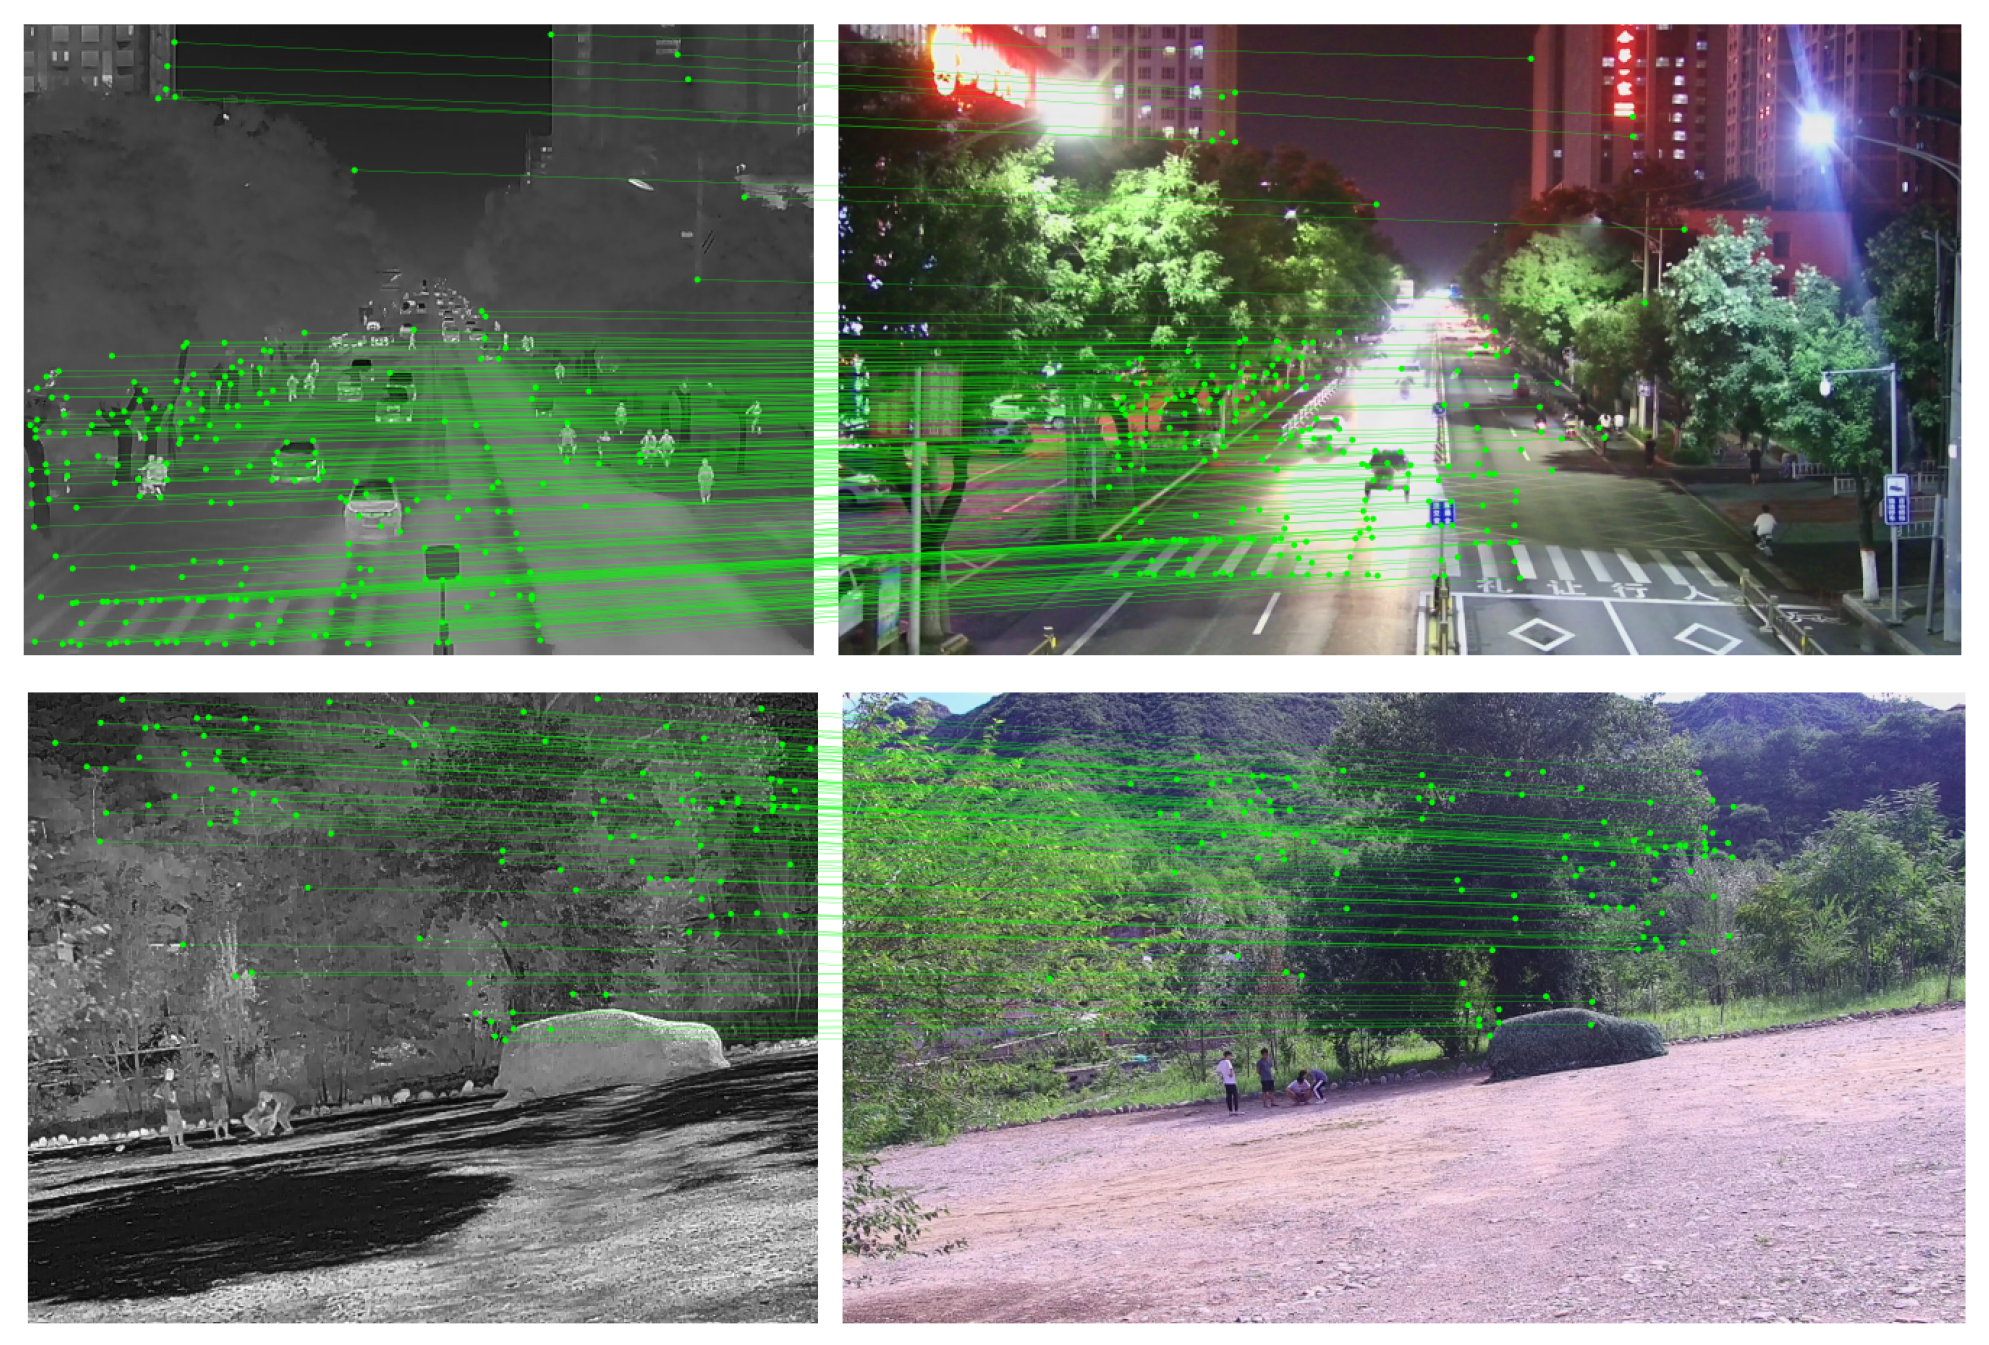
Figure 6.
Registration result of our dataset.
Figure 6.
Registration result of our dataset.
Figure 7.
Examples of drones in our CSMR dataset. The images in the first row are visible-light images. The images in the second row are infrared images.
Figure 7.
Examples of drones in our CSMR dataset. The images in the first row are visible-light images. The images in the second row are infrared images.
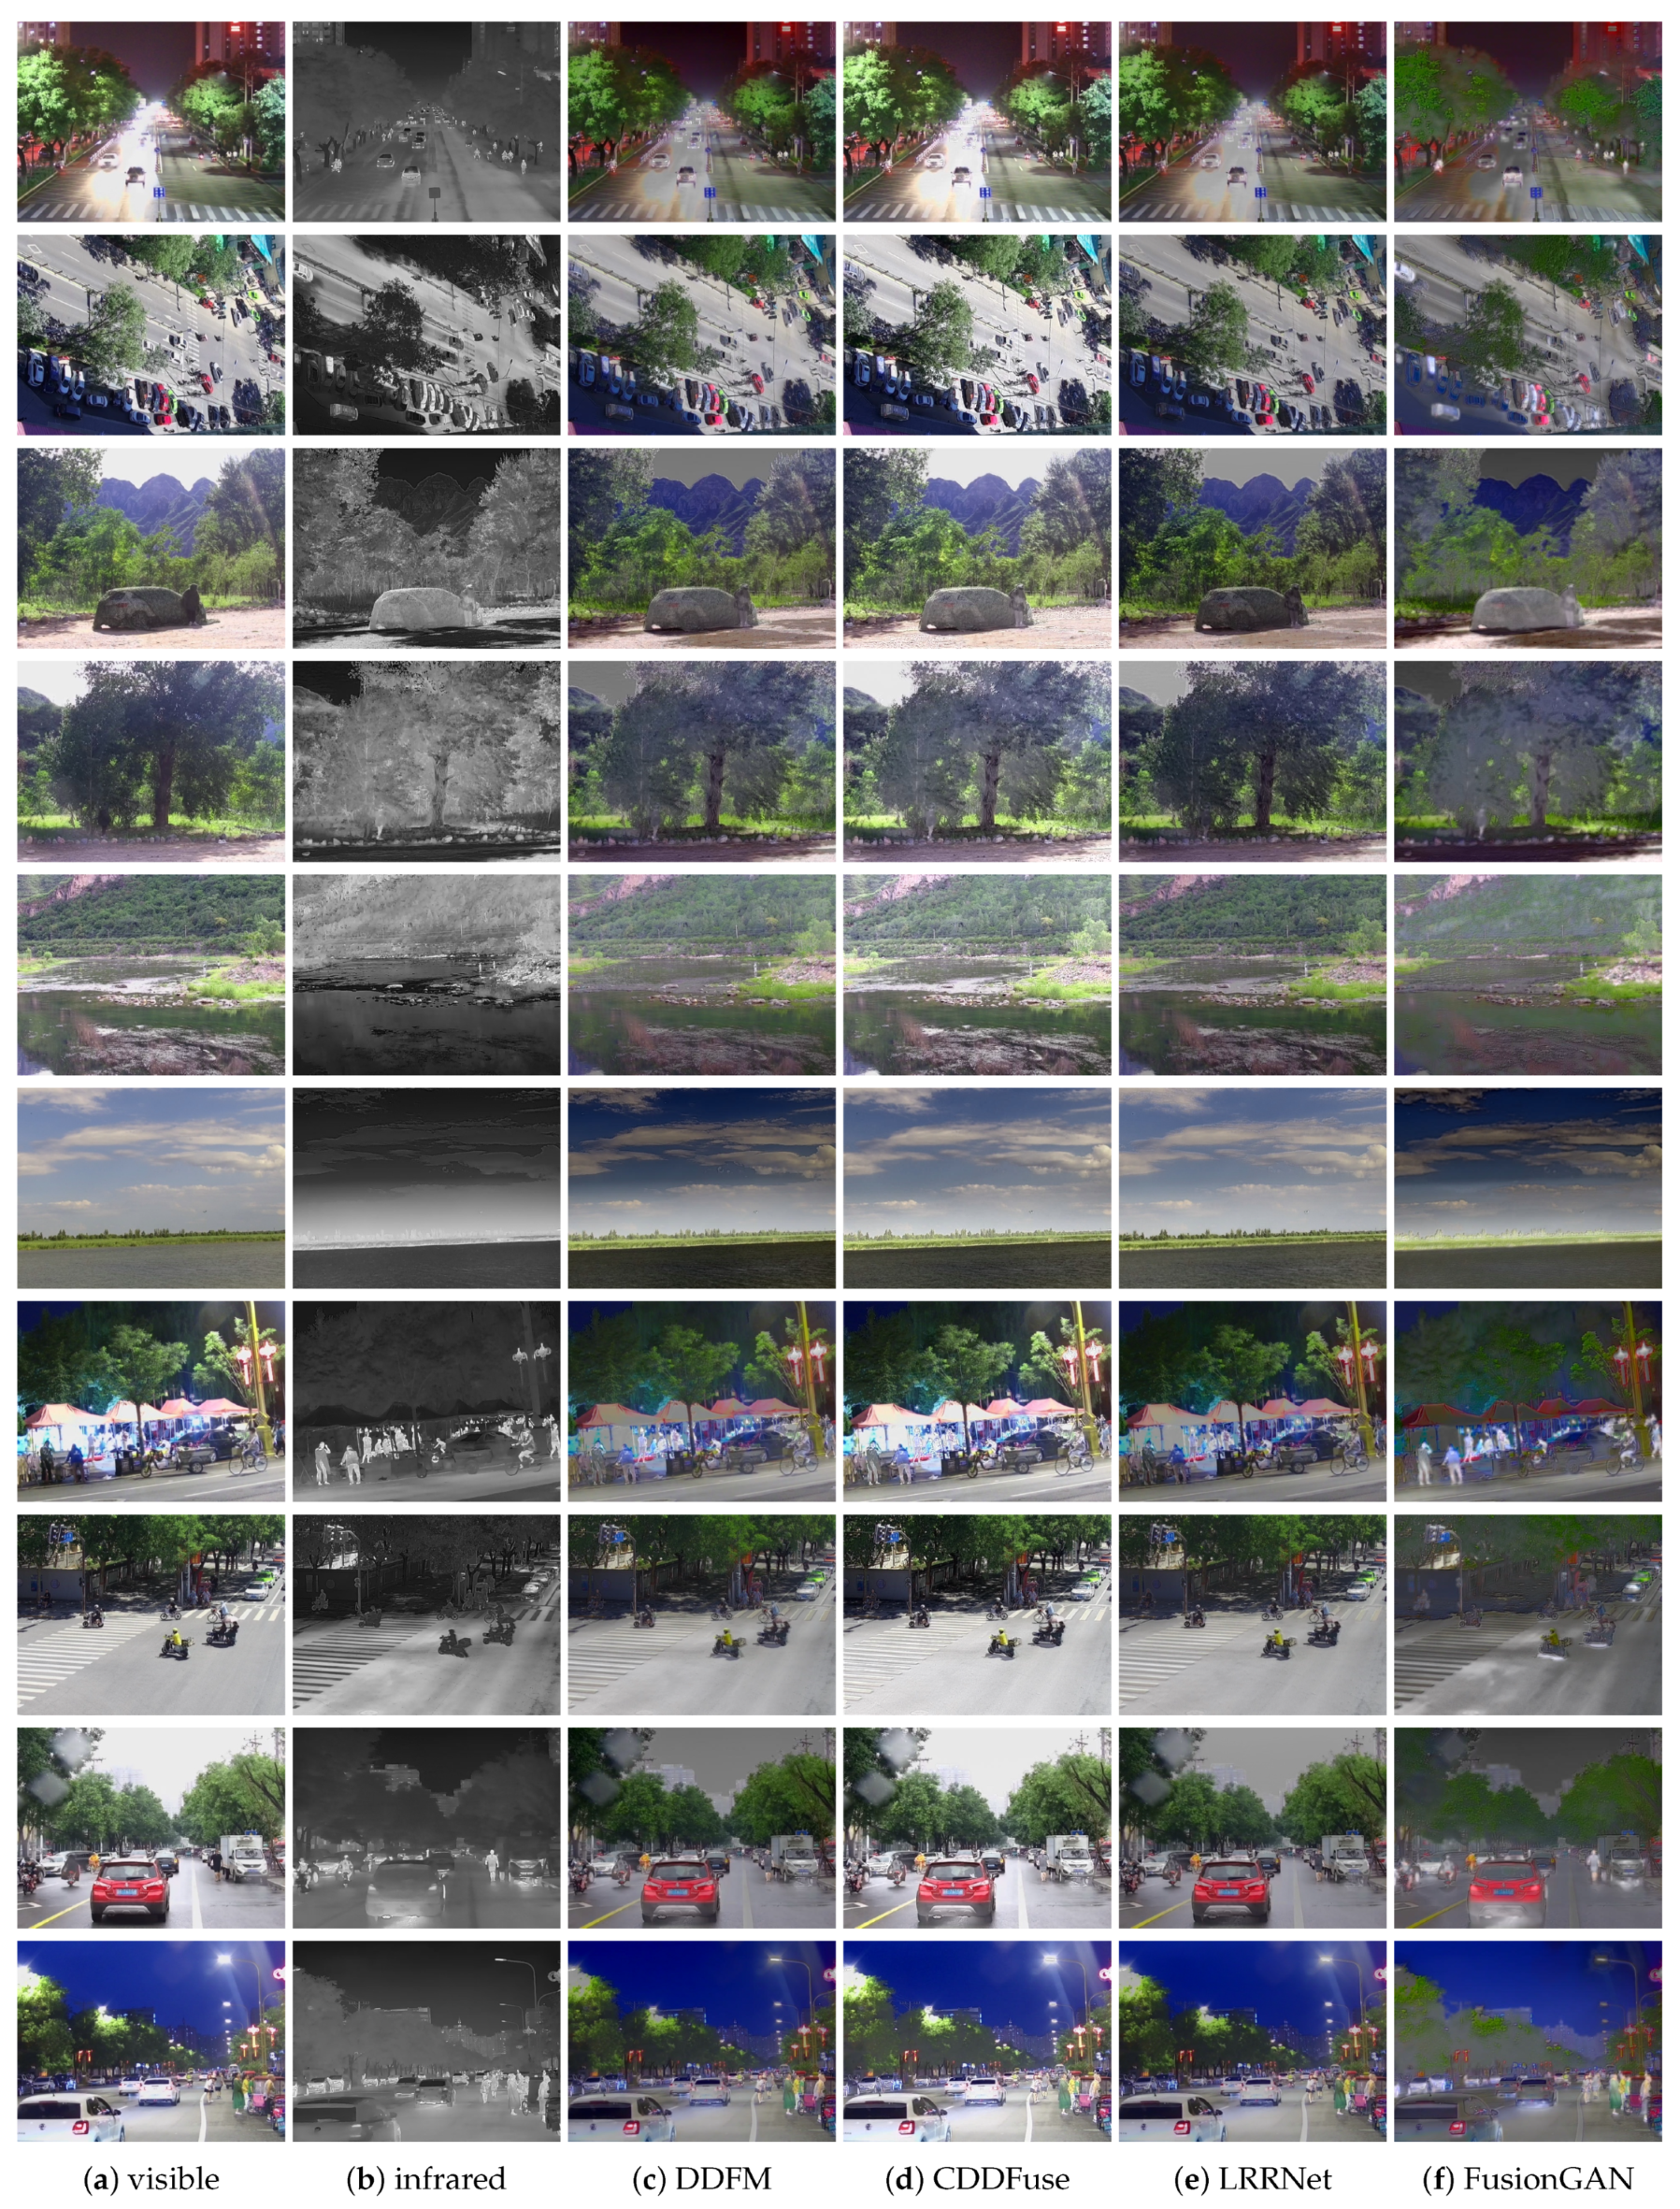
Figure 8.
Examples of fusion algorithms on our CSMR dataset.
Figure 8.
Examples of fusion algorithms on our CSMR dataset.
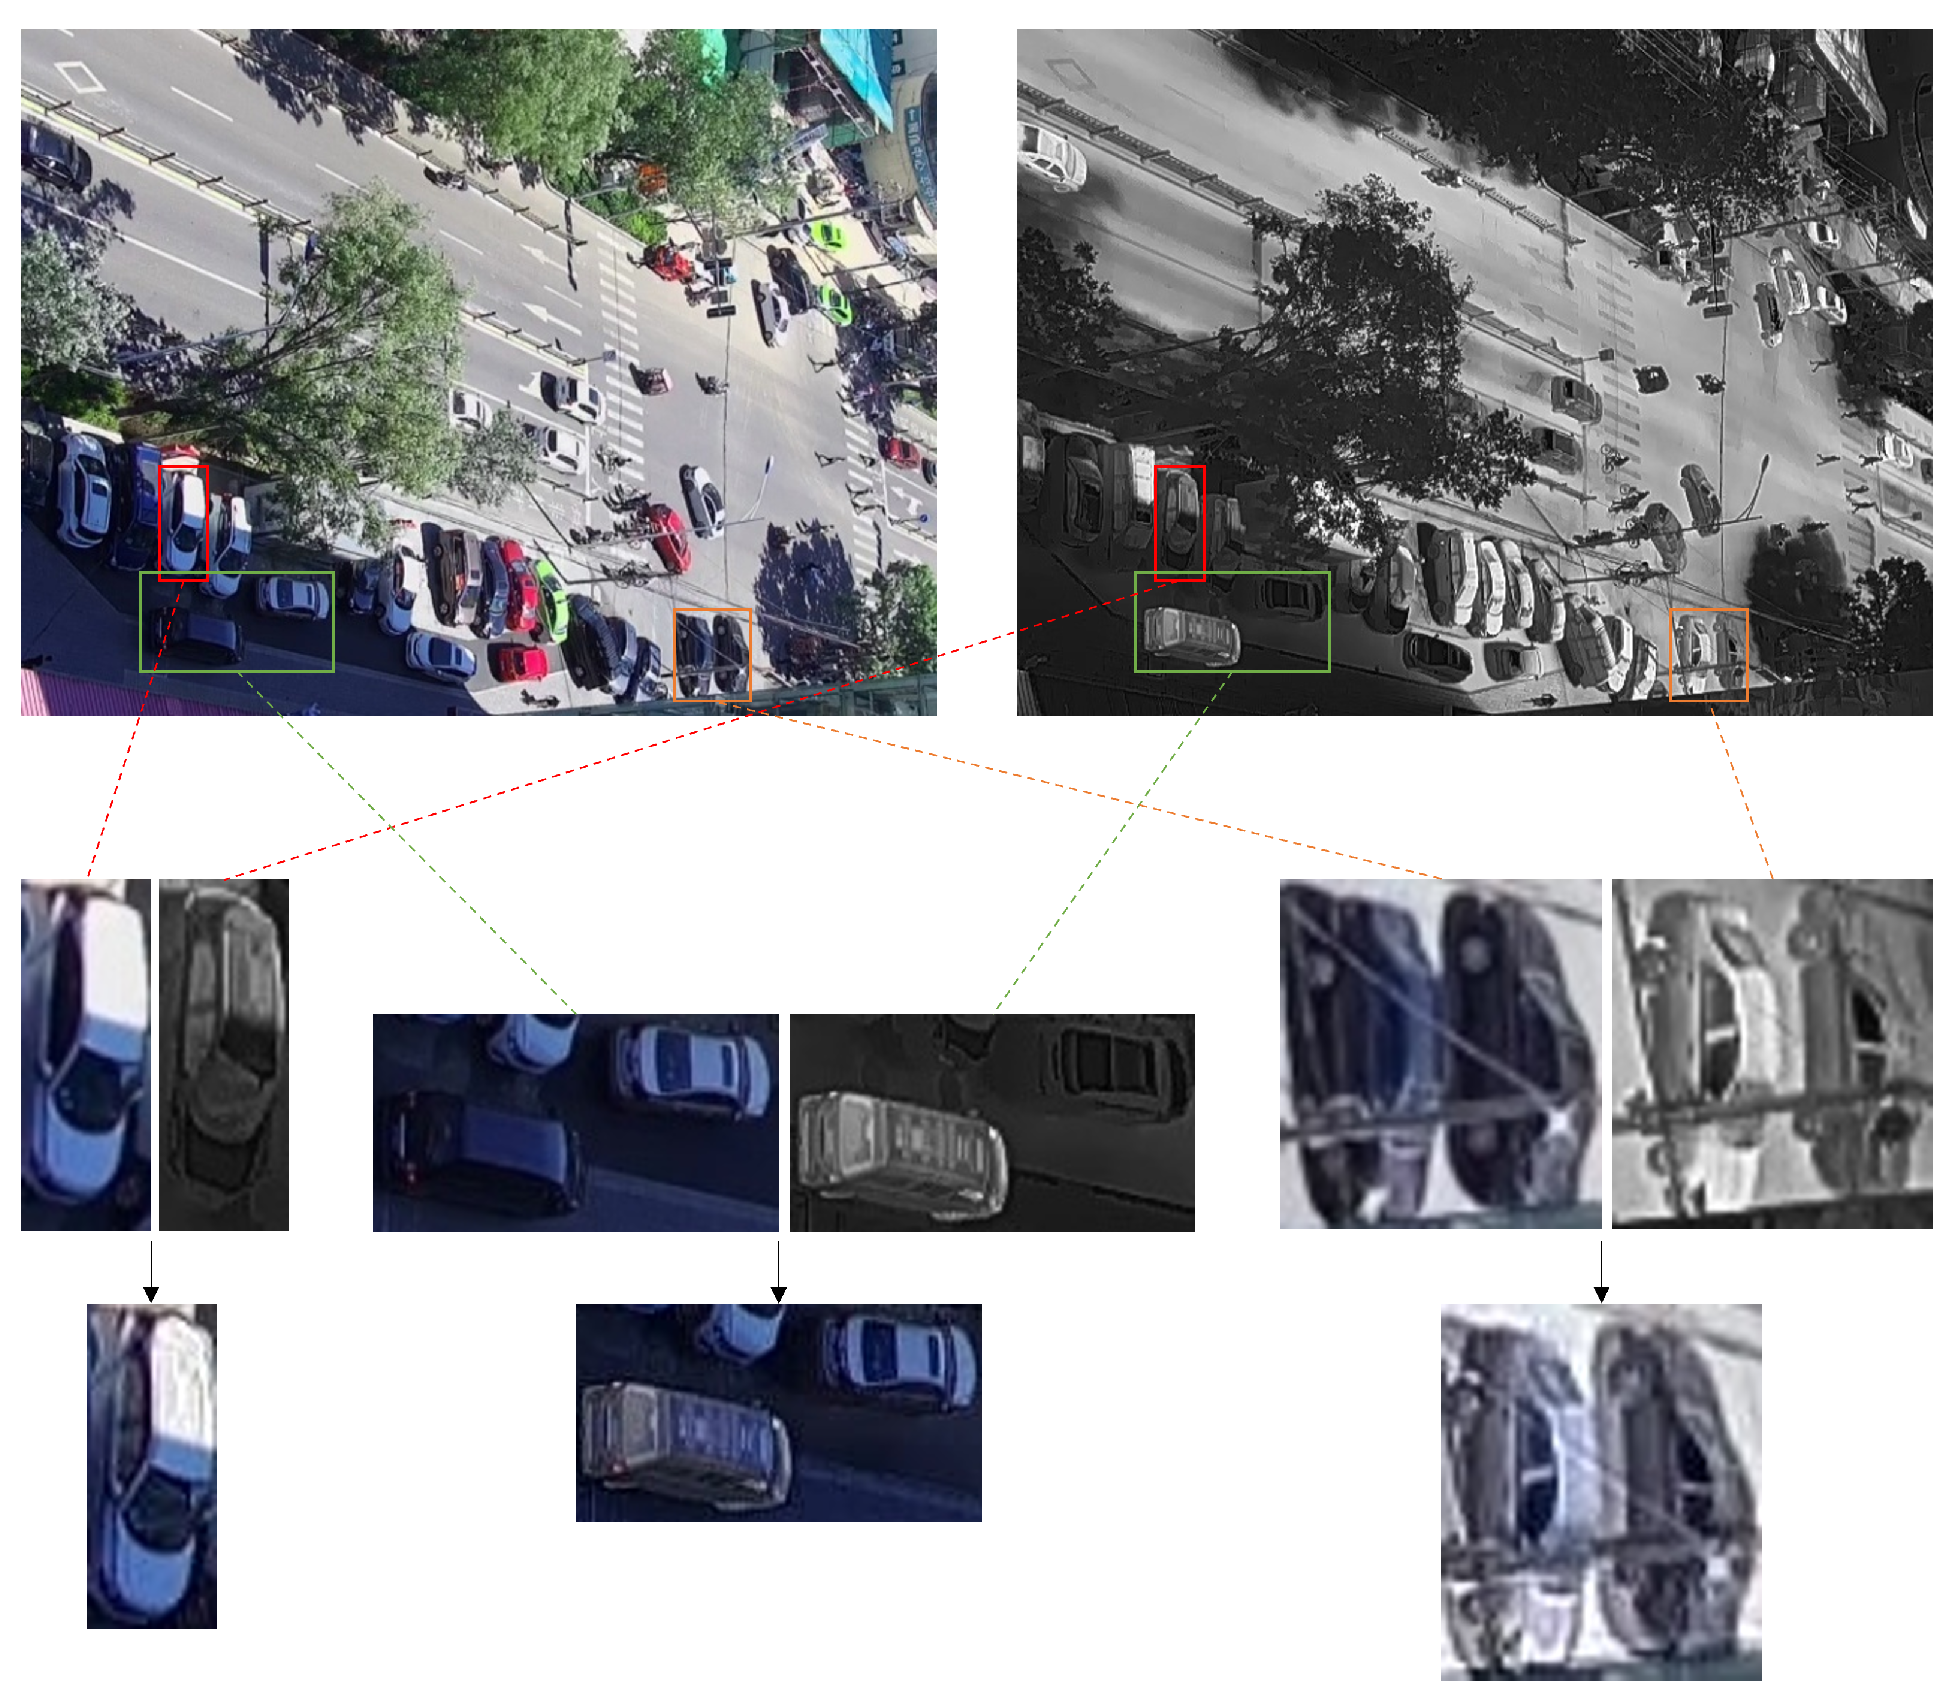
Figure 9.
Examples of “erratic temperature”. From left to right: a single car; two different-colored cars; two same-colored cars.
Figure 9.
Examples of “erratic temperature”. From left to right: a single car; two different-colored cars; two same-colored cars.
Figure 10.
Examples of pedestrian and car detection on our CSMR dataset.
Figure 10.
Examples of pedestrian and car detection on our CSMR dataset.
Figure 11.
Examples of failure cases.
Figure 11.
Examples of failure cases.
Figure 12.
Examples of drone detection on our CSMR dataset.
Figure 12.
Examples of drone detection on our CSMR dataset.
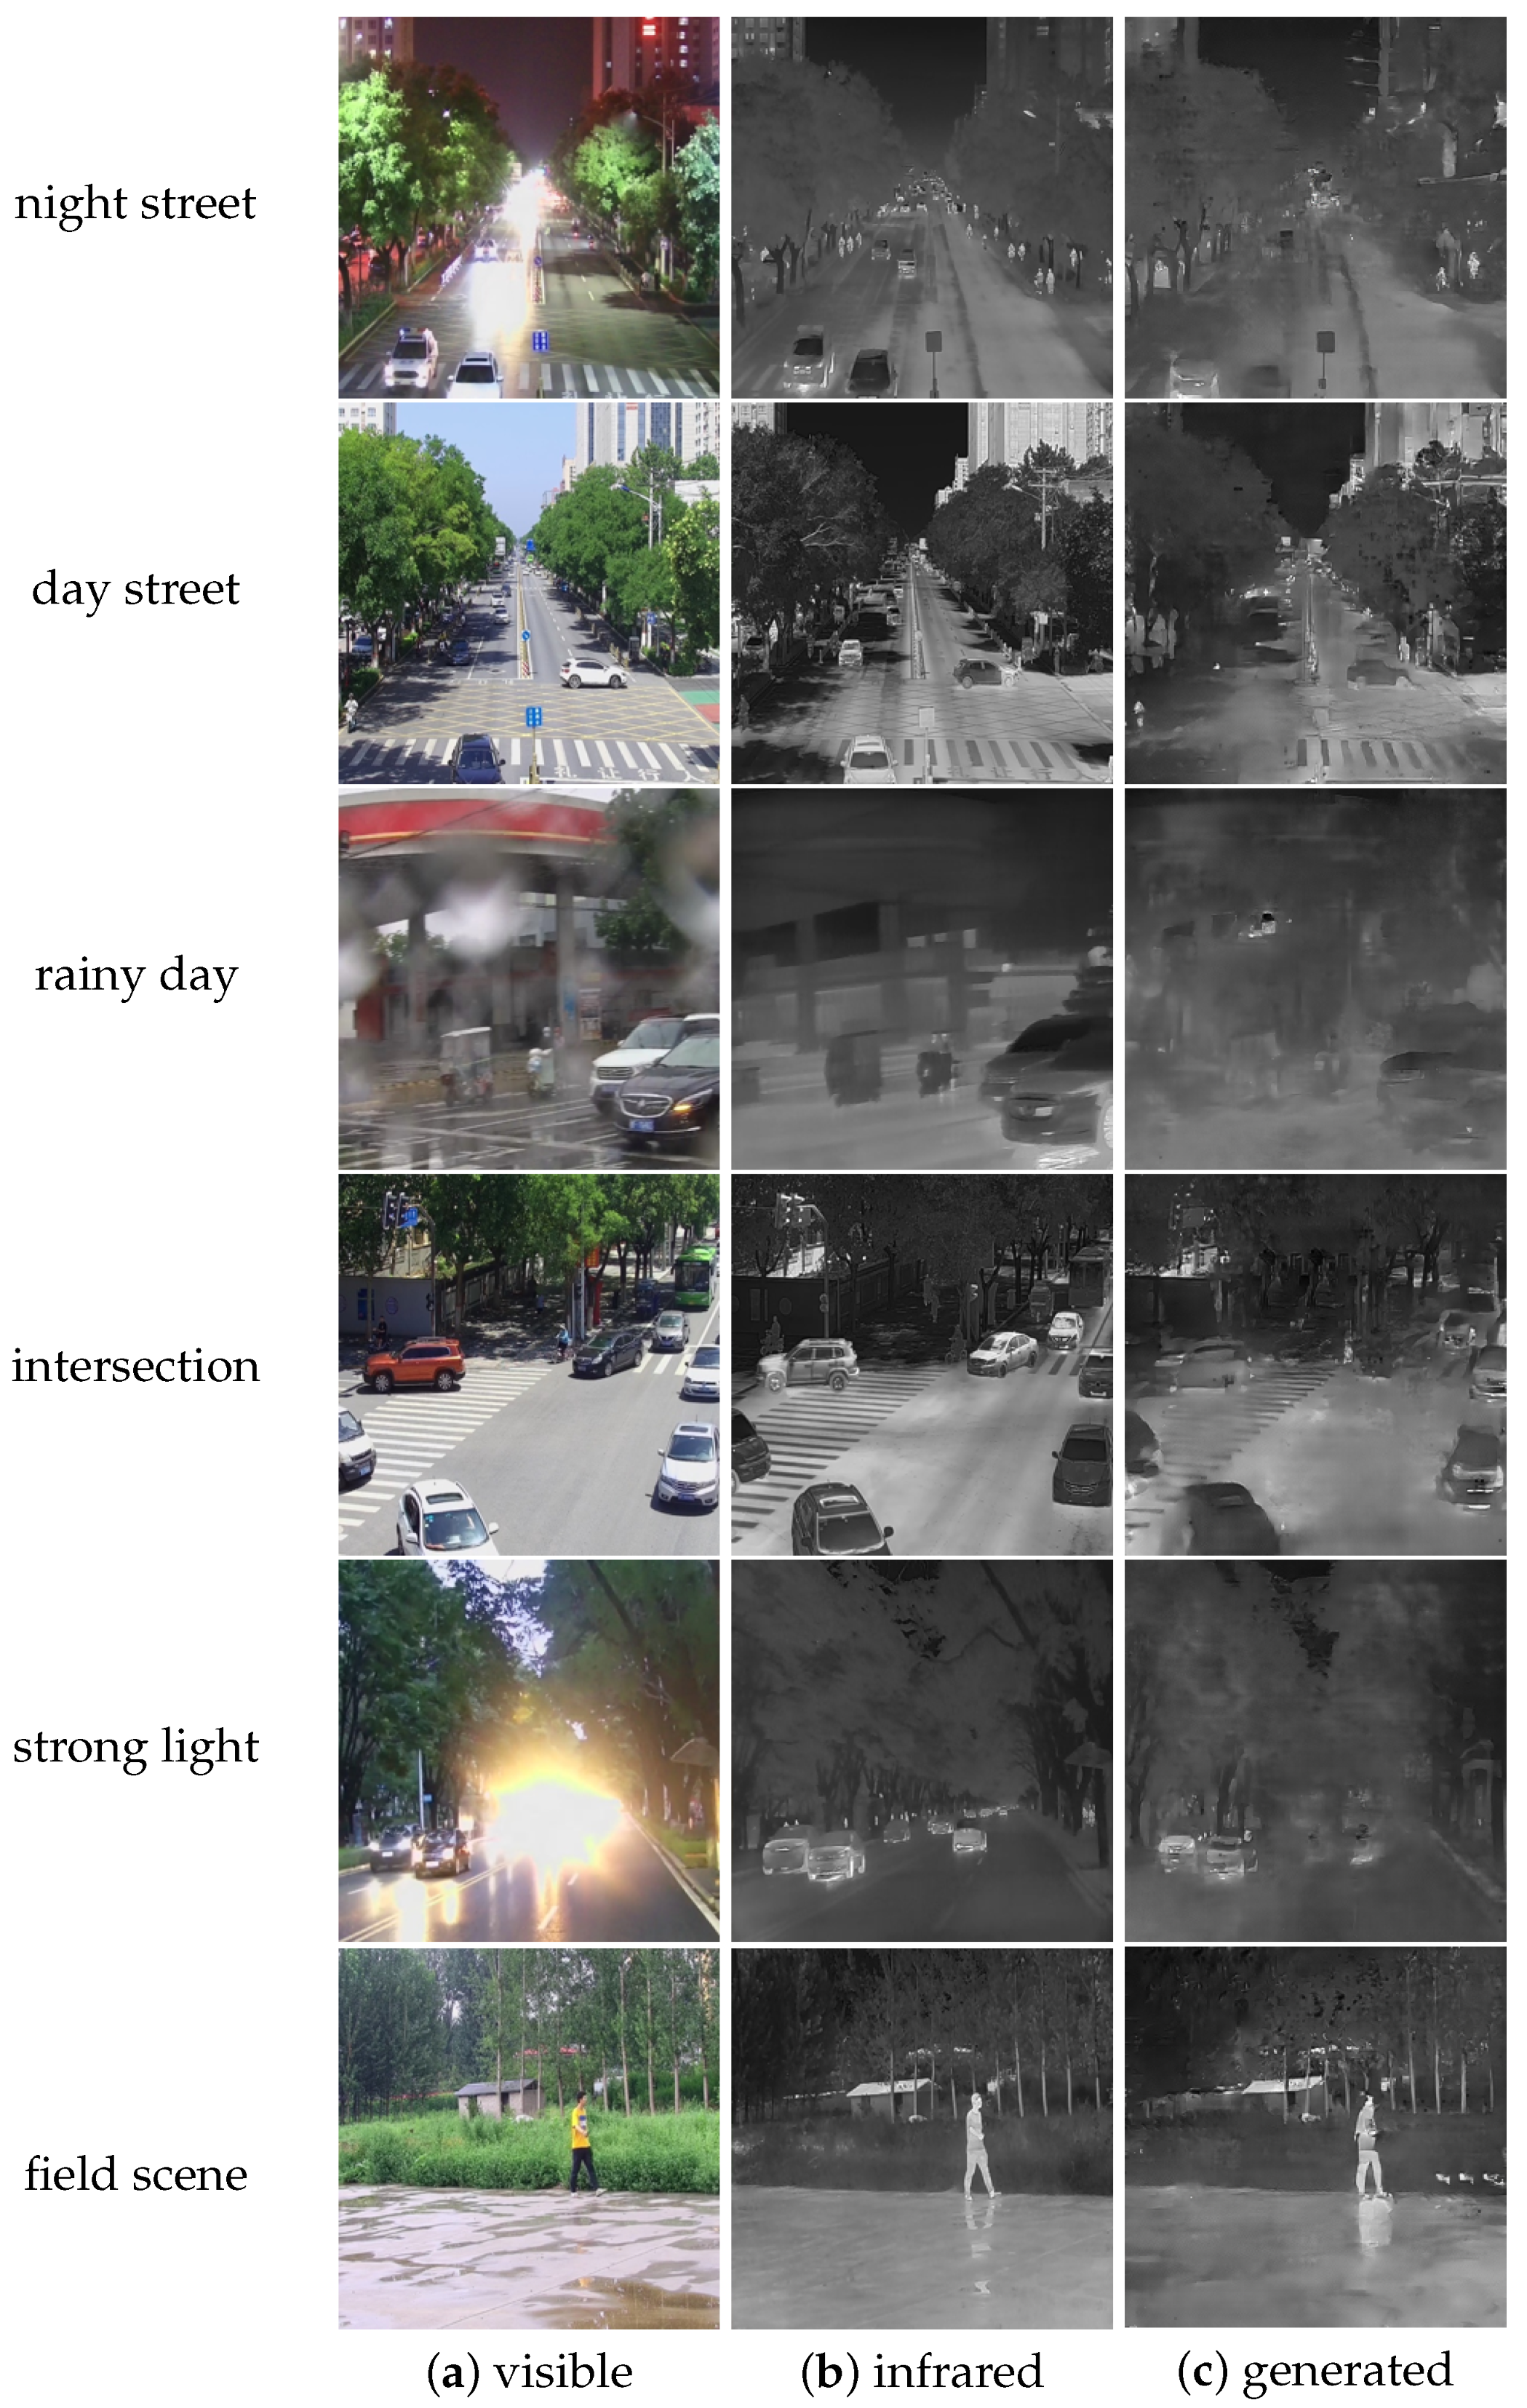
Figure 13.
Examples of image-to-image translation results on our CSMR dataset.
Figure 13.
Examples of image-to-image translation results on our CSMR dataset.
Table 1.
Comparison of our dataset and the existing multi-modal datasets, including TNO Image Fusion Dataset, OSU Color-Thermal Database, KAIST Multispectal Dataset, CVC-14, FLIR Thermal Dataset, and LLVIP.
Table 1.
Comparison of our dataset and the existing multi-modal datasets, including TNO Image Fusion Dataset, OSU Color-Thermal Database, KAIST Multispectal Dataset, CVC-14, FLIR Thermal Dataset, and LLVIP.
| | Image Pairs | Resolution | Registered | Labeled | Observation Perspective | Scenarios | Instances | Application |
|---|
| TNO | 261 | 768 × 576 | ✓ | × | head-up | multiple | person and car | military use |
| OSU | 285 | 320 × 240 | ✓ | × | top-down | single | person | pedestrian detection |
| CVC-14 | 8490 | 640 × 512 | × | ✓ | head-up | single | person | autonomous driving |
| KAIST | 4750 | 640 × 480 | ✓ | ✓ | head-up | single | person | autonomous driving |
| FLIR | 5258 | 640 × 512 | × | ✓ | head-up | single | person, car, dog, bike | autonomous driving |
| LLVIP | 15,488 | 1080 × 720 | ✓ | ✓ | top-down | single | person | pedestrian detection |
| ours | 30,819 | 640 × 512 * | ✓ | ✓ | head-up, top-down, bottom-up | multiple | person, car, drone | security surveillance and |
| | | | | | | | | monitoring low-slow-small targets |
Table 2.
The parameters of the visible and infrared cameras.
Table 2.
The parameters of the visible and infrared cameras.
| | Visible Camera | Infrared Camera |
|---|
| resolution | 2560 × 1440 | 640 × 512 |
| frame rate | 50 Hz:25 fps | 50 Hz:50 fps |
| SNR/NETD | >52 dB | <50 mk |
| focal length | 4.8–144 mm | 6.3 mm |
| network protocol | TCP/IP | TCP/IP |
| power supply | DC 12 V | DC 10–30 V |
| power consumption | 2.5 W (static); 4.5 W (dynamic) | 2 W |
| response band | visible spectrum | 8–14 m |
| size | 50 × 60 × 102 mm | 45 × 45 × 99.5 mm |
| weight | 285 g | 265 g |
Table 3.
Experimental results of image fusion. For all metrics, higher values indicate better performance.
Table 3.
Experimental results of image fusion. For all metrics, higher values indicate better performance.
| | | EN | SD | SF | MI | SCD | VIFF | Qabf | SSIM |
|---|
| DDFM | LLVIP | 7.06 | 39.72 | 10.91 | 1.93 | 1.40 | 0.69 | 0.46 | 0.67 |
| ours | 7.07 | 41.94 | 15.10 | 2.01 | 1.47 | 0.50 | 0.40 | 0.68 |
| CDDFuse | LLVIP | 7.35 | 50.26 | 16.42 | 3.01 | 1.58 | 0.86 | 0.63 | 0.66 |
| ours | 7.40 | 59.74 | 23.38 | 2.41 | 1.70 | 0.59 | 0.53 | 0.66 |
| LRRNet | LLVIP | 6.41 | 29.69 | 10.69 | 1.69 | 0.85 | 0.55 | 0.42 | 0.63 |
| ours | 6.99 | 53.79 | 15.96 | 2.27 | 1.20 | 0.52 | 0.45 | 0.64 |
| FusionGAN | LLVIP | 6.46 | 26.77 | 8.05 | 1.97 | 0.65 | 0.44 | 0.23 | 0.58 |
| ours | 6.79 | 33.59 | 10.19 | 1.76 | 0.74 | 0.31 | 0.20 | 0.59 |
Table 4.
Experimental results for pedestrian and car detection. mAP50 means the AP at an IoU threshold of 0.5, mAP75 means the AP at an IoU threshold of 0.75, and mAP means the average of the AP at an IoU threshold of 0.5 to 0.95, with an interval of 0.05.
Table 4.
Experimental results for pedestrian and car detection. mAP50 means the AP at an IoU threshold of 0.5, mAP75 means the AP at an IoU threshold of 0.75, and mAP means the average of the AP at an IoU threshold of 0.5 to 0.95, with an interval of 0.05.
| | | Yolov3 | Yolov5 | Yolov8 |
|---|
| | |
mAP50
|
mAP75
|
mAP
|
mAP50
|
mAP75
|
mAP
|
mAP50
|
mAP75
|
mAP
|
|---|
| visible | car | 0.952 | 0.878 | 0.796 | 0.95 | 0.857 | 0.768 | 0.954 | 0.881 | 0.798 |
| person | 0.865 | 0.632 | 0.565 | 0.836 | 0.538 | 0.509 | 0.842 | 0.609 | 0.548 |
| all | 0.908 | 0.755 | 0.680 | 0.893 | 0.698 | 0.638 | 0.898 | 0.745 | 0.673 |
| infrared | car | 0.925 | 0.759 | 0.686 | 0.916 | 0.719 | 0.651 | 0.921 | 0.755 | 0.678 |
| person | 0.886 | 0.663 | 0.585 | 0.878 | 0.617 | 0.552 | 0.885 | 0.664 | 0.582 |
| all | 0.906 | 0.711 | 0.635 | 0.897 | 0.668 | 0.601 | 0.903 | 0.710 | 0.630 |
Table 5.
Generalization experiment results of our dataset and LLVIP for pedestrian detection.
Table 5.
Generalization experiment results of our dataset and LLVIP for pedestrian detection.
| | | Yolov3 | Yolov5 | Yolov8 |
|---|
| |
Train + Test
|
mAP50
|
mAP75
|
mAP
|
mAP50
|
mAP75
|
mAP
|
mAP50
|
mAP75
|
mAP
|
|---|
| visible | CSMR + LLVIP | 0.540 | 0.247 | 0.272 | 0.457 | 0.182 | 0.217 | 0.495 | 0.237 | 0.253 |
| LLVIP + CSMR | 0.272 | 0.115 | 0.134 | 0.261 | 0.109 | 0.127 | 0.167 | 0.086 | 0.089 |
| infrared | CSMR + LLVIP | 0.785 | 0.454 | 0.444 | 0.773 | 0.403 | 0.417 | 0.718 | 0.407 | 0.401 |
| LLVIP + CSMR | 0.558 | 0.175 | 0.244 | 0.418 | 0.123 | 0.178 | 0.404 | 0.143 | 0.186 |
Table 6.
Comparative experiment results between our dataset and LLVIP for pedestrian detection.
Table 6.
Comparative experiment results between our dataset and LLVIP for pedestrian detection.
| | | Yolov3 | Yolov5 | Yolov8 |
|---|
| | |
mAP50
|
mAP75
|
mAP
|
mAP50
|
mAP75
|
AP
|
mAP50
|
mAP75
|
AP
|
|---|
| visible | LLVIP | 0.871 | 0.455 | 0.466 | 0.908 | 0.564 | 0.527 | 0.889 | 0.542 | 0.511 |
| ours | 0.865 | 0.532 | 0.565 | 0.836 | 0.538 | 0.509 | 0.842 | 0.609 | 0.548 |
| infrared | LLVIP | 0.940 | 0.661 | 0.582 | 0.965 | 0.764 | 0.670 | 0.964 | 0.727 | 0.631 |
| ours | 0.886 | 0.663 | 0.585 | 0.878 | 0.617 | 0.552 | 0.885 | 0.664 | 0.582 |
Table 7.
Experimental results of drone detection. AP50 means the AP at an IoU threshold of 0.5, AP75 means the AP at an IoU threshold of 0.75, and AP means the average of the AP at an IoU threshold of 0.5 to 0.95, with an interval of 0.05.
Table 7.
Experimental results of drone detection. AP50 means the AP at an IoU threshold of 0.5, AP75 means the AP at an IoU threshold of 0.75, and AP means the average of the AP at an IoU threshold of 0.5 to 0.95, with an interval of 0.05.
| | Yolov3 | Yolov5 | Yolov8 |
|---|
| |
AP50
|
AP75
|
AP
|
AP50
|
AP75
|
AP
|
AP50
|
AP75
|
AP
|
|---|
| visible | 0.985 | 0.811 | 0.678 | 0.979 | 0.783 | 0.663 | 0.981 | 0.800 | 0.686 |
| infrared | 0.994 | 0.887 | 0.701 | 0.993 | 0.848 | 0.683 | 0.994 | 0.876 | 0.708 |
Table 8.
Experimental results of image-to-image translation algorithms on KAIST, LLVIP, and our dataset.
Table 8.
Experimental results of image-to-image translation algorithms on KAIST, LLVIP, and our dataset.
| Dataset | PSNR | SSIM |
|---|
| KAIST | 28.9935 | 0.6918 |
| LLVIP | 10.7688 | 0.1757 |
| ours | 21.6358 | 0.5909 |


 ,
, 


