Article

Cross-Visual Style Change Detection for Remote Sensing Images via Representation Consistency Deep Supervised Learning

1
State Key Laboratory of Information Engineering in Surveying, Mapping and Remote Sensing, Wuhan University, Wuhan 430072, China
2
State Key Laboratory of Geo-Information Engineering, Xi’an 710054, China
3
School of Information Science and Engineering, Wuhan University of Science and Technology, Wuhan 430072, China
4
Qinhuangdao Branch Campus, Northeastern University, Qinhuangdao 066004, China
*
Author to whom correspondence should be addressed.
Remote Sens. 2025, 17(5), 798; https://doi.org/10.3390/rs17050798
Submission received: 15 January 2025 / Revised: 17 February 2025 / Accepted: 22 February 2025 / Published: 25 February 2025
(This article belongs to the Special Issue Advances in Deep Learning Approaches in Remote Sensing)

Abstract

:
Change detection techniques, which extract different regions of interest from bi-temporal remote sensing images, play a crucial role in various fields such as environmental protection, damage assessment, and urban planning. However, visual style interferences stemming from varying acquisition times, such as radiation, weather, and phenology changes, often lead to false detections. Existing methods struggle to robustly measure background similarity in the presence of such discrepancies and lack quantitative validation for assessing their effectiveness. To address these limitations, we propose Representation Consistency Change Detection (RCCD), a novel deep learning framework that enforces global style and local spatial consistency of features across encoding and decoding stages for robust cross-visual style change detection. RCCD leverages large-kernel convolutional supervision for local spatial context awareness and global content-aware style transfer for feature harmonization, effectively suppressing interference from background variations. Extensive evaluations on S2Looking and LEVIR-CD+ datasets demonstrate RCCD’s superior performance, achieving state-of-the-art F1-scores. Furthermore, on dedicated subsets with large visual style differences, RCCD exhibits more substantial improvements, highlighting its effectiveness in mitigating interference caused by visual style errors. The code has been open-sourced on GitHub.

1. Introduction

Change detection (CD) techniques extract altered regions from bi-temporal remote sensing images, providing a crucial means to monitor Earth’s surface changes over time [1]. CD plays a vital role in environmental monitoring [2], disaster assessment, and urban planning, enabling the tracking of deforestation, glacier retreat, damage assessment, and urban development. This information facilitates informed decision-making and effective resource management [3,4]. Consequently, CD has become an indispensable tool with significant societal and environmental benefits, and the development of accurate and efficient CD methods remains an active research area [5].
In the era of interconnected satellite constellations [
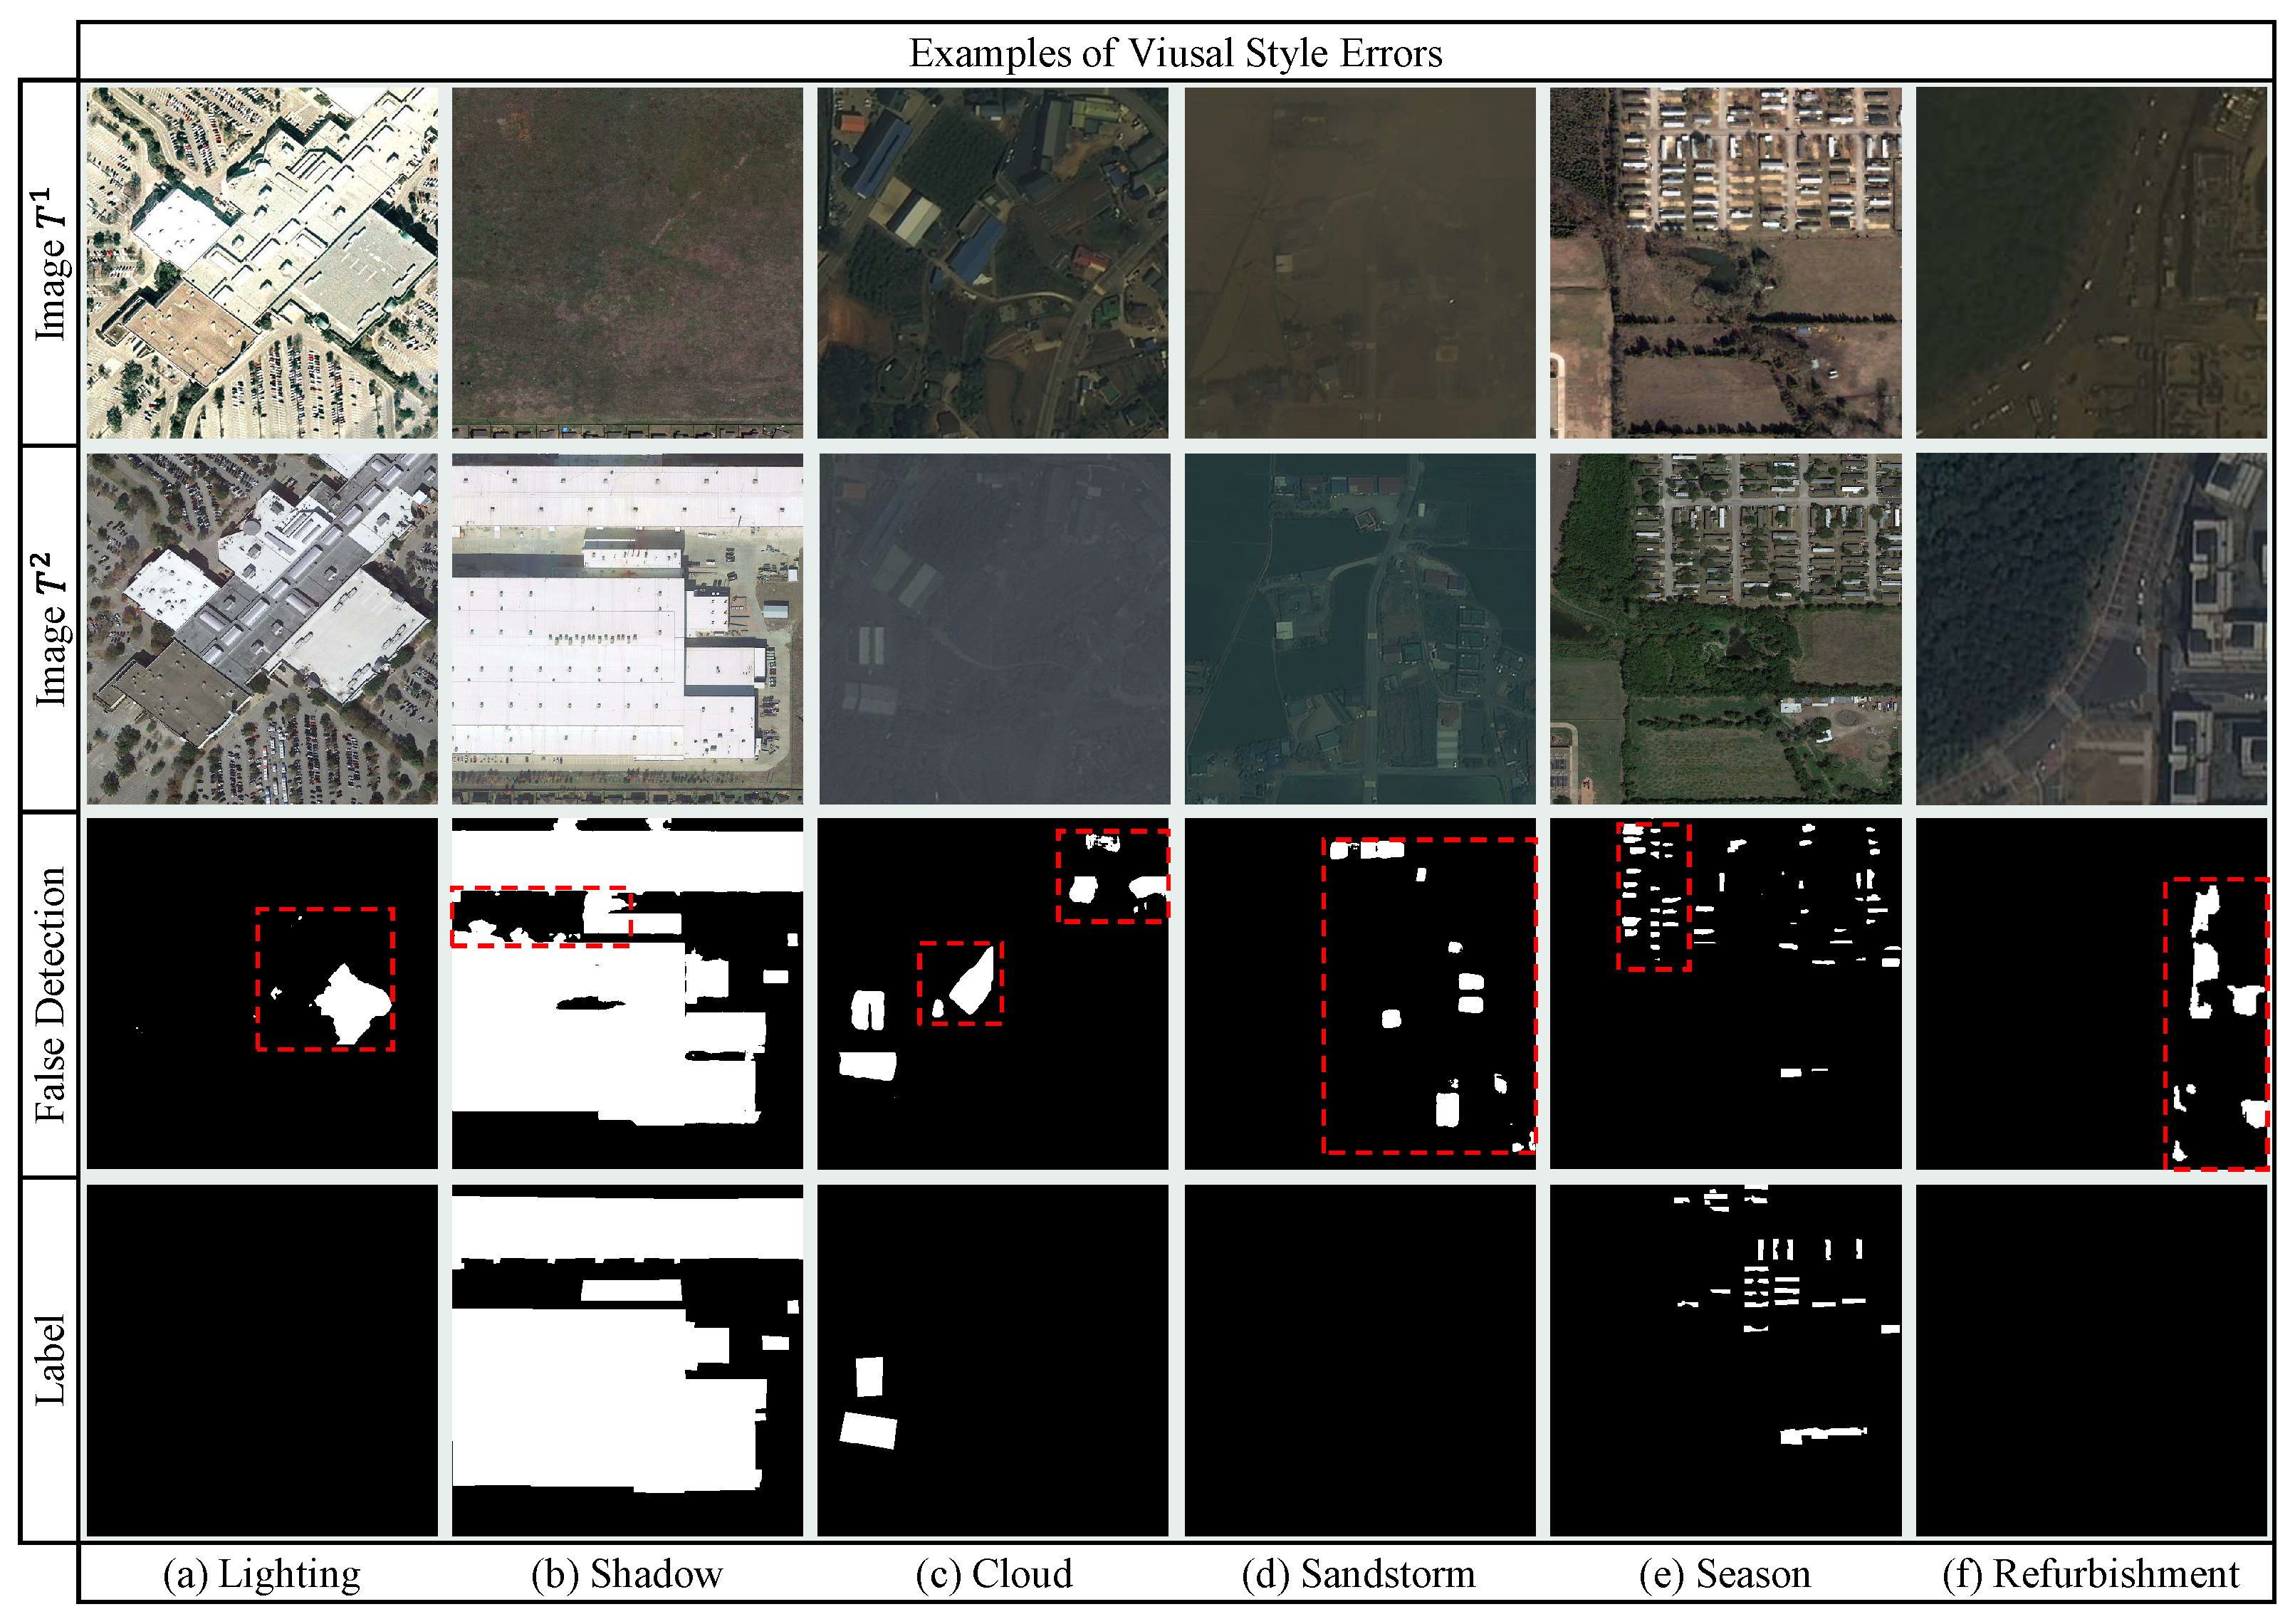
6], the increasing demand for accurate and timely CD from bi-temporal images faces challenges from visual style interferences caused by varying acquisition conditions. These interferences, primarily stemming from radiation differences, atmospheric effects, and seasonal variations, introduce significant difficulties in accurately identifying genuine changes, as shown in Figure 1. These non-change-related pixel value variations manifest as spectral, textural, and semantic discrepancies between images, leading to false detections. For instance, illumination variations can cause shifts in spectral signatures, making similar objects appear different. Atmospheric conditions like haze can weaken textural features, potentially obscuring genuine changes or introducing spurious ones. Moreover, seasonal changes, such as vegetation growth cycles, can lead to substantial semantic changes, even if irrelevant to the user’s objective. Consequently, these visual style discrepancies pose a significant obstacle to achieving high accuracy in CD, particularly in measuring the similarity between unchanged and changed areas across spectral, textural, and semantic domains. This necessitates the development of robust CD algorithms that can effectively mitigate the impact of such interferences.
Current CD research primarily focuses on mitigating visual style interferences through specialized datasets, sophisticated feature enhancements, and refined deep supervision. However, accurately quantifying background similarity amid complex visual style variations and establishing robust evaluation protocols remain challenging, as exemplified by the false detections arising from complex backgrounds in Figure 1. Traditional and machine learning CD methods struggle with varying visual styles [7], particularly radiation and non-linear weather/phenological changes. Deep learning, such as Siamese networks for CD, has emerged as a dominant approach due to its capacity for high-dimensional semantic understanding [8]. Dedicated visual CD datasets [9,10] facilitate method adaptation to specific interference patterns, yet they often lack the full spectrum of real-world variations. Methods explicitly addressing visual style interferences primarily leverage feature enhancement strategies, including difference feature enhancement [11,12], multi-level feature fusion [13,14,15], and global semantic enhancement [16,17,18], to suppress false positives. Deep supervision methods, employing techniques like metric learning [9] and multi-scale supervision [19], also play a vital role. However, these approaches often lack effective feature constraints and measurements, hindering accurate similarity measurement in complex backgrounds by failing to establish consistent feature contrast during Siamese feature extraction. Furthermore, robustly quantifying visual style interference errors remains challenging, hindering comprehensive method assessment. Next, we provide a detailed introduction to the progress in related work for these two challenges.
Recent advances in deep learning [8] for change detection have achieved significant progress through encoder–decoder architectures that leverage weight-shared, pre-trained backbones to extract multi-temporal features [14,20,21,22]. Researchers enhance robustness via multi-task learning [23,24], training constraints [25,26,27], and deep supervision [19], with innovations including pyramid networks for salient feature refinement [28], multi-scale fusion frameworks like MSFF-CDNet [29], and temporal modeling with P2V-CD [18]. SEIFNet further integrates global-local cues to refine boundaries [30], while deep supervision strategies suppress noise through multi-level supervision [31], atrous spatial pyramid pooling [32], attention-based fusion [33], and GAN constraints [34]. However, despite these efforts, Siamese CD frameworks remain limited by unsystematic designs, sensitivity to interference, and insufficient utilization of advanced structures. Crucially, existing methods often neglect comprehensive constraints on bi-temporal backbone features, failing to ensure comparable and identically distributed representations during Siamese feature extraction [1,2,19], which undermines their robustness in complex scenarios.
A persistent challenge in optical remote sensing CD is visual style interference caused by radiometric, seasonal, and phenological variations [20,35]. While specialized datasets like LEVIR-CD+ [9] and S2Looking [10] improve adaptability, feature enhancement strategies dominate current solutions, including difference amplification [12], multi-level fusion [19], and global semantic integration [30]. Techniques such as multi-level difference enhancement [36] and similarity-aware attention networks [37] aim to suppress false positives, yet critical gaps persist: (1) inadequate constraints during Siamese feature extraction hinder consistent feature contrast in complex backgrounds, and (2) robust protocols for quantifying style interference errors remain underdeveloped. Traditional and deep learning methods struggle to disentangle style variations from genuine changes [7], while existing datasets lack real-world heterogeneity [11,13]. This limitation perpetuates false detections in scenarios with large visual style differences (Figure 1), underscoring the need for systematic feature constraints and standardized evaluation metrics [14,15,16,17,18].
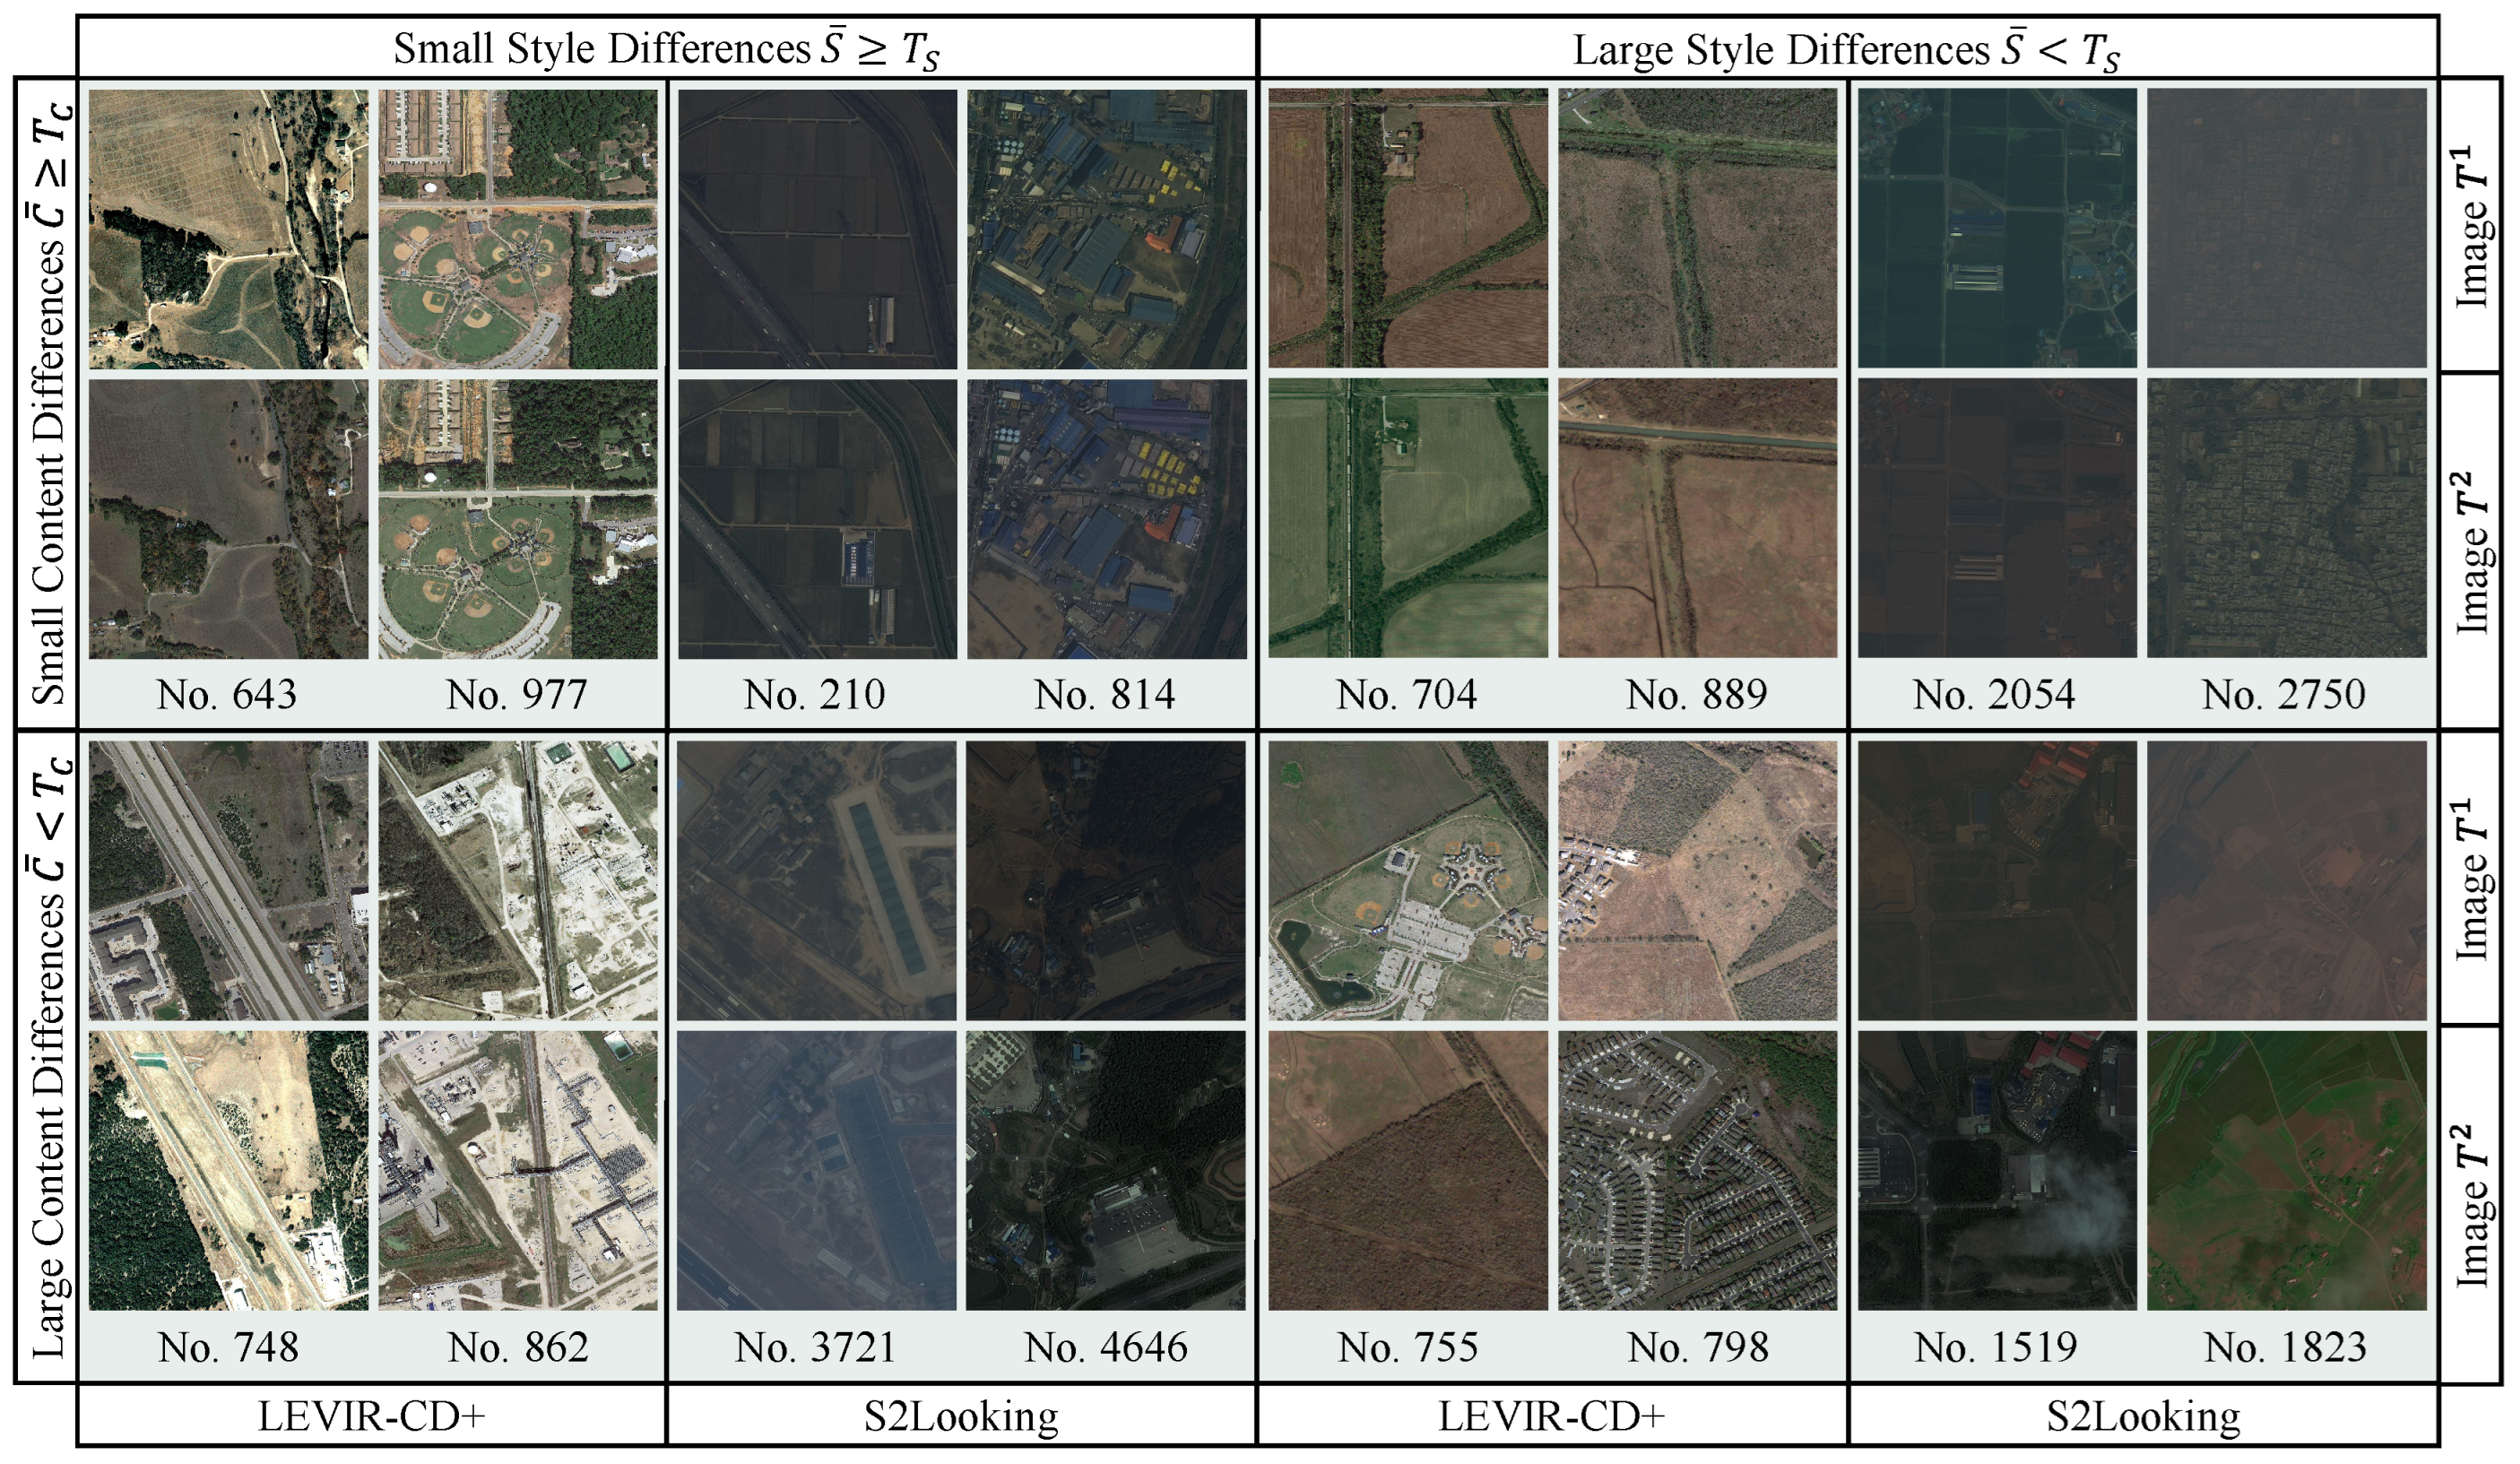
To address the challenges in robustly measuring background similarity and quantitatively evaluating errors, we propose the Representation Consistency Change Detection (RCCD) framework. This framework is explicitly designed to handle remote sensing images with cross-visual style variations, aiming to achieve robust CD by enforcing representation consistency between bi-temporal global style and local spatial consistency of features throughout the encoding and decoding pipeline. RCCD comprises an encoder, a decoder, and a deep supervisor. The encoder utilizes a pre-trained network with shared weights for multi-level feature extraction. The Unified Decoder and Detector (UDD), equipped with skip connections and residual units, performs scale-wise decoding to generate the CD map. The Representation Consistency (RC) deep supervisor, active only during training, operates at all scales throughout the encoding and decoding process. It consists of local spatial contexts based on the large kernel convolution supervised (LS) module and the Global content-aware Style transfer (GS) module, constraining feature representation consistency includes local context and global style promoting effective CD. The LS module comprehensively assesses correlations between background and target regions in the bi-temporal features. The GS module computes the similarity of channel-wise auto-correlation Gram matrices, implicitly performing style distribution transfer to harmonize global feature representations. Furthermore, we introduce a novel validation method for visual style errors by utilizing Otsu’s method to segment CD datasets into subsets with varying degrees of visual style differences based on content and style similarity measurements of pre-trained backbone features. This enables quantitative assessment of the effectiveness of cross-visual style CD algorithms. We rigorously evaluate RCCD on the LEVIR-CD+ and S2Looking datasets, including their subsets with significant visual style differences. Our results demonstrate that RCCD substantially improves cross-visual style CD performance, achieving state-of-the-art (SOTA) results.
  • RCCD framework: A novel fully convolutional Siamese neural network training framework with an encoder, decoder, and deep supervisor module, enabling efficient and effective mitigation of cross-visual style errors without incurring extra computational costs during inference.
  • Representation consistency deep supervised learning: A method integrating target local spatial context and global content awareness, constructing a loss function that effectively suppresses image pairs with significant visual style differences, promoting robust CD.
  • Visual style errors validation: A novel method leveraging pre-trained networks to partition datasets based on visual style differences, enabling quantitative assessment of cross-visual style CD algorithms.
  • SOTA performance: RCCD achieves SOTA accuracy, substantially improving cross-visual style error suppression in challenging scenarios. The code is available on GitHub: https://github.com/wjj282439449/RCCD (accessed on 3 October 2024).
This paper proceeds as follows: Section 2 presents our methodology; Section 3 details our experimental setup and results; Section 4 discusses the implications and limitations; and Section 5 concludes the paper.

2. Methodology

We propose the Representation Consistency Change Detection (RCCD) framework (Figure 2), a cross-visual-style CD method tailored for bi-temporal images. Unlike conventional Siamese encoder–decoder networks, RCCD incorporates a novel representation consistency deep supervision approach during training. This approach applies additional supervision to multi-scale features at each encoding and decoding stage, additional assessing the similarity between bi-temporal pyramid features extracted by the backbone network, considering both local spatial and global stylistic characteristics. The encoder utilizes the pre-trained model for robust feature extraction. We introduce a unified basic feature compression unit (UDD) for both the decoder and detector, enabling efficient dimensionality reduction and feature fusion. Finally, the detector outputs a binary change mask aligned with the input image dimensions.

2.1. Overall Architecture

Given a pair of registered images { T 1 , T 2 } R C × H × W , RCCD predicts a change mask, denoted as M a s k , using only the encoder, decoder, and detector components, excluding the supervisor module during inference. This process can be defined as follows:
M a s k = RCCD ( T 1 , T 2 )
The encoder generates a four-stage multi-scale pyramid of downsampled features, { F D 1 t , F D 2 t , F D 3 t , F D 4 t } , from each input image with a feature downsampling ratio of { 4 , 2 , 2 , 2 } between consecutive stages:
{ F E 1 t , F E 2 t , F E 3 t , F E 4 t } = Encoder ( T t ) , t { 1 , 2 }
The decoder upsamples input features via interpolation and a UDD module. Each level, except the lowest ( F E 4 1 and F E 4 2 ), concatenates its input with the previous level’s UDD output before its own UDD processing, as follows:
F D l = Decoder ( l ) ( F E l 1 , F E l 2 , F D ( l + 1 ) ) l { 1 , 2 , 3 } Decoder ( l ) ( F E l 1 , F E l 2 ) l = 4
The detector utilizes two UDD modules as foundational building blocks, taking the outputs from each UDD level as input. It then employs a two-channel convolutional layer to generate the final CD prediction P and binary M a s k , as follows:
M a s k = B i n a r y ( P ) = Detector ( F D 1 , F D 2 , F D 3 , F D 4 )
During training, the supervisor employs three loss functions: Cross-Entropy Loss ( L C E ) to evaluate the similarity between the result (P) and the Label (L), and two L1 loss functions to supervise local spatial (LS, Section 2.3) similarity ( L L S ) and global style (GS, Section 2.3.1) consistency ( L G S ), respectively:
L C E = 1 H W n = 1 H W [ L n log ( P n ) + ( 1 L n ) log ( 1 P n ) ] ,
L L S = 1 8 · C l H l W l l = 1 4 n = 1 C l H l W l ( L S ( F E l 1 , F E l 2 ) n L n 1 + L S ( F D l ) n L n 1 ) ,
L G S = 1 4 · C l 1 C l 2 l = 1 4 n = 1 C l 1 C l 2 ( G S ( F E l 1 ) n G S ( F E l 2 ) n 1 ) ,
L = L C E + λ 1 L L S + λ 2 L G S ,
where L n represents each pixel between P and L. The E l and D l denote the l-th stage encoder and decoder. The LS and GS module are calculated as in Equations (18) and (20), and the LS module is capable of accepting two forms of input.
Therefore, the optimization process of RCCD for the parameters θ * aims to achieve consistency with the ground truth L, as follows:
θ * = arg min θ L ( RCCD ( ( T 1 , T 2 , θ ) , L )

2.2. Siamese Encoder–Decoder Structure

CNX Encoder: Utilizing a hierarchical, pre-trained ConvNeXt (CNX) network [38], the encoder extracts multi-level features { F E 1 , F E 2 , F E 3 , F E 4 } from input image pairs { T 1 , T 2 } R C × H × W , as defined in Equation (2). The resulting top-down encoding, within a Siamese structure, efficiently captures local features and streamlines the CD process.
In Figure 3a, each backbone feature level consists of a downsampling layer (with multipliers n { 4 , 2 , 2 , 2 } ) and multiple basic blocks; LN denotes Layer Normalization:
F D l = LN ( Conv ( n , n ) ) ( F D l ) , l { 1 , 2 , 3 , 4 }
where F l R C × H n × W n , Conv superscript “(n,n)” indicates the kernel size and stride of the Convolution (Conv) operation, respectively. The CNX block computation is as follows:
CNX ( F ) = Conv ( GELU ( Conv ( LN ( Conv ( 7 ) ( F ) ) ) ) F
F D ( l + 1 ) = CNX ( m ) ( F D l ) , m { 3 , 3 , 9 , 3 }
where m is the per-stage CNX repetition count. Downsampling of F D l followed by m CNX computations yields the input features for stage F l + 1 . Superscript (7) denotes a 7 × 7 Conv, while the absence of a superscript indicates a 1 × 1 Conv. The two 1 × 1 Convs expand the channel dimension by a factor of 4 and then recover it.GELU [39] is an adaptive activation function. “⊕” denotes element-wise addition.
Unified Decoder and Detector (UDD): The UDD module, illustrated in Figure 3b, combines compressed multi-level feature representations with decoder outputs, using skip connections to the encoder for improved gradient flow. The UDD comprises a UDD Squeeze unit (UDDSqz) and a UDD Residual unit (UDDRes), both composed of several Basic Units (BU): Conv BN GELU :
UDD ( ) = UDDRes ( UDDSqz ( ) )
F D l = UDDSqz ( ) = BU ( l ) ( )
F D l = UDDRes ( ) = BU ( l ) ( BU ( l ) ( F D l ) ) F D l
where Equation (14) utilizes a 1 × 1 Conv. Equation (15) employs 3 × 3 , 1 × 1 , respectively.
Decoder and Detector: The decoder collects outputs from the encoder and utilizes a UDD module at each layer. The multi-layer outputs then serve as input for the detector, which receives F D 1 , F D 2 , F D 3 , F D 4 from the decoder. As depicted in Figure 2, the features are interpolated to the same shape and Equation (13) is applied twice. Finally, a 1 × 1 Conv to generates the change M a s k :
M a s k = Softmax ( Conv ( UDD ( UDD ( F D 1 , F D 2 , F D 3 , F D 4 ) ) ) )

2.3. Representation Consistency Deep Supervised Learning

Unlike other Siamese CD methods, RCCD employs a representation consistency deep supervision training strategy. This framework comprises local spatial contexts, large-kernel supervised modules, and global content-aware style transfer modules, generating additional loss function constraint terms, L L S and L G S , respectively. During training, features generated at each level, F E l 1 , F E l 2 and F D l , are subjected to deep supervision (detailed in Section 2.2), comprising the local spatial similarity large-kernel loss (LS loss, Equation (6)), and the Global content-aware Style transfer similarity loss (GS loss, Equation (7)). Both feature similarity losses are computed after Softmax, utilizing the L1 norm as the similarity metric.

2.3.1. Local Spatial Context Large-Kernel Supervised (LS) Module

The LS module assesses local spatial correlation using large-scale convolutional kernels to constrain the representational consistency of features within a defined local spatial extent. It comprises three key components: channel compression, residual module [40], and large-kernel linear discrimination. The channel compression module reduces feature map dimensionality, mitigating computational complexity. The residual module expands the receptive field and facilitates discriminative local spatial feature extraction:
UDD ( F l ) = UDDRes ( m ) ( UDDSqz ( F l ) ) , F l { ( F E l 1 , F E l 2 ) , F D l D }
The large-kernel linear discrimination module, with adjustable parameters, outputs a measure of local spatial similarity used by the loss function (Equation (6)) during the training, as follows:
LS ( F l ) = Softmax ( Conv ( k ) ( UDD ( F l ) ) )

2.3.2. Global Content-Aware Style Transfer (GS) Module

The GS module implicitly performs style transfer through global content similarity assessment, constraining features from images with varying styles to possess representationally consistent global style descriptors.
Firstly, the GS module flattens spatial dimensions and then transposes the spatial and channel dimensions of each features.
F E l t R C l × H l × W l F E l t R C l × H l W l F E l t R H l W l × C l
Next, the matrix multiplication between the original features and their transposed counterparts for global style descriptor (Gram matrix).
G S ( F E l t ) = 1 C l H l W l ( F E l t F E l t ) R C l × C l
Finally, the loss function constrains (Equation (7)) the global style descriptors of features from different temporal phases, ensuring that content-aware, consistent features can be extracted even from images exhibiting diverse visual styles.

2.4. Visual Style Errors Validation

To demonstrate the effectiveness of our algorithm in mitigating visual style discrepancies, we propose a novel visual style error validation method (Figure 4), leveraging cosine similarity to measure both content and style similarity between pyramid features extracted using a pre-trained backbone network (without fine-tuning). We then employ Otsu’s method [41] to segment these similarity values, yielding two subsets: the large visual style difference (Large-VS) subset (low content and style similarity) and the small visual style difference (Small-VS) subset (high content and style similarity). Improved algorithm performance on the Large-VS subset, compared to the Small-VS subset, demonstrates effective mitigation of visual style discrepancies and robust CD performance. The detailed procedure is as follows:
  • Extract multi-level features: utilize a pre-trained backbone network to extract pyramid features from each image pair:
    { F E 1 t , F E 2 t , F E 3 t , F E 4 t } = Backbone ( T t ) , t { 1 , 2 }
  • Calculate mean content similarity ( C ¯ ): average the cosine similarity between corresponding feature maps across all levels for both temporal phases:
    C ¯ = CosSim ( F E l 1 , F E l 2 ) = 1 4 l = 1 4 F E l 1 · F E l 2 F E l 1 F E l 2 , F E l t R C l H l W l
  • Calculate mean style similarity ( S ¯ ): average the Gram matrix-based cosine similarity (Equation (20)) between corresponding feature maps across all levels:
    S ¯ = 1 4 l = 1 4 G S ( F E l 1 ) · G S ( F E l 1 ) G S ( F E l 1 ) G S ( F E l 1 ) , G S ( F E l ) t R C l C l
  • Apply Otsu’s method: utilize Otsu’s method to determine the optimal segmentation thresholds T C and T S for content and style similarity, respectively, based on the sets { C ¯ 1 , C ¯ 2 , , C ¯ n } and { S ¯ 1 , S ¯ 2 , , S ¯ n } .
  • Construct visual style subsets, ∧ denotes the intersection of sets:
    Large-VS Subset (low content and low style similarity):
    C ¯ < T C S ¯ < T S .
    Small-VS Subset (high content and high style similarity):
    C ¯ T C S ¯ T S .

3. Experiments and Analysis

3.1. Experimental Settings

3.1.1. Datasets

Following Section 2.4, both test sets were partitioned into Large-VS and Small-VS subsets based on content and style similarity. The LEVIR-CD+ (348 pairs): 56 and 226 pairs; the S2Looking (1000 pairs): 157 and 559 pairs, respectively. The detailed proportions of image pairs with similar styles and content in the two datasets are presented in Table 1.
LEVIR-CD+: This CD datas contains over 985 pairs of bi-temporal building images (0.5 m/pixel) from 20 different regions in USA, spanning five years. Each image has dimensions of 1024 × 1024 pixels. The dataset is split into training (65%), validation (25% of training), and test (35%) sets. It includes significant lighting, shadow, and phenology variances [9].
S2Looking: This dataset comprises 5000 pairs of satellite images (0.5–0.8 m/pixel) captured over three years, each with dimensions of 1024 × 1024 pixels. The dataset (3500 training, 500 validation, and 1000 test images) incorporates significant weather and radiation variability [10].

3.1.2. Evaluation Metrics

This evaluation includes comparisons with recent bi-temporal CD methods and ablation studies. We evaluate the CD quality using four metrics: Precision (Pre.), Recall (Rec.), F1-measure (F1), and Intersection over Union (IoU), computed from True Positives (TPs), False Positives (FPs), and False Negatives (FNs). Higher scores across all metrics indicate superior performance.
Pre . = TP TP + FP
Rec . = TP TP + FN
F 1 - measure ( F 1 ) = 2 × Pre . × Rec . Pre . + Rec .
IoU = TP TP + FP + FN

3.1.3. Implementation Details

We trained and tested RCCD and mainstream methods on LEVIR-CD+, S2Looking, and VS subsets using a single 4090 GPU. Dataset images were cropped to 256 × 256 pixel size, maintaining the original training and test set divisions. Models were selected from a valid set.The RCCD backbone was initialized with pre-trained parameters. Model optimization employed the AdamW [42] optimizer with a learning rate of 5 × 10 5 , a batch size of 32. Data augmentation included random photometric and geometric distortions. Our RCCD was implemented in PyTorch 2.1, while others used their official implementations.

3.2. Comparisons on Mainstream Methods

We compared our RCCD model with ten other CD methods on the S2Looking and LEVIR-CD+ datasets, including UNet [13], FC-Diff [11], FC-Conc [11], IFNet [31], SNUNet [14], L-UNet [15], BIT [16], ICIF-Net [17], P2V [18], CDNeXt [43], and the RCCD-B baseline model (lacking GS and LS modules). We evaluated the robustness of these methods against visual style errors using Large-VS and Small-VS subsets. The results of FC-Diff, L-UNet, BIT, ICIF-Net, P2V, CDNeXt, and our RCCD were visualized on both datasets.

3.2.1. Results on S2Looking Dataset

Figure 5 visually compares CD results on images with varying style differences. Unlike other methods, RCCD demonstrates robustness to variations in radiation, weather, phenology, and refurbishment, exhibiting broader applicability and effectively mitigating visual style errors. Under consistent radiation (e.g., rows 1–3), RCCD shows fewer missed detections and more accurate change boundaries. In the presence of irrelevant changes like clouds and vegetation phenology (e.g., rows 4–8), RCCD generates fewer false positives (e.g., rows 5, 7, and 8). In the fifth set of images, the changes between cultivated land and bare land are not of interest in this dataset; however, the significant semantic and color differences have led most methods to misclassify these changes. In the ninth set of images, vegetation is detected as change due to varied visual characteristics across different images caused by phenological variations, whereas buildings and bare land, presenting similar visual appearances due to dust, result in omissions during detection. For uninteresting changes like road construction, our method demonstrates greater stability. These results confirm RCCD accurately extracts changes in interest under complex background interference, effectively suppressing visual style variations compared to mainstream methods.
Table 2 compares the performance of different methods on the S2Looking test set. Our RCCD method achieved the highest F1 and IoU scores across the full dataset and showed substantial improvement on the Large-VS subset. Compared to CDNeXt, RCCD achieved a 0.89% and 1.95% increase in F1-score on the full dataset and the Large-VS subset, respectively. Compared to the third-best method, these increases were 6.15% and 7.47%, representing relative improvements of 119.1% and 21.5% on the Large-VS subset. Compared to the RCCD baseline, our method further improved F1-score by 1.81% (full dataset) and 2.57% (Large-VS subset), a relative increase of 41.9%. Consistent accuracy improvement was also observed on the Small-VS subset, indicating the LS and GS components do not negatively impact performance in other scenarios. This suggests our method effectively mitigates visual style discrepancies. Interestingly, feature differencing methods performed better on the Small-VS subset, while self- and cross-attention methods excelled on the Large-VS subset.

3.2.2. Results on LEVIR-CD+ Dataset

Figure 6 visually compares CD results on images with significant variations in illumination, shadows, and vegetation phenology. RCCD demonstrates robustness to complex backgrounds, achieving higher detection rates (Small-VS) and lower false positive rates (Large-VS). Under consistent radiation (e.g., rows 1 and 2), other methods exhibit missed detections, as feature measurements at the decoding stage cannot effectively distinguish changed buildings from the ground. In scenarios with significant radiation differences (e.g., rows 3–6), other methods often misidentify rooftop illumination and building shadow variations as changes, while RCCD avoids these errors. In the third set of images, the strong contrasts and shadows in the later image due to lighting conditions cause most methods to interpret these dramatic visual differences as changes. Vegetation changes also pose challenges for other methods (e.g., rows 7–10), as dense foliage can obscure buildings, hindering accurate assessment. In the eighth set of images, occlusions from vegetation growth and scene style variations resulting from differences in lighting and shadows lead to a large number of false alarms. RCCD’s large-scale convolutions, with their ability to induce bias in local spatial contexts, effectively determine the identity consistency between buildings and their surroundings.
Table 3 presents the performance of different methods on the LEVIR-CD+ test set, which exhibits significant variations in illumination, shadows, and phenology. Our RCCD achieved the highest accuracy across all evaluations, with substantial improvement on the Large-VS subset. Compared to CDNeXt, RCCD achieved a 0.54% higher F1-score (3.52% higher than IFNet). On the Large-VS subset, RCCD’s F1-score improved by 1.12% (107.4% relative increase), indicating its effectiveness in mitigating interference from radiation and phenological changes. Compared to RCCD-B, our method achieved an additional 56.9% improvement on this subset. Comparable accuracy of RCCD, RCCD-B, and CDNeXt on the Small-VS subset suggests the overall improvement stems from the representation consistency learning, which mitigates visual style discrepancies. This highlights the crucial role of addressing such discrepancies for improved CD.

3.3. Ablation Study

The S2Looking and LEVIR-CD+ valid sets validated our proposed algorithm’s effectiveness. These studies investigated various design choices: the number of UDDRes repetitions (m) for the LS module, the large-kernel Conv size (k), loss hyperparameters ( λ 1 , λ 2 ), and the representation consistency integration within encoder–decoder stages. These experiments ensured a rational and well-justified algorithm structure.

3.3.1. LS Module: UDDRes Depth Analysis

This ablation study (Table 4) investigated the impact of varying the number of UDDRes repetitions (m) within the LS module, while keeping all other hyperparameters fixed. We aimed to determine if the LS module benefits from similarity measurements at higher semantic levels. Results indicate that directly measuring the similarity between encoder and decoder features is optimal ( m = 1 ), eliminating the need for extracting high-dimensional semantic representations. This is because the module’s primary function is to capture local spatial feature similarity between target and background, effectively achieved through large convolutional kernels. While increasing UDDRes depth might lead to further performance gains, it would incur excessive computational costs during training, making it impractical for our current setup.

3.3.2. LS Module: Large-Kernel Size Effectiveness

The large kernel size (k) in our LS module plays a pivotal role in capturing local spatial context for building target detection, serving as a core parameter for measuring the similarity of local spatial contexts (Figure 7a,b). As shown in Table 5, our experiments indicate that the optimal kernel sizes vary by dataset: k = 15 yields the highest F1-score of 67.13% for S2Looking, while k = 11 achieves a peak F1-score of 87.50% for LEVIR-CD+. These optimal values align closely with the datasets’ ground resolutions—S2Looking varies between 0.5 and 0.8 m/pixel (averaging around 0.65 m/pixel), LEVIR-CD+ has a consistent resolution of 0.5 m/pixel. The ratio of ground resolutions (0.65/0.5 = 1.3) closely matches the ratio of optimal kernel sizes (15/11 ≈ 1.36), suggesting that the ideal kernel size for measuring building target similarity in local spatial contexts is approximately 23 times the ground resolution (in meters). Note that if the targets of interest include other objects (e.g., vehicles, roads, or trees), the optimal kernel size may need re-evaluation. While larger kernels up to these optimal values improve performance, they also incur a modest increase in computational cost—parameters increase from 49.61 M to 50.58 M and FLOPs from 17.46 G to 17.96 G when k increases from 1 to 15. Beyond the optimal sizes, further increases in k lead to diminished performance improvements relative to the additional computational load.

3.3.3. Representation Consistency: Loss Weighting

Figure 7c,d analyze the effectiveness of loss function hyperparameters λ 1 and λ 2 in Equation (8). Optimal weights for the LS and GS modules need to be adjusted for different datasets. We sampled values for both weights (0 to 1), keeping other parameters fixed at 0 and adjusting either λ 1 or λ 2 individually. Results show incorporating the LS or GS module within a certain range improves accuracy. On S2Looking (more pronounced global style differences), the GS module generally outperforms the LS module. Conversely, on LEVIR-CD+ (greater local content variations), the LS module performs better. Since both types of variations are typically present, fine-tuning the loss function weighting is necessary. The principle is to select the minimum weights that still yield performance improvements, avoiding negative effects from excessively large weights.
Figure 7c,d and Table 6 reveal three key findings about loss weight selection: (1) Performance Stability: Both modules tolerate moderate weight variations while maintaining >95% of maximum gains. For S2Looking, GS achieves peak F1 (67.57%) at λ 2 = 0.025 0.25 (10× range), while LEVIR-CD+ sustains >87% F1 with λ 1 = 0.01 0.075 (7.5× range). (2) Dataset-Specific Optimization: S2Looking benefits more from GS (max ΔF1 = +0.64% vs. baseline), as its wider viewpoint variations create stronger spectral discrepancies than structural changes. LEVIR-CD+ prefers LS (max ΔF1 = +0.67%) due to its nadir perspective and 0.5 m resolution emphasizing structural details. (3) The selection principle of optimal weights follow: λ 1 = 0.05 / λ 2 = 0.025 for S2Looking and λ 1 = 0.01 / λ 2 = 0.1 for LEVIR-CD+.

3.3.4. Representation Consistency: Encoder and Decoder Stages

Analyzing Representation Consistency (RC) learning in encoding and decoding stages (Table 7) with fixed parameters allows exploration of reasonable framework structures. Firstly, the RC module acting independently in either stage shows varying responses across datasets, but generally outperforms the baseline (no RC). Secondly, for S2Looking (significant visual style differences), representation consistency between bi-temporal features is more crucial in encoding than decoding. For LEVIR-CD+ (complex background details), representation control in decoding yields better performance. In conclusion, full-stage representation consistency is optimal for addressing visual style issues, effectively handling both global style differences and local content discrepancies.

3.4. Visual Style Subset Visualization

Figure 8 visualizes our visual style error validation method across content and style difference dimensions, using uniformly sampled examples. Based on the magnitude of these differences (large or small), we categorize them into four scenarios: small content/small style, small content/large style, large content/small style, and large content/large style. Visual comparison reveals that large content differences generally exhibit localized semantic variations (e.g., vegetation transforming into bare land, changes in building surroundings, uninteresting changes like parking lots). Conversely, large style differences tend to exhibit image-wide inconsistencies in radiation, weather, and phenology. Consequently, subsets exhibiting both large content and large style differences can be effectively identified. This method effectively partitions a CD dataset into two subsets for validating visual style errors, providing a quantifiable representation of this problem.

3.5. Feature Interpretability of Representation Consistency

As illustrated in Figure 9, we employ a feature visualization technique—Gradient weighted Class Activation Mapping (GradCAM++) [44]—to perform an interpretability analysis of the features during the change detection process in RCCD. We compare the feature visualizations under three conditions: with the representation consistency learning module (w/LS and GS), with only the GS module (w/GS), and without any representation consistency learning modules (w/o LS and GS). The model with the representation consistency deep supervision module demonstrates stable feature responses throughout both the encoding and decoding stages—the heatmaps exhibit more uniform intensities and do not fluctuate dramatically despite variations in the visual styles of the input images. A similar global stabilization effect can be observed in the second row: with the addition of the GS module, the perceived activation distribution in the heatmap becomes even more uniform. In the first row, we observe that, compared to the second row (which lacks the LS module), there is a more pronounced suppression of pseudo-changes in the target objects and adjacent background during the decoding process. This underscores the necessity of local spatial context measurement. In contrast, the third row—corresponding to the configuration without any representation consistency learning module—exhibits the highest number of false alarms and is more susceptible to interference from vegetation and shadows, resulting in aberrant heatmap activations. Overall, the feature visualizations obtained during the RCCD prediction process confirm that the LS module effectively measures the similarity between the target and its local spatial context to suppress false alarms, while the GS module plays a crucial role in globally stabilizing images with varied visual styles, thereby ensuring the construction of comparable features.

3.6. Computational Complexity Analysis

The proposed RCCD framework is designed not only to achieve state-of-the-art (SOTA) accuracy in CD but also to maintain a favorable efficiency-accuracy trade-off, as shown in Table 8. Specifically, the design of RCCD incorporates a representation consistency deep supervision strategy during training to enforce robust bi-temporal feature constraints. However, once trained, the representation consistency supervisor (comprising the local spatial and global style modules) is not required during inference. This design choice directly results in a substantial reduction in computational burden during the testing phase. Concretely, when the supervisor module is removed, experimental evaluations show that the effective parameter count decreases by approximately 24.5% and the FLOPs are reduced by 14.3%. This ensures that RCCD remains highly efficient in practical applications without sacrificing its strong predictive performance. Moreover, RCCD achieves the highest detection accuracy under these optimized conditions. On the S2Looking and LEVIR-CD+, RCCD outperforms the CDNeXt by improving 0.89% and 0.54% F1, respectively. In addition, compared with other methods such as UNet, FC-Diff, IFNet, SNUNet, and L-UNet, RCCD not only maintains competitive (or even superior) segmentation performance but does so with a significantly lower computational cost. For example, although IFNet exhibits strong detection performance, its large model size (35.73M parameters) and high FLOPs (82.26G) undermine its practical applicability. In contrast, RCCD achieves a well-balanced trade-off by leveraging the shared encoder–decoder structure and excluding additional inference overhead from the representation consistency modules.

4. Discussion

The proposed RCCD framework demonstrates significant advancements in handling cross-visual style challenges for remote sensing CD. Our experimental results reveal three critical insights: First, enforcing representation consistency at both encoding and decoding stages proves more effective than single-stage constraints (
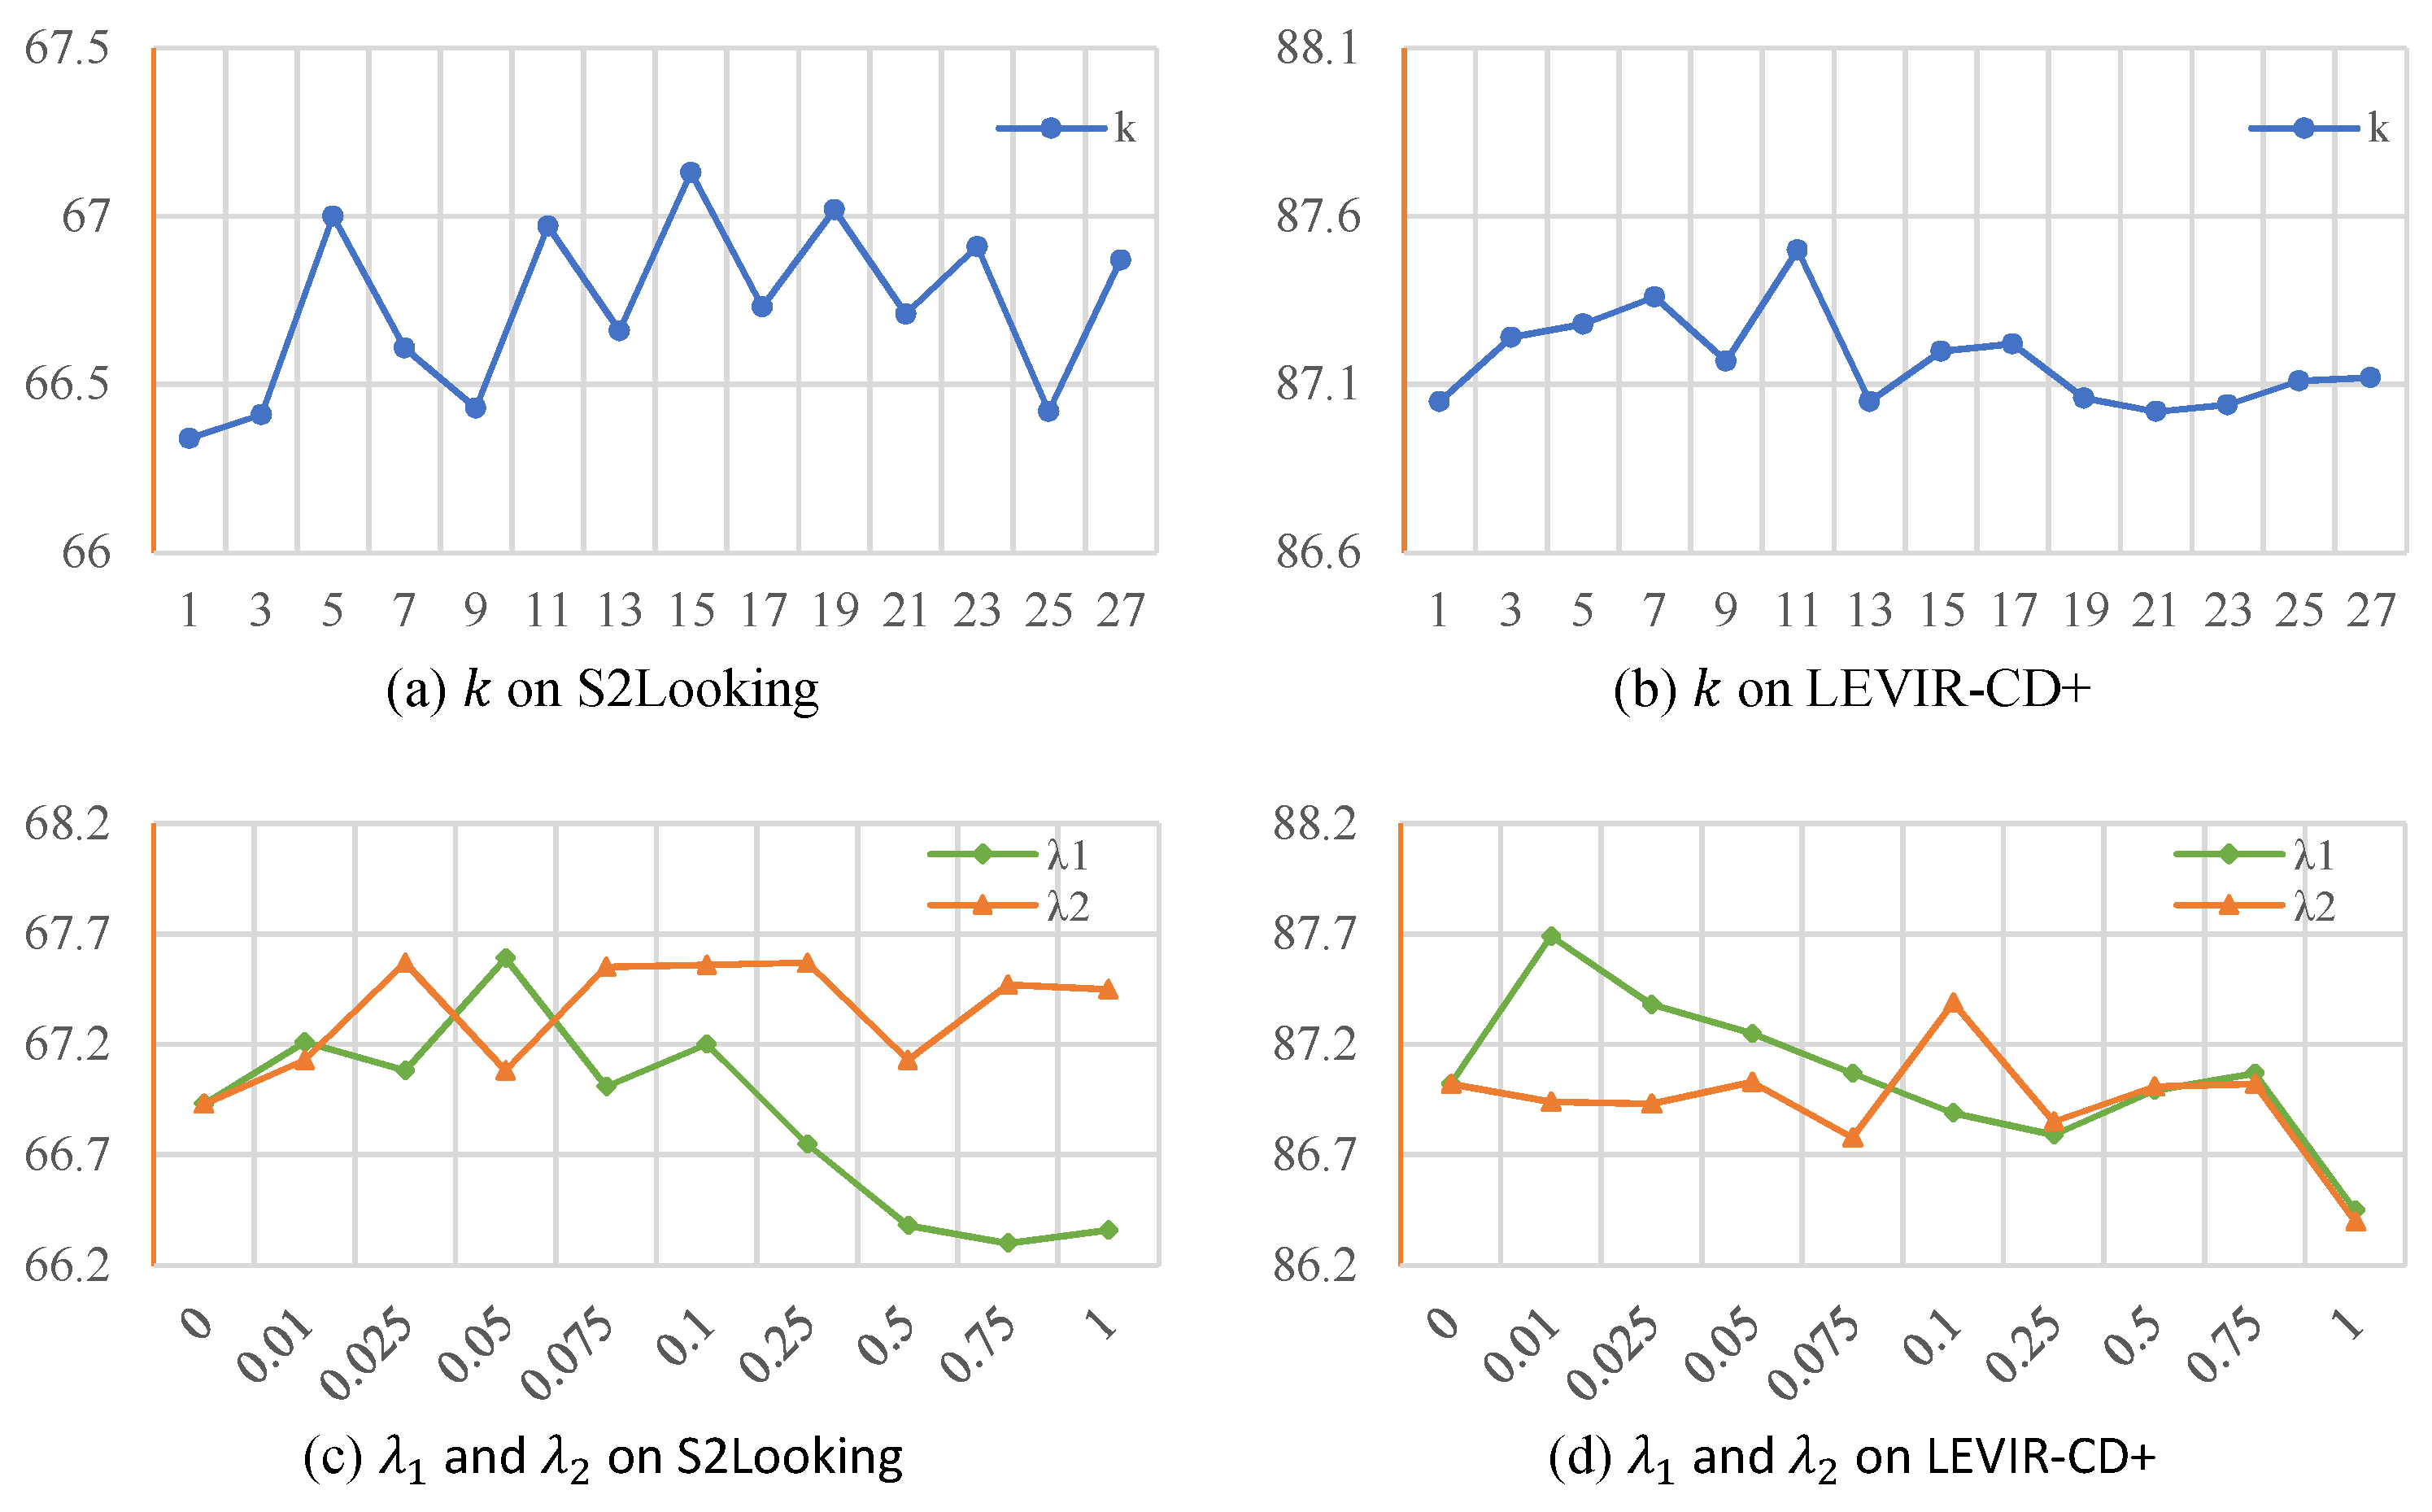
Table 7), particularly for datasets combining global style variations and local content discrepancies. This hierarchical consistency learning aligns with recent findings in domain adaptation, suggesting that multi-level feature alignment better captures cross-domain relationships. Second, the dataset-specific optimal kernel sizes for LS modules (15 for S2Looking vs. 11 for LEVIR-CD+) correlate with spatial resolution differences (0.65 m vs. 0.5 m), establishing a practical guideline for kernel size selection as 23× ground resolution. Third, our visual style validation method provides a novel quantitative framework for CD algorithm evaluation, addressing a critical gap in current benchmarking practices.
The effectiveness of RCCD stems from its dual mechanism: (1) The GS module acts as a global style normalizer through Gram matrix alignment, reducing domain shifts caused by seasonal/illumination variations. (2) The LS module functions as a local context stabilizer, mitigating false alarms from transient environmental changes through large receptive field analysis. This dual approach outperforms existing single-strategy solutions like metric learning or attention mechanisms, particularly in complex scenarios combining both global and local variations. However, two limitations warrant discussion: (1) The current LS module focuses on rectangular context regions, potentially missing irregular-shaped contexts. Future work could explore deformable convolutions for adaptive context shaping. (2) While our style validation method effectively identifies challenging samples, it relies on pre-trained features that may not optimally represent CD-specific characteristics. Developing task-oriented style metrics could further enhance validation accuracy.
Practically, RCCD’s robustness enables reliable CD in applications requiring cross-seasonal analysis, such as post-disaster assessment and illegal construction monitoring. The framework’s modular design permits integration with various backbone architectures, suggesting broad applicability beyond building CD. Future research directions include extending RCCD to multi-temporal CD scenarios and investigating self-supervised adaptation for unseen style variations.

5. Conclusions

This paper introduced Representation Consistency Change Detection (RCCD), a transformative framework that fundamentally elevates CD in remote sensing by pioneering a novel paradigm of representation consistency learning. This framework fundamentally advances CD in optical remote sensing by systematically addressing visual style discrepancies. Through innovative representation consistency learning integrating global style transfer and local spatial context constraints, RCCD achieves outperformance on the benchmark (87.68% F1 on LEVIR-CD+, 67.60% on S2Looking), demonstrating particular efficacy in challenging scenarios with large visual style differences (90.55% and 68.76% F1 on respective Large-VS subsets). The proposed visual style validation method establishes a novel paradigm for quantitative error analysis in CD research, enabling targeted algorithm improvement. In the future, we will delve into the beneficial impact of temporal visual style inconsistencies in remote sensing imagery on foundational models and CD tasks, aiming to advance the technological frontiers and foster innovative applications within this domain.

Author Contributions

Conceptualization, J.W. and K.S.; methodology, J.W.; writing—original draft preparation, J.W.; writing—review and editing, K.S. and W.L. (Wangbin Li); validation, S.G.; visualization, S.M.; supervision, K.S.; project administration, W.L. (Wenzhuo Li); software, Y.T.; investigation, W.C.; data curation, Y.D.; funding acquisition, K.S. All authors have read and agreed to the published version of the manuscript.

Funding

This research was funded by the National Key Research and Development Program of China (No. 2022YFB3902900), and the National Natural Science Foundation of China Projects (No. 42192583). Funded by State Key Laboratory of Geo-Information Engineering, NO. SKLGIE2023-M-3-2.

Data Availability Statement

No new data were created in this manuscript.

Acknowledgments

The authors would like to thank the editor and reviewers for their contributions to this paper.

Conflicts of Interest

The funders had no role in the design of the study; in the collection, analyses, or interpretation of data; in the writing of the manuscript; or in the decision to publish the results.

References

  1. Zhang, H.; Ma, G.; Fan, H.; Gong, H.; Wang, D.; Zhang, Y. SDCINet: A Novel Cross-Task Integration Network for Segmentation and Detection of Damaged/Changed Building Targets With Optical Remote Sensing Imagery. ISPRS J. Photogramm. Remote Sens. 2024, 218, 422–446. [Google Scholar] [CrossRef]
  2. Lv, Z.; Liu, T.; Benediktsson, J.A.; Falco, N. Land Cover Change Detection Techniques: Very-High-Resolution Optical Images: A Review. IEEE Geosci. Remote Sens. Mag. 2022, 10, 44–63. [Google Scholar] [CrossRef]
  3. Li, W.; Sun, K.; Li, W.; Wei, J.; Miao, S.; Gao, S.; Zhou, Q. Aligning semantic distribution in fusing optical and SAR images for land use classification. ISPRS J. Photogramm. Remote Sens. 2023, 199, 272–288. [Google Scholar] [CrossRef]
  4. Li, W.; Sun, K.; Li, W.; Huang, X.; Wei, J.; Chen, Y.; Cui, W.; Chen, X.; Lv, X. Assisted learning for land use classification: The important role of semantic correlation between heterogeneous images. ISPRS J. Photogramm. Remote Sens. 2024, 208, 158–175. [Google Scholar] [CrossRef]
  5. Gao, S.; Sun, K.; Li, W.; Li, D.; Tan, Y.; Wei, J.; Li, W. A Building Change Detection Framework With Patch-Pairing Single-Temporal Supervised Learning and Metric Guided Attention Mechanism. Int. J. Appl. Earth Obs. Geoinf. 2024, 129, 103785. [Google Scholar] [CrossRef]
  6. Li, D.; Wang, M.; Guo, H.; Jin, W. On China’s Earth Observation System: Mission, Vision and Application. Geo-Spat. Inf. Sci. 2024, 1–19. [Google Scholar] [CrossRef]
  7. Bai, T.; Wang, L.; Yin, D.; Sun, K.; Chen, Y.; Li, W.; Li, D. Deep learning for change detection in remote sensing: A review. Geo-Spat. Inf. Sci. 2023, 26, 262–288. [Google Scholar] [CrossRef]
  8. LeCun, Y.; Bengio, Y.; Hinton, G. Deep learning. Nature 2015, 521, 436–444. [Google Scholar] [CrossRef] [PubMed]
  9. Chen, H.; Shi, Z. A spatial-temporal attention-based method and a new dataset for remote sensing image change detection. Remote Sens. 2020, 12, 1662. [Google Scholar] [CrossRef]
  10. Shen, L.; Lu, Y.; Chen, H.; Wei, H.; Xie, D.; Yue, J.; Chen, R.; Lv, S.; Jiang, B. S2Looking: A Satellite Side-Looking Dataset for Building Change Detection. Remote Sens. 2021, 13, 5094. [Google Scholar] [CrossRef]
  11. Daudt, R.C.; Le Saux, B.; Boulch, A. Fully convolutional siamese networks for change detection. In Proceedings of the 2018 25th IEEE International Conference on Image Processing (ICIP), Athens, Greece, 7–10 October 2018; pp. 4063–4067. [Google Scholar] [CrossRef]
  12. Peng, X.; Zhong, R.; Li, Z.; Li, Q. Optical remote sensing image change detection based on attention mechanism and image difference. IEEE Trans. Geosci. Remote Sens. 2021, 59, 7296–7307. [Google Scholar] [CrossRef]
  13. Ronneberger, O.; Fischer, P.; Brox, T. U-Net: Convolutional Networks for Biomedical Image Segmentation. In Medical Image Computing and Computer-Assisted Intervention—MICCAI 2015; Springer: Cham, Switzerland, 2015; pp. 234–241. [Google Scholar] [CrossRef]
  14. Fang, S.; Li, K.; Shao, J.; Li, Z. SNUNet-CD: A densely connected Siamese network for change detection of VHR images. IEEE Geosci. Remote Sens. Lett. 2022, 19, 1–5. [Google Scholar] [CrossRef]
  15. Papadomanolaki, M.; Vakalopoulou, M.; Karantzalos, K. A deep multitask learning framework coupling semantic segmentation and fully convolutional LSTM networks for urban change detection. IEEE Trans. Geosci. Remote Sens. 2021, 59, 7651–7668. [Google Scholar] [CrossRef]
  16. Chen, H.; Qi, Z.; Shi, Z. Remote sensing image change detection with transformers. IEEE Trans. Geosci. Remote Sens. 2022, 60, 1–14. [Google Scholar] [CrossRef]
  17. Feng, Y.; Xu, H.; Jiang, J.; Liu, H.; Zheng, J. ICIF-Net: Intra-Scale Cross-Interaction and Inter-Scale Feature Fusion Network for Bitemporal Remote Sensing Images Change Detection. IEEE Trans. Geosci. Remote Sens. 2022, 60, 1–13. [Google Scholar] [CrossRef]
  18. Lin, M.; Yang, G.; Zhang, H. Transition Is a Process: Pair-to-Video Change Detection Networks for Very High Resolution Remote Sensing Images. IEEE Trans. Image Process. 2023, 32, 57–71. [Google Scholar] [CrossRef] [PubMed]
  19. Pan, J.; Cui, W.; An, X.; Huang, X.; Zhang, H.; Zhang, S.; Zhang, R.; Li, X.; Cheng, W.; Hu, Y. MapsNet: Multi-level feature constraint and fusion network for change detection. Int. J. Appl. Earth Obs. Geoinf. 2022, 108, 102676. [Google Scholar] [CrossRef]
  20. Liu, Y.; Pang, C.; Zhan, Z.; Zhang, X.; Yang, X. Building change detection for remote sensing images using a dual-task constrained deep siamese convolutional network model. IEEE Geosci. Remote Sens. Lett. 2021, 18, 811–815. [Google Scholar] [CrossRef]
  21. Eftekhari, A.; Samadzadegan, F.; Dadrass Javan, F. Building change detection using the parallel spatial-channel attention block and edge-guided deep network. Int. J. Appl. Earth Obs. Geoinf. 2023, 117, 103180. [Google Scholar] [CrossRef]
  22. Basavaraju, K.S.; Sravya, N.; Lal, S.; Nalini, J.; Reddy, C.S.; Dell’Acqua, F. UCDNet: A Deep Learning Model for Urban Change Detection From Bi-Temporal Multispectral Sentinel-2 Satellite Images. IEEE Trans. Geosci. Remote Sens. 2022, 60, 1–10. [Google Scholar] [CrossRef]
  23. Gao, S.; Li, W.; Sun, K.; Wei, J.; Chen, Y.; Wang, X. Built-Up Area Change Detection Using Multi-Task Network with Object-Level Refinement. Remote Sens. 2022, 14, 957. [Google Scholar] [CrossRef]
  24. Pang, C.; Wu, J.; Ding, J.; Song, C.; Xia, G.S. Detecting building changes with off-nadir aerial images. Sci. China Inf. Sci. 2023, 66, 140306. [Google Scholar] [CrossRef]
  25. Shi, Q.; Liu, M.; Li, S.; Liu, X.; Wang, F.; Zhang, L. A deeply supervised attention metric-based network and an open aerial image dataset for remote sensing change detection. IEEE Trans. Geosci. Remote Sens. 2022, 60, 1–16. [Google Scholar] [CrossRef]
  26. Shen, Q.; Huang, J.; Wang, M.; Tao, S.; Yang, R.; Zhang, X. Semantic feature-constrained multitask siamese network for building change detection in high-spatial-resolution remote sensing imagery. ISPRS J. Photogramm. Remote Sens. 2022, 189, 78–94. [Google Scholar] [CrossRef]
  27. Lei, J.; Gu, Y.; Xie, W.; Li, Y.; Du, Q. Boundary Extraction Constrained Siamese Network for Remote Sensing Image Change Detection. IEEE Trans. Geosci. Remote Sens. 2022, 60, 1–13. [Google Scholar] [CrossRef]
  28. Liu, T.; Gong, M.; Lu, D.; Zhang, Q.; Zheng, H.; Jiang, F.; Zhang, M. Building Change Detection for VHR Remote Sensing Images via Local–Global Pyramid Network and Cross-Task Transfer Learning Strategy. IEEE Trans. Geosci. Remote Sens. 2022, 60, 1–17. [Google Scholar] [CrossRef]
  29. Wang, L.; Li, Y.; Zhang, M.; Shen, X.; Peng, W.; Shi, W. MSFF-CDNet: A Multiscale Feature Fusion Change Detection Network for Bi-Temporal High-Resolution Remote Sensing Image. IEEE Geosci. Remote Sens. Lett. 2023, 20, 1–5. [Google Scholar] [CrossRef]
  30. Huang, Y.; Li, X.; Du, Z.; Shen, H. Spatiotemporal Enhancement and Interlevel Fusion Network for Remote Sensing Images Change Detection. IEEE Trans. Geosci. Remote Sens. 2024, 62, 1–14. [Google Scholar] [CrossRef]
  31. Zhang, C.; Yue, P.; Tapete, D.; Jiang, L.; Shangguan, B.; Huang, L.; Liu, G. A deeply supervised image fusion network for change detection in high resolution bi-temporal remote sensing images. ISPRS J. Photogramm. Remote Sens. 2020, 166, 183–200. [Google Scholar] [CrossRef]
  32. Ding, Q.; Shao, Z.; Huang, X.; Altan, O. DSA-Net: A novel deeply supervised attention-guided network for building change detection in high-resolution remote sensing images. Int. J. Appl. Earth Obs. Geoinf. 2021, 105, 102591. [Google Scholar] [CrossRef]
  33. Wang, D.; Chen, X.; Jiang, M.; Du, S.; Xu, B.; Wang, J. ADS-Net: An Attention-Based deeply supervised network for remote sensing image change detection. Int. J. Appl. Earth Obs. Geoinf. 2021, 101, 102348. [Google Scholar] [CrossRef]
  34. Lebedev, M.A.; Vizilter, Y.V.; Vygolov, O.V.; Knyaz, V.A.; Rubis, A.Y. Change detection in remote sensing images using conditional adversarial networks. ISPRS-Int. Arch. Photogramm. Remote Sens. Spatial Inf. Sci. 2018, XLII-2, 565–571. [Google Scholar] [CrossRef]
  35. Deepanshi; Barkur, R.; Suresh, D.; Lal, S.; Reddy, C.S.; Diwakar, P.G. RSCDNet: A Robust Deep Learning Architecture for Change Detection From Bi-Temporal High Resolution Remote Sensing Images. IEEE Trans. Emerg. Top. Comput. Intell. 2023, 7, 537–551. [Google Scholar] [CrossRef]
  36. Chen, Z.; Zhou, Y.; Wang, B.; Xu, X.; He, N.; Jin, S.; Jin, S. EGDE-Net: A building change detection method for high-resolution remote sensing imagery based on edge guidance and differential enhancement. ISPRS J. Photogramm. Remote Sens. 2022, 191, 203–222. [Google Scholar] [CrossRef]
  37. Guo, H.; Su, X.; Wu, C.; Du, B.; Zhang, L. SAAN: Similarity-Aware Attention Flow Network for Change Detection With VHR Remote Sensing Images. IEEE Trans. Image Process. 2024, 33, 2599–2613. [Google Scholar] [CrossRef] [PubMed]
  38. Liu, Z.; Mao, H.; Wu, C.Y.; Feichtenhofer, C.; Darrell, T.; Xie, S. A ConvNet for the 2020s. In Proceedings of the 2022 IEEE/CVF Conference on Computer Vision and Pattern Recognition (CVPR), New Orleans, LA, USA, 18–24 June 2022; pp. 11966–11976. [Google Scholar] [CrossRef]
  39. Hendrycks, D.; Gimpel, K. Bridging Nonlinearities and Stochastic Regularizers with Gaussian Error Linear Units. In Proceedings of the International Conference Learning Representations (ICLR), Toulon, France, 24–26 April 2017. [Google Scholar]
  40. He, K.; Zhang, X.; Ren, S.; Sun, J. Deep Residual Learning for Image Recognition. In Proceedings of the 2016 IEEE Conference on Computer Vision and Pattern Recognition (CVPR), Las Vegas, NV, USA, 27–30 June 2016; pp. 770–778. [Google Scholar] [CrossRef]
  41. Otsu, N. A Threshold Selection Method from Gray-Level Histograms. IEEE Trans. Syst. Man. Cybern. B Cybern. 1979, 9, 62–66. [Google Scholar] [CrossRef]
  42. Loshchilov, I.; Hutter, F. Decoupled Weight Decay Regularization. In Proceedings of the International Conference on Learning Representations (ICLR), New Orleans, LA, USA, 6–9 May 2019. [Google Scholar]
  43. Wei, J.; Sun, K.; Li, W.; Li, W.; Gao, S.; Miao, S.; Zhou, Q.; Liu, J. Robust change detection for remote sensing images based on temporospatial interactive attention module. Int. J. Appl. Earth Obs. Geoinf. 2024, 128, 103767. [Google Scholar] [CrossRef]
  44. Selvaraju, R.R.; Cogswell, M.; Das, A.; Vedantam, R.; Parikh, D.; Batra, D. Grad-cam: Visual explanations from deep networks via gradient-based localization. In Proceedings of the 2017 IEEE International Conference on Computer Vision (ICCV), Venice, Italy, 22–29 October 2017; pp. 618–626. [Google Scholar] [CrossRef]
Figure 1. Six examples include the T 1 image, T 2 image, false detection map, and label. Red boxes highlight the significant areas of false detection.
Remotesensing 17 00798 g001
Figure 2. Illustration of the RCCD framework, including the representation consistency deep supervisor.
Remotesensing 17 00798 g002
Figure 3. Details of CNX and UDD blocks in various stages of the encoder, decoder, and detector.
Remotesensing 17 00798 g003
Figure 4. Workflow for generating Large- and Small-VS subsets based on visual style differences.
Remotesensing 17 00798 g004
Figure 5. Visualizations of different methods on S2Looking.
Remotesensing 17 00798 g005
Figure 6. Visualizations of different methods on LEVIR-CD+.
Remotesensing 17 00798 g006
Figure 7. Impact of kernel size (k) and loss weights (LS λ 1 and GS λ 2 ) on F1.
Remotesensing 17 00798 g007
Figure 8. Visual style error validation via content/style differences.
Remotesensing 17 00798 g008
Figure 9. Comparison of feature visualizations for the representational consistency deep supervision method. “w/” indicates that the module is included, while “w/o” denotes its exclusion. The symbol definitions correspond to the formulas presented in Section 2.
Remotesensing 17 00798 g009
Table 1. Distribution of visual differences in the S2Looking and LEVIR-CD+ datasets.
CategoryS2Looking (Pairs)LEVIR-CD+ (Pairs)
C ¯ T C S ¯ T S 559226
C ¯ T C S ¯ < T S 6017
C ¯ < T C S ¯ T S 22449
C ¯ < T C S ¯ < T S 15756
Total1000348
Table 2. Quantitative performance of RCCD and competing methods on the S2Looking. Color convention: best, 2nd-best, and 3rd-best.
S2LookingFull DatasetLarge-VS SubsetSmall-VS Subset
MethodPre.Rec.F1IoUPre.Rec.F1IoUPre.Rec.F1IoU
UNet62.5542.4750.5933.8664.5143.4451.9235.0665.1341.0250.3433.63
FC-Diff61.6561.2561.4544.3558.0162.7760.2943.1564.4960.3362.3445.28
FC-Conc68.6753.8860.3843.2567.3655.2860.7343.6070.6352.1760.0142.87
IFNet66.1848.5656.0238.9061.1850.7755.4938.4068.6545.5154.7437.68
SNUNet69.5453.8260.6843.5567.7655.7561.1744.0669.9952.9260.2743.13
L-UNet72.4653.2661.3944.2970.5153.7561.0043.8873.3351.9560.8243.70
BIT67.7455.9561.2844.1867.0556.4461.2944.1869.3154.6361.1043.99
ICIF-Net72.6850.7759.7842.6368.9452.9759.9142.7775.4347.5858.3641.20
P2V68.7451.6158.9641.8067.0452.7559.0441.8970.4650.4258.7741.62
CDNeXt-B70.8960.2965.1648.3369.4562.1665.6148.8273.8158.5365.2948.47
CDNeXt70.7863.0866.7150.0572.1562.2166.8150.1670.0862.3666.0049.25
RCCD-B72.9659.9165.7949.0274.1159.8066.1949.4771.9758.8764.7647.89
RCCD71.1064.4367.6051.0671.8365.9468.7652.4071.3663.7767.3550.77
Table 3. Quantitative performance of RCCD and competing methods on the LEVIR-CD+. Color convention: best, 2nd-best, and 3rd-best.
LEVIR-CD+Full DatasetLarge-VS SubsetSmall-VS Subset
MethodPre.Rec.F1IoUPre.Rec.F1IoUPre.Rec.F1IoU
UNet73.2375.2574.2259.0181.4373.2077.0962.7366.4172.3869.2752.98
FC-Diff78.2073.5475.8061.0382.5871.1976.4661.8972.1771.8272.0056.25
FC-Conc71.0577.6674.2158.9980.9675.1977.9763.8960.1477.0467.5551.00
IFNet85.8382.5684.1672.6690.8585.0987.8778.3781.2877.5579.3765.80
SNUNet85.3280.1882.6770.4688.3581.4184.7473.5283.3576.1779.6066.11
L-UNet83.5679.5581.5168.7986.9279.1182.8370.6980.3477.1078.6964.86
BIT84.4883.2283.8472.1889.5085.0287.2077.3080.1978.9679.5766.08
ICIF-Net85.5081.2583.3271.4090.5582.5186.3575.9779.8877.6078.7264.91
P2V78.0080.9479.4565.9084.3481.9183.1171.1070.8077.2473.8858.58
CDNeXt-B86.6483.9985.2974.3589.3285.5787.4077.6384.9580.6482.7470.56
CDNeXt89.6884.7387.1477.2192.7386.3689.4380.8887.0181.4784.1572.63
RCCD-B88.5284.4786.4576.1391.5985.8488.6279.5785.6382.6584.1172.58
RCCD89.1186.3087.6878.0691.9289.2190.5582.7386.0282.9584.4673.10
Table 4. Impact of UDDRes repetition (m) on LS module performance. Color convention: best, 2nd-best, and 3rd-best.
m-UDDResLEVIR-CD+S2Looking
F1IoUF1IoU
167.2850.6987.3677.55
266.6549.9886.7976.66
366.8150.1687.1177.17
466.7050.0486.5076.21
566.8750.2387.1677.25
Table 5. Impact of LS module kernel size (k) on S2Looking and LEVIR-CD+, encompassing Parameters (Params) count, FLoating-Point OPerations (FLOPs), and F1-score comparisons in RCCD training. Color convention: best, 2nd-best, and 3rd-best.
kS2Looking F1LEVIR-CD+ F1Params (M)FLOPs (G)
166.3487.0549.6117.46
366.4187.2449.6517.48
567.0087.2849.7217.52
766.6187.3649.8217.57
966.4387.1749.9617.64
1166.9787.5050.1317.73
1366.6687.0550.3417.84
1567.1387.2050.5817.96
1766.7387.2250.8618.10
1967.0287.0651.1718.26
2166.7187.0251.5218.44
2366.9187.0451.9018.63
2566.4287.1152.3118.84
2766.8787.1252.7619.07
Table 6. Impact of the loss weighting parameter for LS ( λ 1 ) and GS ( λ 2 ) modules on S2Looking and LEVIR-CD+ performance. Color convention: best, 2nd-best, and 3rd-best.
ValueS2Looking F1LEVIR-CD+ F1
λ 1 λ 2 λ 1 λ 2
066.9366.9387.0287.00
0.0167.2167.1387.6986.94
0.02567.0867.5787.3886.93
0.0567.5967.0887.2587.03
0.07567.0167.5587.0786.78
0.167.267.5686.8987.39
0.2566.7567.5786.7986.85
0.566.3867.1386.9987.01
0.7566.3067.4787.0787.02
166.3667.4586.4586.40
Table 7. Effectiveness of representation consistency learning across encoder–decoder stages. ✓: LS/GS module activated, ✗: LS/GS module deactivated. Color convention: best, 2nd-best, and 3rd-best.
Encoder StageDecoder StageS2LookingLEVIR-CD+
E1E2E3E4D4D3D2D1F1IoUF1IoU
66.4749.7787.1777.17
66.7450.0987.0777.10
67.0950.4786.8676.77
66.5149.8287.1777.25
66.6750.0187.0477.05
66.3149.6087.0076.99
66.3649.6586.9776.95
66.4749.7886.5476.27
65.7949.0286.4576.13
66.7650.1187.2777.41
66.2949.5887.2077.30
67.2850.6987.4277.66
Table 8. Computational complexity analysis across different methodologies, encompassing Parameters (Params) count, FLoating-Point OPerations (FLOPs), and F1-score comparisons on S2Looking and LEVIR-CD+ datasets. Lower values of Params and FLOPs indicate superior efficiency. RCCD-training denotes computational complexity during inference in the training phase, while RCCD-valid represents RCCD complexity during validation procedures. Color convention: best, 2nd-best, and 3rd-best.
MethodS2Looking F1LEVIR-CD+ F1Params (M)FLOPs (G)
UNet50.5974.221.353.58
FC-Diff61.4575.801.354.73
FC-Conc60.3874.211.545.33
IFNet56.0284.1635.7382.26
SNUNet60.6882.6710.2044.38
L-UNet61.3981.518.4517.33
BIT61.2883.843.048.75
ICIF-Net59.7883.3223.8425.41
P2V58.9679.455.4232.96
CDNeXt66.7187.1439.4215.76
RCCD-training--50.1317.72
RCCD-valid67.6087.6837.8415.18
Disclaimer/Publisher’s Note: The statements, opinions and data contained in all publications are solely those of the individual author(s) and contributor(s) and not of MDPI and/or the editor(s). MDPI and/or the editor(s) disclaim responsibility for any injury to people or property resulting from any ideas, methods, instructions or products referred to in the content.

