

Terrestrial and Martian Paleo-Hydrologic Environment Systematic Comparison with ASI PRISMA and NASA CRISM Hyperspectral Instruments

 ,
,  , , and
Abstract
1. Introduction
2. Materials and Methods
2.1. PRISMA
- L1: Top-of-atmosphere spectral radiance.
- L2B: At-surface radiance
- L2C: At-surface reflectance
- L2D: At-surface geocoded reflectance
2.2. CRISM
- Targeted Mode (Full-Resolution Targeted—FRT), with high spectral (545–655 channels) and spatial resolution (~18–36 m/pixel), used for detailed mineralogical studies.
- Half-Resolution Targeted (HRL) and Half-Resolution Short (HRS), with lower spatial resolution (~36–72 m/pixel) but still with high spectral detail, used when full resolution is not needed.
- Along-Track Summing (ATS), used to reduce data volume by averaging pixels in the along-track direction, used for specific targets where high spatial resolution is unnecessary.
- Mapping Mode (MSP—Multispectral Survey Mode): lower spectral resolution (~72 selected channels) but covering large areas, used for broad mineralogical mapping.
- Emplacement (EPF—Emission Phase Function Mode), which acquires multiple views of a target at different angles, helping study surface photometric properties and atmospheric effects.
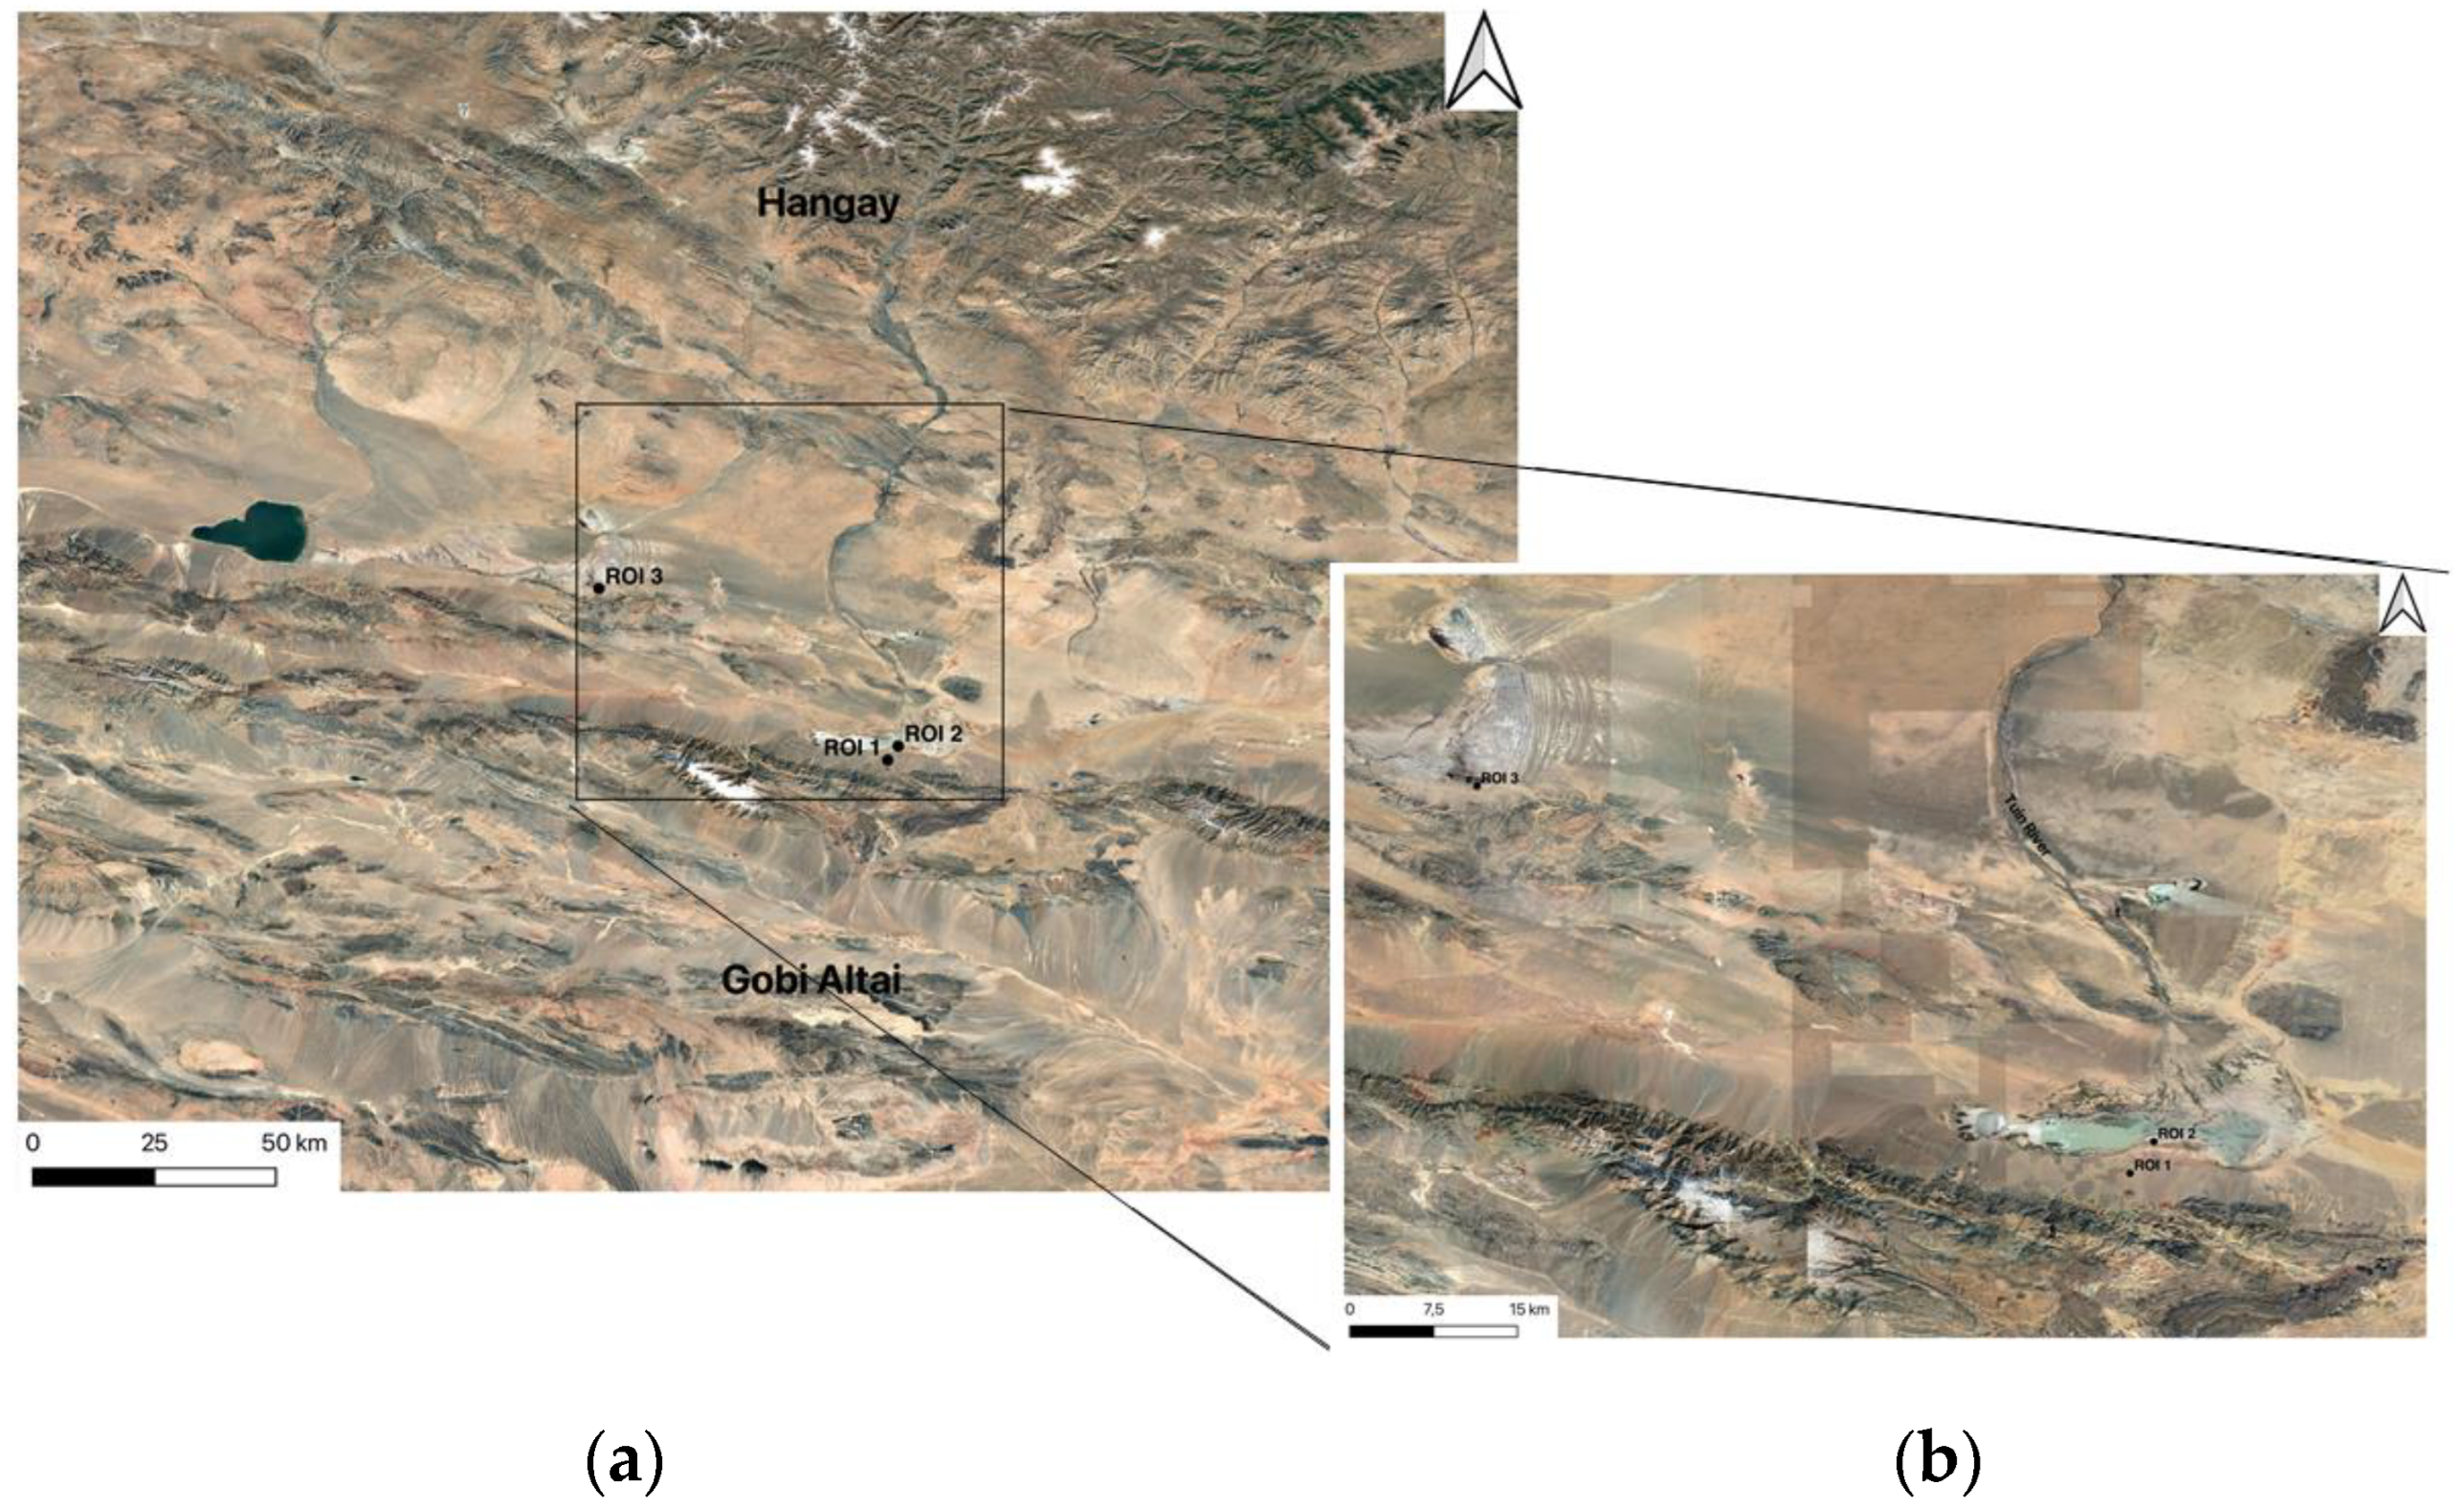
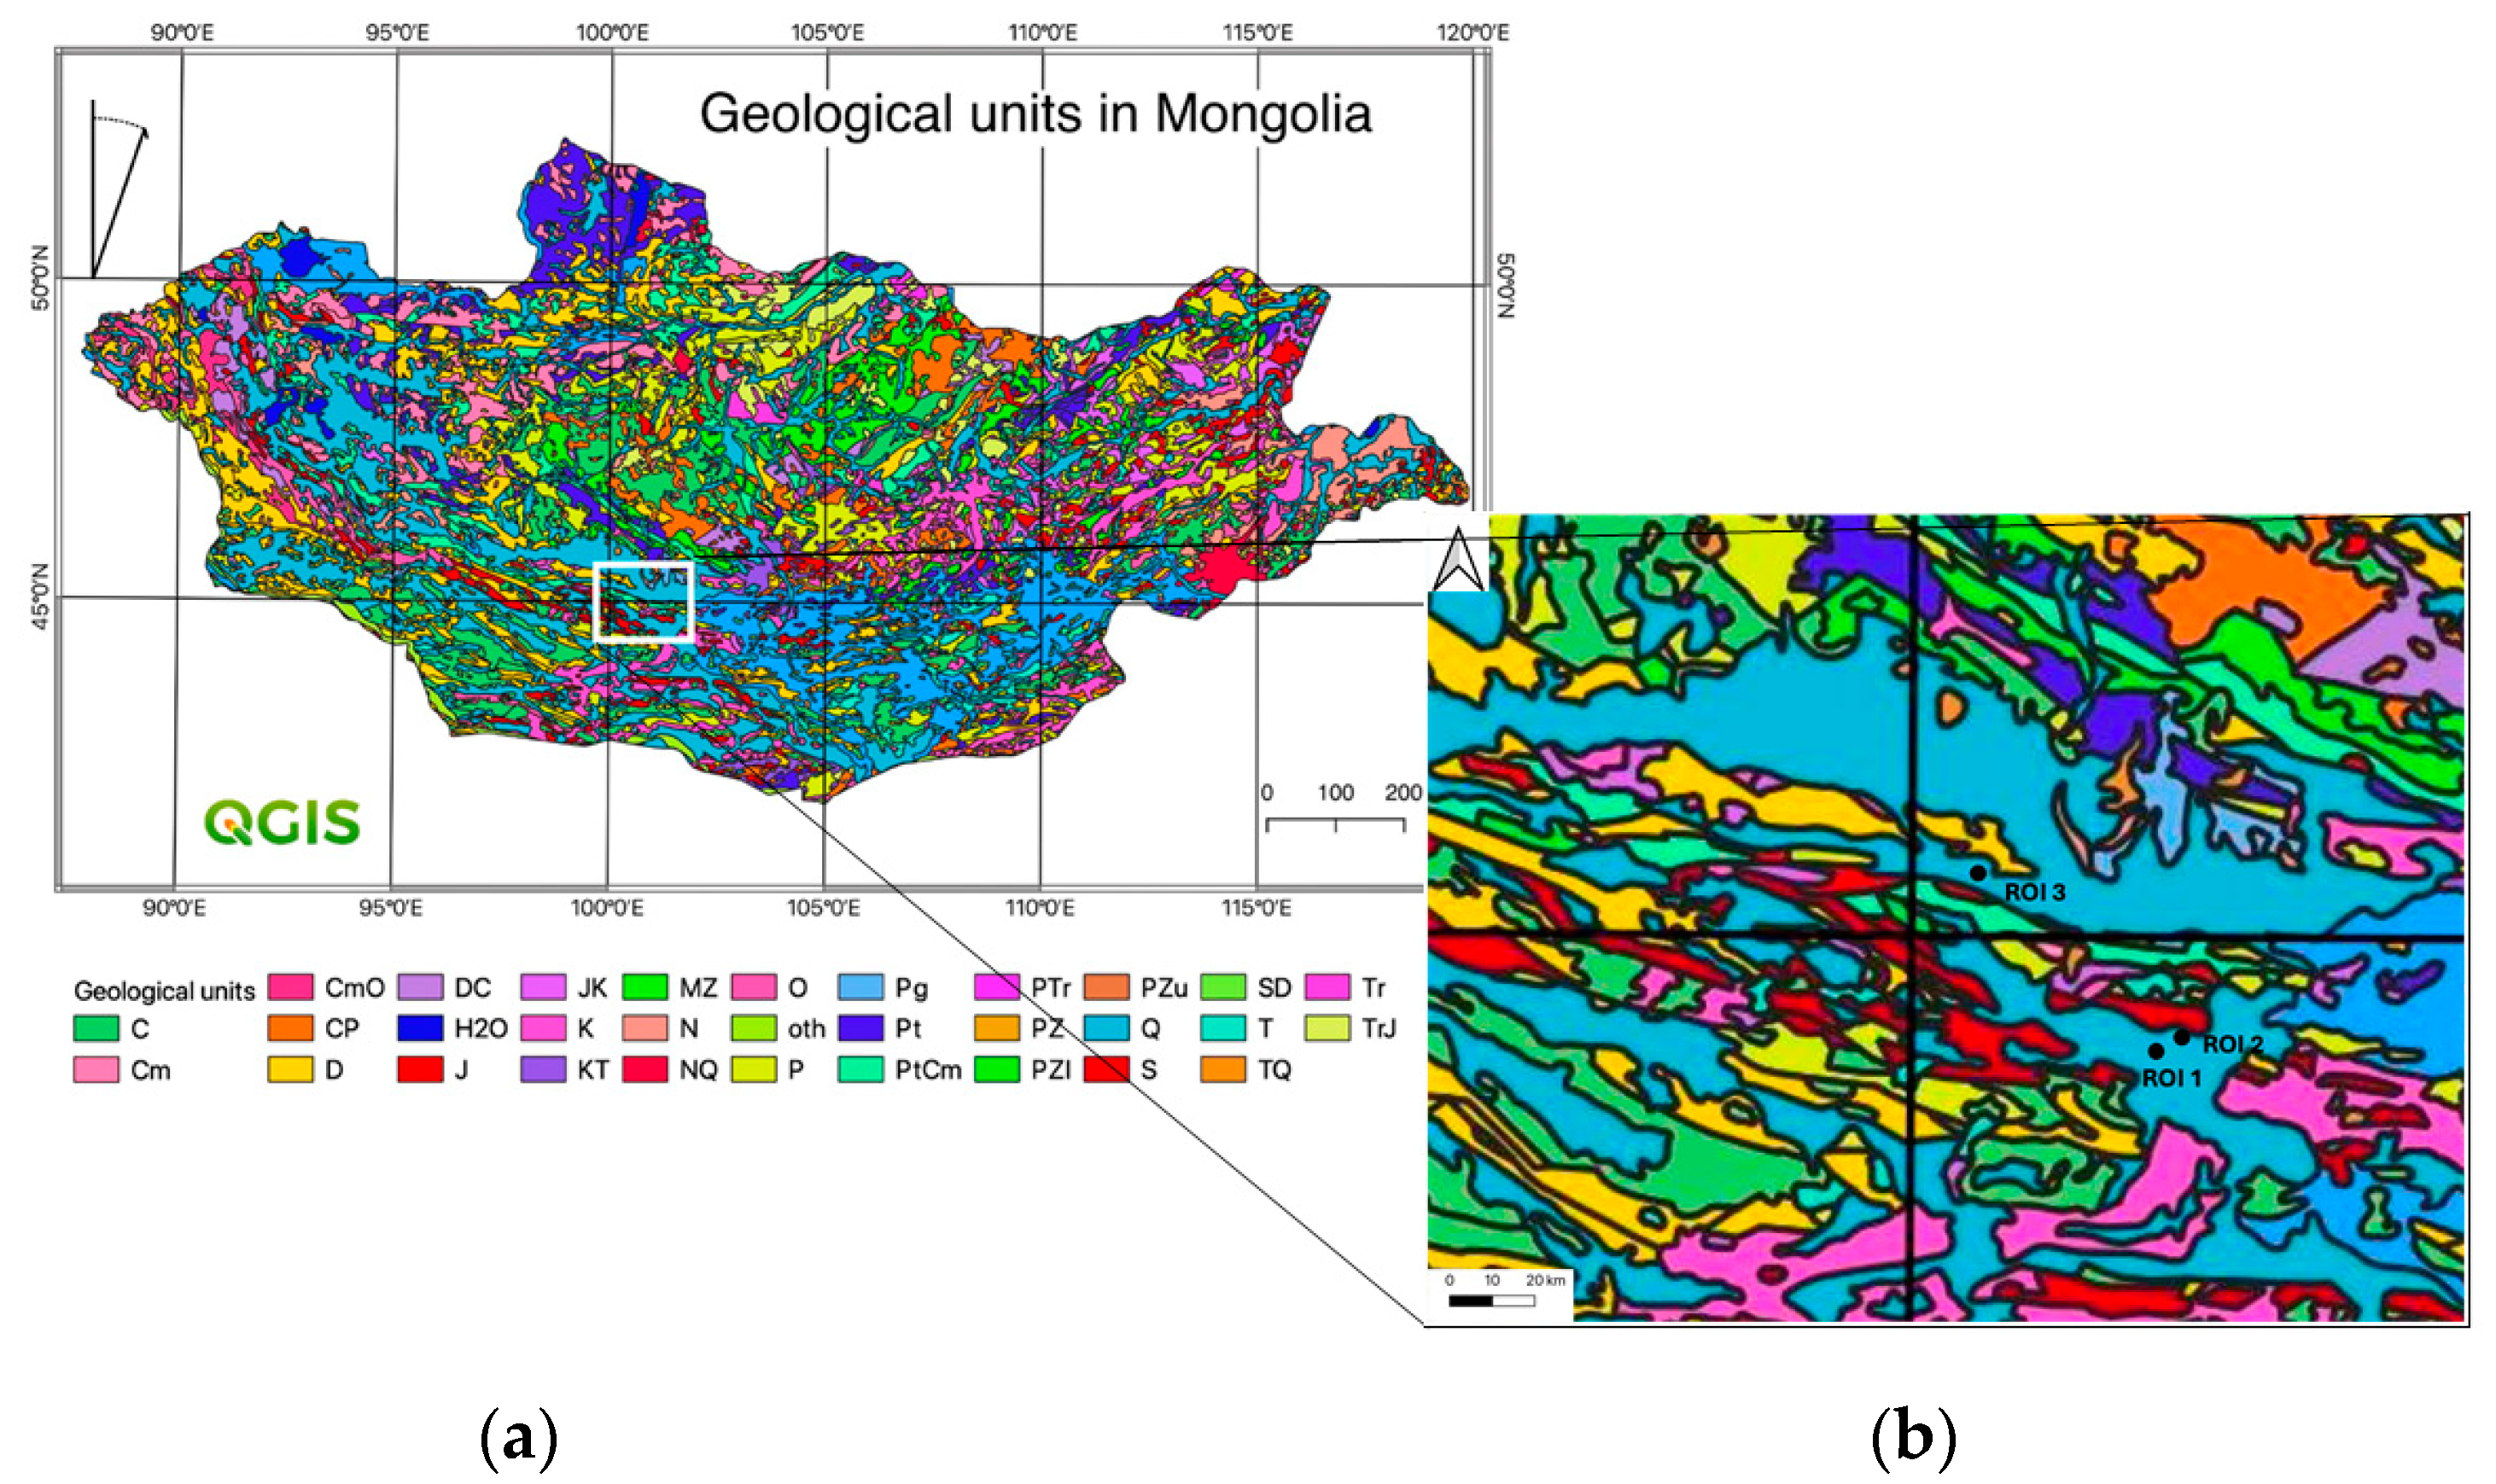
2.3. Selection of the Studied Regions
2.4. PRISMA Data Reduction
3. Results
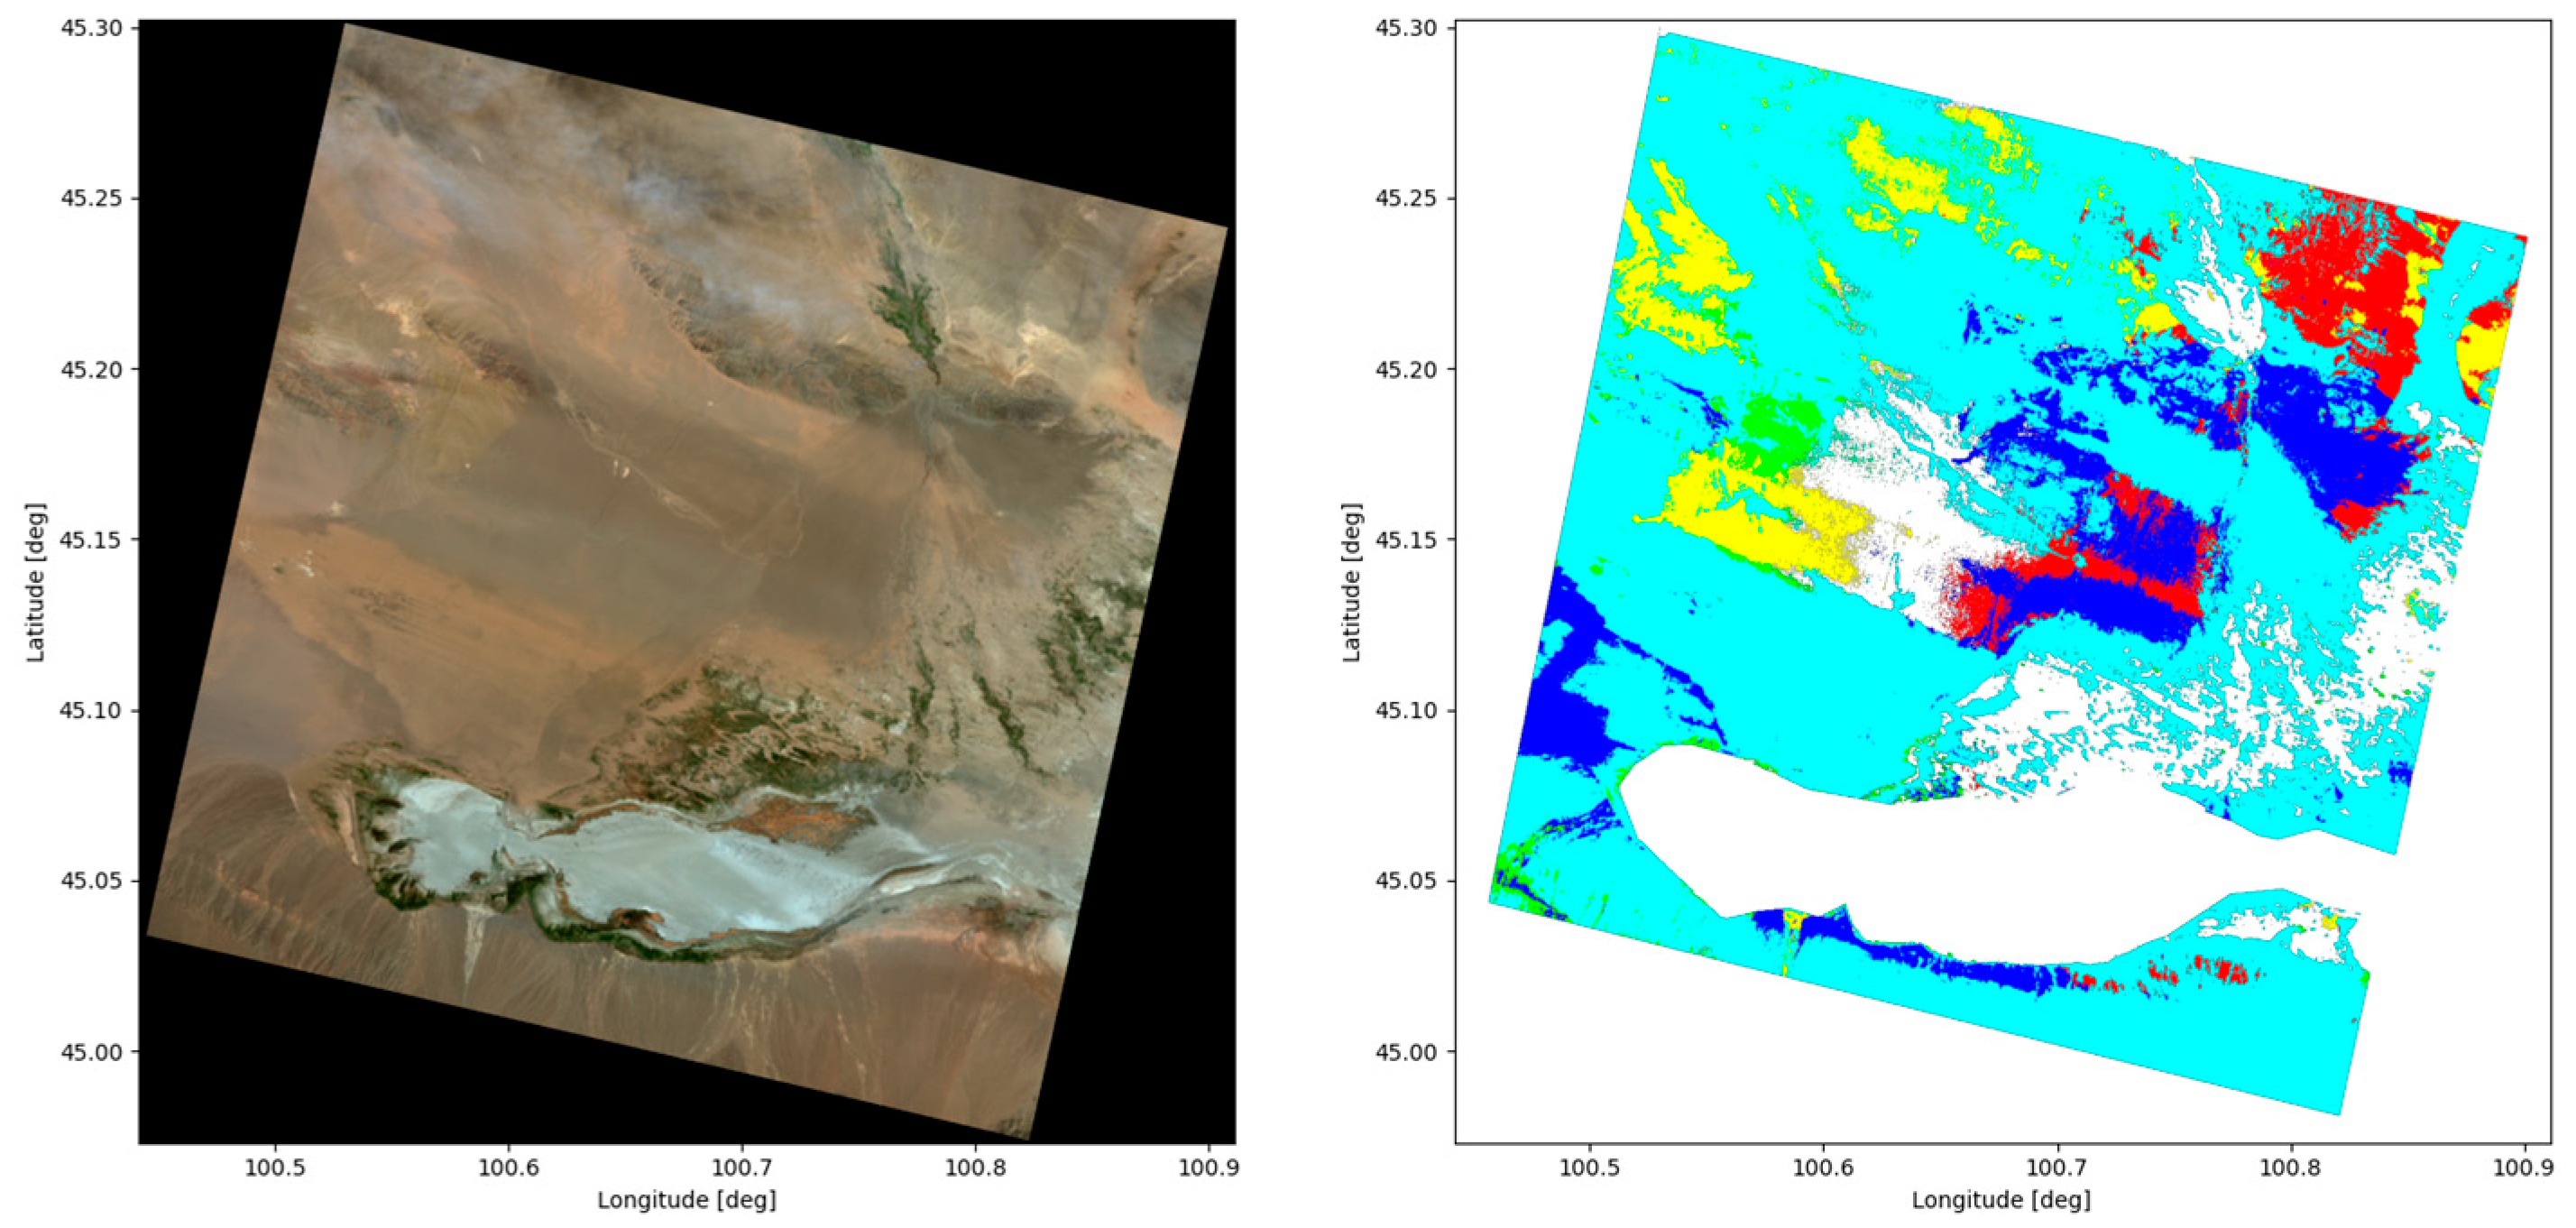
3.1. Gobi Lakes
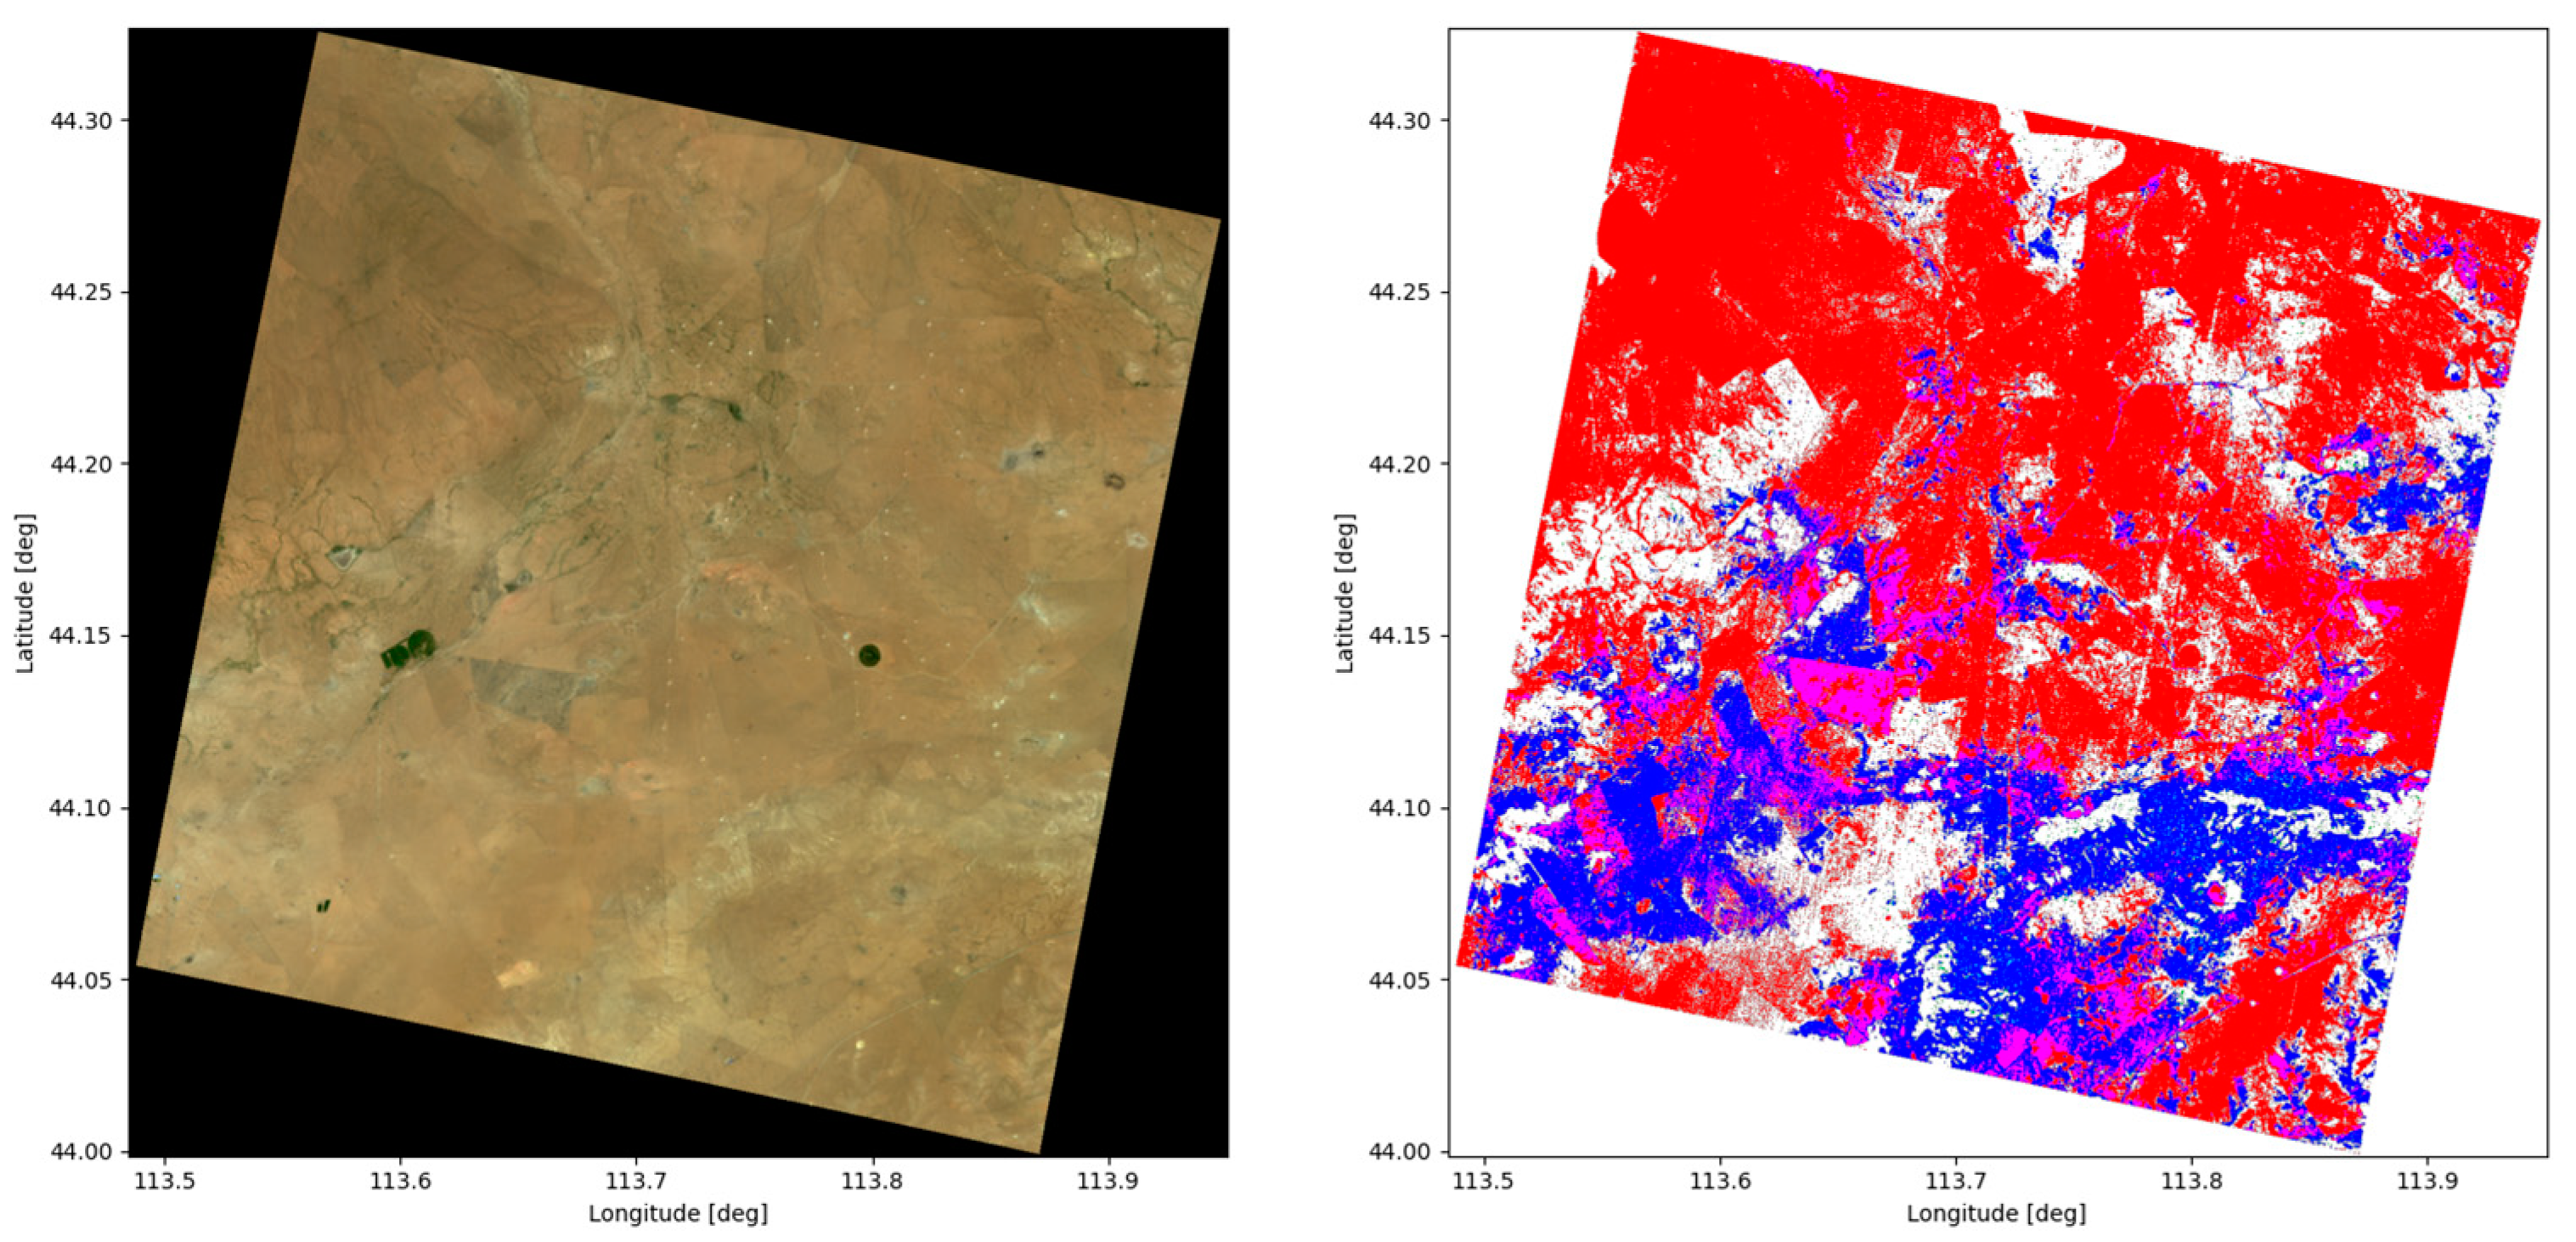
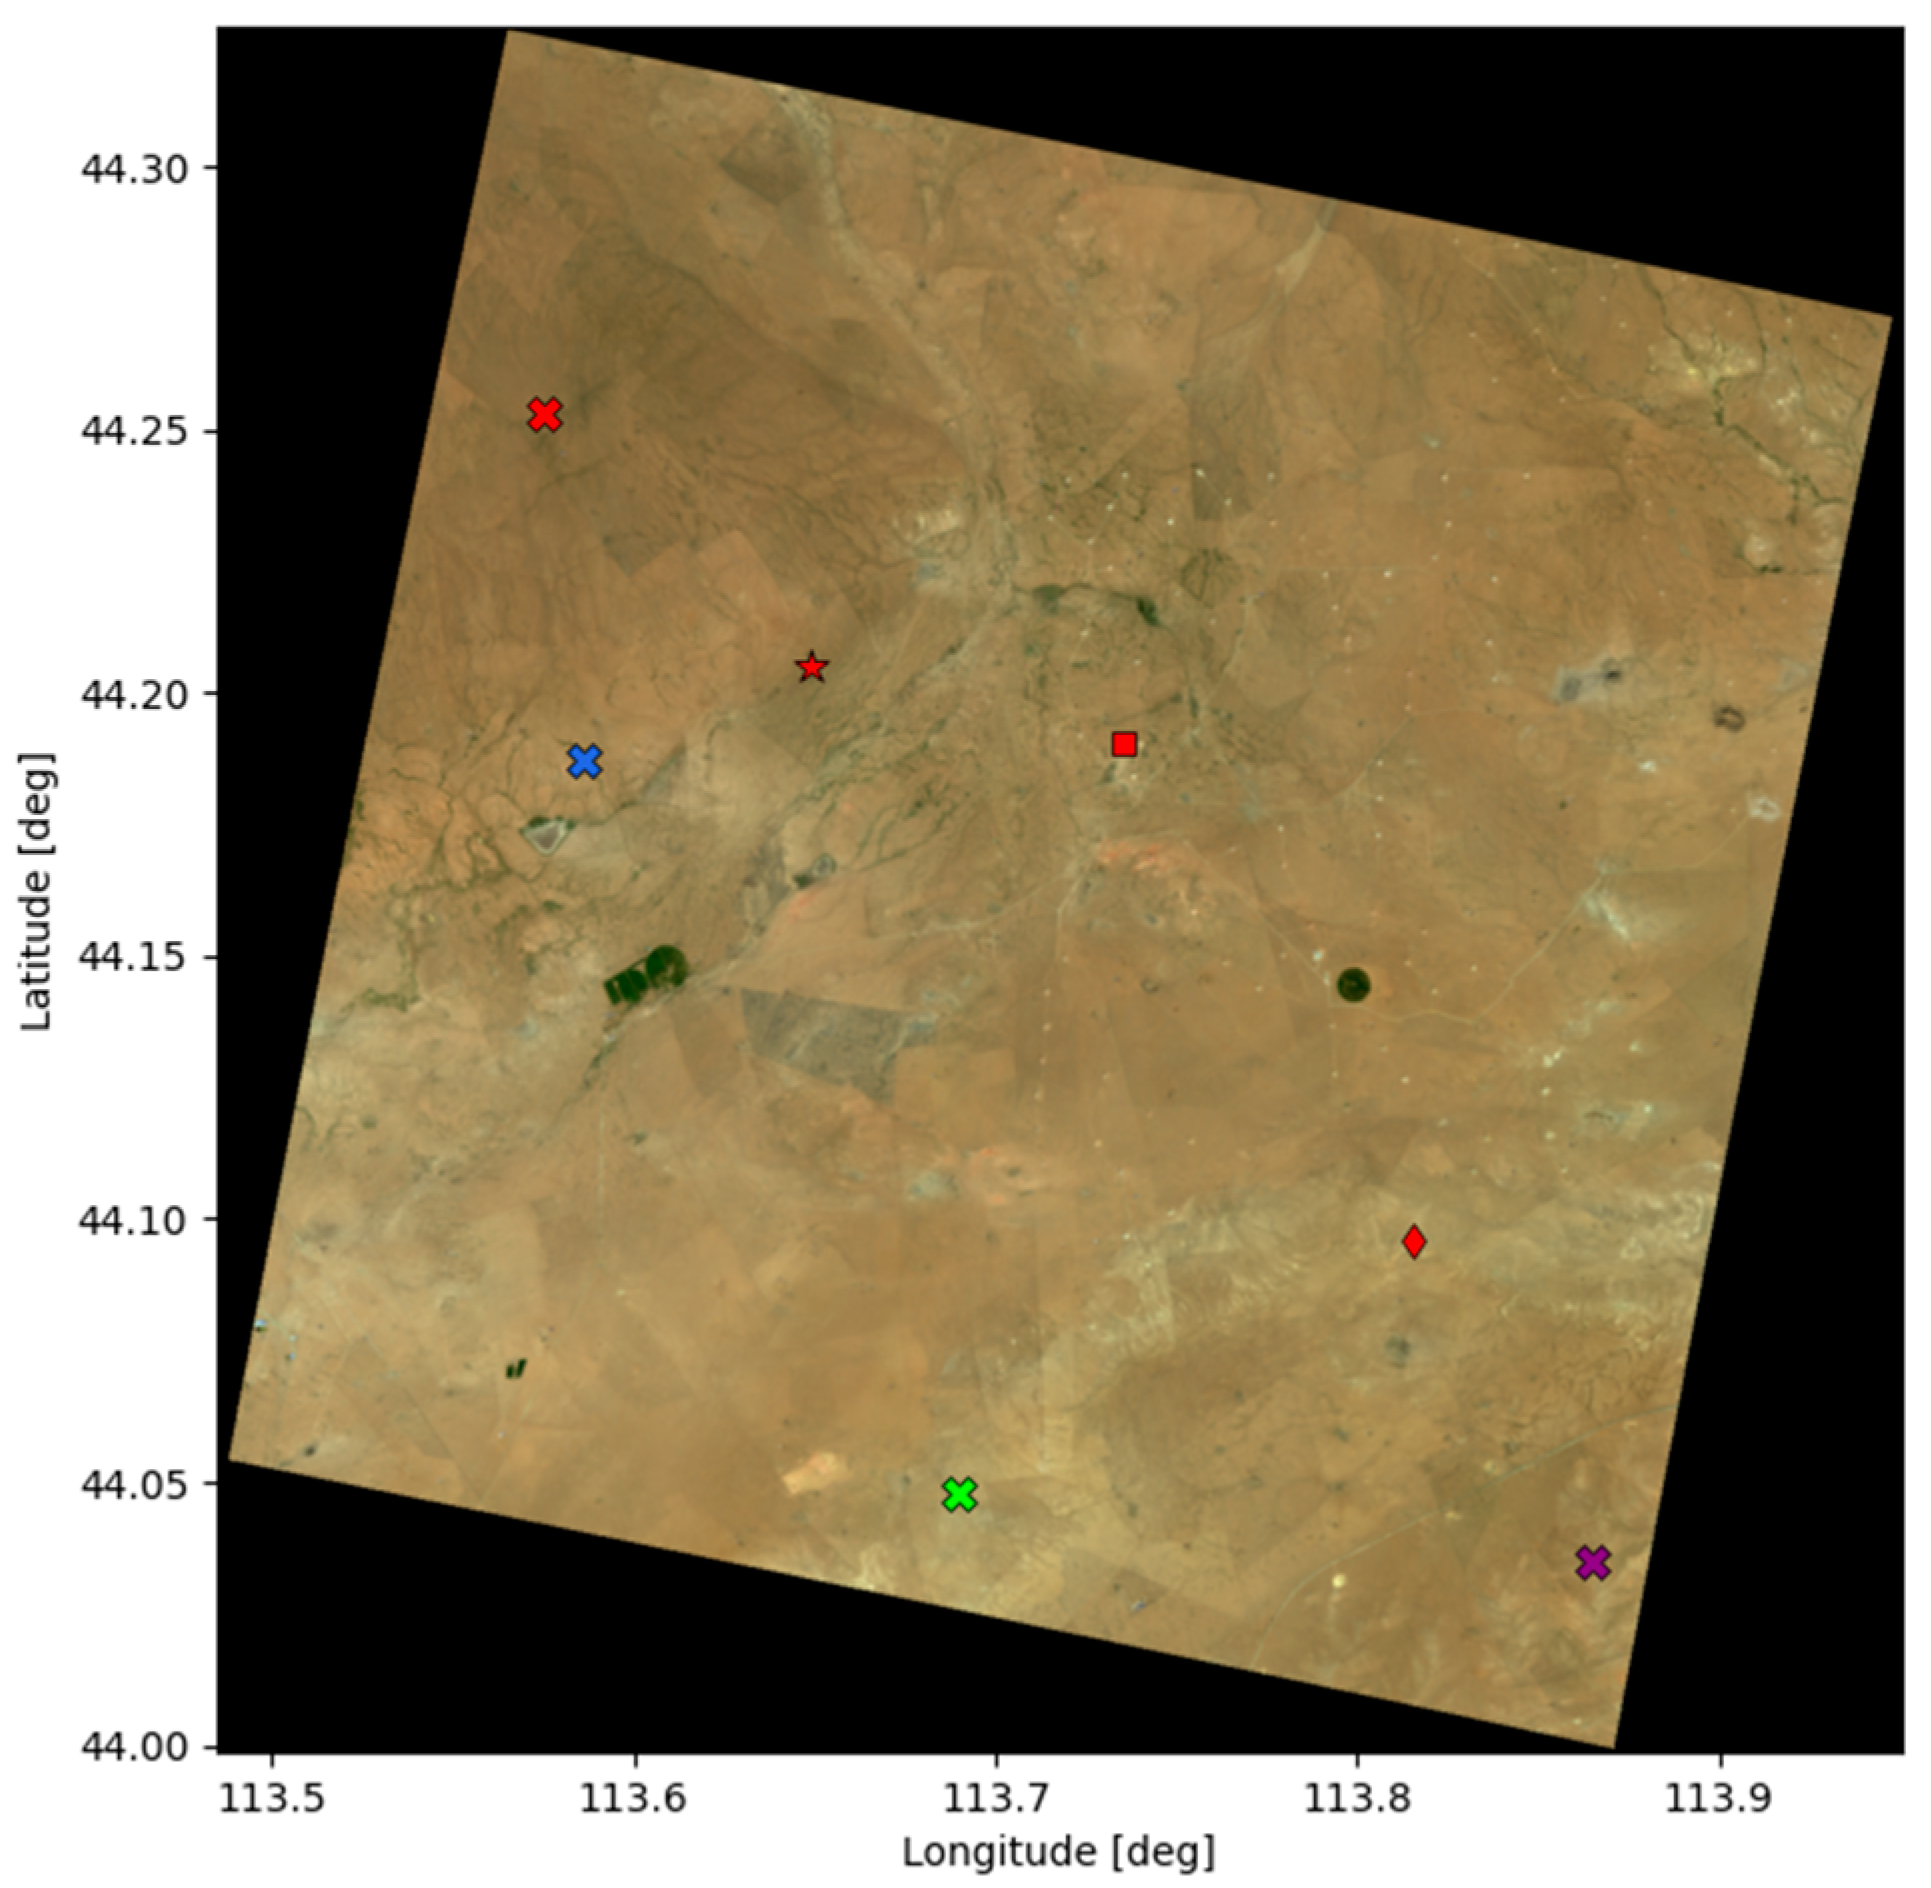
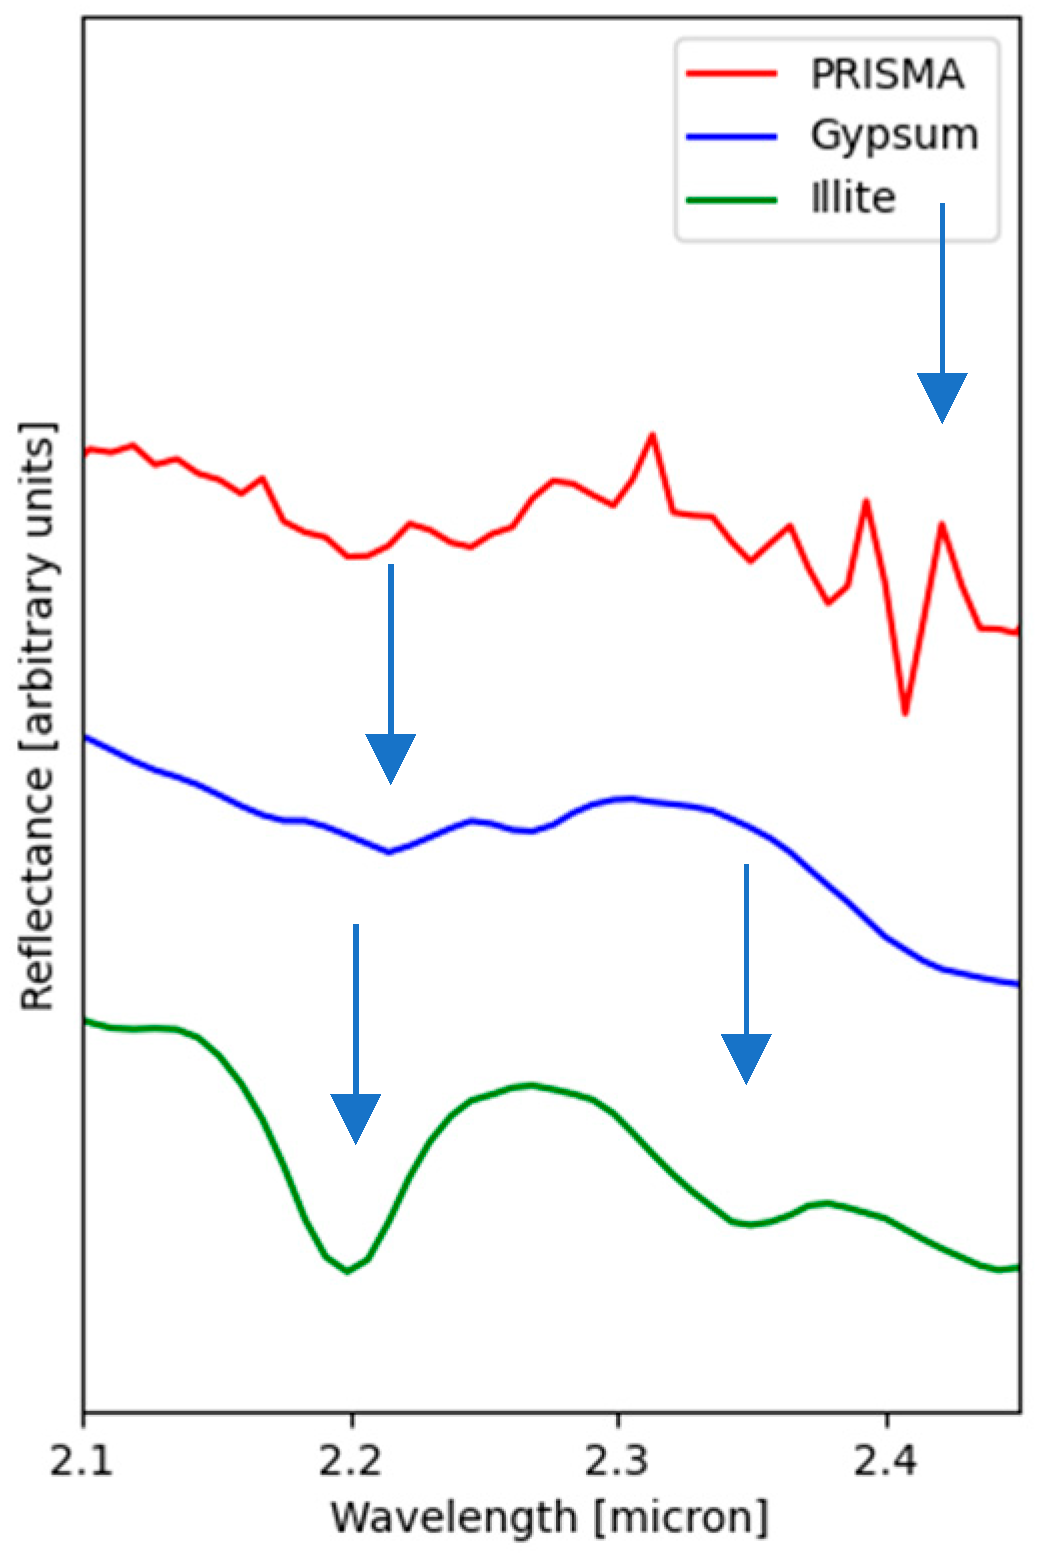
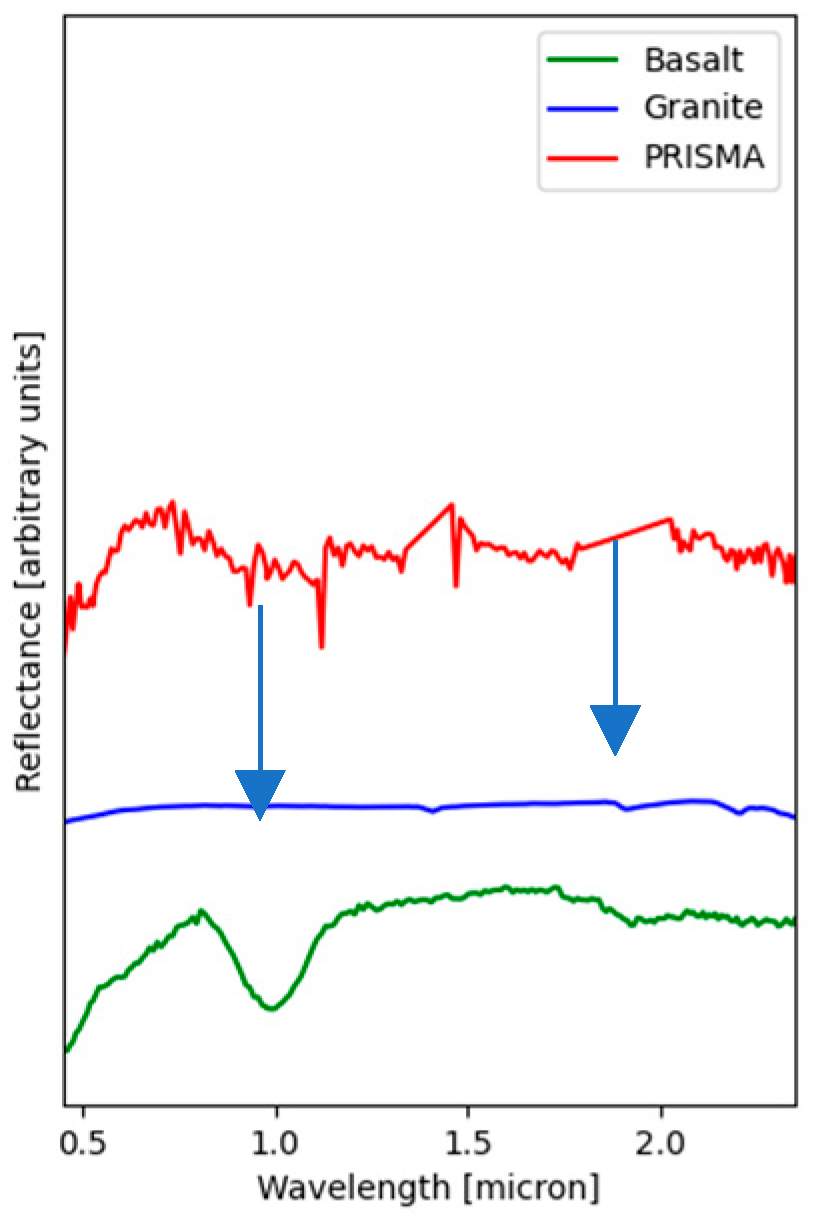
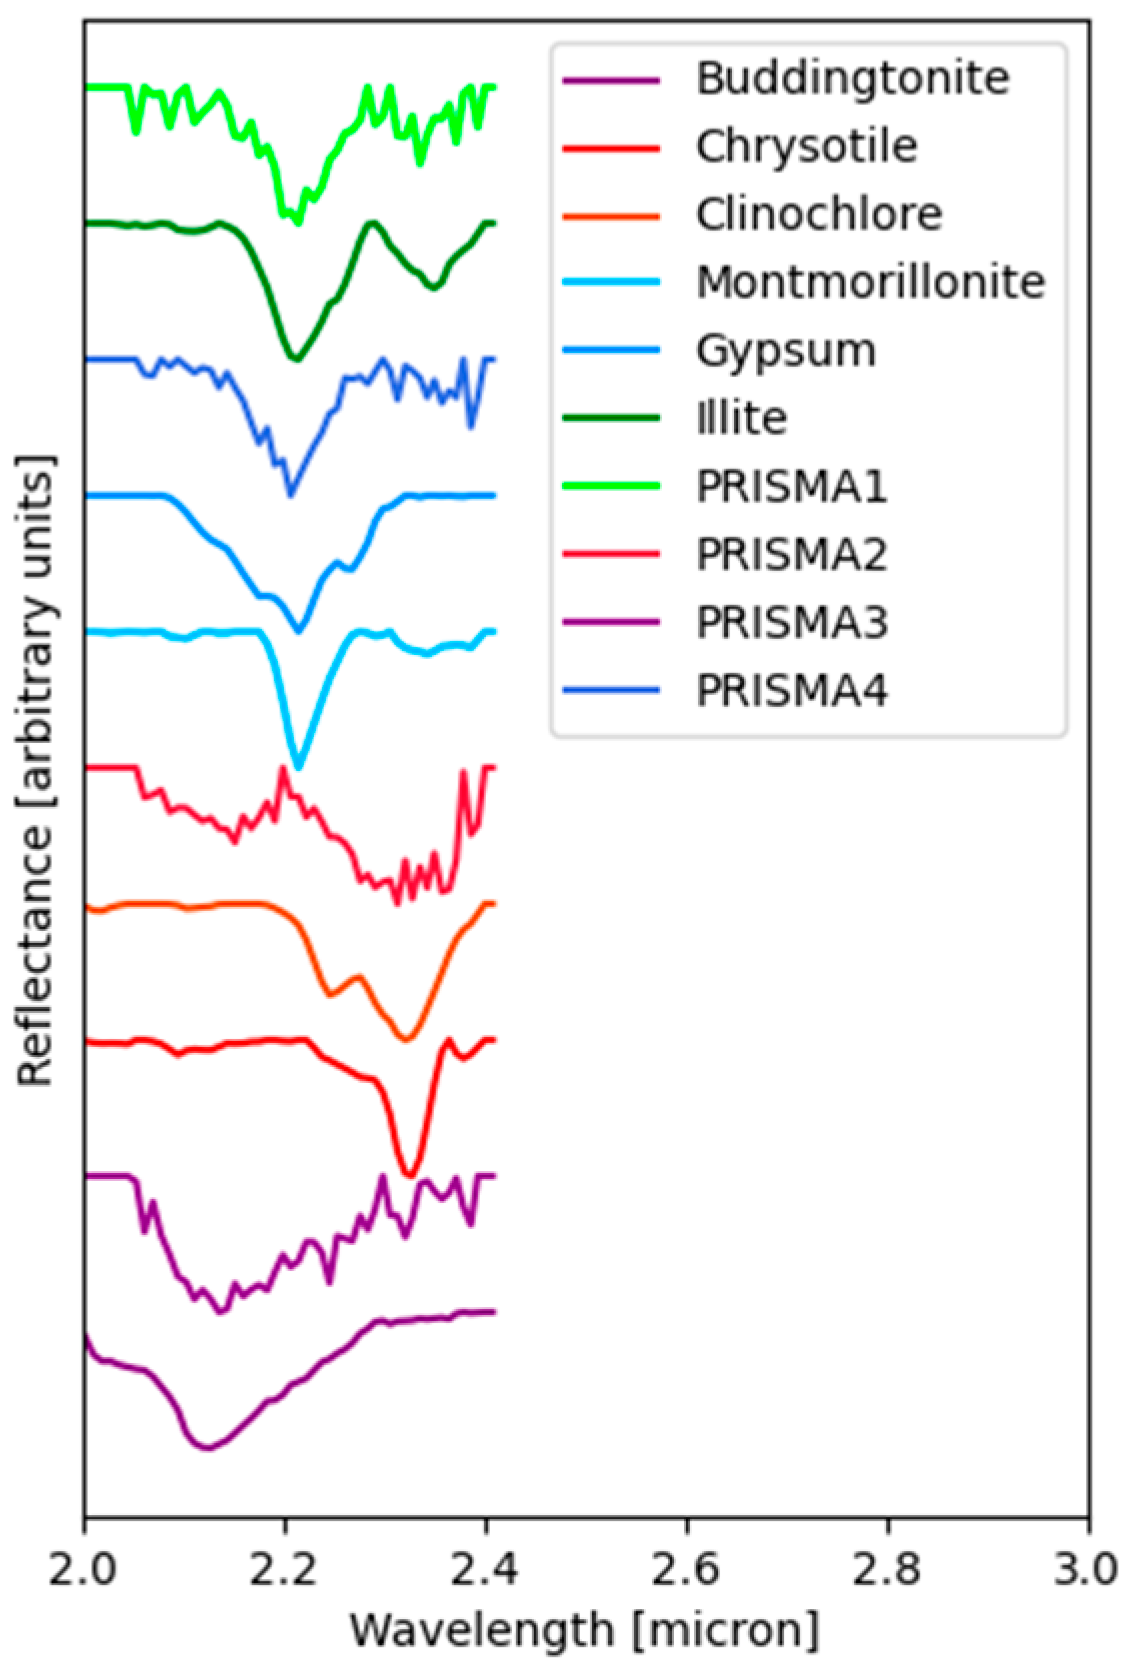
3.2. Dalinouer Area
4. Discussion
5. Conclusions
Author Contributions
Funding
Data Availability Statement
Acknowledgments
Conflicts of Interest
References
- Hand, E. Phoenix descending. Nature 2008, 453, 142. [Google Scholar] [CrossRef] [PubMed]
- Changela, H.G.; Chatzitheodoridis, E.; Antunes, A.; Beaty, D.; Bouw, K.; Bridges, J.C.; Capova, K.A.; Cockell, C.S.; Conley, C.A.; Dadachova, E.; et al. Mars: New insights and unresolved questions. Int. J. Astrobiol. 2022, 21, 46. [Google Scholar] [CrossRef]
- Calvin, W.M.; King, T.V.V.; Clark, R.N. Hydrous carbonates on Mars?: Evidence from Mariner 6/7 infrared spectrometer and ground-based telescopic spectra. J. Geophys. Res. 1994, 99, 14659–14676. [Google Scholar] [CrossRef]
- Erard, S.; Bibring, J.-P.; Mustard, J.; Forni, O.; Head, J.W.; Hurtrez, S.; Langevin, Y.; Pieters, C.M.; Rosenqvist, J.; Sotin, C.; et al. Spatial variations in composition of the Valles Marineris and Isidis Planitia regions of Mars derived from ISM data. In IN: Lunar and Planetary Science Conference, 21st, Houston, TX, 12–16 March 1990, Proceedings (A91-42332 17-91); CNES-Supported Research; Lunar and Planetary Institute: Houston, TX, USA, 1991; pp. 437–455. [Google Scholar]
- Murchie, S.; Arvidson, R.; Bedini, P.; Beisser, K.; Bibring, J.; Bishop, J.; Boldt, J.; Cavender, P.; Choo, T.; Clancy, R.T.; et al. Compact reconnaissance imaging spectrometer for Mars (CRISM) on Mars reconnaissance orbiter (MRO). J. Geophys. Res. Planets 2007, 112, e5. [Google Scholar] [CrossRef]
- Domagal-Goldman, S.D.; Wright, K.E.; Adamala, K.; De La Rubia, L.A.; Bond, J.; Dartnell, L.R.; Goldman, A.D.; Lynch, K.; Naud, M.-E.; Paulino-Lima, I.G.; et al. The astrobiology primer v2. 0. Astrobiology 2016, 16, 561. [Google Scholar] [CrossRef]
- Kereszturi, A. Review of Wet Environment Types on Mars with Focus on Duration and Volumetric Issues. Astrobiology 2012, 12, 586–600. [Google Scholar] [CrossRef] [PubMed]
- Caporusso, G.; Lopinto, E.; Lorusso, R.; Rosa, L.; Rocchina, G.; Girolamo, D.M.; Patrizia, S. The Hyperspectral Prisma Mission in Operation. In Proceedings of the IGARSS 2020—2020 IEEE International Geoscience and Remote Sensing Symposium, Waikoloa, HI, USA, 26 September–2 October 2020. [Google Scholar] [CrossRef]
- Ovchinnikova, A.; Jaumann, R.; Walter, S.H.; Gross, C.; Zuschneid, W.; Postberg, F. A modeling approach for water and sediment transport in Jezero crater on Mars based on new geomorphological evidence. Icarus 2025, 426, 116349. [Google Scholar] [CrossRef]
- Steinmann, V.; Bahia, R.S.; Kereszturi, A. Selecting Erosion-and Deposition-Dominated Zones in the Jezero Delta Using a Water Flow Model for Targeting Future In Situ Mars Surface Missions. Remote Sens. 2024, 16, 3649. [Google Scholar] [CrossRef]
- Holm-Alwmark, S.; Kinch, K.M.; Hansen, M.D.; Shahrzad, S.; Svennevig, K.; Abbey, W.J.; Anderson, R.B.; Calef, F.J.; Gupta, S.; Hauber, E.; et al. Stratigraphic Relationships in Jezero Crater, Mars: Constraints on the Timing of Fluvial-Lacustrine Activity From Orbital Observations. J. Geophys. Res. 2021, 126, e2021JE006840. [Google Scholar] [CrossRef]
- Goudge, T.A.; Milliken, R.E.; Head, J.W.; Mustard, J.F.; Fassett, C.I. Sedimentological evidence for a deltaic origin of the western fan deposit in Jezero crater, Mars and implications for future exploration. Earth Planet. Sci. Lett. 2017, 458, 357–365. [Google Scholar] [CrossRef]
- Goudge, T.A.; Mustard, J.F.; Head, J.W.; Fassett, C.I.; Wiseman, S.M. Assessing the mineralogy of the watershed and fan deposits of the Jezero crater paleolake system, Mars. J. Geophys. Res. Planets 2015, 120, 775–808. [Google Scholar] [CrossRef]
- Ori, G.G.; Rossi, A.P.; Komatsu, G.; Ormo, J.; Rainone, M.; Signanini, P.; Torrese, P.; Sammartino, P.; Madonna, R.; Baliva, A.; et al. Seismic Data from the Main Crater of the Proposed Sirente Meteorite Crater Field (Central Italy). In Proceedings of the 38th Lunar and Planetary Science Conference, (Lunar and Planetary Science XXXVIII), League City, TX, USA, 12–16 March 2007; p. 1092, LPI Contribution No. 1338. [Google Scholar]
- Daxner-Höck, G.; Badamgarav, D. Geological and stratigraphic setting. Annalen des Naturhistorischen Museums in Wien. Serie A für Mineralogie und Petrographie, Geologie und Paläontologie, Anthropologie und Prähistorie. 2006, pp. 1–24. Available online: https://www.jstor.org/stable/41702093 (accessed on 19 February 2025).
- Erdenetsogt, B.O.; Lee, I.; Bat-Erdene, D.; Jargal, L. Mongolian coal-bearing basins: Geological settings, coal characteristics, distribution, and resources. Int. J. Coal Geol. 2009, 80, 87–104. [Google Scholar] [CrossRef]
- Walther, M. Paläoklimatische Untersuchungen zur jungpleistozänen Landschaftsentwicklung im Changai-Bergland und in der nördlichen Gobi. Petermanns Geogr. Mitteilungen 1998, 142, 207–217. [Google Scholar]
- Lehmkuhl, F.; Lang, A. Geomorphological investigations and luminescence dating in the southern part of the Khangay and the Valley of the Gobi Lakes (Central Mongolia). J. Quat. Sci. Publ. Quat. Res. Assoc. 2011, 16, 69–87. [Google Scholar] [CrossRef]
- Lehmkuhl, F.; Nottebaum, V.; Hülle, D. Aspects of late Quaternary geomorphological development in the Khangai Mountains and the Gobi Altai Mountains (Mongolia). Geomorphology 2017, 312, 24–39. [Google Scholar] [CrossRef]
- Van der Wal, J.L.; Nottebaum, V.C.; Stauch, G.; Binnie, S.A.; Batkhishig, O.; Lehmkuhl, F.; Reicherter, K. Geomorphological evidence of active faulting in low seismicity regions—Examples from the valley of Gobi lakes, southern Mongolia. Front. Earth Sci. 2021, 8, 589814. [Google Scholar] [CrossRef]
- Guy, A.; Schulmann, K.; Munschy, M.; Miehe, J.; Edel, J.; Lexa, O.; Fairhead, D. Geophysical constraints for terrane boundaries in southern Mongolia. J. Geophys. Res. Solid Earth 2014, 119, 7966–7991. [Google Scholar] [CrossRef]
- Sekine, Y.; Kitajima, T.; Fukushi, K.; Gankhurel, B.; Tsetsgee, S.; Davaasuren, D.; Matsumiya, H.; Chida, T.; Nakamura, M.; Hasebe, N. Hydrogeochemical Study on Closed-Basin Lakes in Cold and Semi-Arid Climates of the Valley of the Gobi Lakes, Mongolia: Implications for Hydrology and Water Chemistry of Paleolakes on Mars. Minerals 2020, 10, 792. [Google Scholar] [CrossRef]
- Lemenkova, P. Gobi Altai, Khangai and Khentii Mountains mapped by a mixed-method cartographic approach for comparative geophysical analysis. Mong. Geosci. 2021, 26, 62–79. [Google Scholar] [CrossRef]
- Scuderi, L.A.; Mason, D.P. Gobi Desert Deltas as Analogs for Jezero Delta Mars. In Proceedings of the Workshop on Terrestrial Analogs for Planetary Exploration, Online, 16–18 June 2021. LPI Contribution No. 2595, id.8083. [Google Scholar]
- Zhang, M.; Guo, Z. Origin of Late Cenozoic Abaga–Dalinuoer basalts, eastern China: Implications for a mixed pyroxenite–peridotite source related with deep subduction of the Pacific slab. Gondwana Res. 2016, 37, 130–151. [Google Scholar] [CrossRef]
- Chen, S.S.; Fan, Q.C.; Zou, H.B.; Zhao, Y.-W.; Shi, R.-D. Geochemical and Sr–Nd isotopic constraints on the petrogenesis of late Cenozoic basalts from the Abaga area, Inner Mongolia, eastern China. J. Volcanol. Geotherm. Res. 2015, 305, 30–44. [Google Scholar] [CrossRef]
- Geology of Nei Mongol (Inner Mongolia), Northeastern China [1:1,500,000]. Available online: https://www.orrbodies.com/resource/geology-nei-mongol-inner-mongolia-north-eastern-china/ (accessed on 19 February 2025).
- Zhang, T.; Stackhouse, P.W., Jr.; Macpherson, B.; Mikovitz, J.C. A solar azimuth formula that renders circumstantial treatment unnecessary without compromising mathematical rigor: Mathematical setup, application and extension of a formula based on the subsolar point and atan2 function. Renew. Energy 2021, 172, 1333–1340. [Google Scholar] [CrossRef]
- Manzari, P.; Camplone, V.; Zinzi, A.; Zinzi, A.; Ammannito, E.; Sindoni, G.; Zucca, F.; Polenta, G. Exploiting Prisma Hypespectral Data to Support CRISM Measurements on Paleo-Hydrological Environments on Mars. In Proceedings of the 13th Workshop on Hyperspectral Image and Signal Processing: Evolution in Remote Sensing, WHISPERS, Athens, Greece, 31 October–2 November 2023. [Google Scholar]
- Kokaly, R.F.; Clark, R.N.; Swayze, G.A.; Livo, K.E.; Hoefen, T.M.; Pearson, N.C.; Wise, R.A.; Benzel, W.M.; Low, H.A.; Driscoll, R.L.; et al. Data: U.S. Geological Survey Data Release; Version 7; USGS Spectral Library, 2017. Available online: https://www.sciencebase.gov/catalog/item/5807a2a2e4b0841e59e3a18d (accessed on 19 February 2025).
- Geological Map of Inner Mongolia Autonomous Region, China. Available online: https://ikcest-drr.data.ac.cn/map/m02c7 (accessed on 19 February 2025).
- Brown, A.J.; Viviano, C.E.; Goudge, T.A. Olivine-Carbonate Mineralogy of the Jezero Crater Region. J. Geophys. Res. Planets 2020, 125, e2019JE006011. [Google Scholar] [CrossRef]
- Ehlmann, B.L.; Mustard, J.F.; Fassett, C.I.; Schon, S.C.; Iii, J.W.H.; Marais, D.J.D.; Grant, J.A.; Murchie, S.L. Clay minerals in delta deposits and organic preservation potential on Mars. Nat. Geosci. 2008, 1, 355–358. [Google Scholar] [CrossRef]
- Ehlmann, B.L.; Mustard, J.F.; Murchie, S.L.; Poulet, F.; Bishop, J.L.; Brown, A.J.; Calvin, W.M.; Clark, R.N.; Marais, D.J.D.; Milliken, R.E.; et al. Orbital Identification of Carbonate-Bearing Rocks on Mars. Science 2008, 322, 1828–1832. [Google Scholar] [CrossRef] [PubMed]
- Horgan, B.H.N.; Anderson, R.B.; Dromart, G.; Amador, E.S.; Rice, M.S. The mineral diversity of Jezero crater: Evidence for possible lacustrine carbonates on Mars. Icarus 2020, 339, 113526. [Google Scholar] [CrossRef]
- Phua, Y.Y.; Ehlmann, B.L.; Siljestrom, S.; Czaja, A.D.; Beck, P.; Connell, S.; Wiens, R.C.; Jakubek, R.S.; Williams, R.M.E.; Zorzano, M.; et al. Characterizing Hydrated Sulfates and Altered Phases in Jezero Crater Fan and Floor Geologic Units with SHERLOC on Mars 2020. J. Geophys. Res. Planets 2024, 129, e2023JE008251. [Google Scholar] [CrossRef]
- Bosak, T.; Shuster, D.L.; Scheller, E.L.; Siljeström, S.; Zawaski, M.J.; Mandon, L.; Simon, J.I.; Weiss, B.P.; Stack, K.M.; Mansbach, E.N.; et al. Astrobiological Potential of Rocks Acquired by the Perseverance Rover at a Sedimentary Fan Front in Jezero Crater, Mars. AGU Adv. 2024, 5, e2024AV001241. [Google Scholar] [CrossRef]


| Area | Latitude Range [Deg] | Longitude Range [Deg] | PRISMA Product Name |
|---|---|---|---|
| Gobi Lake | 44.974–45.302 | 100.442–100.911 | PRS_L2D_STD_20210629041841_20210629041845_0001 |
| Dalinouer | 43.999–44.327 | 113.485–113.951 | PRS_L2D_STD_20230829032232_20230829032236_0001 |
Disclaimer/Publisher’s Note: The statements, opinions and data contained in all publications are solely those of the individual author(s) and contributor(s) and not of MDPI and/or the editor(s). MDPI and/or the editor(s) disclaim responsibility for any injury to people or property resulting from any ideas, methods, instructions or products referred to in the content. |
© 2025 by the authors. Licensee MDPI, Basel, Switzerland. This article is an open access article distributed under the terms and conditions of the Creative Commons Attribution (CC BY) license (https://creativecommons.org/licenses/by/4.0/).
Share and Cite
Zinzi, A.; Manzari, P.; Camplone, V.; Ammannito, E.; Sindoni, G.; Zucca, F.; Polenta, G. Terrestrial and Martian Paleo-Hydrologic Environment Systematic Comparison with ASI PRISMA and NASA CRISM Hyperspectral Instruments. Remote Sens. 2025, 17, 758. https://doi.org/10.3390/rs17050758
Zinzi A, Manzari P, Camplone V, Ammannito E, Sindoni G, Zucca F, Polenta G. Terrestrial and Martian Paleo-Hydrologic Environment Systematic Comparison with ASI PRISMA and NASA CRISM Hyperspectral Instruments. Remote Sensing. 2025; 17(5):758. https://doi.org/10.3390/rs17050758
Chicago/Turabian StyleZinzi, Angelo, Paola Manzari, Veronica Camplone, Eleonora Ammannito, Giuseppe Sindoni, Francesco Zucca, and Gianluca Polenta. 2025. "Terrestrial and Martian Paleo-Hydrologic Environment Systematic Comparison with ASI PRISMA and NASA CRISM Hyperspectral Instruments" Remote Sensing 17, no. 5: 758. https://doi.org/10.3390/rs17050758
APA StyleZinzi, A., Manzari, P., Camplone, V., Ammannito, E., Sindoni, G., Zucca, F., & Polenta, G. (2025). Terrestrial and Martian Paleo-Hydrologic Environment Systematic Comparison with ASI PRISMA and NASA CRISM Hyperspectral Instruments. Remote Sensing, 17(5), 758. https://doi.org/10.3390/rs17050758