Next Article in Journal
High-Precision Localization Tracking and Motion State Estimation of Ground-Based Moving Target Utilizing Unmanned Aerial Vehicle High-Altitude Reconnaissance
Next Article in Special Issue
Copernicus Sentinel-3 OLCI Level-1B Radiometry Product Validation Status After Six Years in Constellation by Three Independent Expert Groups
Previous Article in Journal
Quantitative Remote Sensing Supporting Deep Learning Target Identification: A Case Study of Wind Turbines
Previous Article in Special Issue
Evaluation of In Situ FAPAR Measurement Protocols Using 3D Radiative Transfer Simulations
 
 
remotesensing-logo
Article Menu

Article Menu

Article

Fiducial Reference Measurements for Greenhouse Gases (FRM4GHG): Validation of Satellite (Sentinel-5 Precursor, OCO-2, and GOSAT) Missions Using the COllaborative Carbon Column Observing Network (COCCON)

by
Mahesh Kumar Sha
1,*,
Saswati Das
2,
Matthias M. Frey
3,4,
Darko Dubravica
4,
Carlos Alberti
4,
Bianca C. Baier
5,
Dimitrios Balis
6,
Alejandro Bezanilla
7,
Thomas Blumenstock
4,
Hartmut Boesch
8,
Zhaonan Cai
9,
Jia Chen
10,
Alexandru Dandocsi
11,
Martine De Mazière
1,
Stefani Foka
12,
Omaira García
13,
Lawson David Gillespie
14,15,
Konstantin Gribanov
16,
Jochen Gross
4,
Michel Grutter
7,
Philip Handley
5,17,
Frank Hase
4,
Pauli Heikkinen
18,
Neil Humpage
19,20,
Nicole Jacobs
14,
Sujong Jeong
21,
Tomi Karppinen
18,
Matthäus Kiel
2,
Rigel Kivi
18,
Bavo Langerock
1,
Joshua Laughner
2,
Morgan Lopez
22,
Maria Makarova
12,
Marios Mermigkas
6,
Isamu Morino
3,
Nasrin Mostafavipak
14,23,
Anca Nemuc
11,
Timothy Newberger
5,17,
Hirofumi Ohyama
3,
William Okello
24,
Gregory Osterman
2,
Hayoung Park
21,
Razvan Pirloaga
11,25,
David F. Pollard
26,
Uwe Raffalski
27,
Michel Ramonet
22,
Eliezer Sepúlveda
13,28,
William R. Simpson
29,
Wolfgang Stremme
7,
Colm Sweeney
5,
Noemie Taquet
7,28,
Chrysanthi Topaloglou
6,
Qiansi Tu
4,30,
Thorsten Warneke
8,
Debra Wunch
14,
Vyacheslav Zakharov
16 and
Minqiang Zhou
9
add Show full author list remove Hide full author list
1
Royal Belgian Institute for Space Aeronomy, Ringlaan-3, 1180 Brussels, Belgium
2
Jet Propulsion Laboratory, California Institute of Technology, 4800 Oak Grove Dr, Pasadena, CA 91011, USA
3
National Institute for Environmental Studies (NIES), Onogawa 16-2, Tsukuba 305-8506, Japan
4
Institute of Meteorology and Climate Research Atmospheric Trace Gases and Remote Sensing (IMK-ASF), Karlsruhe Institute of Technology, Hermann-von-Helmholtz-Platz 1, 76344 Leopoldshafen, Germany
5
NOAA Global Monitoring Laboratory, 325 Broadway, Boulder, CO 80305, USA
6
Laboratory of Atmospheric Physics, Department of Physics, Aristotle University of Thessaloniki, 54124 Thessaloniki, Greece
7
Instituto de Ciencias de la Atmósfera y Cambio Climático, Universidad Nacional Autónoma de México, Circuito Exterior s/n, Ciudad Universitaria, Ciudad de México 04510, Mexico
8
Institute of Environmental Physics, University of Bremen, Otto-Hahn-Allee 1, 28359 Bremen, Germany
9
CNRC, Institute of Atmospheric Physics, Chinese Academy of Sciences, Beichenxilu-81, Beijing 100029, China
10
School of Computation, Information and Technology, Technical University of Munich, Theresienstr. 90, 80333 Munich, Germany
11
National Institute of Research and Development for Optoelectronics, 409 Atomistilor Street, 077125 Magurele, Romania
12
Department of Atmospheric Physics, Saint Petersburg State University, Ulyanovskay st., 1, 198504 St. Petersburg, Russia
13
State Meteorological Agency of Spain (AEMet), La Marina-20, 38001 Santa Cruz de Tenerife, Spain
14
Department of Physics, University of Toronto, 60 St. George Street, Toronto, ON M5S 1A1, Canada
15
Environment and Climate Change Canada, Climate Chemistry Measurements and Research, 4905 Dufferin St., Toronto, ON M3H 5T4, Canada
16
Institute of Natural Sciences and Mathematics, Ural Federal University, 19 Mira Street, 620002 Ekaterinburg, Russia
17
Cooperative Institute for Research in Environmental Sciences (CIRES), University of Colorado-Boulder, 216 UCB, Boulder, CO 80309, USA
18
Space and Earth Observation Centre, Finnish Meteorological Institute, Tähteläntie 62, 99600 Sodankylä, Finland
19
National Centre for Earth Observation, University of Leicester, Space Park Leicester, 92 Corporation Road, Leicester LE4 5SP, UK
20
School of Physics and Astronomy, University of Leicester, Space Park Leicester, 92 Corporation Road, Leicester LE4 5SP, UK
21
Department of Environmental Planning, Graduate School of Environmental Studies, Seoul National University, 1 Gwanak-ro, Gwanak-gu, Seoul 08826, Republic of Korea
22
Laboratoire des Sciences du Climat et de l’Environnement, UMR 8212 CEA-CNRS-UVSQ, 91191 Gif-sur-Yvette, France
23
Institute of Meteorology and Climate Research (IMK-IFU), Karlsruhe Institute of Technology (KIT), Kreuzeckbahnstr. 19, 82467 Garmisch-Partenkirchen, Germany
24
National Fisheries Resources Research Institute (NaFIRRI), Plot 39/45, Nile Crescent, Jinja P.O. Box 343, Uganda
25
Faculty of Physics, University of Bucharest, 405 Atomistilor Street RO077125, 030018 Magurele, Romania
26
National Institute of Water & Atmospheric Research Ltd. (NIWA), Private Bag 50061, Omakau 9352, New Zealand
27
Swedish Institute of Space Physics (IRF), Box 812, 98128 Kiruna, Sweden
28
Tragsatec, Julian Camarillo-6B, 28037 Madrid, Spain
29
Department of Chemistry, Biochemistry, and Geophysical Institute, University of Alaska Fairbanks, Fairbanks, AK 99775, USA
30
School of Mechanical Engineering, Tongji University, Shanghai 200070, China
*
Author to whom correspondence should be addressed.
Remote Sens. 2025, 17(5), 734; https://doi.org/10.3390/rs17050734
Submission received: 31 December 2024 / Revised: 6 February 2025 / Accepted: 10 February 2025 / Published: 20 February 2025

Abstract

:
The COllaborative Carbon Column Observing Network has become a reliable source of high-quality ground-based remote sensing network data that provide column-averaged dry-air mole fractions of carbon dioxide (XCO2), methane (XCH4), and carbon monoxide (XCO). The fiducial reference measurements of these gases from the COCCON complement the TCCON and NDACC-IRWG data. This study shows the application of COCCON data for the validation of existing greenhouse gas satellite products. This study includes the validation of XCH4 and XCO products from the European Copernicus Sentinel-5 Precursor (S5P) mission, XCO2 products from the American Orbiting Carbon Observatory-2 (OCO-2) mission, and XCO2 and XCH4 products from the Japanese Greenhouse gases Observing SATellite (GOSAT). A total of 27 datasets contributed to this study; some of these were collected in the framework of campaign activities and covered only a short time period. In addition, several permanent stations provided long-term observations. The random uncertainties in the validation results, specifically for S5P with a lot of coincidences pairs, are found to be similar to the comparison with the TCCON. The comparison results of OCO-2 land nadir and land glint observation modes to the COCCON on a global scale, despite limited coincidences, are very promising. The stations can, therefore, expand on the coverage of the already existing ground-based reference remote sensing sites from the TCCON and the NDACC network. The COCCON data can be used for future satellite and model validation studies and carbon cycle studies.

1. Introduction

Satellite missions require calibration (Cal) and validation (Val) of their products post-launch for the estimation of uncertainties and to ensure that they provide reliable information on the measured variables. The lack of fiducial reference measurement (FRM) data limits the use of satellite data for any quantitative purpose as the accuracy of the data product cannot be estimated. This paper should be considered as a direct continuation of the companion paper, which gives an overview of the instruments capable of providing FRM data for satellites measuring greenhouse gases (GHGs) [1]. These instruments are part of the COllaborative Carbon Column Observing Network (COCCON; https://www.imk-asf.kit.edu/english/COCCON.php, accessed on 1 March 2024), which follows the established protocol for instrument calibration, operation, maintenance, data acquisition and processing, data quality control, and public data dissemination. A self-assessment of the COCCON, providing dry-air column-averaged mole fractions of carbon dioxide (XCO2), methane (XCH4), and carbon monoxide (XCO) against the CEOS-FRM (Committee on Earth Observation Satellites) maturity matrix (MM), has been performed. The results show “ideal” or “excellent” grades for several categories, except for the Automation level, where the grading is “good”. The COCCON, therefore, can complement the reference data provided by the Total Carbon Column Observing Network (TCCON; https://tccon-wiki.caltech.edu/, accessed on 1 March 2024) [2] and the InfraRed Working Group of the Network for the Detection of Atmospheric Composition Change (NDACC-IRWG; https://www2.acom.ucar.edu/irwg, accessed on 1 March 2024) [3]. The NDACC-IRWG will be herewith referred to as NDACC. In this paper, we will show how such a suite of independent, fully characterized, and traceable measurements of the COCCON help in the evaluation of target GHGs measured by a multiple suite of satellite-borne sensors. The satellite sensors evaluated are the European Copernicus Sentinel-5 Precursor (S5P), the American Orbiting Carbon Observatory-2 (OCO-2), and the Japanese Greenhouse gases Observing SATellite (GOSAT).
Space-based retrievals of greenhouse gases are capable of providing a global picture of their distribution by quantifying the sources and sinks from top-down estimates via their use in inverse modeling. GOSAT is the first of the series of dedicated GHG missions [4,5] that was successfully launched in 2009. This was followed by the successful launch of OCO-2 in 2014, the launch of the S5P in 2017, and several other missions since then. The Thermal and Near-Infrared Sensor for carbon Observation–Fourier Transform Spectrometer (TANSO-FTS) instrument onboard GOSAT and the OCO-2 was the first space-based sensor designed specifically to retrieve carbon dioxide (CO2) concentrations using measurements of reflected sunlight. The TROPOMI instrument onboard the S5P mission and TANSO-FTS onboard GOSAT infers methane (CH4) concentrations using similar measurements, while carbon monoxide (CO) concentrations are inferred only from the S5P measurements. In this paper, we will focus on the validation of these three products.
The principal challenge for satellites measuring GHGs is the need for high precision and low bias on local to regional to global scales to resolve and quantify very small variations in GHG concentrations with surface sources and sinks on such scales. Furthermore, the long-term monitoring of GHGs and their use in inverse models to infer surface fluxes require precise and accurate global measurements of these gases. The validation efforts presented here, covering several GHG missions, are an effort to fully assess the real-world retrieval accuracies of the satellite products under various measuring conditions offered by the increasing number of portable Fourier transform infrared (FTIR) spectrometers under the umbrella of the COCCON, which are capable of providing FRMs of greenhouse gases. The COCCON will help to improve spatial coverage and sampling density in data-poor regions that are not covered by the TCCON or NDACC stations.
This paper is organized as follows: Section 2 provides an overview of the satellite missions (S5P, OCO-2, and GOSAT) and ground-based reference remote sensing COCCON data. Section 3 provides the detailed validation results for the three satellites using the COCCON as the reference. This paper ends with a discussion and outlook presented in Section 4.

2. Materials and Methods

2.1. Sentinel-5 Precursor Mission Overview

Sentinel-5 Precursor (S5P) is the first of the series of Copernicus missions dedicated to monitoring the Earth’s atmosphere. The TROPOMI instrument, as the unique payload of S5P, is the state-of-the-art hyperspectral spectrometer covering ultraviolet–visible (270–495 nm), near-infrared (675–775 nm), and shortwave infrared (2305–2385 nm) spectral regions [6]. The radiometric measurements of the Earth’s radiance and solar irradiance performed by TROPOMI are processed to retrieve the atmospheric abundances of ozone (O3), nitrogen dioxide (NO2), formaldehyde (HCHO), sulfur dioxide (SO2), methane (CH4), and carbon monoxide (CO), as well as cloud and aerosol properties. TROPOMI is a nadir-viewing imaging spectrometer orbiting in a sun-synchronous polar orbit with an Equator crossing at 13:30 local solar time. It has a swath width of 2600 km and is, therefore, able to map the entire planet every day. CH4 and CO are retrieved from the shortwave infrared (SWIR) bands. The spatial resolution of the CH4 and CO products was initially 7 × 7 km2 and later increased to 5.5 × 7 km2 on 6 August 2019. After an initial commissioning phase since its launch on 13 October 2017, the first operational data have been publicly available since 30 April 2018. The latest product versions of the reprocessed (RPRO) and offline (OFFL) data have been used in this work. The details of the version number and corresponding file names and dates are listed in Table 1. The details on the improvements in the latest versions with respect to the previous versions are given in the product readme file (PRF; https://sentinel.esa.int/documents/247904/3541451/Sentinel-5P-Methane-Product-Readme-File & https://sentinel.esa.int/documents/247904/3541451/Sentinel-5P-Carbon-Monoxide-Level-2-Product-Readme-File, accessed on 1 March 2024).
The RemoTeC-S5P algorithm performs the operational processing of the SWIR data to retrieve the total column-averaged dry-air mole fraction of methane (XCH4). The details are described in Hu et al. [7] and the algorithm theoretical baseline document (ATBD) for S5P methane retrieval [8]. The bias and random error requirements for S5P XCH4 data are 1.5% and 1%, respectively [9]. Currently, only cloud-free observations are processed to retrieve XCH4 over land (nadir observations) and water (glint observations). The standard XCH4 product shows a bias that is dependent on the surface albedo, and, as a result, a bias correction is applied. The bias-corrected methane product is also made available operationally, along with the standard methane product. The details are described in the ATBD. We will show the validation results for both products using the FRM data. All pixels with a quality assurance value (QA) > 0.5 are used in this work, as recommended by the PRF, to filter out pixels with surface albedo < 0.02, solar zenith angle (SZA) > 70°, viewing zenith angle > 60°, and some other conditions mentioned in the PRF document.
The shortwave infrared carbon monoxide retrieval (SICOR) algorithm performs the operational processing of the SWIR data to retrieve the total column density of carbon monoxide simultaneously with interfering trace gases and effective cloud parameters (cloud height and optical thickness). The details are described in the ATBD for S5P CO total column retrieval document [10]. The bias and random error requirements for S5P total column-averaged dry-air mole fraction of carbon monoxide (XCO) data are 15% and 10%, respectively [9]. An S5P CO near-real-time product with delivery within 3 h after sensing is also available operationally, along with the OFFL product. The two products employ the same algorithm, and validation results using NDACC data show similar behavior of both products [11]. The single overpasses of S5P show stripes of erroneous CO values < 5% in the flight direction. The striping effect is analyzed in detail [12], and a stripe-corrected product is produced operationally. In this work, we will show the validation results of the S5P OFFL CO standard product and the destriped product with QA values > 0.5, as recommended by the PRF. This QA selection filters out pixels with SZA ≥ 80° and some other criteria, as mentioned in the PRF.

2.2. OCO-2 Mission Overview

The Orbiting Carbon Observatory-2 (OCO-2) is a National Aeronautics and Space Administration (NASA) mission launched into space on 2 July 2014. It is part of the afternoon satellite train (A-train) orbiting the Earth’s atmosphere at an altitude of 705 km. OCO-2 flies in a sun-synchronous near-polar orbit with an inclination of 98.2°, with the ascending node crossing the equator near 13:30 local time, and has a repeat cycle of 16 days. It is designed to measure atmospheric carbon dioxide (CO2) to improve the understanding of the terrestrial carbon cycle [13,14,15,16]. The single OCO-2 footprint with 1.3 km × 2.3 km covers an area of just under 3 km2. It captures eight such spatially separated footprints every 1/3 of a second [17]. OCO-2 measures CO2 in two spectral bands: one band has a spectral range of 1594–1619 nm and a spectral resolution of 0.08 nm, while the other band has a spectral range of 2042–2082 nm with a spectral resolution of 0.10 nm. Oxygen is measured in the A-band spectral range of 758–772 nm with a spectral resolution of 0.04 nm. OCO-2 measures CO2 with sufficient precision and accuracy to identify its sources and sinks on regional scales and quantify its seasonal and inter-annual variability. The column-averaged dry-air mole fraction of CO2 (XCO2) is the ratio of the retrieved abundances of CO2 and dry air. XCO2 is a particularly useful quantity in the study of the carbon cycle [18]. This is due to its relative insensitivity towards vertical mixing as column integration is performed to calculate the total column product and its utility in deducing the surface fluxes in CO2. XCO2 is measured with high precision from space by OCO-2 [19] in three viewing modes—nadir, glint, and target modes. In nadir mode, typically used over land surfaces, the instrument points straight down, and data are collected along the instrument’s ground track. In glint mode, used over both land and water surfaces, the instrument points towards the sun’s glint spot on the surface. This significantly improves the signal-to-noise ratio, especially over water. In target mode, the instrument locks its view onto a specific surface location (as commanded) and retains this view while flying overhead. During its overpass, the instrument acquires several thousands of observations at a wide range of viewing zenith angles. These observations are particularly helpful for validation purposes and help to identify potential errors and biases in the retrieved data. Detailed accounts of the retrieval algorithm used to retrieve atmospheric abundances of CO2 and surface pressure, among other atmospheric and surface properties, are provided by Connor et al. [20], O’Dell et al. [21,22], and Jacobs et al. [23].

2.3. GOSAT Mission Overview

The Japanese Greenhouse gases Observing SATellite (GOSAT), named IBUKI, was successfully launched on 23 January 2009 [4]. It is placed in a sun-synchronous orbit at an altitude of 666 km with an Equator overpassing at 13:00 local time, with an inclination angle of 98°, and has a repeat cycle of 3 days. It is designed to monitor CO2 and CH4 globally from space and has been doing so for more than 15 years. It has a footprint diameter of about 10.5 km and a single-scan time of 4 s. The Thermal and Near-Infrared Sensor for Carbon Observation–Fourier Transform Spectrometer (TANSO-FTS) records gas absorption spectra in the SWIR range from the reflected solar radiation on the Earth’s surface as well as the thermal infrared radiation (TIR) from the ground and the atmosphere. The spectrometer is capable of detecting three narrow bands (0.758–0.775 µm, 1.56–1.72 µm, and 1.92–2.08 µm) in the SWIR and a wide band (5.56–14.3 µm) in the TIR [24]. The TANSO Cloud and Aerosol Imager (TANSO-CAI) is a second instrument onboard to detect cloud and aerosol interference and to perform correction. TIR observations are sensitive to CO2 and CH4 in the middle to upper troposphere, whereas SWIR observations are also sensitive to their abundances near the surface. As the major sources and sinks of CO2 and CH4 exist near the surface, SWIR observations are more suitable for carbon flux estimation. The National Institute for Environmental Studies (NIES) provides the level-2 (L2) products containing XCO2 and XCH4 retrieved concentrations from the TANSO-FTS spectra [24,25]. The first data have been available since June 2009.

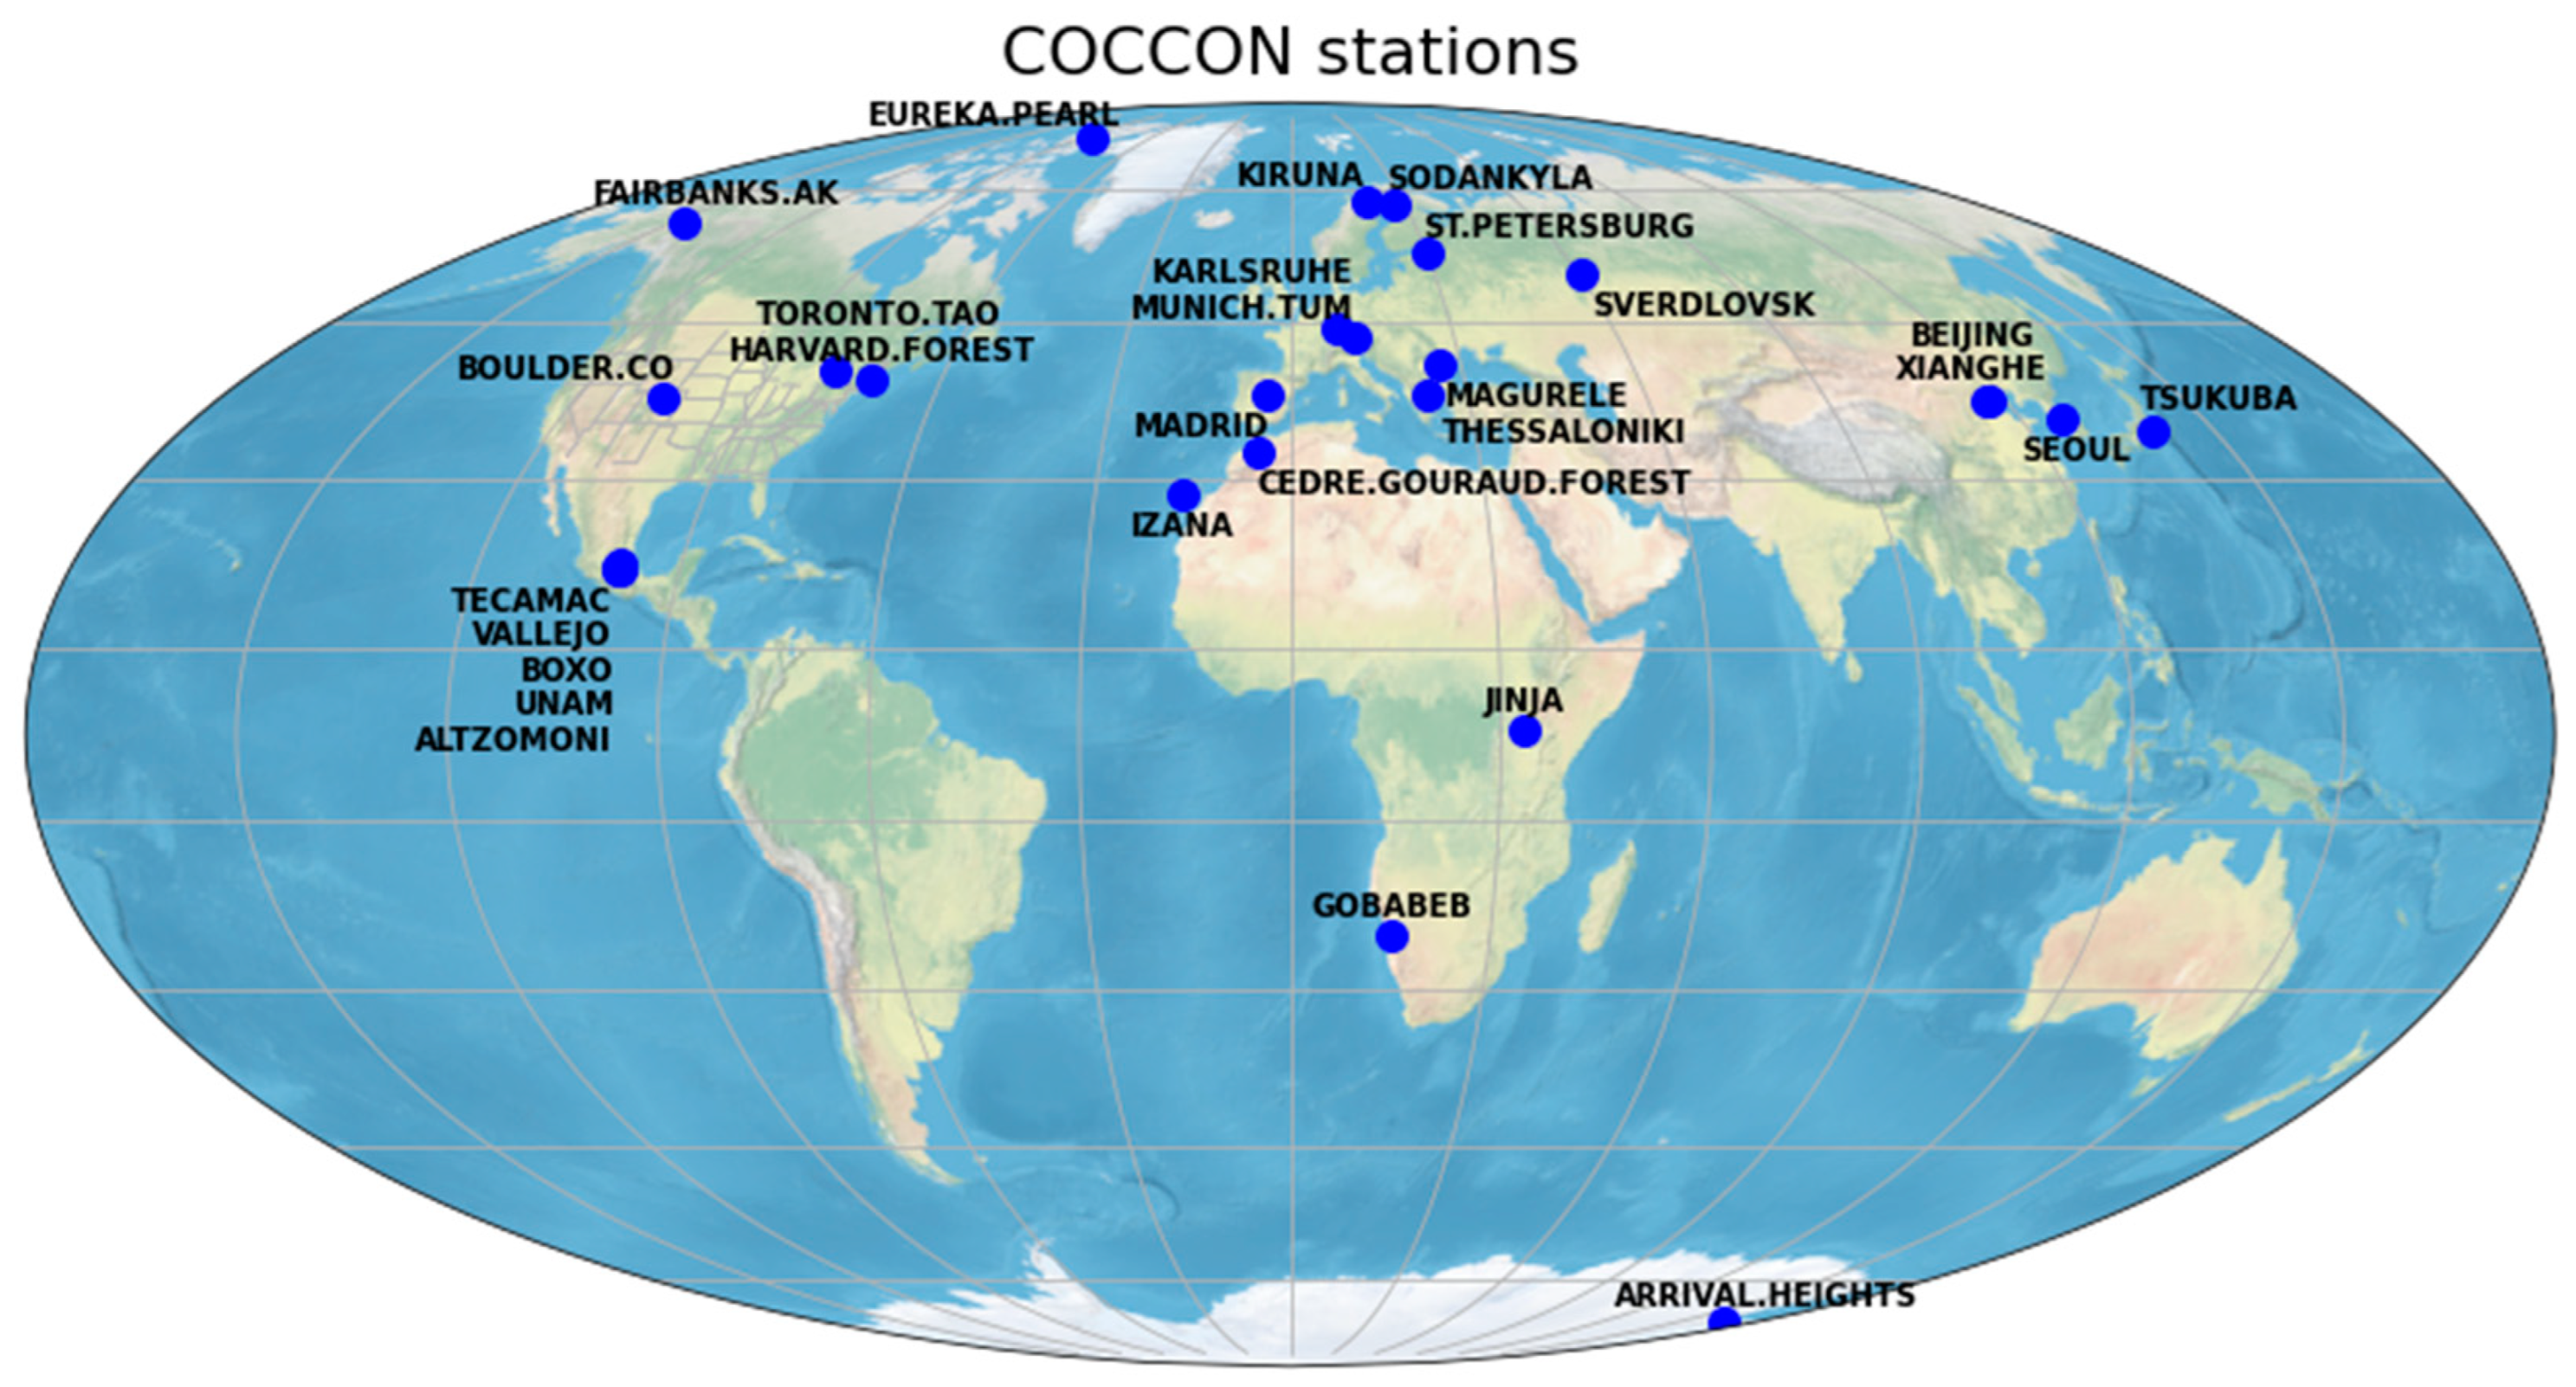
2.4. Ground-Based COCCON Reference Data

The COllaborative Carbon Column Observing Network (COCCON) represents a network of low-spectral-resolution Fourier transform infrared spectrometers, primarily of the Bruker EM27/SUN-type and recently added Bruker Vertex70/Invenio spectrometers. These spectrometers have the benefit of being portable as compared to the traditional high-spectral-resolution FTIRs from the TCCON and NDACC. As a result, they can be deployed on a campaign basis around a source region of interest, as well as permanent deployment in data-poor regions where the deployment of high-resolution FTIR spectrometers is difficult, if not sometimes impossible. However, only a few sites have the EM27/SUN deployed in an automated weather-proof enclosure box. The spectrometers at the other sites need to be brought outside manually each day/time when the weather conditions are favorable for measurements. Such manual operation procedures have their own limitations, as they are based on the availability of personnel for performing the measurements. This can lead to data gaps that could influence the validation results. The spectrometers record direct solar absorption spectra in the near-infrared (NIR) spectral range. EM27/SUN spectrometers record double-sided direct current (DC) coupled interferograms, performing an average of 10 scans in about 58 s at a spectral resolution of 0.5 cm−1. Data acquisition is performed using a room-temperature (RT) InGaAs detector (5500–11,000 cm−1) and a wavelength-extended RT InGaAs detector (4000–5500 cm−1) [26]. In the extended configuration, the EM27/SUN encompasses the spectral region observed by TROPOMI. The interferograms were processed using the COCCON processing chain and PROFFAST v1 retrieval code to retrieve accurate and precise column-averaged abundances of atmospheric constituents like CO2, CH4, CO, H2O, and O2 [26,27,28]. Very recently, PROFFAST v2.4 was released [29]. However, the re-processing of the complete set of data used from the network will take time to complete. Therefore, in this work, we used the v1 of COCCON data to include as many sites as possible in our analysis and obtain a network-wide overview of the characteristics and their dependencies on the satellite products. The XCO2, XCH4, and XCO products from various sites within the COCCON are used as FRM data for the validation studies shown in this work. The COCCON sites (Figure 1) cover a wide latitude range, from a high-latitude Arctic site at Eureka (80.1°N) to an Antarctic site at Arrival Heights (−77.8°N) [30]. There are several stations between 70°N and 55°N, like Kiruna, Sodankylä, St. Petersburg and Sverdlovsk [31], and Fairbanks [32] stations, providing good coverage of the high northern latitude stations, which pose a challenge for the satellite algorithms for retrievals at high air masses, high solar zenith angles, and varying scenes with snow, ice, or snow-free ground between the different seasons. Several of the COCCON sites are in urban areas (e.g., Toronto [33], Thessaloniki [34], Beijing and Xianghe [35]) or encircling cities designed to capture city emissions (e.g., Munich [36,37], Madrid, Mexico City [38,39,40]) and are therefore representative of high-pollution sites. The Gobabeb site [41] is a high-albedo station and provides a unique changing terrain with sand desert and gravel plains; it is one of the only two stations in the global south that provided data for this study. The Jinja [42] station close to the equator (0.4°N) is another station on the African continent.

3. Results

The coincidence criteria applied for the validation of satellite products are described individually for each satellite and its respective products. Although the individual coincidence criteria applied to the different satellites are different, they are similar to the coincidence criteria that were typically used for those satellites in previous studies. This mostly applies to the geometrical coincidence criteria. However, because COCCON measurements are performed more frequently (one every minute under clear sky conditions) as compared to TCCON measurements (two scans every three minutes under clear sky conditions), for some of the comparisons, we limited the time coincidence criteria to obtain a better representativeness of the atmospheric state for the ground-based COCCON data when compared to the satellite data.

3.1. Sentinel-5 Precursor Validation

The total column products from the TCCON and NDACC are the primary ground-based reference validation data source for the validation of S5P CO and CH4 products; some examples are Lorente et al. [43], Sha et al. [44], and Borsdorff et al. [12]. The latest validation results of the operational S5P products are regularly updated in the quarterly validation report produced by the S5P Mission Performance Center [11]. In this section, we focus on the validation results of S5P CO and CH4 products using all available COCCON data. The COCCON sites not only help to fill geographical gaps but are very useful in complementing the TCCON and NDACC dataset as they cover a large range of measurand space of influencing parameters (e.g., albedo, aerosol, humidity, clouds, surface conditions, a priori, …) that often show dependence on satellite product uncertainties. Therefore, the validation of the satellite products against this enhanced range of influencing parameters of the measurand space will provide a sense of the bias and uncertainties in the satellite products. It will also give confidence in using them when they are within the mission requirements or assist in performing the necessary corrections to the satellite data to bring them in line with the mission requirements.
We used the following coincidence criteria for comparison against the COCCON sites: S5P observations within a 50 km radius of the site for CO and 100 km for CH4 to ensure that a sufficient number of coincidence measurements and COCCON observations within ±1 h of the S5P overpass were taken into account. The special and temporal colocation criteria chosen here are similar to the validation of operational S5P CO and CH4 products using the TCCON [11]. The criteria gave a sufficient number of pixels for robust statistics. An average of all S5P pixels was performed for each of the COCCON measurements co-located within the S5P measurements. Co-located pairs were created between the COCCON and averaged S5P only if a minimum of five pixels was found when applying the coincidence criteria. In the comparison, an a priori alignment, i.e., aligning the a priori profile to a common a priori, was performed to correct/compensate its contribution to the smoothing equation [45]. The COCCON data with the S5P a priori substitute were then compared directly to the S5P data. The S5P columns were also corrected to take into account the altitude variability for the collocated pixels [44].

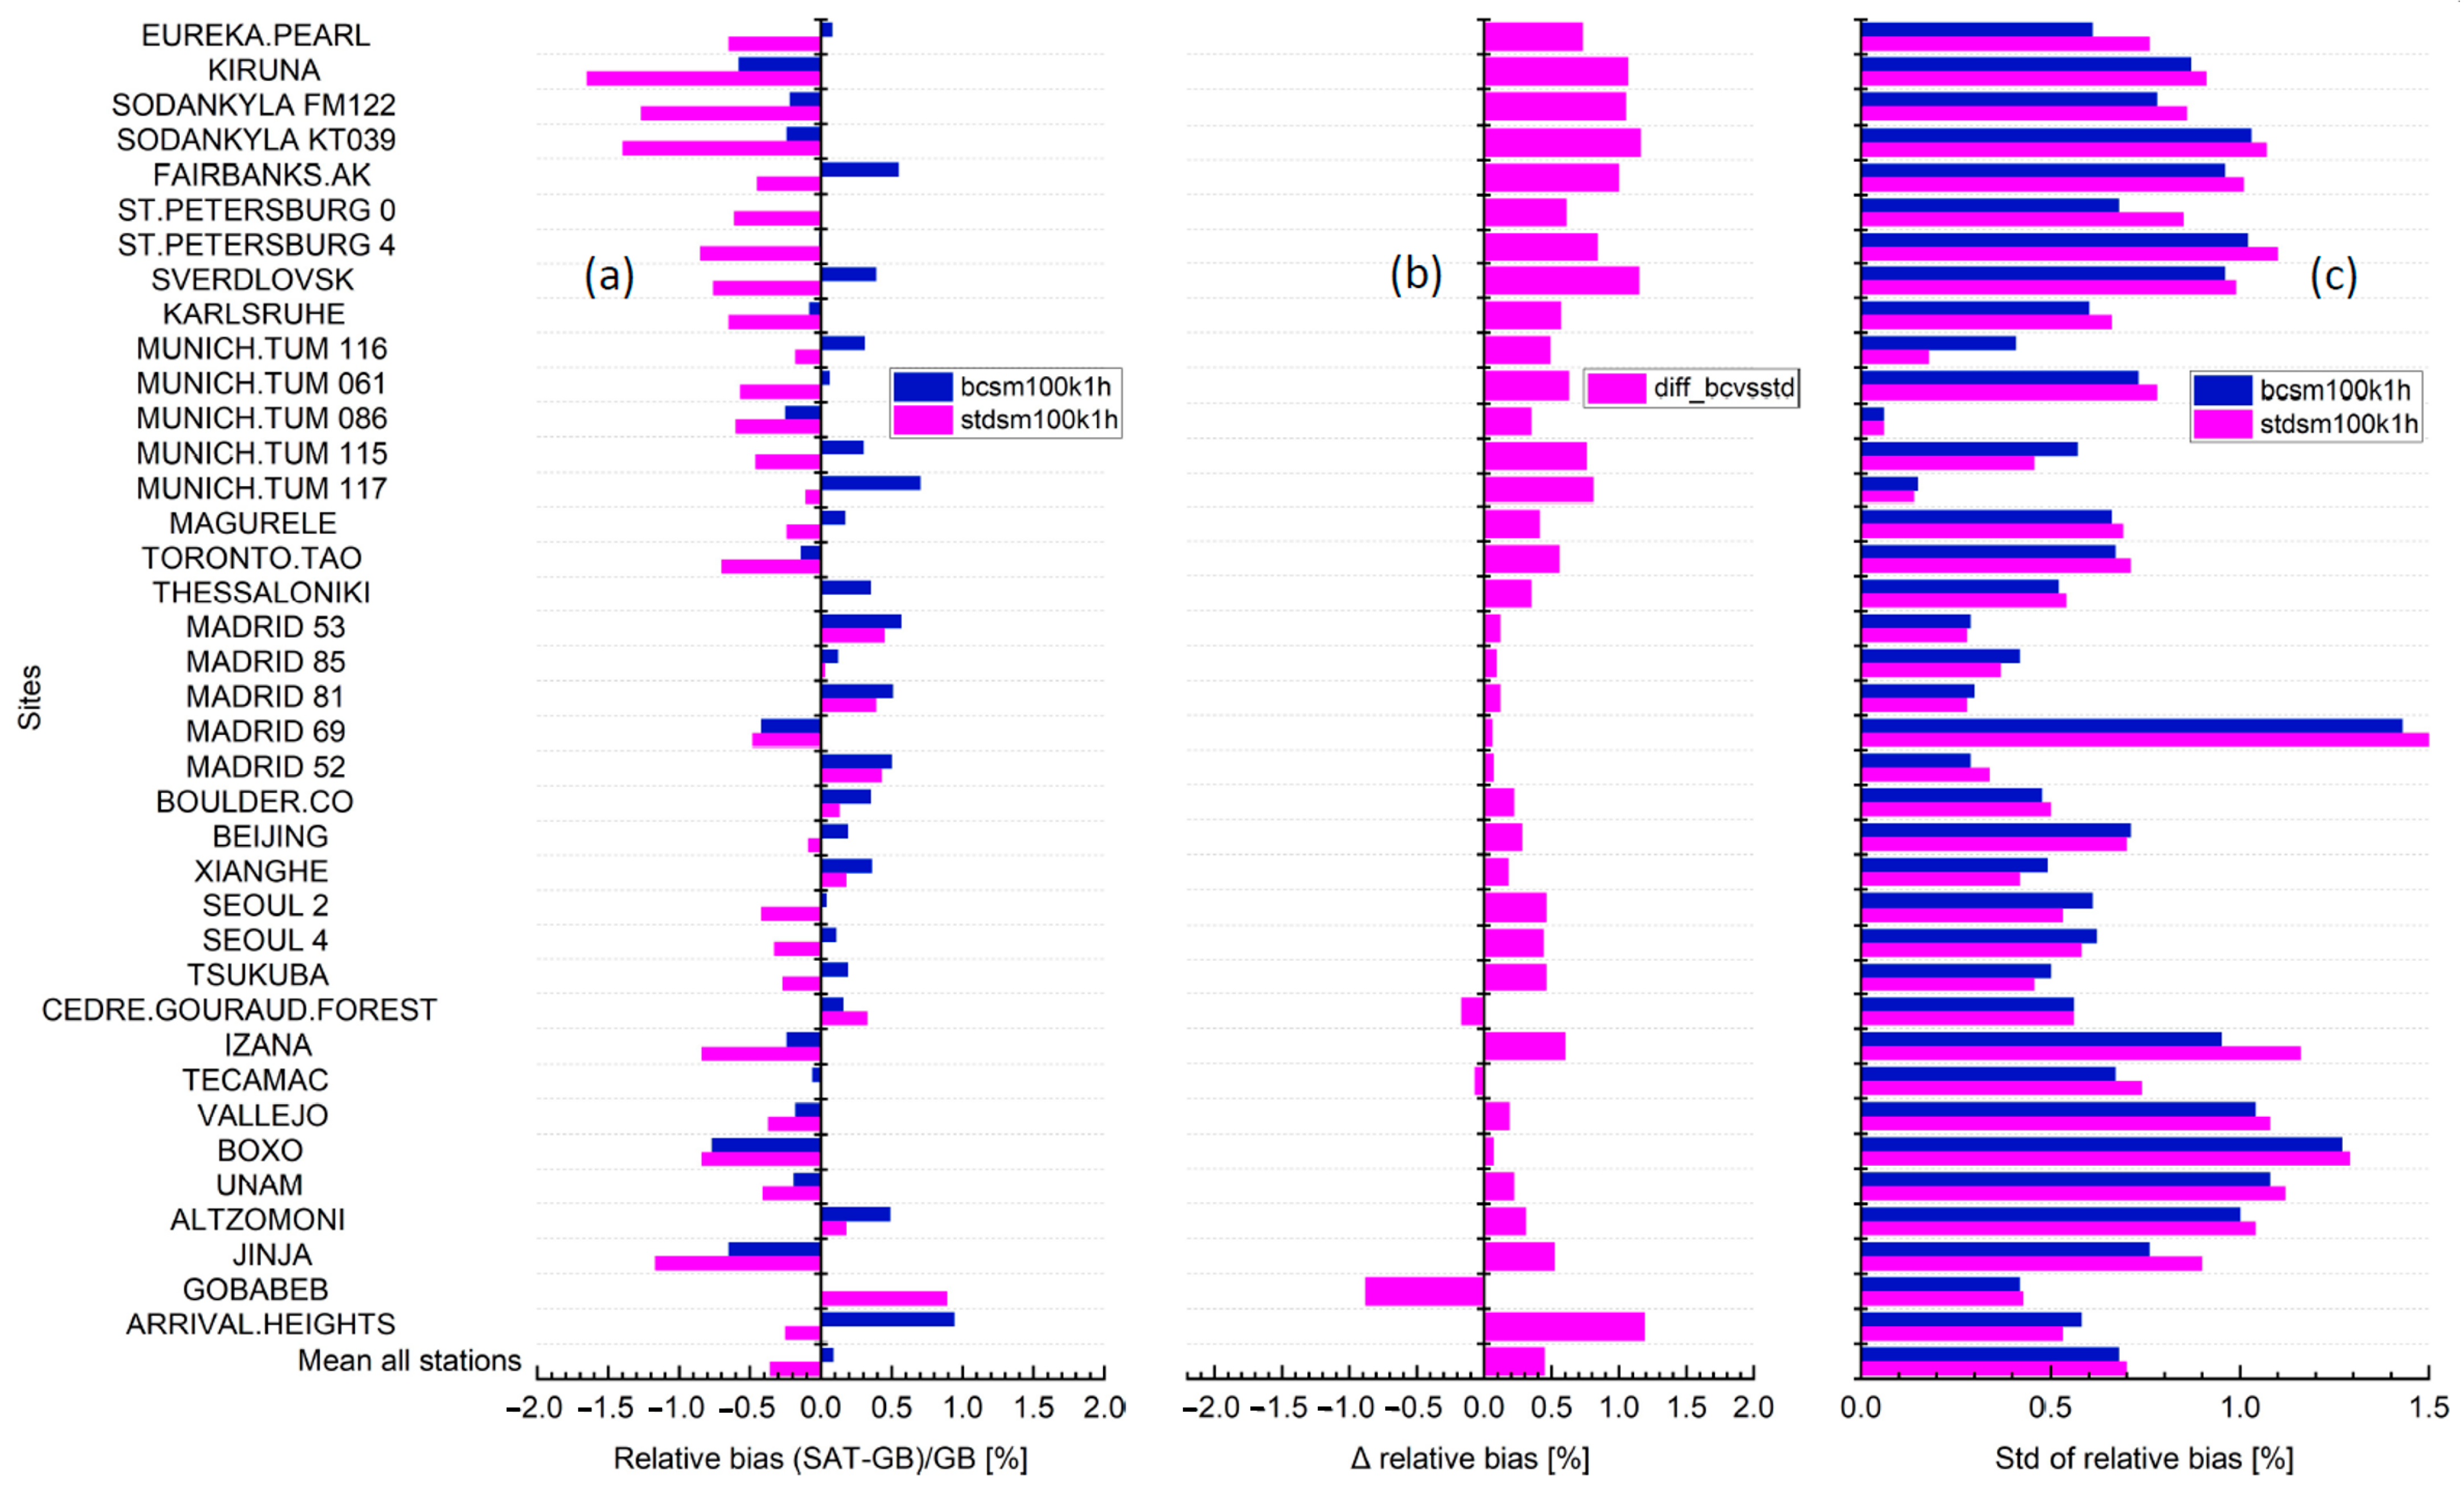
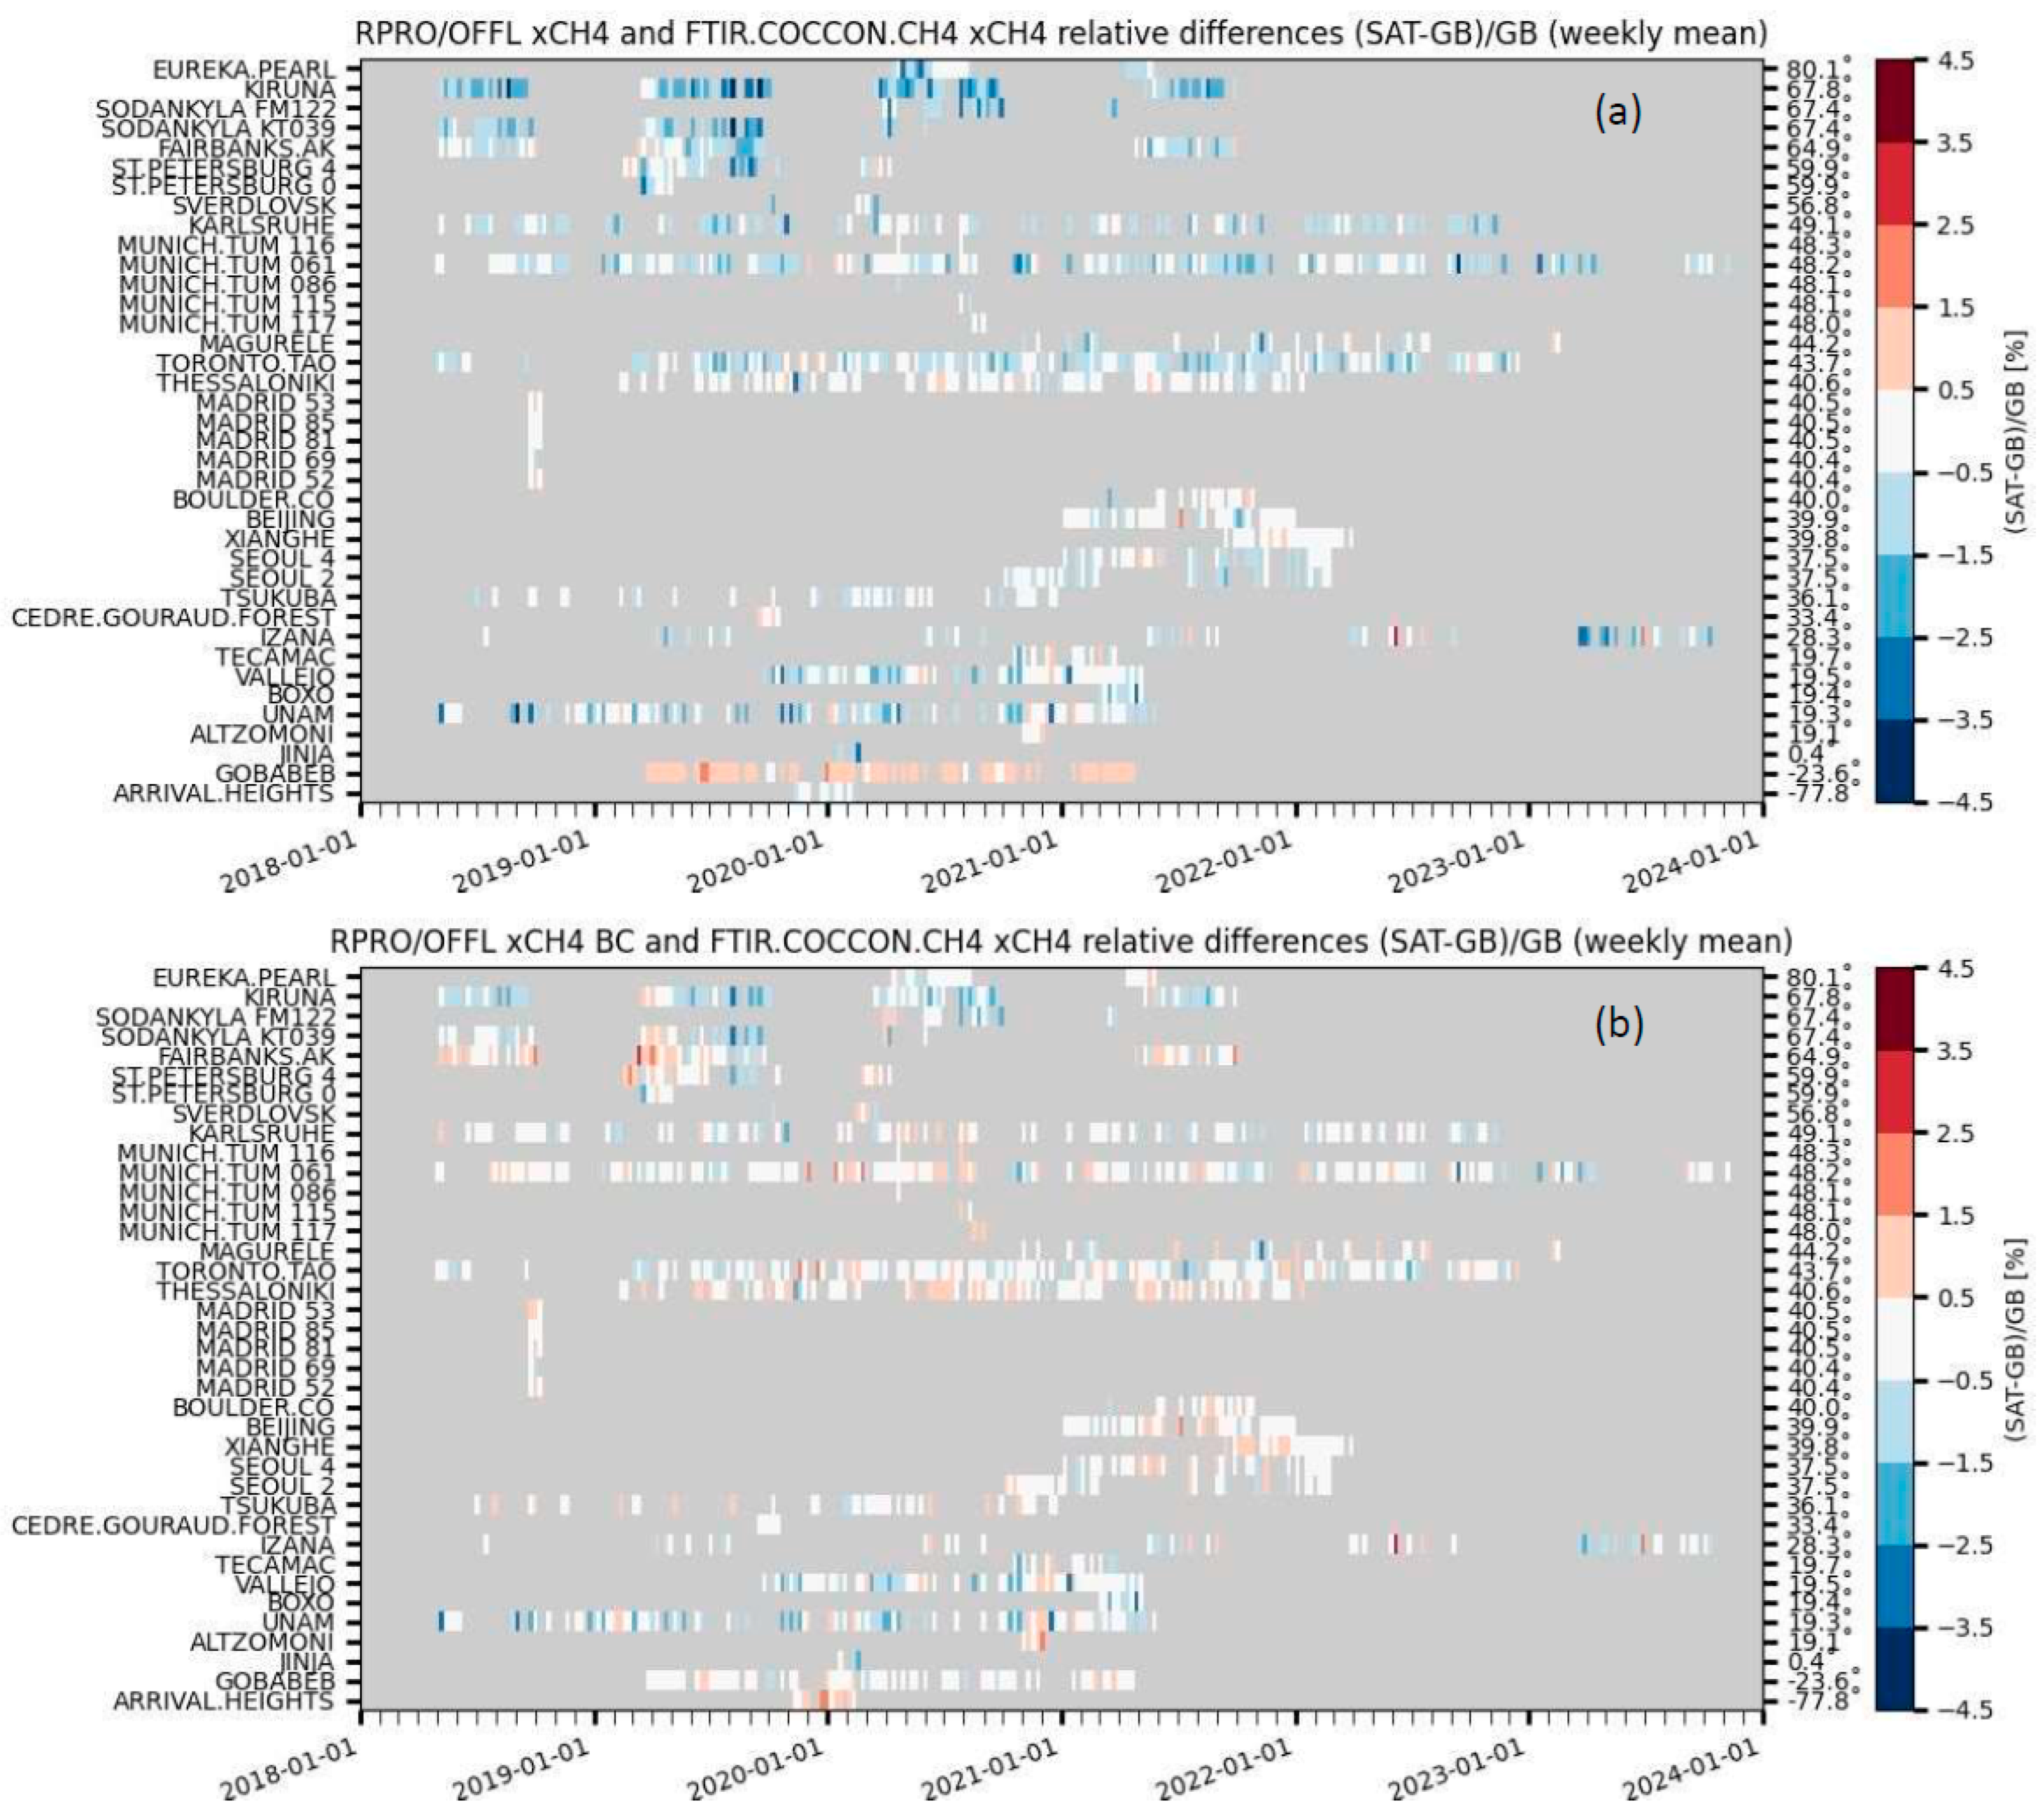
3.1.1. S5P XCH4 Validation Results

The validation results of the standard and bias-corrected S5P XCH4 products with the a priori aligned ground-based reference COCCON data are shown in Table 2. A total of 27 stations for the period between April 2018 and December 2023 are found within the colocation criteria. The systematic difference, which is represented by the mean of all relative differences, between the S5P and COCCON is, on average, −0.36 ± 0.54% for the standard product and 0.09 ± 0.37% for the bias-corrected S5P XCH4 products. The random error, which is represented by the standard deviation of the relative bias, is, on average, 0.70 ± 0.34% for the standard product and 0.68 ± 0.3% for the bias-corrected S5P XCH4 products. Therefore, the results show that the bias correction of the S5P XCH4 data brings the values closer to the reference data, as both the mean and standard deviation of the comparison are reduced. The absolute difference in the mean values of the relative bias between the standard and bias-corrected S5P XCH4 product is 0.45%, which is comparable to 0.42% for the validation results against the TCCON, as shown in Sha et al. [44]. This result shows that the albedo-dependent bias correction for the COCCON sites is comparable to the results of the previous studies. For most sites, the correlation coefficient between the two datasets is 0.75 except when the dataset is less than a week and in high-latitude sites where the bias changes between the spring, summer, and autumn periods as a function of surface albedo and polar vortex conditions (see the next paragraph for further explanations). Furthermore, the correlation is mostly determined by the seasonal cycle; therefore, for short data periods, it is critical to determine which period the data belong to. The outliers in the statistics are due to the limited datasets available for the comparison. The ratio of the standard deviation of the ground-based data to the standard deviation of the satellite data is given as the SD column in the table. The value of SD is below 1 for most stations, implying that the S5P data are more variable than the ground-based reference COCCON data.
Figure 2 shows the bar plots for the S5P XCH4 validation results against the ground-based COCCON data. Figure 2a shows the mean relative biases, (b) shows the difference in the mean relative bias between the S5P bias-corrected and standard XCH4 products, and (c) shows the standard deviation of the relative biases at each COCCON station. The S5P standard and bias-corrected results for (a) and (c) are shown in magenta and blue, respectively. The relative bias is typically below the 1.5% limit except at the Kiruna site for the standard XCH4 validation case. The relative bias value changes from −1.65% to −0.58% from the standard to bias-corrected XCH4 product for the Kiruna site. The bias correction of the S5P XCH4 product is a function of surface albedo; therefore, it acts according to the surface albedo situation at the site and is different for different sites. Figure 2b shows that for most of the high-latitude sites, the overall direction of the change in bias is positive and negative for Gobabeb (a site with high surface albedo). The Madrid 69 instrument shows opposite behavior (negative bias) compared to the other spectrometers deployed during the campaign for XCH4. This spectrometer was installed at the José Echegaray School, which is the location closest to the waste treatment plants, thereby making it more strongly affected by XCH4 plumes. The standard deviation of the relative bias for the standard and bias-corrected S5P XCH4 products are comparable. The high values at some sites are due to the limited number of colocations, and for the rest of the locations, the values are within the limit of 1%.
The mosaic plots of the relative biases for the standard and bias-corrected S5P XCH4 products relative to the COCCON are shown in Figure 3a,b, respectively. Each bar represents the average of the weekly relative bias values. The bias-corrected S5P XCH4 product shows a high positive bias during spring, which is then reduced and even shows negative bias during summer and autumn periods. This is attributed to the correlation with the low surface albedo in SWIR but high albedo in the NIR during the presence of snow and a low albedo in the NIR during snow-free periods [43,44]. The bias correction of the operation S5P CH4 product is performed as a function of the surface albedo in the SWIR band. However, a strong dependence of the bias is observed w.r.t. the NIR band, which is not yet accounted for in the bias correction. An additional effect at the high-latitude site is the influence of the polar vortex condition, which is difficult to represent using the a priori profiles. The difference between the a priori profile and the true atmospheric state will add to the bias. The Gobabeb site shows all positive values (orange) in the standard XCH4 validation plot (panel a), which then change to more white values (within the ±0.5% range). Furthermore, it can be said that campaign measurements of only a week give limited information about the satellite data quality; therefore, further extended periods of at least three to four weeks should be pursued depending on the availability of the instruments and personnel. Longer time periods of data are very helpful in observing seasonality effects in the data. This can be seen easily, especially for the high-latitude stations where the seasonal dependence of bias and its variability over different years gives important information on the dependence of the bias on different parameters.

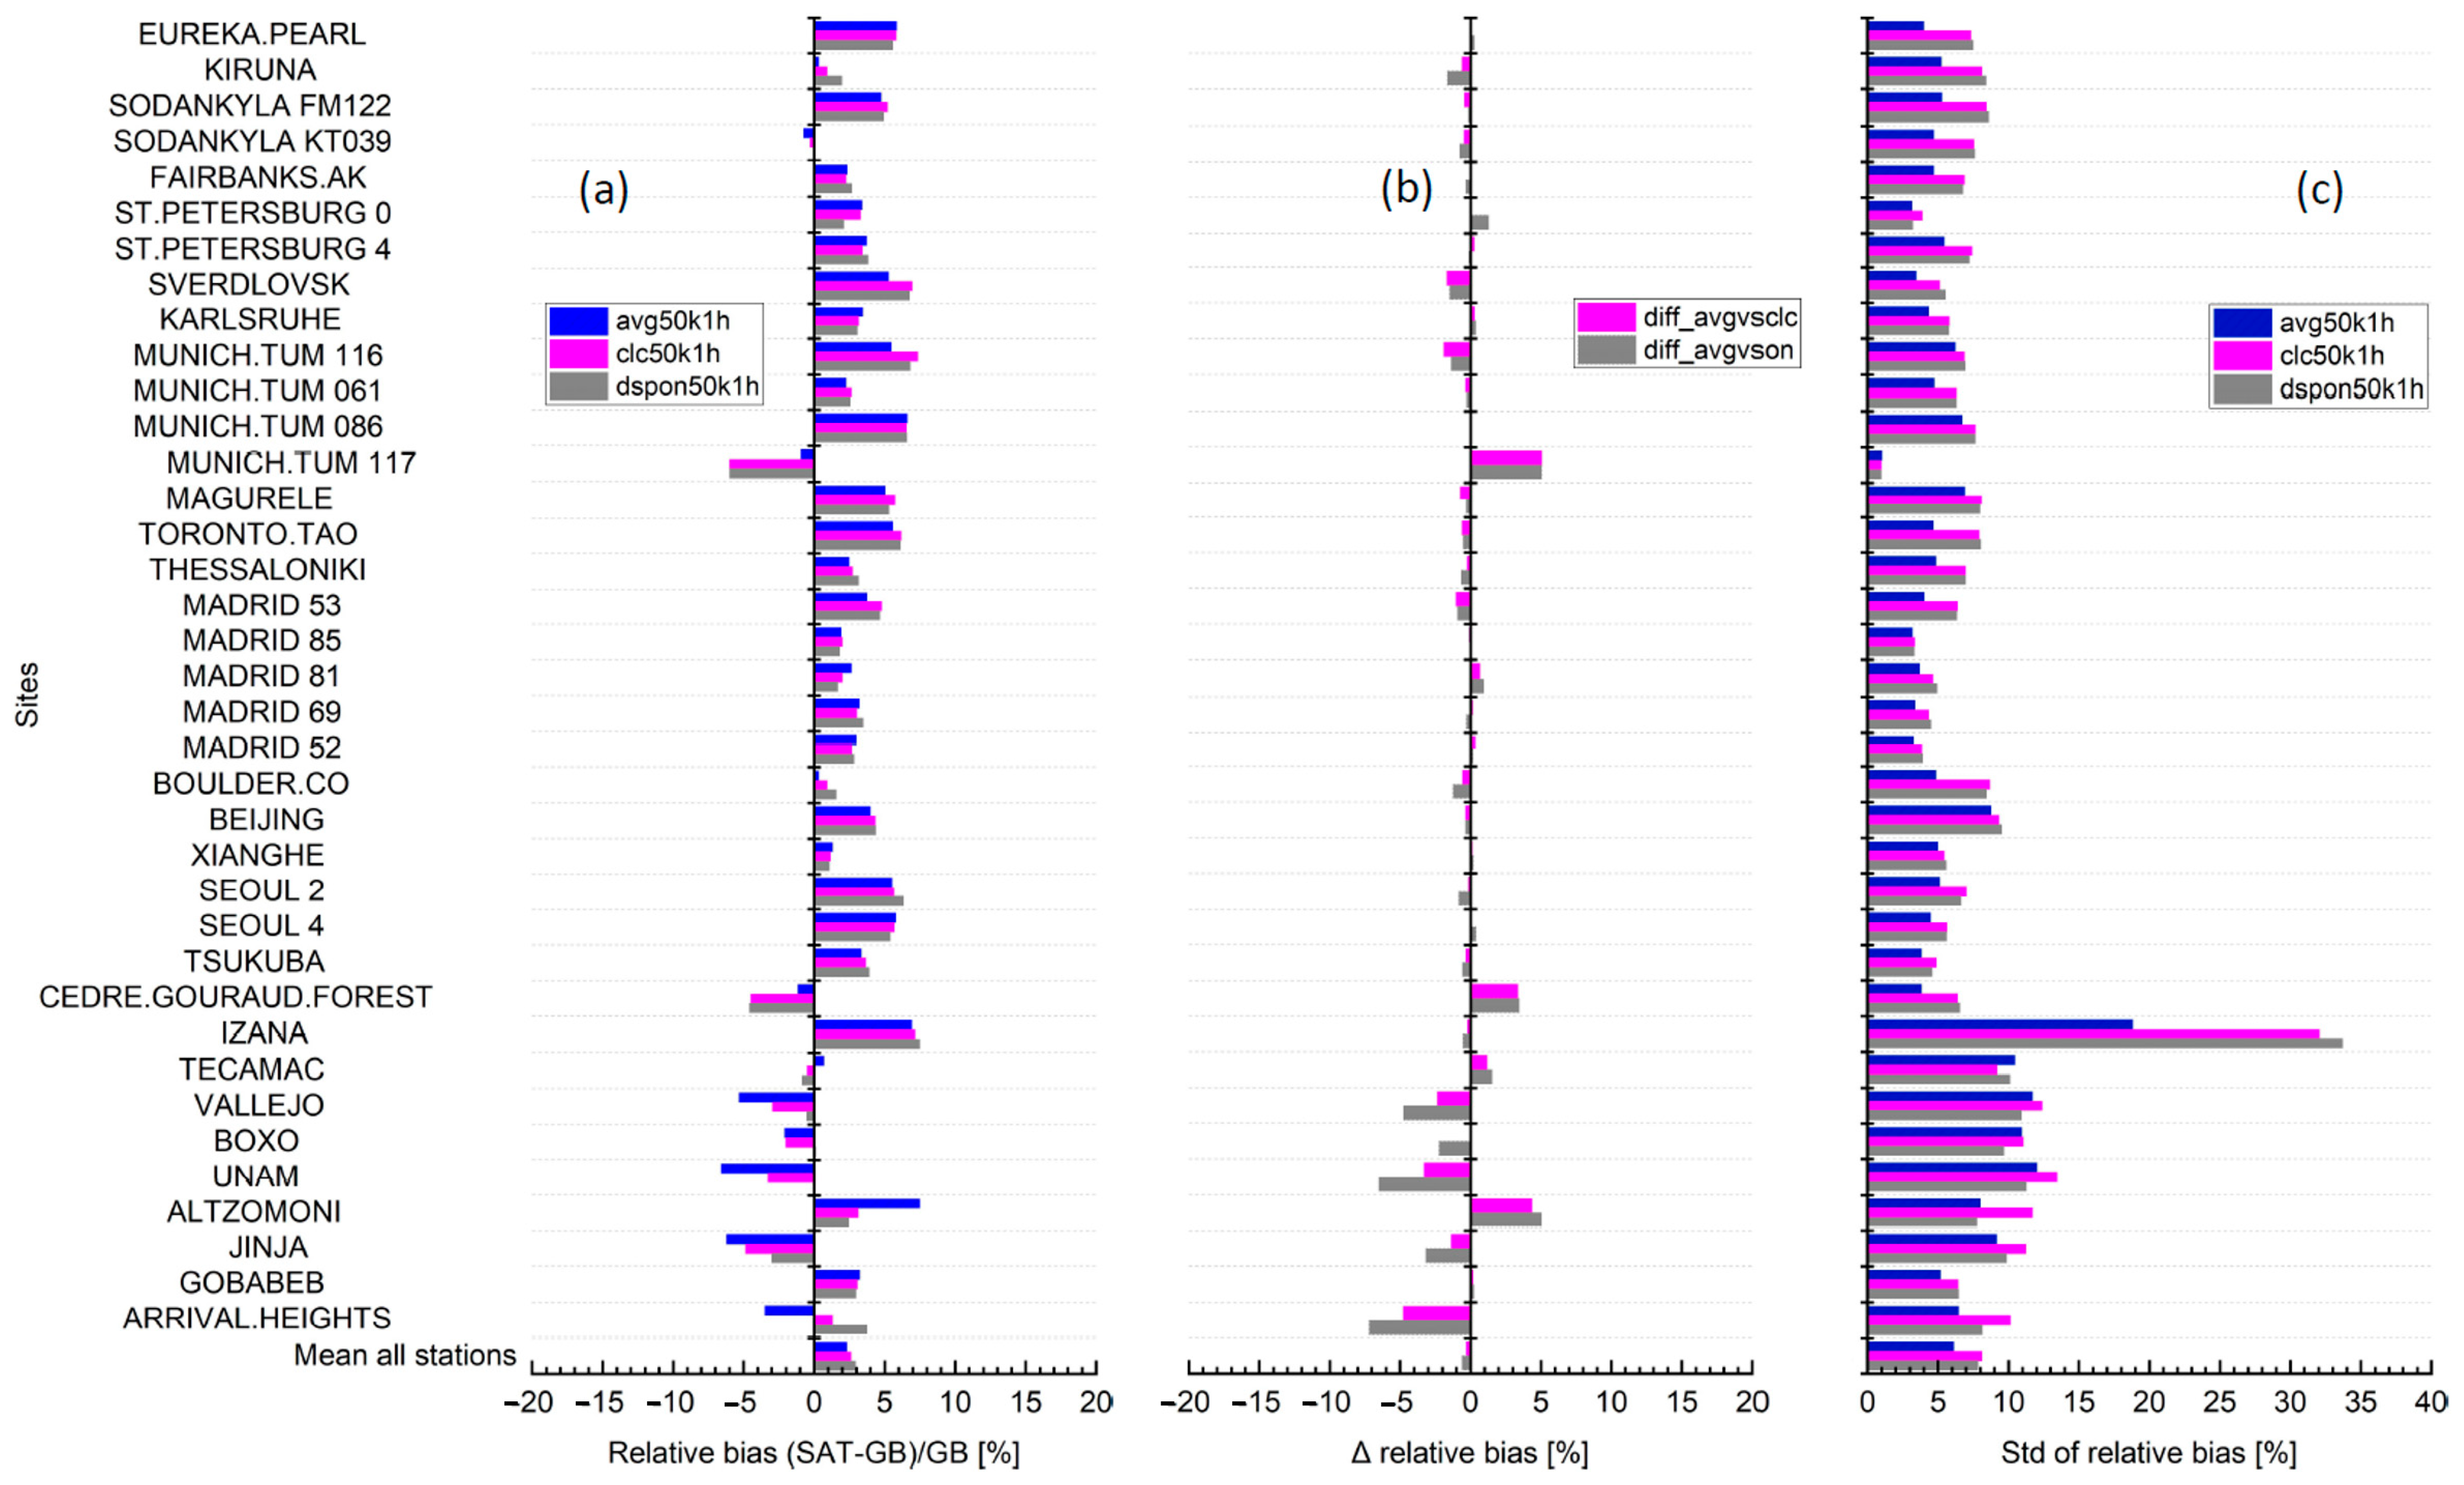
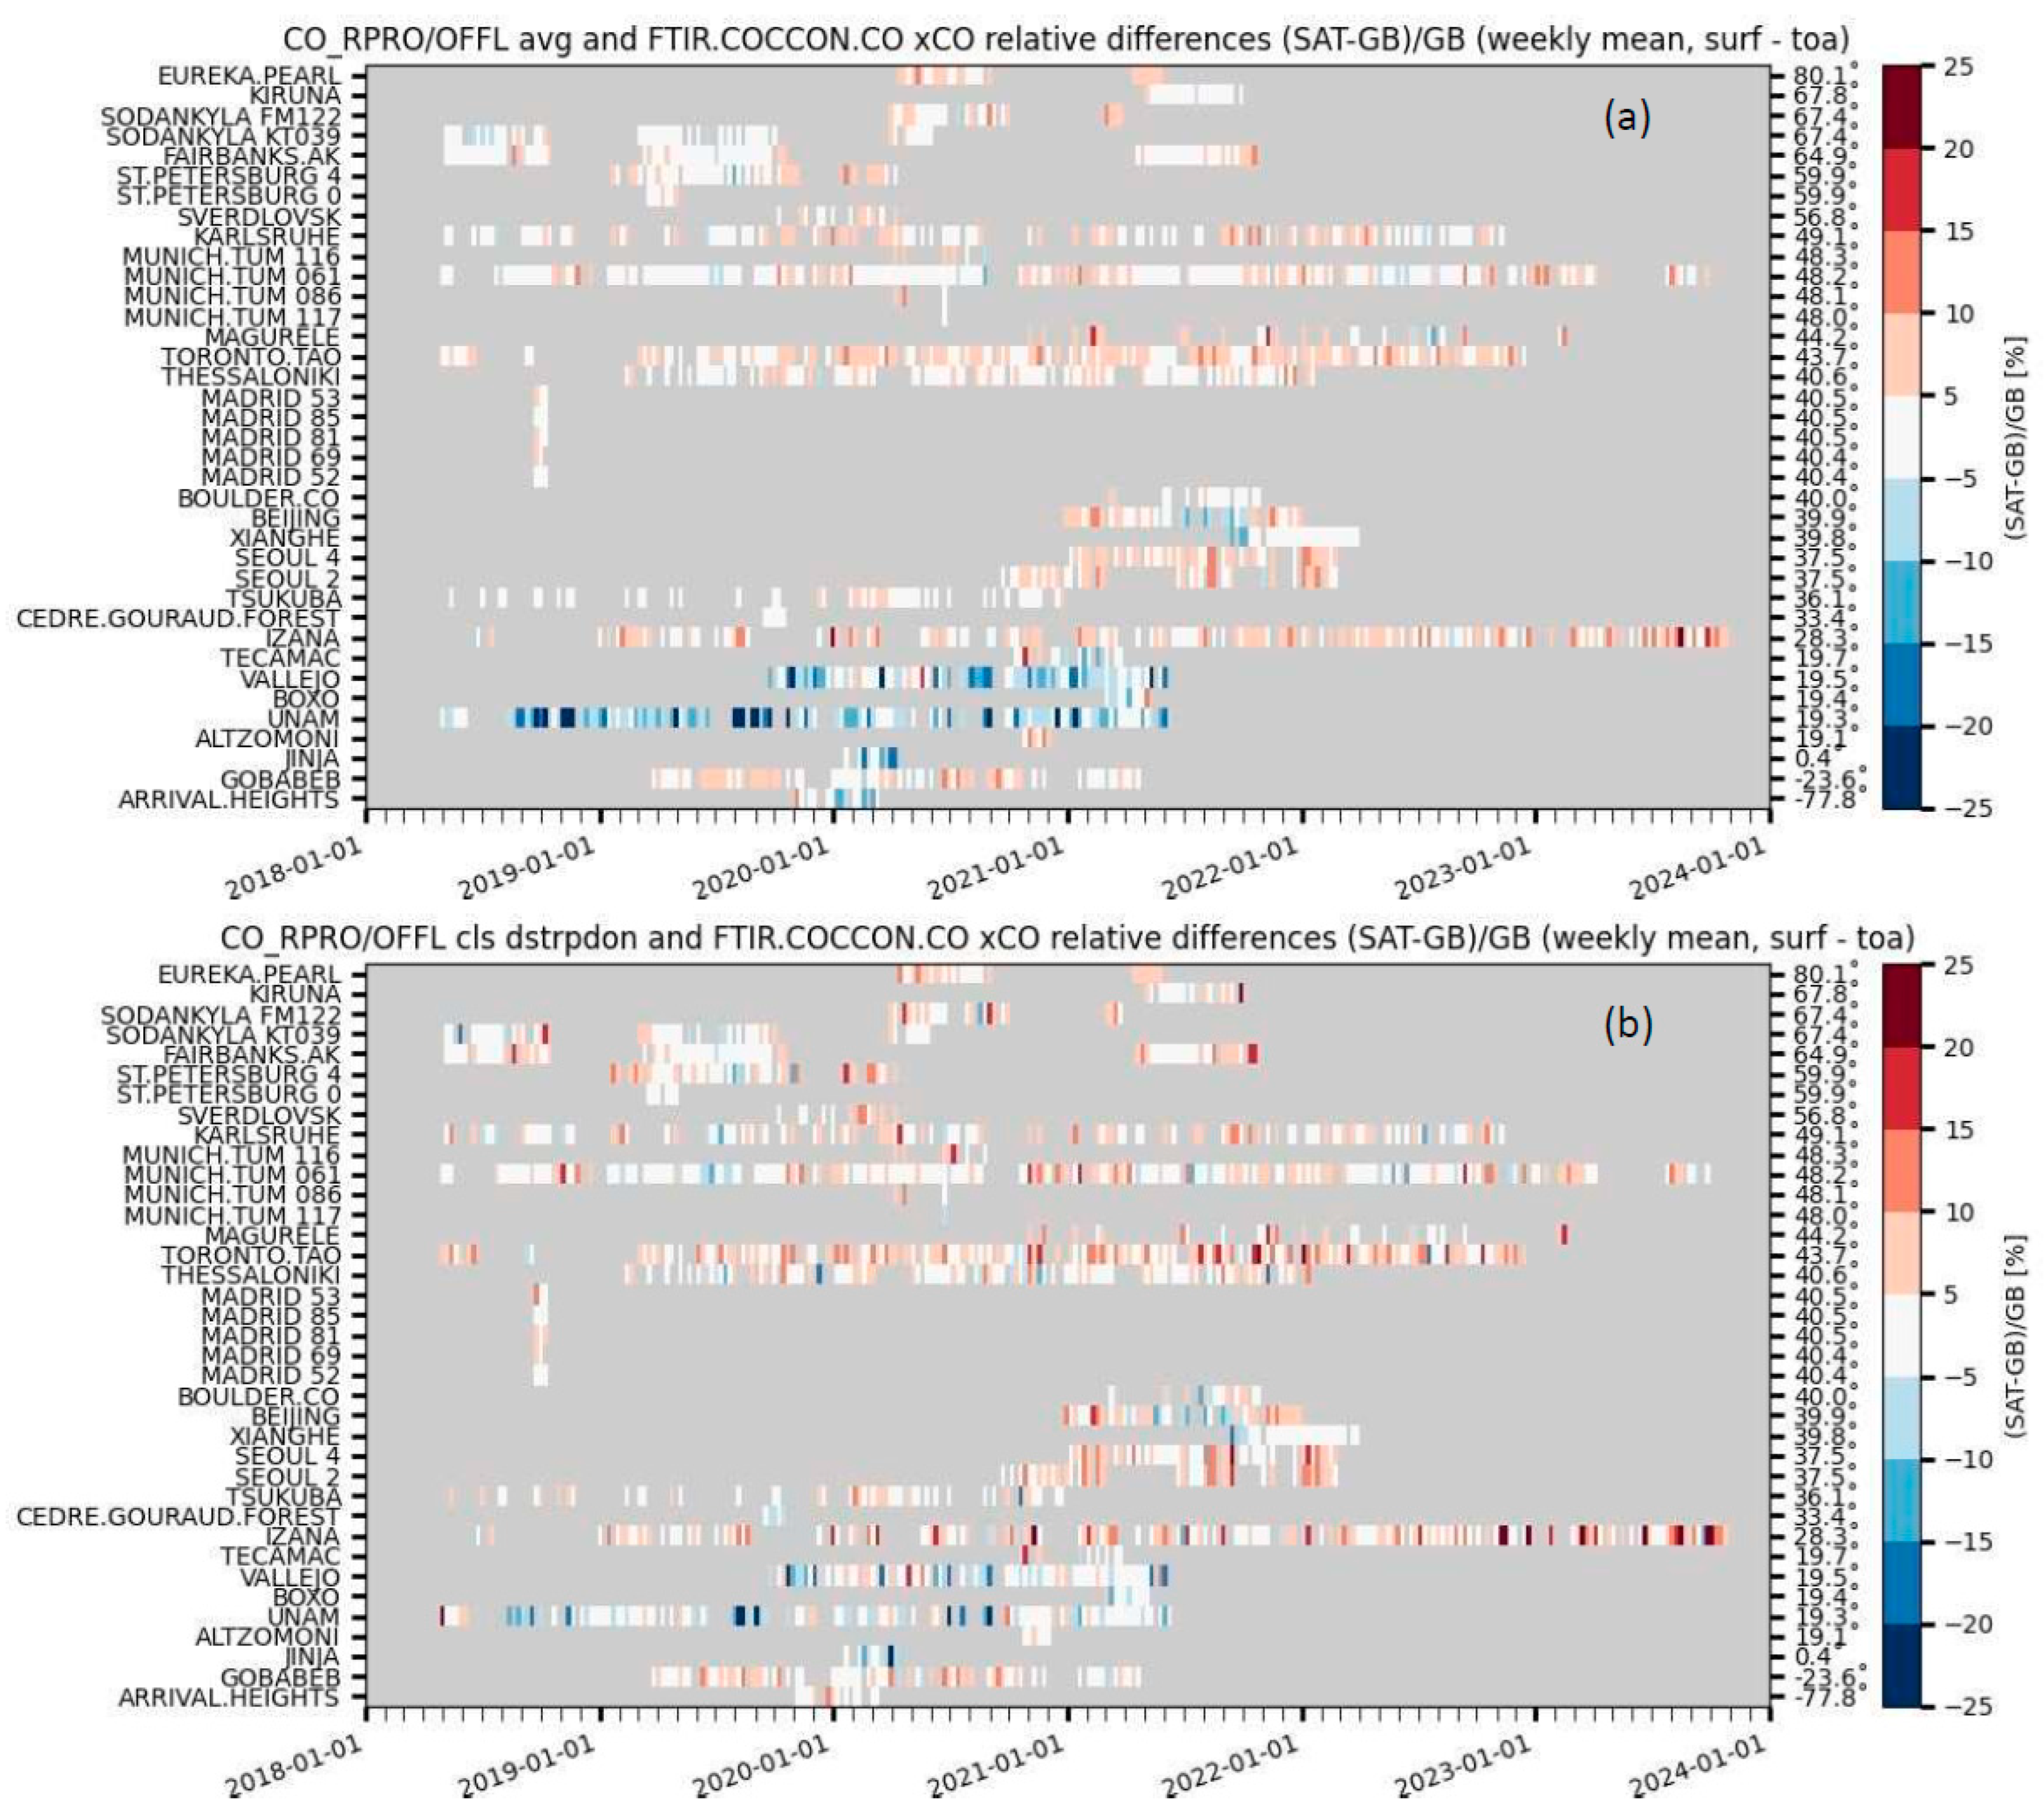
3.1.2. S5P XCO Validation Results

The validation results of the S5P XCO standard and destriped products with a priori aligned ground-based reference COCCON data are shown in Table 3. A total of 27 stations for the period between April 2018 and December 2023 are found within the colocation criteria. The systematic difference between the S5P and COCCON XCO is, on average, 2.24 ± 3.59% for the 50 km radius colocation criterion and an average of all valid pixels taken within the colocation radius. A second test case with colocation for the closest valid pixel (see the magenta colored bars in Figure 4a,c) gives a mean systematic difference of 2.39 ± 3.50%. The best reduction in the standard deviation of the mean systematic difference is for the destriped on-pixel colocation criteria, which gives a mean value of 2.71 ± 3.11%. This will be discussed further when explaining Figure 4 and Figure 5. The random error between the S5P and COCCON XCO comparisons is, on average, 6.00 ± 3.35% for the circle with 50 km radius settings, 7.92 ± 4.86% for the closest pixel setting, and 7.65 ± 4.92% for the destriped on-pixel setting. As expected, the latter two validation settings with single-pixel comparisons have a larger standard deviation as compared to the averaged case, but they are still within the mission requirements for most cases. The values are around 10% or slightly more for the sites that are closer to the hot spots (e.g., sites near/around Mexico City—Tecamac, Vallejo, Boxo, and Unam; Beijing). In most of these cases, the systematic difference between the S5P and COCCON XCO values improved for the destriped on-pixel validation case. The correlation coefficient between the two datasets is, for most sites, around or above 0.85 except when the dataset is less than a week. Izaña is a special case where, despite a high number of measurements, the correlation is low, and the standard deviation is high. The ground-based reference COCCON data for this site seems to have a higher scatter in the time series since the summer of 2021, the cause of which is under investigation. The outliers in the statistics are due to the limited datasets available for the comparison. The ratio of the standard deviation of the ground-based data to the standard deviation of the satellite data is given as the SD column in the table. The value of SD is below 1 for most sites, implying that the S5P data are more variable than the ground-based reference COCCON data.
Figure 4 shows the bar plots for the S5P XCO validation results against the ground-based COCCON data. Figure 4a shows the mean relative biases for the three validation cases of the average of coincidence pixels within a 50 km radius (blue), the closest pixel (magenta), and the destriped on-pixel (grey) coincidence cases, (b) shows the difference in the mean relative bias of the averaged case against the closest (magenta) and destriped on-pixels (grey) cases, and (c) shows the standard deviation of the relative biases at each COCCON station for the three validation cases. The relative bias is typically well below the 15% limit for all sites and all validation cases. As already mentioned, for several polluted regions (e.g., Mexico City), the validation results for the destriped on-pixel case show that the satellite-derived XCO values are closer to the ground-based reference COCCON XCO data. For other sites with limited datasets, the scatter increases, as shown by the higher values of the standard deviation of the relative biases for the closest and destriped on-pixel cases as compared to the average case.
The mosaic plots of the relative biases for the averaged over 50 km radius case and destriped on-pixel case for validation of S5P XCO against the COCCON XCO data are shown in Figure 5a,b, respectively. Each bar represents the average of the weekly relative bias values. We observe a high positive bias during periods with events of elevated CO and a negative bias during periods with occurrences of low CO. The most prominent change can be seen in the blue or dark blue color bars (a), which then change to more white bars (b) for the sites around Mexico City (Tecamac, Vallejo, Boxo, Unam).

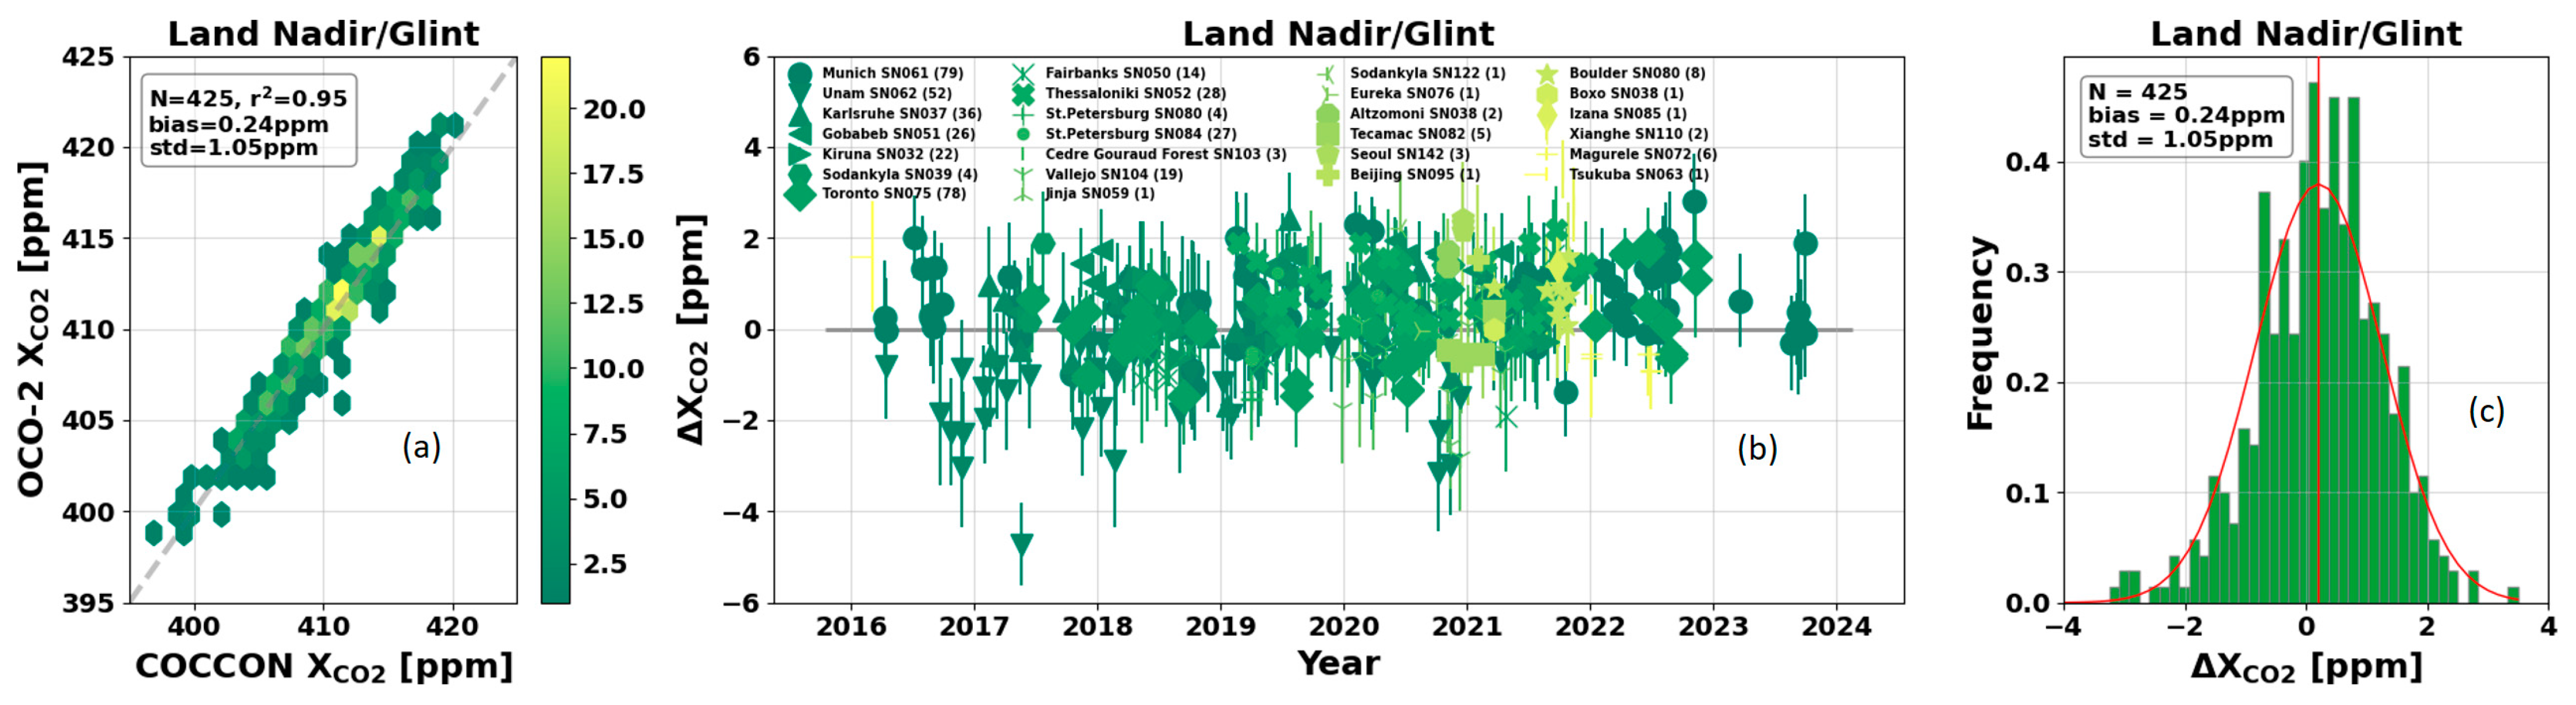
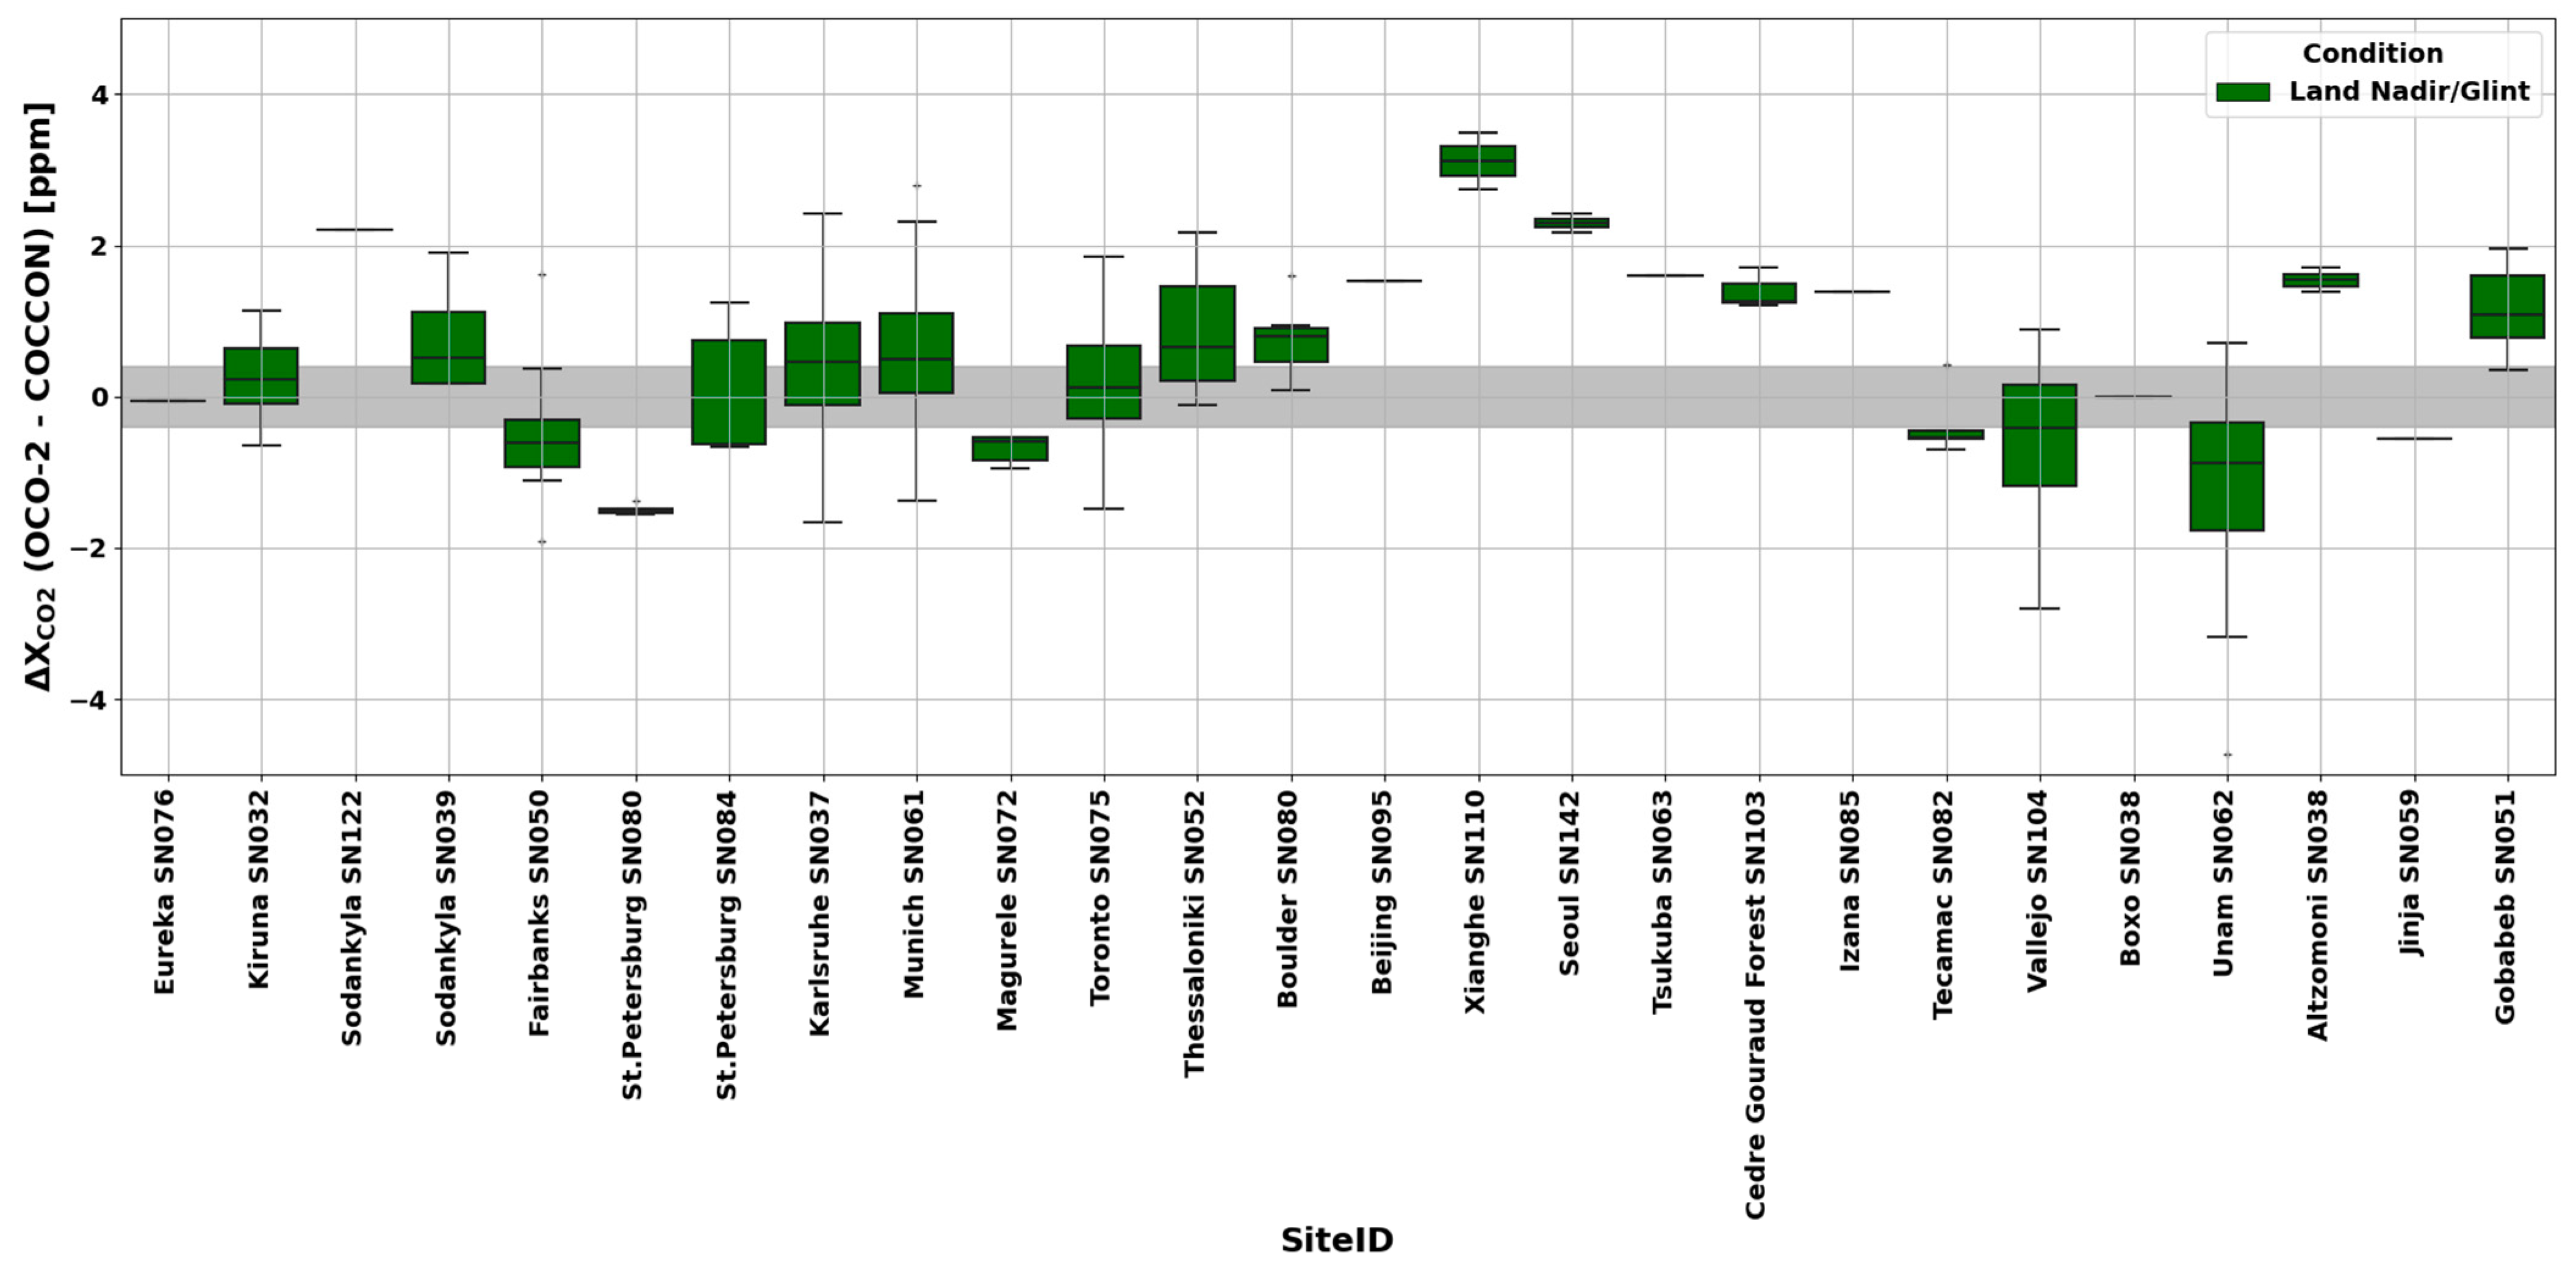
3.2. OCO-2 Validation

The ground-based TCCON [2] XCO2 data are the primary reference validation data source for the validation of OCO-2 XCO2 products. Wunch et al. [46] used XCO2 retrievals from the TCCON to validate the V7 OCO-2 XCO2 retrievals and demonstrate the OCO-2 validation methodology. The process of comparing OCO-2 XCO2 observations to TCCON observations has continued with each updated OCO-2 data release and continues to be extremely important in demonstrating the quality of the satellite data record. With nearly a decade of OCO-2 observations and continued improvement in the data quality, we now look to expand our validation analysis to include comparisons to data from EM27/SUN spectrometers as part of the COCCON. For this analysis, we use the V11.1 retrospective “lite” files, in which the data are bias-corrected and quality-controlled [22]. V11.1 implements the Copernicus digital elevation map (DEM) instead of the NASADEM+, along with a recalculated bias correction that accounts for this change. The new DEM improves the retrievals, particularly at high latitudes. Further, V11.1 includes modifications to the quality control parameters (h2o_ratio and co2_ratio) to improve their accuracy. The soundings over the ocean remain unchanged from V11 since the OCO-2 V11.1 update is only applied to the retrievals over land [23].
Atmospheric CO2 measurements are tied to the NOAA Global Monitoring Laboratory’s primary standards. Hall et al. [47] published revisions to the World Meteorological Organization’s CO2 scale. Thus, in situ CO2 measurements have been recalibrated to the new scale, identified as WMO-CO2-X2019 (hereafter X2019). Although the initial OCO-2 V11.1 release was vicariously tied to the X2007 WMO CO2 scale through the TCCON transfer standard [2], updated TCCON scaling from the previous X2007 CO2 scale to the new X2019 CO2 scale has resulted in similar updates to the OCO-2 data. OCO-2 V11.1 now includes an additional variable, “XCO2_X2019”, which is the estimate of XCO2 on the X2019 scale, where the X2019 XCO2 value is roughly 0.08 ppm higher than that of X2007. The XCO2 data used in this analysis are on the X2019 scale. The data were used when the “xco2_quality_flag” is zero, as directed by the OCO-2 Data Product User’s Guide (https://docserver.gesdisc.eosdis.nasa.gov/public/project/OCO/OCO2_V11_OCO3_V10_DUG.pdf, accessed on 1 March 2024). We used the following geographic coincidence criteria for comparisons against the COCCON sites: a box centered on the COCCON site that spans 2.5° in latitude and 5° in longitude, barring some exceptions. For Beijing, Xianghe, Seoul, and Tsukuba, smaller latitude–longitude boxes (±0.25° × ±0.25°) were used to minimize the inclusion of redundant scatter and the impact of urban vs. rural gradients. For Altzomoni, Unam, Vallejo, Tecamac, and Boxo, the coincidence boxes span 2° in latitude and 2° in longitude. The COCCON data used are within ± 1 h of the median OCO-2 overpass time. All data that passed the selection criteria were aggregated into overpass means, and the median OCO-2 XCO2 was compared to the COCCON XCO2 median recorded during the two-hour window. Comparing the median values reduces the random component of the COCCON error budget and is less sensitive to outliers.
The validation results of the OCO-2 data in the land nadir and land glint observation modes globally against the COCCON XCO2 data are shown in Figure 6. Figure 6a shows the OCO-2 one-to-one plot against the COCCON. “N” indicates the number of coincident data points between OCO-2 and the COCCON. The coefficient of determination is represented by “r2”, the bias is indicated by “bias”, and the standard deviation is indicated by “std”. The data are plotted as a “hexbin plot”, where the color of each hexbin represents the number of points in it. The x- and y-axes indicate XCO2 data values in parts per million (ppm) for the COCCON and OCO-2, respectively. A total of 425 coincidences were found, with a high r2 value (0.95), suggesting a good correlation between OCO-2 and COCCON data. The average bias value is 0.25 ppm, which is positive, indicating higher OCO-2 data reported compared to the coincident COCCON data. The standard deviation is 1.05 ppm, which indicates the spread of the bias. There are several sites where very few OCO-2 colocations are found, which is partly the cause of some of the large scatter seen in the bias. Figure 6b shows the time series of the differences between the OCO-2 land nadir, land glint data, and the coincident COCCON data. The x-axis represents the year, and the y-axis indicates ΔXCO2 (OCO-2—COCCON) in ppm. A unique marker is used to identify a site and EM27/SUN pair. Sites with more than one EM27/SUN are identified by the EM27/SUN ID following the site name (e.g., Sodankylä SN039 and Sodankylä SN122). For a large fraction of sites, the markers lie above the y = 0 ppm line (indicated by the horizontal grey line). Figure 6c shows the difference distribution using a histogram plot. The x-axis indicates the XCO2 difference between OCO-2 and COCCON data, and the y-axis indicates the frequency of occurrence. The bent red line indicates the bell curve, and the vertical red line indicates its mean. The histogram shows that, overall, OCO-2 reports slightly higher XCO2 values compared to the coincident COCCON data. The mean bias, standard deviation, r2, and number of coincidence pairs for each site are provided in Table 4.
Figure 7 shows the site-to-site differences between the OCO-2 data and the coincident COCCON data (ΔXCO2) in the land nadir and land glint observation modes. The data are plotted as “box plots”. The bottom and top edges of the box indicate the 25th and 75th percentile limits, respectively. The whiskers indicate the complete data range, barring the outliers. The grey-shaded region encompasses the ΔXCO2 values within ±0.4 ppm, attributed to the uncertainty in the COCCON values. The deviations beyond ±0.4 ppm are more likely from the uncertainties in the OCO-2 data. The results indicate that sites with limited coincidences, such as Xianghe and Seoul, show high bias values. Sites with more than one EM27/SUN show better agreement when there are higher coincidences with OCO-2. For example, the St. Petersburg SN084 data (N = 27) agree better with OCO-2 compared to the St. Petersburg SN080 data (N = 4). Considering the uncertainties and the limited coincidences for several COCCON sites, these initial comparisons of OCO-2 to COCCON data on a global scale are very promising for the land nadir and land glint observation modes.

3.3. GOSAT Validation

The ground-based total column products of XCO2 and XCH4 from the TCCON are the primary reference validation data source for the different versions of the GOSAT products retrieved by NIES. NIES V01.xx XCO2 and XCH4 were validated by Morino et al. [48], followed by a validation study by Yoshida et al. [25] for the improved NIES V02.xx and by Someya et al. [24] for NIES V03.xx of XCO2 and XCH4 data. In this study, the recently published L2 version 03 retrieval product developed by NIES was used. This version is discussed in detail in Someya et al. [24]. We used the bias-corrected V03.05 dataset, as outlined in Someya et al. [24].
We used the following coincidence criteria for comparison against the COCCON sites: GOSAT observations within ±2° of the sites to ensure that a sufficient number of coincidence data and COCCON observations within ±30 min of the GOSAT overpass were considered. If multiple GOSAT scans satisfied the spatial coincidence criterion, the averaged value was used for the analysis. Similarly, if multiple COCCON spectrometers performed observations during a GOSAT overpass, the averaged value from all co-located COCCON spectrometers was used. This mainly affects the city campaign observations (Madrid, Munich, St. Petersburg, and Seoul). GOSAT is unique as it performs observations with different sensor gain settings. This study focused on the standard gain H setting. Gain M is generally only used over bright surfaces, e.g., deserts [49]. For the COCCON stations, GOSAT only performed gain M observations over Gobabeb and Cedregouraudforest. An analysis of gain M and gain H data at the COCCON Gobabeb site is given in Frey et al. [41]. Additionally, the analysis focused on land observations, e.g., GOSAT V03.05 data with “land” flag = 100, and disregarded data with mixed land and ocean surfaces within the footprint.

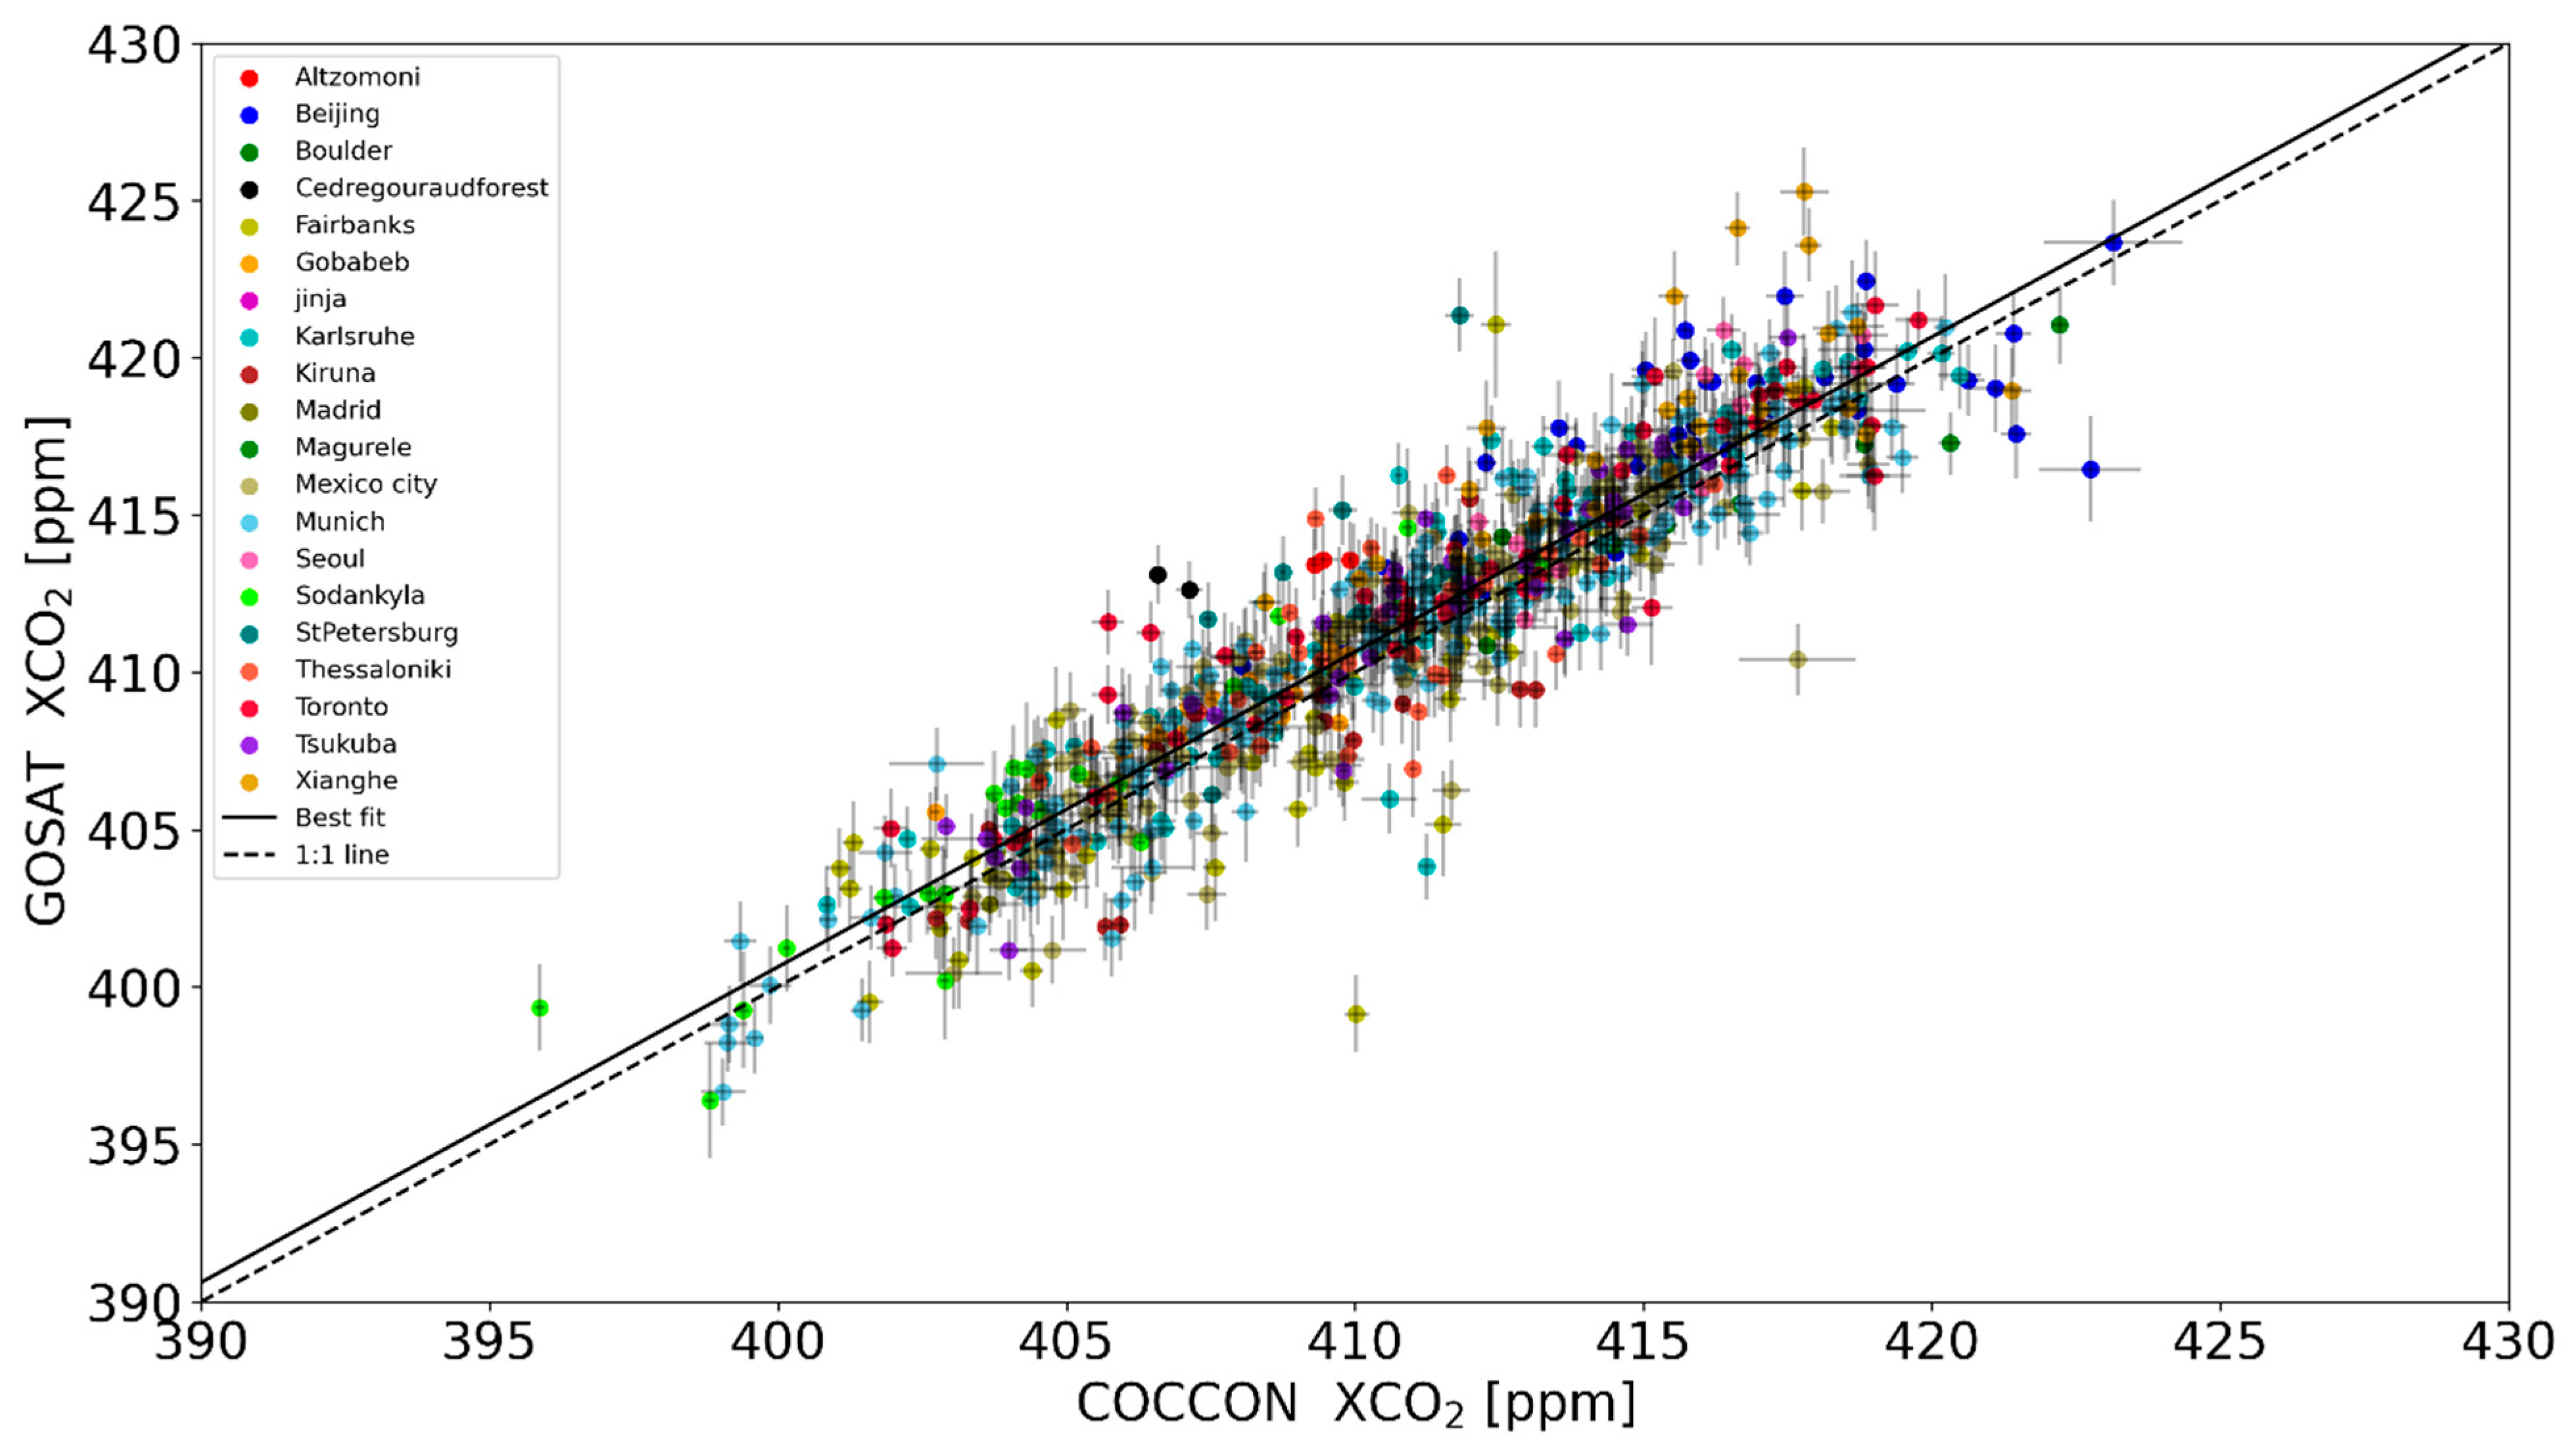
3.3.1. GOSAT XCO2 Validation Results

Table 5 shows XCO2 mean differences (biases) between GOSAT and COCCON observations and the standard deviations (SDs) for all stations, together with the coefficient of determination R2 and the number of coincident observations N (sites with no coincident measurements are not listed). The largest bias (6.01 ppm) is seen for Cedregouraudforest. However, it should be noted that only two coincident measurements were found for this site. The largest SD (7.13 ppm) is observed in Munich. R2 is above 0.7 for 13 out of the 20 stations. For seven sites, less than 10 coincident measurements were found.
A correlation plot showing coincident measurements from all sites (N = 766) is shown in Figure 8. Different colors depict the individual stations. The solid black line is the best fit line through all data points, the dotted black line is the 1:1 line. Error bars denote the 1σ standard deviation of the hourly mean values for COCCON observa-tions and the measurement error for the GOSAT soundings. The lowest absolute XCO2 values are found for the beginning of the Sodankylä data, and the highest values are ob-served more recently at the city sites. We find a good overall agreement with mean R2 of 0.850 for all sites. The mean bias is 0.65 ppm (0.16 %) and mean standard deviation of 2.01 ppm (0.49 %), which is within the uncertainty of the comparison. Someya et al. [24] found a similar uncertainty of 2.20 ppm when comparing GOSAT V03.00 gain H land soundings to TCCON data (version GGG2020). Someya et al. use the non bias-corrected V03.00 dataset, therefore we do not compare the biases from the two studies.

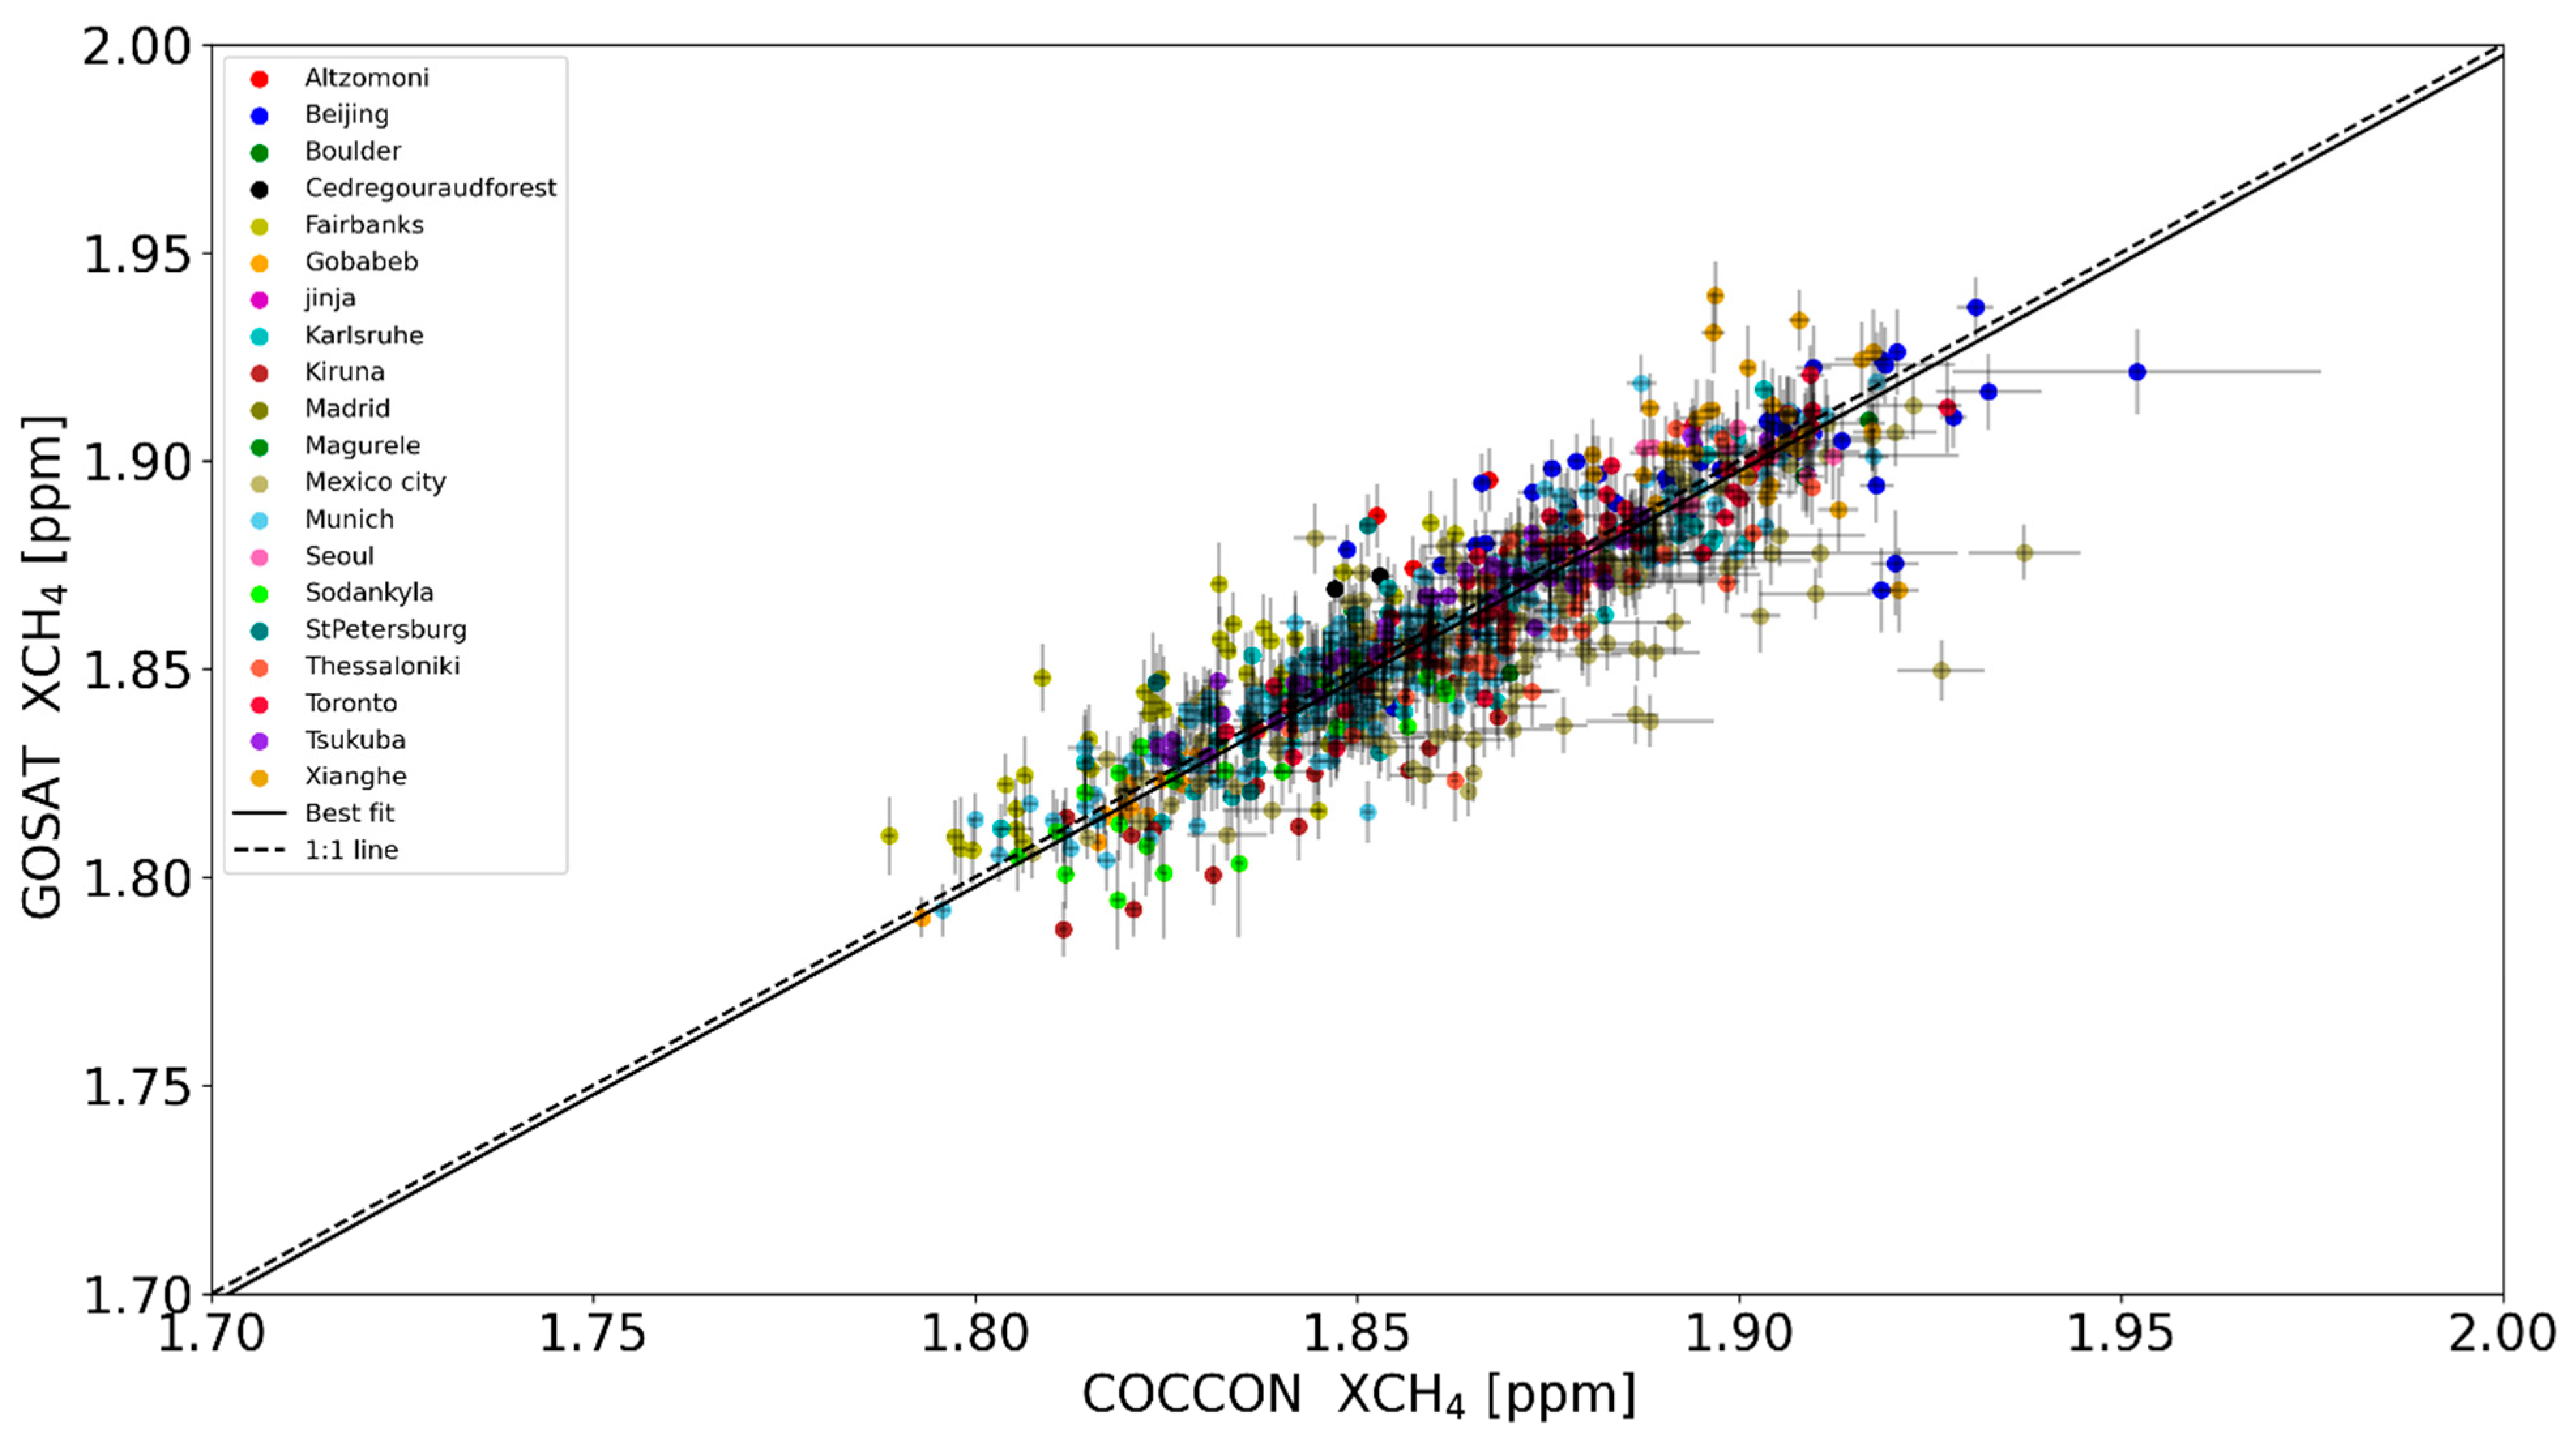
3.3.2. GOSAT XCH4 Validation Results

Table 6 shows XCH4 mean differences (biases) between the GOSAT and COCCON observations and the standard deviations (SDs) for all stations, together with the coefficient of determination R2 and the number of coincident observations N (sites with no coincidence data are not listed). The maximum positive bias (21.93 ppb) is observed at Altzomoni. Kiruna has the maximum negative bias (−18.55 ppb). Apart from Altzomoni and Cedregouraudforest, which have a limited number of colocations, the mean bias is −2.32 ppb (within 1%) for all stations. Munich has the highest SD (36.56 ppb). R2 is above 0.7 for 7 of the 20 stations. For Xianghe, R2 is notably lower for XCH4 when compared to XCO2.
An XCH4 correlation plot between the GOSAT and COCCON observations for all sites (N = 766) is shown in Figure 9. Different colors depict the individual stations. The solid black line is the best-fit line through all data points; the dotted black line is the 1:1 line. The error bars denote the 1σ standard deviation of the hourly mean values for the COCCON observations and the measurement error for the GOSAT soundings. The XCH4 correlation plot shows lower values for the remote sites at the beginning of the observation period, with higher values in the recent city observations. Specifically, the values for XCH4 are low in Sodankylä, but not as pronounced as the Sodankylä XCO2 values. The mean R2 is 0.786, with a mean bias of −2.32 ppb (−0.12%) and a mean standard deviation of 13.52 ppb (0.73%). Again, we find a good level of agreement with the results of Someya et al. (2023). They derived an uncertainty of 11.97 ppb when comparing GOSAT V03.00 and TCCON observations.

4. Discussion and Outlook

The column-averaged dry-air mole fractions of carbon dioxide (XCO2), methane (XCH4), and carbon monoxide (XCO) from the COCCON can provide fiducial reference measurements and complement the TCCON and the NDACC-IRWG [1]. In this study, we used these data from the network for the geophysical validation of multiple suites of satellite-borne sensors (namely, the European Copernicus Sentine-5 Precursor (S5P), the American Orbiting Carbon Observatory-2 (OCO-2), and the Japanese Greenhouse gases Observing SATellite (GOSAT). The earliest COCCON data used in this study span from 2016 to the latest data obtained at the end of 2023, while for some of the sites, only a few days of observations are available due to their deployment as short-term campaigns. The COCCON data version v1 was used in this study as this version provides the largest dataset of the COCCON stations. The 27 individual COCCON stations contributing to this study cover a broad range of latitudinal scales from the high-latitude Arctic site at Eureka to the Antarctic site at Arrival Heights. They cover a broad range of measurand space with high air masses, high zenith angles, and varying albedo with snow, ice, or snow-free in high latitudes; Gobabeb, as special high-albedo site; urban sites in cities close to high-pollution region; multiple spectrometers encircling a source area (e.g., cities like Munich, Madrid, Mexico City); and an equatorial station in Africa.
The coincidence criteria applied to the individual satellite validation are different from each other, but they are similar to the coincidence criteria that were typically used for the respective satellites in previous studies.
We found that the systematic difference between the S5P standard and bias-corrected XCH4 products (V02.04 and above) and a priori aligned COCCON data is, on average, −0.36 ± 0.54% and 0.09 ± 0.37%, respectively. The magnitude of change in bias is similar to that seen for the TCCON validation case in Sha et al., 2024 [44], but the 1σ standard deviation is smaller (by roughly 0.2%) in the COCCON validation case and well within the limit of 1.5%. The random error was also found to be well below the 1% limit for both the standard (0.70 ± 0.34%) and bias-corrected (0.68 ± 0.3%) XCH4 products. For most sites, the correlation coefficient between the S5P and COCCON XCH4 dataset is above 0.75 except when a limited dataset is available for the comparison. A seasonal dependence of the bias was seen, especially for high-latitude sites, where a high bias during the springtime at high solar zenith angles is observed, and a decreasing bias with decreasing solar zenith angle is observed for the remaining months. We found that the systematic difference between the S5P and COCCON XCO is, on average, 2.24 ± 3.59% for the average of all pixels within the 50 km radius colocation criterion and 2.71 ± 3.11% for the destriped on-pixel colocation criterion. The latter colocation criterion reduces the scatter in the mean and is ideal for sites that are closer to the source. The random error between the two validation cases is, on average, 6.00 ± 3.35% and 7.65 ± 4.92%. Both the systematic difference and the random error values were found to be within the limits of 15% and 10%, respectively. These results are very promising as they show the high quality of the S5P CO product. The correlation coefficient between the test cases is around 0.85 or above, except when the intercomparison dataset has limited data. A seasonal dependence of relative bias was seen, with high bias during the high-CO event and low bias during the low-CO event. In addition to the environmental factors, the residual bias can potentially be due to other factors, like the retrieval algorithm, cloud and aerosol effects, and lack of a calibrated reference traceable to the world meteorological organization scale [50].
A total of 425 coincidences were found between the OCO-2 V11.1 land nadir and land glint and COCCON XCO2 data. The average bias value is 0.24 ppm, with a standard deviation of 1.05 ppm and a coefficient of determination value of 0.95. Considering the uncertainties and the limited coincidences for several COCCON sites, these initial comparisons of OCO-2 to COCCON data on a global scale are very promising for the land nadir and land glint observation modes.
GOSAT NIES V03.05 gain H bias-corrected observations were validated against COCCON data. A total of 766 coincidences were found between the GOSAT and COCCON XCO2 data. The overall good agreement was confirmed with a mean R2 value of 0.850 for all sites. The mean bias is 0.65 ppm (0.16%), and the mean standard deviation is 2.01 ppm (0.49%), which is within the uncertainty of the comparison. A total of 766 coincidences were also found for the XCH4 data between the GOSAT and COCCON data. The R2 value is 0.786, with a mean bias of −2.32 ppb (−0.12%) and a mean standard deviation of 13.52 ppb (0.73%). The uncertainties were found to be similar to the comparison with TCCON data for both the XCO2 and XCH4 validation cases.
Detailed comparisons of S5P/OCO-2/GOSAT and COCCON data helped detect and quantify regional-scale biases in the satellite products when a sufficient number of colocation pairs were available at the sites. Finally, COCCON has become a reliable source of high-quality ground-based network data that provide column-averaged dry-air mole fractions of CO2 (XCO2), CH4 (XCH4), and CO (XCO). It complements the current efforts of the TCCON and the NDACC network in providing high-quality reference data for satellite and model validation studies and carbon cycle studies. Current efforts are ongoing at the COCCON central processing facility hosted at the Karlsruhe Institute of Technology and on the individual PI level to process the COCCON data with the latest v2.4 of PROFFAST processing chain. Future studies should use the v2.4 of COCCON data when available for the validation of satellite and models and carbon cycle studies.

Author Contributions

Conceptualization, M.K.S., S.D., M.M.F., D.D. and F.H.; data curation, M.K.S., S.D., M.M.F., D.D., C.A., B.C.B., D.B., A.B., T.B., H.B., Z.C., J.C., A.D., S.F., O.G., L.D.G., K.G., J.G., M.G., P.H. (Philip Handley), F.H., P.H. (Pauli Heikkinen), N.H., N.J., S.J., T.K., M.K., R.K., B.L., J.L., M.L., M.M. (Maria Makarova), M.M. (Marios Mermigkas), I.M., N.M., A.N., T.N., H.O., W.O., G.O., H.P., R.P., D.F.P., U.R., M.R., E.S., W.R.S., W.S., C.S., N.T., C.T., Q.T., T.W., D.W., V.Z. and M.Z.; visualization, M.K.S., S.D., and M.M.F.; writing—original draft, M.K.S., S.D. and M.M.F.; writing—review and editing, M.K.S., S.D., M.M.F., D.D., C.A., B.C.B., D.B., A.B., T.B., H.B., Z.C., J.C., A.D., M.D.M., S.F., O.G., L.D.G., K.G., J.G., M.G., P.H. (Philip Handley), F.H., P.H. (Pauli Heikkinen), N.H., N.J., S.J., T.K., M.K., R.K., B.L., J.L., M.L., M.M. (Maria Makarova), M.M. (Marios Mermigkas), I.M., N.M., A.N., T.N., H.O., W.O., G.O., H.P., R.P., D.F.P., U.R., M.R., E.S., W.R.S., W.S., C.S., N.T., C.T., Q.T., T.W., D.W., V.Z. and M.Z. All authors have read and agreed to the published version of the manuscript.

Funding

This research and the APC were funded by the European Space Agency’s QA4EO project under grant agreement no. 4000128426/19/NL/FF/ab, the SVANTE project under grant agreement no. 4000132151/20/NL/FF/ab, and the FRM Programme under grant agreement no. 4000117640/16/I-LG and 4000136108/21/I-DT-lr. Part of this study was carried out in the framework of the Copernicus Sentinel-5 Precursor Mission Performance Centre (S5P, MPC), contracted by the European Space Agency (ESA/ESRIN, contract no. 4000117151/16/I-LG), and supported by the Belgian Federal Science Policy Office (BELSPO), the Royal Belgian Institute for Space Aeronomy (BIRA-IASB). Part of this study was also supported by the S5P Validation Team (S5PVT) AO project TCCON4S5P (ID no. 28603, PI Mahesh Kumar Sha, BIRA-IASB), with national funding from the BELSPO through the ESA ProDEx projects TROVA and TROVA-E2 (PEA 4000116692). This work contains modified Copernicus Sentinel-5 Precursor satellite data (2018–2023) post-processed by BIRA-IASB. The GOSAT validation work was supported in part by the NIES GOSAT project. We acknowledge the CONACyT-ANR project 290589 “Mexico City’s Regional Carbon Impacts” (ANR-17-CE04-0013-01) for funding. Also, the former projects CONACYT 239618 “El estudio del ciclo de Carbono y de lo gases de efecto invernadero utilizando espectroscopia de absorción solar” and UNAM-DGAPA PAPIIT IN111521/IN106024 are acknowledged. Eliezer Sepúlveda and Noemie Taquet are supported by the AEMET project under the framework of the Spanish Recovery, Transformation, and Resilience Plan (Plan de Recuperación, Transformación y Resiliencia, PRTyR), funded by the European Commission—NextGenerationEU (Reference No. P02.C05.I03.P51.S000.043). Funding for the Toronto and Eureka EM27/SUN was provided by the Canada Foundation for Innovation and the Ontario Research Fund. The measurements at Boulder were supported in part by NOAA cooperative agreements NA17OAR4320101 and NA22OAR4320151 and by NASA grant 80NSSC18K0898 and NASA/JPL subaward 1615988. The Tsukuba COCCON site is supported in part by the GOSAT series project. The measurements in Korea were supported by the Korea Environment Industry & Technology Institute (KEITI) through the “Climate Change R&D Project for New Climate Regime”, funded by the Korea Ministry of Environment (MOE) (2022003560006). Greek national funds were provided through the Operational Program “Competitiveness, Entrepreneurship and Innovation” (NSRF 2014–2020) by the “PANhellenic Infrastructure for Atmospheric Composition and Climate Change” project (MIS 5021516), implemented under the Action “Reinforcement of the Research and Innovation” Infrastructure. Support was provided for enhancing the operation of the National Network for Climate Change (CLIMPACT), National Development Program, and General Secretariat of Research and Innovation. The measurements at Fairbanks were supported by NASA (grant no. NNH17ZDA001N-OCO2). This work was carried out through the Core Program within the National Research Development and Innovation Plan 2022–2027, with the support of MCID, project no. PN 23 05/ 3.01.2023 and the European Commission under the Horizon 2020—Research and Innovation Framework Programme, H2020-INFRAIA-2020-1, ATMO-ACCESS Grant Agreement no. 101008004. We acknowledge funding provided by the Natural Environment Research Council for this work, through award ref. NE/N015681/1 “The Global Methane Budget”. SPbU research activity and the collection of data at the St. Petersburg site were funded by a Saint Petersburg State University project, ID: 93882802 (GZ_MDF-2023-2). The collection of COCCON data at Sverdlosk was performed by K. Gribanov and V. Zakharov, who were supported by the state task of the Ministry of Education and Science of the Russian Federation, project no. FEUZ 2024-0011. The measurements in St. Petersburg and Sverdlosk were supported by the European Commission, Horizon 2020 Framework Programme (VERIFY (grant no. 776810)). The measurement campaign at Trainou was funded by Labex VOLTAIRE (ANR-10-LABX-100-01) and the European project H2020 MARSU (DOI 10.3030/690958) coordinated by l’ICARE. The Xianghe and Beijing FTIR measurements are supported by the National Key Research and Development Program of China (2023YFB3907505). The COCCON measurements at Arrival Heights were core-funded by the National Institute of Water and Atmospheric Research (NIWA) through New Zealand’s Ministry of Business, Innovation and Employment Strategic Science Investment Fund. The Munich measurements were funded by the German Research Foundation (CH 1792/2-1, INST 95/1544), the EU Horizon 2020 Project PAUL (101037319), and the ERC consolidator grant CoSense4Climate (101089203). The support of COCCON partner activities by KIT (instrumental tests, COCCON code development and maintenance), the deployment of KIT spectrometers for long-terms site observations (Karlsruhe, Kiruna, Fairbanks, and Thessaloniki), and several campaign activities were enabled by the ESA projects COCCON PROCEEDS (contract 4000121212/17/I-EF) and COCCON OPERA (contract 4000140431/23/I-DT-Ir).

Data Availability Statement

Copernicus Sentinel-5P (processed by ESA), 2021, TROPOMI Level-2 Methane Total Column products, Version 02, are produced by the European Space Agency: https://doi.org/10.5270/S5P-3lcdqiv, accessed on 1 March 2024. Copernicus Sentinel-5P (processed by ESA), 2021, TROPOMI Level-2 Carbon Monoxide total column products, Version 02, are produced by the European Space Agency: https://doi.org/10.5270/S5P-bj3nry0, accessed on 1 March 2024. OCO-2 Lite files are produced by the NASA OCO-2 project at the Jet Propulsion Laboratory, California Institute of Technology, and are available from the NASA Goddard Earth Science Data and Information Services Center (GES-DISC; https://daac.gsfc.nasa.gov/, accessed on 1 March 2024). The GOSAT SWIR L2 V03.05 product is available from the GOSAT Data Archive Service (https://data2.gosat.nies.go.jp/index_en.html, accessed on 1 March 2024). COCCON data from some of the stations are publicly available from the COCCON data archive (https://www.imk-asf.kit.edu/english/3884.php, accessed on 1 March 2024), while the data from other sites are not yet published and can be made available upon request.

Acknowledgments

The authors thank Olivier Rasson (BIRA-IASB) and José Granville (BIRA-IASB) for their support in creating the S5P overpass level-2 files and downloading the data used in this study. We acknowledge the technical assistance provided by Omar López, Alfredo Rodriguez, Miguel Robles, and Delibes Flores. We would like to thank Antarctica New Zealand for providing logistical support for the measurements at Arrival Heights and Hue Tran, Jamie McGaw, and Mark Murphy for carrying out the measurements. We would like to thank Moritz Makowski for data retrieval and Andreas Luther and Florian Dietrich for operating the instruments at the Munich sites. We thank Valéry Catoire and Chaoyang XUE (LPC2E, UMR CNRS CNES Univ Orleans, France), as well as Yangang REN and Max McGILLEN (ICARE, UPR CNRS, Orleans, France), for deploying and maintaining the instrument at the French COCCON sites used in this study. The authors acknowledge the NIES GOSAT project for making the GOSAT data available to the public. Part of this work was carried out at the Jet Propulsion Laboratory, California Institute of Technology, under a contract with the National Aeronautics and Space Administration (80NM0018D0004).

Conflicts of Interest

Author David F. Pollard was employed by the company National Institute of Water & Atmospheric Research Ltd. The remaining authors declare that the research was conducted in the absence of any commercial or financial relationships that could be construed as a potential conflict of interest.

References

  1. Sha, M.K.; De Mazière, M.; Notholt, J.; Blumenstock, T.; Bogaert, P.; Cardoen, P.; Chen, H.; Desmet, F.; García, O.; Griffith, D.W.T.; et al. Fiducial reference measurement for greenhouse gases (frm4ghg). Remote Sens. 2024, 16, 3525. [Google Scholar] [CrossRef]
  2. Wunch, D.; Toon, G.C.; Blavier, J.-F.L.; Washenfelder, R.A.; Notholt, J.; Connor, B.J.; Griffith, D.W.T.; Sherlock, V.; Wennberg, P.O. The total carbon column observing network. Philos. Trans. R. Soc. A Math. Phys. Eng. Sci. 2011, 369, 2087–2112. [Google Scholar] [CrossRef] [PubMed]
  3. De Mazière, M.; Thompson, A.M.; Kurylo, M.J.; Wild, J.D.; Bernhard, G.; Blumenstock, T.; Braathen, G.O.; Hannigan, J.W.; Lambert, J.-C.; Leblanc, T.; et al. The network for the detection of atmospheric composition change (NDACC): History, status and perspectives. Atmos. Chem. Phys. 2018, 18, 4935–4964. [Google Scholar] [CrossRef]
  4. Kuze, A.; Suto, H.; Nakajima, M.; Hamazaki, T. Thermal and near infrared sensor for carbon observation Fourier-transform spectrometer on the greenhouse gases observing satellite for greenhouse gases monitoring. Appl. Opt. 2009, 48, 6716–6733. [Google Scholar] [CrossRef]
  5. Yokota, T.; Yoshida, Y.; Eguchi, N.; Ota, Y.; Tanaka, T.; Watanabe, H.; Maksyutov, S. Global concentrations of CO2 and CH4 retrieved from GOSAT: First preliminary results. SOLA 2009, 5, 160–163. [Google Scholar] [CrossRef]
  6. Veefkind, J.P.; Aben, I.; McMullan, K.; Förster, H.; de Vries, J.; Otter, G.; Claas, J.; Eskes, H.J.; de Haan, J.F.; Kleipool, Q.; et al. TROPOMI on the ESA sentinel-5 precursor: A GMES mission for global observations of the atmospheric composition for climate, air quality and ozone layer applications. Remote Sens. Environ. 2012, 120, 70–83. [Google Scholar] [CrossRef]
  7. Hu, H.; Hasekamp, O.; Butz, A.; Galli, A.; Landgraf, J.; de Brugh, J.A.; Borsdorff, T.; Scheepmaker, R.; Aben, I. The operational methane retrieval algorithm for tropomi. Atmos. Meas. Tech. 2016, 9, 5423–5440. [Google Scholar] [CrossRef]
  8. Hasekamp, O.; Lorente, A.; Hu, H.; Butz, A.; aan de Brugh, J.; Landgraf, J. Algorithm Theoretical Baseline Document for Sentinel-5 Precursor Methane Retrieval. 2022. Available online: https://sentinels.copernicus.eu/documents/247904/2476257/Sentinel-5P-TROPOMI-ATBD-Methane-retrieval.pdf/ (accessed on 1 March 2024).
  9. ESA-EOPG-CSCOP-PL. Sentinel-5 Precursor Calibration and Validation Plan for the Operational Phase, 2017-11-06. Available online: https://sentinel.esa.int/documents/247904/2474724/Sentinel-5P-Calibration-and-Validation-Plan.pdf (accessed on 1 March 2024).
  10. Landgraf, J.; aan de Brugh, J.; Scheepmaker, R.; Borsdorff, T.; Houweling, S.; Hasekamp, O. Algorithm Theoretical Baseline Document for Sentinel-5 Precursor: Carbon Monoxide Total Column Retrieval. 2022. Available online: https://sentinels.copernicus.eu/documents/247904/2476257/Sentinel-5P-TROPOMI-ATBD-Carbon-Monoxide-Total-Column-Retrieval.pdf/ (accessed on 1 March 2024).
  11. Lambert, J.-C.; Keppens, A.; Compernolle, S.; Eichmann, K.-U.; de Graaf, M.; Hubert, D.; Langerock, B.; Ludewig, A.; Sha, M.K.; Verhoelst, T.; et al. Quarterly Validation Report of the Copernicussentinel-5 Precursor Operational Data Products #23: April2018 to May2024. 2024. Available online: https://mpc-vdaf.tropomi.eu/ProjectDir/reports//pdf/S5P-MPC-IASB-ROCVR-23.00.00_FINAL_signed.pdf (accessed on 1 March 2024).
  12. Borsdorff, T.; aan de Brugh, J.; Schneider, A.; Lorente, A.; Birk, M.; Wagner, G.; Kivi, R.; Hase, F.; Feist, D.G.; Sussmann, R.; et al. Improving the TROPOMI CO data product: Update of the spectroscopic database and destriping of single orbits. Atmos. Meas. Tech. 2019, 12, 5443–5455. [Google Scholar] [CrossRef]
  13. Crisp, D.; Miller, C.E.; DeCola, P.L. NASA Orbiting Carbon Observatory: Measuring the column averaged carbon dioxide mole fraction from space. J. Appl. Remote Sens. 2008, 2, 023508. [Google Scholar] [CrossRef]
  14. Crisp, D. Measuring atmospheric carbon dioxide from space with the Orbiting Carbon Observatory-2 (OCO-2). In Earth Observing Systems XX; Butler, J.J., Xiong, X., Gu, X., Eds.; International Society for Optics and Photonics, SPIE: San Diego, CA, USA, 2015; Volume 9607, p. 960702. [Google Scholar] [CrossRef]
  15. Crisp, D.; Pollock, H.R.; Rosenberg, R.; Chapsky, L.; Lee, R.A.M.; Oyafuso, F.A.; Frankenberg, C.; O’Dell, C.W.; Bruegge, C.J.; Doran, G.B.; et al. The on-orbit performance of the orbiting carbon Observatory-2 (OCO-2) instrument and its radiometrically calibrated products. Atmos. Meas. Tech. 2017, 10, 59–81. [Google Scholar] [CrossRef]
  16. Crowell, S.; Baker, D.; Schuh, A.; Basu, S.; Jacobson, A.R.; Chevallier, F.; Liu, J.; Deng, F.; Feng, L.; McKain, K.; et al. The 2015–2016 carbon cycle as seen from OCO-2 and the global in situ network. Atmos. Chem. Phys. 2019, 19, 9797–9831. [Google Scholar] [CrossRef]
  17. David Crisp and the OCO-2 Team. Measuring atmospheric carbon dioxide from space: The GOSAT and OCO-2 missions. In Renewable Energy and the Environment; Optica Publishing Group: Austin, TX, USA, 2011; p. EWC6. [Google Scholar] [CrossRef]
  18. Keppel-Aleks, G.; Wennberg, P.O.; Schneider, T. Sources of variations in total column carbon dioxide. Atmos. Chem. Phys. 2011, 11, 3581–3593. [Google Scholar] [CrossRef]
  19. Eldering, A.; O’Dell, C.W.; Wennberg, P.O.; Crisp, D.; Gunson, M.R.; Viatte, C.; Avis, C.; Braverman, A.; Castano, R.; Chang, A.; et al. The orbiting carbon observatory-2: First 18 months of science data products. Atmos. Meas. Tech. 2017, 10, 549–563. [Google Scholar] [CrossRef]
  20. Connor, B.J.; Boesch, H.; Toon, G.; Sen, B.; Miller, C.; Crisp, D. Orbiting carbon observatory: Inverse method and prospective error analysis. J. Geophys. Res. Atmos. 2008, 113. [Google Scholar] [CrossRef]
  21. O’Dell, C.W.; Connor, B.; Bösch, H.; O’Brien, D.; Frankenberg, C.; Castano, R.; Christi, M.; Eldering, D.; Fisher, B.; Gunson, M.; et al. The ACOS CO2 retrieval algorithm—Part 1: Description and validation against synthetic observations. Atmos. Meas. Tech. 2012, 5, 99–121. [Google Scholar] [CrossRef]
  22. O’Dell, C.W.; Eldering, A.; Wennberg, P.O.; Crisp, D.; Gunson, M.R.; Fisher, B.; Frankenberg, C.; Kiel, M.; Lindqvist, H.; Mandrake, L.; et al. Improved retrievals of carbon dioxide from orbiting carbon observatory-2 with the version 8 ACOS algorithm. Atmos. Meas. Tech. 2018, 11, 6539–6576. [Google Scholar] [CrossRef]
  23. Jacobs, N.; O’Dell, C.W.; Taylor, T.E.; Logan, T.L.; Byrne, B.K.; Kiel, M.; Kivi, R.; Heikkinen, P.; Merrelli, A.; Payne, V.H.; et al. The importance of digital elevation model accuracy in XCO2 retrievals: Improving the OCO-2 ACOS v11 product. Atmos. Meas. Tech. Discuss. 2023, 17, 1375–1401. [Google Scholar] [CrossRef]
  24. Someya, Y.; Yoshida, Y.; Ohyama, H.; Nomura, S.; Kamei, A.; Morino, I.; Mukai, H.; Matsunaga, T.; Laughner, J.L.; Velazco, V.A.; et al. Update on the GOSAT TANSO–FTS SWIR level 2 retrieval algorithm. Atmos. Meas. Tech. 2023, 16, 1477–1501. [Google Scholar] [CrossRef]
  25. Yoshida, Y.; Ota, Y.; Eguchi, N.; Kikuchi, N.; Nobuta, K.; Tran, H.; Morino, I.; Yokota, T. Retrieval algorithm for CO2 and CH4 column abundances from short-wavelength infrared spectral observations by the greenhouse gases observing satellite. Atmos. Meas. Tech. 2011, 4, 717–734. [Google Scholar] [CrossRef]
  26. Hase, F.; Frey, M.; Kiel, M.; Blumenstock, T.; Harig, R.; Keens, A.; Orphal, J. Addition of a channel for XCO observations to a portable FTIR spectrometer for greenhouse gas measurements. Atmos. Meas. Tech. 2016, 9, 2303–2313. [Google Scholar] [CrossRef]
  27. Sha, M.K.; De Mazière, M.; Notholt, J.; Blumenstock, T.; Chen, H.; Dehn, A.; Griffith, D.W.T.; Hase, F.; Heikkinen, P.; Hermans, C.; et al. Intercomparison of low- and high-resolution infrared spectrometers for ground-based solar remote sensing measurements of total column concentrations of CO2, CH4, and CO. Atmos. Meas. Tech. 2020, 13, 4791–4839. [Google Scholar] [CrossRef]
  28. Frey, M.; Sha, M.K.; Hase, F.; Kiel, M.; Blumenstock, T.; Harig, R.; Surawicz, G.; Deutscher, N.M.; Shiomi, K.; Franklin, J.E.; et al. Building the collaborative carbon column observing network (COCCON): Long-term stability and ensemble performance of the EM27/SUN Fourier transform spectrometer. Atmos. Meas. Tech. 2019, 12, 1513–1530. [Google Scholar] [CrossRef]
  29. Feld, L.; Herkommer, B.; Vestner, J.; Dubravica, D.; Alberti, C.; Hase, F. Proffastpylot: Running proffast with python. J. Open Source Softw. 2024, 9, 6481. [Google Scholar] [CrossRef]
  30. Pollard, D.F.; Hase, F.; Sha, M.K.; Dubravica, D.; Alberti, C.; Smale, D. Retrievals of XCO2, XCH4 and XCO from portable, near-infrared Fourier transform spectrometer solar observations in antarctica. Earth Syst. Sci. Data 2022, 14, 5427–5437. [Google Scholar] [CrossRef]
  31. Alberti, C.; Tu, Q.; Hase, F.; Makarova, M.V.; Gribanov, K.; Foka, S.C.; Zakharov, V.; Blumenstock, T.; Buchwitz, M.; Diekmann, C.; et al. Investigation of spaceborne trace gas products over St Petersburg and Yekaterinburg, Russia, by using collaborative column carbon observing network (COCCON) observations. Atmos. Meas. Tech. 2022, 15, 2199–2229. [Google Scholar] [CrossRef]
  32. Jacobs, N.; Simpson, W.R.; Wunch, D.; O’Dell, C.W.; Osterman, G.B.; Hase, F.; Blumenstock, T.; Tu, Q.; Frey, M.; Dubey, M.K.; et al. Quality controls, bias, and seasonality of CO2 columns in the boreal forest with orbiting carbon observatory-2, total carbon column observing network, and EM27/SUN measurements. Atmos. Meas. Tech. 2020, 13, 5033–5063. [Google Scholar] [CrossRef]
  33. Pak, N.M.; Hedelius, J.K.; Roche, S.; Cunningham, L.; Baier, B.; Sweeney, C.; Roehl, C.; Laughner, J.; Toon, G.; Wennberg, P.; et al. Using portable low-resolution spectrometers to evaluate total carbon column observing network (TCCON) biases in North America. Atmos. Meas. Tech. 2023, 16, 1239–1261. [Google Scholar] [CrossRef]
  34. Mermigkas, M.; Topaloglou, C.; Balis, D.; Koukouli, M.E.; Hase, F.; Dubravica, D.; Borsdorff, T.; Lorente, A. FTIR measurements of greenhouse gases over Thessaloniki, Greece in the framework of COCCON and comparison with S5P/TROPOMI observations. Remote Sensing 2021, 13, 3395. [Google Scholar] [CrossRef]
  35. Zhou, M.; Ni, Q.; Cai, Z.; Langerock, B.; Nan, W.; Yang, Y.; Che, K.; Yang, D.; Wang, T.; Liu, Y.; et al. CO2 in Beijing and Xianghe observed by ground-based FTIR column measurements and validation to OCO-2/3 satellite observations. Remote Sens. 2022, 14, 3769. [Google Scholar] [CrossRef]
  36. Rißmann, M.; Chen, J.; Osterman, G.; Zhao, X.; Dietrich, F.; Makowski, M.; Hase, F.; Kiel, M. Comparison of OCO-2 target observations to MUCCnet—Is it possible to capture urban XCO2 gradients from space? Atmos. Meas. Tech. 2022, 15, 6605–6623. [Google Scholar] [CrossRef]
  37. Dietrich, F.; Chen, J.; Voggenreiter, B.; Aigner, P.; Nachtigall, N.; Reger, B. MUCCnet: Munich urban carbon column network. Atmos. Meas. Tech. 2021, 14, 1111–1126. [Google Scholar] [CrossRef]
  38. Che, K.; Lauvaux, T.; Taquet, N.; Stremme, W.; Xu, Y.; Alberti, C.; Lopez, M.; García-Reynoso, A.; Ciais, P.; Liu, Y.; et al. CO2 emissions estimate from Mexico city using ground- and space-based remote sensing. J. Geophys. Res. Atmos. 2024, 129, e2024JD041297. [Google Scholar] [CrossRef]
  39. Taquet, N.; Stremme, W.; del Castillo, M.E.G.; Almanza, V.; Bezanilla, A.; Laurent, O.; Alberti, C.; Hase, F.; Ramonet, M.; Lauvaux, T.; et al. CO2 and CO temporal variability over Mexico city from ground-based total column and surface measurements. Atmos. Chem. Phys. 2024, 24, 11823–11848. [Google Scholar] [CrossRef]
  40. Che, K.; Lauvaux, T.; Taquet, N.; Stremme, W.; Xu, Y.; Alberti, C.; Lopez, M.; García-Reynoso, A.; Ciais, P.; Liu, Y.; et al. Urban XCO2 gradients from a dense network of solar absorption spectrometers and OCO-3 over Mexico city. J. Geophys. Res. Atmos. 2024, 129, e2023JD040063. [Google Scholar] [CrossRef]
  41. Frey, M.M.; Hase, F.; Blumenstock, T.; Dubravica, D.; Groß, J.; Göttsche, F.; Handjaba, M.; Amadhila, P.; Mushi, R.; Morino, I.; et al. Long-term column-averaged greenhouse gas observations using a COCCON spectrometer at the high-surface-albedo site in Gobabeb, Namibia. Atmos. Meas. Tech. 2021, 14, 5887–5911. [Google Scholar] [CrossRef]
  42. Humpage, N.; Boesch, H.; Okello, W.; Chen, J.; Dietrich, F.; Lunt, M.F.; Feng, L.; Palmer, P.I.; Hase, F. Greenhouse gas column observations from a portable spectrometer in Uganda. Atmos. Meas. Tech. 2024, 17, 5679–5707. [Google Scholar] [CrossRef]
  43. Lorente, A.; Borsdorff, T.; Butz, A.; Hasekamp, O.; de Brugh, J.A.; Schneider, A.; Wu, L.; Hase, F.; Kivi, R.; Wunch, D.; et al. Methane retrieved from TROPOMI: Improvement of the data product and validation of the first 2 years of measurements. Atmos. Meas. Tech. 2021, 14, 665–684. [Google Scholar] [CrossRef]
  44. Sha, M.K.; Langerock, B.; Blavier, J.-F.L.; Blumenstock, T.; Borsdorff, T.; Buschmann, M.; Dehn, A.; De Mazière, M.; Deutscher, N.M.; Feist, D.G.; et al. Validation of methane and carbon monoxide from sentinel-5 precursor using TCCON and NDACC-IRWG stations. Atmos. Meas. Tech. 2021, 14, 6249–6304. [Google Scholar] [CrossRef]
  45. Rodgers, C.D.; Connor, B.J. Intercomparison of remote sounding instruments. J. Geophys. Res. Atmos. 2003, 108. [Google Scholar] [CrossRef]
  46. Wunch, D.; Wennberg, P.O.; Osterman, G.; Fisher, B.; Naylor, B.; Roehl, C.M.; O’Dell, C.; Mandrake, L.; Viatte, C.; Kiel, M.; et al. Comparisons of the orbiting carbon observatory-2 (OCO-2) XCO2 measurements with TCCON. Atmos. Meas. Tech. 2017, 10, 2209–2238. [Google Scholar] [CrossRef]
  47. Hall, B.D.; Crotwell, A.M.; Kitzis, D.R.; Mefford, T.; Miller, B.R.; Schibig, M.F.; Tans, P.P. Revision of the world meteorological organization global atmosphere watch (WMO/GAW) CO2 calibration scale. Atmos. Meas. Tech. 2021, 14, 3015–3032. [Google Scholar] [CrossRef]
  48. Morino, I.; Uchino, O.; Inoue, M.; Yoshida, Y.; Yokota, T.; Wennberg, P.O.; Toon, G.C.; Wunch, D.; Roehl, C.M.; Notholt, J.; et al. Preliminary validation of column-averaged volume mixing ratios of carbon dioxide and methane retrieved from GOSAT short-wavelength infrared spectra. Atmos. Meas. Tech. 2011, 4, 1061–1076. [Google Scholar] [CrossRef]
  49. Velazco, V.A.; Deutscher, N.M.; Morino, I.; Uchino, O.; Bukosa, B.; Ajiro, M.; Kamei, A.; Jones, N.B.; Paton-Walsh, C.; Griffith, D.W.T. Satellite and ground-based measurements of XCO2 in a remote semiarid region of Australia. Earth Syst. Sci. Data 2019, 11, 935–946. [Google Scholar] [CrossRef]
  50. Wunch, D.; Laughner, J.; Toon, G.C.; Roehl, C.M.; Wennberg, P.O.; Millán, L.F.; Deutscher, N.M.; Warneke, T.; Pollard, D.F.; Feist, D.G.; et al. The Total Carbon Column Observing Network’s GGG2020 Data Version: Data Quality, Comparison with GGG2014, and Future Outlook. CaltechDATA 2025. [Google Scholar] [CrossRef]
Figure 1. Geographical distribution of the COCCON stations that provided data for this study. The background image was created with Natural Earth.
Remotesensing 17 00734 g001
Figure 2. S5P XCH4 validation results against the ground-based COCCON XCH4 data used in this study for the period between April 2018 and December 2023. (a) Bar chart of relative biases in percentage. (b) Difference in the relative bias (bias-corrected—standard case) in percentage. (c) Standard deviation of the relative biases in percentage. The stations are sorted by decreasing latitude. The numbers at the end of the sites represent the instrument ids when multiple instruments are located at a single location.
Remotesensing 17 00734 g002
Figure 3. Mosaic plots showing the relative biases between the co-located standard (a) and bias-corrected (b) S5P XCH4 products and COCCON XCH4 data from the COCCON sites in this study between April 2018 and December 2023. The stations are sorted by decreasing latitude.
Remotesensing 17 00734 g003
Figure 4. S5P XCO validation results against the ground-based COCCON XCO data used in this study for the period between April 2018 and December 2023. (a) Bar chart of relative biases in percentage. (b) Difference in the relative biases for validation cases (closest pixel and destriped on-pixel colocations) against the reference case (average) in percentage. (c) Standard deviation of the relative biases in percentage. The stations are sorted by decreasing latitude. The numbers at the end of the sites represent the instrument ids when multiple instruments are located at a single location.
Remotesensing 17 00734 g004
Figure 5. Mosaic plots showing the S5P XCO and ground-based COCCON XCO relative biases for the validation strategy with co-located averaged (a) and destriped on-pixel (b) cases from the COCCON sites in this study between April 2018 and December 2023. The stations are sorted by decreasing latitude.
Remotesensing 17 00734 g005
Figure 6. Validation of OCO-2 land nadir/glint observation mode using COCCON data. (a) The one-to-one relationship between OCO-2 and COCCON for data recorded ± 1 h of the OCO-2 overpass time. The grey dashed line indicates the one-to-one line. “N” indicates the number of coincident points, and “r2” indicates the coefficient of determination. The global average bias is indicated by “bias”, and the standard deviation is represented by “std”. The x- and y-axes indicate the XCO2 values for the COCCON and OCO-2, respectively. The color of each hexbin indicates the number of points in it, identified by the color bar. The time series of ΔXCO2 (OCO-2—COCCON) is shown in the panel plot (b). The markers indicate the COCCON sites/EM27/SUNs for which coincident OCO-2 data are available. The numbers within the brackets next to the markers indicate the number of coincidences (N) corresponding to each site+EM27/SUN pair. The error bars indicate the standard deviation of ΔXCO2. (c) The histogram provides the distribution of ΔXCO2. The x-axis shows the value of the difference, and the y-axis indicates the fraction of observations. All XCO2 data values are in parts per million (ppm).
Remotesensing 17 00734 g006
Figure 7. The site-to-site differences between the OCO-2 data and the coincident COCCON data. The bottom and top edges of the boxes indicate the 25th and 75th percentile limits, respectively. The whiskers indicate the full data range, excluding the outliers. The grey-shaded region represents the ±0.4 ppm uncertainty attributed to the COCCON. Values beyond this range are more likely due to uncertainties in the OCO-2 data. The COCCON measurement locations are ordered by latitude from north to south.
Remotesensing 17 00734 g007
Figure 8. Correlation plot between co-located COCCON and GOSAT XCO2 observations. Different colors denote different COCCON sites. The solid black line is the best-fit line through all data points, the dotted black line is the 1:1 line. Error bars denote the standard deviation of the hourly mean values for COCCON observations and the measurement error for GOSAT soundings.
Remotesensing 17 00734 g008
Figure 9. Correlation plot between co-located COCCON and GOSAT XCH4 observations. Different colors denote different COCCON sites. The solid black line is the best-fit line through all data points; the dotted black line is the 1:1 line. The error bars denote the standard deviation of the hourly mean values for COCCON observations and the measurement error for GOSAT soundings.
Remotesensing 17 00734 g009
Table 1. S5P operational level-2 CO and CH4 reprocessed (RPRO) and offline (OFFL) data versions used in this work.
Product IDStreamVersionIn Operation from
(Orbit #, Date)
In Operation Until
(Orbit #, Date)
L2_CO
and
L2_CH4
RPRO02.04.002818, 2018-04-3024779, 2022-07-25
OFFL02.04.00
02.05.00
02.06.00
24655, 2022-07-17
28031, 2023-03-12
31705, 2023-11-26
28030, 2023-03-12
31704, 2023-11-26
35777, 2024-09-07
Table 2. S5P standard and bias-corrected XCH4 validation results against COCCON XCH4 data at 27 stations for the period between April 2018 and December 2023. Colocation with a radius of 100 km spatial and ±1 h temporal around the satellite overpass was used. The COCCON stations (column 1) are sorted according to decreasing latitude (column 2). The number of co-located measurements for each site is shown in column “No.”. The ratio of the standard deviation of the time series of the COCCON data relative to the standard deviation of the time series of the S5P data is shown in the column labeled “SD”. The correlation coefficient between the S5P and the COCCON data is shown in column “Corr”. Columns “Rel diff bias (%)” and “Rel diff SD (%)” show the relative difference (SAT—GB)/GB bias in percentage and the standard deviation of the relative bias in percentage, respectively.
SiteLat
(°N)
No.S5P bc XCH4S5P std XCH4
SDCorrRel Diff Bias (%)Rel Diff SD (%)SDCorrRel Diff Bias (%)Rel Diff SD (%)
EUREKA.PEARL80.121,6380.90.780.080.610.80.73−0.650.76
KIRUNA67.814,5660.80.68−0.580.870.80.67−1.650.91
SODANKYLA FM12267.419710.80.64−0.220.780.80.58−1.270.86
SODANKYLA KT03967.455800.70.17−0.241.030.70.10−1.401.07
FAIRBANKS.AK64.939,6840.90.670.550.960.90.64−0.451.01
ST.PETERSBURG 059.96850.90.240.000.680.70.20−0.610.85
ST.PETERSBURG 459.927060.90.33−0.011.020.80.33−0.851.10
SVERDLOVSK56.82820.30.700.390.960.30.75−0.760.99
KARLSRUHE49.112,4631.00.85−0.080.600.90.83−0.650.66
MUNICH.TUM 11648.34460.10.060.310.410.30.07−0.180.18
MUNICH.TUM 06148.281,3250.90.830.060.730.90.81−0.570.78
MUNICH.TUM 08648.123547.0−0.01−0.250.063.10.07−0.600.06
MUNICH.TUM 11548.131018.30.140.300.574.80.94−0.460.46
MUNICH.TUM 11748.05500.60.780.700.151.30.38−0.110.14
MAGURELE44.217220.70.750.170.660.70.74−0.240.69
TORONTO.TAO43.753,8370.80.86−0.140.670.80.85−0.700.71
THESSALONIKI40.697141.00.850.350.521.00.840.000.54
MADRID 5340.57961.10.660.570.291.00.700.450.28
MADRID 8540.56671.10.580.120.421.10.670.030.37
MADRID 8140.57441.10.570.510.301.00.670.390.28
MADRID 6940.44533.20.34−0.421.433.50.16−0.481.51
MADRID 5240.48041.10.760.500.291.20.660.430.34
BOULDER.CO40.051990.90.850.350.480.80.860.130.50
BEIJING39.957781.00.810.190.711.00.80−0.090.70
XIANGHE39.845950.70.820.360.490.80.840.180.42
SEOUL 237.517371.10.670.040.611.20.75−0.420.53
SEOUL 437.521821.10.770.110.621.20.79−0.330.58
TSUKUBA36.131080.90.860.190.500.90.89−0.270.46
CEDRE.GOURAUD.FOREST33.46890.60.310.160.560.60.360.330.56
IZANA28.325080.80.75−0.240.950.80.59−0.841.16
TECAMAC19.711591.10.56−0.060.671.00.460.010.74
VALLEJO19.577890.90.56−0.181.040.90.54−0.371.08
BOXO19.413581.70.50−0.771.271.60.49−0.841.29
UNAM19.310,3060.90.61−0.191.080.90.58−0.411.12
ALTZOMONI19.1521.10.430.491.001.10.400.181.04
JINJA0.42850.60.96−0.650.760.60.94−1.170.90
GOBABEB−23.692420.80.860.010.420.80.850.890.43
ARRIVAL.HEIGHTS−77.83410.90.750.940.581.00.75−0.250.53
Mean --2.620.610.090.681.120.61−0.360.70
Table 3. S5P XCO validation results against COCCON XCO data at 27 stations for the period between April 2018 and December 2023. Colocation with a radius of 50 km and the averaged value as spatial, as well as destriped on station pixel and colocation of ±1 h as temporal around the satellite overpass, were used. The COCCON stations (column 1) are sorted according to decreasing latitude (column 2). The number of co-located measurements for each site is shown in column “No.”. The ratio of the standard deviation of the time series of the COCCON data relative to the standard deviation of the time series of the S5P data is shown in column “SD”. The correlation coefficient between the S5P and the COCCON data is shown in column “Corr”. Columns “Rel diff bias (%)” and “Rel diff SD (%)” show the relative difference (SAT—GB)/GB bias in percentage and the standard deviation of the relative bias in percentage, respectively.
SiteLat
(°N)
S5P XCO AvgS5P XCO Dstrpdon
No.SDCorrRel Diff Bias (%)Rel Diff SD (%)No.SDCorrRel Diff Bias (%)Rel Diff SD (%)
EUREKA.PEARL80.140,7890.80.975.863.9937,8450.80.905.587.49
KIRUNA 67.851650.90.960.325.2339140.80.911.968.41
SODANKYLA FM12267.449160.80.954.765.2837270.70.904.928.61
SODANKYLA KT03967.411,6160.80.95−0.764.7189270.80.87−0.017.61
FAIRBANKS.AK64.986,2481.00.932.354.7171,6321.00.902.686.77
ST.PETERSBURG 059.97611.20.773.393.146080.80.802.103.20
ST.PETERSBURG 459.943711.00.883.705.4537450.80.843.837.22
SVERDLOVSK56.86840.80.925.283.465920.80.806.765.51
KARLSRUHE49.117,5820.80.953.464.3414,4380.80.923.075.78
MUNICH.TUM 11648.311730.80.925.456.2211710.80.886.826.93
MUNICH.TUM 06148.2123,6000.90.922.284.72109,5560.80.862.556.32
MUNICH.TUM 08648.19220.60.846.586.719200.60.826.557.64
MUNICH.TUM 11748.017nannan−0.941.0317nannan−6.000.98
MAGURELE44.221631.00.825.036.9118760.90.785.337.99
TORONTO.TAO43.782,2130.90.945.574.6973,0120.80.866.108.04
THESSALONIKI40.614,6100.90.882.474.8612,6900.80.833.146.95
MADRID 5340.58471.30.583.734.027360.70.424.666.34
MADRID 8540.57161.10.701.903.196800.90.711.813.32
MADRID 8140.58021.10.292.633.686820.70.101.684.93
MADRID 6940.45051.30.603.193.373930.90.403.484.52
MADRID 5240.48591.10.393.003.268010.80.402.833.92
BOULDER.CO40.069371.00.950.334.8663971.00.861.588.42
BEIJING39.987781.00.924.008.7877881.00.894.369.51
XIANGHE39.864051.00.971.305.0052860.90.961.095.58
SEOUL 237.529430.90.915.515.1427030.90.876.346.63
SEOUL 437.537141.00.945.794.4835280.90.915.395.62
TSUKUBA36.149041.00.963.343.8444230.90.943.924.60
CEDRE.GOURAUD.FOREST33.47690.80.58−1.133.837320.50.50−4.596.53
IZANA28.317,0680.60.416.9418.8415,4210.30.277.4933.69
TECAMAC19.717291.20.660.6810.468031.30.67−0.8610.09
VALLEJO19.511,1121.20.77−5.3111.7190041.10.84−0.5310.91
BOXO19.422481.10.83−2.0910.9417781.10.890.149.68
UNAM19.315,2581.30.71−6.5912.0412,3681.00.81−0.0611.24
ALTZOMONI19.1631.10.457.488.02560.70.582.447.76
JINJA0.48530.80.90−6.229.157020.80.91−3.029.88
GOBABEB −23.610,3450.90.983.235.1997690.90.962.986.45
ARRIVAL.HEIGHTS−77.85980.60.74−3.486.465150.70.453.748.16
Mean --0.960.802.336.13--0.830.762.957.84
Table 4. OCO-2 V11.1 XCO2 validation results against COCCON data. The mean differences (biases), the standard deviation (SD), the coefficient of determination (R2), and the number of colocations N are presented for each site where at least one colocation was found.
SitesBias [ppm]SD [ppm]R2N
Altzomoni1.540.2312
Beijing1.531.53 1
Boulder0.740.460.918
Boxo−0.01−0.01 1
Cedre Gouraud Forest1.400.270.093
Eureka−0.06−0.06 1
Fairbanks−0.510.810.9814
Gobabeb1.130.480.9726
Izana1.401.39 1
Jinja−0.56−0.56 1
Karlsruhe0.400.790.9636
Kiruna0.260.470.9922
Magurele−0.690.190.936
Munich SN0610.570.800.9879
Seoul2.290.120.993
Sodankyla SN0390.770.810.974
Sodankyla SN1222.212.21 1
St.Petersburg SN080−1.490.080.904
St.Petersburg SN0840.200.700.9527
Tecamac−0.370.450.965
Thessaloniki0.830.700.9628
Tsukuba1.591.59 1
Toronto0.210.820.9878
Unam−1.061.080.9352
Vallejo−0.601.020.7819
Xianghe3.110.5412
Table 5. GOSAT V03.05 XCO2 validation results against the COCCON data. The mean differences (biases), the standard deviation (SD), the coefficient of determination R2, and the number of colocations N are presented for each site where at least one colocation was found.
StationBias [ppm] (%)SD [ppm] (%)R2N
Altzomoni3.39 (0.83)1.00 (0.24)0.0194
Beijing1.43 (0.34)4.52 (1.09)0.60844
Boulder−0.08 (−0.02)2.86 (0.69)0.7536
Cedregouraudforest6.01 (1.48)0.37 (0.09)1.0002
Fairbanks−0.53 (−0.13)6.84 (1.67)0.72350
Gobabeb1.05 (0.26)2.20 (0.54)0.76220
Jinja0.55 (0.13) 1
Karlsruhe0.85 (0.21)7.07 (1.72)0.86275
Kiruna−0.90 (−0.22)5.16 (1.27)0.69115
Madrid−0.54 (−0.13)0.93 (0.23)0.9673
Magurele−1.76 (−0.42)2.89 (0.69)0.8734
Mexico City0.35 (0.09)5.71 (1.39)0.832168
Munich0.49 (0.12)7.34 (1.79)0.903178
Seoul1.52 (0.37)4.08 (0.98)0.78413
Sodankyla1.12 (0.28)6.18 (1.53)0.87222
St. Petersburg3.08 (0.75)4.10 (1.00)0.3599
Thessaloniki0.55 (0.13)4.12 (1.00)0.55233
Toronto1.21 (0.29)7.13 (1.73)0.90152
Tsukuba0.82 (0.20)6.08 (1.48)0.87539
Xianghe2.62 (0.63)4.48 (1.08)0.54028
All data0.65 (0.16)2.01 (0.49)0.850766
Table 6. GOSAT V03.05 XCH4 validation results against the COCCON data. The mean differences (biases), the standard deviation (SD), the coefficient of determination R2, and the number of colocations N are presented for each site where at least one colocation was found.
StationBias [ppb] (%)SD [ppb] (%)R2N
Altzomoni21.93 (1.18)10.84 (0.58)0.0194
Beijing0.85 (0.04)29.55 (1.56)0.49544
Boulder−1.30 (−0.07)22.26 (1.19)0.5706
Cedregouraudforest20.74 (1.12)3.34 (0.18)1.0002
Fairbanks12.27 (0.67)26.86 (1.47)0.66750
Gobabeb−2.23 (0.12)16.08 (0.88)0.89020
Jinja5.78 (0.31) 1
Karlsruhe−2.44 (−0.13)31.17 (1.68)0.83875
Kiruna−18.55 (−1.00)23.98 (1.31)0.63315
Madrid−8.34 (−0.45)9.79 (0.53)0.5693
Magurele−8.40 (−0.44)17.01 (0.89)0.9704
Mexico City−8.36 (−0.45)32.87 (1.76)0.603168
Munich−1.07 (−0.06)36.56 (1.97)0.873178
Seoul−0.97 (−0.05)16.32 (0.86)0.50513
Sodankyla−8.08 (−0.44)24.68 (1.35)0.63622
St. Petersburg6.84 (0.37)20.73 (1.13)0.4319
Thessaloniki−10.50 (−0.56)24.60 (1.31)0.67033
Toronto−0.91 (−0.05)32.99 (1.76)0.89052
Tsukuba2.69 (0.14)28.55 (1.53)0.90939
Xianghe6.54 (0.34)18.51 (0.97)0.00128
All data−2.32 (−0.12)13.52 (0.73)0.786766
Disclaimer/Publisher’s Note: The statements, opinions and data contained in all publications are solely those of the individual author(s) and contributor(s) and not of MDPI and/or the editor(s). MDPI and/or the editor(s) disclaim responsibility for any injury to people or property resulting from any ideas, methods, instructions or products referred to in the content.

