Article

MtAD-Net: Multi-Threshold Adaptive Decision Net for Unsupervised Synthetic Aperture Radar Ship Instance Segmentation

1
School of Computer and Communication Engineering, University of Science and Technology Beijing, Beijing 100083, China
2
Department of Electronic Engineering, Tsinghua University, Beijing 100084, China
*
Author to whom correspondence should be addressed.
Remote Sens. 2025, 17(4), 593; https://doi.org/10.3390/rs17040593
Submission received: 1 December 2024 / Revised: 7 February 2025 / Accepted: 8 February 2025 / Published: 9 February 2025

Abstract

:
In synthetic aperture radar (SAR) images, pixel-level Ground Truth (GT) is a scarce resource compared to Bounding Box (BBox) annotations. Therefore, exploring the use of unsupervised instance segmentation methods to convert BBox-level annotations into pixel-level GT holds great significance in the SAR field. However, previous unsupervised segmentation methods fail to perform well on SAR images due to the presence of speckle noise, low imaging accuracy, and gradual pixel transitions at the boundaries between targets and background, resulting in unclear edges. In this paper, we propose a Multi-threshold Adaptive Decision Network (MtAD-Net), which is capable of segmenting SAR ship images under unsupervised conditions and demonstrates good performance. Specifically, we design a Multiple CFAR Threshold-extraction Module (MCTM) to obtain a threshold vector by a false alarm rate vector. A Local U-shape Feature Extractor (LUFE) is designed to project each pixel of SAR images into a high-dimensional feature space, and a Global Vision Transformer Encoder (GVTE) is designed to obtain global features, and then, we use the global features to obtain a probability vector, which is the probability of each CFAR threshold. We further propose a PLC-Loss to adaptively reduce the feature distance of pixels of the same category and increase the feature distance of pixels of different categories. Moreover, we designed a label smoothing module to denoise the result of MtAD-Net. Experimental results on the dataset show that our MtAD-Net outperforms traditional and existing deep learning-based unsupervised segmentation methods in terms of pixel accuracy, kappa coefficient, mean intersection over union, frequency weighted intersection over union, and F1-Score.

1. Introduction

A synthetic aperture radar (SAR) can work in all-weather conditions. It can monitor the target area without being affected by extreme weather such as haze, dark clouds, and rain [1].
With the rapid development of spaceborne SAR systems such as RADARSAT-2 [2], TerraSAR-X [3], Sentinel-1 [4], and Gaofen-3 [5], SAR images have attracted great attention in many applications such as maritime surveillance, ocean monitoring, fishery control, ship detection, etc. [6,7,8,9]. As the fundamental application of SAR images, SAR ship segmentation has received extensive attention in recent years.
In order to perform target segmentation of images, many traditional methods have been proposed. The traditional target segmentation mainly involves threshold-based [10,11,12,13], region-based [14,15,16], wavelet-based [17], and cluster-based methods [18]. These methods have achieved good performance on simple images, but they basically rely on handcrafted features and fixed hyperparameters. However, SAR backscatter is affected by the speckle noise and the imaging geometry, making targets in SAR images normally present heterogeneous backscatter intensity with incompleteness and discontinuity shapes. These methods usually result in inaccurate segmentation results.
With the development of deep learning, many deep neural network frameworks have been widely employed in the field of image segmentation. Although these methods have high robustness and scalability and avoid the uncertainty caused by noise, the training of these networks is still demanding on the number of validity marker samples of SAR images. However, pixel-level Ground Truth (GT) is a scarce resource in the SAR image domain, because it requires extensive expertise and a significant amount of time. Compared with pixel-level GT, Bounding Box (BBox)-level annotations are easier to obtain, but they also contain noise around the target. Therefore, exploring the use of unsupervised instance segmentation methods to transform BBox-level annotations into pixel-level GT holds great significance in the SAR field.
Meanwhile, unsupervised deep learning methods for image segmentation are also emerging, which are mainly categorized into four classes [19,20,21,22,23,24,25]. The first class is to train the encoder–decoder structure to complete the feature extraction of image pixels, followed by single-step decision making. The second class is to design the loss function through information invariance and equivalence so that the neural network clusters the features corresponding to each pixel, and then completes the segmentation based on the clustering results. The third class is based on the method of superpixel segmentation and merging [26], designing the corresponding loss function for the characteristics of superpixel to complete the unsupervised segmentation of the image. The last class is based on Generative Adversarial Networks (GANs) [27], which obtains networks with the ability to segment images into foreground and background while adversarial training. These methods enable further performance improvement in the field of unsupervised image segmentation. However, due to the fact that SAR images are characterized by speckle noise, low imaging resolution, and unshaped boundaries, the existing deep learning methods are not accurate enough to locate the targets in SAR images.
In order to address the above problems, we firstly design a Multiple CFAR Threshold-extraction Module (MCTM). Specifically, this module uses the CFAR detector to extract the corresponding thresholds based on multiple false alarm rates that vary from small to large. Then, we designed an adaptive decision network. Inspired by Unet [28] and Vision Transformer [29], our adaptive decision network contains two modules, Local U-shape Feature Extractor (LUFE) and Global Vision Transformer Encoder (GVTE), where LUFE projects each pixel to a high-dimensional feature space, and GVTE encodes the input image, extracts global features, and outputs the probability corresponding to each CFAR threshold. The vector inner product of the outputs of GVTE and MCTM is then computed to perform adaptive decision making for multi-thresholding. In addition, we design a new pixel-level contrast loss function (PLC-Loss) with reference to contrast learning, which can reduce the distance in the feature space of pixels with the same category in the image and increase the distance in the feature space of pixels with different categories, so as to realize fine segmentation of SAR ship image targets in an unsupervised way. Finally, we design a label smoothing module to denoise the result of MtAD-Net. Our code is available at https://github.com/xjf20010726/MtAD-Net (accessed on 30 November 2024).
Our main contributions are summarized as follows:
1.
We propose a new network model named Multi-threshold Adaptive Decision Network (MtAD-Net). Unlike existing methods, our approach utilizes the CFAR algorithm to analyze the sea clutter noise around the ship based on different false alarm rates, obtaining the corresponding thresholds and achieving adaptive decision fusion. This process enables accurate localization of the ship’s target boundary and segmentation into continuous regions.
2.
We design a pixel-level contrast loss function (PLC-Loss) that reduces the distance of pixels within the same category and increases the distance of pixels of different categories so that the model can converge quickly under unsupervised conditions.
3.
Experimental results show that unsupervised instance segmentation of SAR ship images is a challenging task, and previous unsupervised segmentation methods cannot provide precise results. Our method achieves state-of-the-art (SOTA) results in five metrics [30]: Pixel Accuracy (PA), Mean Intersection over Union (MIoU), Frequency Weighted Intersection over Union (FWIoU), kappa (K), and F1-Score (F1).

2. Related Work

2.1. Unsupervised Deep Learning Segmentation Method for Optical Images

These approaches can be mainly categorized into four classes, reflecting significant associations and differences in their techniques for feature extraction, representation optimization, and semantic consistency.
Encoder–decoder architectures serve as foundational methods in unsupervised segmentation, leveraging hierarchical compression and reconstruction of image resolution to integrate multi-scale features. These approaches, such as W-Net [19], often incorporate reconstruction tasks to balance local boundary details and global semantic information.
To address the challenge of aligning pixel features with semantic concepts, methods based on invariance and equivariance introduce loss functions that optimize feature robustness against photometric and geometric transformations. For instance, IIC [20] employs mutual information maximization to ensure semantic consistency across different views, while PiCIE [23] further strengthens geometric and photometric invariance for enhanced global feature stability. In contrast, Kim-Net [22] focuses on local feature continuity and similarity, complementing global consistency approaches.
On the other hand, methods based on superpixel segmentation and merging utilize prior local structural information to optimize both segmentation boundaries and regional coherence. Superpixel-based methods, such as LPC [25] and DIC [22], begin with initial image over-segmentation and refine the results through local feature similarity and global semantic constraints. LPC employs dual loss mechanisms to enhance boundary awareness, whereas DIC iteratively updates cluster centers to improve segmentation stability and granularity.
GAN-based methods exploit the generative capabilities of adversarial networks to extract semantic features for segmentation, enabling foreground and background separation. Labels4Free [24] exemplifies this category by extending the StyleGAN [31] generator architecture to include a segmentation branch, producing high-quality foreground/background masks during adversarial training.
The above methods are designed for RGB images and perform well on them. Compared to RGB images, SAR images exhibit speckle noise, lower imaging accuracy, and gradient pixel changes at target edges and backgrounds. These methods fail to achieve the expected segmentation results for SAR images due to their unique characteristics.

2.2. Unsupervised Deep Learing Segmentation Method for SAR Images

Unsupervised segmentation in SAR imagery is a challenging task due to the modality’s inherent speckle noise, complex scene structures, and the high cost of labeled data acquisition. Recent advancements leverage domain adaptation and SAR-specific deep learning techniques to address these challenges, focusing on bridging the modality gap and exploiting the unique spatial and semantic properties of SAR data.
A SAR-specific method, such as IDUDL [32], first combines a feature extraction network with SLIC [26] to generate pseudo-labels for input images. Then, it trains a fully convolutional neural network (FCN) [33] using these pseudo-labels to obtain segmentation results. These two steps are iterated alternately, with the generated pseudo-labels enhancing the performance of the segmentation network. Additionally, the segmentation network’s output feeds back to the feature extraction network, refining the pseudo-labels. Once the generated pseudo-labels stabilize, the segmentation network’s output represents the final segmentation result.
In contrast, domain adaptation methods like CDA-SAR [34] focus on cross-modal knowledge transfer. It consists of a Sample-level Image Transfer (SIT) module and a Feature-level Domain Adaptation (FDA) module, which supports cross-domain instance segmentation in SAR images. The SIT module transfers the image style from optical images to SAR images with Generative Adversarial Networks. Then, the pseudo-SAR images with fine labeling and the unlabeled SAR images are fed into the segmentation network, and the cross-domain alignment of features is realized based on the instance-level contrastive learning of the FDA module, so as to complete the segmentation of SAR images.
Although these methods are designed for SAR images and have demonstrated significant potential, the pseudo-labels generated by IDUDL are affected by the superpixel merging mechanism, leading to edge localization errors. Consequently, the segmentation results obtained using pseudo-labels for training also suffer from inaccurate edge localization. CDA-SAR is a cross-domain segmentation method that uses optical images as the source domain. However, the feature alignment between optical and SAR images may cause the unique features of SAR images to be lost, leading to segmentation discontinuities and edge localization errors.

3. Method

In this section, we introduce the proposed MtAD-Net (Section 3.1, Section 3.2, Section 3.3 and Section 3.4), the PLC-Loss (Section 3.5), and the label smoothing module (Section 3.6) in detail.

3.1. Overall Architecture

As shown in Figure 1, the proposed MtAD-Net takes a single image as input to the Multiple CFAR Threshold-extraction Module (Section 3.2), Local U-shape Feature Extractor (Section 3.3), and Global Vision Transformer Encoder (Section 3.4) to obtain an adaptive threshold.
Section 3.2 introduces the Multiple CFAR Threshold-extraction Module (MCTM). The input image is first divided into the noise region and the object region. We count all pixels in the noise region and obtain corresponding thresholds according to different false alarm rates, and finally obtain a set of threshold vectors T = { T 1 , T 2 , . . . , T n } Z N , where N indicates the number of false alarm rates. Section 3.3 introduces the Local U-shape Feature Extractor (LUFE). We feed the image into the LUFE and obtain the pixel-level feature F R C × H × W , where C, H, and W denote the channel, height, and width of the feature map. Section 3.4 introduces the Global Vision Transformer Encoder (GVTE). We feed the image into GVTE and obtain a set of probability vectors P = { P 1 , P 2 , . . . , P n } , where P i denotes the probability of T i . We define the final adaptive threshold as
T f i n a l = i = 1 n P i × T i

3.2. Multiple CFAR Threshold-Extraction Module

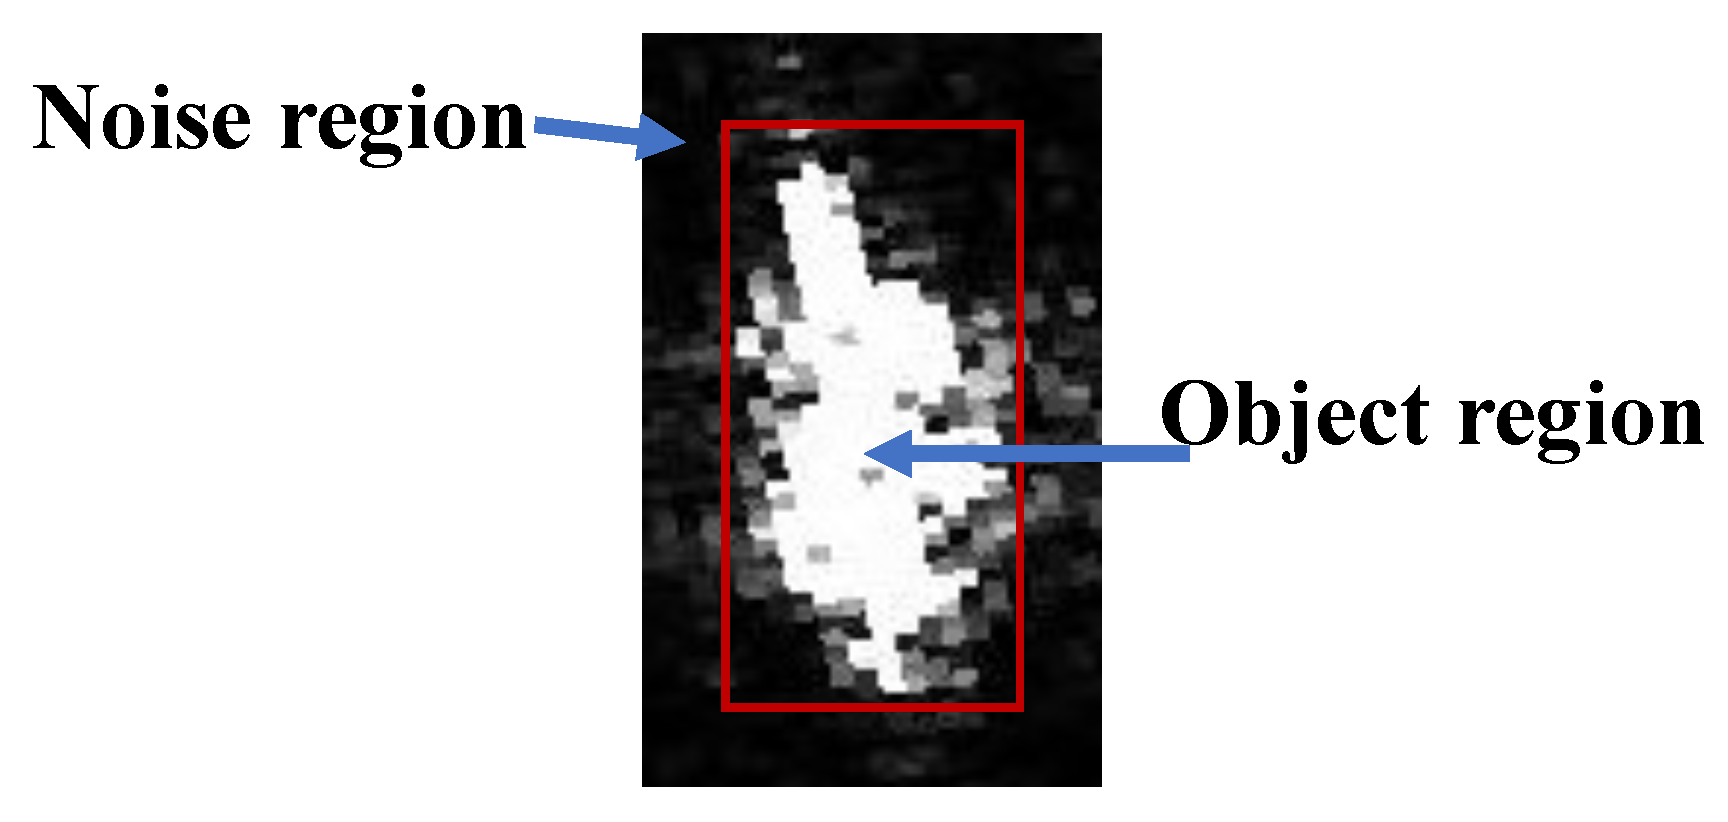
In this module, as shown in Figure 2, we first divide a SAR ship image with size H × W into object region and noise region according to the given two thresholds τ 1 and τ 2 , and the region separation algorithm is shown in Algorithm 1.
Algorithm 1 Get Noise Region.
Input:   I m a g e , τ 1 , τ 2
Output: Noise region
  1: c l u 1 f l a t t e n ( I m a g e [ 0 : τ 1 , : ] )
  2: c l u 2 f l a t t e n ( I m a g e [ H τ 1 : H , : ] )
  3: c l u 3 f l a t t e n ( I m a g e [ τ 1 : H τ 1 , 0 : τ 2 ] )
  4: c l u 4 f l a t t e n ( I m a g e [ τ 1 : H τ 1 , W τ 2 : W ] )
  5: c l u c o n c a t ( c l u 1 ; c l u 2 ; c l u 3 ; c l u 4 )
  6: N o i s e r e g i o n R e m o v e L a r g e V a l u e ( c l u )
  7: return Noise region
The function of R e m o v e L a r g e V a l u e ( ) is to sort all pixels in the noise area from smallest to largest, and then remove the bottom 5% of pixel values, retaining only the top 95%.
We model the noise region and calculate the probability of each pixel value appearing in the noise region. Then, we use a given set of false alarm rate vectors F a = { F a 1 , F a 2 , . . . , F a n } , and for each given false alarm rate F a i , we find the threshold T i that satisfies the condition. We use Algorithm 2 to find the threshold T i that best satisfies the false alarm rate F a i . The vector composed of these threshold values T i is the threshold vector T of the MCTM output. In Algorithm 2, H i s t is the histogram of the noise region, which represents the statistical frequency of pixel intensities, and F a is the false alarm rate vectors.
Algorithm 2 Get Threshold T by F a .
Input:  H i s t , F a
Output: T
  1: n l e n ( F a )
  2: for each i [ 1 , n ]  do
  3:     P 0
  4:     j 255
  5:    while  j 0  do
  6:       if  P F a i  then
  7:           T i j
  8:          break
  9:       end if
10:        P P + H i s t [ j ]
11:        j j 1
12:    end while
13: end for
14:  T { T 1 , T 2 , . . . , T n }
15: return  T

3.3. Local U-Shape Feature Extractor

The proposed Local U-Shape Feature Extractor (LUFE) is designed to map each pixel of SAR image into a high-dimensional feature space. The structure of the LUFE module is shown in Figure 3a. For the input image X 0 R C 0 × H 0 × W 0 , we use the Down module to extract local features, and we can obtain local features X i 1 R C i 1 × H 0 2 i 1 × W 0 2 i 1 , i { 1 , 2 , 3 } . We use maximum pooling for X i 1 to obtain X i R C i × H 0 2 i × W 0 2 i , i { 1 , 2 , 3 } . In order to obtain the feature map with the same resolution as the input SAR image, we design the Up module to up-sample the local features map F i R C i × H 0 2 i × W 0 2 i , i { 1 , 2 , 3 } . X i 1 will be concatenated with the feature map F i after up-sampling operation as the input of Up to generate F i 1 . The output of LUFE is F 0 , which is a feature map with the same resolution as the original SAR image, and it maps every pixel in the SAR image into a high-dimensional feature space. The processing of the LUFE can be expressed as
X i 1 = D o w n ( X i 1 ) , i { 1 , 2 , 3 }
X i = M a x p o o l ( X i 1 ) , i { 1 , 2 , 3 }
F 3 = X 3
F i 1 = U p { C o n c a t [ X i 1 , U p s a m p l e ( F i ) ] } , i { 1 , 2 , 3 }
where Down () and Up () are the Down model and Up model designed by us, respectively. Their structures are shown in Figure 3b,c, respectively. The internal structure of the two models is the same, and both use two convolutional neural networks with kernel sizes of 3 × 3 , two InstanceNorm layers, and two ReLU activation function layers. They also use a skip connection to prevent information loss.

3.4. Global Vision Transformer Encoder

As mentioned in [29,35], the Vision Transformer architecture has a powerful global perception capability, and the multi-head self-attention mechanism enables it to capture richer feature information. Through the combination of different attention heads, Vision Transformer can better understand the relationship between different regions in an image. Based on this, we make a minor modification to the Vision Transformer architecture and propose the GVTE module. This module can deeply understand the relationship between noise regions and ship targets, capture the global features of ship images, and provide corresponding probability weights for the thresholds obtained by the CFAR algorithm at different false alarm rates.
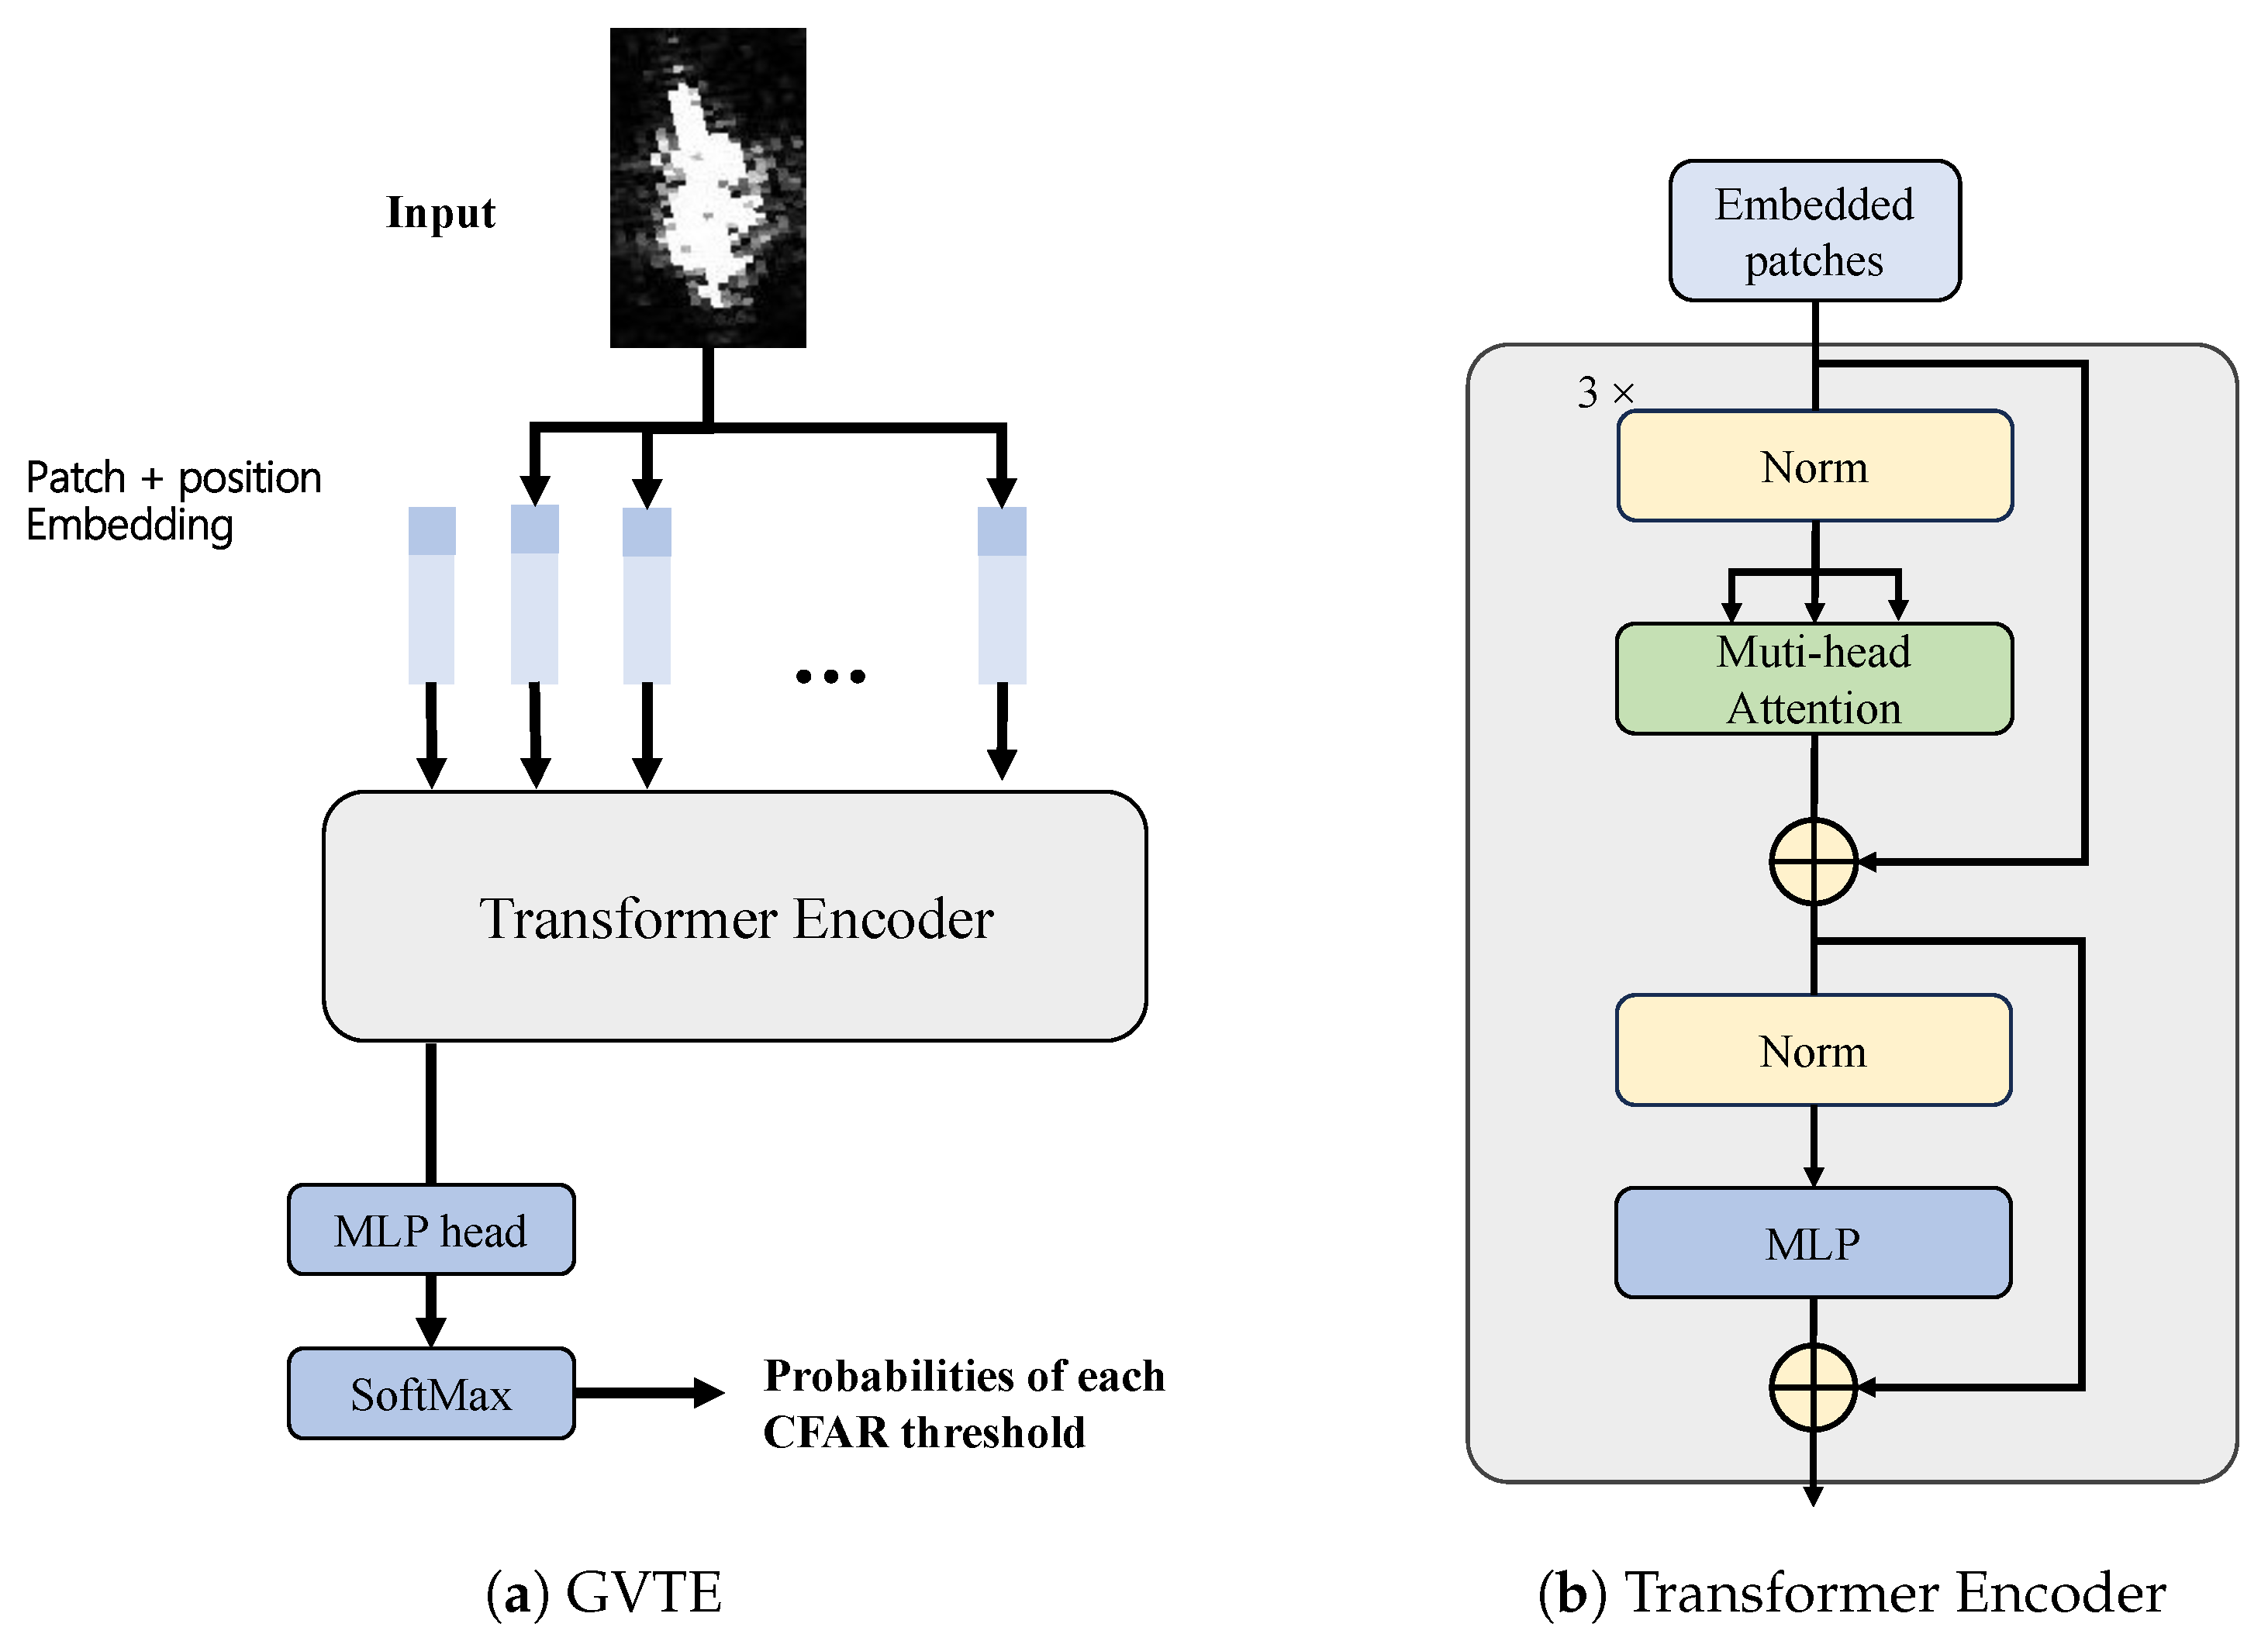
The structure of the GVTE is shown in Figure 4a. Input images X 0 are flattened into 2D patches E e m R N × ( P 2 C 0 ) , where N = ( H 0 W 0 / P 2 ) is the number of patches, ( P , P ) is the resolution of each patch, ( H 0 , W 0 ) is resolution of the input images, and C 0 is the number of channels. We concatenate a learnable embedding named C l s _ t o k e n with E e m . Then, we add the position embedding E p o s to the entire patch embedding sequence to obtain embedded tokens E 0 R ( N + 1 ) × ( P 2 C 0 ) . This process can be expressed as
E 0 = E p o s + C o n c a t ( C l s _ t o k e n , E e m )
Embedded tokens E 0 are fed into the Transformer Encoder to extract the global features E 3 of the input image. The Transformer Encoder structure is shown in Figure 4b. It consists of three blocks, each consisting of alternating layers of multi-head self-attention mechanisms and MLP layers. And LayerNorm (LN) is applied before every layer, and residual connections after every layer.
Therefore, each block’s input E i 1 will be divided into m heads after LayerNorm, and then fed into the multi-head self-attention to obtain interaction tokens E a i . We define these processes as
E a i = M S A [ L N ( E i 1 ) ] + E i 1
In each head, the multi-head self-attention module MSA defines three trainable weight matrices to transform queries Q, keys K, and values V. Then, E a i are fed into the MLP module to obtain E i , and the result of MLP can be expressed as
E i = M L P [ L N ( E a i ) ] + E a i
Then, we input E 3 ( 0 ) into the MLP head module and use the softmax function on the MLP head’s output to obtain the probability vector P = { P 1 , P 2 , . . . , P N } R N , where N is the number of false alarm rates, and P i denotes the probability of each threshold T i . The result of P can be expressed as
P = S o f t M a x [ M L P _ h e a d ( E 3 ( 0 ) ) ]

3.5. Pixel-Level Contrast Loss Function

We hope to achieve the segmentation of SAR ship images under unsupervised conditions. In the process of training, since there is no GT to guide the model training, the CE Loss [36] commonly used in semantic segmentation cannot be used to train the model. So we need to design a new loss function to guide the model training.
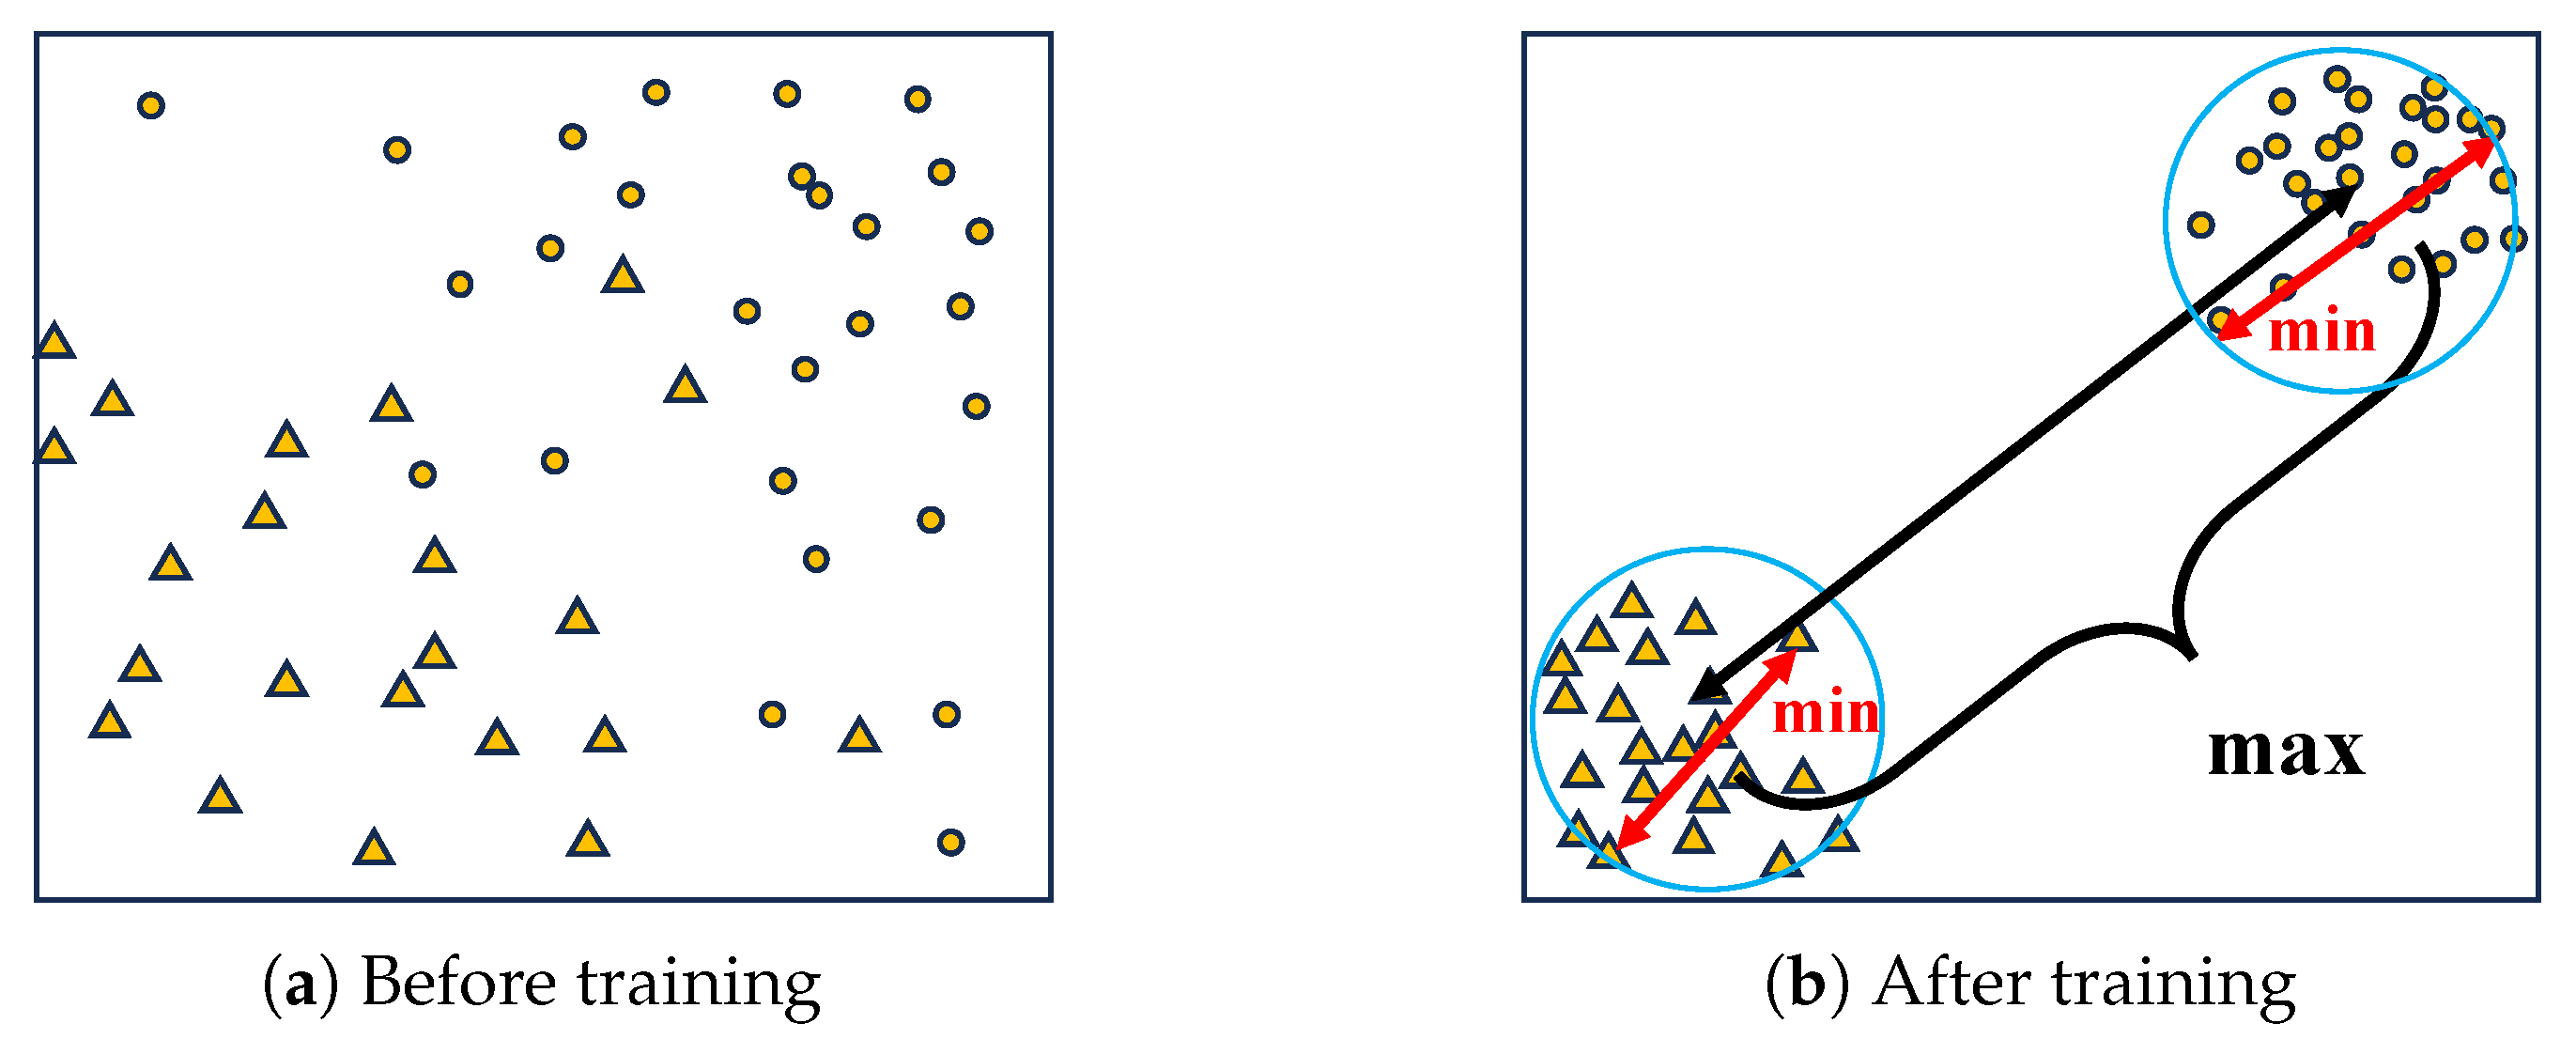
In contrastive learning, InfoNCE loss [37] can not only increase the similarity between positive samples, but also reduce the similarity between negative samples. Inspired by this method, we hope to achieve the results as shown in Figure 5; that is, after the model is trained by the loss function, each pixel of the image is projected into the feature space, the distance between pixels of the same category is as small as possible, and the distance between pixels of different categories is as large as possible. To achieve this goal, we first define a distance function.
D i s t ( j , k ) = 1 2 S i g m o i d ( 2 2 C o s ( F 0 ( j ) , F 0 ( k ) ) )
where F 0 denotes the output of the LUFE module, and j and k denote two pixels in F 0 . This distance function shows that, if two pixels are closer to the same category, then their distance in feature space tends to 0. Otherwise, their distance in feature space tends to 1.
Then, we divide all the pixels of the SAR image into two sets: ship and noise. The two sets are divided as follows:
S S h i p = { j | P i x ( j ) > T }
S N o i s e = { j | P i x ( j ) T }
where P i x ( ) denotes the pixel value of the image, j denotes the index, and T denotes the CFAR threshold.
We set the ship class as a positive sample and the sea surface noise as a negative sample, so we define the following positive sample pair set S P o and negative sample pair set S N e .
S P o = { ( j , k ) | j S S h i p k S S h i p }
S N e = { ( j , k ) | j S N o i s e k S N o i s e }
From the above definition, we compute the sum of the feature distances of pixels belonging to S P o and the sum of the feature distances of pixels belonging to S N e respectively.
D P = ( j , k ) S P o D i s t ( j , k )
D N = ( j , k ) S N e D i s t ( j , k )
In order to realize our assumption that the feature distance of pixels of the same category is as small as possible, and the feature distance of pixels of different categories is as large as possible, we define the loss function as
L o s s = D P + D N j , k a l l p i x e l D i s t ( j , k )
In order to make an adaptive decision, multiple false alarm rates can be selected to define multiple thresholds with CFAR detector, and these thresholds are comprehensively considered to obtain an adaptive result. Let the threshold obtained by the i-th false alarm rate be T i , the corresponding loss result is L o s s i . According to a series of given false alarm rates, we obtain the final loss function P L C - L o s s by summing all L o s s i according to the weights.
P L C - L o s s = i = 1 N P i × L o s s i
where P i denotes the output of the GVTE module, meaning the probability weight of the threshold T i provided by MCTM.

3.6. Label Smoothing Module

The SAR ship image is segmented by the output of MtAD-Net ( T f i n a l ). We find that there is salt noise in the sea surface area and pepper noise in the ship area. Therefore, we design a label smoothing module to denoise.
In the label smoothing module, we first apply a median filter to the output, smoothing the edges and removing the small size of the pepper noise. Then, we use an eight-connected neighborhood clustering module [38] to cluster all pixels, calculate the area of each connected domain, and retain the max area of the connected domain. If any two pixels ( x 0 , y 0 ) and ( x 1 , y 1 ) in result maps M have intersection areas in their eight-connected neighborhoods, i.e.,
N 8 ( x 0 , y 0 ) N 8 ( x 1 , y 1 ) 0
where N 8 ( x 0 , y 0 ) and N 8 ( x 1 , y 1 ) represent the eight-connected neighborhoods of pixel ( x 0 , y 0 ) and ( x 1 , y 1 ) , respectively. Then, ( x 0 , y 0 ) and ( x 1 , y 1 ) are judged as adjacent pixels. If these two pixels have the same value, i.e.,
P i x ( x 0 , y 0 ) = P i x ( x 1 , y 1 ) ( P i x ( x 0 , y 0 ) , P i x ( x 1 , y 1 ) ) M
where P i x ( x 0 , y 0 ) and P i x ( x 1 , y 1 ) represent the value of pixel ( x 0 , y 0 ) and ( x 1 , y 1 ) , respectively, and these two pixels are considered to belong to the same connected domain. Once all the connected domains in the image are determined, the area can be calculated according to the number of their pixels, and then only the area with the largest area is reserved, which can effectively suppress the salt noise on the sea surface.
Finally, according to the area of the SAR ship image, the different size of the kernels is used to perform morphological close operation, which can effectively suppress the large size pepper noise in the ship area. This process can be represented by Algorithm 3.
Algorithm 3 Denoise large size of pepper noise in the ship area
Input:  I m a g e
Output: I
  1: H , W S i z e ( I m a g e )
  2: A r e a H × W
  3: if   A r e a 1000  then
  4:       k e r n e l ( 7 , 7 × W H + 1 )
  5: else if   A r e a 8000
  6:       k e r n e l ( 10 , 10 × W H + 1 )
  7: else
  8:       k e r n e l ( 21 , 21 × W H + 1 )
  9: end if
10: I c l o s e ( I m a g e , k e r n e l )
11: return I

4. Experiment

In this section, we first introduce the dataset we used and our evaluation metrics, and then we cover the implementation details. After that, we compare our MtAD-Net with several unsupervised segmentation methods. Ablation studies are conducted to validate the reasonableness of the parameter choices and the effectiveness of the proposed module. Finally, we investigate the relationship between the final segmentation threshold T f i n a l and the given false alarm rate vector F a , demonstrating the effectiveness of adaptive decision fusion.

4.1. Dataset

(1) SSDD: This dataset is the earliest open source SAR image dataset and has made significant contributions to the development of oriented detectors. It contains 1160 images and 2456 objects (ships). The images in SSDD are acquired by TerraSAR-X, RadarSat-2, and Sentinel-1 sensors [2,3,4]. The image size ranges from 200 to 700, with a resolution of 1 to 15 m.
After the re-labeling by Zhang et al. [8], the SSDD dataset now contains three versions, BBox-SSDD, RBox-SSDD, and PSeg-SSDD, and the number of SSDD targets changed to 2587. We used 2041 ship images out of 928 SSDD images for training and 546 ship images out of 232 SSDD images for testing according to the division of Zhang et al.
(2) HRSID: This dataset [9] is composed of high-resolution SAR images for ship detection, semantic segmentation, and instance segmentation tasks. The image size is 800 × 800 . This dataset includes 5604 high-resolution SAR images with 16951 ship instances. HRSID dataset with resolutions of 0.5, 1, and 3 m. We cropped all the ships and used 65% of all the ship images for training and 35% of all the ship images for testing.
In order to obtain more background information, we changed the BBox coordinates from ( x m i n , y m i n , x m a x , y m a x ) to ( x m i n 15 , y m i n 15 , x m a x + 15 , y m a x + 15 ) when cropping the ships in the SSDD and HRSID images.
Finally, we crop the corresponding position of mask in PSeg-SSDD and HRSID as GT for subsequent evaluation of the performance of our unsupervised segmentation model.

4.2. Evaluation Metrics

The performance of MtAD-Net on the dataset is evaluated using the pixel accuracy (PA), kappa coefficient (kappa), mean intersection over union (mIoU), frequency weighted intersection over union (FWIoU), and the F1-score (F1).
(1) Pixel Accuracy: PA is the simplest metric, used to calculate the ratio between the number of correctly categorized pixels and the total number of pixels. It is computed as
P A = T P + T N T P + T N + F N + F P
where TP denotes the number of pixels for which both the prediction result and the true value are ships. TN denotes the number of pixels for which both the prediction result and the true value are backgrounds. FP denotes the number of pixels that are actually backgrounds but are predicted to be ships. FN denotes the number of pixels that are actually ships but are predicted to be backgrounds.
(2) Kappa coefficient: Kappa is a measure of classification accuracy. Usually, kappa falls between 0 and 1. Kappa can indicate the level of consistency, and when the kappa coefficient is greater than 0.80, the consistency between the predicted results and GT can be considered almost perfect. It can be computed as
p o = T P + T N T P + T N + F P + F N
p e = ( T P + F P ) ( T P + F N ) + ( T N + F P ) ( T N + F N ) ( T P + T N + F P + F N ) ( T P + T N + F P + F N )
K a p p a = p o p e 1 p e
(3) Mean Intersection over Union: This is a standard metric, which calculates the ratio of intersection and union between two sets, which in image segmentation are the two sets of GT and predicted values. The intersection and concatenation ratio within each class is calculated first and then the mean value is calculated. It can be converted to the ratio of TP to the sum of TP, FN, FP.
M I o U = 1 2 ( T P T P + F P + F N + T N T N + F N + F P )
(4) Frequency Weighted Intersection over Union: This is a slight improvement on MIoU, which assigns weight to each class based on its frequency of occurrence. It can be computed as
F W I o U = ( T P ( T P + T N ) T P + F P + F N + T N ( T N + F P ) T N + F N + F P ) T P + T N + F P + F N
(5) F1-Score: The F1-score is a measure of classification issues. Its value is between 0 and 1. It is the harmonic average of precision and recall. It can be computed as
P r e c i s i o n = T P T P + F P
R e c a l l = T P T P + F N
F 1 S c o r e = 2 R e c a l l × P r e c i s i o n R e c a l l + P r e c i s i o n

4.3. Implementation Details

The proposed MtAD-Net is composed of three modules: MCTM, LUFE, and GVTE. For MCTM, we set the false alarm rate F a = { 0.005 , 0.01 , 0.1 , 0.25 , 0.5 } . For LUFE, all input images are resized to 96 × 96 after CentreCrop. ResNet is chosen as our LUFE backbone. The output channels for Down0, Down1, and Down2 are set to 8, 16, and 32. The output channels of Up0, Up1, and Up2 are set the same as the output channels of the Down module. For GVTE, utilizing Vit as the backbone, all images are resized to 96 × 96 ; then, the size of each patch is set to 6 × 6 , the number of heads is set to 12, and the number of layers of the Transformer Encoder is set to 3. We initialize the parameters with SARShipDataset and LS-SSDD’s pre-trained weight [39,40]. Our network was trained using the PLC-Loss and optimized by the Adam method [41] with the CosineAnnealingLR scheduler. We set the learning rate, batch size, and epoch as 1 × 10 5 , 2, and 100, respectively. All models were implemented in PyTorch [42] on a computer with an Intel(R) Xeon(R) Gold 6342 CPU @ 2.80 GHz and an NVIDIA A800 80 GB PCIe GPU.

4.4. Comparison with Representative Methods

To demonstrate the superiority of our method, we compare the MtAD-Net with several representative methods, including two traditional methods (OTSU [10] and CFAR [13]), two deep learning methods for optical images (Kim-Net [21] and PiCIE [23]), and two deep learning methods for SAR images (IDUDL [32] and CDA-SAR [34]). For a fair comparison, we retrained all the deep learning methods on two datasets of SSDD and HRSID, respectively.
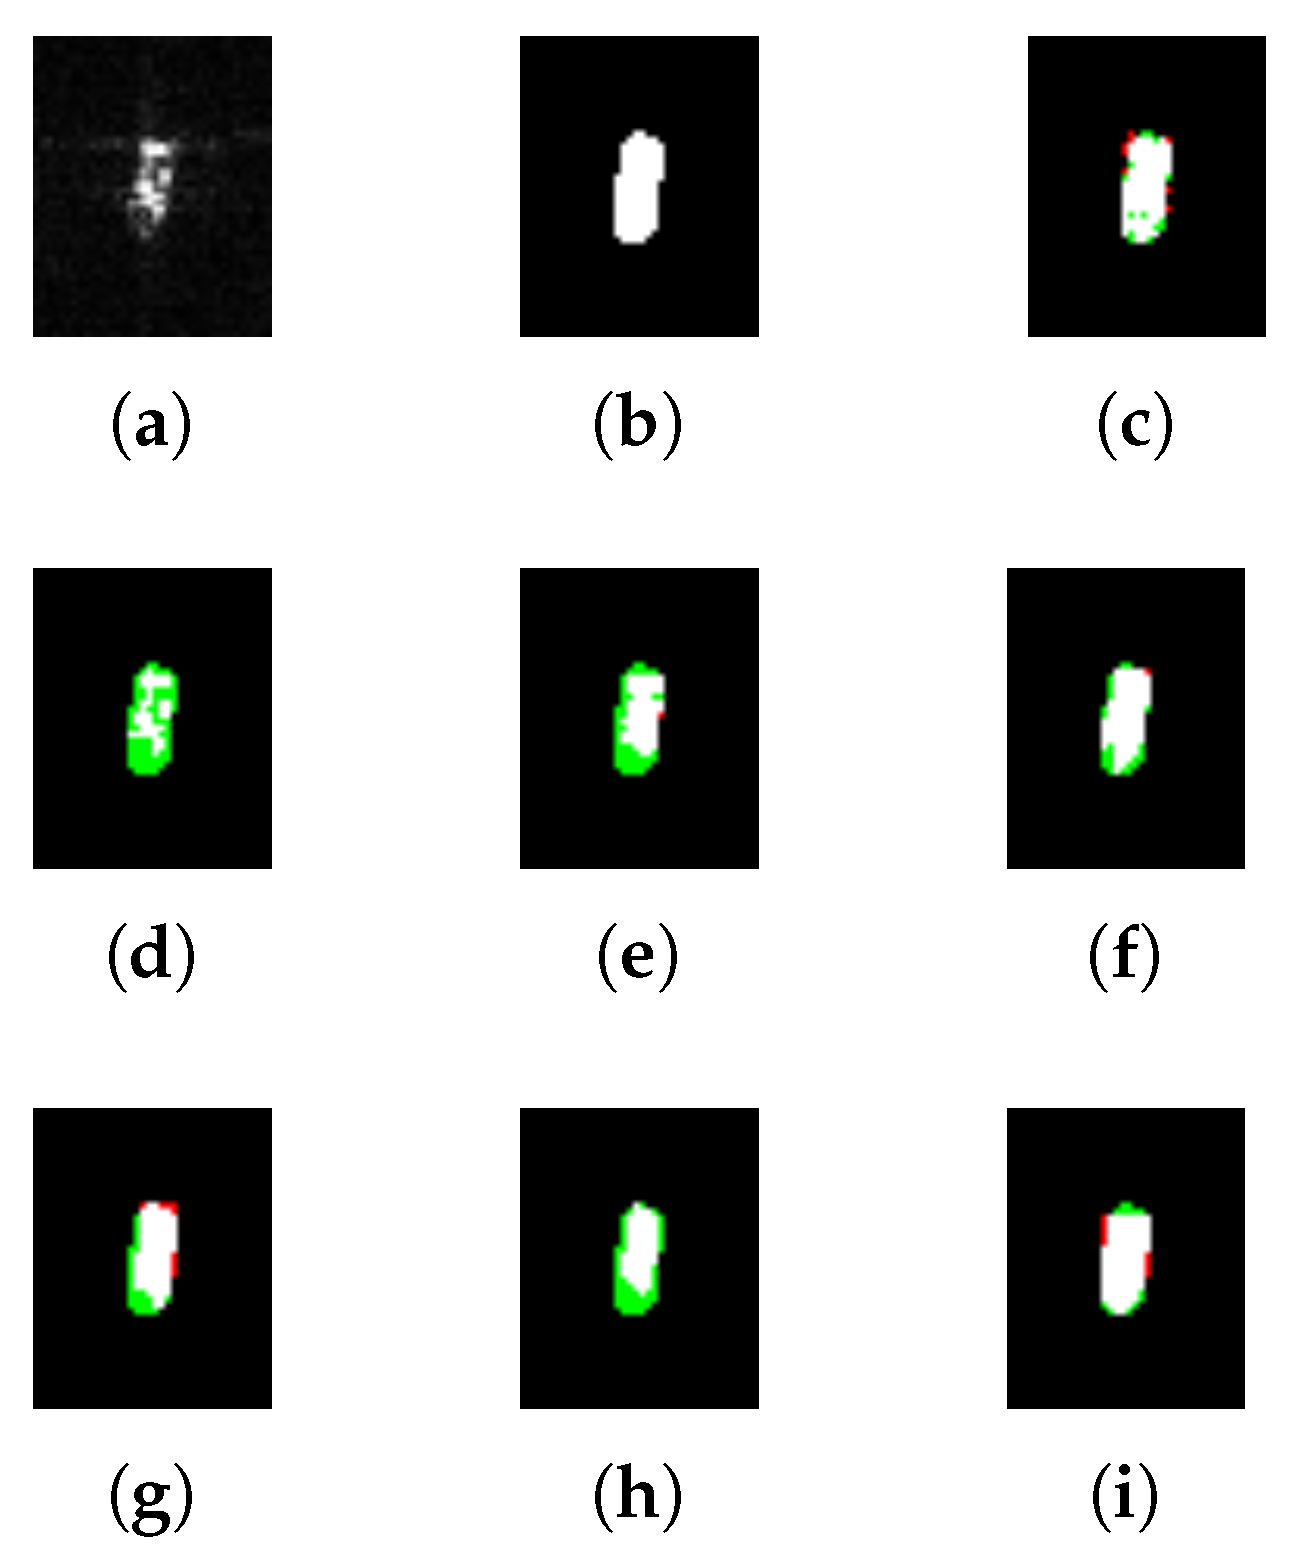
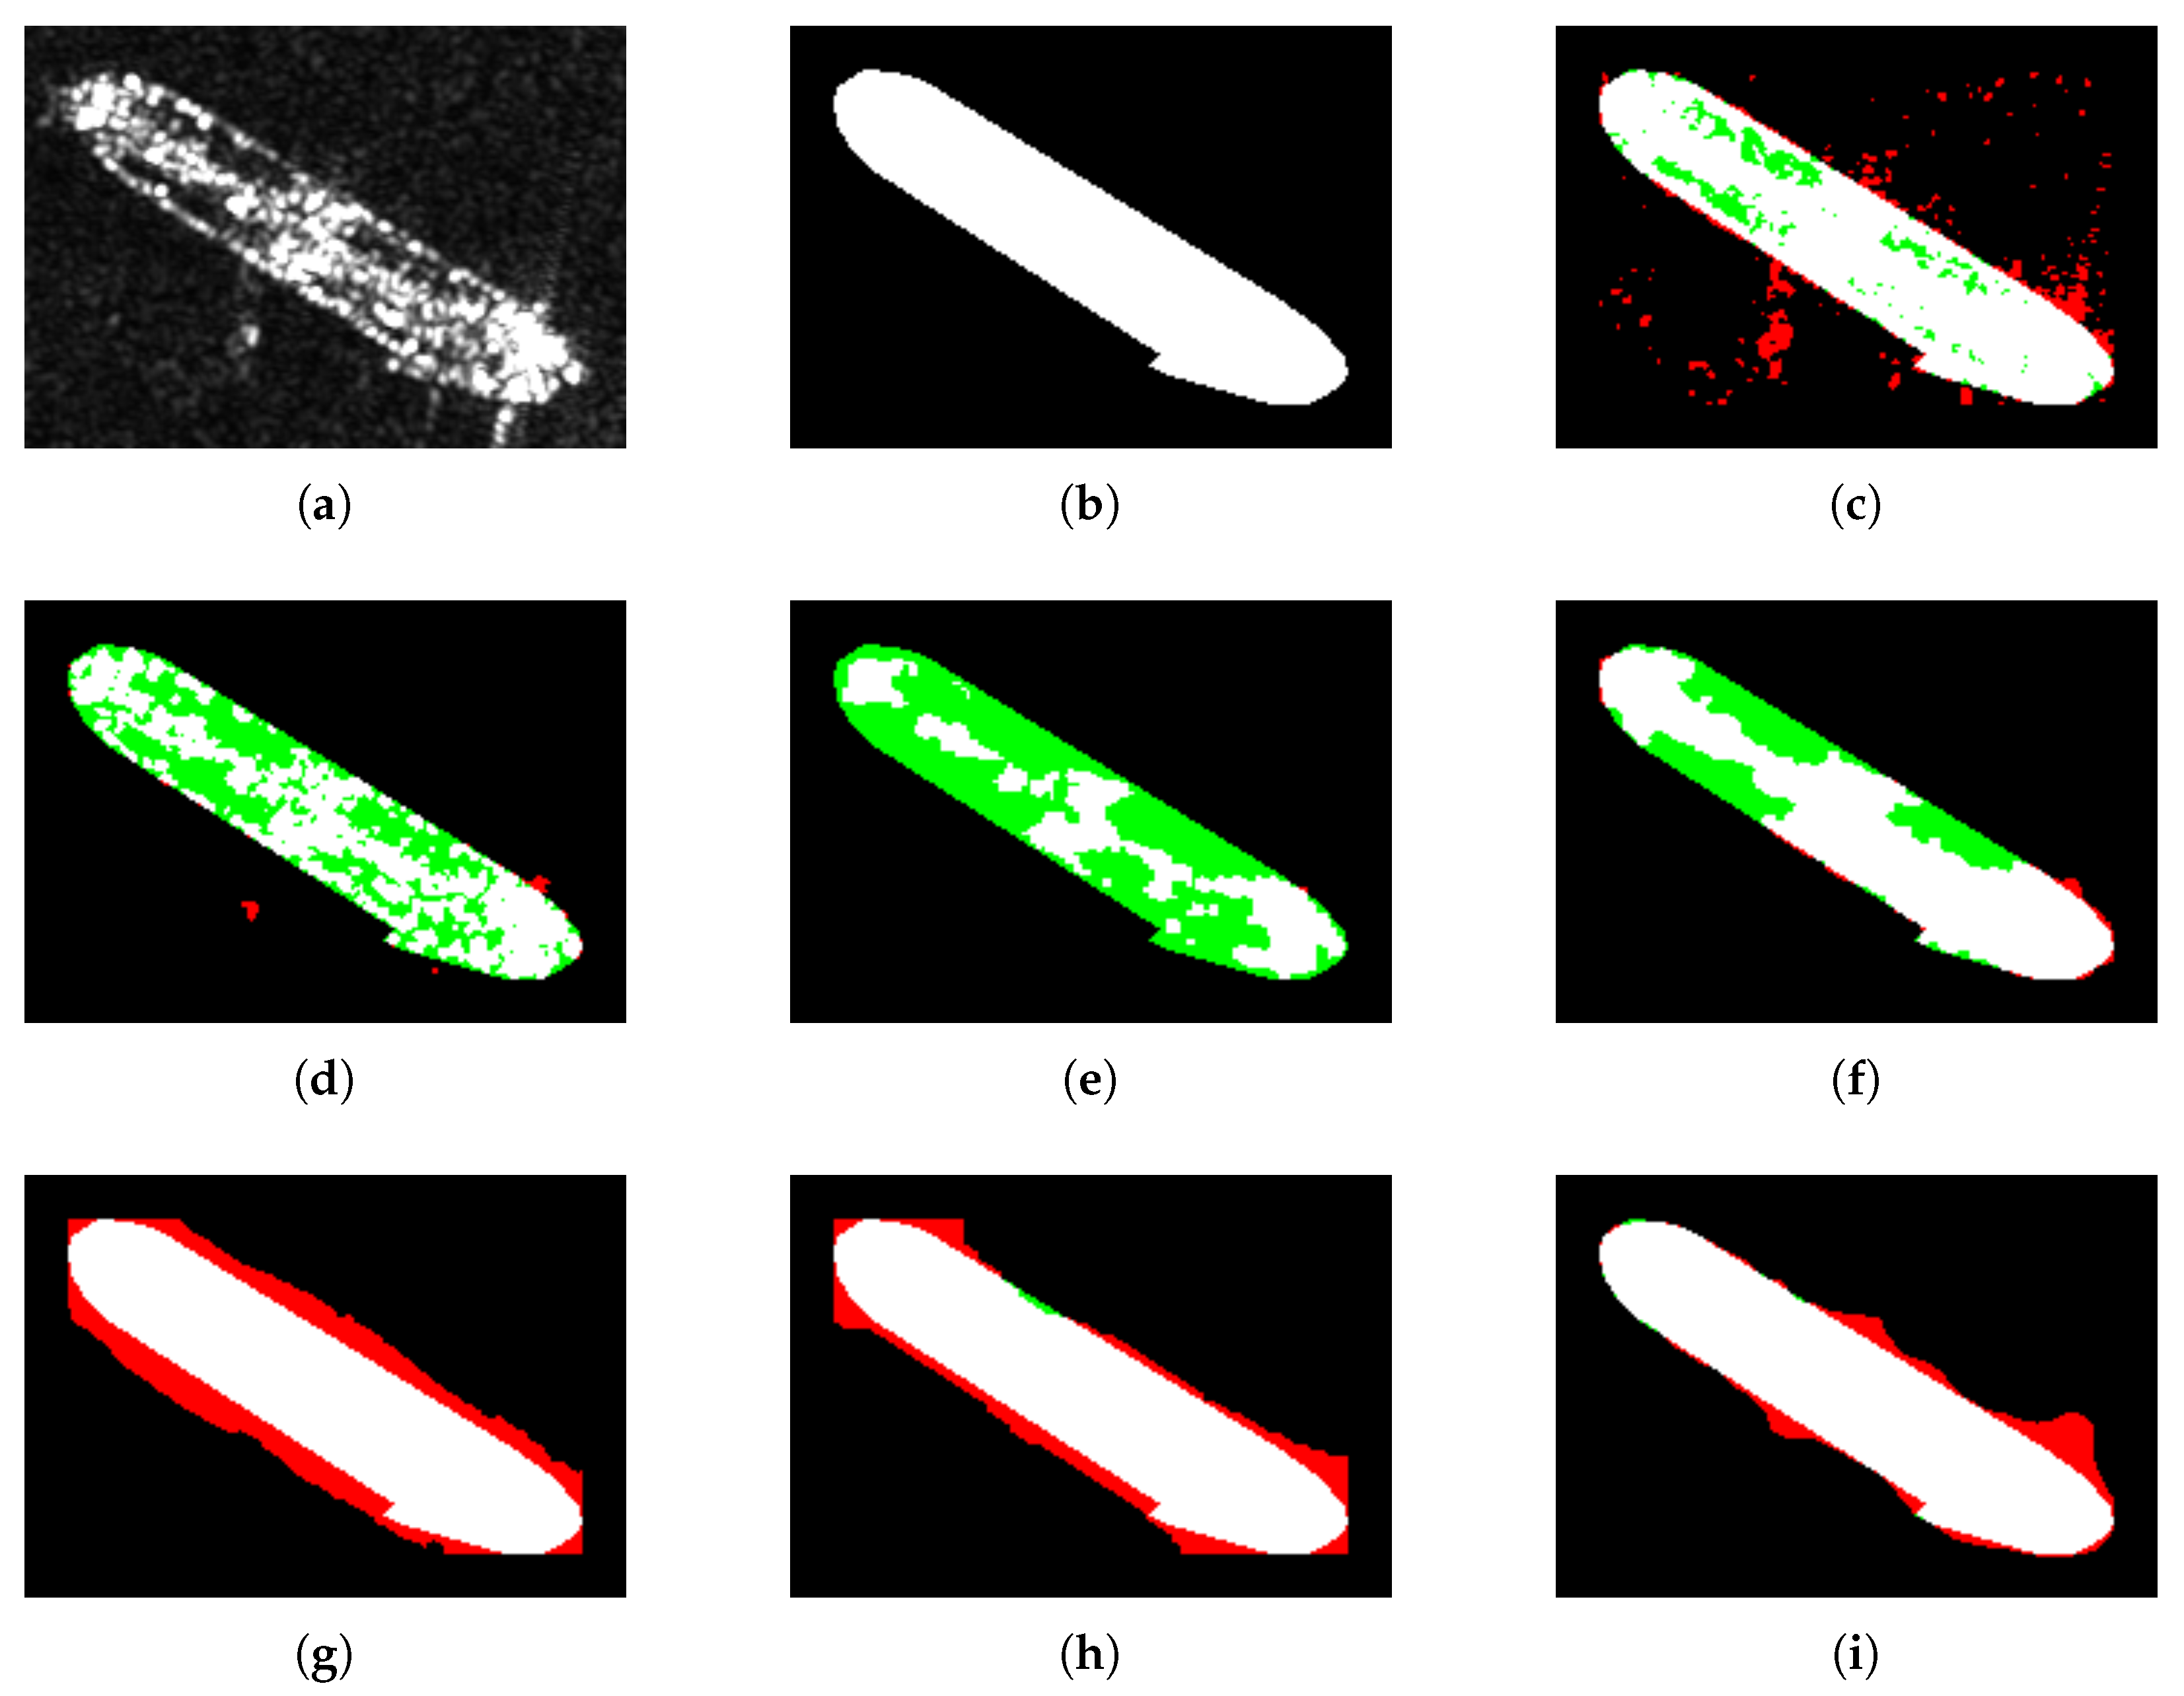
(1) Qualitative Results: Qualitative results on our datasets are shown in Figure 6, Figure 7, Figure 8 and Figure 9, where Figure 6 (ship region with 175 pixels) and Figure 7 (ship region with 116 pixels) show the qualitative results of small-size ship segmentation on the SSDD dataset and the HRSID dataset by different unsupervised segmentation methods, respectively. It can be seen that, compared with other methods, our method has better ability to locate the ship target boundary.
Figure 8 (ship region with 2661 pixels) and Figure 9 (ship region with 6994 pixels) show the qualitative results of large-size ship segmentation on the SSDD dataset and the HRSID dataset by different unsupervised segmentation methods, respectively.
It can be seen that the segmentation difficulty of large-size ships is higher than that of small-size ships. This is because there are usually pixels inside large ships that have a very low contrast with the sea surface background. Therefore, for the CFAR method, to reduce the number of false negative pixels inside the ship, it is necessary to increase the false alarm rate, resulting in a significant number of false positive pixels around the ship. The OTSU method relies on pixel values to complete image segmentation, so this method can only segment high-brightness pixels in the ship area.
Both Kim-Net and PiCIE are deep learning methods for optical images, so the two methods pay more attention to the intensity information of the ship region, and can segment high-brightness pixels in the ship well, but it will produce false negative pixels when the contrast between the ship region and the background region is low.
Both CDA-SAR and IDUDL are deep learning methods for SAR images, so the segmentation results produced by these two methods are better than the above methods. However, CDA-SAR requires cross-domain conversion, which may cause the loss of SAR-specific features, leading to discontinuous segmentation results or inaccurate edge positioning, and increasing false positives and false negatives. Similarly, IDUDL generates pseudo-labels using a super-pixel merging mechanism, which also contributes to inaccurate edge positioning in the segmentation results, resulting in false positives and false negatives.
Our method can partition the ship into a continuous region and produce only a few false positive and false negative regions when facing such a large ship target with low contrast.
(2) Quantitative Results: Table 1 and Table 2 show the quantitative analysis results of different methods on the SSDD and the HRSID datasets, respectively. It is worth noting that the improvements achieved by our MtAD-Net over other methods are obvious. On the SSDD dataset, the proposed MtAD-Net achieves 0.963 on PA, 0.846 on kappa, 0.865 on MIoU, 0.932 on FWIoU, and 0.868 on F1-Score, and the proposed MtAD-Net outperforms other methods more than 1.1 % on PA, 5.8 % on kappa, 4.5 % on MIoU, 2.2 % on FWIoU, and 4.8 % on F1-Score. On the HRSID dataset, the proposed MtAD-Net achieves 0.963 on PA, 0.830 on kappa, 0.853 on MIoU, 0.935 on FWIoU, and 0.851 on F1-Score, and the proposed MtAD-Net outperforms other methods by more than 0.4 % on PA, 6.5 % on kappa, 4.4 % on MIoU, 1.0 % on FWIoU, and 5.4 % on F1-Score. This is because our MtAD-Net has the ability to make adaptive decisions compared to other methods. Compared with other methods, MtAD-Net can locate the boundary of ships in SAR images more accurately. Moreover, MtAD-Net can find the most suitable threshold in low-resolution and low-contrast SAR images to segment the ship in the image into complete regions.
To further validate the effectiveness of the proposed MtAD-Net, we conducted statistical significance analysis using the paired t-test [43] and McNemar test [44]. The significance level was set to α = 0.05 . These analyses were performed on the SSDD and HRSID datasets to assess the statistical reliability and robustness of our method in comparison with other methods. The experimental results indicate that the proposed MtAD-Net shows statistically significant differences compared to other methods. Specifically, the p-values for comparisons between MtAD-Net and other methods are all less than 0.05, indicating that the performance differences are statistically significant and unlikely to have occurred by random chance.
In conclusion, the experimental results of the quantitative analyses show that the proposed method achieves significantly better segmentation performance than the existing methods on both the SSDD and the HRSID datasets. Statistical analyses using the paired t-test and McNemar test further validate that the performance improvements are statistically significant.

4.5. Ablation Study

4.5.1. Ablation Study on Removing the Percentage of Pixel Values in RemoveLargeValue()

Ship targets are surrounded by not only sea clutter noise but also strong scatter points caused by sidelobe leakage. These strong scatter points arise from the scattering effect caused by the ship targets themselves, and they can interfere with the CFAR method. To remove these scatter points, we utilized the RemoveLargeValue() function. This function sorts all pixels in the noise region in ascending order and removes the last x% of pixel values. To determine the optimal percentage for removing pixel values, we tested the removal of 1%, 2%, 5%, 10%, and 20% of the pixel values, comparing the results with those of no removal. The experimental results are shown in Table 3 and Table 4.
The best performance was observed when 5% of the pixel values were removed. This percentage achieved the highest values in all evaluation metrics for both SSDD and HRSID datasets. Specifically, for SSDD, PA reached 0.963, kappa was 0.846, MIoU was 0.865, FWIoU was 0.932, and F1-Score was 0.868. Similarly, for HRSID, PA was 0.963, kappa was 0.830, MIoU was 0.853, FWIoU was 0.935, and F1-Score was 0.851. Experimental results show that removing the last 5% pixel values can significantly improve the segmentation accuracy and reduce the influence of the strong sidelobe leakage phenomenon. Removing 1% and 2% of the pixel values resulted in small improvements in performance, but these increases were not as significant as with the 5% removal. This indicates that a small percentage cannot completely remove the strong scatterers caused by strong sidelobe leakage. When the removal percentage increased to 10% and 20%, the performance began to decrease. This indicates that removing too many pixel values leads to the loss of information belonging to sea clutter, which is not conducive to the CFAR method to extract the threshold, thus adversely affecting the segmentation process. Therefore, we selected 5% as the optimal percentage for removing pixel values in the RemoveLargeValue() function.

4.5.2. Ablation Study on the Impact of Different Fa Vectors

We performed an ablation study to explore the effect of different combinations and lengths of false alarm rate vectors on the segmentation performance. The experiment is divided into two parts: (1) The effect of Fa vectors with different lengths on the results. (2) The influence of different combinations of Fa vectors on the results. The experimental results are shown in Table 5 and Table 6.
(1) Impact of Different Fa Lengths: When the false alarm rate vector length was reduced to 3, the performance dropped significantly. This decrease in performance is likely due to the insufficient coverage of Fa values, which are too few to effectively capture the necessary noise conditions, leading to lower accuracy. When the length of false alarm rate vector was increased to 8, the performance increases slightly on the SSDD dataset, but the results on the HRSID dataset do not improve or even decrease slightly. This suggests that adding more elements to Fa may introduce redundant information. The Fa vector of length 5 performed the best, providing optimal segmentation results for both datasets. The choice of five values strikes a balance between coverage and efficiency, avoiding the redundancy of longer vectors and the insufficient coverage of shorter ones.
(2) Impact of Different Fa Combinations: We tested different combinations of false alarm rate vectors of length 5 to determine which combination produced the best performance. Test combinations included F a = { 0.005 , 0.01 , 0.1 , 0.25 , 0.5 } and several other configurations with different values.
The results show that the combination F a = { 0.005 , 0.01 , 0.1 , 0.25 , 0.5 } performs the best in both SSDD and HRSID datasets, achieving the highest performance in terms of PA, kappa, MIoU, FWIoU, and F1-Score.

4.5.3. Effectiveness of Different Components

In this section, we compare our MtAD-Net with several variants to investigate the potential benefits introduced by our MCTM, LUFE, GVTE, PLC-Loss, and the label smoothing module. The results are shown in Table 7 and Table 8.
(1) Multiple CFAR Threshold-extraction Module: The MCTM is used to obtain a set of threshold vectors using different constant false alarm rates. To demonstrate the effectiveness of our MCTM, we introduced the following network variant.
  • MtAD-Net without MCTM: We remove the MCTM from the proposed MtAD-Net and replace the threshold vector provided by the MCTM with a constant set of thresholds { 10 , 50 , 100 , 150 , 200 } . For a fair comparison, we retrained this variant on our datasets.
As shown in Table 7 and Table 8, compared to MtAD-Net, MtAD-Net without MCTM decreased in PA by 1.3 % and 0.3 % , kappa by 6.7 % and 5.7 % , MIoU by 4.1 % and 3.1 % , FWIoU by 2.3 % and 0.8 % , and F1-Score by 6.6 % and 5.9 % on the SSDD and HRSID datasets, respectively.This is because, without MCTM, MtAD-Net without MCTM cannot utilize the CFAR method to extract a unique set of threshold vectors for each SAR ship image. Instead, it can only use a fixed set of threshold vectors, leading to a decline in performance.
(2) Local U-shape Feature Extractor: The LUFE is used to map each pixel of SAR image into a high-dimensional feature space. To demonstrate the effectiveness of our LUFE, we introduced the following network variant.
  • MtAD-Net without LUFE: We use SegNet [45] with the same number of layers to replace the LUFE module in the proposed MtAD-Net. For fair comparison, we retrained this variant on our datasets.
As shown in Table 7 and Table 8, compared to MtAD-Net, MtAD-Net without LUFE decreased in PA by 0.6 % and 0.1 % , kappa by 2.3 % and 2.5 % , MIoU by 1.5 % and 1.4 % , FWIoU by 1.0 % and 0.3 % , and F1-Score by 2.2 % and 2.5 % on the SSDD and HRSID datasets, respectively. This is due to the insufficient ability of the SegNet module to preserve local details during feature extraction and reconstruction, and the lack of multi-scale fusion and residual linkage design in the LUFE module, which leads to a decrease in the model’s ability to localize the target boundaries, thus reducing the overall segmentation accuracy.
(3) Global Vision Transformer Encoder: The GVTE is used to obtain global feature, and then, we use the global feature to obtain a probability vector, which is the probability of each CFAR threshold.
  • MtAD-Net without GVTE: We use ResNet to replace the GVTE module in the proposed MtAD-Net. For fair comparison, we retrained this variant on our datasets.
As shown in Table 7 and Table 8, compared to MtAD-Net, MtAD-Net without GVTE decreased in PA by 0.6 % and 0.3 % , kappa by 3.6 % and 2.4 % , MIoU by 2.3 % and 1.6 % , FWIoU by 1.1 % and 0.6 % , and F1-Score by 3.7 % and 2.2 % on the SSDD and HRSID datasets, respectively. This is because the GVTE module can better understand the relationship between noise regions and target regions in ship images based on the multi-head self-attention mechanism, and can more accurately capture global features in images. In contrast, ResNet mainly relies on local receptive fields to gradually extract global information, which leads to the loss of feature information as the number of layers increases, thus leading to performance degradation.
(4) PLC-Loss: The PLC-Loss helps MtAD-Net adaptively reduce the feature distance of pixels of the same category and increase the feature distance of pixels of different categories. To demonstrate the effectiveness of our loss function, we introduced the following network variant.
  • MtAD-Net without PLC-Loss: we retrained the MtAD-Net using the InfoNCE loss for a fair comparison.
As shown in Table 7 and Table 8, compared to MtAD-Net, MtAD-Net without PLC-Loss decreased in PA by 0.5 % and 1.2 % , kappa by 6.2 % and 6.2 % , MIoU by 3.9 % and 4.2 % , FWIoU by 0.9 % and 2.0 % , and F1-Score by 6.0 % and 5.7 % on the SSDD and HRSID datasets, respectively.
This is because, compared with InfoNCE Loss, the PLC-Loss has more significant advantages in unsupervised SAR ship instance segmentation tasks. First, the loss function is based on the cosine similarity at the pixel level, and the geometric distance between features is explicitly modeled by the non-linear transformation 2 2 c o s ( ) , which enhances the sensitivity to distance changes between similar and dissimilar pixels. Secondly, Sigmoid mapping is introduced to further smooth distance compression, which alleviates the instability of extreme samples for gradient optimization. Different from InfoNCE Loss which focuses on global representation optimization, PLC-Loss not only focuses on global features, but also focuses on local feature relationships. In addition, compared with the problem of gradient dilution of InfoNCE when the number of negative samples is long, the gradient distribution of the PLC-Loss is more balanced and the optimization process is more stable. Therefore, the proposed PLC-Loss can replace InfoNCE loss for target segmentation in SAR images.
(5) Label Smoothing Module: Our label smoothing module can denoise the pepper noise in the ship area and the salt noise in the background area after using T f i n a l to segment SAR images. To demonstrate the effectiveness of our label smoothing method, we introduced the following network variant.
  • MtAD-Net without Label Smoothing: we removed the label smoothing module from our MtAD-Net, and retrained this variant on our dataset.
As shown in Table 7 and Table 8, compared to MtAD-Net, MtAD-Net without Label Smoothing decreased in PA by 0.9 % and 1.1 % , kappa by 4.0 % and 4.7 % , MIoU by 3.2 % and 3.7 % , FWIoU by 1.6 % and 1.8 % , and F1-Score by 3.3 % and 4.0 % on the SSDD and HRSID datasets, respectively. This is because, without the label smoothing module, the MtAD-Net will lose the ability to denoise the salt and pepper noise, so the performance is poor.

4.6. Analysis of T f i n a l in MtAD-Net

For a clear understanding of how T f i n a l is obtained, we provide the false alarm rate vectors F a used in Figure 6i, Figure 7i, Figure 8i, and Figure 9i, the threshold T i obtained by CFAR based on each false alarm rate F a i , the probability P i corresponding to each threshold T i , and the final segmentation threshold T f i n a l . The results are shown in Table 9, Table 10, Table 11 and Table 12.
For the same set of false alarm rate vectors F a = 0.005 , 0.01 , 0.1 , 0.25 , 0.5 , different SAR ship images can obtain different CFAR threshold vectors T. According to different SAR ship images, the GVTE module can provide a set of probability vectors P, with the length equal to the threshold vectors T, where P i denotes the probability corresponding to T i .
T f i n a l is the probability of the decision fusion of vector T, which is calculated as T f i n a l = i = 1 5 T i × P i . It can be found that T f i n a l is not equal to the value in the T vector. This phenomenon shows that our MtAD-Net has excellent decision fusion capability. It is able to generate a more appropriate segmentation threshold T f i n a l by considering the threshold vector T and its corresponding probability weight vector P. This process is not simply selecting a single value from the threshold vector T as the segmentation threshold, but through an intelligent decision fusion mechanism to achieve better segmentation results.

5. Conclusions

In order to convert BBox-level annotations to pixel-level GT, we propose a novel pipeline for unsupervised SAR ship image instance segmentation, which contains the MtAD-Net, the PLC-Loss, and the label smoothing module. Specifically, a Multiple CFAR Threshold-extraction Module, Local U-shape Feature Extractor, and Global Vision Transformer Encoder are designed to complete the multi-threshold adaptive decision in the proposed MtAD-Net. The PLC-Loss is proposed to help MtAD-Net adaptively reduce the feature distance of pixels of the same category and increase the feature distance of pixels of different categories, and the label smoothing module is proposed to denoise the salt-and-pepper noise from the results. Experimental results on the datasets show that the proposed MtAD-Net model outperforms traditional methods and existing deep learning-based methods in a set of evaluation metrics.

Author Contributions

Conceptualization, J.X. and J.Y. (Junjun Yin); Data curation, J.Y. (Junjun Yin); Formal analysis, J.X.; Funding acquisition, J.Y. (Junjun Yin); Investigation, J.X.; Methodology, J.X.; Project administration, J.Y. (Jian Yang); Resources, J.Y. (Junjun Yin); Supervision, J.Y. (Junjun Yin); Validation, J.X., J.Y. (Junjun Yin), and J.Y. (Jian Yang); Visualization, J.X.; Writing—original draft, J.X.; Writing—review and editing, J.X. and J.Y. (Junjun Yin). All authors have read and agreed to the published version of the manuscript.

Funding

This research was funded by NSFC under Grant no. 62222102, NSFC no. 62171023, and the Fundamental Research Funds for the Central Universities under Grant no. FRF-TP-22-005C1.

Data Availability Statement

The storage URL for the SSDD dataset used for ship detection or segmentation experiments is https://github.com/TianwenZhang0825/Official-SSDD (accessed on 11 November 2024). The storage URL for the HRSID dataset used for ship detection or segmentation experiments is https://github.com/chaozhong2010/HRSID (accessed on 11 November 2024).

Conflicts of Interest

The authors declare no conflicts of interest.

References

  1. Zhao, M.; Zhang, X.; Kaup, A. Multitask learning for SAR ship detection with Gaussian-mask joint segmentation. IEEE Trans. Geosci. Remote Sens. 2023, 61, 5214516. [Google Scholar] [CrossRef]
  2. Cheng, P.; Toutin, T. RADARSAT-2 data. GeoInformatics 2010, 13, 22. [Google Scholar]
  3. Pitz, W.; Miller, D. The terrasar-x satellite. IEEE Trans. Geosci. Remote Sens. 2010, 48, 615–622. [Google Scholar] [CrossRef]
  4. Torres, R.; Navas-Traver, I.; Bibby, D.; Lokas, S.; Snoeij, P.; Rommen, B.; Osborne, S.; Ceba-Vega, F.; Potin, P.; Geudtner, D. Sentinel-1 SAR system and mission. In Proceedings of the 2017 IEEE Radar Conference (RadarConf), Seattle, WA, USA, 8–12 May 2017; pp. 1582–1585. [Google Scholar]
  5. Zhao, L.; Zhang, Q.; Li, Y.; Qi, Y.; Yuan, X.; Liu, J.; Li, H. China’s Gaofen-3 satellite system and its application and prospect. IEEE J. Sel. Top. Appl. Earth Obs. Remote Sens. 2021, 14, 11019–11028. [Google Scholar] [CrossRef]
  6. Ao, W.; Xu, F.; Li, Y.; Wang, H. Detection and discrimination of ship targets in complex background from spaceborne ALOS-2 SAR images. IEEE J. Sel. Top. Appl. Earth Obs. Remote Sens. 2018, 11, 536–550. [Google Scholar] [CrossRef]
  7. Li, J.; Chen, J.; Cheng, P.; Yu, Z.; Yu, L.; Chi, C. A survey on deep-learning-based real-time SAR ship detection. IEEE J. Sel. Top. Appl. Earth Obs. Remote Sens. 2023, 16, 3218–3247. [Google Scholar] [CrossRef]
  8. Zhang, T.; Zhang, X.; Li, J.; Xu, X.; Wang, B.; Zhan, X.; Xu, Y.; Ke, X.; Zeng, T.; Su, H.; et al. SAR ship detection dataset (SSDD): Official release and comprehensive data analysis. Remote Sens. 2021, 13, 3690. [Google Scholar] [CrossRef]
  9. Wei, S.; Zeng, X.; Qu, Q.; Wang, M.; Su, H.; Shi, J. HRSID: A high-resolution SAR images dataset for ship detection and instance segmentation. IEEE Access 2020, 8, 120234–120254. [Google Scholar] [CrossRef]
  10. Yousefi, J. Image Binarization Using Otsu Thresholding Algorithm; University of Guelph: Guelph, ON, Canada, 2011; Volume 10. [Google Scholar]
  11. Roy, P.; Dutta, S.; Dey, N.; Dey, G.; Chakraborty, S.; Ray, R. Adaptive thresholding: A comparative study. In Proceedings of the 2014 International Conference on Control, Instrumentation, Communication and Computational Technologies (ICCICCT), Kanyakumari, India, 10–11 July 2014; pp. 1182–1186. [Google Scholar]
  12. Raju, P.D.R.; Neelima, G. Image segmentation by using histogram thresholding. Int. J. Comput. Sci. Eng. Technol. 2012, 2, 776–779. [Google Scholar]
  13. Rohling, H. Radar CFAR thresholding in clutter and multiple target situations. IEEE Trans. Aerosp. Electron. Syst. 1983, AES-19, 608–621. [Google Scholar] [CrossRef]
  14. Pohle, R.; Toennies, K.D. Segmentation of medical images using adaptive region growing. In Proceedings of the Medical Imaging 2001: Image Processing, SPIE, San Diego, CA, USA, 17–22 February 2001; Volume 4322, pp. 1337–1346. [Google Scholar]
  15. Ning, J.; Zhang, L.; Zhang, D.; Wu, C. Interactive image segmentation by maximal similarity based region merging. Pattern Recognit. 2010, 43, 445–456. [Google Scholar] [CrossRef]
  16. Bieniek, A.; Moga, A. An efficient watershed algorithm based on connected components. Pattern Recognit. 2000, 33, 907–916. [Google Scholar] [CrossRef]
  17. Wang, C. Research of image segmentation algorithm based on wavelet transform. In Proceedings of the 2015 IEEE International Conference on Computer and Communications (ICCC), Chengdu, China, 10–11 October 2015; pp. 156–160. [Google Scholar]
  18. Coleman, G.B.; Andrews, H.C. Image segmentation by clustering. Proc. IEEE 1979, 67, 773–785. [Google Scholar] [CrossRef]
  19. Xia, X.; Kulis, B. W-net: A deep model for fully unsupervised image segmentation. arXiv 2017, arXiv:1711.08506. [Google Scholar]
  20. Ji, X.; Henriques, J.F.; Vedaldi, A. Invariant information clustering for unsupervised image classification and segmentation. In Proceedings of the IEEE/CVF International Conference on Computer Vision, Seoul, Republic of Korea, 27 October–2 November 2019; pp. 9865–9874. [Google Scholar]
  21. Kim, W.; Kanezaki, A.; Tanaka, M. Unsupervised learning of image segmentation based on differentiable feature clustering. IEEE Trans. Image Process. 2020, 29, 8055–8068. [Google Scholar] [CrossRef]
  22. Zhou, L.; Wei, W. DIC: Deep image clustering for unsupervised image segmentation. IEEE Access 2020, 8, 34481–34491. [Google Scholar] [CrossRef]
  23. Cho, J.H.; Mall, U.; Bala, K.; Hariharan, B. Picie: Unsupervised semantic segmentation using invariance and equivariance in clustering. In Proceedings of the IEEE/CVF Conference on Computer Vision and Pattern Recognition, Nashville, TN, USA, 20–25 June 2021; pp. 16794–16804. [Google Scholar]
  24. Abdal, R.; Zhu, P.; Mitra, N.J.; Wonka, P. Labels4free: Unsupervised segmentation using stylegan. In Proceedings of the IEEE/CVF International Conference on Computer Vision, Montreal, QC, Canada, 10–17 October 2021; pp. 13970–13979. [Google Scholar]
  25. Wang, B.; Wang, S.; Yuan, C.; Wu, Z.; Li, B.; Hu, W.; Xiong, J. Learnable Pixel Clustering Via Structure and Semantic Dual Constraints for Unsupervised Image Segmentation. In Proceedings of the 2022 IEEE International Conference on Image Processing (ICIP), Bordeaux, France, 16–19 October 2022; pp. 1041–1045. [Google Scholar]
  26. Achanta, R.; Shaji, A.; Smith, K.; Lucchi, A.; Fua, P.; Süsstrunk, S. SLIC superpixels compared to state-of-the-art superpixel methods. IEEE Trans. Pattern Anal. Mach. Intell. 2012, 34, 2274–2282. [Google Scholar] [CrossRef] [PubMed]
  27. Goodfellow, I.; Pouget-Abadie, J.; Mirza, M.; Xu, B.; Warde-Farley, D.; Ozair, S.; Courville, A.; Bengio, Y. Generative adversarial nets. Adv. Neural Inf. Process. Syst. 2014, 27. [Google Scholar] [CrossRef]
  28. Ronneberger, O.; Fischer, P.; Brox, T. U-net: Convolutional networks for biomedical image segmentation. In Proceedings of the Medical Image Computing and Computer-Assisted Intervention–MICCAI 2015: 18th International Conference, Munich, Germany, 5–9 October 2015; Proceedings, Part III 18. Springer: Berlin/Heidelberg, Germany, 2015; pp. 234–241. [Google Scholar]
  29. Dosovitskiy, A. An image is worth 16 × 16 words: Transformers for image recognition at scale. arXiv 2020, arXiv:2010.11929. [Google Scholar]
  30. Li, R.; Zheng, S.; Zhang, C.; Duan, C.; Su, J.; Wang, L.; Atkinson, P.M. Multiattention network for semantic segmentation of fine-resolution remote sensing images. IEEE Trans. Geosci. Remote Sens. 2021, 60, 1–13. [Google Scholar] [CrossRef]
  31. Karras, T.; Laine, S.; Aittala, M.; Hellsten, J.; Lehtinen, J.; Aila, T. Analyzing and improving the image quality of stylegan. In Proceedings of the IEEE/CVF Conference on Computer Vision and Pattern Recognition, Seattle, WA, USA, 14–19 June 2020; pp. 8110–8119. [Google Scholar]
  32. Wang, X.; Zhou, J.; Fan, J. IDUDL: Incremental double unsupervised deep learning model for marine aquaculture SAR images segmentation. IEEE Trans. Geosci. Remote Sens. 2022, 60, 1–12. [Google Scholar] [CrossRef]
  33. Long, J.; Shelhamer, E.; Darrell, T. Fully convolutional networks for semantic segmentation. In Proceedings of the IEEE Conference on Computer Vision and Pattern Recognition, Boston, MA, USA, 7–12 June 2015; pp. 3431–3440. [Google Scholar]
  34. Cheng, X.; Zhu, C.; Yuan, L.; Zhao, S. Cross-modal domain adaptive instance segmentation in sar images via instance-aware adaptation. In Proceedings of the Chinese Conference on Image and Graphics Technologies, Bejing, China, 17–19 August 2023; Springer Singapore: Singapore, 2023; pp. 413–424. [Google Scholar]
  35. Khan, S.; Naseer, M.; Hayat, M.; Zamir, S.W.; Khan, F.S.; Shah, M. Transformers in vision: A survey. ACM Comput. Surv. (CSUR) 2022, 54, 1–41. [Google Scholar] [CrossRef]
  36. Mao, A.; Mohri, M.; Zhong, Y. Cross-entropy loss functions: Theoretical analysis and applications. In Proceedings of the International Conference on Machine Learning, PMLR, Honolulu, HI, USA, 23–29 July 2023; pp. 23803–23828. [Google Scholar]
  37. Oord, A.v.d.; Li, Y.; Vinyals, O. Representation learning with contrastive predictive coding. arXiv 2018, arXiv:1807.03748. [Google Scholar]
  38. Wu, K.; Otoo, E.; Shoshani, A. Optimizing connected component labeling algorithms. In Proceedings of the Medical Imaging 2005: Image Processing, SPIE, San Diego, CA, USA, 13–17 February 2005; Volume 5747, pp. 1965–1976. [Google Scholar]
  39. Wang, Y.; Wang, C.; Zhang, H.; Dong, Y.; Wei, S. A SAR dataset of ship detection for deep learning under complex backgrounds. Remote Sens. 2019, 11, 765. [Google Scholar] [CrossRef]
  40. Zhang, T.; Zhang, X.; Ke, X.; Zhan, X.; Shi, J.; Wei, S.; Pan, D.; Li, J.; Su, H.; Zhou, Y.; et al. LS-SSDD-v1. 0: A deep learning dataset dedicated to small ship detection from large-scale Sentinel-1 SAR images. Remote Sens. 2020, 12, 2997. [Google Scholar] [CrossRef]
  41. Kingma, D.P. Adam: A method for stochastic optimization. arXiv 2014, arXiv:1412.6980. [Google Scholar]
  42. Imambi, S.; Prakash, K.B.; Kanagachidambaresan, G. PyTorch. In Programming with TensorFlow: Solution for Edge Computing Applications; Springer: Cham, Switzerland, 2021; pp. 87–104. [Google Scholar]
  43. Hsu, H.; Lachenbruch, P.A. Paired t Test. Wiley StatsRef: Statistics Reference Online; Wiley: Hoboken, NJ, USA, 2014. [Google Scholar]
  44. Lachenbruch, P.A. McNemar Test. Wiley StatsRef: Statistics Reference Online; Wiley: Hoboken, NJ, USA, 2014. [Google Scholar]
  45. Badrinarayanan, V.; Kendall, A.; Cipolla, R. Segnet: A deep convolutional encoder-decoder architecture for image segmentation. IEEE Trans. Pattern Anal. Mach. Intell. 2017, 39, 2481–2495. [Google Scholar] [CrossRef]
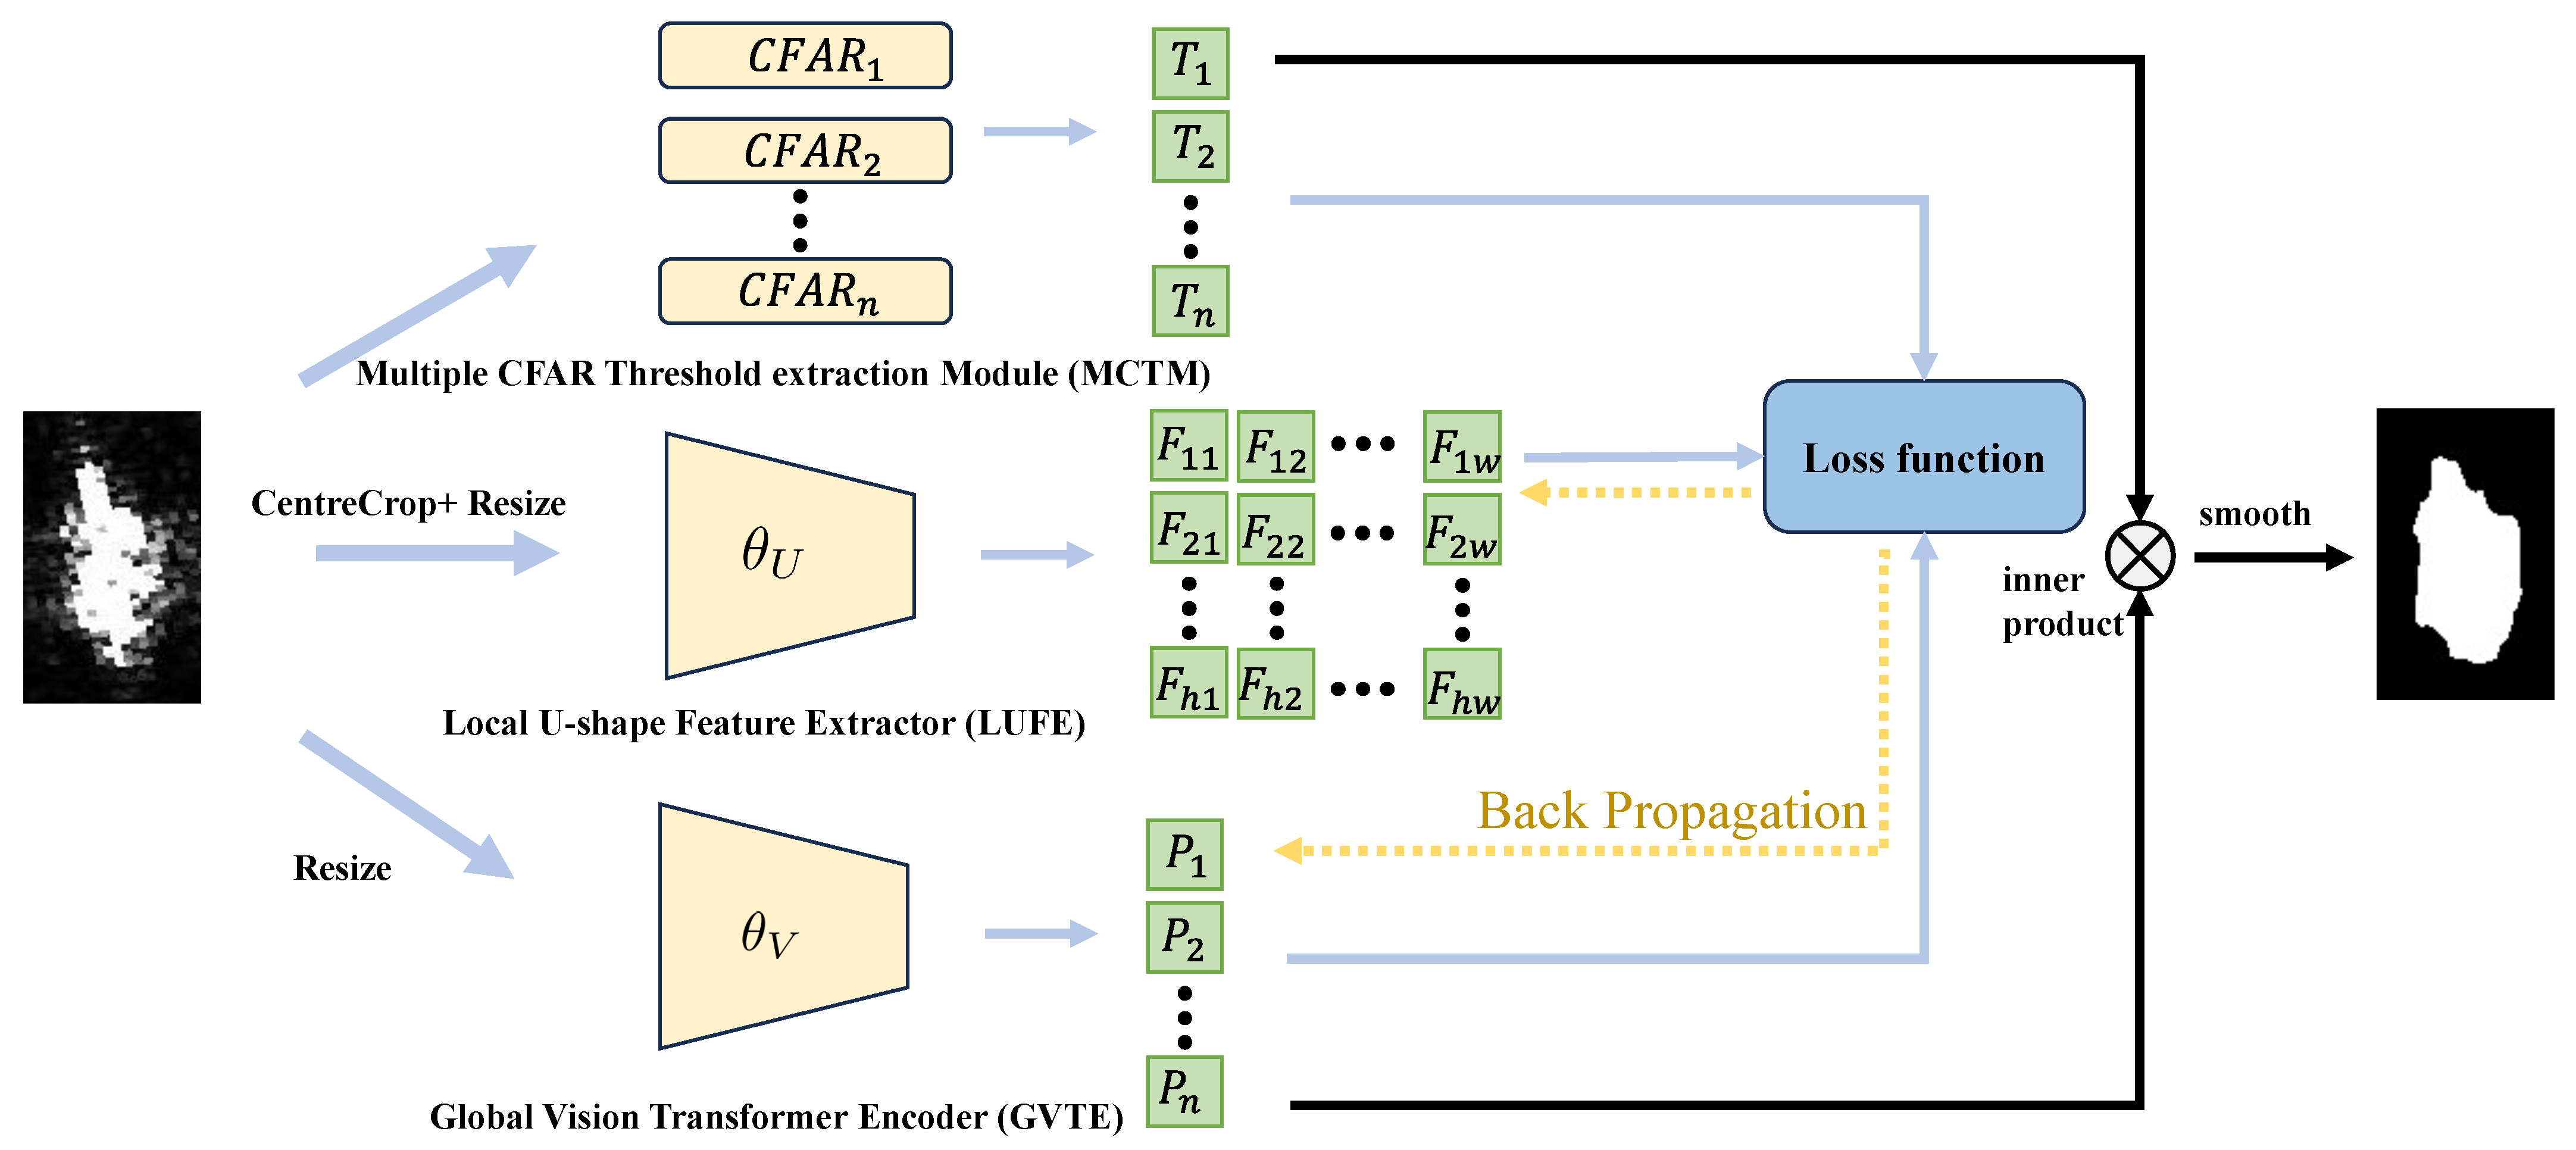
Figure 1. The overall architecture. In MCTM, thresholds corresponding to different false alarm rates are extracted. The LUFE module maps each pixel in the image to a high-dimensional feature space. The GVTE module employs a Vision Transformer structure to extract global features and maps these global features to the probabilities corresponding to the MCTM output thresholds. We use the designed loss function to update the weights of LUFE and GVTE.The inner product of the output vectors from MTCM and GVTE modules serves as the segmentation threshold for the input image. After segmentation, the result undergoes smoothing through the label smoothing module to obtain the final segmentation result.
Remotesensing 17 00593 g001
Figure 2. The image is divided into target region and noise region.
Remotesensing 17 00593 g002
Figure 3. Illustration of the Local U-shape Feature Extractor. (a) The overall structure of the LUFE module. After the input image passes through three Down modules and three Up modules, the feature map of the image is obtained. (b) The specific structure of the Down module. (c) The specific structure of the Up module.
Remotesensing 17 00593 g003
Figure 4. Illustration of the Global Vision Transformer Encoder. (a) The overall structure of the GVTE module. After Patch and Position Embedding, we feed it into Transformer Encoder, the global features of the image can be obtained. After MLP and SoftMax, global features can be mapped to the probabilities of each CFAR threshold. (b) The specific structure of Transformer Encoder.
Remotesensing 17 00593 g004
Figure 5. Schematic diagram of the role of the PLC-Loss function. (a) Distribution of different categories of pixels in the feature space before training. (b) Distribution of different categories of pixels in feature space after training.
Remotesensing 17 00593 g005
Figure 6. Qualitative analysis achieved by different unsupervised segmentation methods on small-size ship in the SSDD dataset. (a) Input image, (b) GT, (c) CFAR, (d) OTSU, (e) Kim-Net, (f) PiCIE, (g) CDA-SAR, (h) IDUDL, (i) Ours. The false negative areas and false positive areas are highlighted by green and red.
Remotesensing 17 00593 g006
Figure 7. Qualitative analysis achieved by different unsupervised segmentation methods on small-size ship in the HRSID dataset. (a) Input image (b) GT, (c) CFAR, (d) OTSU, (e) Kim-Net, (f) PiCIE, (g) CDA-SAR, (h) IDUDL, (i) Ours. The false negative areas and false positive areas are highlighted by green and red.
Remotesensing 17 00593 g007
Figure 8. Qualitative analysis achieved by different unsupervised segmentation methods on large ship in the SSDD dataset. (a) Input image, (b) GT, (c) CFAR, (d) OTSU, (e) Kim-Net, (f) PiCIE, (g) CDA-SAR, (h) IDUDL, (i) Ours. The false negative areas and false positive areas are highlighted by green and red.
Remotesensing 17 00593 g008
Figure 9. Qualitative analysis achieved by different unsupervised segmentation methods on large ship in the HRSID dataset. (a) Input image, (b) GT, (c) CFAR, (d) OTSU, (e) Kim-Net, (f) PiCIE, (g) CDA-SAR, (h) IDUDL, (i) Ours. The false negative areas and false positive areas are highlighted by green and red.
Remotesensing 17 00593 g009
Table 1. PA, kappa, MIoU, FWIoU, and F1-Score achieved by different methods on the SSDD dataset. Larger values indicate better performance. The best results are shown in red and the second best results are shown in blue.
Method DescriptionPAKappaMIoUFWIoUF1
CFAR0.9480.7880.8200.9060.820
OTSU0.9330.6310.7200.8740.665
KIM0.9090.5650.6760.8390.608
PiCIE0.9360.6830.7490.8830.719
CDA-SAR0.9520.7620.8020.9100.789
IDUDL0.9520.7340.7920.9100.760
Ours0.9630.8460.8650.9320.868
Table 2. PA, kappa, MIoU, FWIoU, and F1-Score achieved by different methods on the HRSID dataset. Larger values indicate better performance. The best results are shown in red and the second best results are shown in blue.
Method DescriptionPAKappaMIoUFWIoUF1
CFAR0.9410.7370.7840.9010.771
OTSU0.9330.5640.6810.8740.596
KIM0.9190.5370.6680.8590.574
PiCIE0.9450.7060.7730.9030.735
CDA-SAR0.9460.7650.8030.9090.797
IDUDL0.9590.7570.8090.9250.779
Ours0.9630.8300.8530.9350.851
Table 3. PA, kappa, MIoU, FWIoU, and F1-Score achieved by MtAD-Net on the SSDD dataset after removing different percentages.
PAKappaMIoUFWIoUF1
not remove0.9480.7420.7920.9020.769
remove 1%0.9560.7940.8270.9180.819
remove 2%0.9600.8160.8420.9240.839
remove 5% (selected)0.9630.8460.8650.9320.868
remove 10%0.9600.8410.8600.9320.867
remove 20%0.9520.8270.8490.9180.857
Table 4. PA, kappa, MIoU, FWIoU, and F1-Score achieved by MtAD-Net on the HRSID dataset after removing different percentages.
PAKappaMIoUFWIoUF1
not remove0.9530.7180.7860.9130.740
remove 1%0.9620.7890.8290.9300.818
remove 2%0.9620.8220.8470.9330.844
remove 5% (selected)0.9630.8300.8530.9350.851
remove 10%0.9560.8140.8400.9260.839
remove 20%0.9410.7710.8070.9040.805
Table 5. PA, kappa, MIoU, FWIoU, and F1-Score achieved by MtAD-Net on SSDD dataset after using different false alarm rate vectors.
False Alarm Rate Vector ConfigurationPAKappaMIoUFWIoUF1
F a = { 0.005 , 0.1 , 0.5 } , Length = 30.9610.8220.8480.9260.844
F a = { 0.005 , 0.0075 , 0.01 , 0.05 , 0.1 , 0.2 , 0.25 , 0.5 } , Length = 80.9650.8480.8670.9350.869
F a = { 0.004 , 0.008 , 0.16 , 0.32 , 0.64 } 0.9620.8440.8630.9300.867
F a = { 0.007 , 0.02 , 0.1 , 0.3 , 0.6 } , Length = 50.9630.8400.8600.9310.862
F a = { 0.003 , 0.05 , 0.2 , 0.4 , 0.7 } , Length = 50.9600.8340.8560.9270.858
F a = { 0.001 , 0.05 , 0.15 , 0.35 , 0.8 } , Length = 50.9610.8360.8580.9300.860
F a = { 0.005 , 0.01 , 0.1 , 0.25 , 0.5 } , Length = 5 (selected)0.9630.8460.8650.9320.868
Table 6. PA, kappa, MIoU, FWIoU, and F1-Score achieved by MtAD-Net on HRSID dataset after using different false alarm rate vectors.
False Alarm Rate Vector ConfigurationPAKappaMIoUFWIoUF1
F a = { 0.005 , 0.1 , 0.5 } , Length = 30.9610.7960.8330.9310.817
F a = { 0.005 , 0.0075 , 0.01 , 0.05 , 0.1 , 0.2 , 0.25 , 0.5 } , Length = 80.9630.8270.8510.9350.849
F a = { 0.004 , 0.008 , 0.16 , 0.32 , 0.64 } 0.9590.8250.8490.9300.849
F a = { 0.007 , 0.02 , 0.1 , 0.3 , 0.6 } , Length = 50.9610.8280.8510.9330.851
F a = { 0.003 , 0.05 , 0.2 , 0.4 , 0.7 } , Length = 50.9540.8120.8380.9230.839
F a = { 0.001 , 0.05 , 0.15 , 0.35 , 0.8 } , Length = 50.9570.8200.8450.9270.845
F a = { 0.005 , 0.01 , 0.1 , 0.25 , 0.5 } , Length = 5 (selected)0.9630.8300.8530.9350.851
Table 7. PA, kappa, MIoU, FWIoU, and F1-Score achieved by several variants of MtAD-Net on the SSDD dataset.
ModelPAKappaMIoUFWIoUF1
MtAD-Net without MCTM0.9500.7790.8240.9090.802
MtAD-Net without LUFE0.9570.8230.8500.9220.846
MtAD-Net without GVTE0.9570.8100.8420.9210.831
MtAD-Net without PLC-Loss0.9580.7840.8260.9230.808
MtAD-Net without Label Smoothing0.9540.8060.8330.9160.835
MtAD-Net0.9630.8460.8650.9320.868
Table 8. PA, kappa, MIoU, FWIoU, and F1-Score achieved by several variants of MtAD-Net on the HRSID dataset.
ModelPAKappaMIoUFWIoUF1
MtAD-Net without MCTM0.9600.7730.8220.9270.792
MtAD-Net without LUFE0.9620.8050.8390.9320.826
MtAD-Net without GVTE0.9600.8060.8370.9290.829
MtAD-Net without PLC-Loss0.9510.7680.8110.9150.794
MtAD-Net without Label Smoothing0.9520.7830.8160.9170.811
MtAD-Net0.9630.8300.8530.9350.851
Table 9. The relationship between the final segmentation threshold T f i n a l and false alarm rate vector F a in Figure 6i.
False Alarm RateCFAR ThresholdProbability of Each Threshold T final
0.005370.382
0.01360.192
0.1240.16126.77
0.25120.133
0.520.132
Table 10. The relationship between the final segmentation threshold T f i n a l and false alarm rate vector F a in Figure 7i.
False Alarm RateCFAR ThresholdProbability of Each Threshold T final
0.005200.636
0.01200.351
0.1140.00719.89
0.25110.002
0.570.004
Table 11. The relationship between the final segmentation threshold T f i n a l and false alarm rate vector F a in Figure 8i.
False Alarm RateCFAR ThresholdProbability of Each Threshold T final
0.005800.002
0.01760.002
0.1480.50741.25
0.25340.487
0.5230.002
Table 12. The relationship between the final segmentation threshold T f i n a l and false alarm rate vector F a in Figure 9i.
False Alarm RateCFAR ThresholdProbability of each Threshold T final
0.005430.069
0.01420.083
0.1320.70732.45
0.25250.119
0.5180.022
Disclaimer/Publisher’s Note: The statements, opinions and data contained in all publications are solely those of the individual author(s) and contributor(s) and not of MDPI and/or the editor(s). MDPI and/or the editor(s) disclaim responsibility for any injury to people or property resulting from any ideas, methods, instructions or products referred to in the content.