Article

The Responses of Vegetation Production and Evapotranspiration to Inter-Annual Summer Drought in Northeast Asia Dryland Regions (NADRs)

1
Key Laboratory of Ecological Safety and Sustainable Development in Arid Lands, Lanzhou 730000, China
2
Department of Environment Science, Kangwon National University, Chuncheon 200-701, Republic of Korea
*
Author to whom correspondence should be addressed.
Remote Sens. 2025, 17(4), 589; https://doi.org/10.3390/rs17040589
Submission received: 26 December 2024 / Revised: 27 January 2025 / Accepted: 6 February 2025 / Published: 8 February 2025
(This article belongs to the Section Ecological Remote Sensing)

Abstract

:
The impacts of drought on Gross Primary Productivity (GPP) and Evapotranspiration (ET) play an important role in understanding the carbon–water process of dryland ecosystems. However, just via correlation analysis, the response mechanism of vegetation production and ET to droughts is not well understood. Based on a modified Vegetation Photosynthesis Model (VPM) and a revised Penman–Monteith (PM) model, GPP and ET were simulated to examine their sensitivity to drought and quantitative dynamics among biomes with the drought index in NADRs. The diverse response of GPP and ET to drought depending on biomes, grassland, barren/sparse vegetation and shrub showed a positive response to summer drought, while cropland and forest showed a negative response to summer drought. From the normal summers to extreme drought summers, GPP and ET reduced by 0.36 g C m−2 day−1 and 0.18 mm day−1, nearly 10.54% and 12.77%, respectively. Some compensation mechanisms (i.e., physiological changes of vegetation species to resistant drought) or drought timescale weaken the drought impacts in insignificant correlated regions (GPP or ET and SPEI) with lower reduction rates. Compared with persistent or multiple droughts, the impacts of abrupt wet–dry shifts on GPP and ET were weak with lower rates (4.44% for GPP, 0.92% for ET). Notably, the wet winter and warm spring weakens the summer drought impacts on GPP in some parts of grasslands. These observations would be useful to understand the ecosystem process and to account for the dynamics of ecosystem water use efficiency during drought disturbance in depth.

1. Introduction

The increasing frequency and intensification of droughts under global warming [1,2,3,4] and expansion of drylands in the coming decades [5,6] will alter the coupled carbon–water cycle by affecting the plant community composition [7,8], structure [9,10] and function of the ecosystem [11,12,13]. Understanding the response mechanism of the carbon–water process to drought could give us insights to cope with future droughts.
As the vital indicators of the carbon–water process, Gross Primary Productivity (GPP), Evapotranspiration (ET) and Water Use Efficiency (WUE) are widely used to assess the impacts of drought to ecosystems. Most of research shows that vegetation productivity [14,15,16,17,18] and ET [19,20,21] have been limited by drought at global or regional scale, whereas ecosystem WUE under droughts presents dissimilar variations with drought timing and duration [22,23,24] or intensity [13]. Nevertheless, not enough evidence comes from the drylands. Additionally, dryland ecosystems exhibit different sensitivity to droughts, such as semi-arid regions having larger sensitivity than arid ecosystem [25]. Thus, analyzing the inherent ecological responses to droughts is critical in order to carry out measures to reduce drylands degradation under climate change.
Currently, the methods, mechanisms and processes of ecological responses to droughts are still lacking [26]. Most of the previous research is based on the relationship between drought and indicators [15,27,28,29], or the anomalies of ecological indicators (i.e., GPP or WUE) during drought [18,22] or the difference between dry years and non-dry years [14,30,31,32]. Notably, ignored insignificant related regions between drought and GPP (or ET) might indicate that some compensation mechanisms resist the drought impacts; meanwhile, few studies focus on the impacts of abrupt changes in dry–wet events on carbon–water processes.
Northeast Asia Dryland Regions (NADRs), located in the east of the largest arid zone in the world (Afro–Asian arid zone) [33], are a typical vulnerable eco-environmental area to climate change (i.e., drought) [34]. Due to the vast barren area and grasslands, the responses of the dryland ecosystem to droughts present obvious regional and biomes differences [35], and are still unclear.
Here, our objective is to explain how the carbon–water process responds to droughts in NADRs via quantitative evaluation of the drought impacts on GPP and ET. Given the different responses of the carbon–water process to seasonal drought [24,29], the characteristics of the growing season in NADRs [36], the complexity and inconsistency of alternative WUE parameters [37], only summer GPP and ET were chosen as carbon–water indicators. First, we obtained summer GPP, ET via the Vegetation Photosynthesis Model (VPM) and the revised Penman–Monteith (PM) model (PM) in the whole NADR, respectively. Second, we evaluated the dynamics of GPP, ET and drought conditions. Third, we estimated the sensitivity of GPP and ET to droughts with correlation analysis. Last, we quantified the drought impacts on GPP and ET among different biome types.

2. Materials and Methods

2.1. Study Area

With an aridity index (AI), the boundary of the NADR in this study was defined (Figure 1, AI < 0.65) [38], including most parts of Mongolia, east of Kazakhstan, and arid and semi-arid regions of China except Tibet regions. The NADR has a marked dry continental climate and continental monsoon climate. The annual mean temperature and total annual precipitation have large heterogeneity and vary considerably [39,40]. The high temperature and precipitation are concentrated in the summer months (e.g., June, July and August, JJA).
As the main land cover types, grassland, barren/sparse vegetation and croplands account for 51.3%, 29.2% and 10.5% of NADR total area, respectively (Figure 1). Based on different climate conditions and dominant species, grassland could be divided into 6 classes in China, such as alpine steppe (AS), alpine meadow (AM), temperate desert steppe (DS), typical steppe (TS), meadow steppe (MS) and temperate meadow (TM). Specifically, AS is controlled by cold-xerophytic grasses (e.g., Carex moorcroftii, Stipa purpurea) [41], while perennial grasses (e.g., K. humilis, Kobresia pygmaea and K. tibetica) are dominant species of AM. DS is dominated by xerophytes (e.g., Stipa gobica, Stipa klemezii, Stipa breviflora, Stipa glareosa and Allium polyrhizum) [42], The dominant species of TS are Stipa grandis, Leymus Chinensis, Caragana microphylla, Agropyron cristatum, Stipa Krylovii and Cleistogenes squarrosa. MS is dominated by L. Chinensis, S. grandis, Filofolium sibiricum and Stipa baicalensis [43].

2.2. Estimation of Gross Primary Productivity (GPP) and Evapotranspiration (ET)

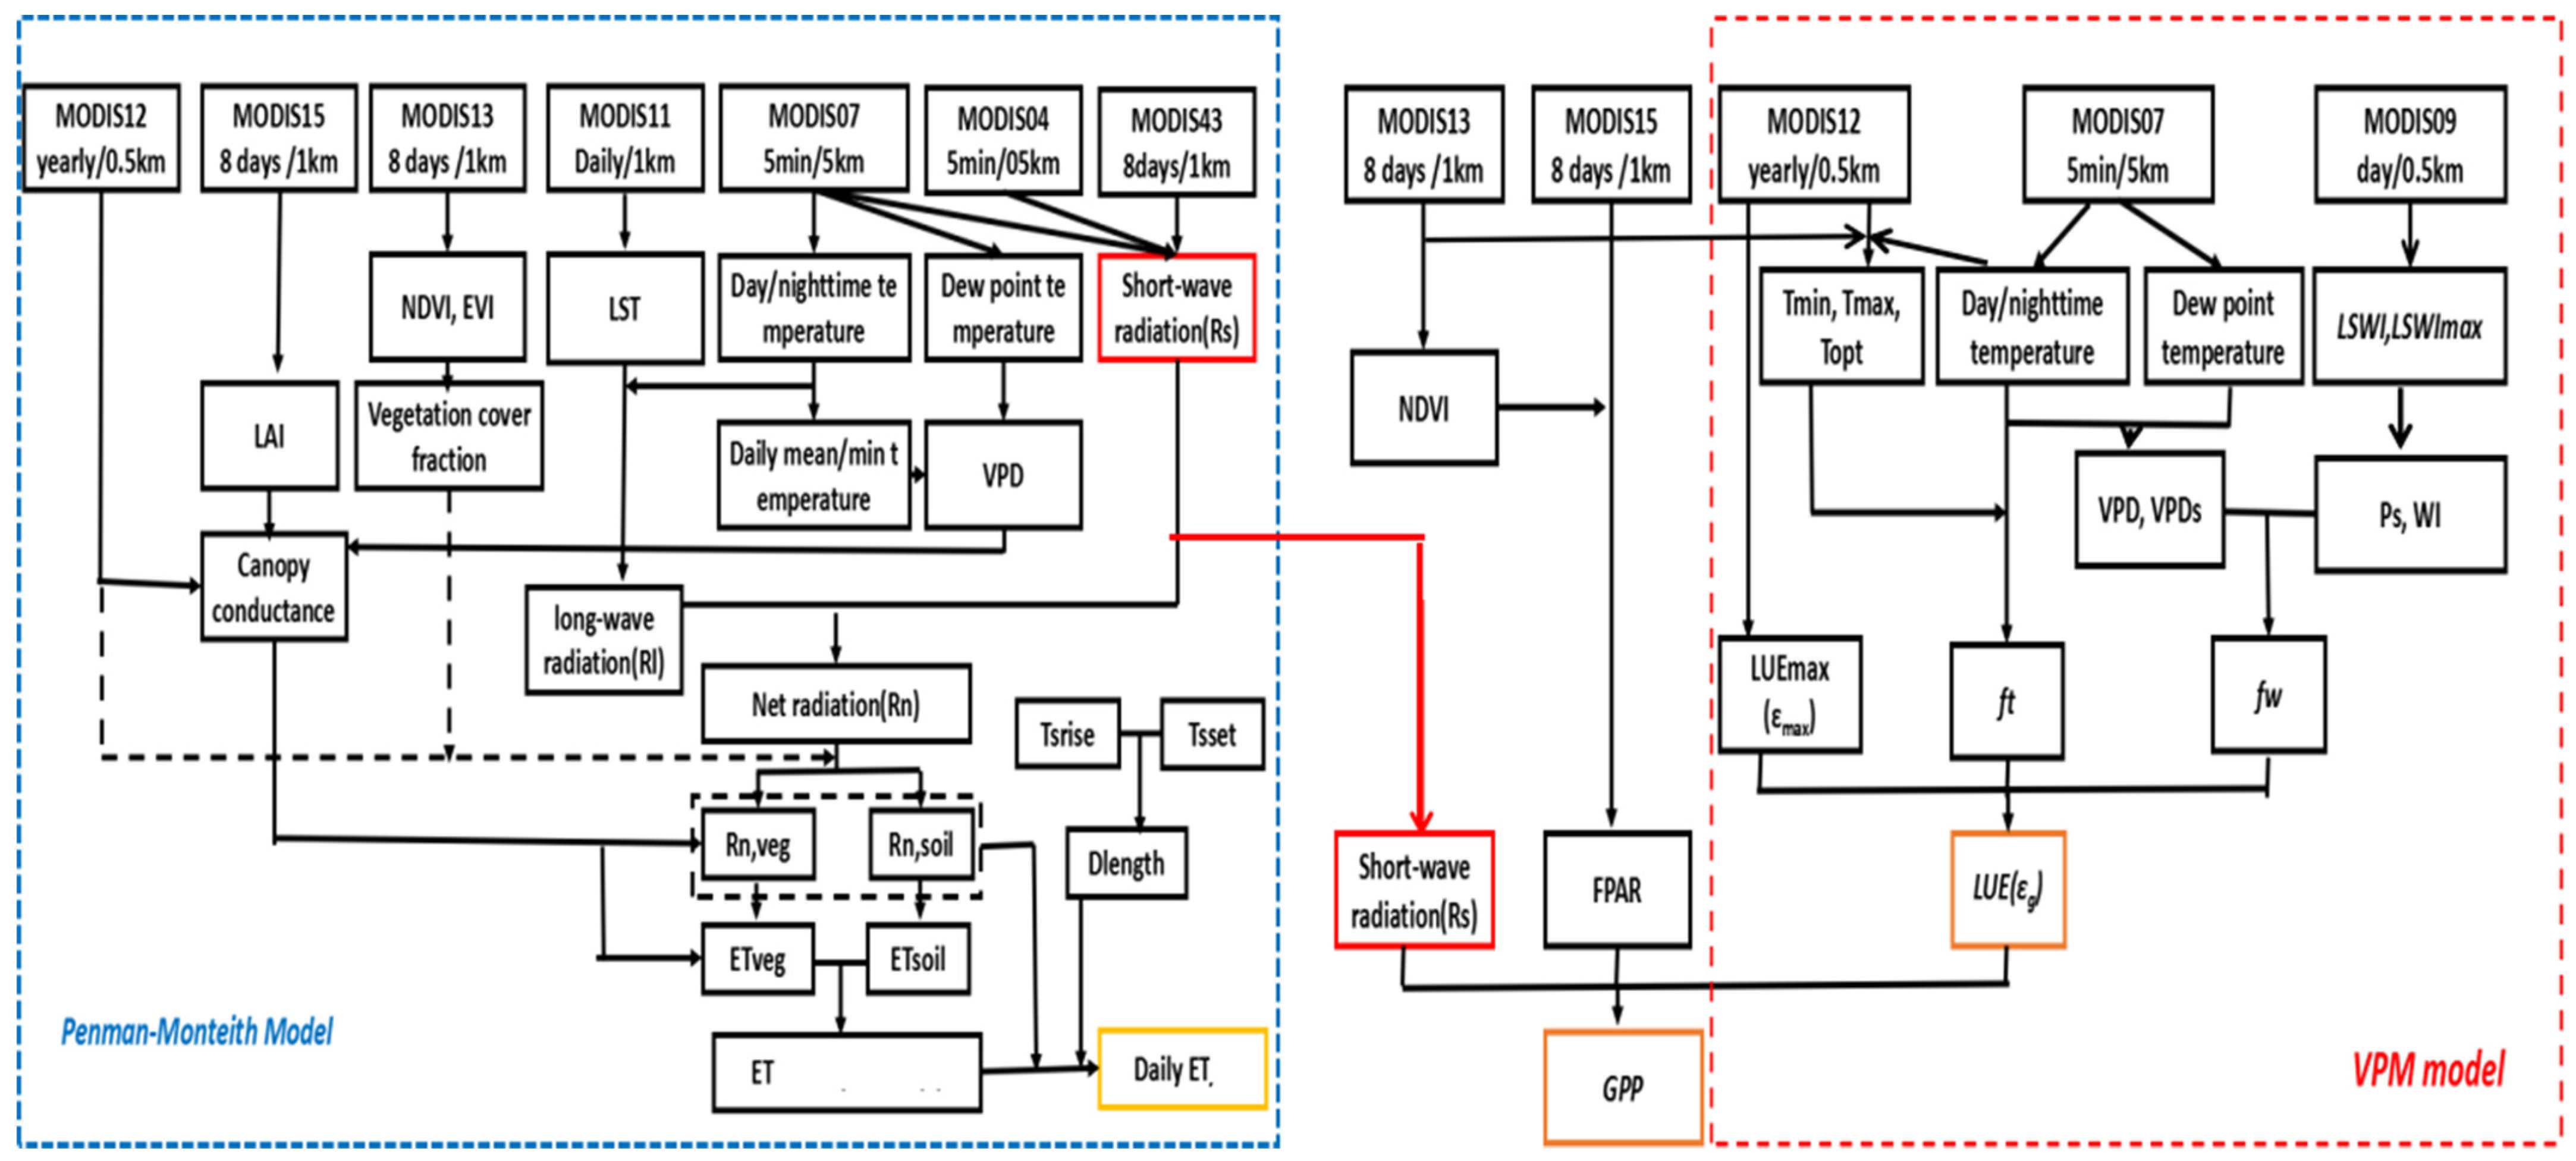
The estimation methods of GPP and ET have been studied deeply. For instance, the VPM model performed better than other light use efficiency models (i.e., Carnegie–Ames-Stanford approach (CASA), Global Production Efficiency Model (GLO-PEM)) for GPP in on a large scale [44,45]. The revised PM model could obtain the accurate daily ET data with MODIS time-series products [46,47,48,49]. Given the applicability and accuracy of the model via satellite data in large-scale dryland, the modified Vegetation Photosynthesis Model (VPM) and revised Penman–Monteith (PM) model were applied to estimate GPP and ET in this study, respectively. The details can be referred to in the flow chart in Figure 2.
GPP = ε g × APAR × Rsd × 0.48
ε g = ε max × min ( F t , F w )
F t = T T m i n T T m a x T T m i n T T m a x T T o p t 2
F w = WI × VPDs
where Rsd is the download shortwave radiation ([46], Figure 2). ɛmax is the potential LUE (g cm−2 MJ−1) and ɛmax for barren/sparse vegetation is 0.389 g cm−2 MJ−1 [50,51]. Ft represents the effects of temperature on ɛmax. Tmin, Tmax and Topt are the minimum, maximum and optimum temperature for photosynthetic activities, respectively. Fw is reflected by VPDS and land water index (WI) that was calculated by satellite-derived land surface water index (LSWI) with consideration of the phenology effects on ɛmax, [11,45].
To estimate total ET, the canopy ET (λEveg; Equation (6)) and soil evaporation (λEsoil; Equation (7)) were calculated [46].
λ E = λ E v e g + λ E s o i l
λ E v e g = Δ R n + ρ c p ( e s e a ) / r a Δ + γ × ( 1 + r s / r a )
λ E s o i l = Δ R n , s o i l + ρ c p ( e s e a ) / r a Δ + γ × ( r t o t / r a ) × ( R H 100 ) ( e s e a ) / 100
where Δ (Pa K−1) is the slope of the curve relating saturated water vapor pressure (es, Pa) to temperature (K); γ (Pa K−1) is psychrometric constant; Rn (W m−2) is available energy; ρ (kg m−3) is air density, cp (J kg−1 K−1) is the specific heat capacity of air; ea (Pa) is the actual water vapor pressure; ra (s m−1) is the aerodynamic resistance; and the surface resistance (rs, s m−1) is the effective resistance to transpiration from the plant canopy.

2.3. Data Sets

2.3.1. MODIS Datasets

Due to the long time series and accessibility on a large scale of the MODIS dataset, the MODIS land and atmosphere products from 2003 to 2015 were collected to estimate GPP and ET, including the MYD09A1 surface reflectance, MYD11A1 land surface temperature and emissivity, MCD12Q1 land cover classification, MYD15A2 LAI, MCD43B3 albedo and atmosphere products (MYD04L2 aerosol and MYD07L2 atmosphere profiles). NDVI and EVI data were obtained from Terra and Aqua MODIS (MOD13A2 and MYD13A2) products to calculate the vegetation cover fraction.

2.3.2. Drought Indicator: The Standardized Precipitation Evapotranspiration Index (SPEI)

Due to the integration of precipitation (P) and potential evapotranspiration (PET) for monitoring drought [52], SPEI achieves remarkable results in eco-hydrological applications [53]. Because of the lagged effect of water on vegetation, 3-month SPEI data covering the period from 2003 to 2015 were selected from the SPEIbase v.2.4 product (https://spei.csic.es/database.html (accessed on 27 January 2025), [54]). The average of 3-month SPEIs in June, July and August were defined as the summer SPEI. Different drought levels were divided based on SPEI (e.g., humid: SPEI ≥ 1.0, normal: −1.0 < SPEI < 1.0, moderate drought (MD): −1.5 < SPEI ≤ −1.0; severe drought (SD): −2.0 < SPEI ≤ −1.5; extreme drought (ED): SPEI ≤ −2.0).

2.3.3. Flux Tower Data

The eddy covariance (EC) flux tower data were used to validate the ET and GPP retrievals derived from the models. Here, 8 flux tower sites were selected in northeast Asia, which represent various major regional biomes (Table S1). For a detailed validation of GPP and ET, refer to Supplementary Materials.

2.4. Methodology

The Man–Kendall trend analysis was used to determine the trends of summer GPP, ET and SPEI over the period of 2003–2015. Significant tests were defined by z value (z ≥ 1.96, significant increase; z ≤ −1.96 significant decrease) at a 95% confidence level [55].
The relationship between summer GPP anomaly (or ET anomaly) and summer SPEI were examined by correlation analysis. Except for the correlation coefficients, the slope of the correlation analysis was also calculated at a 95% and 90% significant level (p < 0.05, p < 0.10).
The anomaly value of GPP and ET is based on Equation (8):
X a n o m a l y = X X m e a n X s d
where X is the variables (GPP or ET in this study), Xmean, Xsd is the mean value and standard deviation of X.
To quantity the drought impacts on GPP and ET, the mean values of GPP and ET were compared among each drought level (humid, normal, MD, SD and ED) at stable biomes during 2003–2015. The differences between normal and dry summers (e.g., MD summer, SD summer and ED summer) were also identified. Additionally, the relative change rates for the abrupt wet–dry shifts cases were evaluated at each stable biome during 2003–2015. The abrupt wet–dry shifts were defined as a normal summer followed by a dry summer, and the difference of GPP or ET between a normal summer and its dry summer followed as shown with the abrupt wet–dry shift index.

3. Results

3.1. Dynamics of Summer Mean GPP, ET and Drought Conditions in NADRs

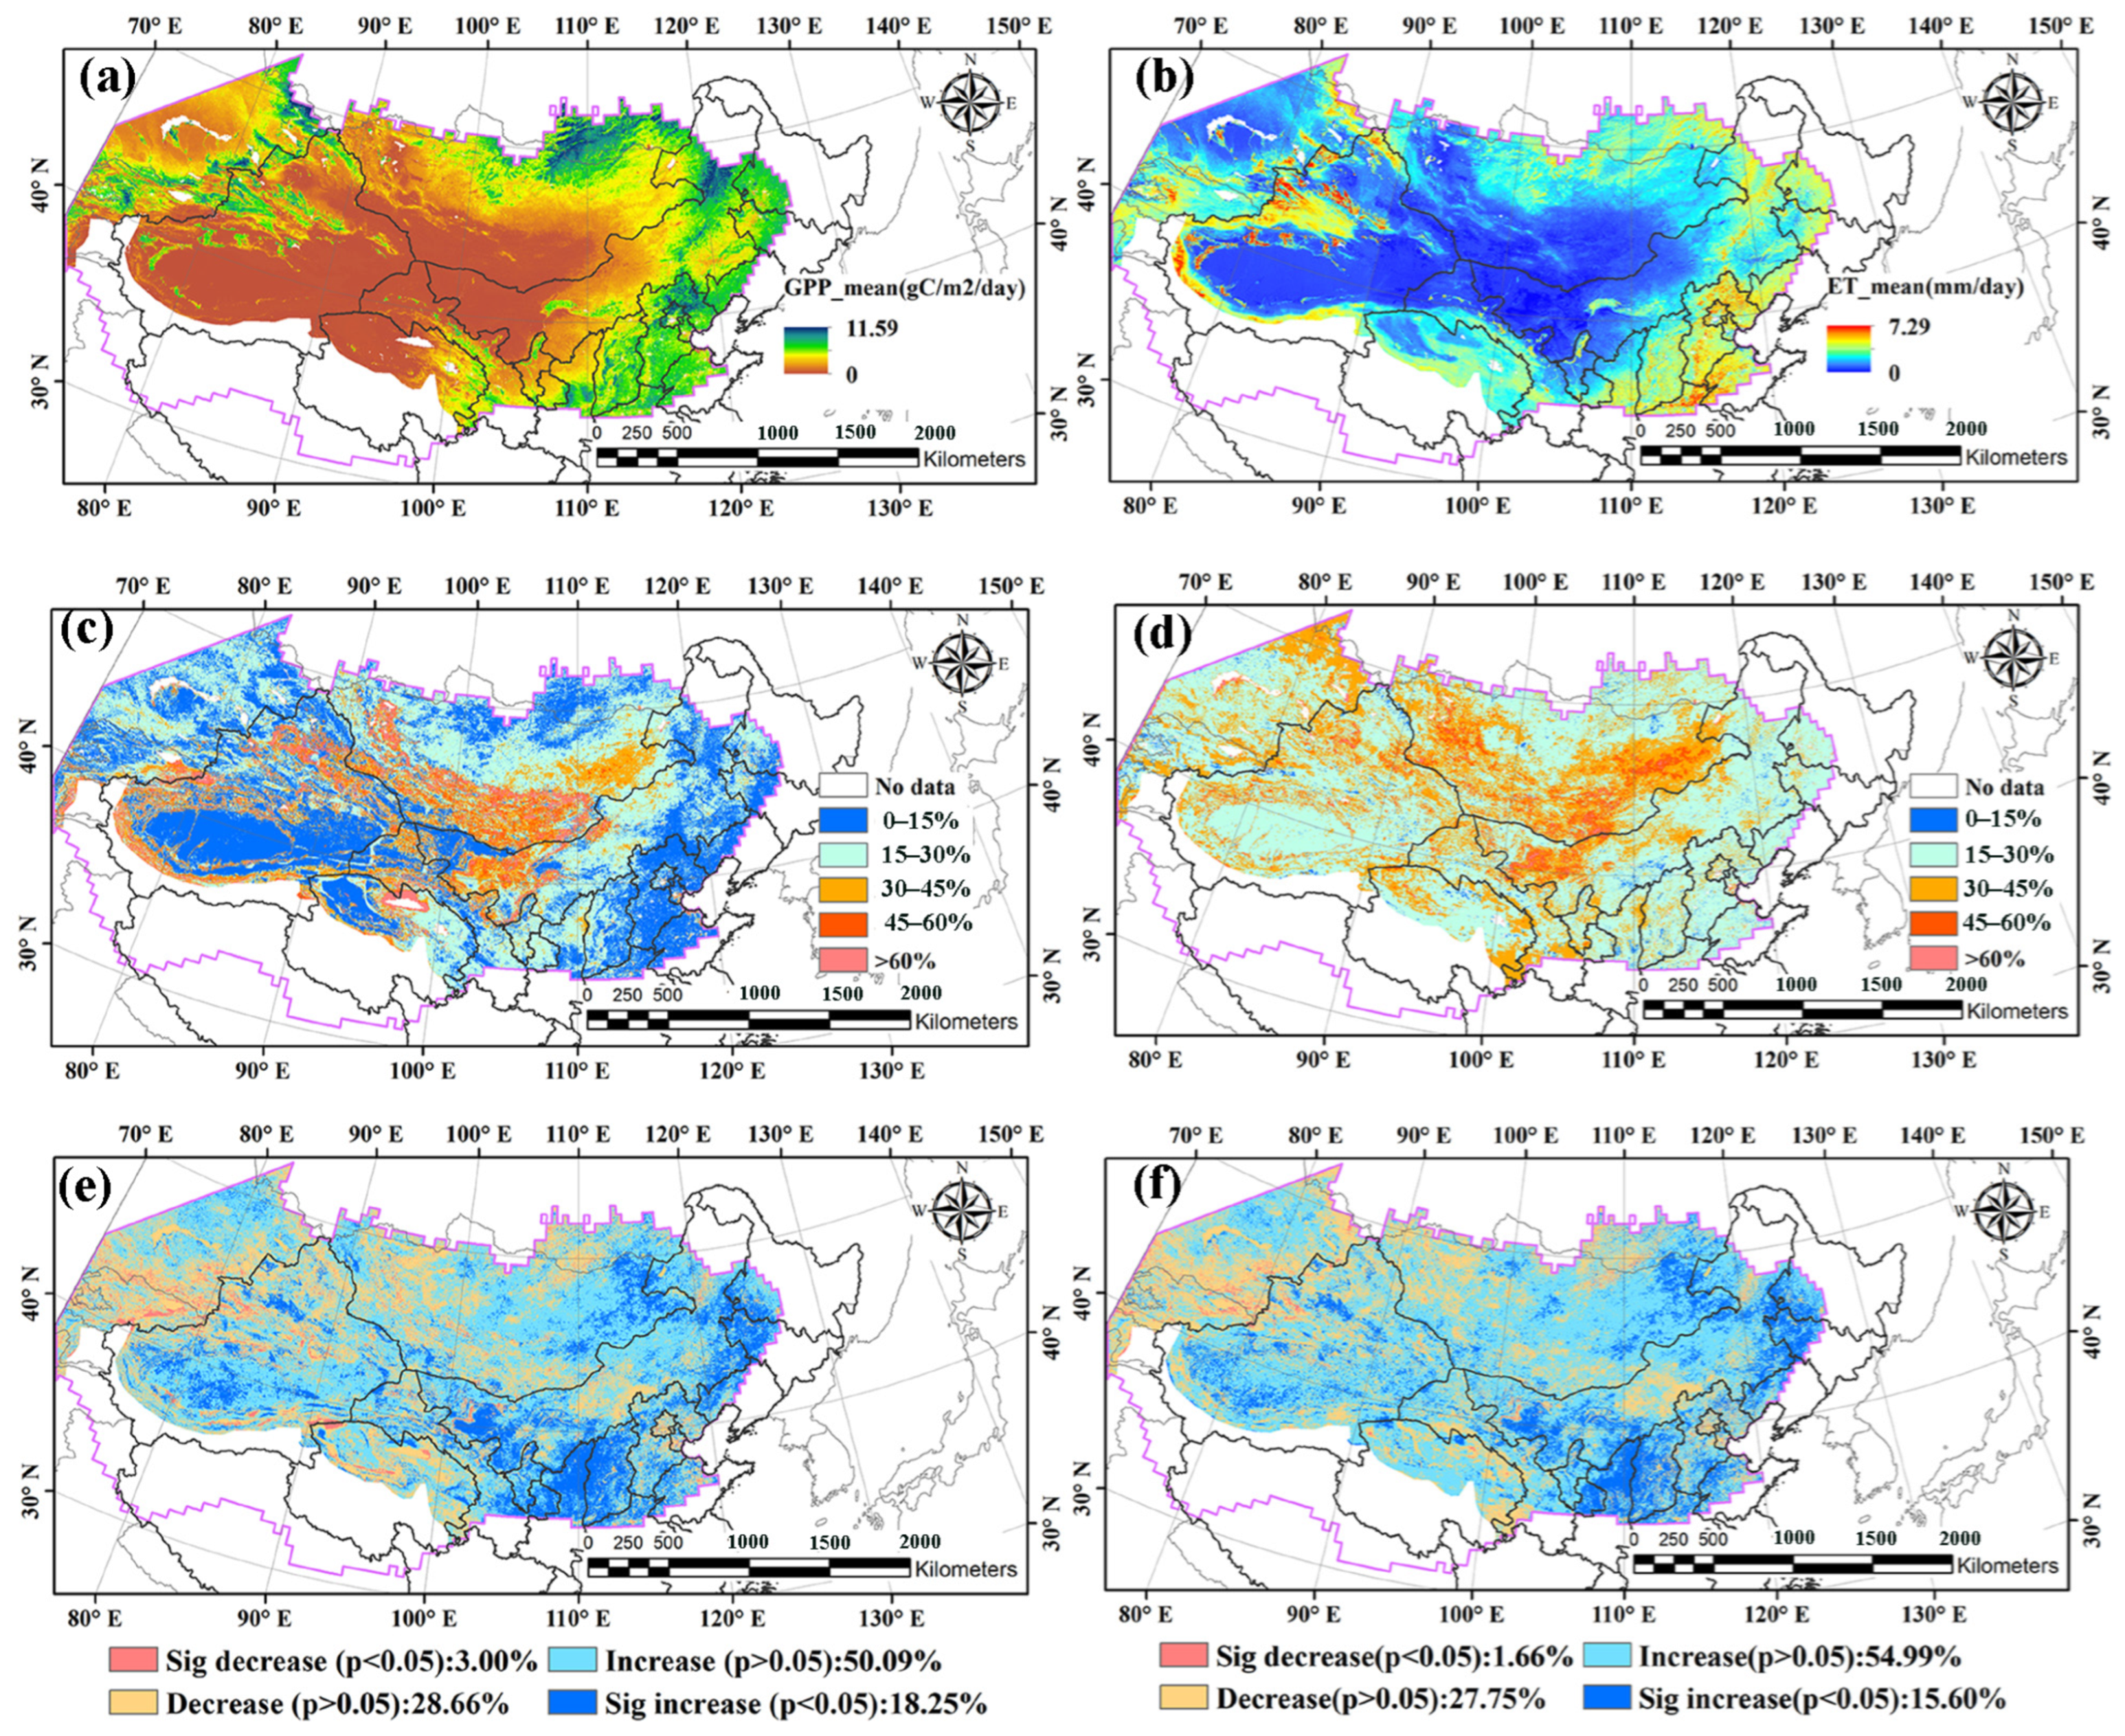
The spatial patterns of summer mean GPP and ET from 2003 to 2015 showed high consistency with that of ET, which increased from barren to grassland and further to cropland and forest (Figure 3a,b). The variations of GPP and ET have little difference with each other. For instance, most forests and cropland showed a lower variation of GPP (i.e., CV less than 15%) than that of ET. While GPP and ET presented a higher variation in the barren/sparsely vegetated regions in southern Mongolia (Figure 3c,d). As for the trends, GPP and ET had consistent patterns, which increased in most regions in the NADR with 18.25% and 15.60%, significant increases in the regions in the northeast and south of the NADR (Figure 3e,f).
The summer drought in the NADR was still serious from 2003 to 2015. Figure 4 illustrated the summer drought conditions, including drought frequency, trends and the percentage area of droughts that occurred in the NADR from 2003 to 2015. Most parts of the NADR experienced frequent droughts, especially moderate and severe droughts (Figure 4a,b). Extreme drought almost occurred in Mongolia and Inner Mongolia (Figure 4c). Although SPEI did not present significant trends (Figure 4d), the affected area of droughts significantly increased from 2003 to 2010 (Figure 4e). Drought impacted over 30% of the regions of the NADR in 2006, 2007, 2009, 2010, 2014 and 2015, and nearly half of the NADR (45.44%) in 2009. The area affected by extreme drought also reached the maximum (13.31%) in 2009 with low SPEI. The relatively wet summer only occurred in 2011 and 2012.

3.2. The Spatial Patterns of the Relationship Between GPP (or ET) and SPEI

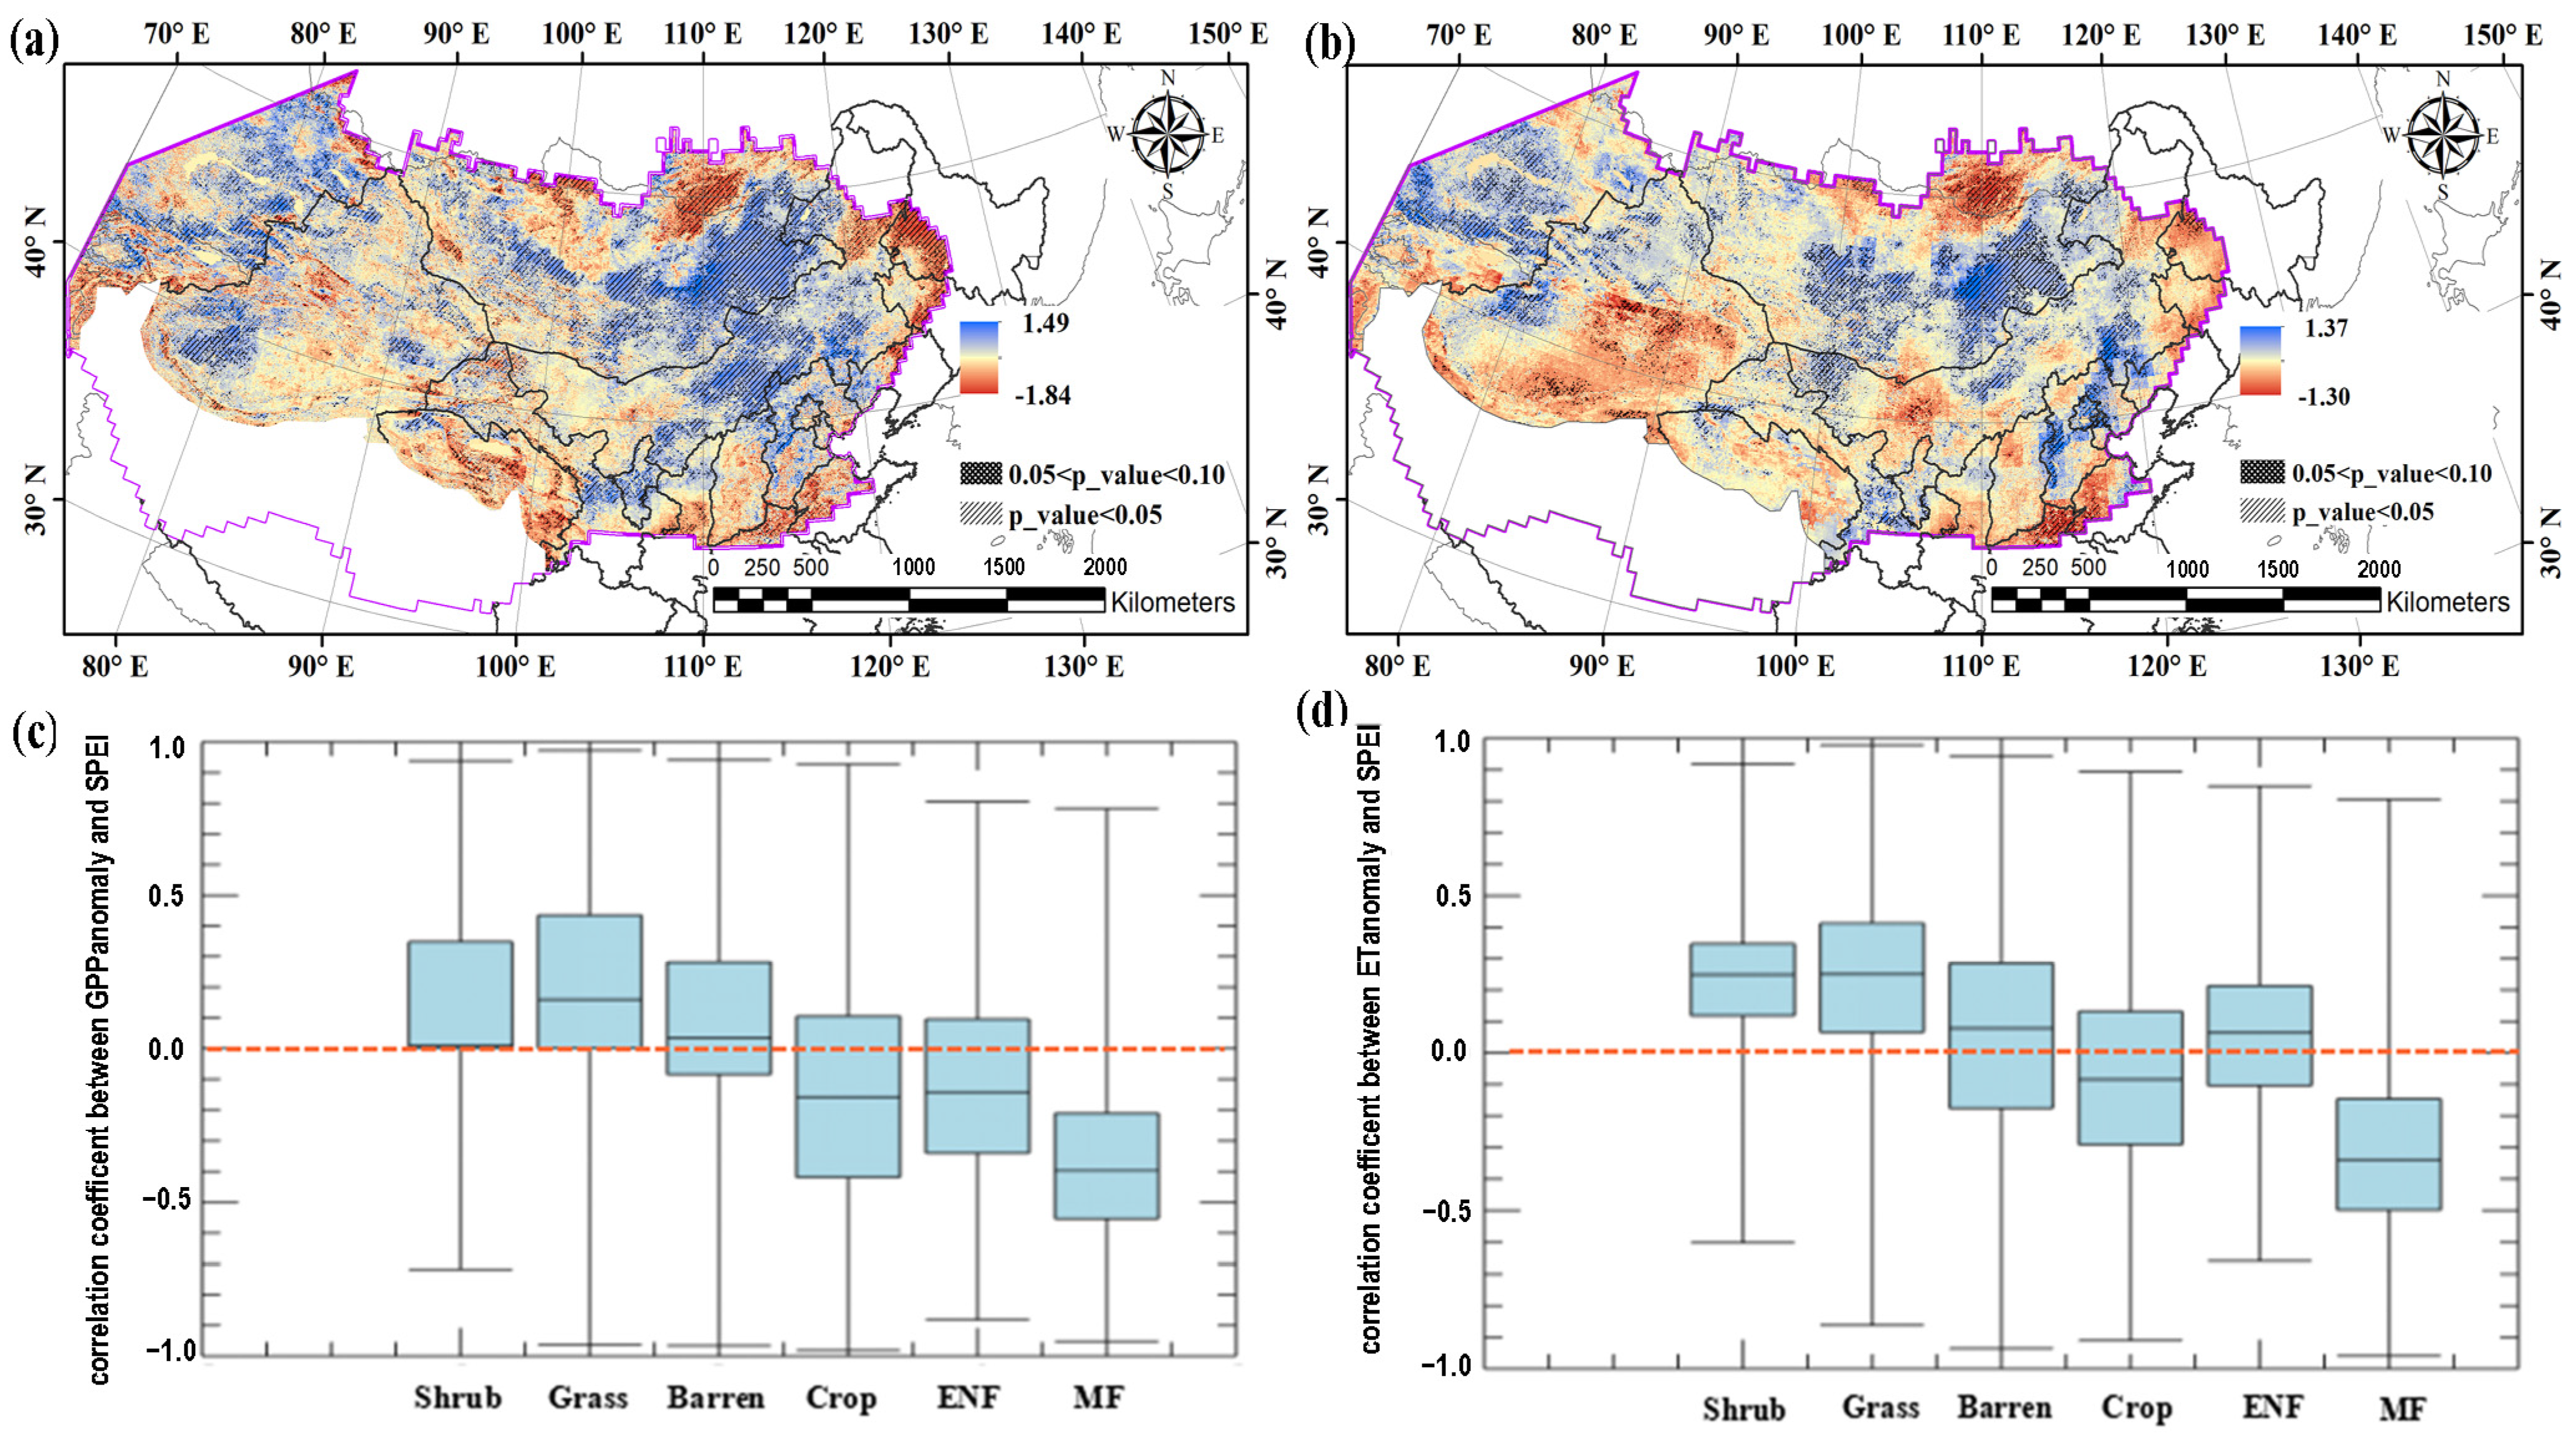
The correlation between summer GPP anomaly (or ET anomaly) and SPEI from 2003 to 2015 had large spatial heterogeneity (Figure 5a,b). Both linear correlation slope (Figure 5a,b) and coefficients (Figure 5c,d) showed that GPP and ET had a positive correlation with SPEI inside the shrub, grassland and some barren/sparse vegetation, while having a negative correlation with SPEI in the ambient forest and croplands. It means drought induces the decreased GPP and ET for grassland and increased GPP and ET for cropland and forest in NADRs. Furthermore, the most significant positive correlated area (p < 0.05, 0.05 < p < 0.10) occurred in the east grassland of Mongolia and middle Inner Mongolia, which was located in the semi-arid regions. The significant negative correlated areas (p < 0.05, 0.05 < p < 0.10) were few, almost distributed in north mixed forest and northeast cropland, which are cold regions. Additionally, GPP and ET showed a minor different response to drought. For example, the significant correlation between ET and SPEI is also presented in the arid desert ecosystem, like Alashan aeolian sandy land (positive) and north of Tarim Basin (negative), where an insignificant correlation between GPP and SPEI was present.

3.3. The Quantitative Changes GPP and ET with Summer Drought

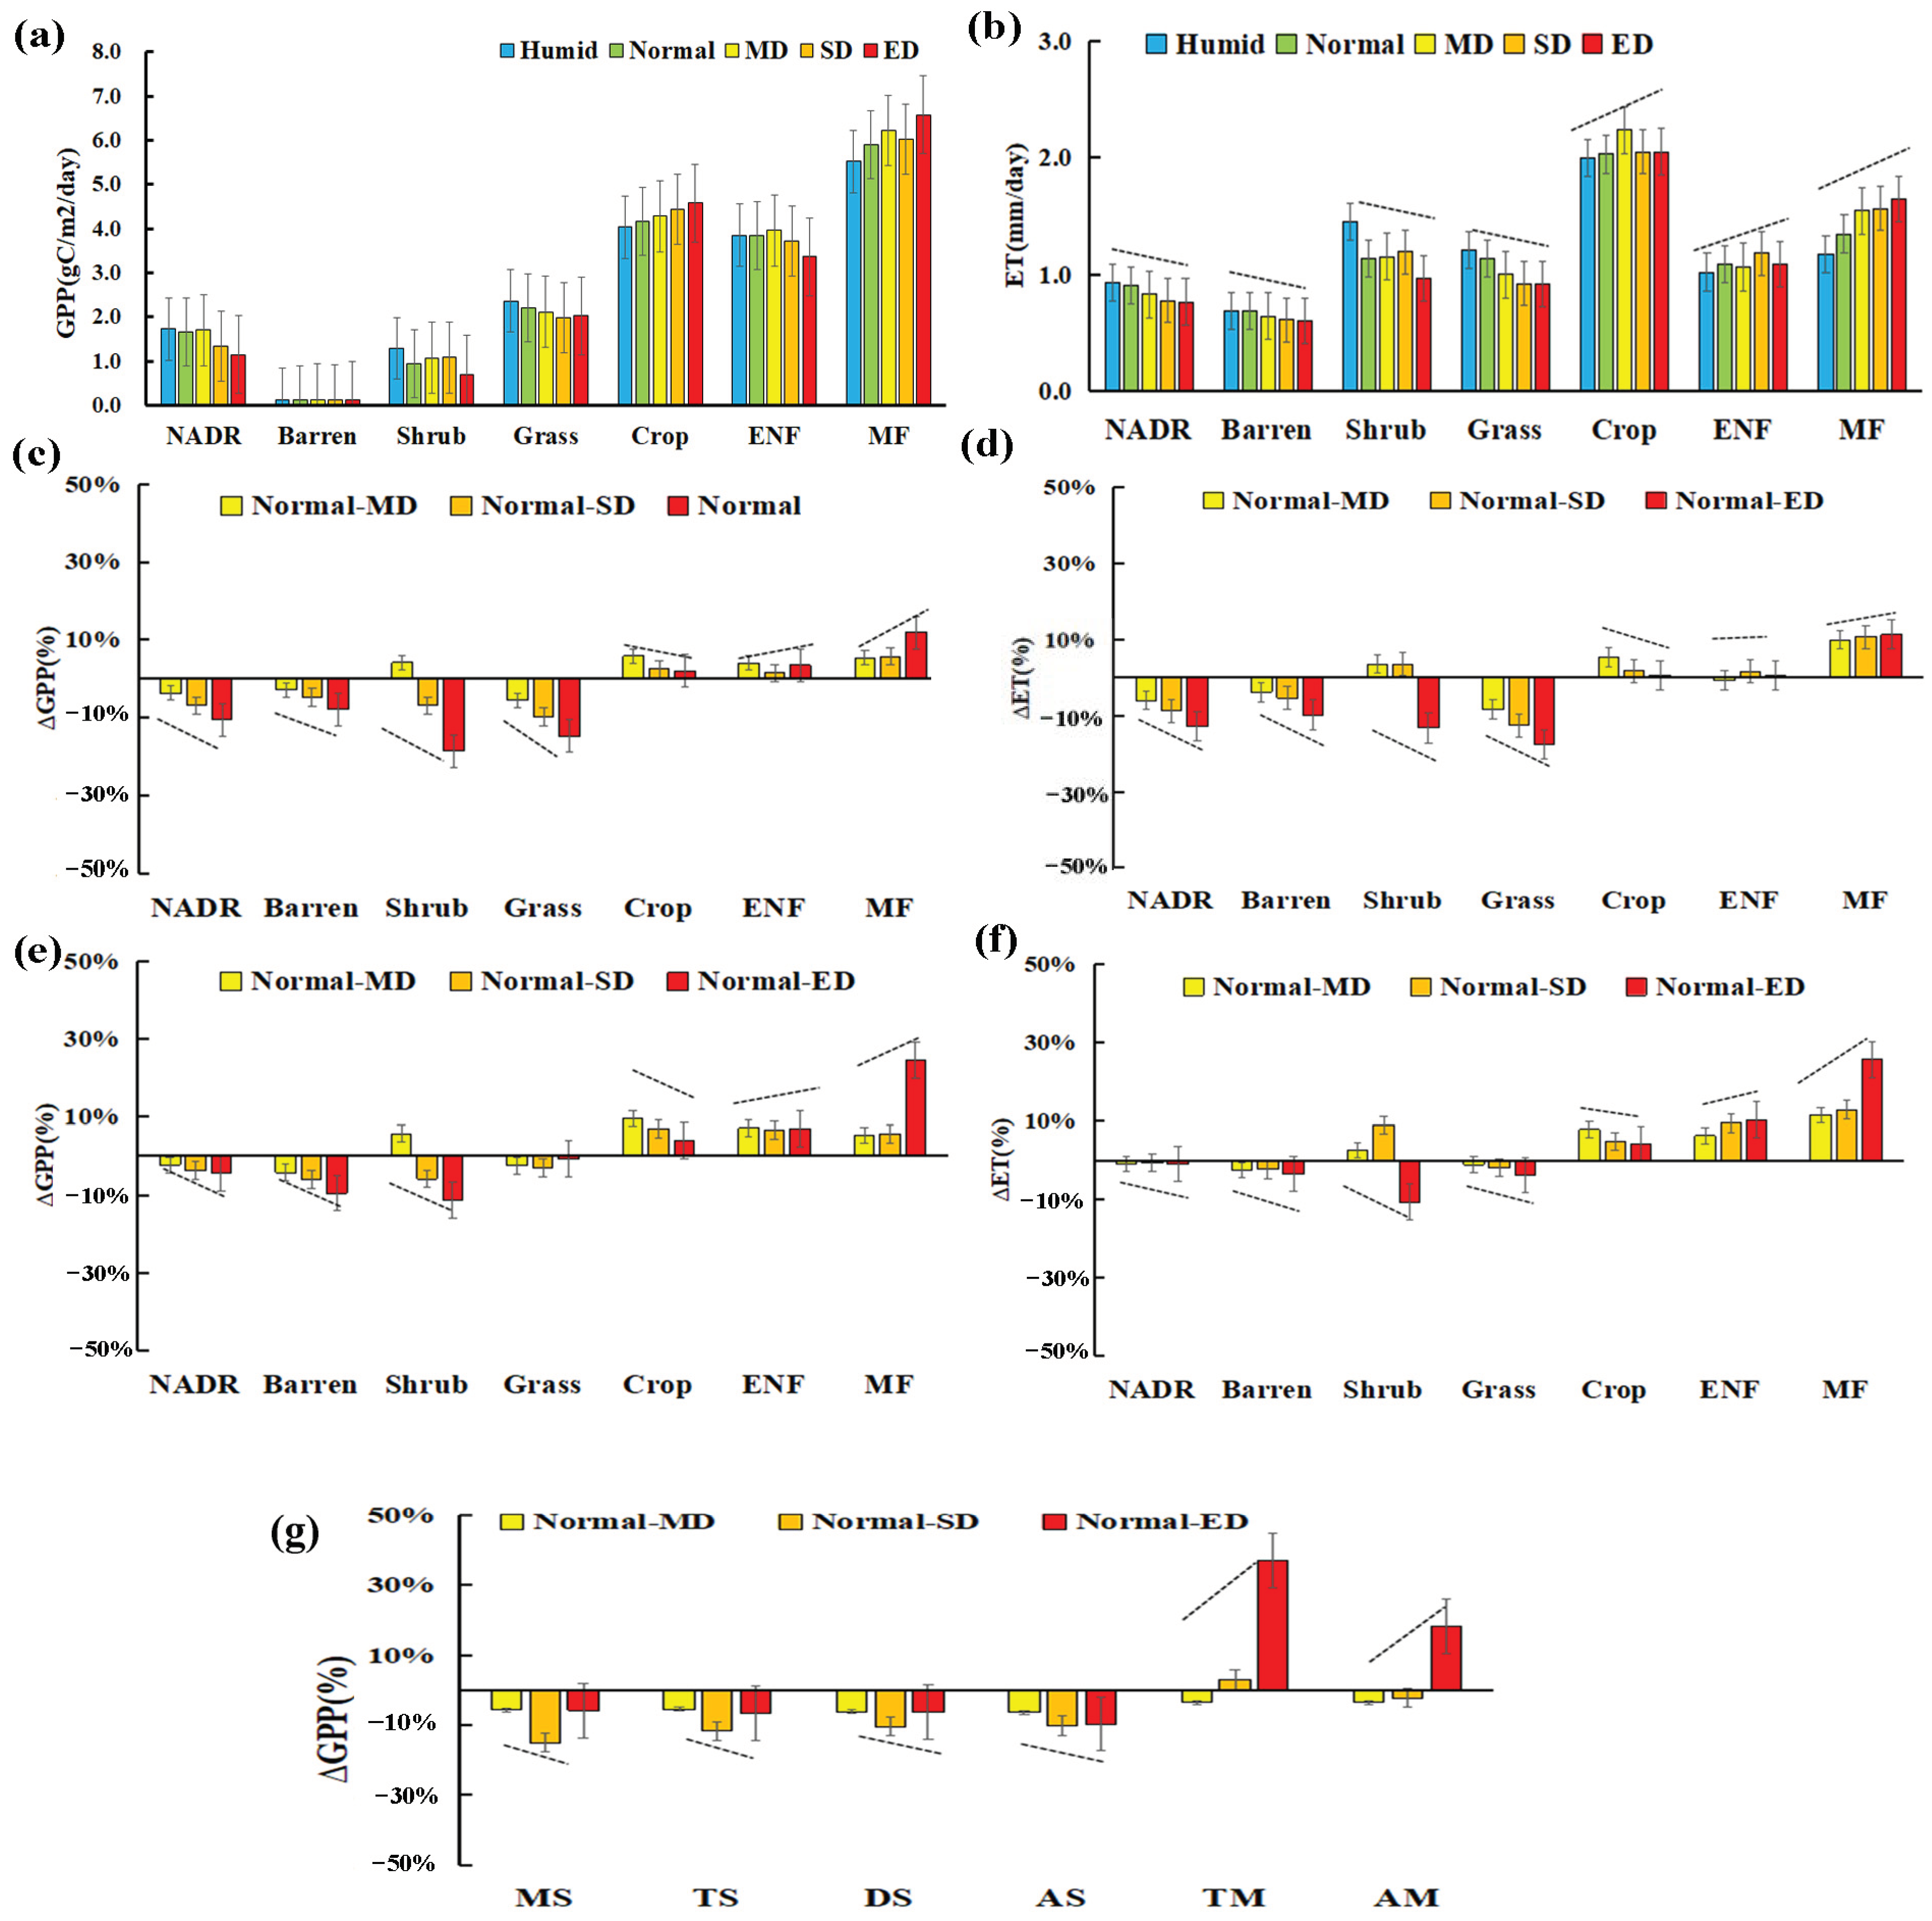
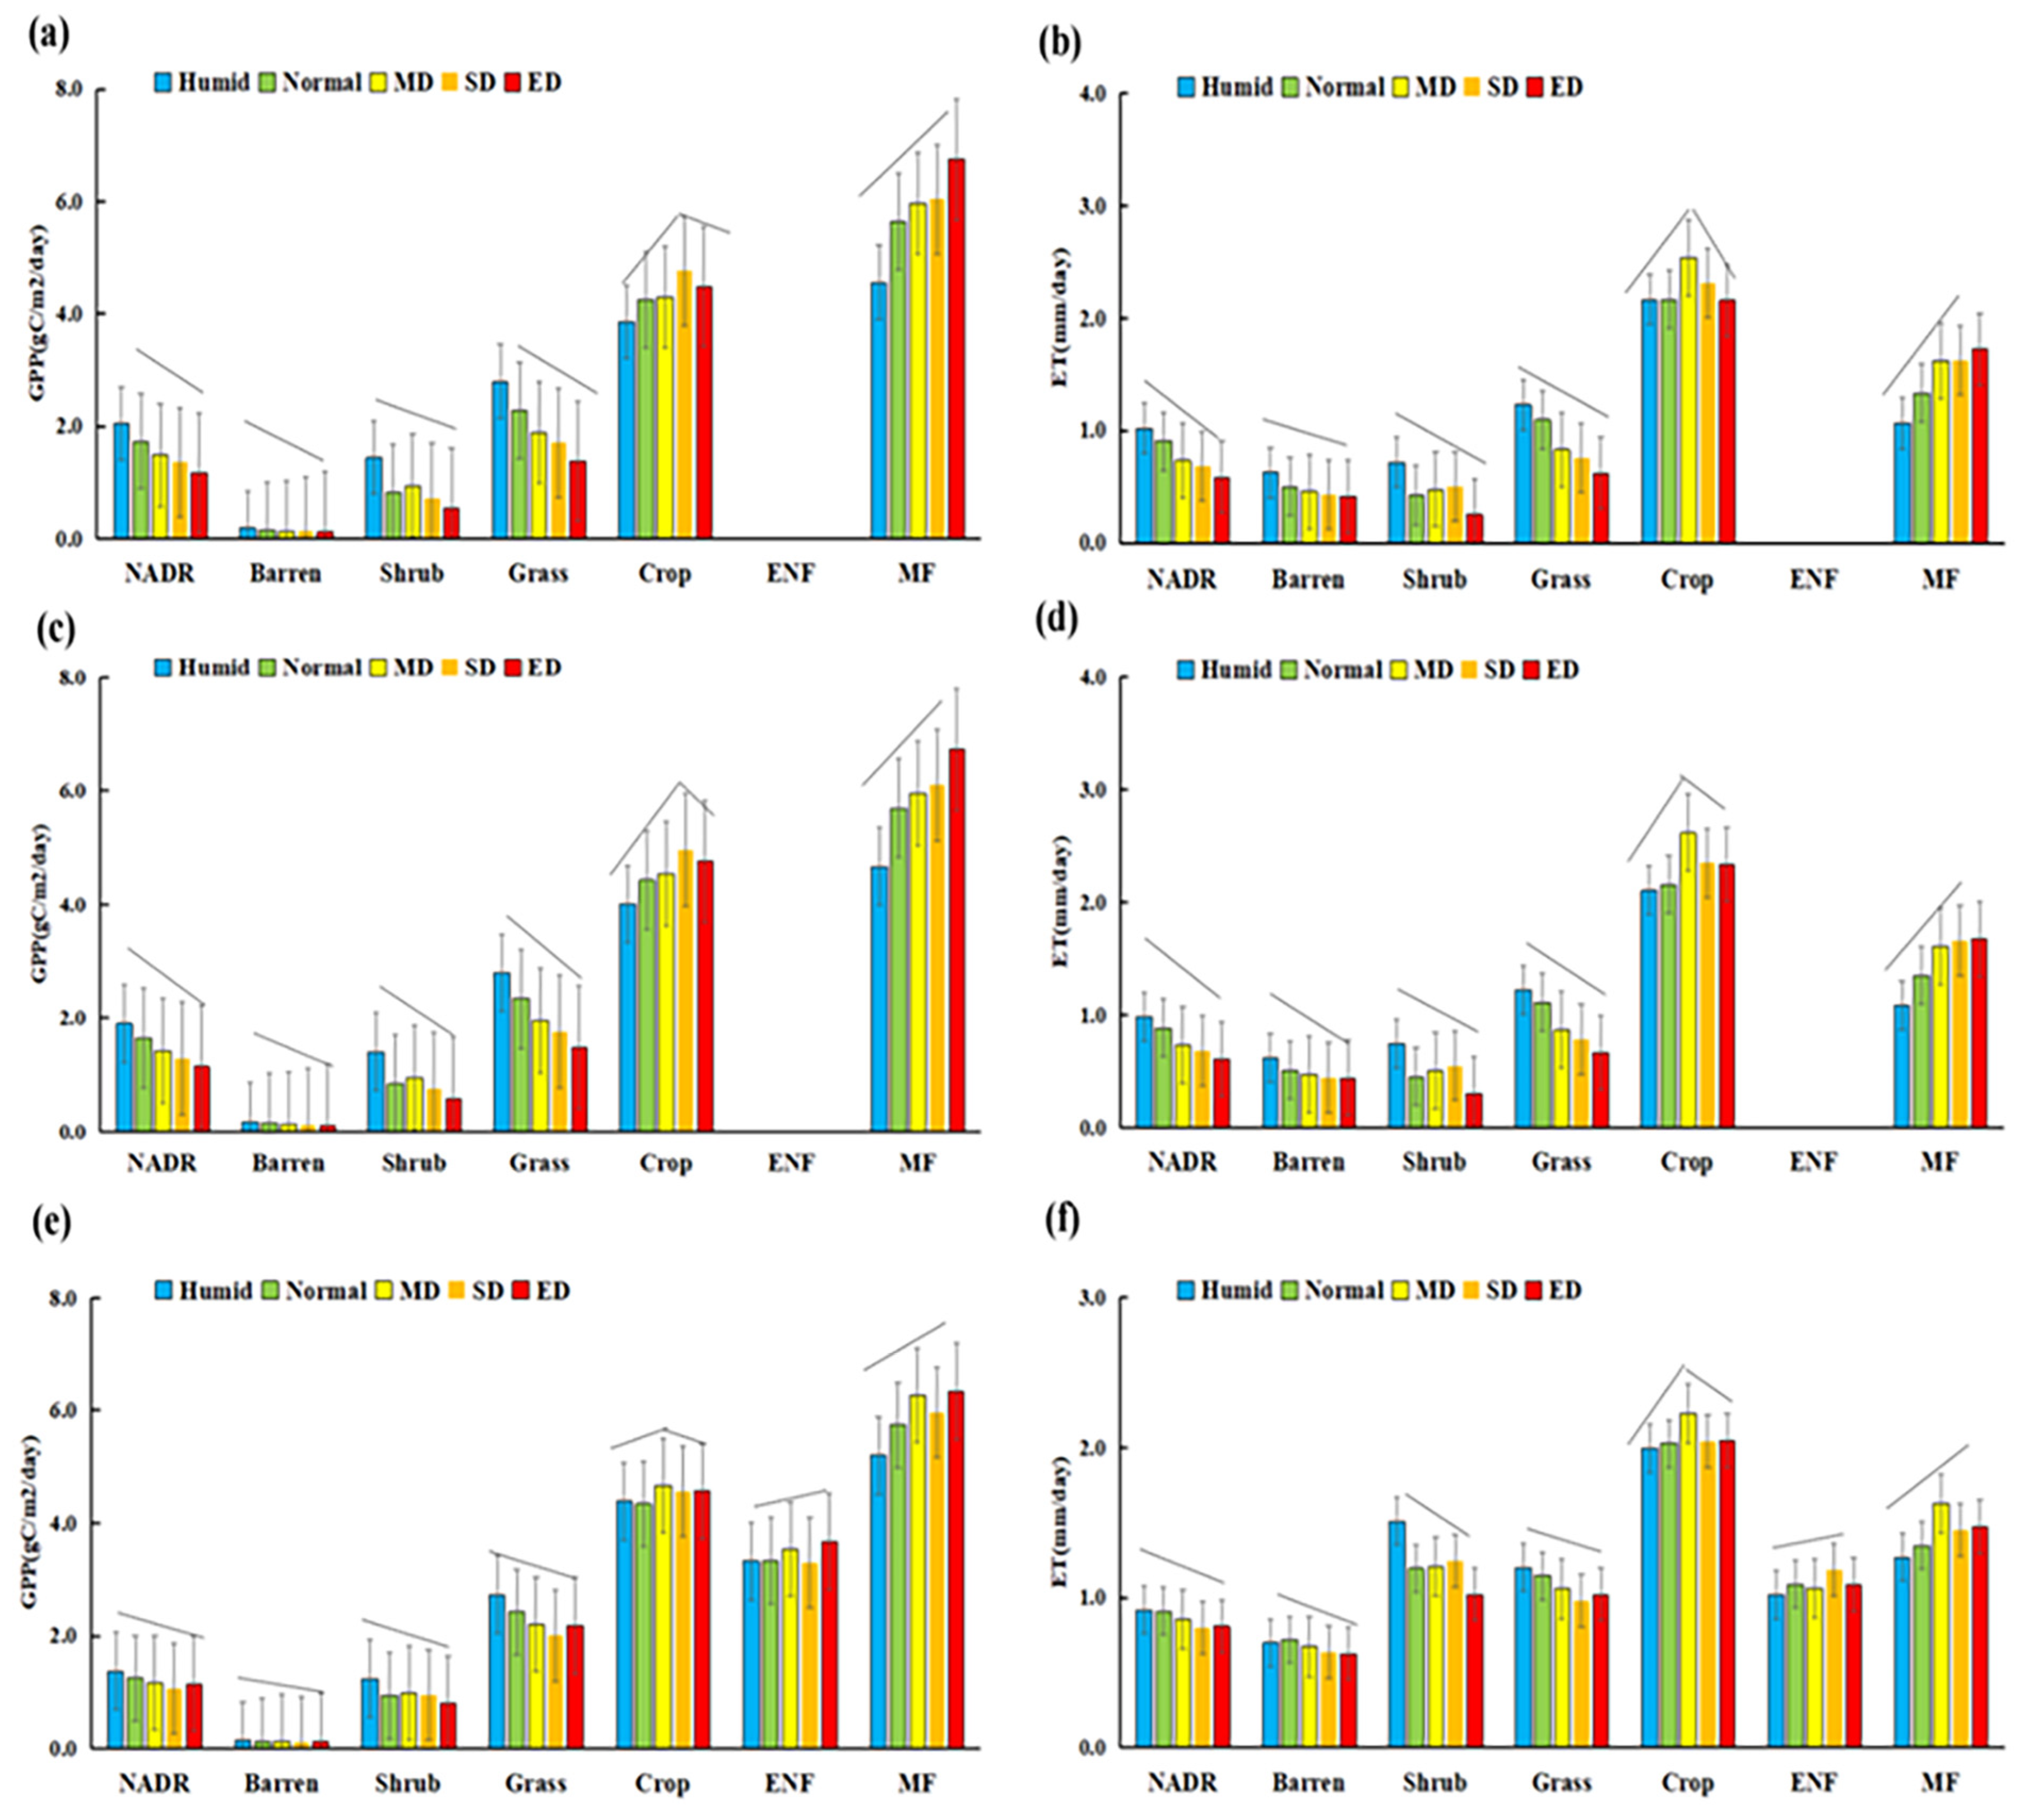
In the whole NADR, with a dryness increase (e.g., from humid to ED summer), the mean value of summer GPP and ET decreased by 0.36 g C m−2 day−1 for GPP and 0.18 mm day−1 for ET. Additionally, the sensitivity of GPP and ET to summer drought also depends on biomes. As Figure 6 shows, GPP and ET for grassland and barren/sparse vegetation also decreased with increased dryness, while cropland and mixed forest presented opposite trends. Figure 6b,c quantified how much the percentage of GPP and ET changed from normal summers to dry summers. In the whole NADR, the difference of GPP (or ET) between normal and moderate summer (Normal-MD, −3.72% for GPP; −5.95% for ET) was less than that between normal and severe, extreme drought summer (Normal-SD: −6.85% for GPP and −8.74% for ET, Normal-ED: −10.54% for GPP and −12.77% for ET). Barren areas and grassland presented similar trends with NADRs by different change rate values, and the larger change rates (Normal-ED: −14.70% for GPP and −17.58% for ET) occurred in grassland, whereas cropland, ENF and MF have opposite trends. GPP and ET of MF increased 11.89% and 11.34% from a normal to extreme drought summer, respectively. Notably, although GPP (or ET) presented a positive and negative relationship with SPEI for shrubland and cropland, respectively, they first increased then decreased at shrubland (i.e., Normal-MD: +4.13% for GPP, +3.59% for ET; Normal-SD: −18.61% for GPP, −13.24% for ET) and decreased their amplification (i.e., Normal-MD: +5.85% for GPP, +5.29% for ET; Normal-SD: +2.10% for GPP, +0.19% for ET).
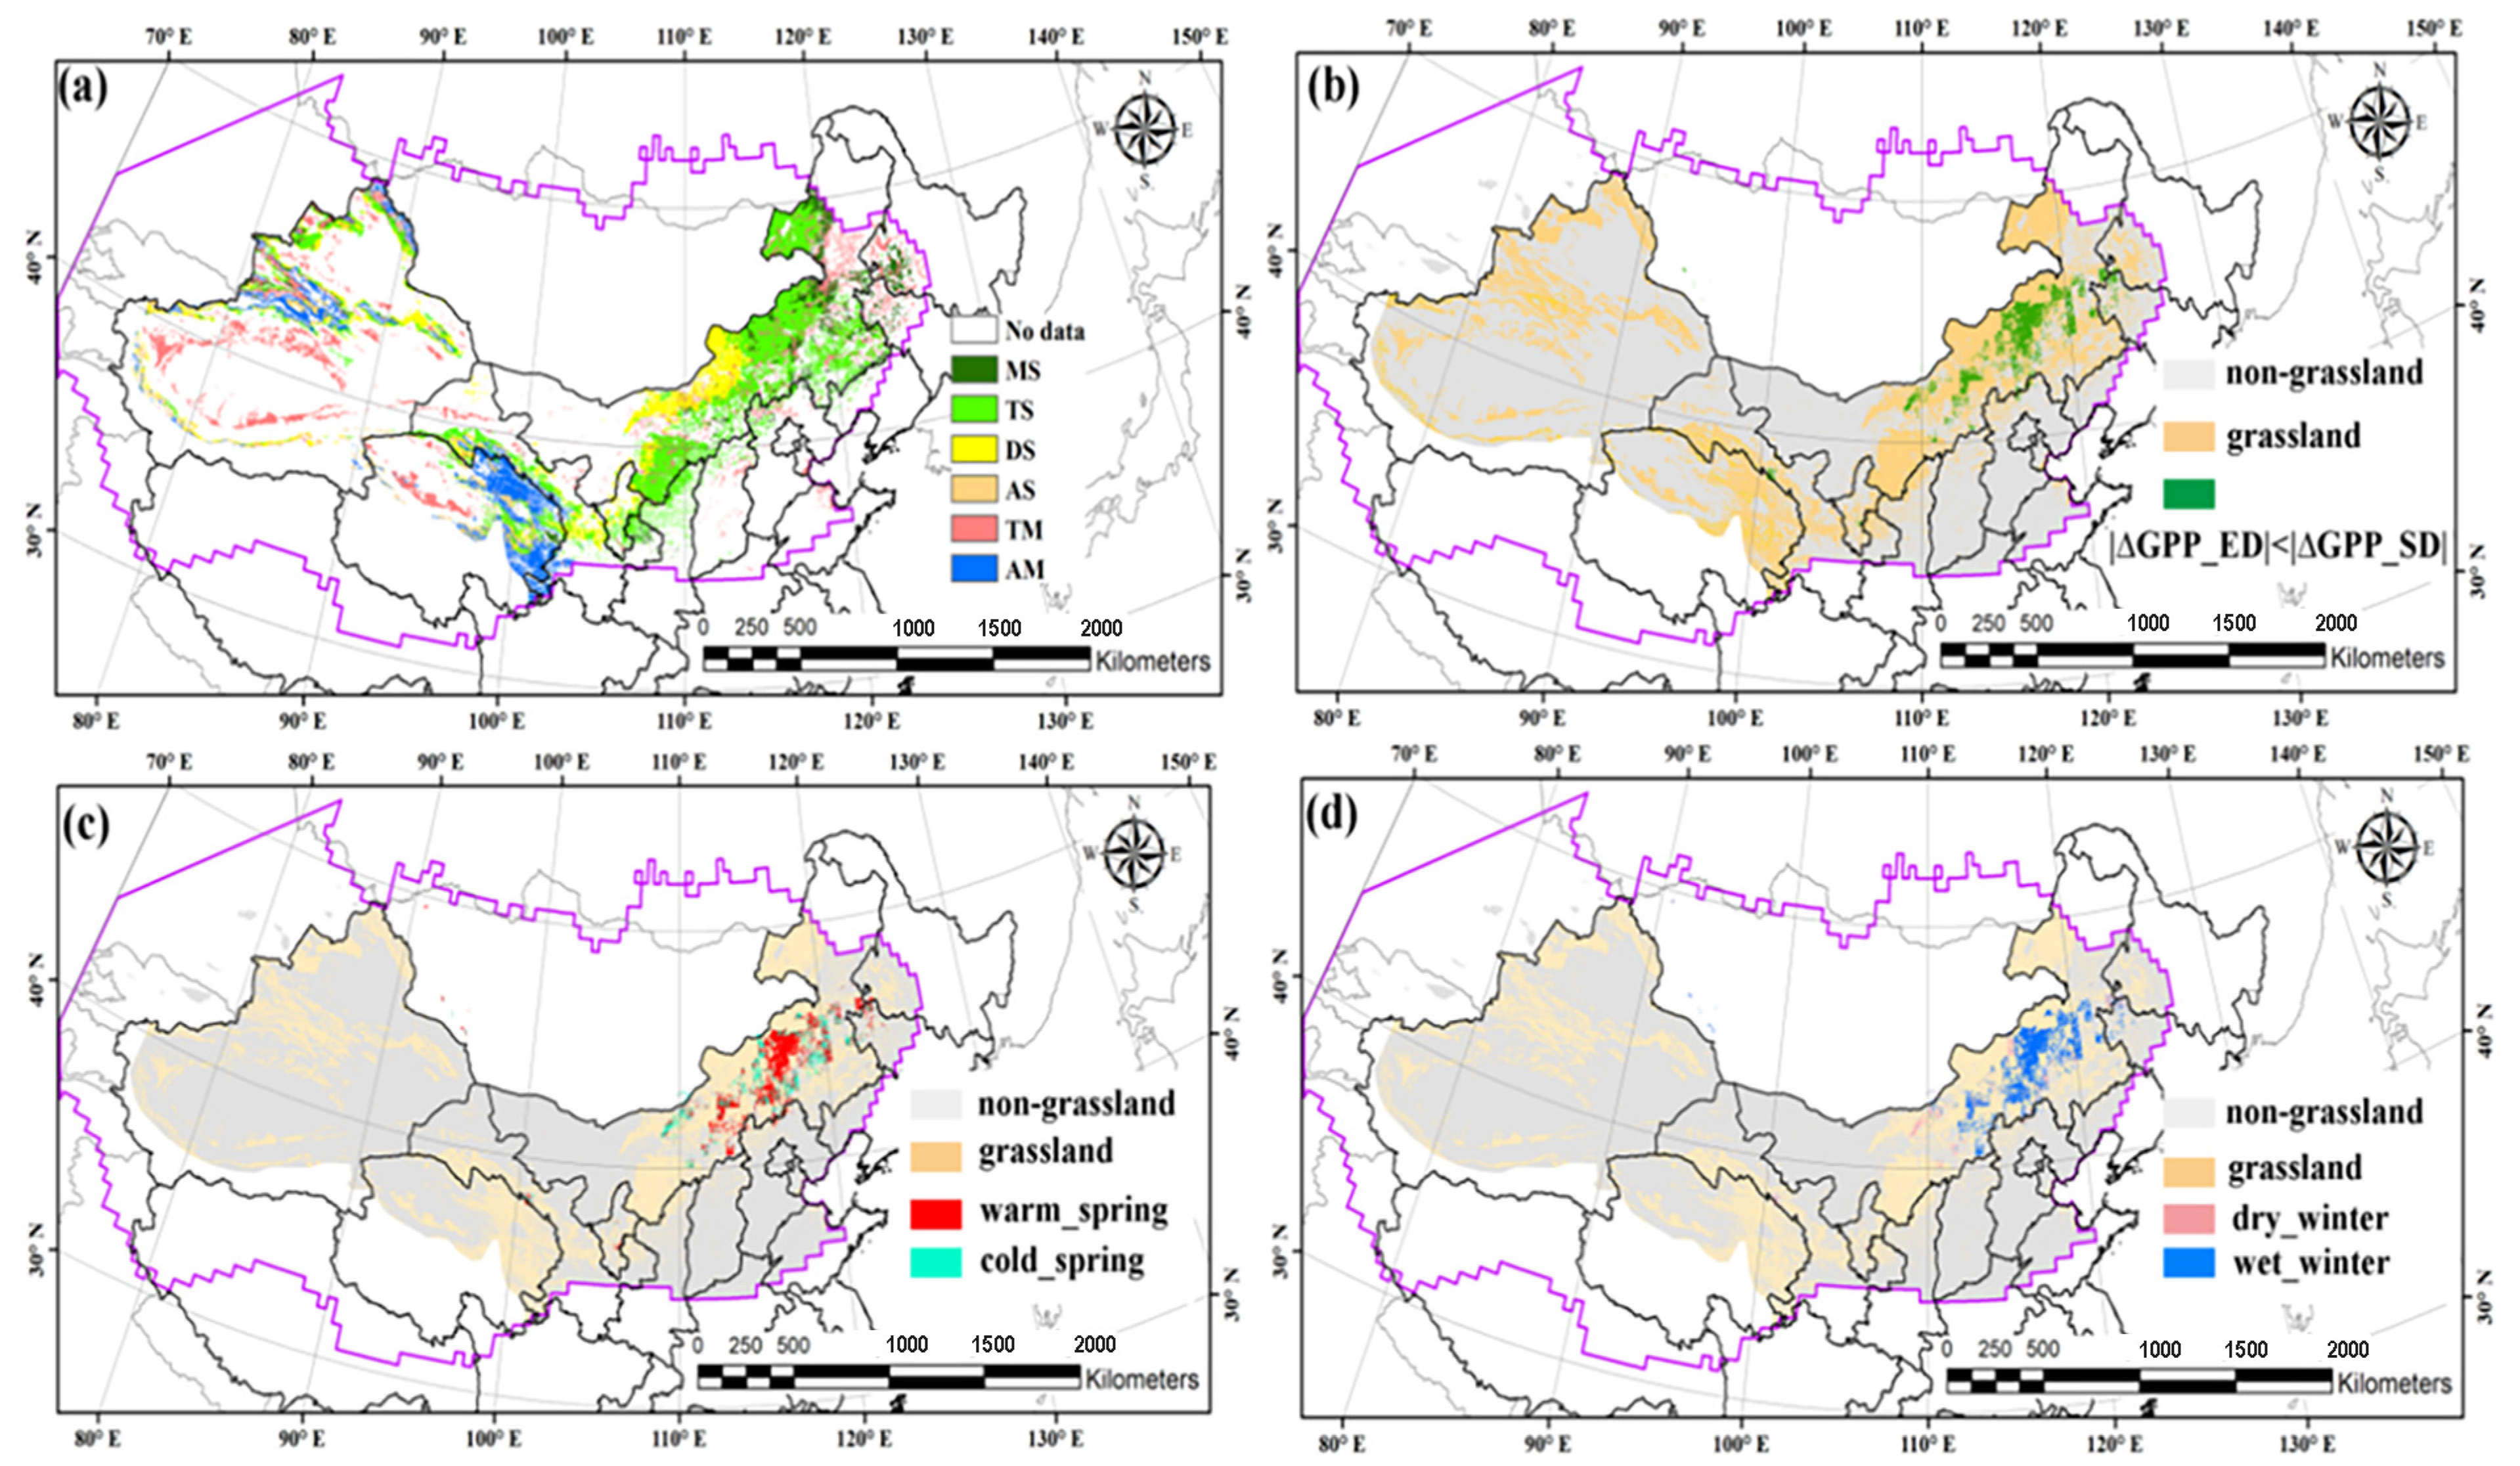
Moreover, the impacts of abrupt dry–wet shifts (e.g., normal summer followed by a dry summer) on GPP and ET were also examined among different biomes (Figure 6e,f), which illustrated the lower change rates (Normal-ED: −4.44% for GPP, −0.92% for ET) but similar trends with multiple drought impacts (Figure 6c,d) in NADRs. Similar results also occurred in almost stable biomes except grassland of GPP (Figure 6e). To account for the difference, we classified the grassland into six sub-classes in China based on vegetation species information and the vegetation map as we mentioned at Section 2.1. The statistics results suggested that the GPP of temperate meadow and alpine meadow increased when the ecosystem experienced a transition from a normal summer to an extreme drought summer (Normal-ED, Figure 6g), which may explain the not obvious changes of grassland GPP in Figure 6e. Notably, the reduction of GPP for MS, TS and DS reached the maximum for the case of transition from a normal summer to a severe drought summer (Normal-SD) and not for an extreme drought summer (Normal-ED).

4. Discussion

4.1. The Diverse Responses of Carbon–Water Process to Summer Drought

Different from most research results, our results suggest that the responses of GPP and ET to summer drought differ substantially among biome types (Figure 5), which agrees with Wu and Chen [56]. The diverse response might result from the different main limited factors for ecosystems. For instance, water plays a key role in the functions and activities of semi-arid grassland regions dominated by herbaceous plants [57,58,59]. During drought, plants reduce enzymatic activities as well as stomatal closure to prevent water loss [60], causing the reduction of the transpiration and photosynthesis rate in grassland (Figure 5), whereas energy supply (or temperature) drives the variation of ecosystem functions largely in high latitude [61] and alpine regions [62]. Less precipitation and cloud cover with more coming solar radiation accelerate the carbon–water process [63,64], which could account for the negative response of GPP and ET to summer drought in mixed forests in cold regions and alpine meadows in Qinghai (Figure 5). The negative effects of drought on productivity for boreal regions are also supported by Zhang et al. [61].
Notably, with significant correlation between GPP (or ET) and SPEI, semi-arid grassland present larger sensitivity to drought than arid regions (Figure 5), which also are found in North America [65] and southeastern Australia [25]. As Vicente-Serrano et al. [66] suggested, the drought timescale determines the sensitivity of biomes to drought, and largely, arid biomes respond to drought at short timescales, while semiarid and sub-humid biomes respond at long timescales due to different root systems. After comparing the relationship between GPP (or ET) and the 1-month scale SPEI value (Figure 7), the sensitivity value gets higher, but the significant area is almost similar with Figure 4. It means that other compensation mechanisms except for drought timescale weaken the impacts of drought in insignificant correlated regions, like different vegetation species physiological responses. For example, on the one hand, the arid desert ecosystems in central Asia dominated by some drought-tolerant species (i.e., Tamarix ramosissima) are more resistant to drought with lengthy root systems to tap deep soil water [67,68]. On the other hand, the ephemerals and annual plants with shallow roots just reserve seeds during drought periods, while flowers grow fast after one or several precipitation events [69], which is difficult to reveal via 1- or 3-month SPEI data [66]. Moreover, some drought-tolerant species with shallow root systems (i.e., Haloxylon ammodendron) maintain photosynthesis but reduce transpiration during drought via effective morphological adjustment (i.e., shrinking shoot size) [64], which explains the different response of GPP and ET to drought in Alashan. In barren areas with very sparse vegetation, like northern Tarim Basin, drought mainly induces the increased soil evaporation rather than vegetation dynamics, which suggest the negative response of ET to drought in these regions. Overall, the insignificant sensitivity to drought in arid ecosystems hinders some compensation mechanisms (i.e., physiological changes of vegetation species to resistant drought), which should be paid much more attention to.

4.2. The Quantitative Evaluation of Summer Drought Impacts on Carbon–Water Process

In NADRs, the difference of average GPP (or ET) between humid and extreme drought summer is near 0.36 g C m−2 day−1 (or 0.18 mm day−1), and GPP (or ET) reduces by nearly 10% (Figure 6c,d) from a normal to extreme drought summer during 2003 to 2015, which is consistent with the global average value [70]. The quantitative impacts of drought were weakened by the insignificant correlations between GPP (or ET) and SPEI. As Figure 8 shows, the difference of GPP (or ET) between humid and extreme drought summer decreases (0.23 g C m−2 day−1 and 0.11 mm day−1, p > 0.10), thus only analyzing the insignificant correlated regions of the NADR.
As for the different biomes, with the increased dryness, the change directions of GPP and ET at grass vegetation decreases and MF regions (Figure 6a–d) agree with the correlation analysis results (Figure 5). However, shrubs and cropland have few different responses with correlation results (Figure 6a–d). For shrubs, due to the root length and small leaf area, the plants with high water use efficiency could continue the photosynthesis and transpiration process to maintain growth during moderate drought [67,68]. Therefore, GPP (or ET) increases a little from normal to MD summers (Figure 6a–d). For cropland, radiation (or temperature) is the main limited factor, which improves the photosynthesis and transpiration process, but photosynthesis rate will not increase when temperature reaches a threshold [71].
Compared with the abrupt shifts during a continuous two years (i.e., a normal summer followed by a dry summer), the persistent or multiple droughts intensify the impacts on the carbon–water process in NADRs with higher change rates (Figure 6c–f). It should be noted that the impacts of abrupt shifts on grassland GPP are a little different due to the different response of steppe types (Figure 6f). However, the transition from a normal summer to an extreme drought summer did not reduce GPP seriously in meadow steppe, temperate steppe and desert steppe, which disagrees with correlation analysis and common knowledge. Fortunately, we noted that the extreme summers were not frequent (1 to 3 times, Figure 4c) and there is a wet winter and warm spring before extreme summer in the grassland of China (Figure 9). It means that the previous wet winter and warm spring weakens the summer drought impacts on vegetation production, which is also verified in the US [72], because the precipitation in winter could be stored in the soil to support plant growth in the spring [73] and warm spring increases ET and carbon uptake to compensate for the GPP reduction during extreme summer drought [72]. Overall, the wet winter and spring weakens the summer drought impacts on GPP in NADR grassland.

4.3. The Advantages and Disadvantages of This Study

Based on the above analysis, the responses of carbon–water processes to summer droughts have been revealed deeply. Not only were different biomes but also the abrupt wet–dry shifts and drought timescale were taken into consideration to explore the response mechanisms. Meanwhile, the lower sensitivity of GPP and ET to summer droughts was also discussed with some compensation mechanisms. However, some disadvantages should be paid attention to. For example, the accuracy of GPP and ET in barren areas or low-NDVI regions was limited by the satellite sensor. Next, the seasonal differences of carbon–water process to droughts should be analyzed in depth.

5. Conclusions

Through the impacts analysis of summer droughts to GPP and ET, we found that the impacts are diverse and depend on the biome types, the significant relationship between the carbon–water process and drought, and drought timescale. Generally, during summer drought, grassland, barren/sparse vegetation and shrub reduce the GPP (or ET), while cropland and forest regions improve GPP (or ET) due to different main limited factors. And the arid barren/sparse vegetation exhibit smaller sensitivity to droughts than semi-arid grassland due to some compensation mechanisms, which weakens the summer drought impacts on the carbon–water process. Whereas, compared with abrupt wet–dry shifts, persistent or multiple droughts intensify the impacts on the carbon–water process in NADRs with higher change rates. Notably, the wet winter and warm spring weaken the summer drought impacts on GPP in some parts of grasslands. In summary, the response mechanism of carbon–water processes to summer drought is complex but could help us to analyze and account for the dynamics of ecosystem water use efficiency during drought disturbance in further research. Also, this study is conducive to making measures or actionable recommendations for policymakers or land managers dealing with dryland ecosystems.

Supplementary Materials

The following supporting information can be downloaded at https://www.mdpi.com/article/10.3390/rs17040589/s1, Figure S1: Comparison of (a) GPP_model data and (b) ET_model data with flux tower measurements. Dashed line is the 1:1 line and solid line indicates the best linear fit curve.; Table S1: Summary of climate and vegetation characteristics of the 8 tower sites; Table S2: Statistics for the modeled GPP, ET (GPP_Model, ET_Model) with tower-measured GPP (GPP_Obs) and ET (ET_Obs) at the 8 study sites.

Author Contributions

Writing—original draft preparation, W.K.; writing—review and editing, S.L.; supervision, S.K. and T.W. All authors have read and agreed to the published version of the manuscript.

Funding

This research was funded by the National Natural Science Foundation of China (NSFC), grant number 42107499.

Data Availability Statement

The MODIS data products could be found in MODIS Web https://modis.gsfc.nasa.gov/data/ (accessed on 27 January 2025); The SPEI dataset can be found from https://spei.csic.es/database.html (accessed on 27 January 2025).

Conflicts of Interest

The authors declare no conflicts of interest.

Abbreviations

The following abbreviations are used in this manuscript:
GPPGross Primary Productivity
ETEvapotranspiration
NADRNortheast Asia Dryland Regions
VPMVegetation Photosynthesis Model
PMPenman–Monteith model
SPEIStandardized Precipitation Evapotranspiration Index
ASAlpine steppe
AMAlpine meadow
DSDesert steppe
TSTypical steppe
MSMeadow steppe
TMTemperate meadow

References

  1. Sheffield, J.; Wood, E.F. Projected changes in drought occurrence under future global warming from multi-model, multi-scenario, IPCC AR4 simulations. Clim. Dyn. 2008, 31, 79–105. [Google Scholar] [CrossRef]
  2. Dai, A. Increasing drought under global warming in observations and models. Nat. Clim. Change 2013, 3, 52. [Google Scholar] [CrossRef]
  3. Dai, A. Drought under global warming: A review. Wiley Interdiscip. Rev. Clim. Change 2011, 2, 45–65. [Google Scholar] [CrossRef]
  4. IPCC. Climate Change 2021: The Physical Science Basis. Contribution of Working Group I to the Sixth Assessment Report of the Intergovernmental Panel on Climate Change; IPCC: Cambridge, UK; New York, NY, USA, 2021. [Google Scholar]
  5. Schlaepfer, D.R.; Bradford, J.B.; Lauenroth, W.K.; Munson, S.M.; Tietjen, B.; Hall, S.A.; Wilson, S.D.; Duniway, M.C.; Jia, G.; Pyke, D.A. Climate change reduces extent of temperate drylands and intensifies drought in deep soils. Nat. Commun. 2017, 8, 14196. [Google Scholar] [CrossRef]
  6. Smith, W.K.; Dannenberg, M.P.; Yan, D.; Herrmann, S.; Barnes, M.L.; Barron-Gafford, G.A.; Biederman, J.A.; Ferrenberg, S.; Fox, A.M.; Hudson, A.; et al. Remote sensing of dryland ecosystem structure and function: Progress, challenges, and opportunities. Remote Sens. Environ. 2019, 233, 111401. [Google Scholar] [CrossRef]
  7. Liu, D.; Estiarte, M.; Ogaya, R.; Yang, X.; Peñuelas, J. Shift in community structure in an early-successional Mediterranean shrubland driven by long-term experimental warming and drought and natural extreme droughts. Glob. Change Biol. 2017, 23, 4267–4279. [Google Scholar] [CrossRef]
  8. Griffin-Nolan, R.J.; Blumenthal, D.M.; Collins, S.L.; Farkas, T.E.; Hoffman, A.M.; Mueller, K.E.; Ocheltree, T.W.; Smith, M.D.; Whitney, K.D.; Knapp, A.K.; et al. Shifts in plant functional composition following long-term drought in grasslands. J. Ecol. 2019, 107, 2133–2148. [Google Scholar] [CrossRef]
  9. Saatchi, S.; Asefi-Najafabady, S.; Malhi, Y.; Aragão, L.E.; Anderson, L.O.; Myneni, R.B.; Nemani, R. Persistent effects of a severe drought on Amazonian forest canopy. Proc. Natl. Acad. Sci. USA 2013, 110, 565–570. [Google Scholar] [CrossRef] [PubMed]
  10. Zhang, Y.; Keenan, T.F.; Zhou, S. Exacerbated drought impacts on global ecosystems due to structural overshoot. Nat. Ecol. Evol. 2021, 5, 1490–1498. [Google Scholar] [CrossRef] [PubMed]
  11. van der Molen, M.K.; Dolman, A.J.; Ciais, P.; Eglin, T.; Gobron, N.; Law, B.E.; Meir, P.; Peters, W.; Phillips, O.L.; Reichstein, M. Drought and ecosystem carbon cycling. Agric. For. Meteorol. 2011, 151, 765–773. [Google Scholar] [CrossRef]
  12. Reichstein, M.; Bahn, M.; Ciais, P.; Frank, D.; Mahecha, M.D.; Seneviratne, S.I.; Zscheischler, J.; Beer, C.; Buchmann, N.; Frank, D.C. Climate extremes and the carbon cycle. Nature 2013, 500, 287. [Google Scholar] [CrossRef]
  13. Xu, H.; Wang, X.; Zhao, C.; Zhang, X. Responses of ecosystem water use efficiency to meteorological drought under different biomes and drought magnitudes in northern China. Agric. For. Meteorol. 2019, 278, 107660. [Google Scholar] [CrossRef]
  14. Ciais, P.; Reichstein, M.; Viovy, N.; Granier, A.; Ogée, J.; Allard, V.; Aubinet, M.; Buchmann, N.; Bernhofer, C.; Carrara, A. Europe-wide reduction in primary productivity caused by the heat and drought in 2003. Nature 2005, 437, 529. [Google Scholar] [CrossRef] [PubMed]
  15. Zhao, M.; Running, S.W. Drought-induced reduction in global terrestrial net primary production from 2000 through 2009. Science 2010, 329, 940–943. [Google Scholar] [CrossRef]
  16. Yang, Y.; Long, D.; Guan, H.; Scanlon, B.R.; Simmons, C.T.; Jiang, L.; Xu, X. GRACE satellite observed hydrological controls on interannual and seasonal variability in surface greenness over mainland Australia. J. Geophys. Res. Biogeosci. 2014, 119, 2245–2260. [Google Scholar] [CrossRef]
  17. Du, L.; Mikle, N.; Zou, Z.; Huang, Y.; Shi, Z.; Jiang, L.; McCarthy, H.R.; Liang, J.; Luo, Y. Global patterns of extreme drought-induced loss in land primary production: Identifying ecological extremes from rain-use efficiency. Sci. Total Environ. 2018, 628, 611–620. [Google Scholar] [CrossRef]
  18. Stocker, B.D.; Zscheischler, J.; Keenan, T.F.; Prentice, I.C.; Seneviratne, S.I.; Peñuelas, J. Drought impacts on terrestrial primary production underestimated by satellite monitoring. Nat. Geosci. 2019, 12, 264–270. [Google Scholar] [CrossRef]
  19. Jung, M.; Reichstein, M.; Ciais, P.; Seneviratne, S.I.; Sheffield, J.; Goulden, M.L.; Bonan, G.; Cescatti, A.; Chen, J.; De Jeu, R. Recent decline in the global land evapotranspiration trend due to limited moisture supply. Nature 2010, 467, 951. [Google Scholar] [CrossRef] [PubMed]
  20. Miralles, D.G.; Van Den Berg, M.J.; Gash, J.H.; Parinussa, R.M.; De Jeu, R.A.; Beck, H.E.; Holmes, T.R.; Jiménez, C.; Verhoest, N.E.; Dorigo, W.A. El Niño–La Niña cycle and recent trends in continental evaporation. Nat. Clim. Change 2014, 4, 122. [Google Scholar] [CrossRef]
  21. Zhao, M.; A, G.; Liu, Y.; Konings, A.G. Evapotranspiration frequently increases during droughts. Nat. Clim. Change 2022, 12, 1024–1030. [Google Scholar] [CrossRef]
  22. Huang, M.; Zhai, P. Impact of extreme seasonal drought on ecosystem carbon–water coupling across China. Adv. Clim. Change Res. 2024, 15, 914–923. [Google Scholar] [CrossRef]
  23. Ma, J.; Jia, X.; Zha, T.; Bourque, C.P.A.; Tian, Y.; Bai, Y.; Liu, P.; Yang, R.; Li, C.; Li, C.; et al. Ecosystem water use efficiency in a young plantation in Northern China and its relationship to drought. Agric. For. Meteorol. 2019, 275, 1–10. [Google Scholar] [CrossRef]
  24. Liu, P.; Zha, T.; Jia, X.; Black, T.A.; Jassal, R.S.; Ma, J.; Bai, Y.; Wu, Y. Different Effects of Spring and Summer Droughts on Ecosystem Carbon and Water Exchanges in a Semiarid Shrubland Ecosystem in Northwest China. Ecosystems 2019, 22, 1869–1885. [Google Scholar] [CrossRef]
  25. Ma, X.; Huete, A.; Moran, S.; Ponce-Campos, G.; Eamus, D. Abrupt shifts in phenology and vegetation productivity under climate extremes. J. Geophys. Res. Biogeosci. 2015, 120, 2036–2052. [Google Scholar] [CrossRef]
  26. Smith, M.D. An ecological perspective on extreme climatic events: A synthetic definition and framework to guide future research. J. Ecol. 2011, 99, 656–663. [Google Scholar] [CrossRef]
  27. Zhang, L.; Xiao, J.; Zhou, Y.; Zheng, Y.; Li, J.; Xiao, H. Drought events and their effects on vegetation productivity in China. Ecosphere 2016, 7, e01591. [Google Scholar] [CrossRef]
  28. Chen, T.; Van der Werf, G.; De Jeu, R.; Wang, G.; Dolman, A. A global analysis of the impact of drought on net primary productivity. Hydrol. Earth Syst. Sci. 2013, 17, 3885–3894. [Google Scholar] [CrossRef]
  29. Pei, T.; Hou, Q.; Chen, Y.; Ji, Z.; Wu, H.; Xie, B.; Qi, P.; Zhang, J. Vegetation in Arid Areas of the Loess Plateau Showed More Sensitivity of Water-Use Efficiency to Seasonal Drought. Forests 2022, 13, 634. [Google Scholar] [CrossRef]
  30. Yang, F.; Zhou, G. Sensitivity of temperate desert steppe carbon exchange to seasonal droughts and precipitation variations in Inner Mongolia, China. PLoS ONE 2013, 8, e55418. [Google Scholar] [CrossRef]
  31. Jongen, M.; Pereira, J.S.; Aires, L.M.I.; Pio, C.A. The effects of drought and timing of precipitation on the inter-annual variation in ecosystem-atmosphere exchange in a Mediterranean grassland. Agric. For. Meteorol. 2011, 151, 595–606. [Google Scholar] [CrossRef]
  32. Carroll, C.J.W.; Slette, I.J.; Griffin-Nolan, R.J.; Baur, L.E.; Hoffman, A.M.; Denton, E.M.; Gray, J.E.; Post, A.K.; Johnston, M.K.; Yu, Q.; et al. Is a drought a drought in grasslands? Productivity responses to different types of drought. Oecologia 2021, 197, 1017–1026. [Google Scholar] [CrossRef] [PubMed]
  33. Gong, Y.Q.; Yu, H.P.; Zhou, J.; Ren, Y.; Wei, Y.; Cheng, S.L.; Yang, Y.X.; Luo, H.Y. Review on Water Vapor Sources in Drylands of East Asia. Adv. Earth Sci. 2023, 38, 168. [Google Scholar]
  34. Zhang, P.; Jeong, J.H.; Yoon, J.H.; Kim, H.; Wang, S.Y.S.; Linderholm, H.W.; Fang, K.; Wu, X.; Chen, D. Abrupt shift to hotter and drier climate over inner East Asia beyond the tipping point. Science 2020, 370, 1095–1099. [Google Scholar] [CrossRef] [PubMed]
  35. Ma, Y.T.; Chen, H.S.; Song, Y.M.; Zhou, B.T.; Sun, S.L.; Du, X.G.; Sun, Y. Persistent greening against drying in northeast Asian semiarid grasslands: Asymmetrical responses of direct and legacy effects to intensified drought. Adv. Clim. Change Res. 2024, 15, 9–20. [Google Scholar] [CrossRef]
  36. Saigusa, N.; Ichii, K.; Murakami, H.; Hirata, R.; Asanuma, J.; Den, H.; Han, S.J.; Ide, R.; Li, S.G.; Ohta, T. Impact of meteorological anomalies in the 2003 summer on Gross Primary Productivity in East Asia. Biogeosciences 2010, 7, 641–655. [Google Scholar] [CrossRef]
  37. Kang, W.; Kang, S. On the use of alternative water use efficiency parameters in dryland ecosystems: A review. J. Ecol. Environ. 2019, 43, 24. [Google Scholar] [CrossRef]
  38. UNEP. World Atlas of Desertification; UNEP: Nairobi, Kenya, 1992. [Google Scholar]
  39. Qi, J.; Chen, J.; Wan, S.; Ai, L. Understanding the coupled natural and human systems in Dryland East Asia. Environ. Res. Lett. 2012, 7, 015202. [Google Scholar] [CrossRef]
  40. Gu, X.; Li, W.; Wang, L. Understanding vegetation changes in northern China and Mongolia with change vector analysis. SpringerPlus 2016, 5, 1780. [Google Scholar] [CrossRef] [PubMed]
  41. Yang, Y.; Fang, J.; Fay, P.A.; Bell, J.E.; Ji, C. Rain use efficiency across a precipitation gradient on the Tibetan Plateau. Geophys. Res. Lett. 2010, 37, L15702. [Google Scholar] [CrossRef]
  42. Guo, Q.; Hu, Z.; Li, S.; Li, X.; Sun, X.; Yu, G. Spatial variations in aboveground net primary productivity along a climate gradient in Eurasian temperate grassland: Effects of mean annual precipitation and its seasonal distribution. Glob. Change Biol. 2012, 18, 3624–3631. [Google Scholar] [CrossRef]
  43. Sun, J.; Du, W. Effects of precipitation and temperature on net primary productivity and precipitation use efficiency across China’s grasslands. GIScience Remote Sens. 2017, 54, 881–897. [Google Scholar] [CrossRef]
  44. Zhang, L.-X.; Zhou, D.-C.; Fan, J.-W.; Hu, Z.-M. Comparison of four light use efficiency models for estimating terrestrial gross primary production. Ecol. Model. 2015, 300, 30–39. [Google Scholar] [CrossRef]
  45. Xiao, X.; Hollinger, D.; Aber, J.; Goltz, M.; Davidson, E.A.; Zhang, Q.; Moore III, B. Satellite-based modeling of gross primary production in an evergreen needleleaf forest. Remote Sens. Environ. 2004, 89, 519–534. [Google Scholar] [CrossRef]
  46. Jang, K.; Kang, S.; Lim, Y.J.; Jeong, S.; Kim, J.; Kimball, J.S.; Hong, S.Y. Monitoring daily evapotranspiration in Northeast Asia using MODIS and a regional Land Data Assimilation System. J. Geophys. Res. Atmos. 2013, 118, 12927–12940. [Google Scholar] [CrossRef]
  47. Sheffield, J.; Ferguson, C.R.; Troy, T.J.; Wood, E.F.; McCabe, M.F. Closing the terrestrial water budget from satellite remote sensing. Geophys. Res. Lett. 2009, 36, L07403. [Google Scholar] [CrossRef]
  48. Yuan, W.; Liu, S.; Yu, G.; Bonnefond, J.-M.; Chen, J.; Davis, K.; Desai, A.R.; Goldstein, A.H.; Gianelle, D.; Rossi, F. Global estimates of evapotranspiration and gross primary production based on MODIS and global meteorology data. Remote Sens. Environ. 2010, 114, 1416–1431. [Google Scholar] [CrossRef]
  49. Jang, K.; Kang, S.; Kim, J.; Lee, C.B.; Kim, T.; Kim, J.; Hirata, R.; Saigusa, N. Mapping evapotranspiration using MODIS and MM5 four-dimensional data assimilation. Remote Sens. Environ. 2010, 114, 657–673. [Google Scholar] [CrossRef]
  50. Heinsch, F.A.; Reeves, M.; Votava, P.; Kang, S.; Milesi, C.; Zhao, M.; Glassy, J.; Jolly, W.M.; Loehman, R.; Bowker, C.F. User’s Guide GPP and NPP (MOD17A2/A3) Products NASA MODIS Land Algorithm; MODIS Land Team: Washington, DC, USA, 2003; pp. 1–57. [Google Scholar]
  51. Running, S.W.; Thornton, P.E.; Nemani, R.; Glassy, J.M. Global terrestrial gross and net primary productivity from the Earth Observing System. In Methods in Ecosystem Science; Springer: Berlin/Heidelberg, Germany, 2000; pp. 44–57. [Google Scholar]
  52. Vicente-Serrano, S.M.; Beguería, S.; López-Moreno, J.I. A multiscalar drought index sensitive to global warming: The standardized precipitation evapotranspiration index. J. Clim. 2010, 23, 1696–1718. [Google Scholar] [CrossRef]
  53. Vicente-Serrano, S.M.; Beguería, S.; Lorenzo-Lacruz, J.; Camarero, J.J.; López-Moreno, J.I.; Azorin-Molina, C.; Revuelto, J.; Morán-Tejeda, E.; Sanchez-Lorenzo, A. Performance of drought indices for ecological, agricultural, and hydrological applications. Earth Interact. 2012, 16, 1–27. [Google Scholar] [CrossRef]
  54. Beguería, S.; Vicente-Serrano, S.M.; Reig, F.; Latorre, B. Standardized precipitation evapotranspiration index (SPEI) revisited: Parameter fitting, evapotranspiration models, tools, datasets and drought monitoring. Int. J. Climatol. 2014, 34, 3001–3023. [Google Scholar] [CrossRef]
  55. Fensholt, R.; Rasmussen, K.; Kaspersen, P.; Huber, S.; Horion, S.; Swinnen, E. Assessing land degradation/recovery in the African Sahel from long-term earth observation based primary productivity and precipitation relationships. Remote Sens. 2013, 5, 664–686. [Google Scholar] [CrossRef]
  56. Wu, C.; Chen, J.M. Diverse responses of vegetation production to interannual summer drought in North America. Int. J. Appl. Earth Obs. Geoinf. 2013, 21, 1–6. [Google Scholar] [CrossRef]
  57. Knapp, A.K.; Smith, M.D. Variation among biomes in temporal dynamics of aboveground primary production. Science 2001, 291, 481–484. [Google Scholar] [CrossRef] [PubMed]
  58. Ponce-Campos, G.E.; Moran, M.S.; Huete, A.; Zhang, Y.; Bresloff, C.; Huxman, T.E.; Eamus, D.; Bosch, D.D.; Buda, A.R.; Gunter, S.A. Ecosystem resilience despite large-scale altered hydroclimatic conditions. Nature 2013, 494, 349. [Google Scholar] [CrossRef]
  59. Poulter, B.; Frank, D.; Ciais, P.; Myneni, R.B.; Andela, N.; Bi, J.; Broquet, G.; Canadell, J.G.; Chevallier, F.; Liu, Y.Y. Contribution of semi-arid ecosystems to interannual variability of the global carbon cycle. Nature 2014, 509, 600. [Google Scholar] [CrossRef] [PubMed]
  60. Reddy, A.R.; Chaitanya, K.V.; Vivekanandan, M. Drought-induced responses of photosynthesis and antioxidant metabolism in higher plants. J. Plant Physiol. 2004, 161, 1189–1202. [Google Scholar] [CrossRef]
  61. Zhang, K.; Kimball, J.S.; Hogg, E.; Zhao, M.; Oechel, W.C.; Cassano, J.J.; Running, S.W. Satellite-based model detection of recent climate-driven changes in northern high-latitude vegetation productivity. J. Geophys. Res. Biogeosci. 2008, 113, G03033. [Google Scholar] [CrossRef]
  62. Peng, F.; You, Q.; Xu, M.; Guo, J.; Wang, T.; Xue, X. Effects of warming and clipping on ecosystem carbon fluxes across two hydrologically contrasting years in an alpine meadow of the Qinghai-Tibet Plateau. PLoS ONE 2014, 9, e109319. [Google Scholar] [CrossRef]
  63. Larcher, W. Physiological Plant Ecology: Ecophysiology and Stress Physiology of Functional Groups; Springer Science & Business Media: Berlin/Heidelberg, Germany, 2003. [Google Scholar]
  64. Yang, Y.; Guan, H.; Batelaan, O.; McVicar, T.R.; Long, D.; Piao, S.; Liang, W.; Liu, B.; Jin, Z.; Simmons, C.T. Contrasting responses of water use efficiency to drought across global terrestrial ecosystems. Sci. Rep. 2016, 6, 23284. [Google Scholar] [CrossRef]
  65. Knapp, A.K.; Carroll, C.J.; Denton, E.M.; La Pierre, K.J.; Collins, S.L.; Smith, M.D. Differential sensitivity to regional-scale drought in six central US grasslands. Oecologia 2015, 177, 949–957. [Google Scholar] [CrossRef]
  66. Vicente-Serrano, S.M.; Gouveia, C.; Camarero, J.J.; Beguería, S.; Trigo, R.; López-Moreno, J.I.; Azorín-Molina, C.; Pasho, E.; Lorenzo-Lacruz, J.; Revuelto, J. Response of vegetation to drought time-scales across global land biomes. Proc. Natl. Acad. Sci. USA 2013, 110, 52–57. [Google Scholar] [CrossRef]
  67. Xu, H.; Li, Y. Water-use strategy of three central Asian desert shrubs and their responses to rain pulse events. Plant Soil 2006, 285, 5–17. [Google Scholar] [CrossRef]
  68. Xu, H.; Li, Y.; Xu, G.; Zou, T. Ecophysiological response and morphological adjustment of two Central Asian desert shrubs towards variation in summer precipitation. Plant Cell Environ. 2007, 30, 399–409. [Google Scholar] [CrossRef] [PubMed]
  69. Li, X.; Li, X.; Jiang, D.; Liu, Z.; Yu, Q. Annual plants in arid and semi-arid desert regions. Front. Biol. China 2008, 3, 259–264. [Google Scholar] [CrossRef]
  70. Liao, C.; Zhuang, Q. Reduction of global plant production due to droughts from 2001 to 2010: An analysis with a process-based global terrestrial ecosystem model. Earth Interact. 2015, 19, 1–21. [Google Scholar] [CrossRef]
  71. Chapin, F.S.; Matson, P.A.; Vitousek, P.M. Principles of Terrestrial Ecosystem Ecology; Springer Sceince+Business Media: London, UK, 2011. [Google Scholar]
  72. Wolf, S.; Keenan, T.F.; Fisher, J.B.; Baldocchi, D.D.; Desai, A.R.; Richardson, A.D.; Scott, R.L.; Law, B.E.; Litvak, M.E.; Brunsell, N.A. Warm spring reduced carbon cycle impact of the 2012 US summer drought. Proc. Natl. Acad. Sci. USA 2016, 113, 5880–5885. [Google Scholar] [CrossRef] [PubMed]
  73. Jobbágy, E.G.; Sala, O.E. Controls of grass and shrub aboveground production in the Patagonian steppe. Ecol. Appl. 2000, 10, 541–549. [Google Scholar] [CrossRef]
Figure 1. The study area map.
Remotesensing 17 00589 g001
Figure 2. Processing flow for estimating ET and GPP using MODIS products.
Remotesensing 17 00589 g002
Figure 3. The (a,b) average value, (c,d) coefficient of variance and (e,f) trend of summer mean GPP and ET from 2003 to 2015 in NADRs.
Remotesensing 17 00589 g003
Figure 4. The frequency and trends of summer drought in the NADR from 2003 to 2015. (ac) Drought frequency of moderate drought (MD, −1.5 < SPEI < −1.0), severe drought (SD, −2.0 < SPEI < −1.5) and extreme drought (ED, SPEI < −2.0); (d) the trends of SPEI; (e) times series of SPEI and the percentage area affected by droughts.
Remotesensing 17 00589 g004
Figure 5. The linear slope between SPEI and (a) GPP anomaly, (b) ET anomaly for 2003–2015; the person coefficients boxplots between SPEI and (c) GPP anomaly, (d) ET anomaly among different biome types.
Remotesensing 17 00589 g005
Figure 6. The average and changes of summer GPP and ET among different dryness levels and biomes: mean GPP (a) and ET (b), the difference of GPP (c) and ET (d) between total normal and dry summer; GPP (e) and ET (f) shifts from normal to different dryness levels, (g) GPP shifts from normal to different dryness levels among different grassland types.
Remotesensing 17 00589 g006
Figure 7. The linear slope between 1-month scale SPEI and (a) GPP anomaly, (b) ET anomaly for 2003–2015.
Remotesensing 17 00589 g007
Figure 8. The average of summer GPP and ET at different dryness levels and biomes. Comparison GPP: (a,b) GPP and ET at 0.05 significant correlated levels with drought (p < 0.05); (c,d) GPP and ET at 0.10 significant correlated levels with drought (p < 0.10); (e,f) GPP and ET at insignificant correlated levels with drought (p > 0.10).
Remotesensing 17 00589 g008
Figure 9. The change of summer GPP and previous winter spring conditions in grasslands of China. (a) The grassland types of north China. (b) The patterns of GPP reduction in the ED summer are lower than those in the SD summer. (c) The spring temperature conditions at (b) patterns by spring mean temperature anomaly (warm spring: temperature anomaly > 0, cold spring: temperature anomaly < 0). (d) The previous winter wet–dry conditions at (b) patterns by the winter SPEI values (dry winter: SPEI < −1, wet winter: SPEI > 1).
Remotesensing 17 00589 g009
Disclaimer/Publisher’s Note: The statements, opinions and data contained in all publications are solely those of the individual author(s) and contributor(s) and not of MDPI and/or the editor(s). MDPI and/or the editor(s) disclaim responsibility for any injury to people or property resulting from any ideas, methods, instructions or products referred to in the content.