Article

R-SABMNet: A YOLOv8-Based Model for Oriented SAR Ship Detection with Spatial Adaptive Aggregation

1
School of Electronic, Electrical and Communication Engineering, University of Chinese Academy of Sciences, Beijing 100049, China
2
Key Laboratory of Technology in Geo-Spatial Information Processing and Application System, Chinese Academy of Sciences, Beijing 100190, China
3
Aerospace Information Research Institute, Chinese Academy of Sciences, Beijing 100094, China
4
Institute of Software, Chinese Academy of Sciences, Beijing 100190, China
*
Author to whom correspondence should be addressed.
Remote Sens. 2025, 17(3), 551; https://doi.org/10.3390/rs17030551
Submission received: 20 December 2024 / Revised: 29 January 2025 / Accepted: 3 February 2025 / Published: 6 February 2025

Abstract

:
Synthetic Aperture Radar (SAR) is extensively utilized in ship detection due to its robust performance under various weather conditions and its capability to operate effectively both during the day and at night. However, ships in SAR images exhibit various characteristics including complex land scattering interference, variable scales, and dense spatial arrangements. Existing algorithms are insufficient in effectively addressing these challenges. To enhance detection accuracy, this paper proposes the Rotated model with Spatial Aggregation and a Balanced-Shifted Mechanism (R-SABMNet) built upon YOLOv8. First, we introduce the Spatial-Guided Adaptive Feature Aggregation (SG-AFA) module, which enhances sensitivity to ship features while suppressing land scattering interference. Subsequently, we propose the Balanced Shifted Multi-Scale Fusion (BSMF) module, which effectively enhances local detail information and improves adaptability to multi-scale targets. Finally, we introduce the Gaussian Wasserstein Distance Loss (GWD), which effectively addresses localization errors arising from angle and scale inconsistencies in dense scenes. Our R-SABMNet outperforms other deep learning-based methods on the SSDD+ and HRSID datasets. Specifically, our method achieves a detection accuracy of 96.32%, a recall of 93.13%, and an average level of accuracy of 95.28% on the SSDD+ dataset.

1. Introduction

As a case of microwave-based imaging radar, SAR produces remote sensing images with high resolution [1]. It facilitates Earth observation through active microwave irradiation [2,3]. In contrast to optical imagery, SAR images provide some penetration capability [4,5]. Due to its exceptional observational capabilities [6], SAR is extensively utilized in military reconnaissance, marine resource management, and rescue missions [7]. In particular, SAR has demonstrated considerable potential for ship target monitoring [8,9].
With improvements in data quality [10] and the increasing diversity of imaging scenarios, SAR ship target detection still faces several technical challenges [11,12]. First, Figure 1a shows that ship detection is challenged by the similar scattering characteristics of land areas and ship targets in nearshore scenes [13,14]. It tends to cause many false detections in land areas [15,16]. Secondly, as illustrated in Figure 1b, ship targets exhibit variations in scattering characteristics and scales [17,18], requiring detection models to handle multi-scale targets. Additionally, due to the dense arrangement of ships shown in Figure 1a, horizontal-frame-based models fail to describe the shape and position of these targets accurately, resulting in more false positives and missed detections [19,20]. Consequently, oriented bounding boxes represent the information of the target better, resulting in higher detection accuracy [21].
This paper aims to solve these problems by proposing R-SABMNet, which utilizes YOLOv8 as the baseline. It integrates several improvements to strengthen the model’s accuracy and robustness. The proposed method includes the following improvements:
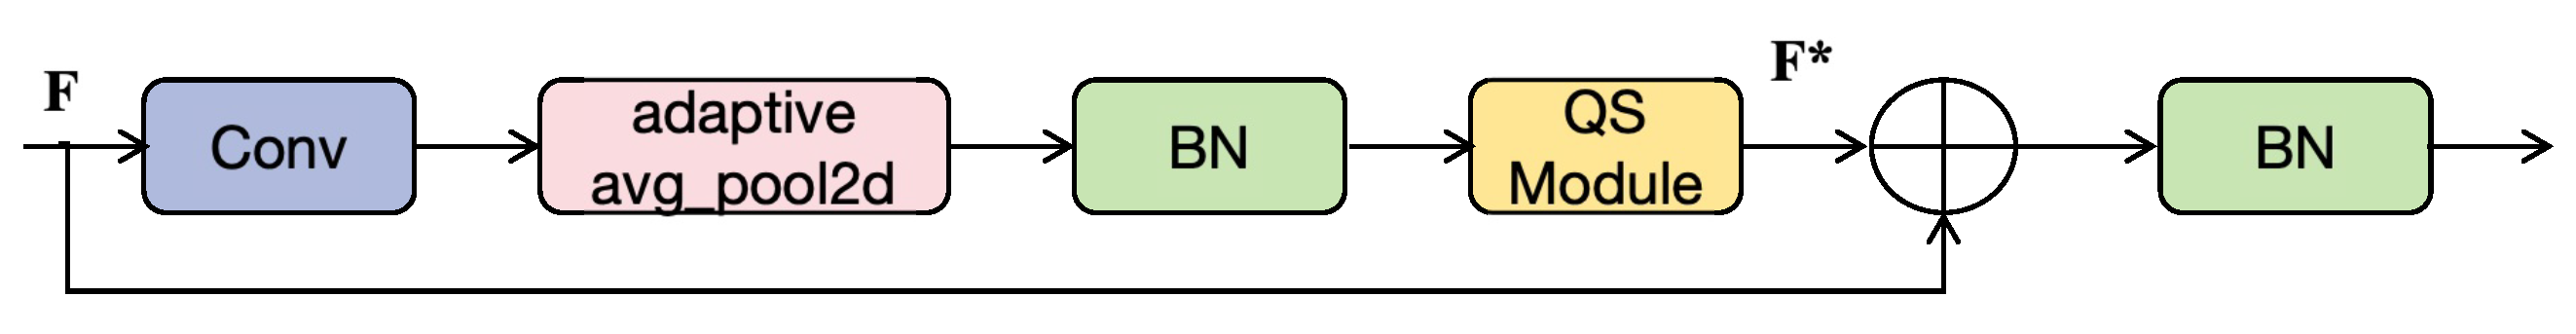
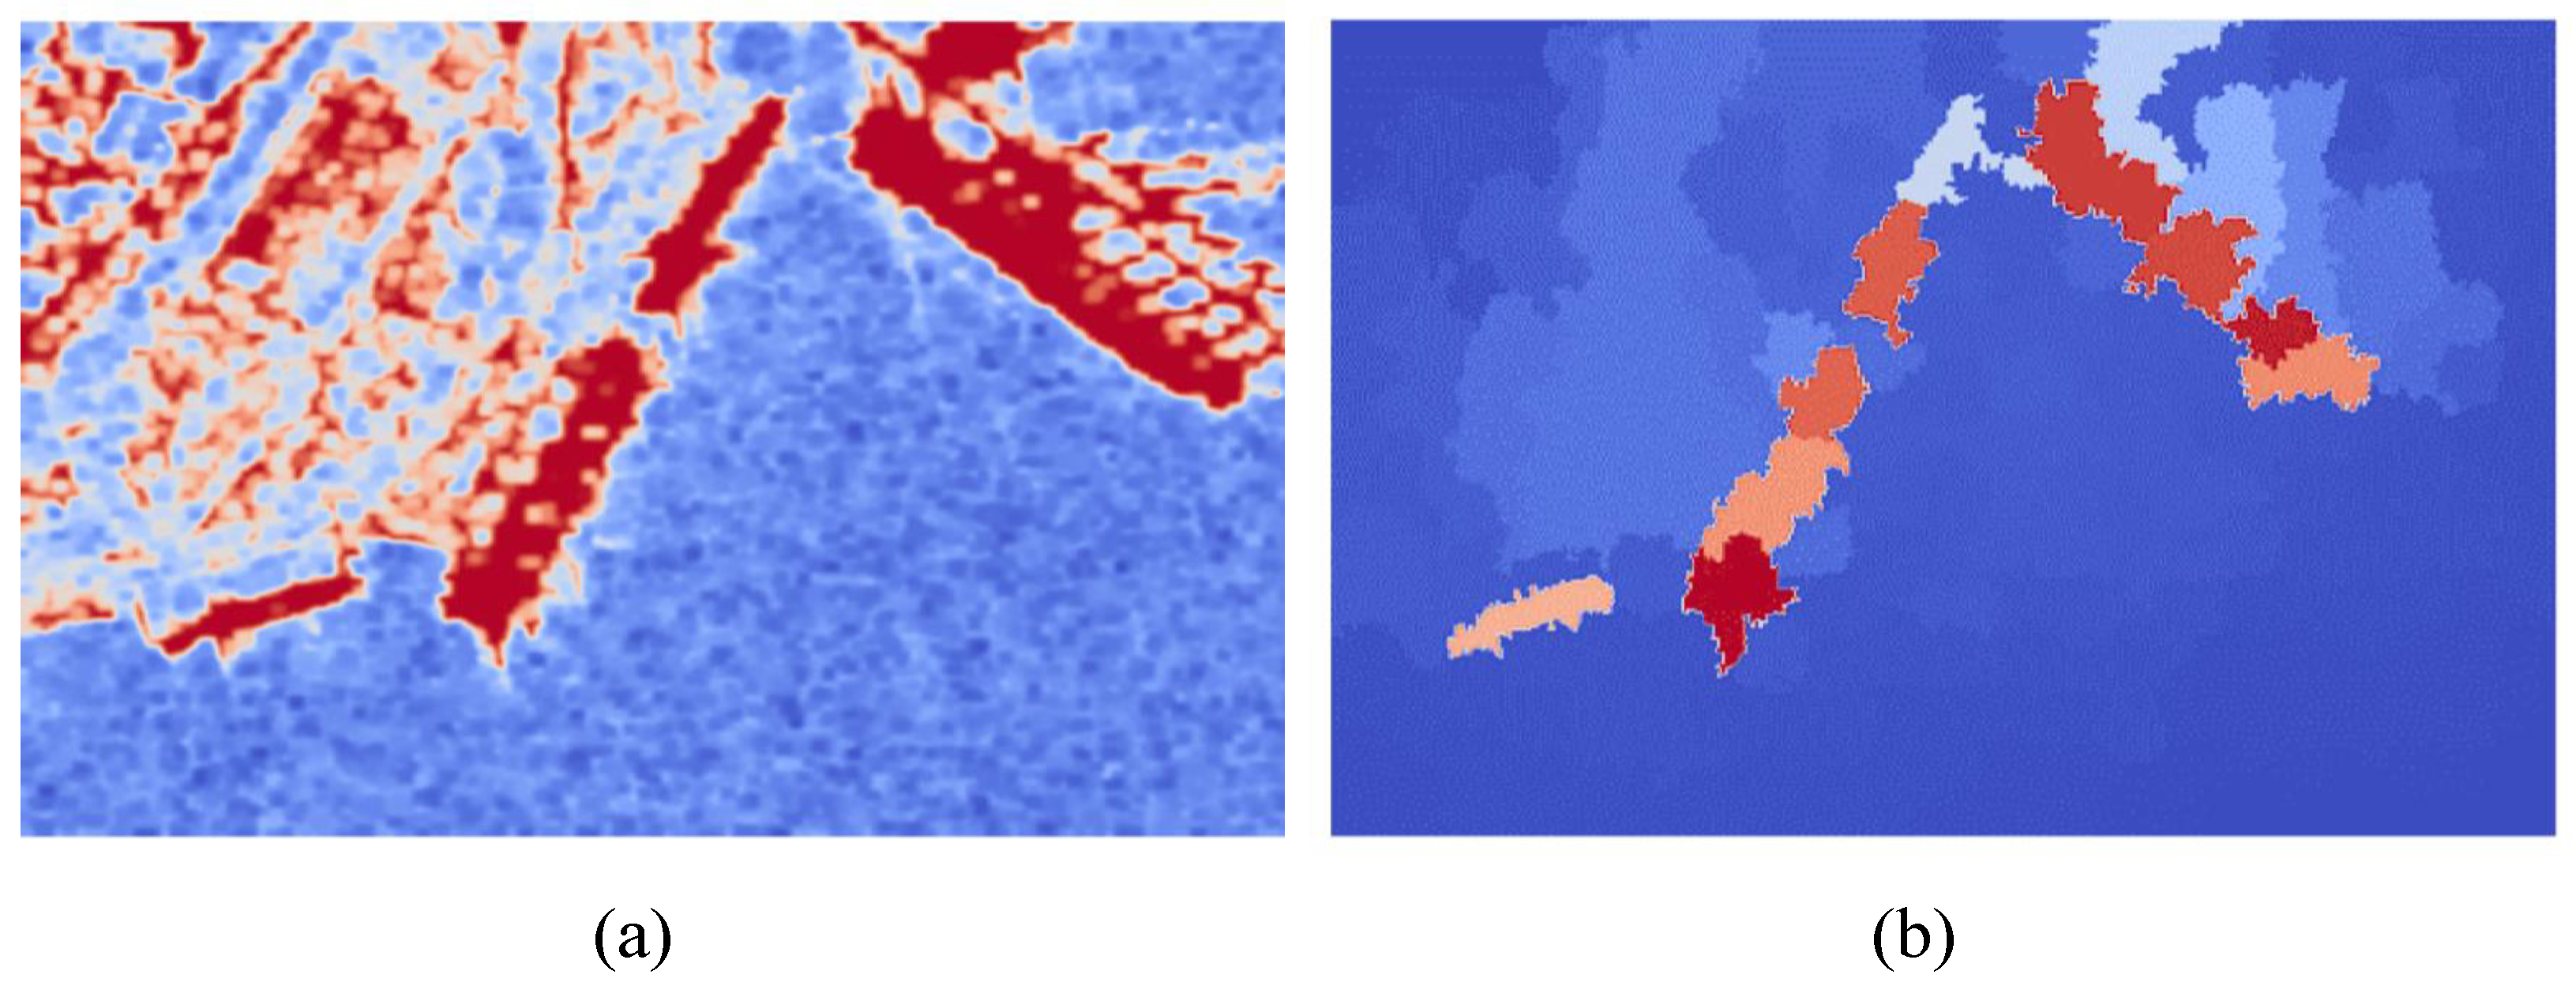
  • The SG-AFA module is proposed to aggregate global spatial information. This module enhances the sensitivity to ship features and improves the feature representation of key regions. As a result, it effectively suppresses land scattering interference and boosts the accuracy in intricate scenarios.
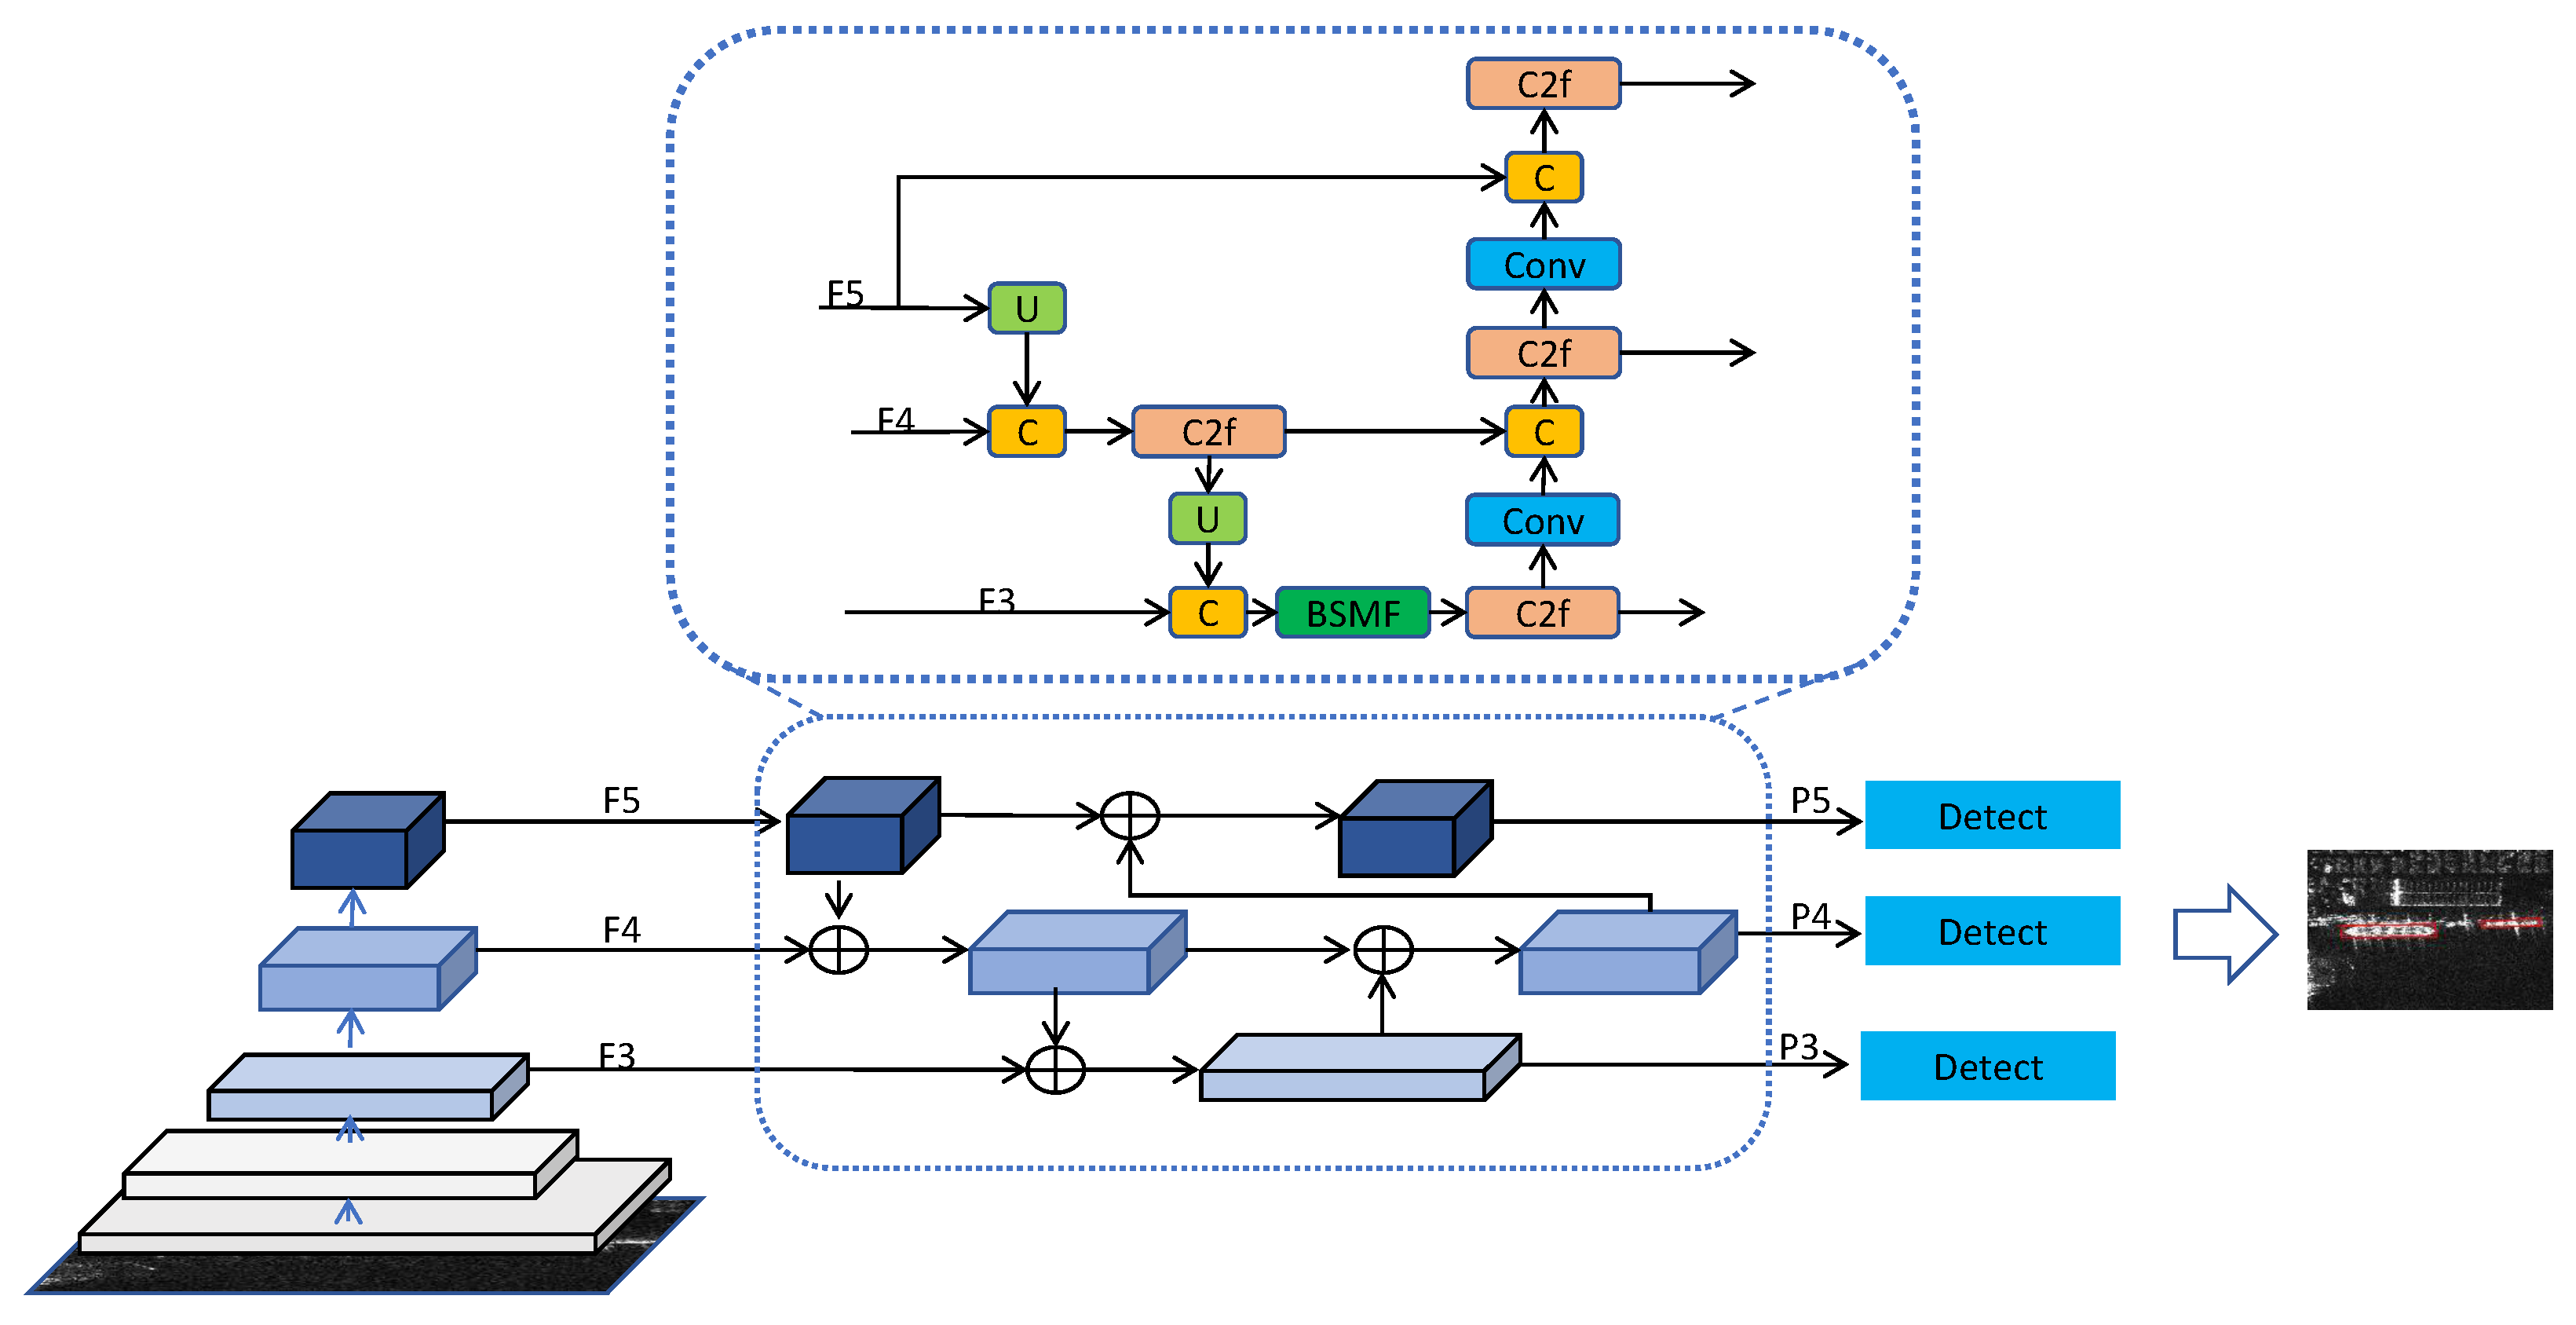
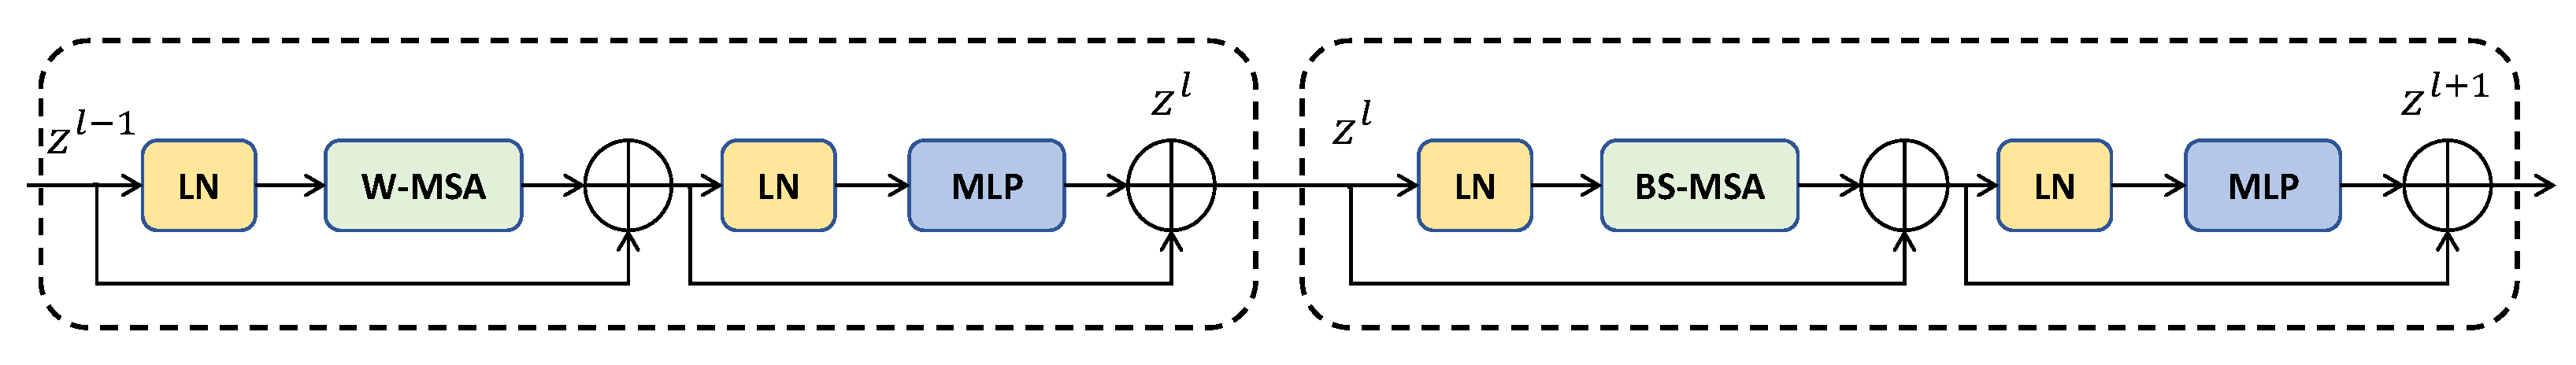
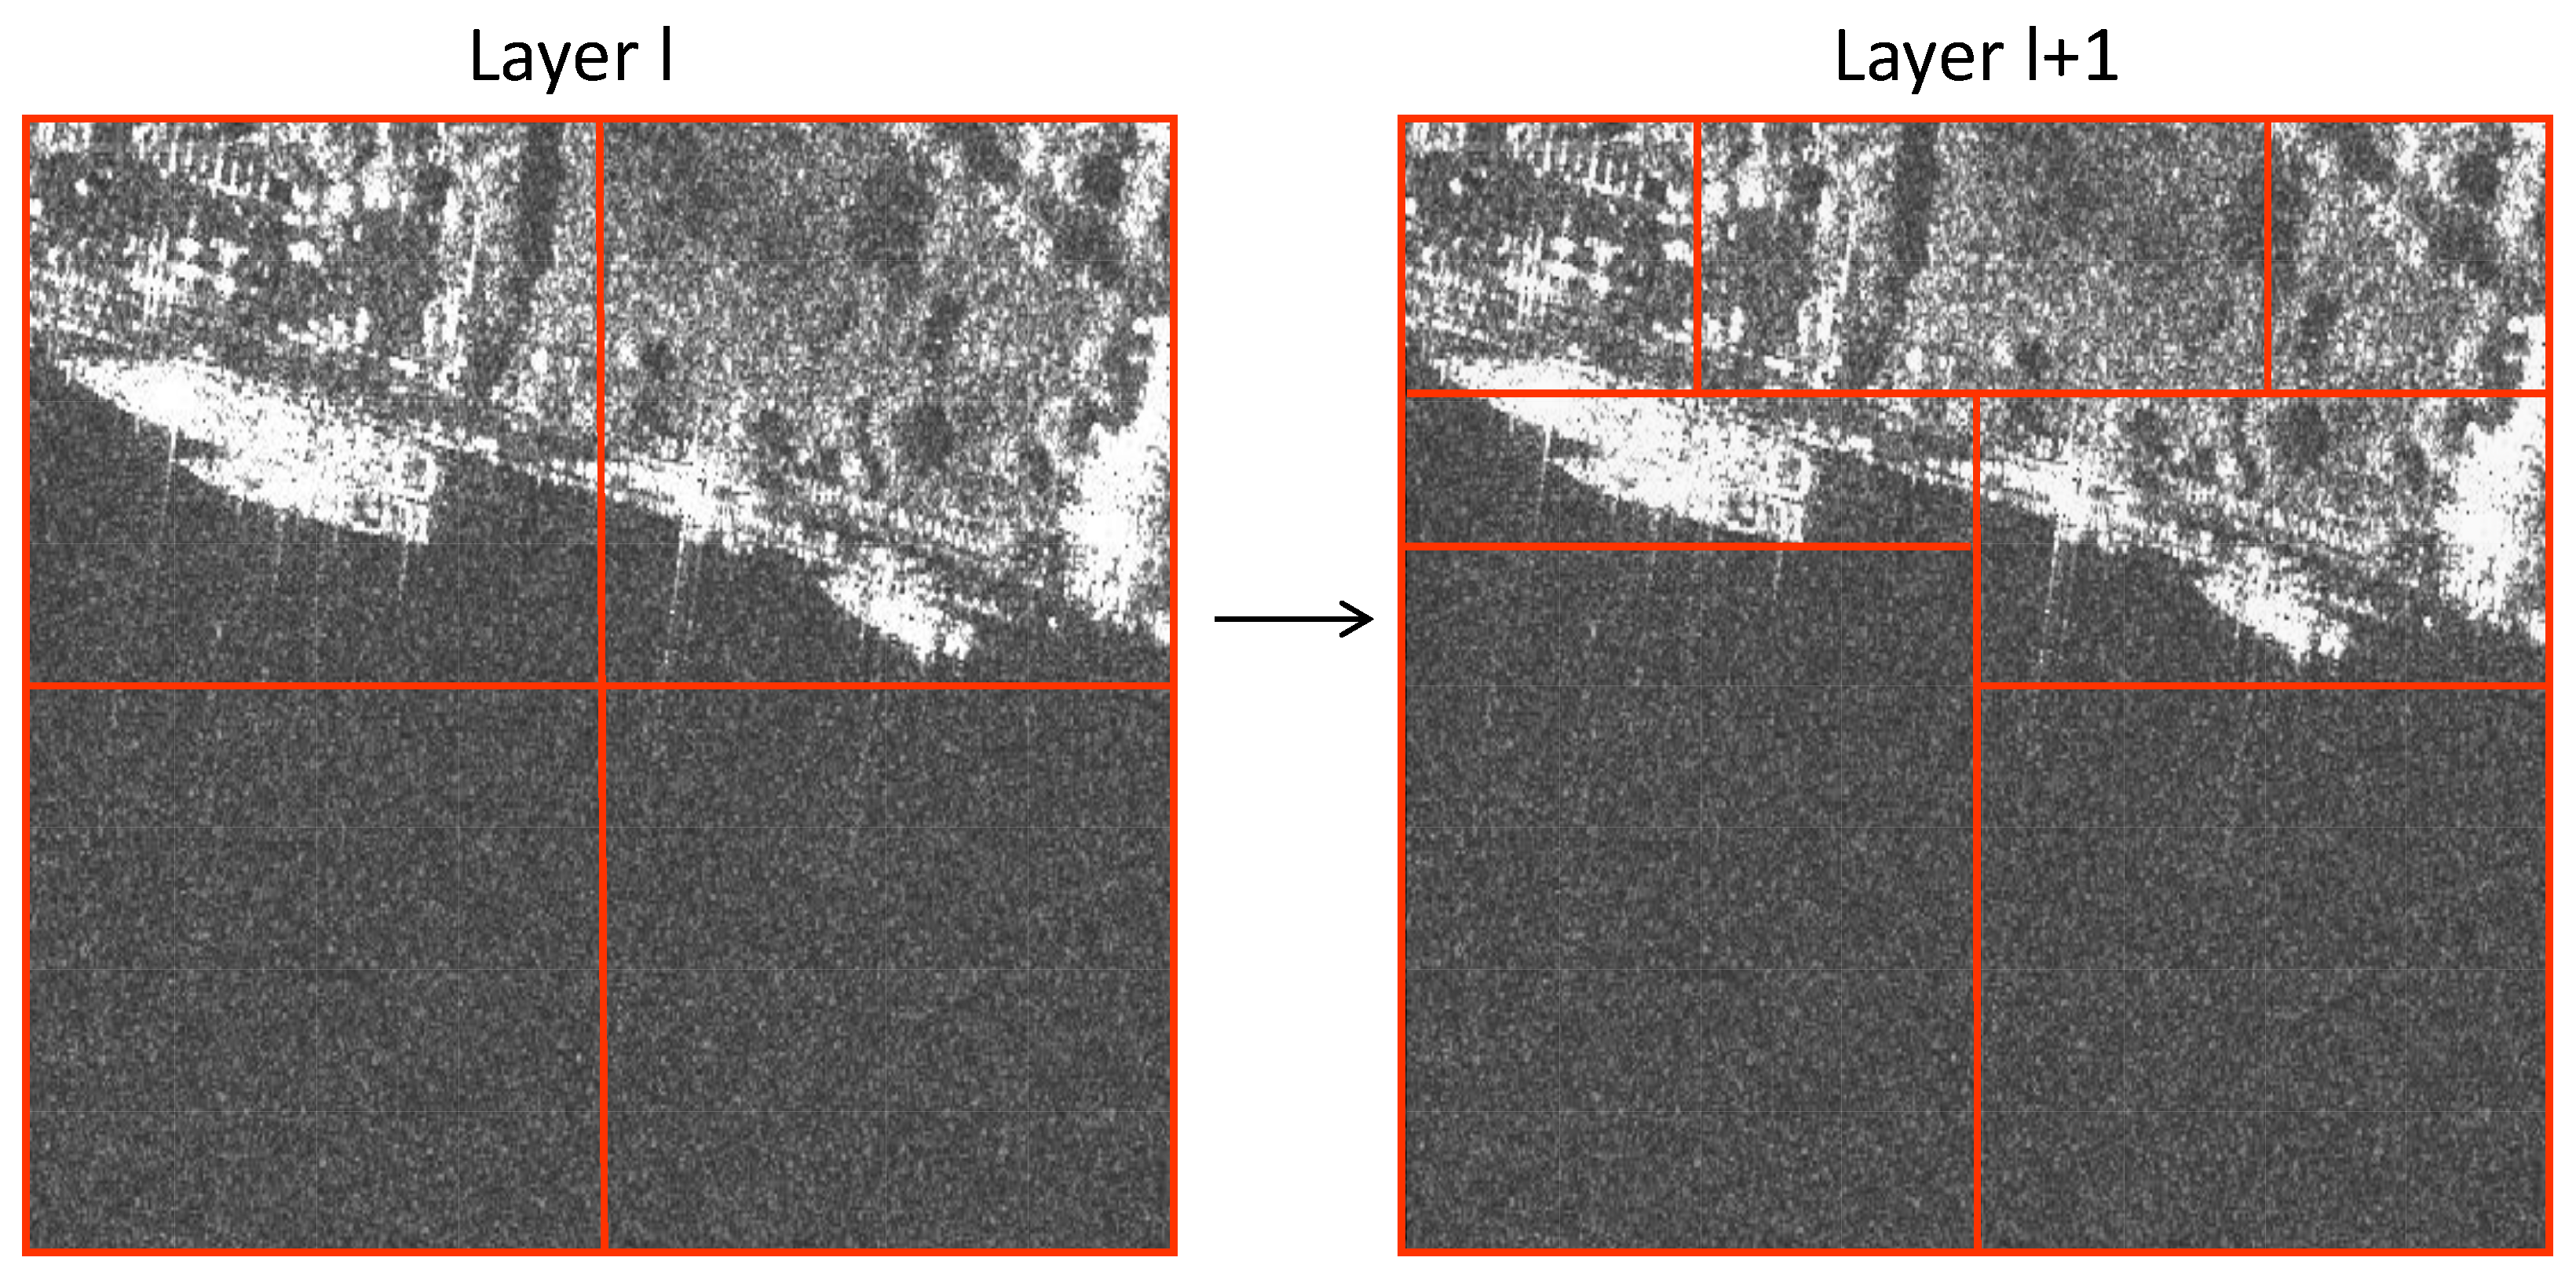
  • The BSMF method is proposed, using a balanced shifted-window attention mechanism. This module enhances local detail and establishes global dependencies, enabling the handling of scale-variant targets.
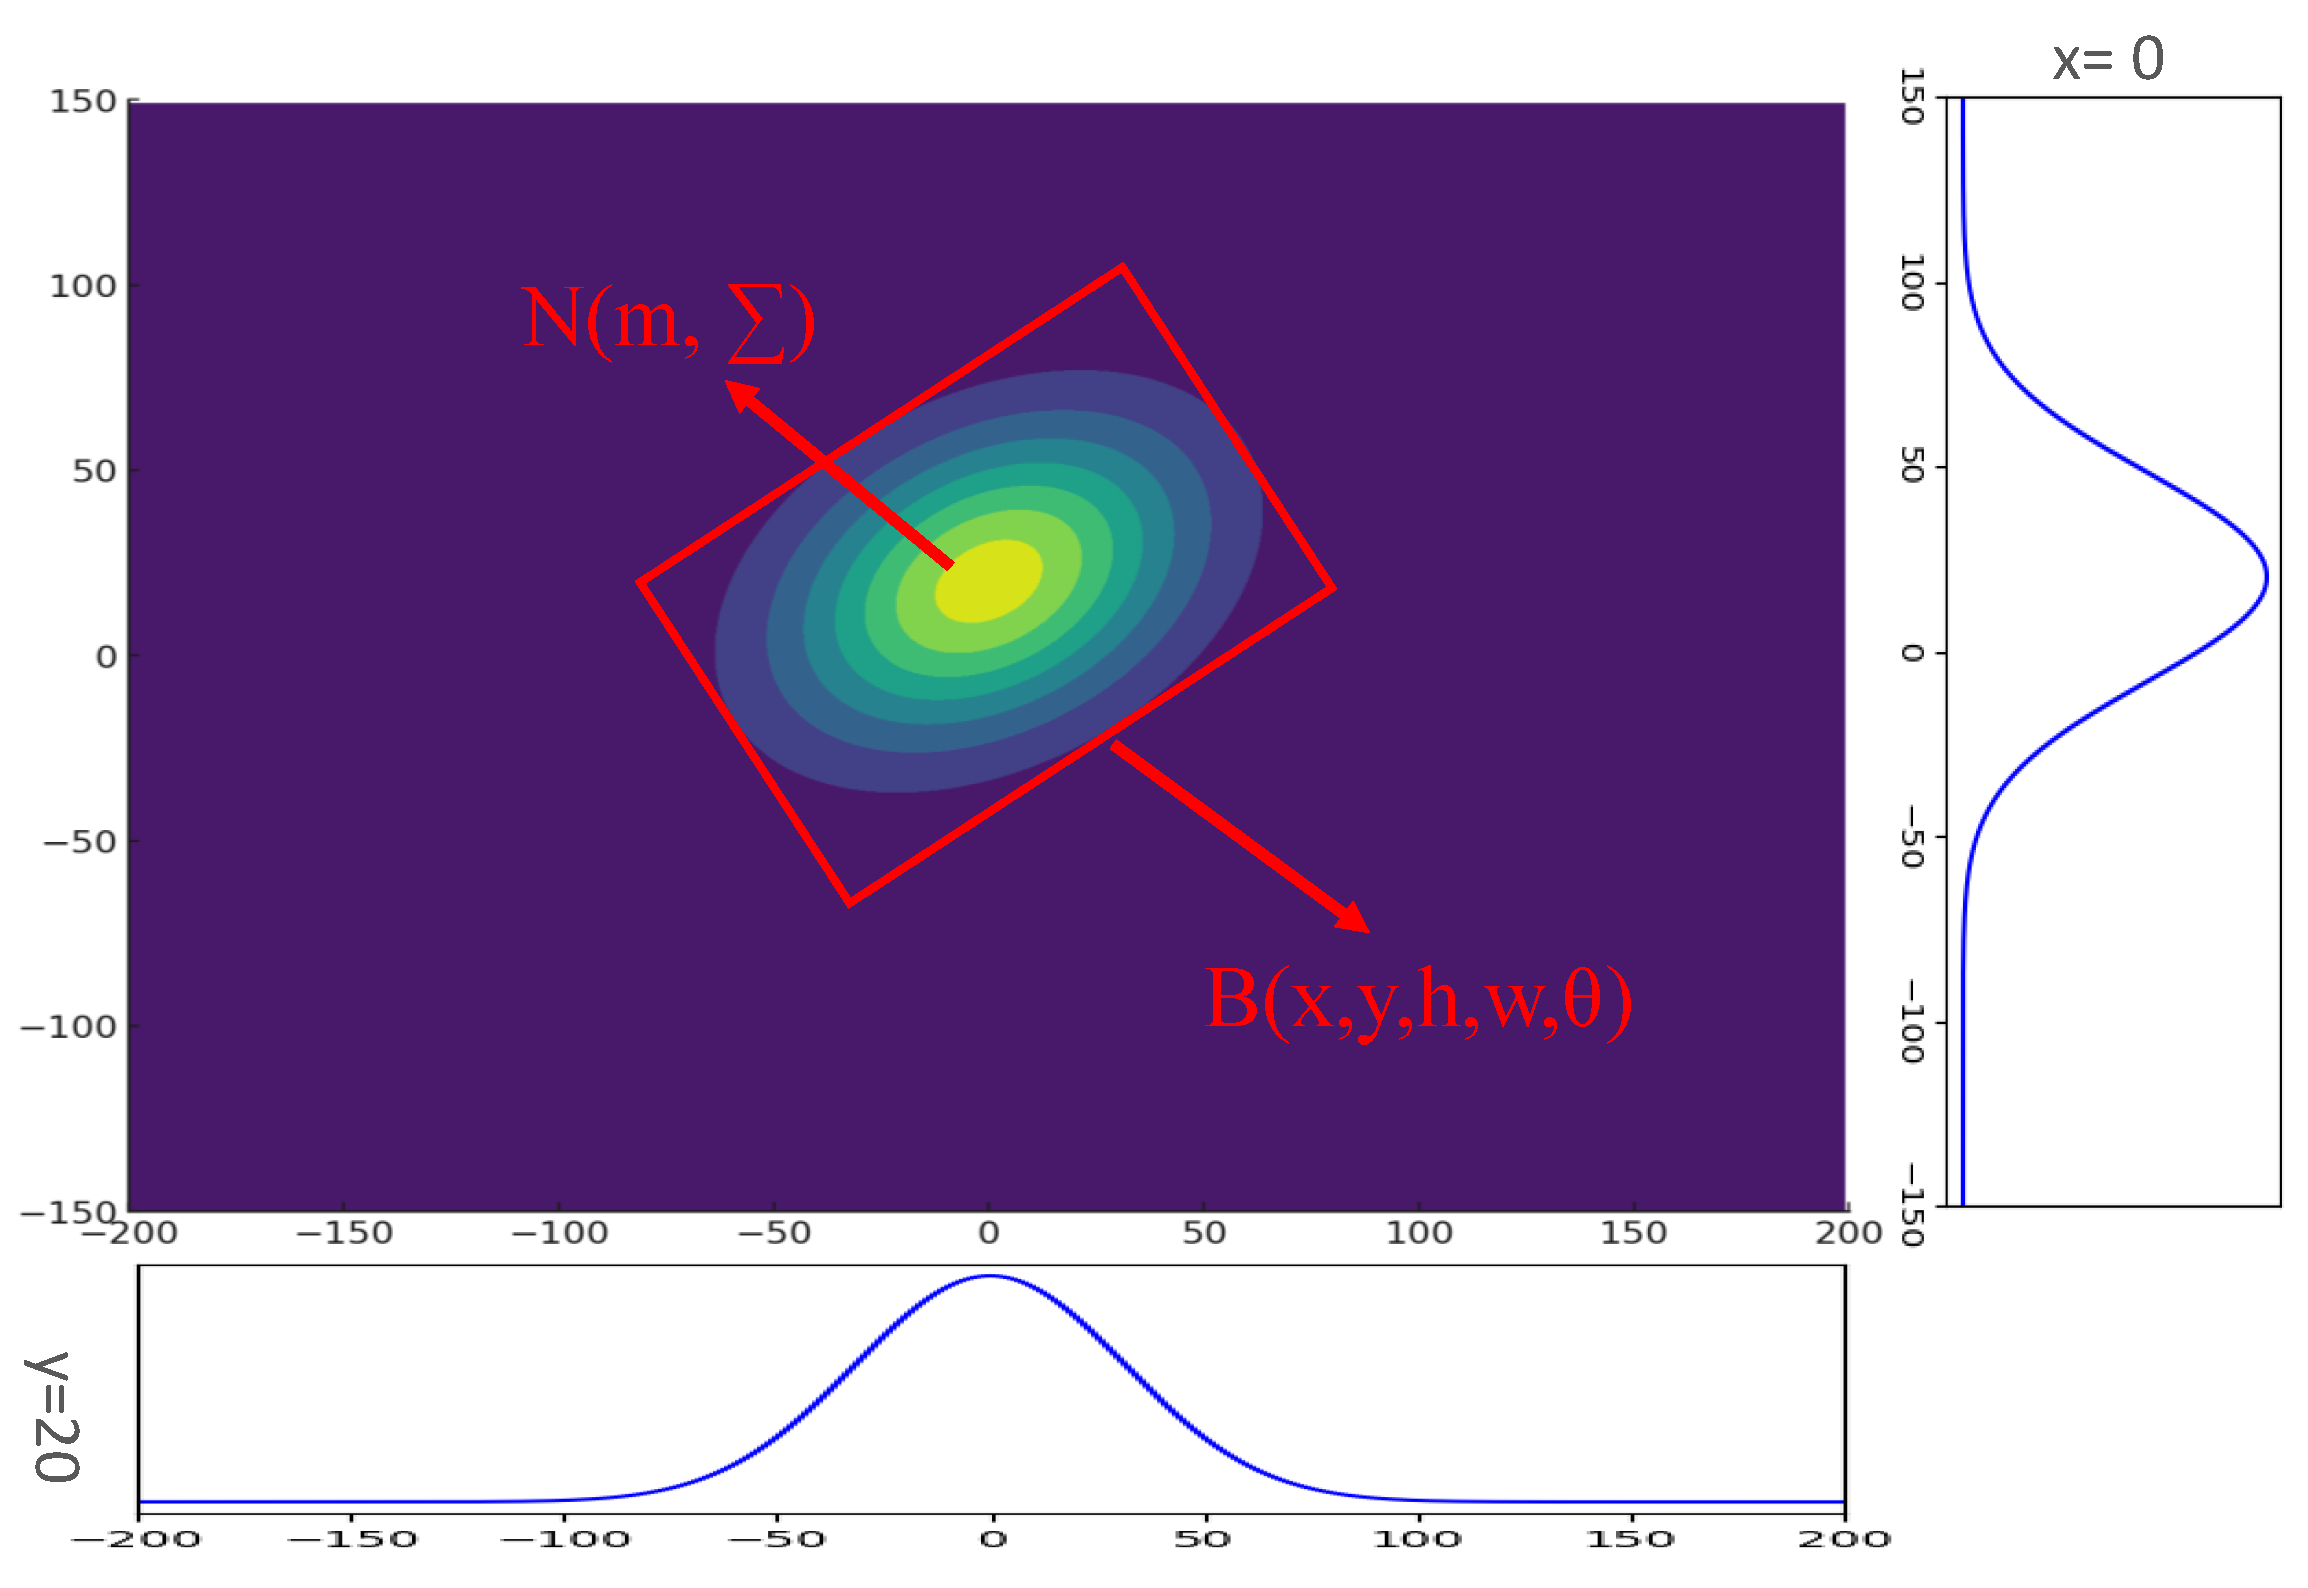
  • The GWD is introduced as the regression loss to perform the computation of the differentiable Rotated IOU. It addresses localization errors due to angle and scale inconsistencies in dense scenes.
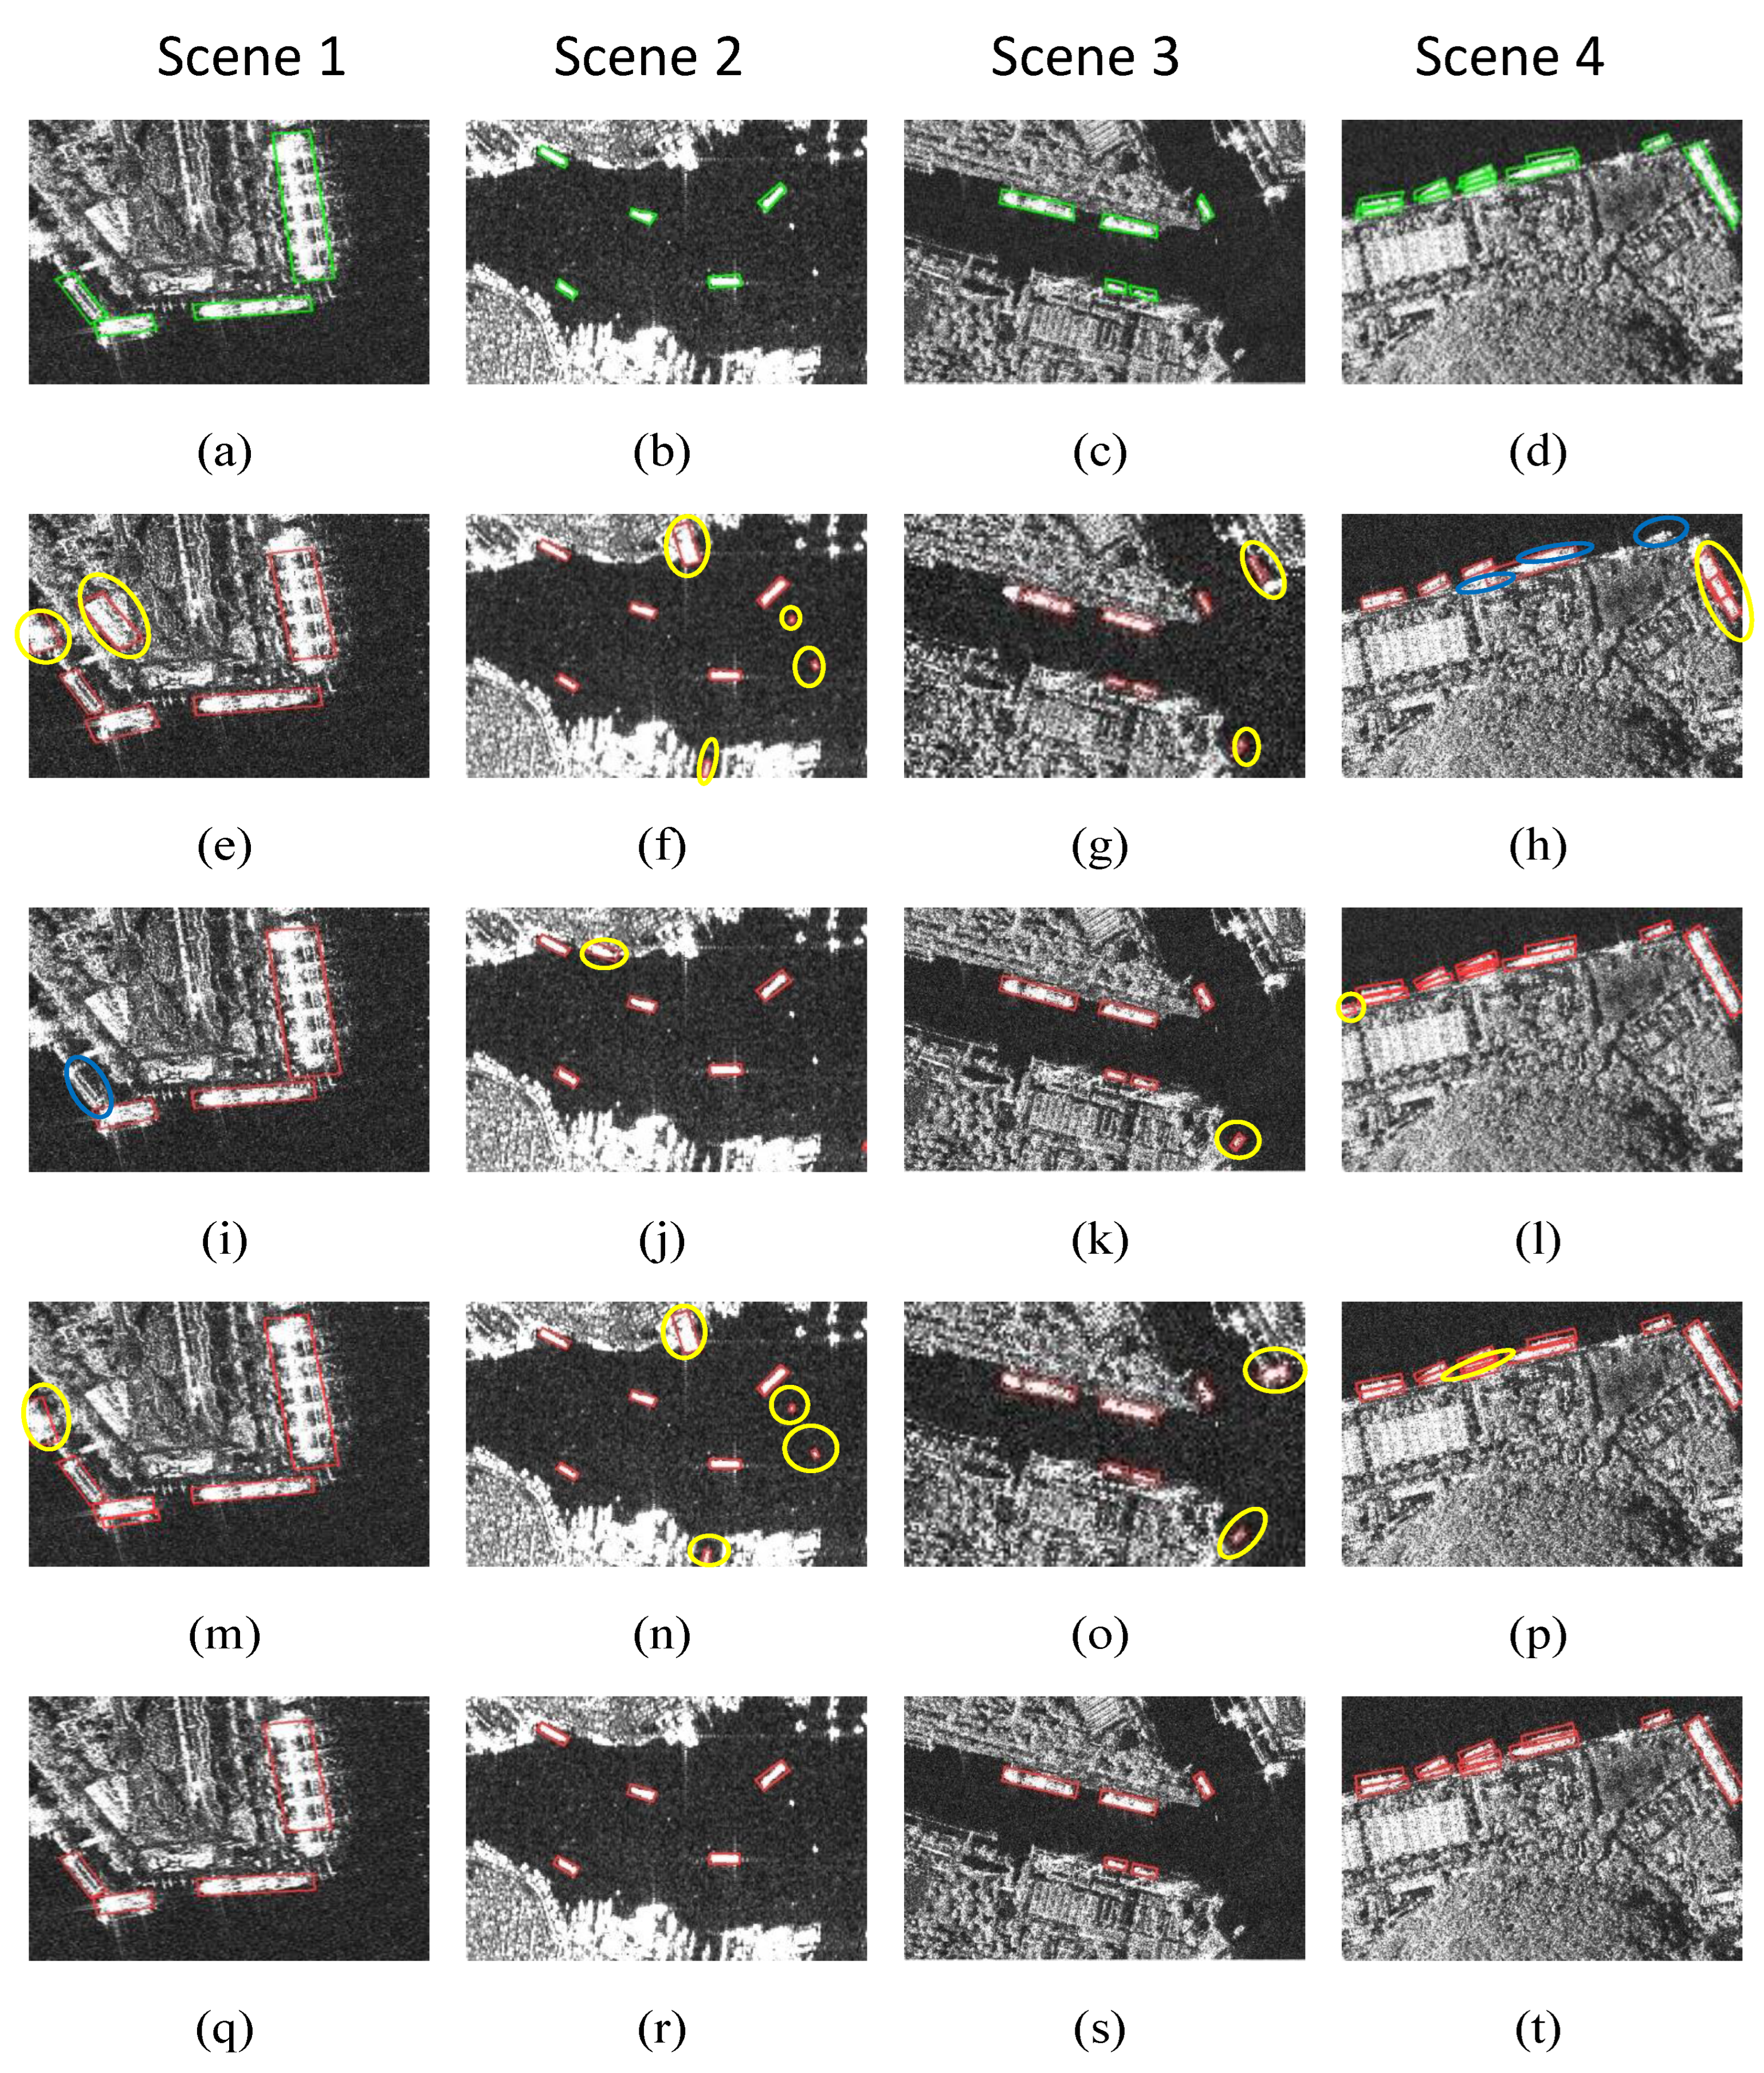
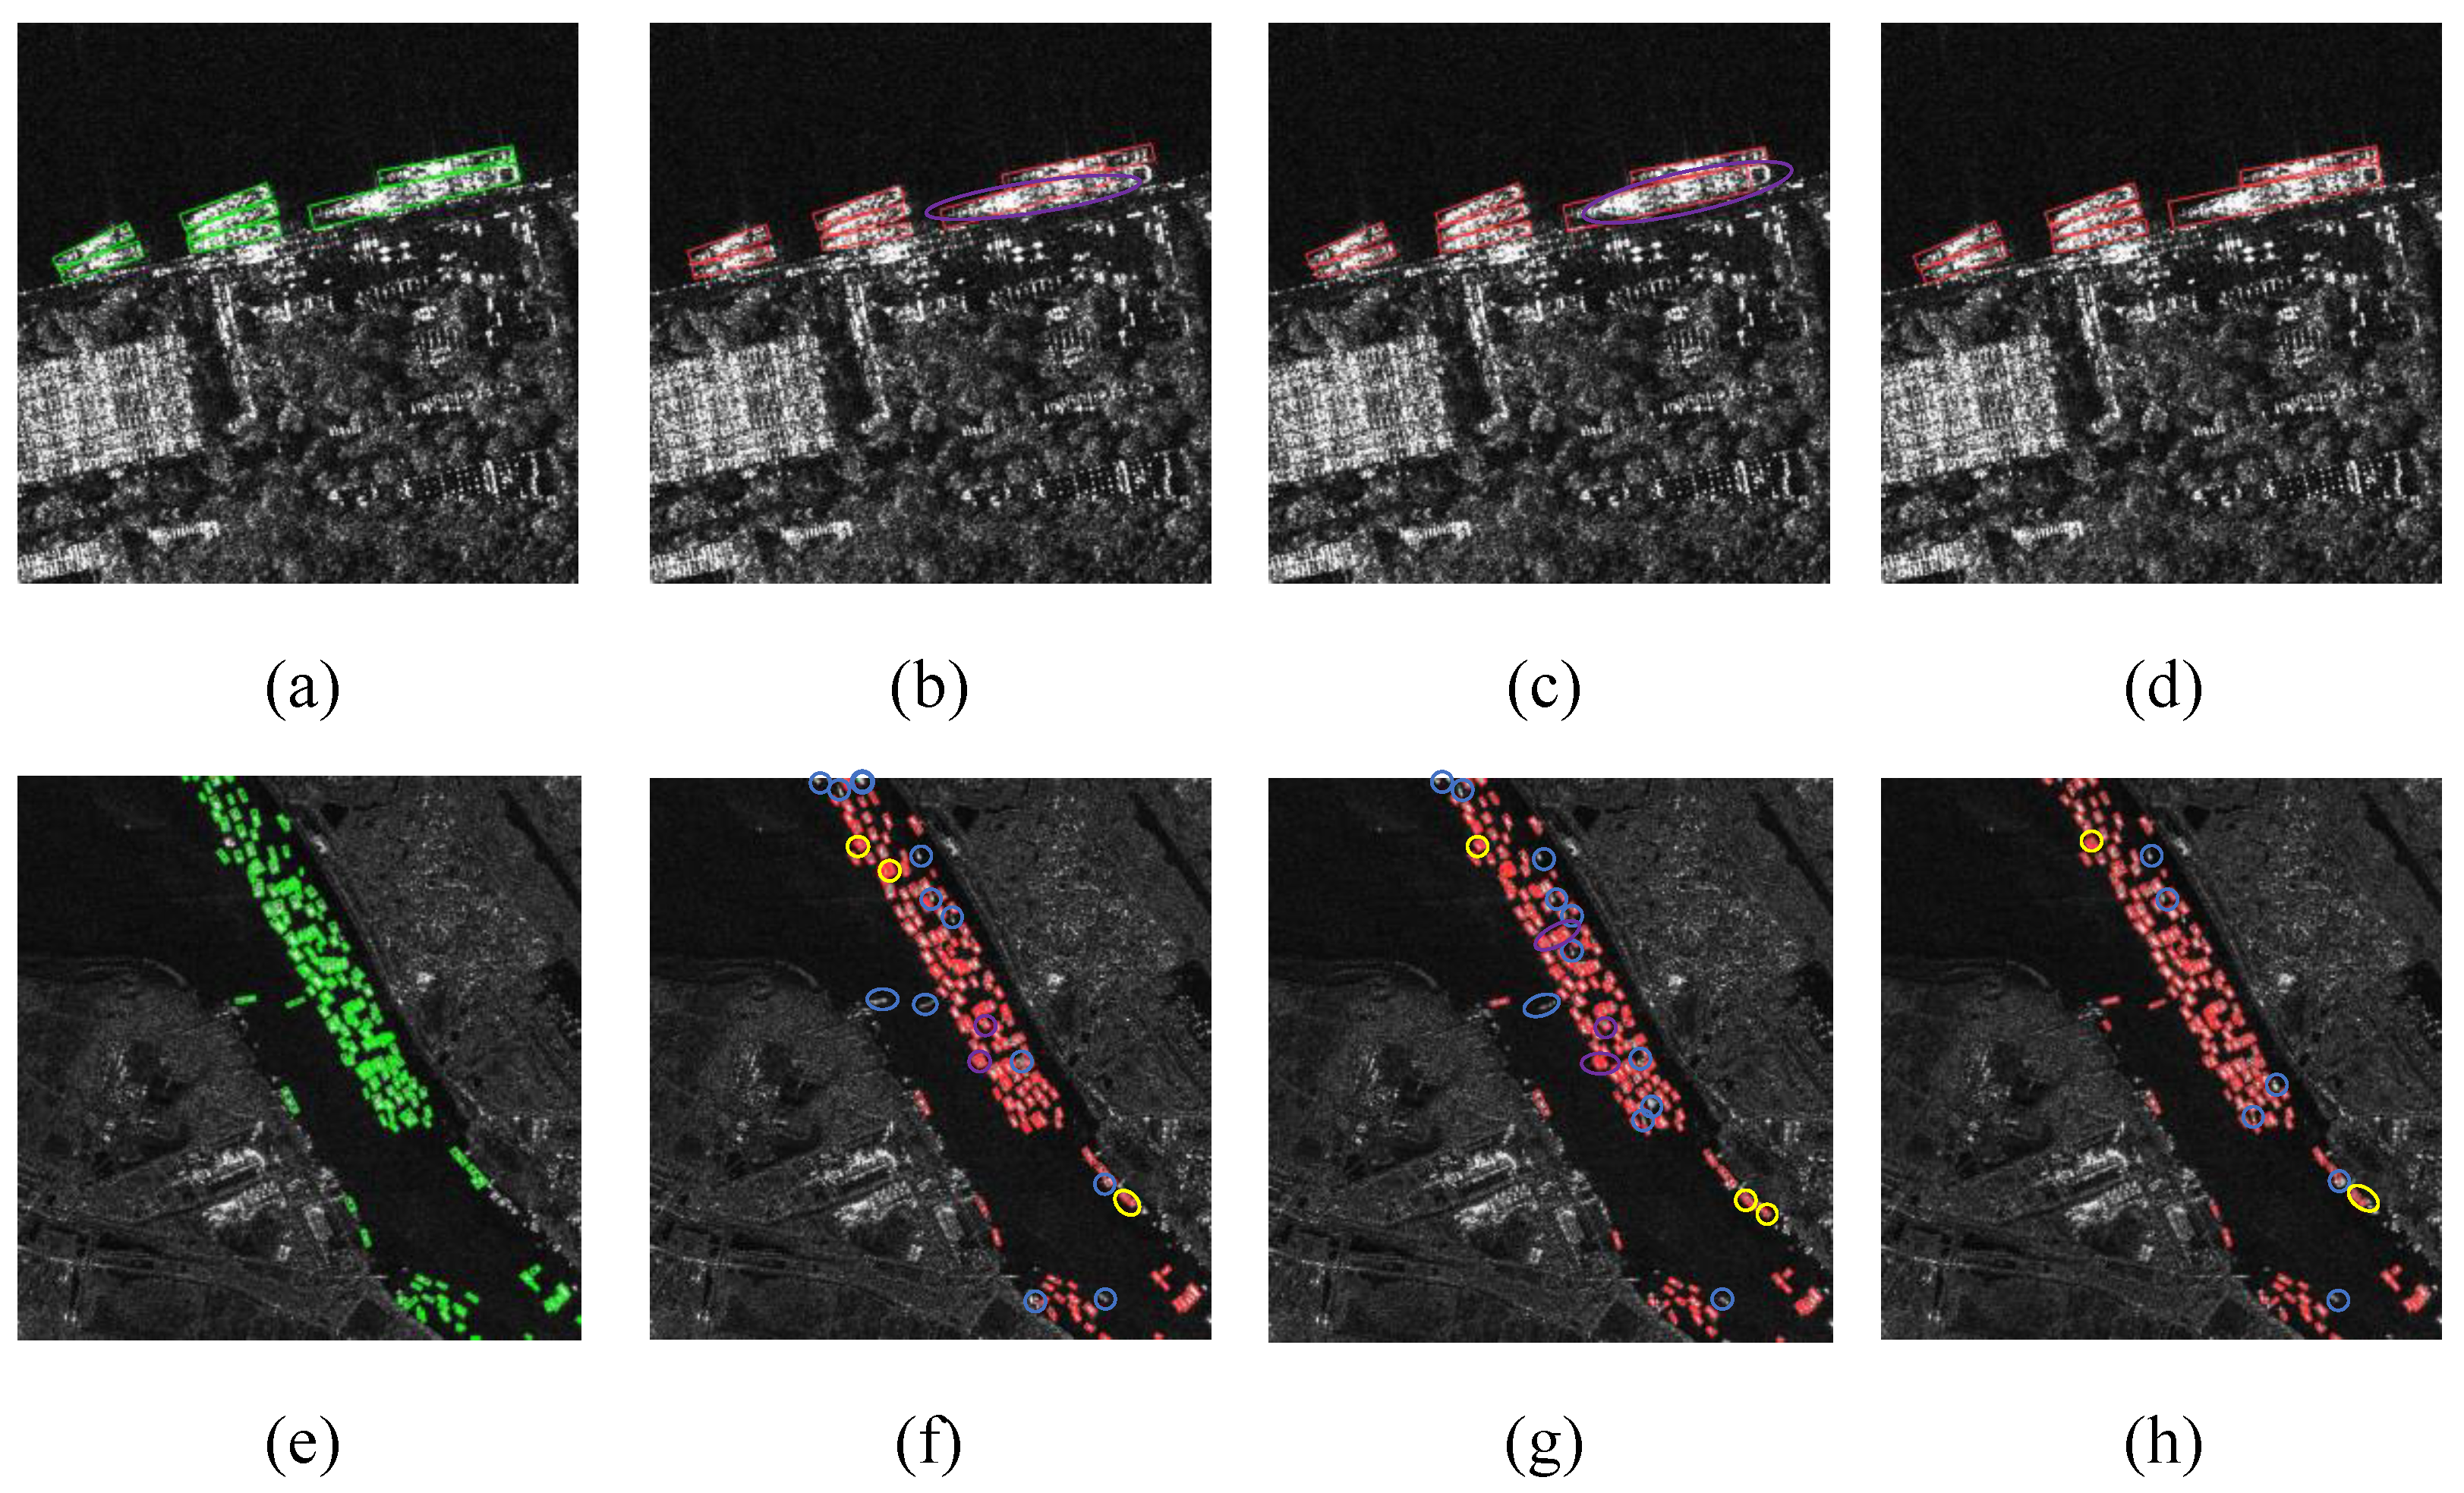
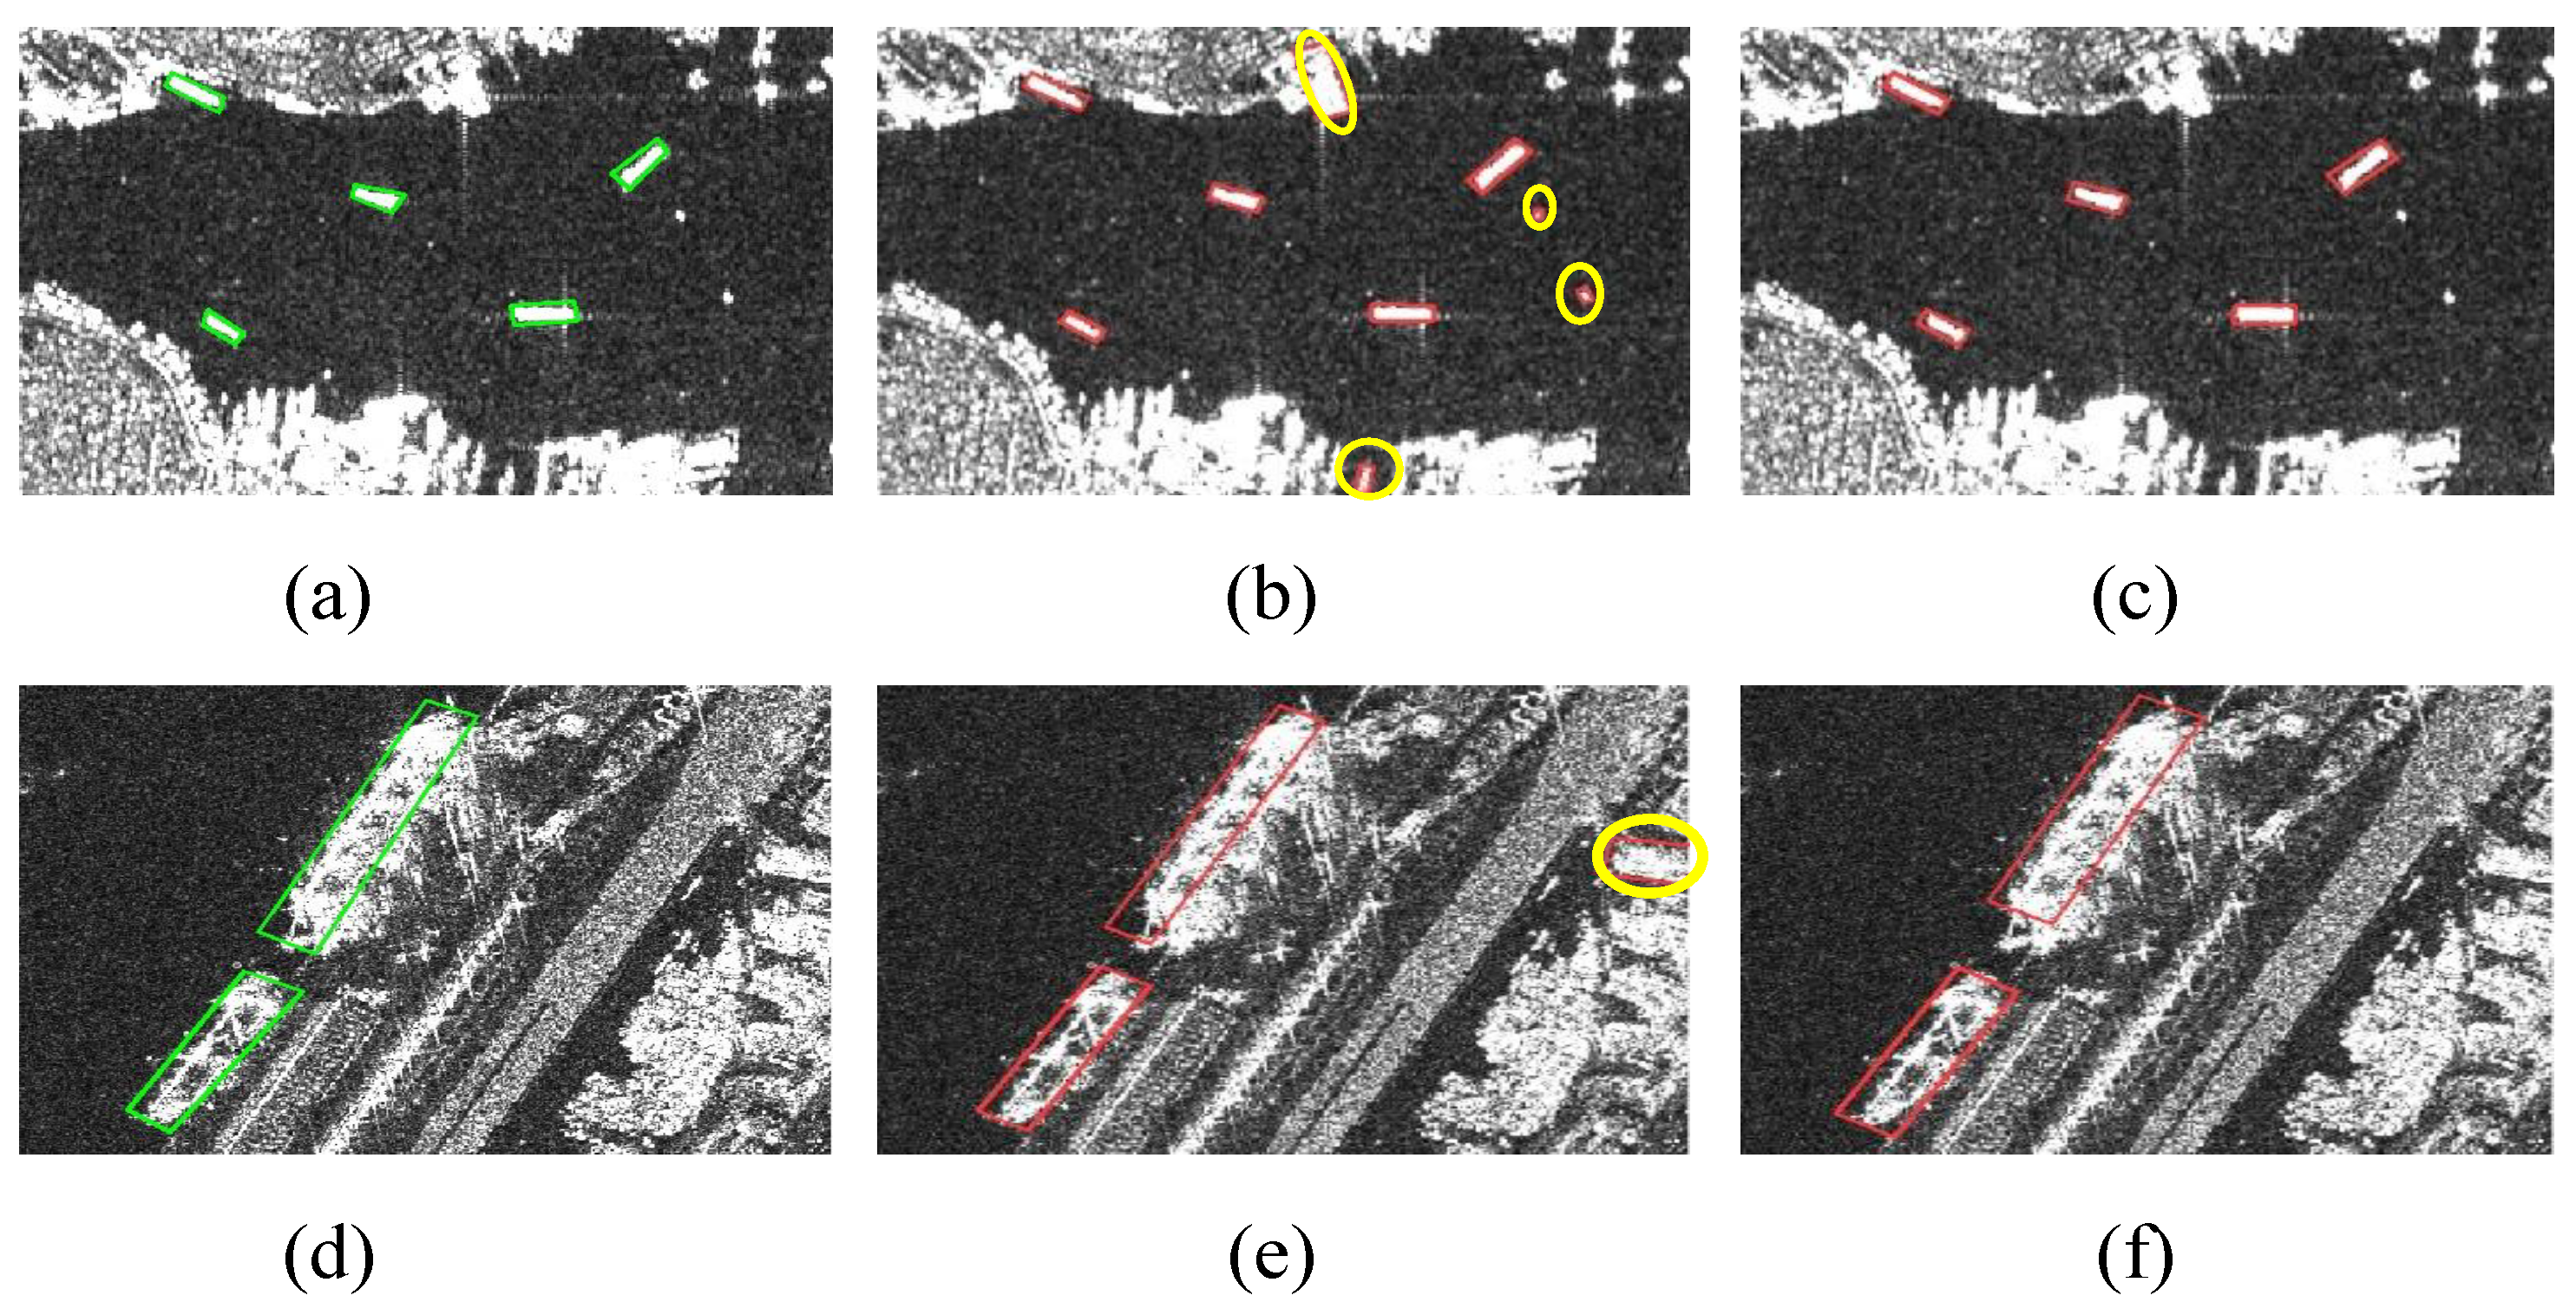
  • The experiments are conducted on various public SAR datasets. The results demonstrate that our method surpasses existing mainstream methods across various detection metrics, particularly in complex coastline scenes and multi-scale scenarios.
The following gives a description of the contributions of this paper. A thorough analysis of work related to the topic at hand is given in Section 2, which covers classical models and the progress made in addressing key challenges. The methodology of R-SABMNet is presented in Section 3. Subsequently, the experimental setup is described, the results are analyzed, and the findings are also visualized in Section 4. Finally, Section 5 concludes by summarizing the paper’s contributions.

2. Related Works

To mitigate the challenges in detecting targets within SAR images, several techniques have been proposed by researchers [22,23]. Based on their technical characteristics, these approaches can be classified into two primary types: traditional approaches and deep learning-driven approaches [24].

2.1. Traditional Detection Methods

Classical SAR target detection approaches principally leverage the contrast between the target and the surrounding clutter. Many commonly used models are based on Constant False Alarm Rate (CFAR), with several improvements built upon it [25,26]. In addition, there are other widely applied algorithms, such as matching templates by comparing similarity measures [27], entropy [28], and wavelet transform [29]. However, most of these algorithms are scene-specific. They rely heavily on predefined distributions or manually designed features. This results in shallow feature representations and limited generalization capability.

2.2. Deep Learning-Driven Detection Methods

Deep learning has experienced substantial growth and innovation in recent years [30]. Various network models, particularly CNNs [31], have greatly enhanced object detection performance. In contrast to traditional methods, deep learning approaches eliminate dependency on complex, manually designed feature engineering. They automatically extract and learn deep features from images, enhancing detection accuracy.
The relevant methods can be classified into two fundamental types: two-stage and one-stage methods [32]. The former proposes candidate regions for potential ship targets using predefined anchor boxes, which are then refined for precise target localization. Notable examples include Faster R-CNN [33], Libra R-CNN [34], and Mask R-CNN [35]. The latter performs both classification and regression on anchor boxes in one step. Prominent single-stage algorithms include the YOLO series [36,37,38,38], SSD [39], and FCOS [40]. Overall, two-stage-based methods generally demonstrate superior detection accuracy but require more computational resources, leading to slower speeds. One-stage-based detectors provide an improved harmony between precision and effectiveness.

2.3. Research on the Related Key Points

SAR images vary in terms of sensors, resolution, and ship types. Consequently, the size difference between the diverse pixel regions of ships within a single dataset can vary by up to a factor of a thousand [41]. To deal with the problem of identifying targets with diverse scales, several algorithms have been proposed, including multi-scale feature processing methods [42], scale-invariant feature detectors like SIFT [42], and pyramid-based approaches that capture both global and local information at various resolutions [43]. In addition, an efficient detection approach based on the Hessian matrix has been proposed [44]. It uses integral images for faster computation and ensures scale and rotation invariance. Bi-DFFM [45] integrates top-down and bottom-up pathways to improve multi-scale ship recognition. Based on CenterNet [46], CenterNet++ [47] was developed to address small-scale SAR ship detection.
Ship detection is challenged by the similar scattering characteristics of land areas and ship targets in nearshore scenes. Additionally, removing the vast ocean and coastline backgrounds in SAR images captured at varying heights is a significant challenge. The MLBR-YOLOX method [48] introduces a new SAR ship recognition network using SSPD and DSFD modules. Also inspired by the advantages of the YOLOX framework, AFSar [49] was introduced as an effective anchorless detection method for complex SAR scenes. Based on the FCOS framework, an anchorless SAR vessel detection approach was introduced [50]. This method modifies the assignment strategy for samples, effectively reducing the likelihood of background regions being incorrectly labeled as positive samples.

2.4. Baseline Model Selection

The YOLO series of models has gained widespread popularity among researchers due to its exceptional detection accuracy and inference efficiency. For instance, YOLOv5 and YOLOv7 have demonstrated remarkable performance across various tasks. YOLOv8, introduced by Ultralytics after extensive optimization, represents a significant advancement over the classic YOLOv5. It incorporates substantial innovations in network architecture and loss function design, while also exhibiting superior capabilities in multi-scale object detection and handling complex backgrounds. Notably, in SAR image processing scenarios, YOLOv8 demonstrates enhanced adaptability and robustness in the precise detection of ship targets.
In contrast, YOLOv11, the latest iteration in the YOLO series, primarily focuses on adjustments to model depth and width parameters. However, its core components, such as the loss function, remain largely unchanged, offering only limited performance improvements for SAR-based ship detection tasks. Moreover, YOLOv8 has been extensively applied and rigorously validated, supported by a well-established community and comprehensive technical documentation. These factors ensure its reliability and stability in practical research applications.
Considering the model’s innovation, task suitability, and maturity of application, this study adopts YOLOv8 as the baseline model. On this foundation, we propose R-SABMNet, which aims to further enhance the accuracy and robustness of ship detection in SAR imagery.

3. Proposed Methods

This section presents detailed information regarding R-SABMNet. The overall architecture of R-SABMNet is first described. Then, the implementation principles of the SG-AFA module, the BSMF module, and the improved loss function are presented.

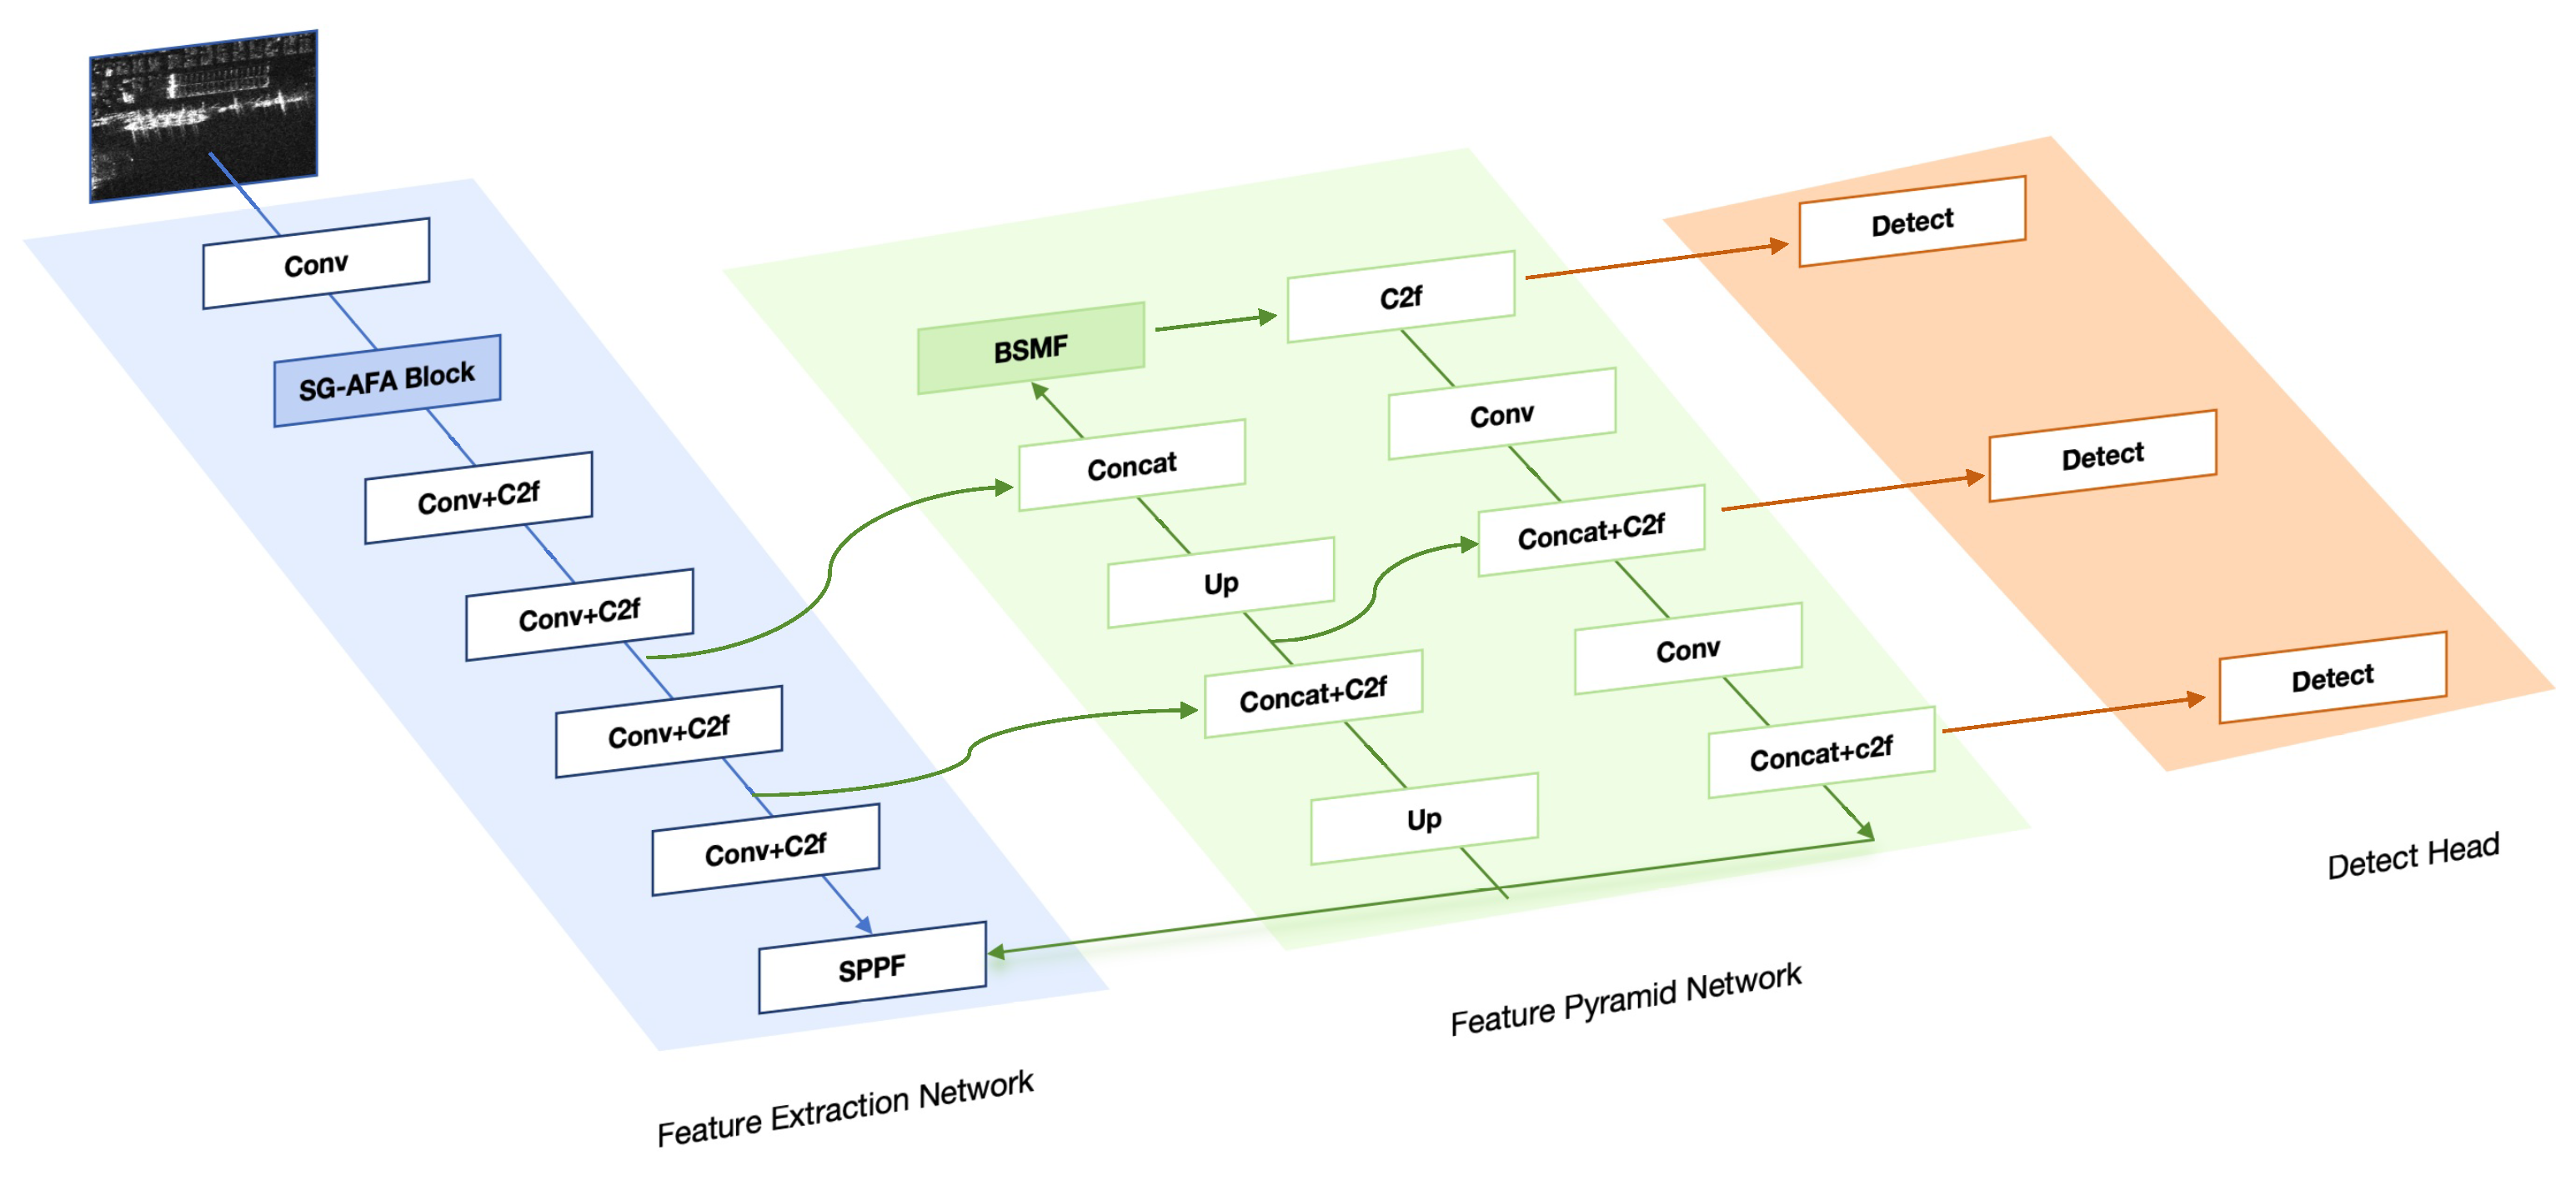
3.1. Model Structure of R-SABMNet

R-SABMNet integrates a Spatial-Guided Adaptive Feature Aggregation (SG-AFA) module and a Balanced Shifted Multi-Scale Fusion (BSMF) module. This approach combines rich and detailed information from different feature layers to achieve high-precision ship target detection. The overall architecture of R-SABMNet is shown in Figure 2. The architecture includes three primary parts: a feature extraction network with the SG-AFA module (SA-FEN), a feature pyramid network with the BSMF module (BSMF-FPN), and an improved detection head. First, the input image is resized to dimensions of 640 × 640 × 3 before feature extraction. It is then passed through the enhanced backbone, which generates three feature maps at different scales: F 3 , F 4 , and F 5 . For multi-scale feature fusion, these maps are provided to the BSMF-FPN. At the final stage, the fused features are passed into the detection head, which generates bounding boxes and classification results.

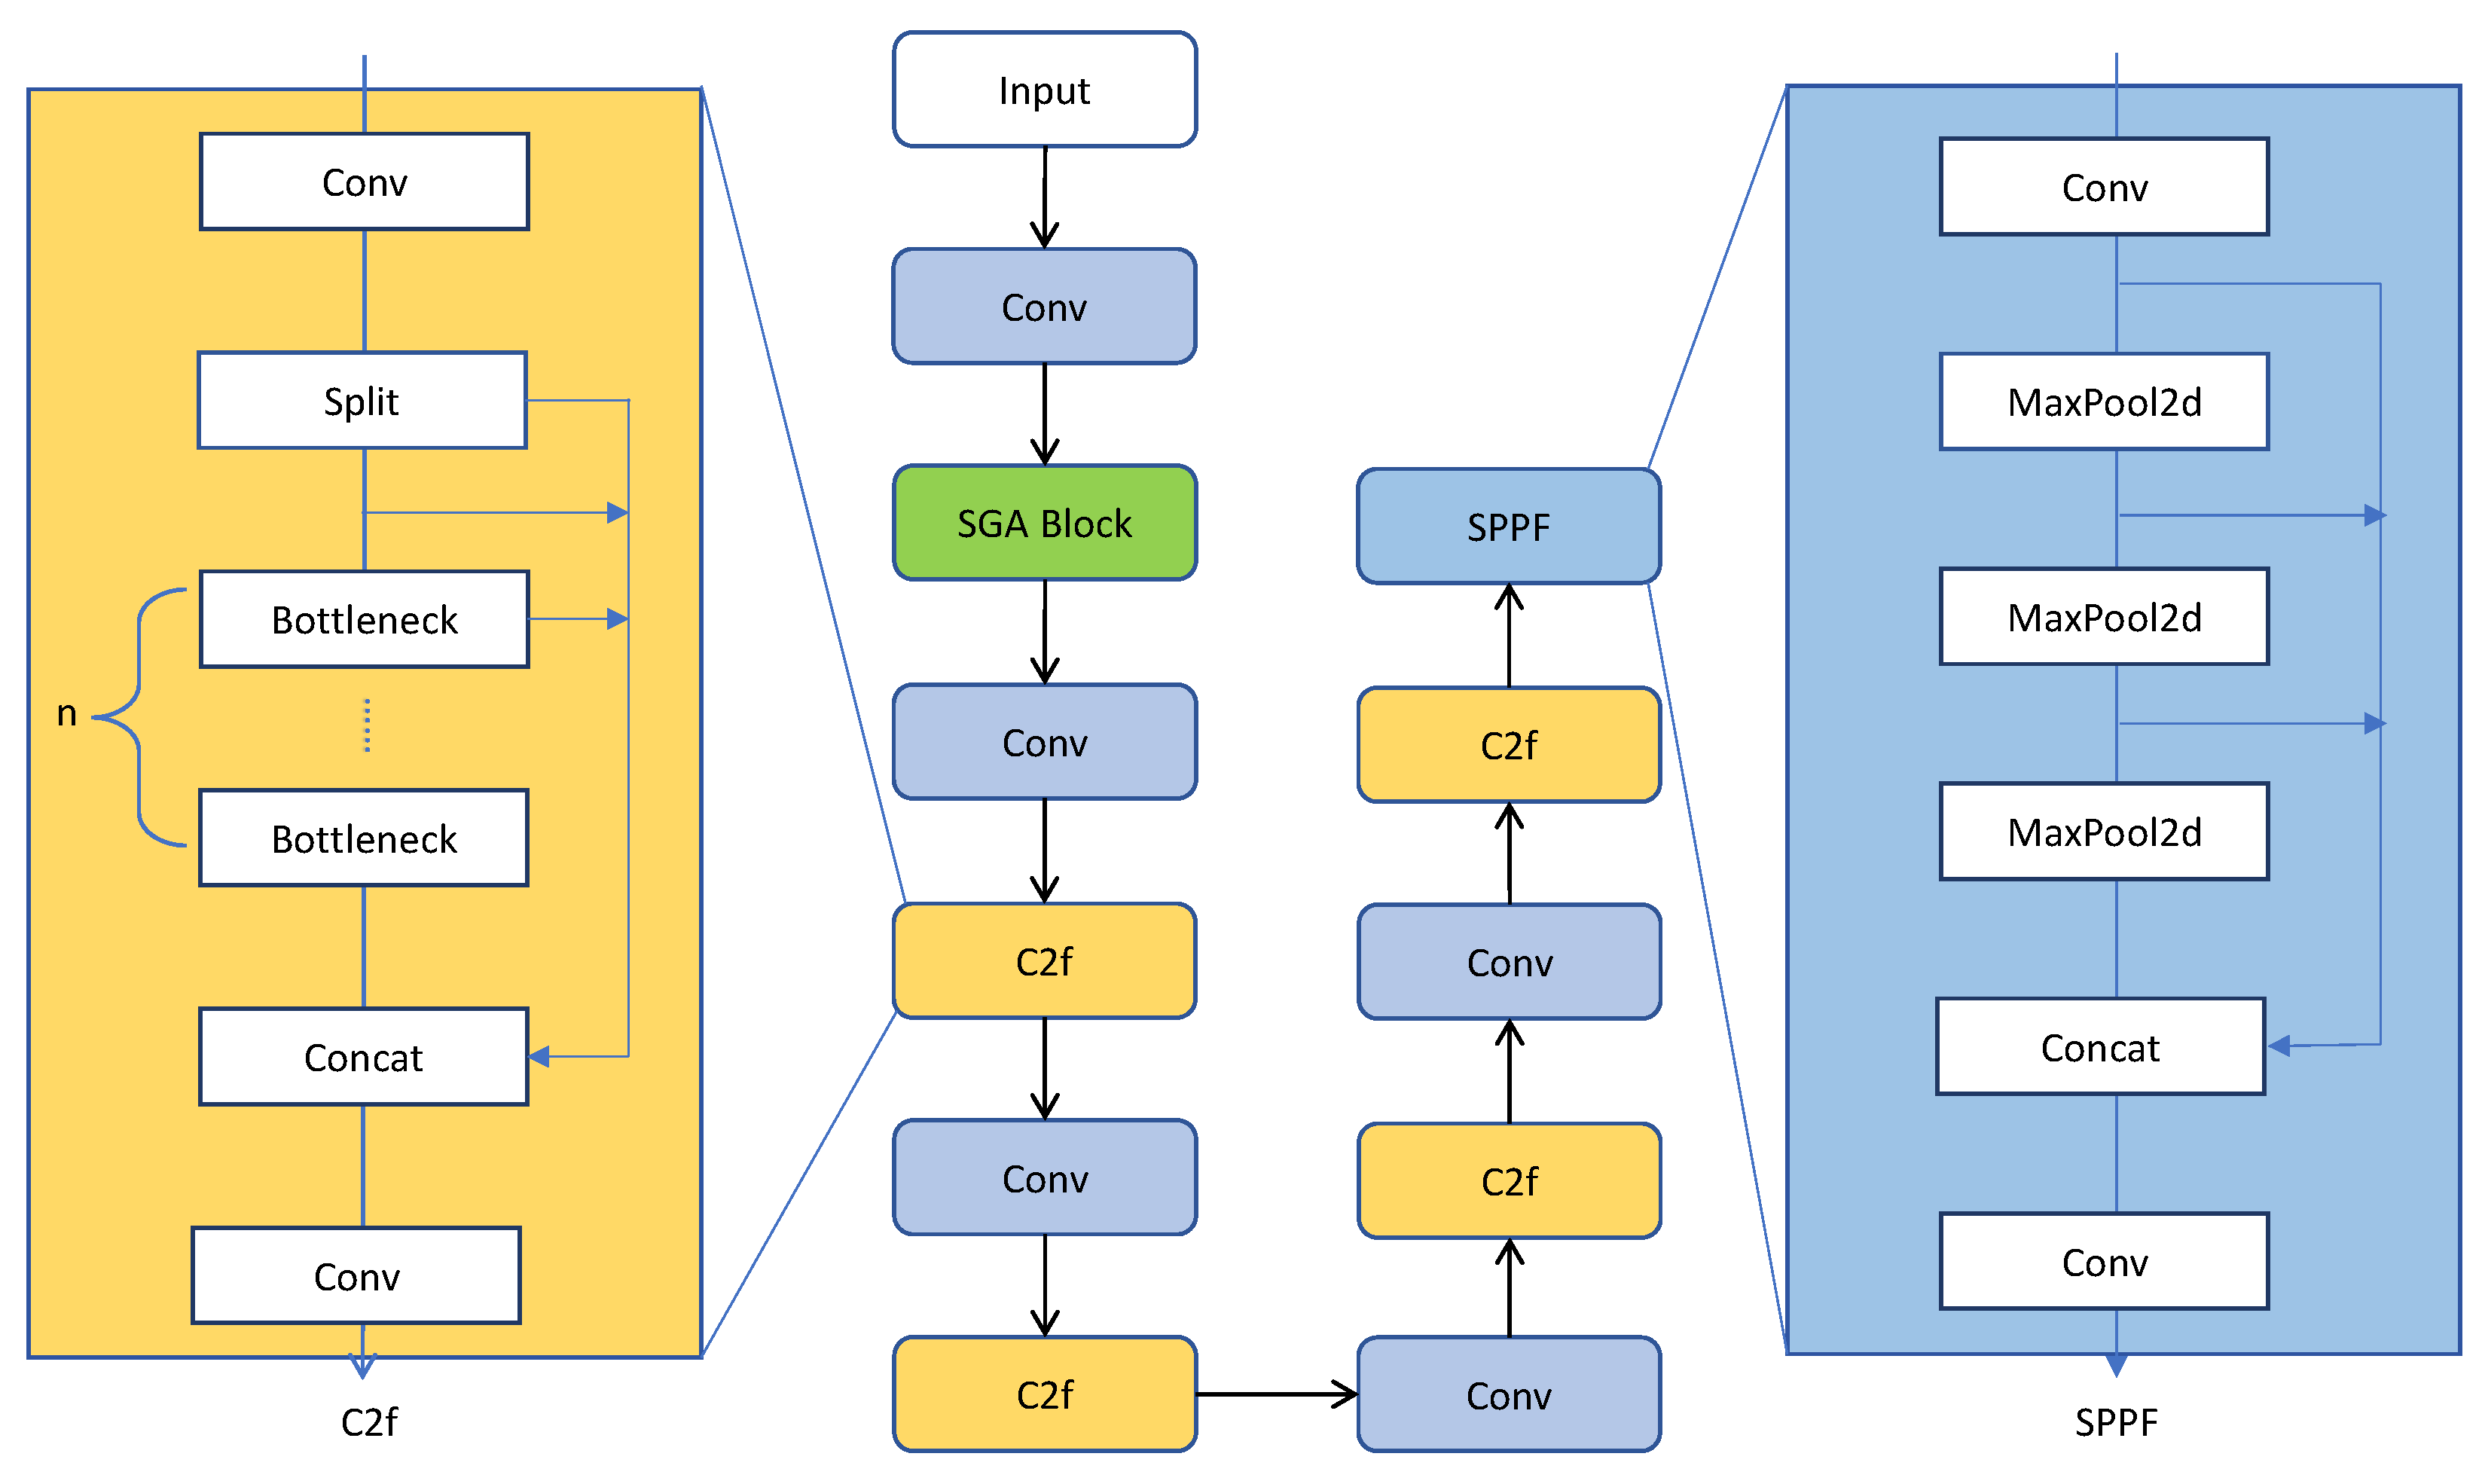
3.2. Feature Extraction Network Based on SG-AFA Module

The YOLOv8-based backbone designed for feature extraction captures semantic features at different levels. The key improvement in YOLOv8 is the Spatial Pyramid Pooling Fast (SPPF), which enhances the model’s performance by enabling better handling of multi-scale information. This improvement allows for more efficient feature extraction, leading to better accuracy and faster inference, especially when detecting objects at different scales in images. In SAR images, scattered facilities in harbors resemble ship hulls in grayscale and texture. This similarity causes strong interference, making it challenging for the original model to effectively extract ship features, resulting in misdetections and omissions. To address this, the SA-FEN is proposed. It enhances global perception, addressing the limitations of the original feature extraction network.
Figure 3 illustrates the structural composition of the SA-FEN. This network consists of a standard convolution layer, the SG-AFA module, a bottleneck layer, and a cascade of the SPPF module. First, the input image passes through the convolutional layer for initial feature extraction. This layer includes a sequence of three modules: Conv2d, BN, and SiLU activation. The features then pass through the SG-AFA module for spatially adaptive aggregation, enhancing the representation of key regions and focusing on important areas. Next, feature extraction is further refined through multiple convolutional layers and the C2f module. This fuses rich features from both shallow and deep layers, capturing multi-scale information. Finally, high-level features are output through the SPPF module, which performs multi-scale pooling on the feature map. This module aggregates both global and local information, improving the model’s capability to detect target areas at multiple scales.
Clutter and scattering interference from land regions result in a significant number of false positives. To address these issues, the SG-AFA module is proposed. Figure 4 provides an overview of the overall structure. The core idea is to consider not only the value of a single pixel but also the surrounding pixel structure and location during feature extraction. This approach supports the model so it can better catch the spatial relationships between features and enhances feature representation in key areas. This module is introduced after the standard convolutional layer of the backbone to generate the aggregated features completely. It retains the ship outline information while suppressing land scattering interference, thereby improving ship detection accuracy when handling complex backgrounds.
First, the feature matrix F is obtained using the convolutional block. The features are then evenly distributed to the adaptive average pooling (adaptive-avg-pool2d) layer to generate the initial aggregation center matrix C k = ( C x , k , C f , k ) . C x , k represents the spatial coordinate and f,k is a feature vector (e.g., color and depth). The features are normalized by the BN layer.
Second, the features are aggregated using the QS Block. The specific computational process is as follows: To assign pixels to corresponding centers, a combined spatial and feature distance metric is used:
D i , k = x i c x , k 2 s 2 + f i c f , k 2 m 2
where x i is the spatial coordinates of pixel i, and f i is the feature vector of pixel i. In addition, the parameters s and m are used to balance the influence of spatial and feature distances, respectively. A smaller s emphasizes local spatial regions, while a larger s enhances global connections. Similarly, a smaller m highlights feature similarity, whereas a larger m reduces sensitivity to feature differences. Based on multiple experimental validations, this study selects s = 15 and m = 0.85 as the final parameter configuration to balance local details and global characteristics while ensuring the stability and accuracy of feature aggregation.
Next, the aggregation weight matrix W is computed to update the superpixel centers. The initial weight matrix is computed as follows:
w i , k = e D i , k
To reduce the interference of land regions, a background suppression strategy is introduced during weight calculation. The modified weight calculation formula is as follows:
w i , k = e α D i , k β R i
where R i is the size of the region containing pixel i, and α and β are adjustable parameters for balancing the contributions of distance and background suppression. A larger α enhances the effect of distance, emphasizing local features, while a smaller α improves global aggregation capability. A larger β effectively suppresses background interference, whereas a smaller β focuses more on feature similarity. Given initial values of α 0 = 4 and β 0 = 2 , the parameters α and β are adaptively adjusted according to the formulas α = α 0 · ( 1 + Grad ) and β = β 0 1 + Grad , where Grad represents the gradient information at the corresponding position in the image. This strategy adjusts the weight contributions of background regions by reducing their influence, ensuring robust feature aggregation. Then, the weight matrix W is normalized to ensure consistent feature aggregation within each region:
w i , k = w i , k j N w j , k
Then, W is used to recalculate the aggregation center matrix C:
c f , k = i N k w i , k f i i N k w i , k , c x , k = i N k w i , k x i i N k w i , k
where N k is the set of pixels that belong to the aggregated region given by k.
Finally, the aggregated matrix F * is computed through the assignment mapping of the central matrix C, and resized to the original dimensions and concatenated with the initial features F. The result is then passed through the BN layer.
Figure 5 illustrates a comparison of feature heatmaps with and without the SG-AFA module. The SG-AFA module utilizes spatial information to adaptively aggregate features, effectively enhancing the representation of target regions while suppressing land interference. Compared to the YOLOv8 without the SG-AFA module, it adaptively adjusts feature weights based on spatial distributions. This significantly enhances the saliency of target regions and suppresses land scattering interference. Under complex backgrounds, the SG-AFA module demonstrates superior spatial consistency and feature aggregation capability. Experimental results indicate that the module enhances the sensitivity to ship features and distinguishes targets from the surrounding land regions.

3.3. Feature Pyramid Network with BSMF Module

A network must be capable of processing multi-scale features due to ships’ multi-scale characteristics. The FPN can fuse features at different scales using a multi-level network structure, making it suitable for multi-scale scenarios. However, FPNs lose some internal structural information during pooling operations. This weakens the model’s ability to reconstruct small targets and capture spatial hierarchical information.
To enable effective cross-scale fusion, we propose an enhanced feature fusion network, as observed in Figure 6. The extracted features ( F 3 , F 4 , F 5 ) from the backbone are input into the BSMF-FPN module to boost the feature representation capability. In convolutional networks, small target features in SAR images often fade during deep feature extraction. This can lead to missed detections. To address this, the BSMF-FPN introduces the BSMF module into the shallow feature channel F 3 . This enhances local information and feature representation, providing the model with richer semantic data.
The BSMF module consists of two key components: window-based multi-self-attention (W-MSA) and balanced shifted multi-self-attention (BS-MSA). It includes a cascade of LayerNorm and MLP layers. Figure 7 illustrates the model’s specific structure. It splits the image into multiple windows and performs self-attention within each window. This mechanism captures local features and reduces computational complexity. The sliding window mechanism enables information exchange between neighboring windows. This improves its ability to integrate both local and global information.
First, the W-MSA is applied within a local window. The input feature map is decomposed into multiple separate windows. Then, self-attention is applied within each window to capture local features. This reduces computational cost by eliminating global computation to enhance detailed local information.
In BS-MSA, the balanced shifted operation is introduced. The window division shifts relative to the previous layer, adjusting the window size and shift step based on local feature map details. This helps the model establish associations between local windows and capture a broader range of contextual information. By alternating between W-MSA and BS-MSA, this model captures global information and cross-window dependencies while maintaining low computational complexity.
Figure 8 illustrates the implementation of balanced shifted windows. In layer l (left side), an average window division strategy is applied. Then, self-attention is calculated individually for each window. In layer l + 1 (right side), the windows are shifted according to the current configuration, forming new windows. Smaller window sizes and shift steps are used at target edges or in complex regions (with high gradients) to preserve important details and edge information. In contrast, larger shift steps in background or low-gradient areas facilitate a broader range of information interaction across windows, enhancing the global semantic understanding of the image. The self-attention operation in the new window extends across the boundaries of the windows in layer l, enabling cross-window connectivity.
Compared to the original FPN, the BSMF-FPN integrates the BSMF module into the shallow feature channels. This approach mitigates information loss and enhances the fusion capability of deeper features in FPN, ultimately advancing the model’s capacity to detect multi-scale objects.

3.4. Improved Detect Head with GWD

In SAR images, ships are often not fixed in direction and are densely arranged. The horizontal frame provides only a rectangular bounding box with a fixed orientation, which is insufficient for accurately enclosing vessels. This increases the likelihood of false positives and missed detections. Especially in the case of closely spaced ships, they may be misclassified as a single target. In contrast, the rotating frame can align with the ship’s actual orientation. This tightens the bounding box around the target, reducing background interference. Additionally, the rotating frame adapts better to small or irregularly shaped targets. Therefore, oriented detection with a rotating frame offers distinct advantages in SAR vessel detection. It better handles the multi-angle and elongated shapes of vessels, improving both accuracy and efficiency. A branch for angle prediction is added to the YOLOv8 model for oriented detection. This forms three decoupled detection heads: the classification, regression, and angle prediction branches, each optimized with different loss functions. However, the computation of RIOU for two rotating frames in OBB detection is non-differentiable. This prevents efficient gradient computation during backpropagation. To address this, this paper introduces the GWD function for regression. This function measures the difference between rotating frames by calculating the Wasserstein distance between two Gaussian distributions.
It is assumed that each rotated bounding box can be approximated by a 2D Gaussian distribution as presented in Figure 9. The red rectangle represents the rotated bounding box, while the inside depicts the corresponding Gaussian distribution. The mean (m) of this distribution represents the center of the bounding rectangle, while the covariance matrix (∑) captures the box’s dimensions and rotation. The rotated bounding box B ( x , y , h , w , θ ) is first transformed into the distribution N ( m , ) .
1 / 2 = R S R T = c o s θ s i n θ s i n θ c o s θ w 2 0 0 h 2 c o s θ s i n θ s i n θ c o s θ
m = ( x , y )
Once the rotated rectangle is converted to a Gaussian distribution, the Wasserstein distance can be used to evaluate the distance between the two distributions. And the Wasserstein distance can be computed using the following formula:
d 2 = m 1 m 2 2 2 + T r ( 1 + 2 2 ( 1 1 / 2 2 1 1 / 2 ) 1 / 2 )
where m 1 and m 2 are the mean values of the two Gaussian distributions that correspond to the centers of the rotated bounding boxes, and 1 and 2 are the covariance matrices, representing the dimensions and orientations of the rotated boxes. By calculating the Wasserstein distance, we can measure the geometric difference between the two rotated bounding boxes. This method removes the requirement for intricate IoU calculations.
The Generalized Wasserstein Distance (GWD) is mapped to a form that is similar to an IoU-based loss function using a nonlinear transformation function f. The Gaussian function helps focus more on densely located targets, effectively reducing the influence of background regions. It is especially well suited for scenarios where targets are concentrated and close to each other. This enhances the representation of local target information. Therefore, it realizes the nonlinear transformation as f. The IoU-like loss function is as follows:
L g w d = 1 1 τ + f ( d 2 ) , τ 1 .
where d 2 represents the squared distance between the target and predicted regions and τ is a hyperparameter for controlling the sensitivity of the transformation. Using cross-validation, different values of τ were tested during training on the validation set. The results showed that τ = 2 achieved the best performance. Therefore, τ = 2 was chosen as the value for this hyperparameter in this study.
Therefore, GWD simplifies the model’s learning by representing rotated frames as 2D Gaussian distributions. This approach effectively handles challenges related to inconsistent angles and scales.

4. Results

The effectiveness of R-SABMNet is evaluated through ablation comparative experiments and experiments.

4.1. Datasets

We chose the SSDD+ [51] and HRSID [52] datasets as the research data for this paper. These datasets include both offshore and onshore ships, as well as a variety of complex marine scenes. They are labeled with rotated bounding boxes. The first dataset contains 2456 ship targets. The primary sources of the images in this dataset are TerraSAR-X, Sentinel-1, and RadarSat-2. The image resolutions range from 1 m to 15 m. The second dataset includes 5604 images. Satellite sensors, including TanDEM-X and Sentinel-1B, were used to obtain these images. The image resolutions range from 0.5 m to 3 m. Table 1 outlines comprehensive information about each dataset.

4.2. Performance Evaluation Metrics

To quantitatively evaluate the detection performance of the R-SABMNet, we use three widely adopted metrics: recall, precision, and AP, which are calculated using the following formulas:
R e c a l l = T P T P + F N
P r e c i s i o n = T P T P + F P
A P = 0 1 P ( R ) d R
where the number of missed targets is denoted by F N , the number of correctly detected targets is T P , and F P indicates the number of falsely detected targets.

4.3. Experiment Details

The experiments in this paper were conducted within a network built on PyTorch 2.1.0, running on a Windows 11 system. YOLOv8n was utilized as the baseline model. After multiple rounds of experimental validation, we set the number of training epochs to 150 and the batch size to eight. The optimization algorithm used was SGD, and the initial rate of learning was 0.0025. The hardware configuration included a 13th Gen Intel i5-13400F CPU (2.50 GHz), an NVIDIA RTX 4060 GPU with 8 GB of video memory, and 64 GB of RAM.

4.4. Comparison with Other Classical Methods

To evaluate the effectiveness of R-SABMNet, this paper selects nine popular directional detection methods for comparison on the SSDD+ dataset. As shown in Table 2, the comparison results are summarized.
Our comparison experiments include both classical two-stage [53,54] and single-stage detectors [55,56]. In addition, we selected the latest YOLOv8-based oriented ship detection model, R-LRBPNet [57], as a comparison model to validate the effectiveness of the proposed approach. It integrates advanced components such as bottleneck transformers, angle decoupling, and lightweight receptive field feature convolution to enhance feature extraction and detection accuracy. Among all detection models, the proposed R-SABMNet outperforms the others across all metrics. Compared to the baseline model in this experiment, R-SABMNet improves accuracy by 2.15%, recall by 1.79%, and AP by 1.22%. Furthermore, compared to R-LRBPNet, the proposed network’s SG-AFA module significantly enhances the model’s sensitivity to ship targets and its capability to represent key regions. As a result, our model achieves a notable improvement in accuracy, outperforming R-LRBPNet by 1.39%. Additionally, by representing oriented bounding boxes as two-dimensional Gaussian distributions, GWD effectively mitigates challenges caused by angular and scale inconsistencies, leading to a 0.59% increase in recall for our model.
To further demonstrate the effectiveness of R-SABMNet, this paper visualizes the results from different methods, as shown in Figure 10. These visualizations clearly demonstrate the ship detection capabilities of each method in complex scenarios. From the comparison, it is evident that our method has a significant advantage, while the other models show varying degrees of false alarms and missed detections. Specifically, in Scene 1, two land areas are mistakenly detected as ships by O-RCNN. The same is the case with Scene 2: sea surface clutter and port facilities are incorrectly identified as ships by O-RCNN, R-YOLOv7, and even R-YOLOv8. In contrast, our method detects all targets correctly, with no false positives or missed detections. This is attributed to the SG-AFA module, which suppresses land scattering interference, enhancing the model’s sensitivity to ship targets and its ability to express key regions. Additionally, a ship on Scene 4’s right side is missed by YOLOv7. Additionally, in Scene 4, dense ships lead to redundant detection boxes by the R-YOLOv8. By contrast, our method performs better, which can be attributed to the GWD, which effectively solves the problem of localization error due to angle and scale inconsistency in dense scenes. In summary, the comparison results clearly confirm that our algorithm achieves superior detection performance.
Since the HRSID provides higher image quality and includes more targets than the SSDD+ dataset, it is well suited for complex target detection tasks. To evaluate the generalization and robustness of R-SABMNet, this paper conducts the same comparison experiments on this dataset. The comparison results in Table 3 show that R-SABMNet far exceeds all competing methods in overall performance. Specifically, our model achieves an accuracy improvement of 1.84%, a recall increase of 3.08%, and a 2.89% enhancement in AP compared to the baseline R-YOLOv8. Similarly, compared to R-LRBPNet, a model also improved from YOLOv8, our model achieves higher precision (92.56% vs. 91.35%), recall (89.43% vs. 87.59%), and AP (90.69% vs. 88.74%) on the HRSID dataset. These improvements further confirm the effectiveness and generalizability of R-SABMNet across different datasets.
To further validate the effectiveness of the model, we selected densely arranged and irregularly oriented scene images for inference testing on the HRSID dataset. Meanwhile, we selected YOLOv8 and R-LRBPNet as comparison methods to verify the improvements of our approach over YOLOv8. Comparative experiments were conducted, with a focus on highlighting the angular differences of the rotated detection boxes. The experimental results are shown in Figure 11. Unlike previous comparisons, this result comparison includes P cases, where the number of rotated bounding boxes is incorrect or the rotation angles differ significantly, highlighted with purple boxes in the figure.
As shown in subfigures (a–d), both the baseline and R-LRBPNet exhibit angular and area errors in the detection results of adjacent targets. In contrast, our method incorporates GWD, which provides a more accurate distance metric for rotated bounding boxes, thereby reducing the errors in RIoU and rotation angles calculations and improving the model’s recall. Subfigures (e–h) illustrate densely packed ship regions with irregular orientations. Due to the high target density, YOLOv8 suffers from significant missed and false detections, with R-LRBPNet performing similarly. In comparison, our model not only substantially reduces both missed and false detections but also mitigates large angular errors present in the baseline. These results demonstrate that by integrating the GWD module, our model optimizes the computation of the intersection-over-union for rotated bounding boxes, effectively reducing false and missed detections, thereby enhancing both detection accuracy and recall.

4.5. Ablation Studies

To thoroughly validate the function of each improvement of R-SABMNet, ablation studies were conducted. The original R-YOLOv8 model serves as the baseline. We conducted three ablation experiments for both quantitative and qualitative analysis. All experiments were conducted under consistent conditions with identical parameter settings to ensure the reliability and validity of the results. We examined the effects of three improvements combined with the baseline model: the SG-AFA module, the BSMF module, and the GWD function. Table 4 displays the results. When the SG-AFA module is added to the baseline, precision increases by 1.47%, recall improves by 0.62%, and AP rises by 0.65%. This improvement is due to the spatial feature aggregation, which enhances the model’s sensitivity to ship targets. Adding the BSMF module further enhances multi-scale feature fusion, increasing precision by 0.64%. Additionally, incorporating the GWD loss function for regression addresses the size, shape, and orientation of rotating boxes. This improvement boosts recall from 91.99% to 93.13%, as shown in row 4 of Table 4.

4.5.1. Effect of SG-AFA Module

Due to the strong similarity in grayscale values and texture features between harbor infrastructure and ship hulls in SAR images, significant interference is introduced. This makes it difficult for the original model to accurately extract ship features, leading to misdetections. To address this, we integrate the SG-AFA module into the baseline model. It enhances feature representation in key regions by incorporating spatial location information, enabling the model to effectively distinguish ship targets while suppressing land scattering interference. As a result, ship detection accuracy improves in cases with complex backgrounds.
We evaluated the performance of the proposed method in complex scenarios, and the comparison results are shown in Figure 12. Subplots (a–c) represent the intersection of nearshore and ocean regions, a scene characterized by both land scattering interference and severe ocean clutter. As shown in subplot (b), YOLOv8 falsely detected two port facilities with scattering characteristics similar to ship targets, along with two significant ocean noise regions that were misclassified as targets. This could be attributed to the lack of mechanisms for capturing the spatial characteristics of ships, leading to severe interference from land scattering and ocean noise in the detection results. With the addition of the SG-AFA module to the baseline model, the model effectively enhanced the representation of key regions by adaptively aggregating spatial features, thus improving detection accuracy. As shown in subplot (c), the improved model accurately identified all targets with zero false positives. Subplots (d–f) depict a nearshore port scene where severe land scattering interference is present. In subplot (e), the baseline model demonstrates a high sensitivity to land scattering, resulting in some false positives. However, the improved detection results, as shown in subplot (f), reveal a significant reduction in false positives in areas with dense land interference. These experimental results indicate that the SG-AFA module not only mitigates the impact of land scattering but also enhances the representation of key features in complex nearshore environments, further validating the effectiveness of the module.

4.5.2. Effect of BSMF Module

During deep feature extraction in convolutional networks, a significant amount of information from small targets in SAR images is lost, leading to missed detections. To deal with this, we proposed the BSMF module to be added into the baseline model during the feature fusion stage. This module enhances the information flow between features of different scales, reduces shallow feature loss, and improves feature fusion in the FPN by capturing global dependencies across spatial locations. This ultimately boosts the performance of YOLOv8.
Figure 13 demonstrates the performance of the proposed method in multi-scale ship detection scenarios. Subfigures (a–c) present the detection results of densely distributed ships in nearshore scenes, while subfigures (d–f) display the detection results of multi-scale ships docked near port facilities. As illustrated in subfigures (b,e), due to the dense arrangement of ships and the severe interference from port facilities, the baseline model exhibits missed detections of targets and false detections caused by land scattering interference. This highlights the baseline model’s insufficient sensitivity to variations in multi-scale features. The limitations become particularly evident when the spatial features of ships are obscured by surrounding ships or complex backgrounds.
After integrating the BSMF module, the model’s sensitivity to multi-scale features is significantly improved. As shown in Figure 13f, the improved method successfully detects ships that were previously missed. Furthermore, as illustrated in Figure 13c, false detections caused by land scattering interference are also reduced. These results demonstrate that the BSMF module effectively preserves shallow features and combines them with deep features. By incorporating the fusion-balanced shifted cross-window multi-head attention mechanism, the module substantially reduces both missed and false detections, further validating its effectiveness in enhancing overall detection performance.

4.5.3. Effect of GWD

Ships in SAR images are typically not fixed in direction and are densely arranged, making the calculation of RIOU between two rotating frames in OBB detection a complex task. The backpropagation process cannot efficiently compute the gradient, resulting in suboptimal model optimization and increasing the likelihood of misdetections and omissions. The following issues often arise: (1) in dense ship scenarios, adjacent ship targets are misclassified as a single target, as shown by the blue box in Figure 14e; (2) redundant detection frames are generated when ships are closely arranged, as shown in Figure 14b. To address these issues, we introduce the GWD into our method. This function measures the difference between rotated frames using the Wasserstein distance of corresponding Gaussian distributions. It effectively handles the size, shape, and orientation of rotated bounding boxes while improving the performance and efficiency of the detection model.
As shown in Figure 14, we evaluated the performance of the proposed method in scenarios where ships are densely arranged and oriented irregularly. Figure 14a,b depict the ground truth of ship detection in two port scenarios with densely arranged ships. From the comparison results, it is evident that the baseline method exhibits significant limitations in such complex scenarios. Specifically, in Figure 14b, redundant detection boxes are concentrated near densely distributed ships, while Figure 14e demonstrates merged detections where a single bounding box covers multiple distinct ships. These issues highlight the baseline method’s inability to distinguish spatially proximate targets and its limited capacity for optimizing rotated bounding boxes. In contrast, as shown in Figure 14c,f, the proposed method significantly mitigates these problems. Redundant detection boxes are effectively eliminated, and densely arranged ship targets are accurately separated. This improvement can be attributed to the incorporation of GWD, which calculates the differences between rotated bounding boxes based on the Wasserstein distance of their corresponding Gaussian distributions. GWD enables precise modeling of the geometric and spatial characteristics of ships, allowing the network to capture subtle distinctions between overlapping or densely arranged targets. The experimental results validate the superiority of the proposed method in detecting densely arranged ships, demonstrating its capability to improve the robustness and detection efficiency of the model in complex SAR image scenarios.

4.6. Generalization Ability Test

To assess the generalization performance of R-SABMNet, we selected a Gaofen-3 SAR image captured in 2022 near the southern mouth of the Yangtze River. The image, with a resolution of 1 m, is located at approximately ( 122 . 20 ° E , 29 . 95 ° N ) , in an archipelago off the northeastern coast of Zhejiang Province, China. We use the weights trained on the SSDD+ dataset to test the method’s generalization ability. First, two representative regions were selected from this image for examination, as shown in Figure 15. Region 2 covers a mixed nearshore and offshore scene, while Region 1 represents an offshore scene. The effectiveness of the R-SABMNet is compared to the baseline. The detection results of the baseline model are displayed in Figure 15A,B, located in the upper left and right corners, respectively. In contrast, Figure 15C,D in the lower left and right corners display the detection results of our method.
In Region 1, where a large number of ship targets are distributed in an offshore scene, the YOLOv8 model misses five ship targets, illustrated in Figure 15A. In contrast, R-SABMNet accurately detects all the ships, achieving a high detection accuracy. Furthermore, in Region 2, the complex port area exhibits densely arranged ships and facility scattering interference. The baseline model generates several missed detections and two false positives in land areas, as seen in Figure 15B. In comparison, R-SABMNet reduces false positives, effectively suppresses interference from land areas, and significantly improves detection performance, with a substantial reduction in missed targets, as depicted in Figure 15D. This also highlights the superior ability of our method to handle land scattering interference.

4.7. Comparison of Model Inference Speed

The above experiments effectively validate that the proposed model achieves promising detection performance. However, computational complexity and runtime are equally critical for practical deployment. To further assess the practicality and feasibility of the proposed R-SABMNet, experiments were conducted across different hardware platforms.
The experimental platforms included the RTX 4060 GPU and a 13-inch MacBook Pro. The RTX 4060, featuring 3072 CUDA cores, 8 GB of GDDR6 memory, and a floating-point performance of over 20 TFLOPS, excels in high-performance tasks. In contrast, the 13-inch MacBook Pro, with its M2 GPU and 8 GB of unified memory, delivers a lower floating-point performance of 3.6 TFLOPS, but offers enhanced integration and efficiency. These hardware differences influence the models’ performance across platforms.
In addition, YOLOv8 (baseline) and YOLOv11 were selected as comparison models to evaluate the inference speed of each model on various hardware platforms, thereby validating the inference speed advantage of our model. In the model inference process, the total time is divided into three main components: pre-process (Pre), inference (Infer), and post-process (Post). We conducted comparative experiments on two different devices to observe the variations across these three metrics. The results are shown in Table 5.
Despite achieving superior accuracy, our model maintains inference speeds comparable to the YOLOv8 and YOLOv11 models. On both the MacBook Pro (13-inch) and RTX 4060 GPU, R-SABMNet shows similar inference times, achieving 3.6 ms (RTX 4060) and 5.3 ms (MacBook Pro) for inference, values which are very close to the YOLOv8 and YOLOv11 models. Notably, our model excels in post-processing speed, achieving 3.7 ms (RTX 4060) and 5.3 ms (MacBook Pro), while other models have higher post-processing times. This demonstrates that R-SABMNet achieves a balance between high accuracy and efficient inference speeds, making it both effective and fast in real-world applications.

5. Conclusions

This paper proposes a new oriented detection model, R-SABMNet, for ship target detection in SAR images. This network first utilizes a feature extraction module with the SG-AFA module to enhance sensitivity to ship features and improve the representation of key regions. It significantly suppresses the scattering interference from land areas. The BSMF module is then introduced to refine local detail and establish global dependencies, thereby enhancing the model’s adaptability to handle multi-scale targets. Additionally, the GWD is employed to improve the regression loss, enabling the computation of differentiable RIOU. This effectively addresses localization errors caused by inconsistencies in angle and scale in dense scenes. A series of comparative and ablation experiments conducted on the HRSID and SSDD+ datasets demonstrate the superior detection performance of the proposed method. The results show that R-SABMNet outperforms nine other methods. Furthermore, tests on Gaofen-3 satellite imagery validate the model’s strong generalizability.
Although the experiments in this study are based on YOLOv8, the modular design ensures that the proposed approach can be flexibly integrated into other network architectures, such as ResNet, Swin Transformer, and other YOLO models. For instance, the SG-AFA module focuses on the unique characteristics of SAR images, such as edge contour enhancement and background noise suppression, significantly improving the representation of ship targets during the feature extraction stage. Meanwhile, the BSMF module incorporates a balanced offset multi-head attention mechanism, which optimizes the capture of local details and effectively models global dependencies during the multi-scale feature fusion stage. This enhances the model’s performance in multi-scale target detection. In future work, we will explore integrating the proposed approach into various backbone networks to further investigate improvements in detection performance and computational efficiency. Special attention should be given to addressing compatibility issues related to feature map resolution and optimizing computational efficiency to accommodate diverse practical application scenarios.

Author Contributions

Conceptualization, X.L. (Xiaoting Li); data curation, X.L. (Xiaoting Li); formal analysis, X.L. (Xiaoting Li) and W.D.; funding acquisition, X.F.; investigation, X.L. (Xiaoting Li); methodology, X.L. (Xiaoting Li); project administration, X.F. and X.L. (Xiaolei Lv); resources, X.F.; software, X.L. (Xiaoting Li); supervision, X.L. (Xiaolei Lv); validation, X.L. (Xiaoting Li); visualization, X.L. (Xiaoting Li); writing—original draft, X.L. (Xiaoting Li); writing—review and editing, X.L. (Xiaoting Li) and W.D. All authors have read and agreed to the published version of the manuscript.

Funding

This research was funded by the LuTan-1 L-Band Spaceborne Bistatic SAR data processing program, grant number E0H2080702.

Data Availability Statement

The datasets used in this paper are available at the following URLs: https://gitcode.com/gh_mirrors/of/Official-SSDD, accessed on 23 May 2024, and https://github.com/chaozhong2010/HRSID, accessed on 7 June 2024.

Conflicts of Interest

The authors declare no conflicts of interest.

References

  1. Yasir, M.; Jianhua, W.; Mingming, X.; Hui, S.; Zhe, Z.; Shanwei, L.; Colak, A.T.I.; Hossain, M.S. Ship detection based on deep learning using SAR imagery: A systematic literature review. Soft Comput. 2023, 27, 63–84. [Google Scholar] [CrossRef]
  2. Steenson, B.O. Detection performance of a mean-level threshold. IEEE Trans. Aerosp. Electron. Syst. 1968, AES-4, 529–534. [Google Scholar] [CrossRef]
  3. Novak, L.M.; Burl, M.C.; Irving, W. Optimal polarimetric processing for enhanced target detection. IEEE Trans. Aerosp. Electron. Syst. 1993, 29, 234–244. [Google Scholar] [CrossRef]
  4. Li, J.; Xu, C.; Su, H.; Gao, L.; Wang, T. Deep learning for SAR ship detection: Past, present and future. Remote Sens. 2022, 14, 2712. [Google Scholar] [CrossRef]
  5. Leng, X.; Ji, K.; Song, H. Key factors influencing ship detection in spaceborne SAR imagery. Remote Sens. Inf. 2016, 31, 3–12. [Google Scholar]
  6. Zhao, W.; Huang, L.; Liu, H.; Yan, C. Scattering-Point-Guided Oriented RepPoints for Ship Detection. Remote Sens. 2024, 16, 933. [Google Scholar] [CrossRef]
  7. Zhang, C.; Gao, G.; Liu, J.; Duan, D. Oriented ship detection based on soft thresholding and context information in SAR images of complex scenes. IEEE Trans. Geosci. Remote Sens. 2023, 62, 5200615. [Google Scholar] [CrossRef]
  8. Grover, A.; Kumar, S.; Kumar, A. Ship detection using Sentinel-1 SAR data. ISPRS Ann. Photogramm. Remote Sens. Spat. Inf. Sci. 2018, 4, 317–324. [Google Scholar] [CrossRef]
  9. Zheng, Y.; Liu, P.; Qian, L.; Qin, S.; Liu, X.; Ma, Y.; Cheng, G. Recognition and depth estimation of ships based on binocular stereo vision. J. Mar. Sci. Eng. 2022, 10, 1153. [Google Scholar] [CrossRef]
  10. Zhang, F.; Yao, X.; Tang, H.; Yin, Q.; Hu, Y.; Lei, B. Multiple mode SAR raw data simulation and parallel acceleration for Gaofen-3 mission. IEEE J. Sel. Top. Appl. Earth Obs. Remote Sens. 2018, 11, 2115–2126. [Google Scholar] [CrossRef]
  11. Zhang, X.; Yao, L.; Lü, Y.; Han, P.; Li, J. Center based model for arbitrary-oriented ship detection in remote sensing images. Acta Photonica Sin. 2020, 49, 0410005. [Google Scholar] [CrossRef]
  12. Li, C.; Xu, H.; Qian, K.; Deng, B.; Feng, Z. Survey of ship detection technology based on deep learning. J. Ordnance Equip. Eng. 2021, 42, 57–63. [Google Scholar]
  13. Gao, G.; Zhang, C.; Zhang, L.; Duan, D. Scattering characteristic-aware fully polarized SAR ship detection network based on a four-component decomposition model. IEEE Trans. Geosci. Remote Sens. 2023, 61, 5222722. [Google Scholar] [CrossRef]
  14. Wang, J.; Lu, C.; Jiang, W. Simultaneous ship detection and orientation estimation in SAR images based on attention module and angle regression. Sensors 2018, 18, 2851. [Google Scholar] [CrossRef]
  15. Zhou, K.; Zhang, M.; Wang, H.; Tan, J. Ship detection in SAR images based on multi-scale feature extraction and adaptive feature fusion. Remote Sens. 2022, 14, 755. [Google Scholar] [CrossRef]
  16. Shiqi, C.; Ronghui, Z.; Jun, Z. Regional attention-based single shot detector for SAR ship detection. J. Eng. 2019, 2019, 7381–7384. [Google Scholar] [CrossRef]
  17. Liu, S.; Kong, W.; Chen, X.; Xu, M.; Yasir, M.; Zhao, L.; Li, J. Multi-scale ship detection algorithm based on a lightweight neural network for spaceborne SAR images. Remote Sens. 2022, 14, 1149. [Google Scholar] [CrossRef]
  18. Zhu, H.; Xie, Y.; Huang, H.; Jing, C.; Rong, Y.; Wang, C. DB-YOLO: A duplicate bilateral YOLO network for multi-scale ship detection in SAR images. Sensors 2021, 21, 8146. [Google Scholar] [CrossRef] [PubMed]
  19. Zhu, M.; Hu, G.; Li, S.; Zhou, H.; Wang, S. FSFADet: Arbitrary-oriented ship detection for SAR images based on feature separation and feature alignment. Neural Process. Lett. 2022, 54, 1995–2005. [Google Scholar] [CrossRef]
  20. Fang, M.; Gu, Y.; Peng, D. FEVT-SAR: Multi-category Oriented SAR Ship Detection Based on Feature Enhancement Vision Transformer. IEEE J. Sel. Top. Appl. Earth Obs. Remote Sens. 2024, 18, 2704–2717. [Google Scholar] [CrossRef]
  21. Han, J.; Ding, J.; Li, J.; Xia, G.S. Align deep features for oriented object detection. IEEE Trans. Geosci. Remote Sens. 2021, 60, 5602511. [Google Scholar] [CrossRef]
  22. Zhang, Y.; Hao, Y. A survey of SAR image target detection based on convolutional neural networks. Remote Sens. 2022, 14, 6240. [Google Scholar] [CrossRef]
  23. Li, D.; Liang, Q.; Liu, H.; Liu, Q.; Liu, H.; Liao, G. A novel multidimensional domain deep learning network for SAR ship detection. IEEE Trans. Geosci. Remote Sens. 2021, 60, 5203213. [Google Scholar] [CrossRef]
  24. Huang, Q.; Zhu, W.; Li, Y.; Zhu, B.; Gao, T.; Wang, P. Survey of target detection algorithms in SAR images. In Proceedings of the 2021 IEEE 5th Advanced Information Technology, Electronic and Automation Control Conference (IAEAC), Chongqing, China, 12–14 March 2021; IEEE: New York, NY, USA, 2021; pp. 1756–1765. [Google Scholar]
  25. Leng, X.; Ji, K.; Yang, K.; Zou, H. A bilateral CFAR algorithm for ship detection in SAR images. IEEE Geosci. Remote Sens. Lett. 2015, 12, 1536–1540. [Google Scholar] [CrossRef]
  26. Liu, T.; Zhang, J.; Gao, G.; Yang, J.; Marino, A. CFAR ship detection in polarimetric synthetic aperture radar images based on whitening filter. IEEE Trans. Geosci. Remote Sens. 2019, 58, 58–81. [Google Scholar] [CrossRef]
  27. Wang, S.; Wang, M.; Yang, S.; Jiao, L. New hierarchical saliency filtering for fast ship detection in high-resolution SAR images. IEEE Trans. Geosci. Remote Sens. 2016, 55, 351–362. [Google Scholar] [CrossRef]
  28. Kapur, J.N.; Sahoo, P.K.; Wong, A.K. A new method for gray-level picture thresholding using the entropy of the histogram. Comput. Vis. Graph. Image Process. 1985, 29, 273–285. [Google Scholar] [CrossRef]
  29. Wardlow, B.D.; Egbert, S.L.; Kastens, J.H. Analysis of time-series MODIS 250 m vegetation index data for crop classification in the US Central Great Plains. Remote Sens. Environ. 2007, 108, 290–310. [Google Scholar] [CrossRef]
  30. Fan, W.; Zhou, F.; Bai, X.; Tao, M.; Tian, T. Ship detection using deep convolutional neural networks for PolSAR images. Remote Sens. 2019, 11, 2862. [Google Scholar] [CrossRef]
  31. Wu, F.; He, J.; Zhou, G.; Li, H.; Liu, Y.; Sui, X. Improved Oriented Object Detection in Remote Sensing Images Based on a Three-Point Regression Method. Remote Sens. 2021, 13, 4517. [Google Scholar] [CrossRef]
  32. Du, L.; Wang, Z.; Wang, Y.; Wei, D.; Li, L. Survey of research progress on target detection and discrimination of single-channel SAR images for complex scenes. J. Radars 2020, 9, 34–54. [Google Scholar]
  33. Ren, S.; He, K.; Girshick, R.; Sun, J. Faster R-CNN: Towards real-time object detection with region proposal networks. IEEE Trans. Pattern Anal. Mach. Intell. 2016, 39, 1137–1149. [Google Scholar] [CrossRef] [PubMed]
  34. Pang, J.; Chen, K.; Shi, J.; Feng, H.; Ouyang, W.; Lin, D. Libra r-cnn: Towards balanced learning for object detection. In Proceedings of the IEEE/CVF Conference on Computer Vision and Pattern Recognition, Long Beach, CA, USA, 16–20 June 2019; pp. 821–830. [Google Scholar]
  35. He, K.; Gkioxari, G.; Dollár, P.; Girshick, R. Mask r-cnn. In Proceedings of the IEEE International Conference on Computer Vision, Venice, Italy, 22–29 October 2017; pp. 2961–2969. [Google Scholar]
  36. Redmon, J. You only look once: Unified, real-time object detection. In Proceedings of the IEEE Conference on Computer Vision and Pattern Recognition, Las Vegas, NV, USA, 27–30 June 2016. [Google Scholar]
  37. Wang, C.Y.; Bochkovskiy, A.; Liao, H.Y.M. YOLOv7: Trainable bag-of-freebies sets new state-of-the-art for real-time object detectors. In Proceedings of the IEEE/CVF Conference on Computer Vision and Pattern Recognition, Vancouver, BC, Canada, 17–24 June 2023; pp. 7464–7475. [Google Scholar]
  38. Ge, Z. Yolox: Exceeding yolo series in 2021. arXiv 2021, arXiv:2107.08430. [Google Scholar]
  39. Liu, W.; Anguelov, D.; Erhan, D.; Szegedy, C.; Reed, S.; Fu, C.Y.; Berg, A.C. Ssd: Single shot multibox detector. In Proceedings of the Computer Vision–ECCV 2016: 14th European Conference, Amsterdam, The Netherlands, 11–14 October 2016; Proceedings, Part I 14. Springer: Berlin/Heidelberg, Germany, 2016; pp. 21–37. [Google Scholar]
  40. Tian, Z.; Shen, C.; Chen, H.; He, T. FCOS: Fully Convolutional One-Stage Object Detection. In Proceedings of the 2019 IEEE/CVF International Conference on Computer Vision (ICCV), Seoul, Republic of Korea, 27 October–2 November 2019; pp. 9626–9635. [Google Scholar] [CrossRef]
  41. Zhang, T.; Zhang, X.; Ke, X.; Zhan, X.; Shi, J.; Wei, S.; Pan, D.; Li, J.; Su, H.; Zhou, Y.; et al. LS-SSDD-v1. 0: A deep learning dataset dedicated to small ship detection from large-scale Sentinel-1 SAR images. Remote Sens. 2020, 12, 2997. [Google Scholar] [CrossRef]
  42. Lin, T.Y.; Dollár, P.; Girshick, R.; He, K.; Hariharan, B.; Belongie, S. Feature pyramid networks for object detection. In Proceedings of the IEEE Conference on Computer Vision and Pattern Recognition, Honolulu, HI, USA, 21–26 July 2017; pp. 2117–2125. [Google Scholar]
  43. Cui, Z.; Li, Q.; Cao, Z.; Liu, N. Dense attention pyramid networks for multi-scale ship detection in SAR images. IEEE Trans. Geosci. Remote Sens. 2019, 57, 8983–8997. [Google Scholar] [CrossRef]
  44. Weixing, W.; Ting, C.; Sheng, L.; Enmei, T. Remote sensing image automatic registration on multi-scale harris-laplacian. J. Indian Soc. Remote Sens. 2015, 43, 501–511. [Google Scholar] [CrossRef]
  45. Sun, Z.; Leng, X.; Lei, Y.; Xiong, B.; Ji, K.; Kuang, G. BiFA-YOLO: A novel YOLO-based method for arbitrary-oriented ship detection in high-resolution SAR images. Remote Sens. 2021, 13, 4209. [Google Scholar] [CrossRef]
  46. Duan, K.; Bai, S.; Xie, L.; Qi, H.; Huang, Q.; Tian, Q. Centernet: Keypoint triplets for object detection. In Proceedings of the IEEE/CVF International Conference on Computer Vision, Seoul, Republic of Korea, 27 October–2 November 2019; pp. 6569–6578. [Google Scholar]
  47. Guo, H.; Yang, X.; Wang, N.; Gao, X. A CenterNet++ model for ship detection in SAR images. Pattern Recognit. 2021, 112, 107787. [Google Scholar] [CrossRef]
  48. Zhang, J.; Sheng, W.; Zhu, H.; Guo, S.; Han, Y. MLBR-YOLOX: An efficient SAR ship detection network with multilevel background removing modules. IEEE J. Sel. Top. Appl. Earth Obs. Remote Sens. 2023, 16, 5331–5343. [Google Scholar] [CrossRef]
  49. Wan, H.; Chen, J.; Huang, Z.; Xia, R.; Wu, B.; Sun, L.; Yao, B.; Liu, X.; Xing, M. AFSar: An anchor-free SAR target detection algorithm based on multiscale enhancement representation learning. IEEE Trans. Geosci. Remote Sens. 2021, 60, 5219514. [Google Scholar] [CrossRef]
  50. Sun, Z.; Dai, M.; Leng, X.; Lei, Y.; Xiong, B.; Ji, K.; Kuang, G. An anchor-free detection method for ship targets in high-resolution SAR images. IEEE J. Sel. Top. Appl. Earth Obs. Remote Sens. 2021, 14, 7799–7816. [Google Scholar] [CrossRef]
  51. Zhang, T.; Zhang, X.; Li, J.; Xu, X.; Wang, B.; Zhan, X.; Xu, Y.; Ke, X.; Zeng, T.; Su, H.; et al. SAR ship detection dataset (SSDD): Official release and comprehensive data analysis. Remote Sens. 2021, 13, 3690. [Google Scholar] [CrossRef]
  52. Wei, S.; Zeng, X.; Qu, Q.; Wang, M.; Su, H.; Shi, J. HRSID: A high-resolution SAR images dataset for ship detection and instance segmentation. IEEE Access 2020, 8, 120234–120254. [Google Scholar] [CrossRef]
  53. Xie, X.; Cheng, G.; Wang, J.; Yao, X.; Han, J. Oriented R-CNN for object detection. In Proceedings of the IEEE/CVF International Conference on Computer Vision, Montreal, BC, Canada, 11–17 October 2021; pp. 3520–3529. [Google Scholar]
  54. Ding, J.; Xue, N.; Long, Y.; Xia, G.S.; Lu, Q. Learning RoI transformer for oriented object detection in aerial images. In Proceedings of the IEEE/CVF Conference on Computer Vision and Pattern Recognition, Long Beach, CA, USA, 16–20 June 2019; pp. 2849–2858. [Google Scholar]
  55. Yang, X.; Yan, J.; Feng, Z.; He, T. R3det: Refined single-stage detector with feature refinement for rotating object. In Proceedings of the AAAI Conference on Artificial Intelligence, Virtual, 2–9 February 2021; Volume 35, pp. 3163–3171. [Google Scholar]
  56. Lin, T. Focal Loss for Dense Object Detection. arXiv 2017, arXiv:1708.02002. [Google Scholar]
  57. Gao, G.; Chen, Y.; Feng, Z.; Zhang, C.; Duan, D.; Li, H.; Zhang, X. R-LRBPNet: A Lightweight SAR Image Oriented Ship Detection and Classification Method. Remote Sens. 2024, 16, 1533. [Google Scholar] [CrossRef]
Figure 1. Representative SAR images of ships: (a) Scene with land scattering interference. (b) Multi-scale ship scene.
Remotesensing 17 00551 g001
Figure 2. Overall structure of R-SABMNet.
Remotesensing 17 00551 g002
Figure 3. Detailed architecture of SA-FEN.
Remotesensing 17 00551 g003
Figure 4. Overall structure of SG-AFA Block.
Remotesensing 17 00551 g004
Figure 5. Heatmap representation of different features. (a) Heatmap of features without SG-AFA. (b) Heatmap of features with SG-AFA.
Remotesensing 17 00551 g005
Figure 6. Model structure details of BSMF-FPN.
Remotesensing 17 00551 g006
Figure 7. Model structure of BSMF.
Remotesensing 17 00551 g007
Figure 8. Balanced shifted window diagram.
Remotesensing 17 00551 g008
Figure 9. Schematic diagram of 2D Gaussian distribution modeling for rotated bounding boxes.
Remotesensing 17 00551 g009
Figure 10. Comparison of detection results across different models on SSDD+ dataset. (ad) Ground truth. (eh) O-RCNN detection results. (il) Results of R-YOLOv7. (mp) Baseline results. (qt) Results of our model. Yellow represents false positives, blue represents missed detections, red represents detection results, and green denotes the ground truth.
Remotesensing 17 00551 g010
Figure 11. Comparison of detection results across different models on HRSID dataset. (a,e) Ground truth. (b,f) Baseline results. (c,g) Results of R-LRBPNet. (d,h) Results of our model. Yellow represents false positives, blue represents missed detections, red represents detection results, and green denotes the ground truth.
Remotesensing 17 00551 g011
Figure 12. Comparison of detection results in nearshore scenarios. (a,d) Ground truth. (b,e) Baseline without SG-AFA. (c,f) Baseline with SG-AFA. Yellow represents false positives, red represents detection results, and green denotes the ground truth.
Remotesensing 17 00551 g012
Figure 13. Comparison of results in multi-scale ship scenarios. (a,d) Ground truth. (b,e) Baseline without BSMF. (c,f) Baseline with BSMF. Yellow represents false positives, blue represents missed detections, and red denotes correct detections.
Remotesensing 17 00551 g013
Figure 14. Comparison of detection results in dense ship scenarios. (a,d) Ground truth. (b,e) Baseline without GWD. (c,f) Baseline with GWD. Yellow represents false positives, blue represents missed detections, red represents detection results, and green denotes the ground truth.
Remotesensing 17 00551 g014
Figure 15. Detection results in complex scenarios of Gaofen-3 SAR images. (A,B) Results of YOLOv8. (C,D) Results of R-SABMNet. Yellow represents false positives, blue represents missed detections, red represents detection results, and green denotes the ground truth.
Remotesensing 17 00551 g015
Table 1. Detailed information concerning datasets.
SSDD+HRSID
Number of Images11605640
Number of Ships255116,965
Image Size (Pixels)500 × 500800 × 800
Resolution (m)1–150.5–3
Polarization ModeVV, VH, HH, HVVV, HV, HH
Table 2. Comparison of detection results from different models on SSDD+ dataset.
ModulePrecision (%)Recall (%)AP (%)
Two-StageR-FasterRCNN90.7491.4989.62
O-RCNN92.8391.3690.15
ROI88.4289.2887.65
One-StageR-FCOS83.5587.7382.91
R3Det84.4185.6483.72
R-RetinaNet86.5688.1987.61
R-YOLOv783.5587.7382.91
R-LRBPNet94.9392.5494.86
R-YOLOv8 (baseline)94.1791.3494.06
Ours96.3293.1395.28
Table 3. Comparison of detection results from different models on HRSID dataset.
ModulePrecision (%)Recall (%)AP (%)
Two-StageR-FasterRCNN80.6281.0477.87
O-RCNN85.3584.6180.2
ROI84.1982.4878.76
One-StageR-FCOS78.7774.9173.15
R3Det79.8675.2977.45
R-RetinaNet83.7281.4580.23
R-YOLOv789.685.3784.38
R-LRBPNet91.3587.5988.74
R-YOLOv8 (baseline)90.7286.3587.8
Ours92.5689.4390.69
Table 4. Results of ablation experiments on SSDD+ dataset.
ExperimentSG-AFABSMFGWDP (%)R (%)AP (%)
1---94.1791.3494.06
2--95.6491.9694.71
3-96.2191.9994.83
496.3293.1395.28
Table 5. Comparison of different models’ inference speed across different hardware platforms.
ModelMacBook Pro (13-Inch)RTX4060 GPU
Pre (ms)Infer (ms)Post (ms)Pre (ms)Infer (ms)Post (ms)
YOLOv80.76.56.90.44.85.3
YOLOv110.86.36.00.53.94.2
R-SABMNet0.86.75.30.53.63.7
Disclaimer/Publisher’s Note: The statements, opinions and data contained in all publications are solely those of the individual author(s) and contributor(s) and not of MDPI and/or the editor(s). MDPI and/or the editor(s) disclaim responsibility for any injury to people or property resulting from any ideas, methods, instructions or products referred to in the content.

