The experiment analysis can be divided into the following three parts: In the first part, we simulate a real on-orbit scenario of space targets to obtain the corresponding ISAR images. The second part analyzes the feature point detection performance. Finally, we examine the feature point matching performance in the third part.
4.1. Experiment Configuration
To simulate ISAR images, we set the satellite orbit to a commonly used sun-synchronous orbit for remote sensing satellites, with the orbit parameters shown in
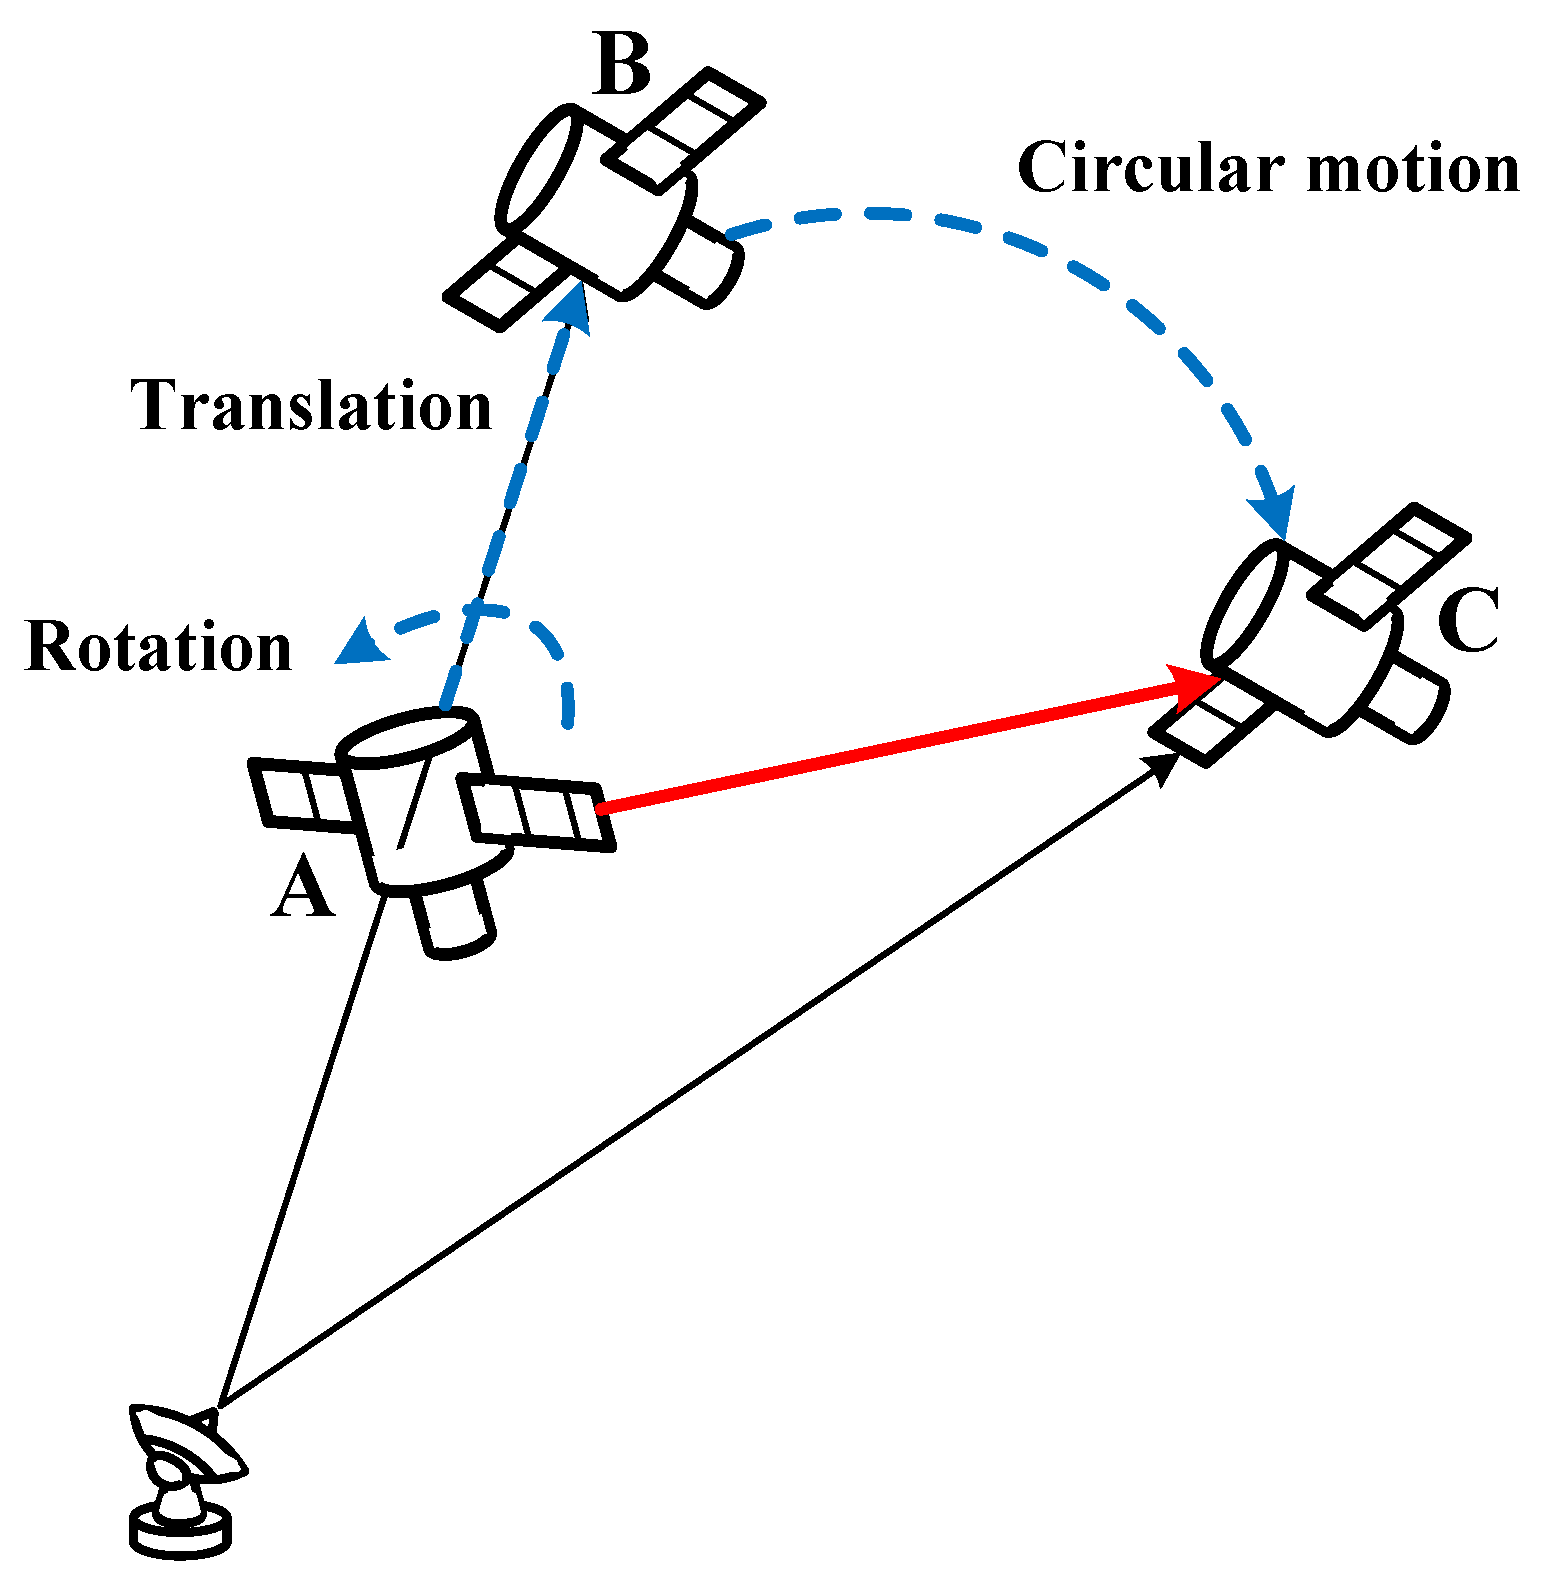
Table 1. The observing radar is positioned at 114 degrees east longitude and 30 degrees north latitude, with an operating bandwidth of 1.8 GHz. The observation scenario is shown in
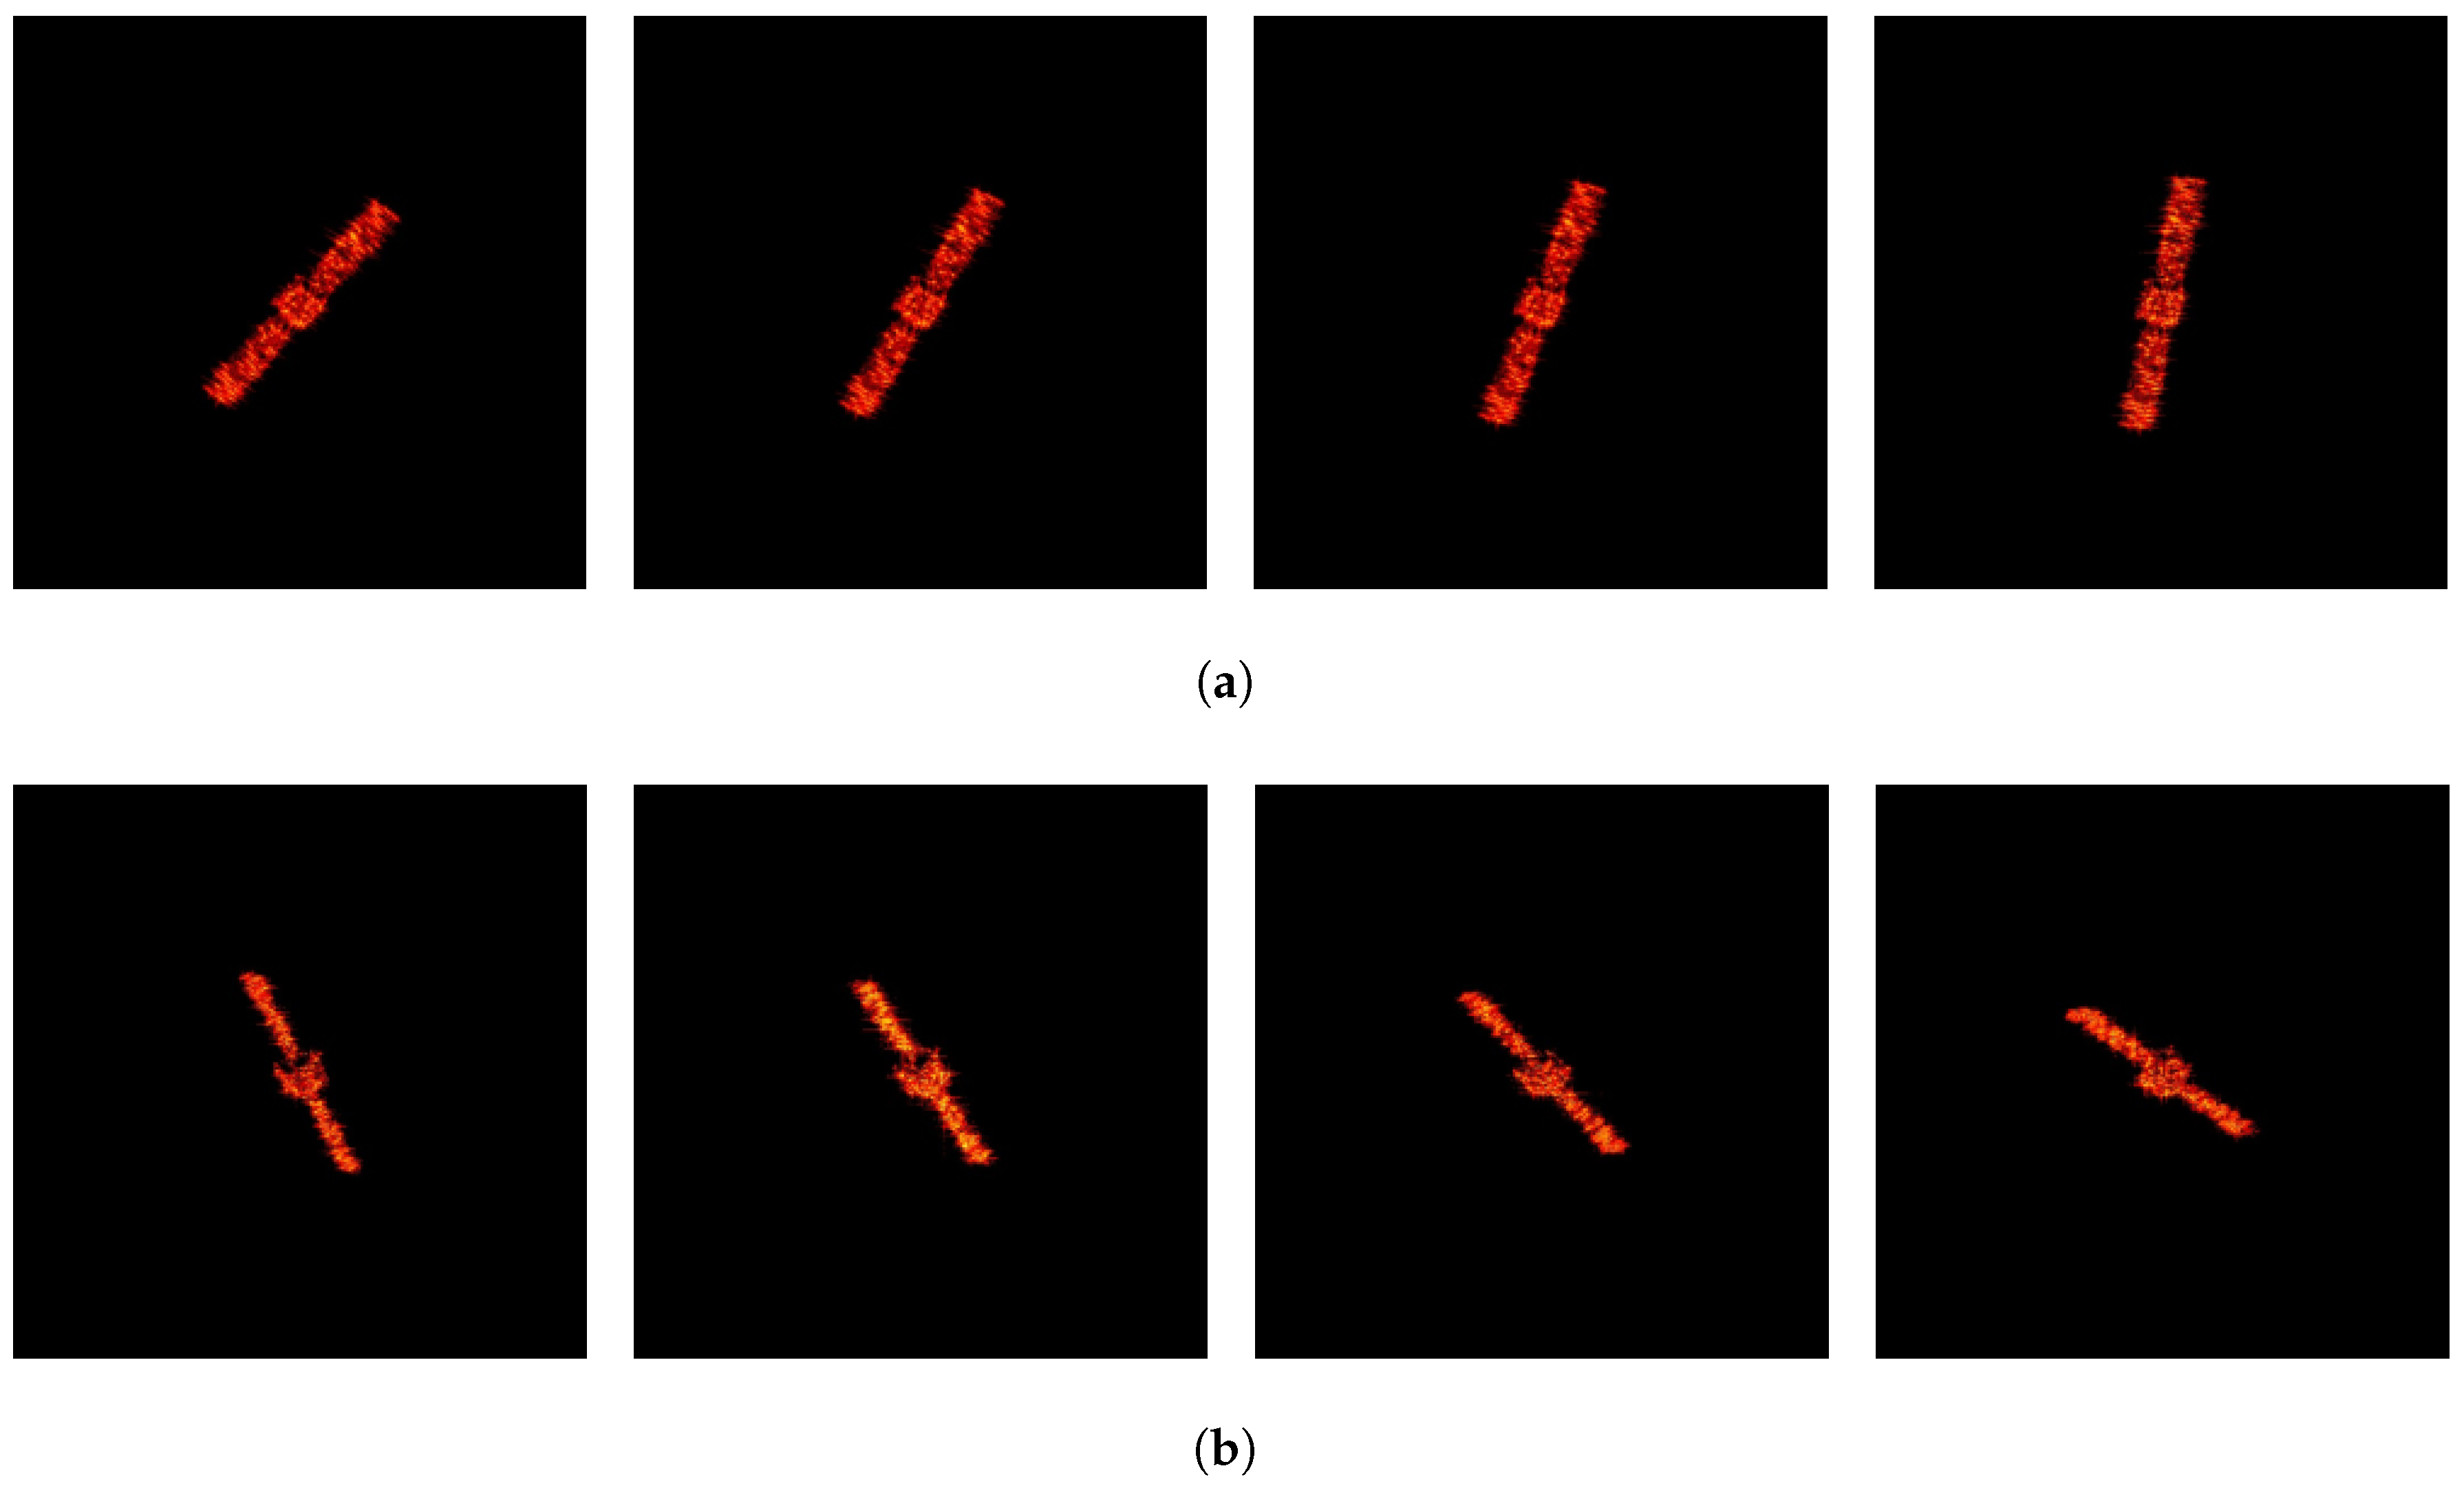
Figure 11a. Subsequently, based on this observation scenario, we simulate the wideband echoes of the target within the imaging interval using the physical optics method. After applying pulse compression and translational compensation to the wideband echoes of the target, we perform ISAR imaging using the range-Doppler algorithm. As shown in
Figure 11b, We choose the Chang’e-I satellite as the target. The satellite body size of Chang’e-I is 2 m × 1.72 m × 2.2 m, and the maximum span of the solar panel is 18.1 m. To calculate the electromagnetic echoes using the physical optics method, we set the material of these models as the perfect electric conductor (PEC) and dissect these models into uniform triangular facets. Meanwhile, inspired by reference [
35], we add surface roughness to the electromagnetic grid model to make the properties of the simulated images closer to those of the real ISAR data. By adding a certain perturbation to the coordinates of the subdivided triangular facets of the target, the normal vectors of these facets are slightly offset, thus obtaining a target surface with undulations. Therefore, the simulated ISAR images can be made more continuous and closer to the real ISAR data. Based on the aforementioned setup, we simulate 100 ISAR images within the imaging interval. According to the orbital motion parameters, cross-range scaling is performed on the simulated images. After cross-range scaling, the range and cross-range resolutions are both 0.08 m.
Figure 12 presents the ISAR simulated images at two different time segments.
To train BasicPoint, we randomly initialize the space target primitive within the observable size and simulate the space target primitive image dataset, yielding 20,000 ISAR primitive images. In the experiment, these ISAR primitive images are divided into the training and test sets at a ratio of 8:2.
Table 2 shows the training parameters.
To obtain the ISAR images, we utilize the physical optics algorithm and the range-Doppler algorithm to simulate 10,000 ISAR images of Chang’e-I spacecraft in different attitudes within the aforementioned observation scenario. Subsequently, we use BasicPoint to label the pseudo-ground truth of these ISAR images. In the same way, these ISAR images are divided into training and test sets at a ratio of 8:2. During the training process of SFPD, the hyperparameters of the loss function play a crucial role in optimizing performance. The key hyperparameters of the loss function used in the training process are shown in
Table 3, which are determined through a series of experiments. Furthermore, the training parameters of SFPD are shown in
Table 4. The experimental platform consists of an i9-13900K CPU and two 4090 GPUs (24 GB), with the operating system being Ubuntu 20.04.
4.2. Feature Point Detection
To evaluate the feature point detection performance of SFPD, we use the number of correctly detected feature points and the feature point detection accuracy as evaluation metrics. If the Euclidean distance between the detected feature point and the ground truth is less than 2 pixels, this feature point can be regarded as correctly detected. Therefore, the number of correctly detected feature points can reflect the effectiveness of feature point detection, which can be represented as follows:
where
is the
ith detected feature point, and
is the ground truth of the
jth feature point. The feature point detection accuracy can reflect the reliability of feature point detection, and its equation can be represented as the ratio of
to
, where
is the number of all detected feature points.
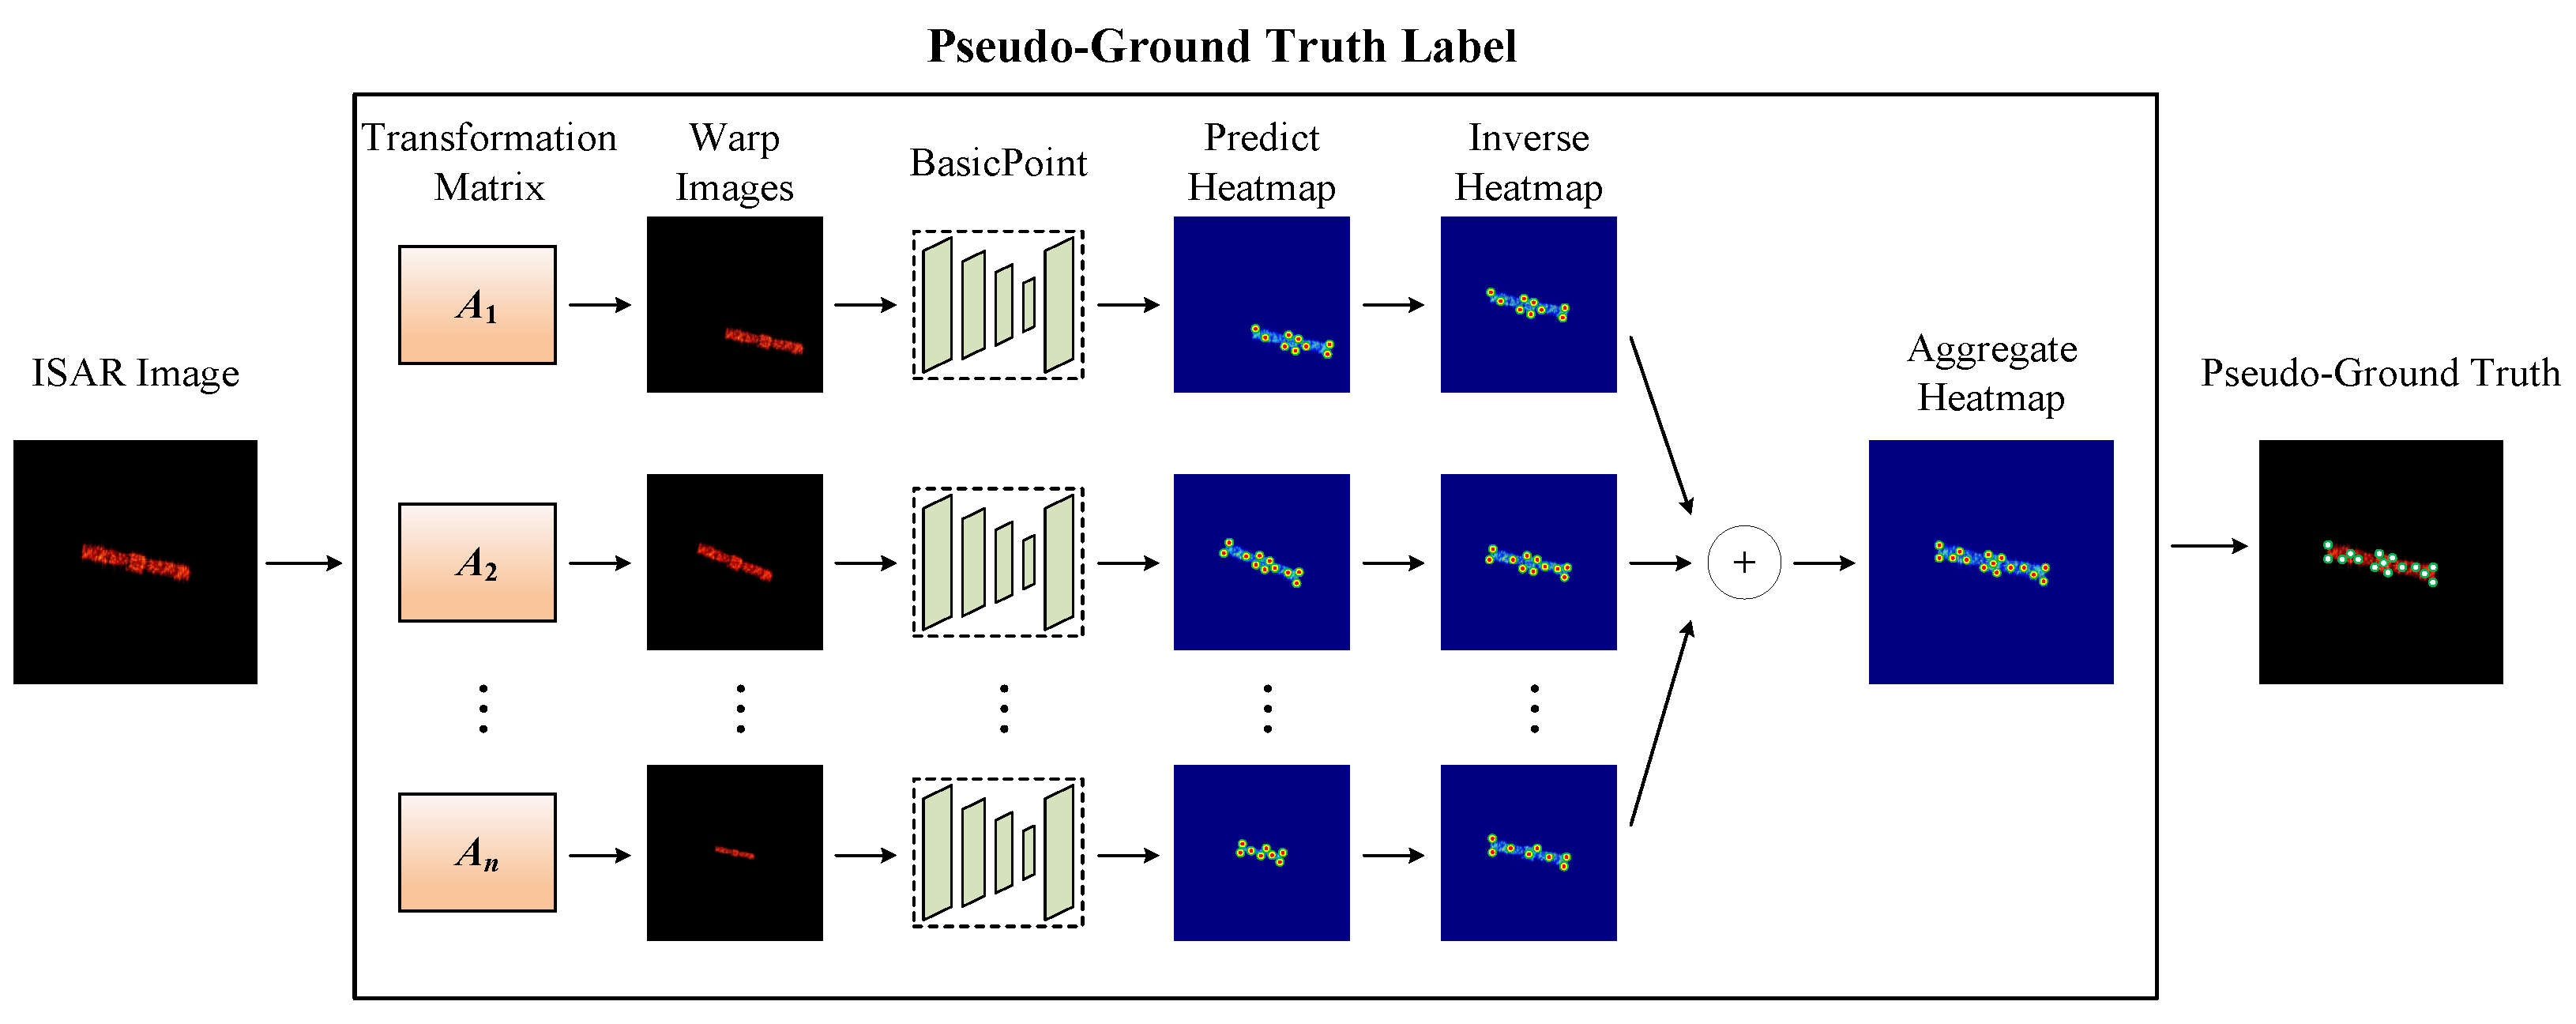
The hyperparameters involved in the proposed method influence the feature point detection significantly. To determine the optimal values of the hyperparameters, we test the proposed method under different experimental settings and select the best-performing hyperparameters. As previously mentioned, the number of affine transformations
affects the pseudo-ground truth labeling, which in turn impacts the training performance of SFPD.
Figure 13 shows an example of pseudo-ground truth labeling for ISAR images of space targets under different numbers of affine transformations. In the figure, green points represent correctly labeled feature points, while blue points represent incorrectly labeled feature points. As seen in
Figure 13, the quality of the pseudo-ground truth labeling gradually improves as the number of affine transformations increases. As the pseudo-ground truth labeling becomes more accurate, SFPD can learn more precise feature mapping relationships. Its convolutional layers can better capture the image features related to the feature points, while the pooling layers can more effectively retain the key information in the image. Therefore,
is an important hyperparameter for SFPD.
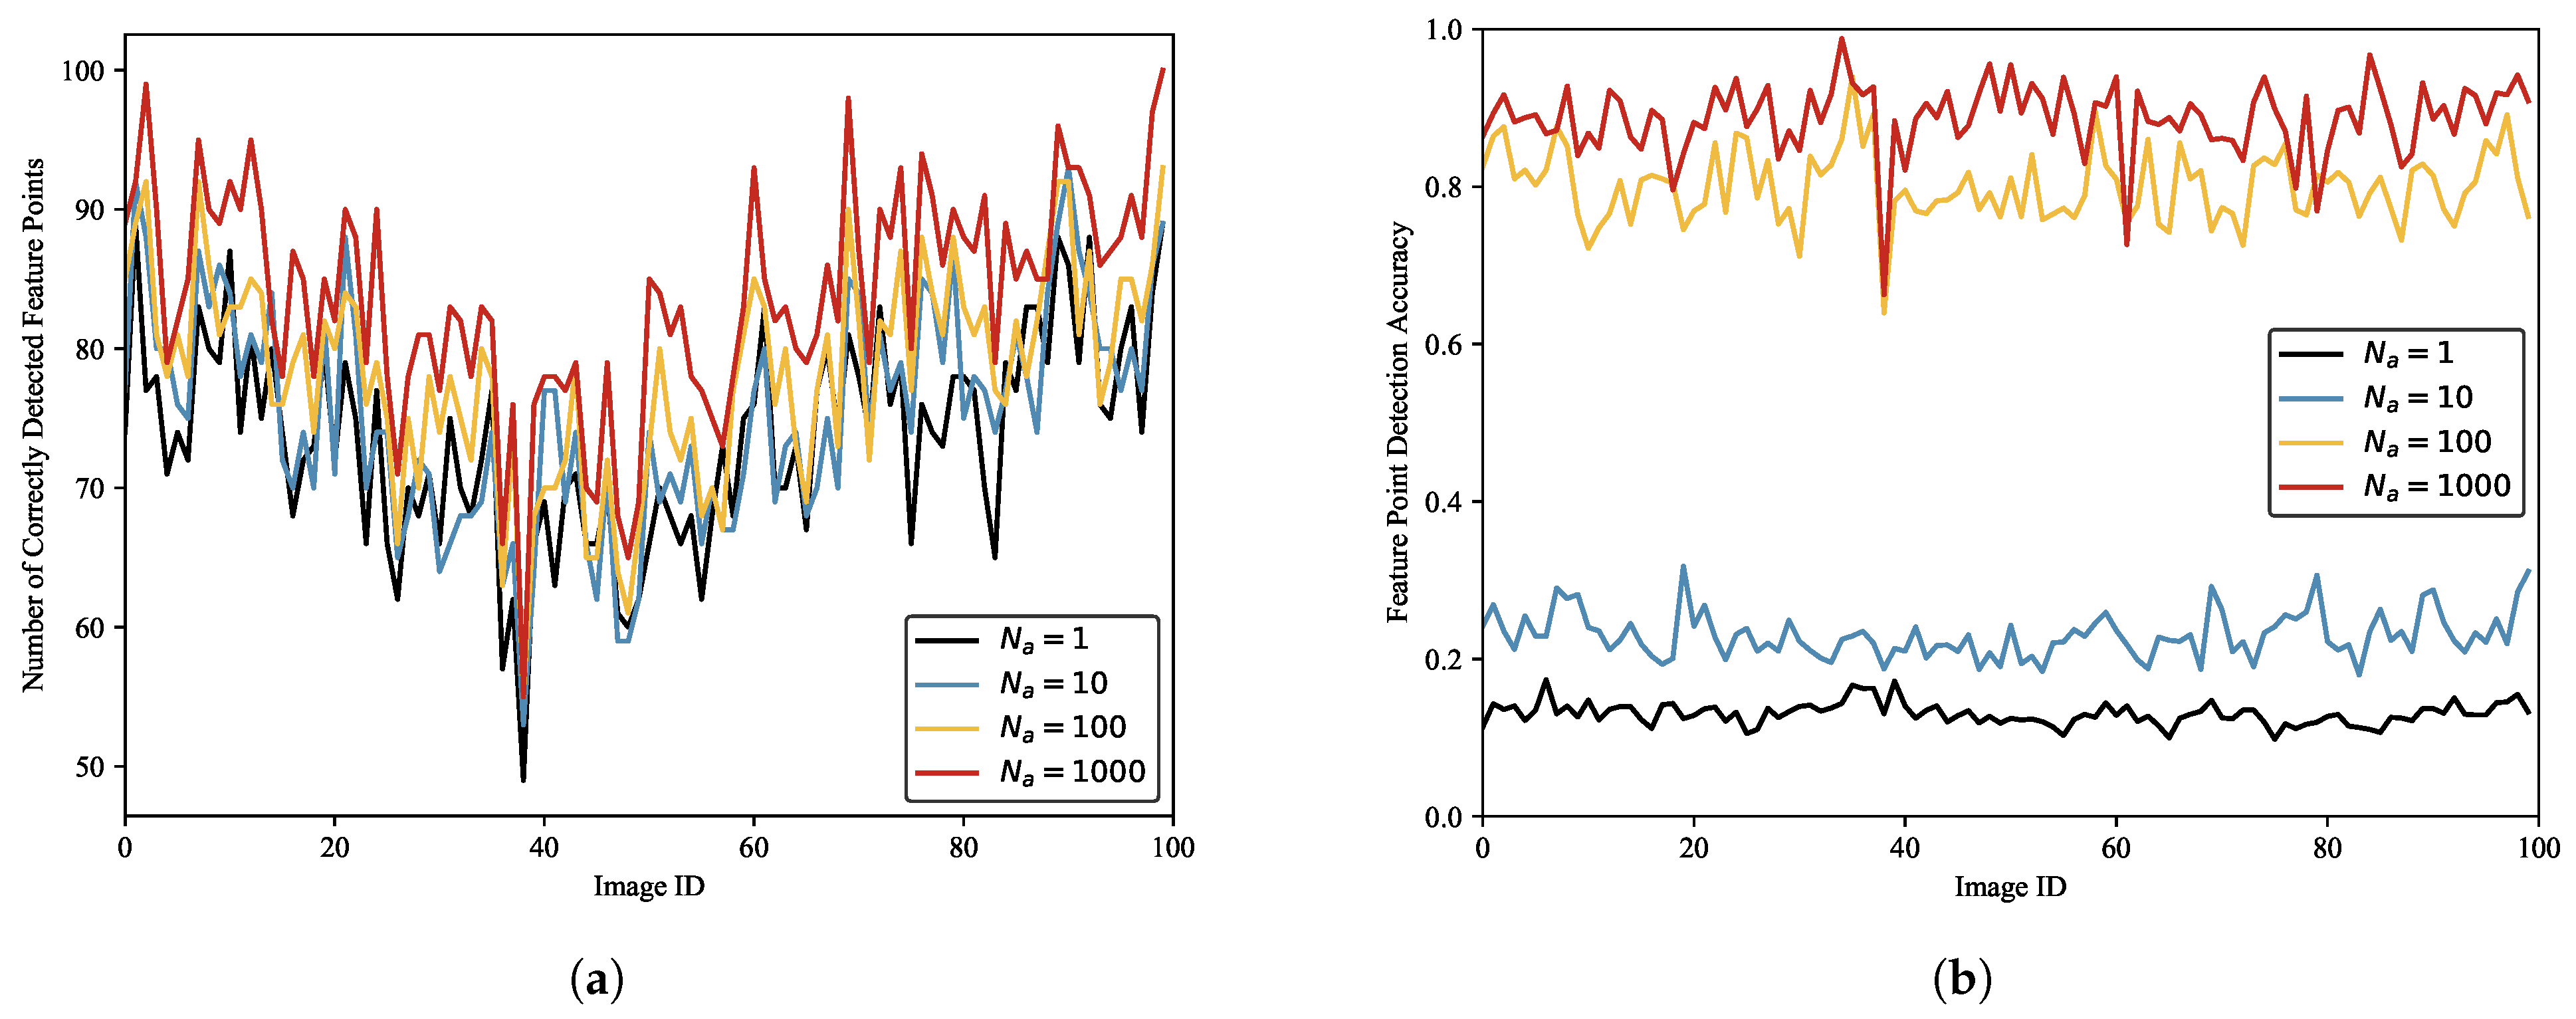
We label the ISAR image dataset of space targets using different numbers of affine transformations and train SFPD with these datasets. Then, we use these models to detect 100 randomly selected test images.
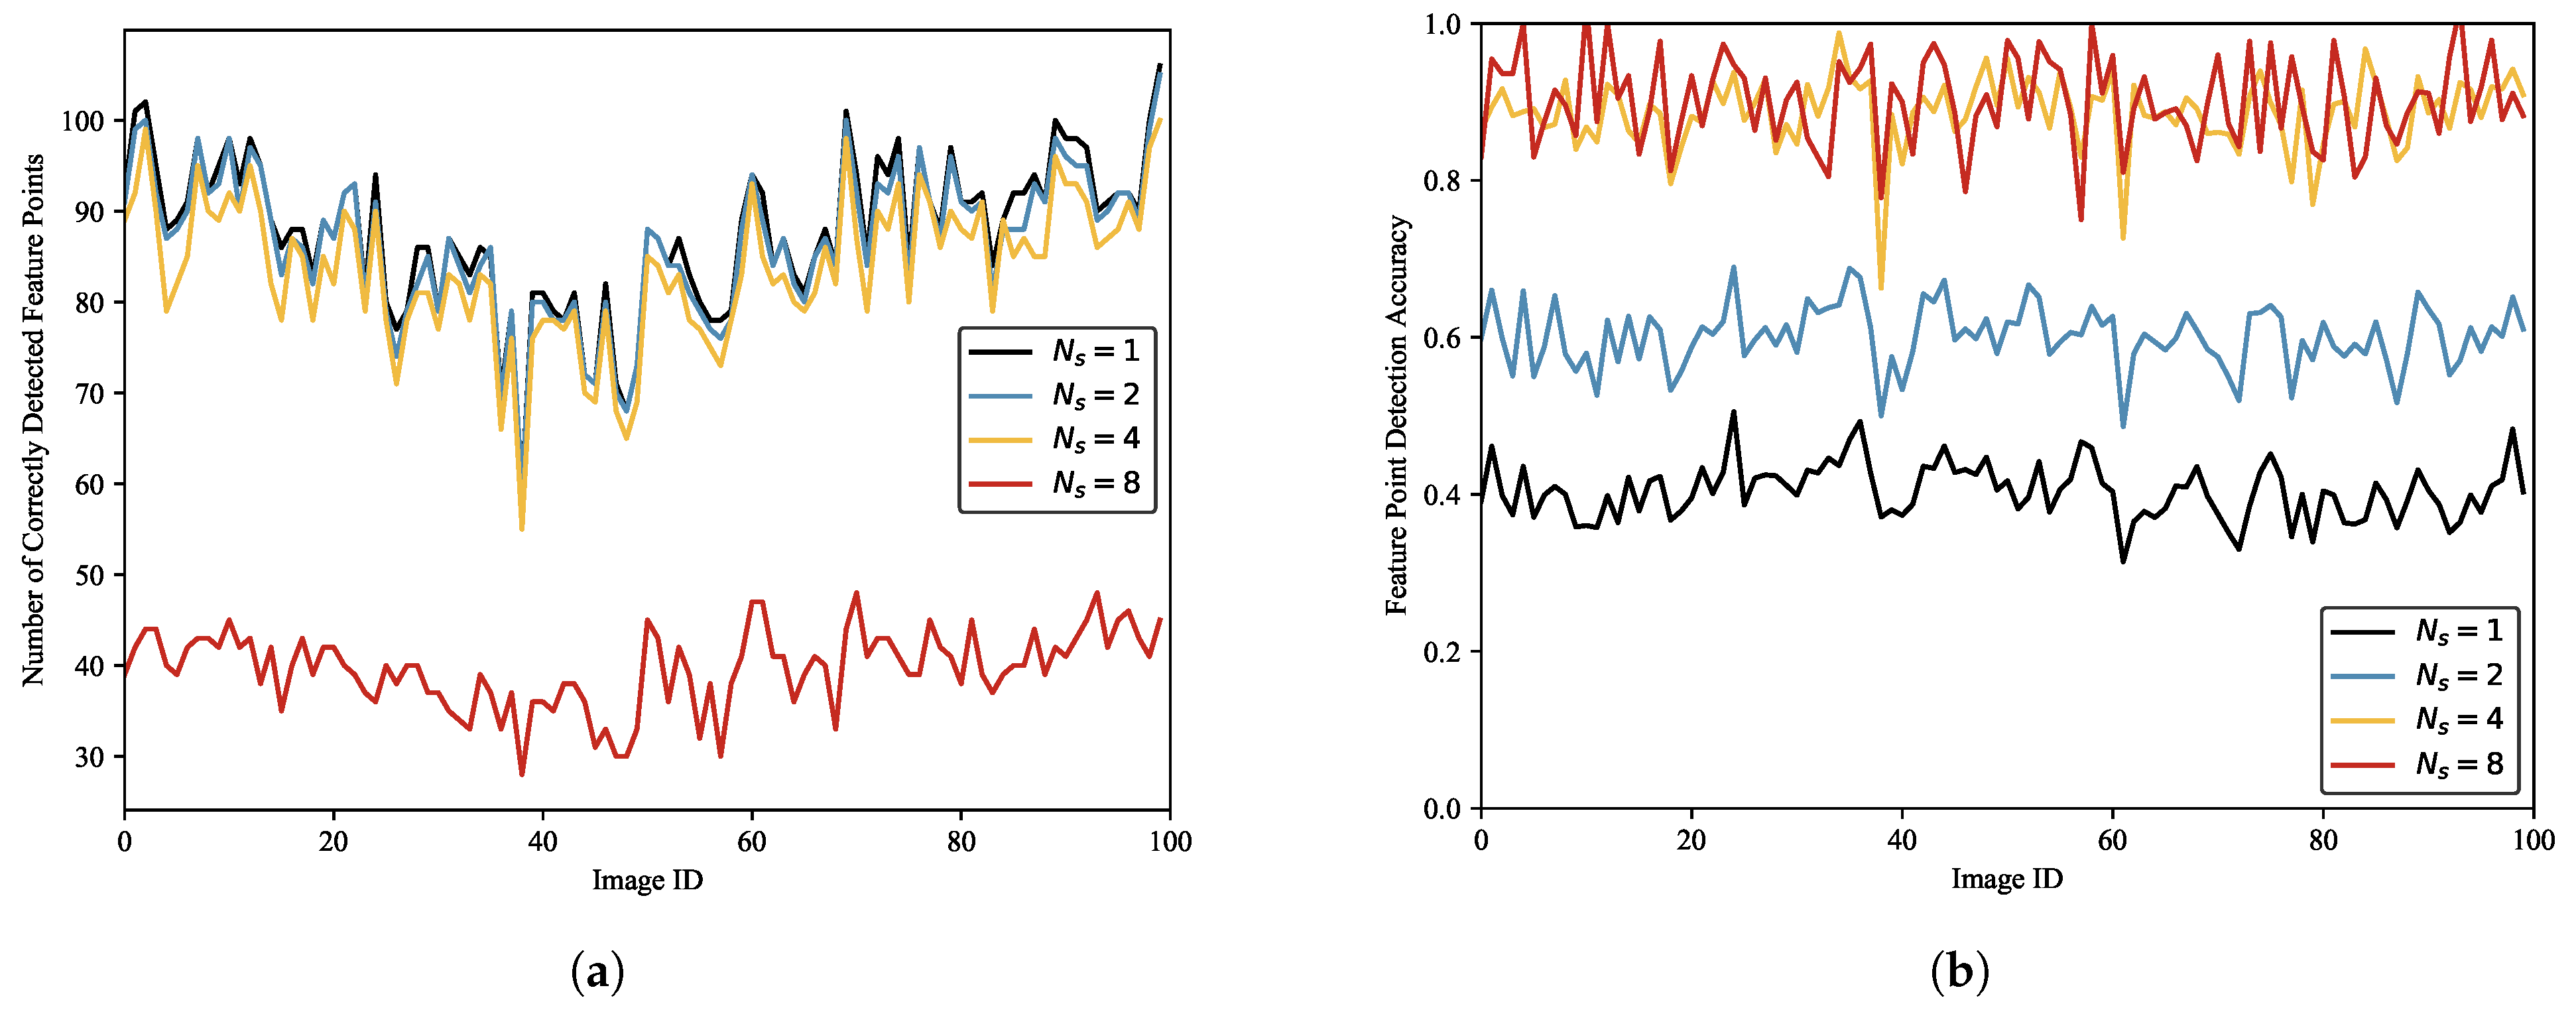
Figure 14 depicts the results. As shown in
Figure 14, the number of correctly detected feature points increases with the number of affine transformations.
Figure 14b presents the detection accuracy under different numbers of affine transformations. Similarly, the feature point detection accuracy also increases with the number of affine transformations. The statistical results are presented in
Table 5. It can be observed that when
and
, the detection accuracy of SFPD is only around 0.15. When
and
, the detection accuracy is around 0.8. Therefore, the detection performance of SFPD is better when
and
. This is because when labeling the pseudo-ground truth of the ISAR image dataset of space targets, too few affine transformations can lead to errors in the pseudo-ground truth, affecting the subsequent training of SFPD. When the number of affine transformations exceeds 100, the labeled results of the pseudo-ground truth tend to stabilize, allowing SFPD to extract the correct feature point positions in the ISAR images of space targets.
In ISAR images of space targets, feature points are manifested as pixel clusters rather than individual discrete pixels. Image features within the same pixel cluster exhibit high consistency, allowing feature point detection algorithms to detect the same feature points multiple times in neighboring locations. To solve this problem, we introduce the non-maximum suppression (NMS) [
37] algorithm into the feature point detection process to eliminate redundantly detected feature points.
Figure 15 shows an example of the feature map output by SFPD after being processed by the non-maximum suppression algorithm. For better observation, we present a local region of the feature map. From
Figure 15, we can see that the feature map output by SFPD contains a large number of feature point responses. This is because, in SFPD, different convolutional kernels may extract similar features from local regions of the image, leading to overlapping responses on the feature map. The non-maximum suppression algorithm compares the intensities of these responses and retains only the strongest feature points, effectively removing redundant responses and preventing repeated processing of the same feature points. Therefore, the suppression threshold, which is a key parameter in the non-maximum suppression algorithm, also serves as a core hyperparameter in the proposed method.
To select the optimal suppression threshold, we use SFPD to detect feature points in 100 randomly selected images from the test dataset under different suppression thresholds.
Figure 16a shows the number of correctly detected feature points under different suppression thresholds. It can be observed that when the suppression threshold is maximum, SFPD detects the fewest correct feature points. This is because an excessively large suppression threshold causes the NMS algorithm to overperform, thus erroneously removing some correct feature points and, consequently, affecting feature point detection performance.
Figure 16b illustrates the relationship between the detection accuracy and
. The detection accuracy increases as the suppression threshold increases. When
and
, the detection accuracies are almost identical, suggesting that when
, the NMS algorithm is already capable of effectively eliminating the majority of redundant feature points. The statistical results are shown in
Table 6. We observe that when the suppression thresholds are
and
, SFPD detects the most correct feature points, but the feature point detection accuracy is only around 0.5, which is due to the low suppression threshold and the inability to remove redundant feature points. When
, the feature point detection accuracy improves by 1.54% compared to
, yet the number of correct feature points is only 47.34% of that achieved at
. Therefore, to balance the impact of the non-maximum suppression algorithm on feature point detection effectiveness, we set the suppression threshold to 4 pixels.
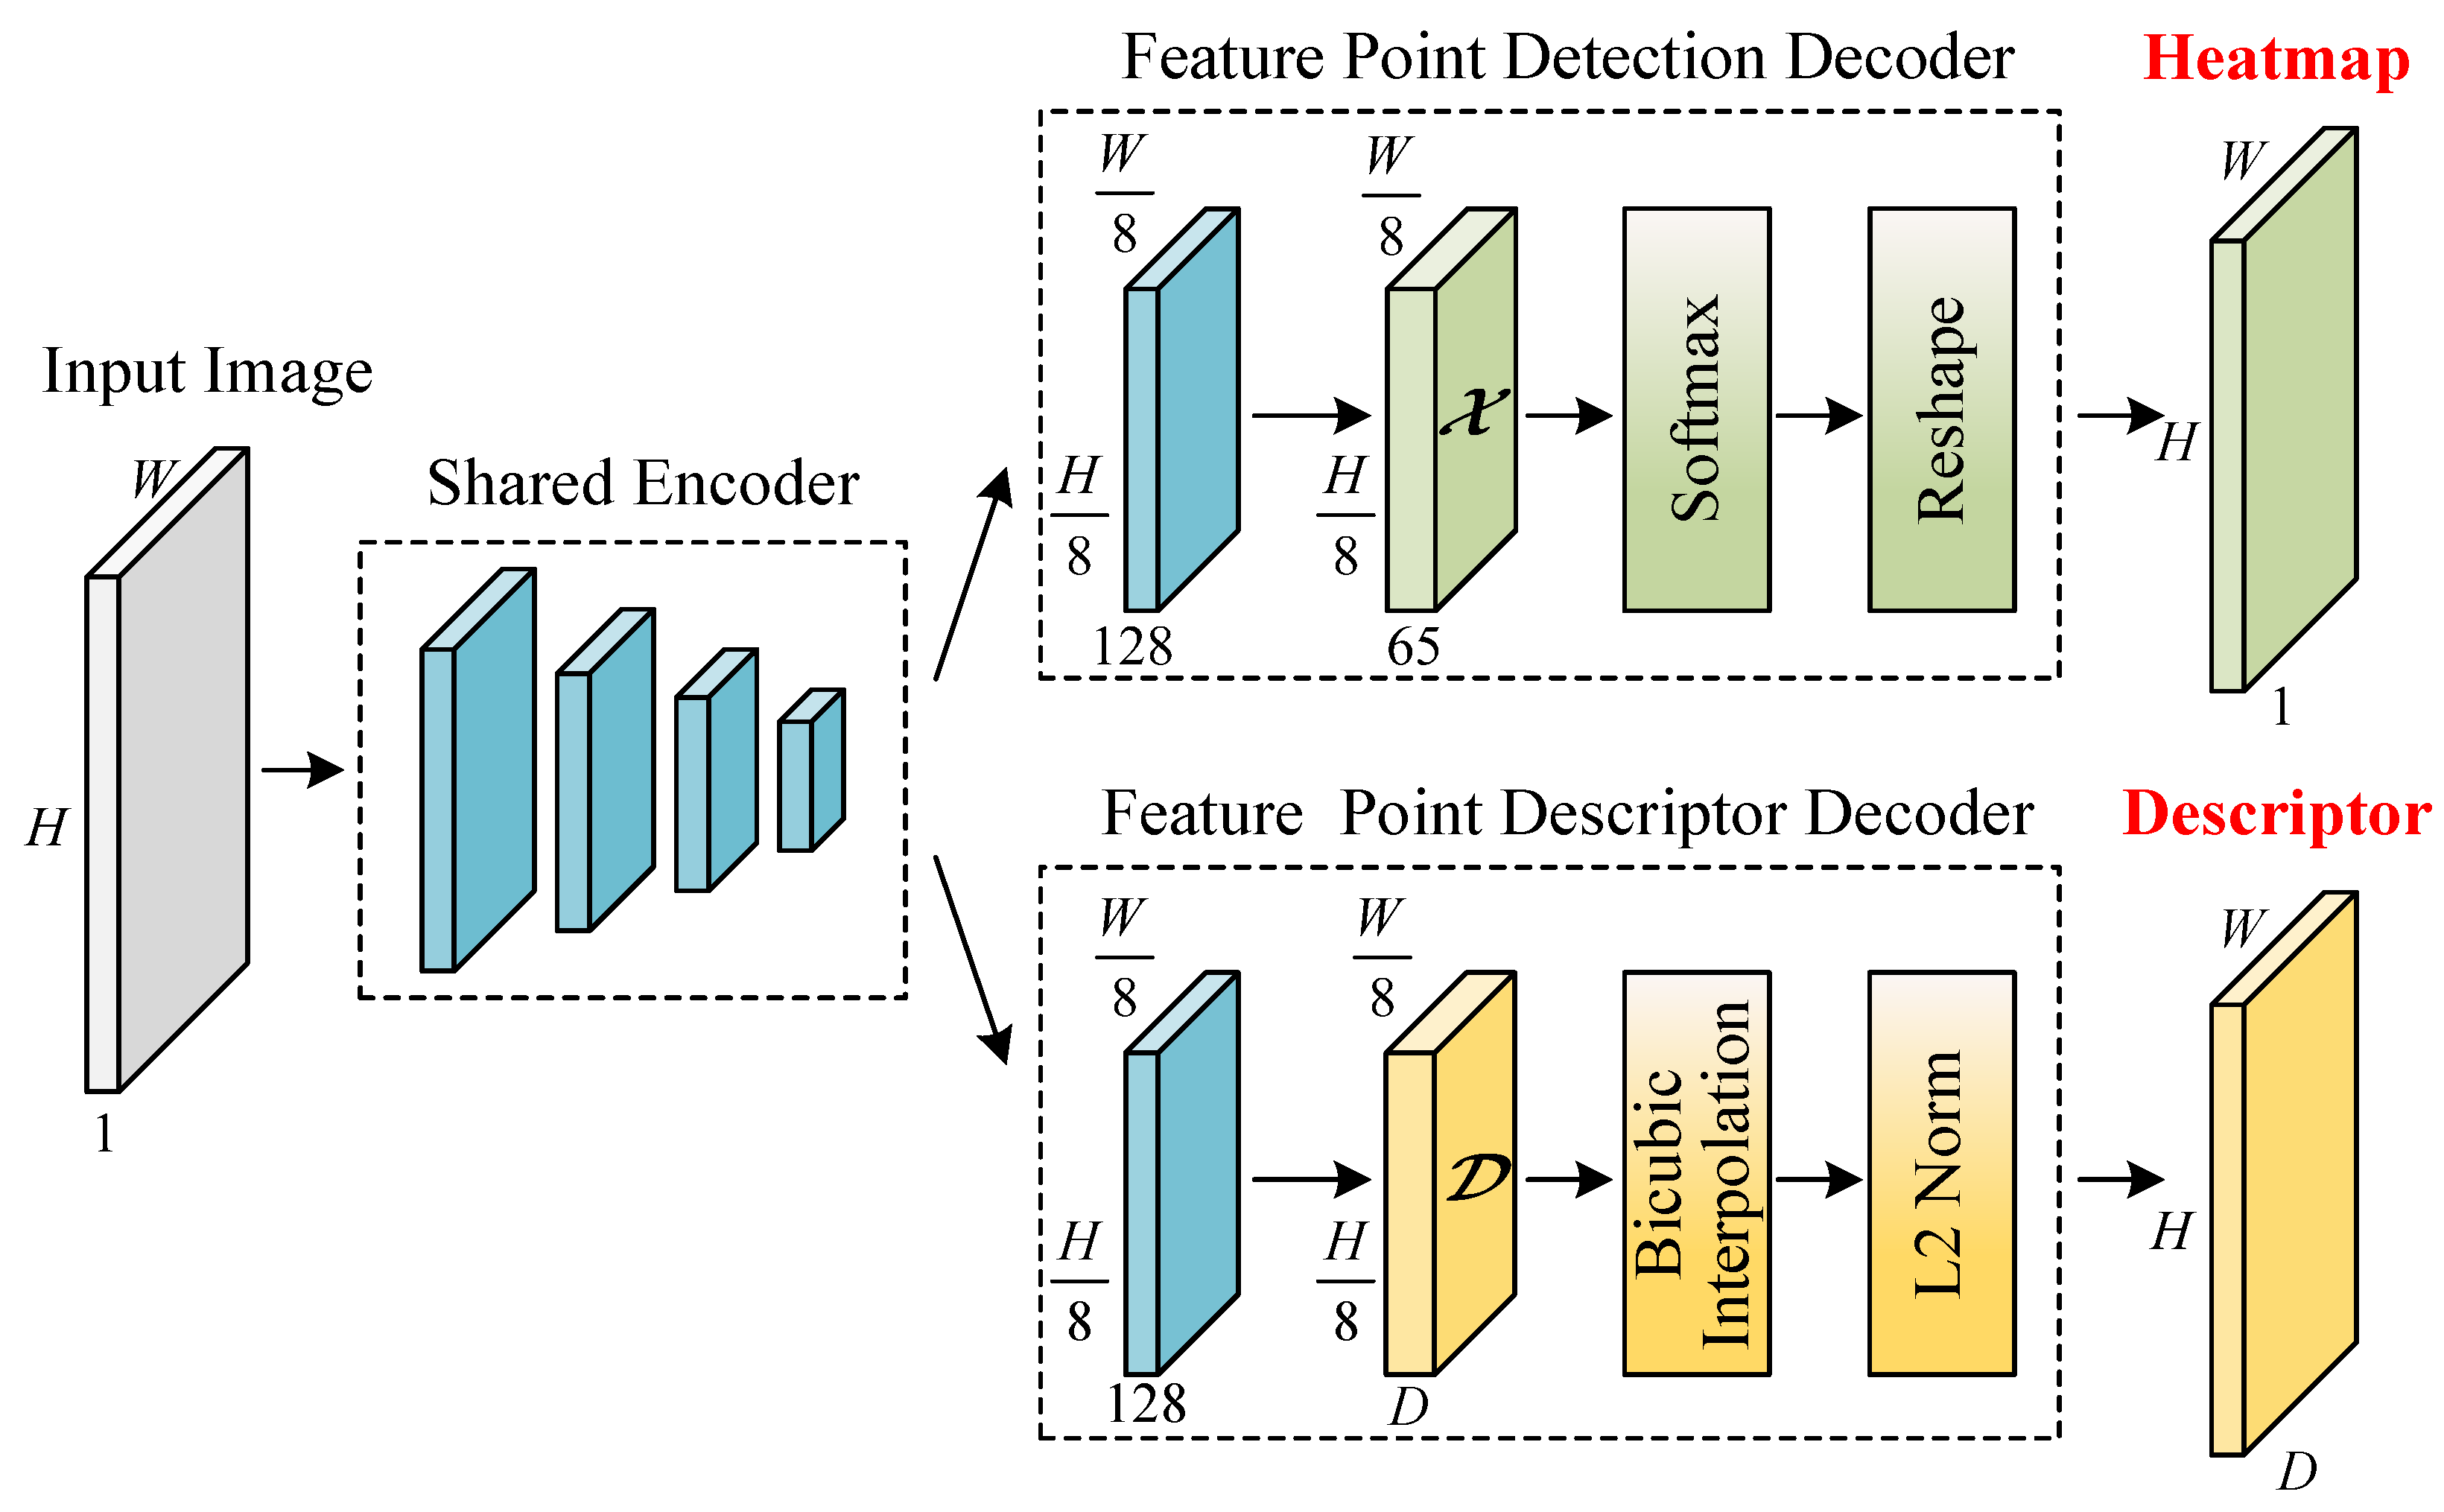
Since SFPD is a self-supervised network and the input labels of SFPD are the pseudo-ground truth labeled by BasicPoint, we designed corresponding experiments to verify the impact of the pseudo-ground truth on the feature point detection performance. During the experiment, we used BasicPoint and SFPD to detect feature points in 100 randomly selected test images. The experimental results are depicted in
Figure 17. We can observe that the performance of SFPD is better than that of BasicPoint, which indicates that the feature point detection performance of SFPD has been significantly improved after self-supervised training. Furthermore, it also validates the effectiveness of the proposed pseudo-ground truth labeling method.
Table 7 presents the statistical results of the experiment. From
Table 7, it can be observed that compared to BasicPoint, SFPD achieves a 49.12% increase in the number of correctly detected feature points and a 55.85% enhancement in the feature point detection accuracy. This is because BasicPoint inevitably results in missed detections and false detections when labeling the ISAR images of space targets, leading to poor feature point detection performance. However, the correctly detected feature points in the labeling results share similarities in their features, while the features of false detections exhibit randomness. Therefore, during the training process, SFPD can learn the correct features of feature points, thereby enhancing the detection performance.
The existing research studies on extracting features from ISAR images using neural networks focus on semantic features, which have clear semantics and are different from the feature points detected by SFPD. Therefore, these research studies have not been used for comparison with SFPD. We compare SFPD with the commonly used feature point detection algorithm, referred to as speeded-up robust features (SURF) [
38], to investigate the performance of SFPD. Additionally, we also compare our algorithm with the improved SIFT algorithm specifically designed for ISAR images in [
20] and the improved Kanade–Lucas–Tomasi (KLT) algorithm designed for ISAR images in [
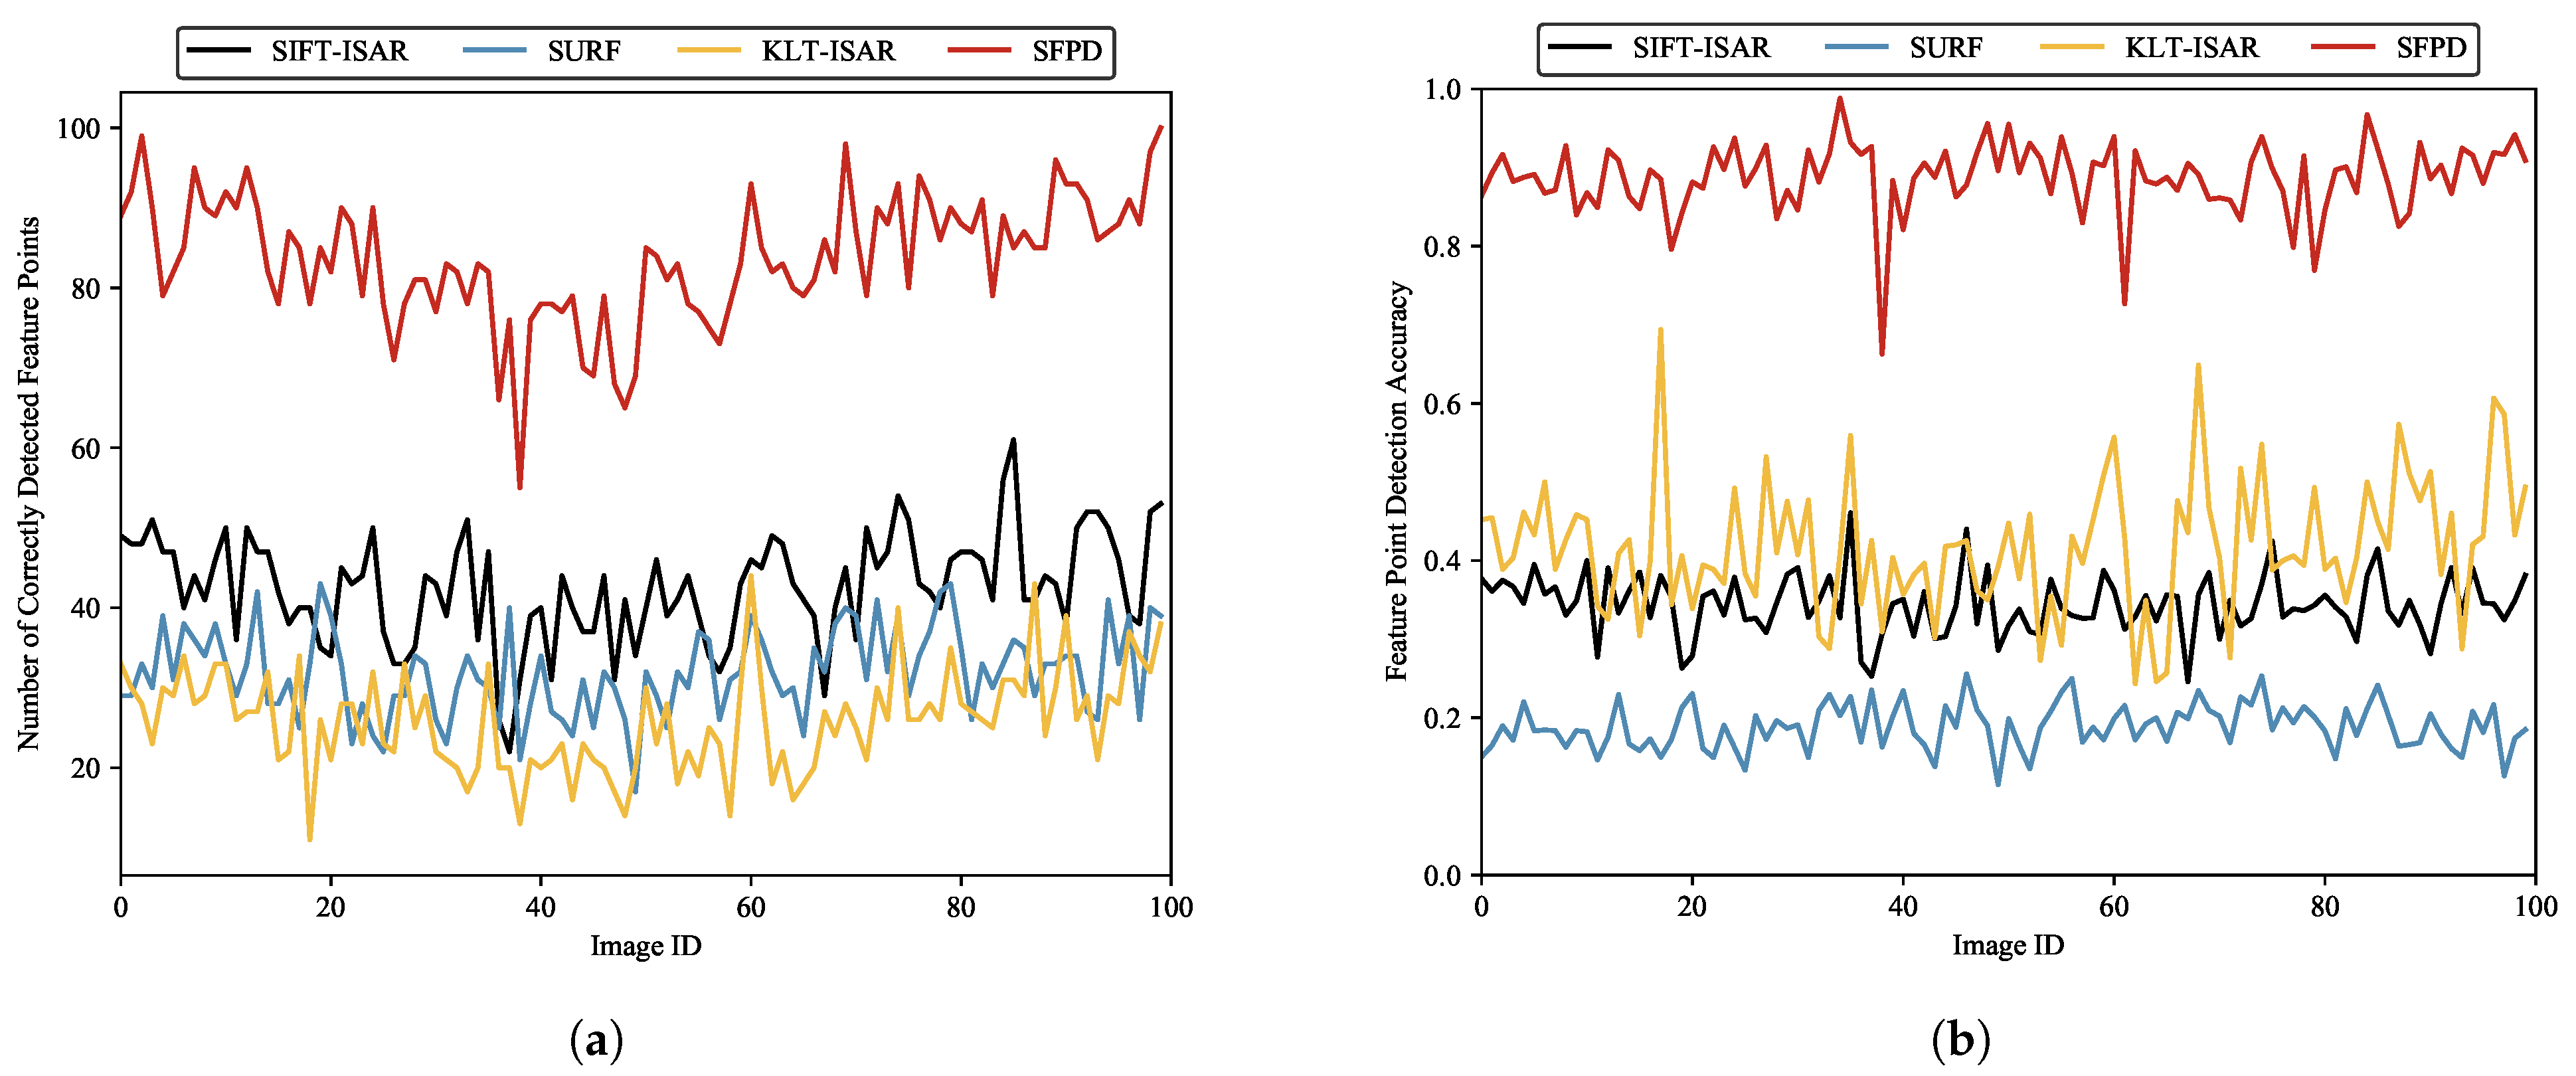
22]. For the convenience of subsequent elaboration and comparison, these two algorithms are referred to as SIFT-ISAR and KLT-ISAR, respectively. The test data consist of 100 randomly selected ISAR images of space targets from the test dataset. As shown in
Figure 18, SFPD outperforms the other three methods, which fully demonstrates the effectiveness of SFPD. Furthermore, we can observe that SURF has a lower number of correctly detected feature points and a lower feature point detection accuracy. This is because of the significant difference in the imaging mechanisms between optical images and ISAR images, leading to substantial differences in their image features. This results in a higher likelihood of false detections and missed detections during the feature point detection process. In contrast, although KLT-ISAR detects fewer feature points correctly, it has a higher detection accuracy than both SIFT-ISAR and SURF. This indicates that the detection performance of KLT-ISAR is superior to those of SIFT-ISAR and SURF, as false detections have a greater impact than missed detections. The statistics for the four aforementioned algorithms are presented in
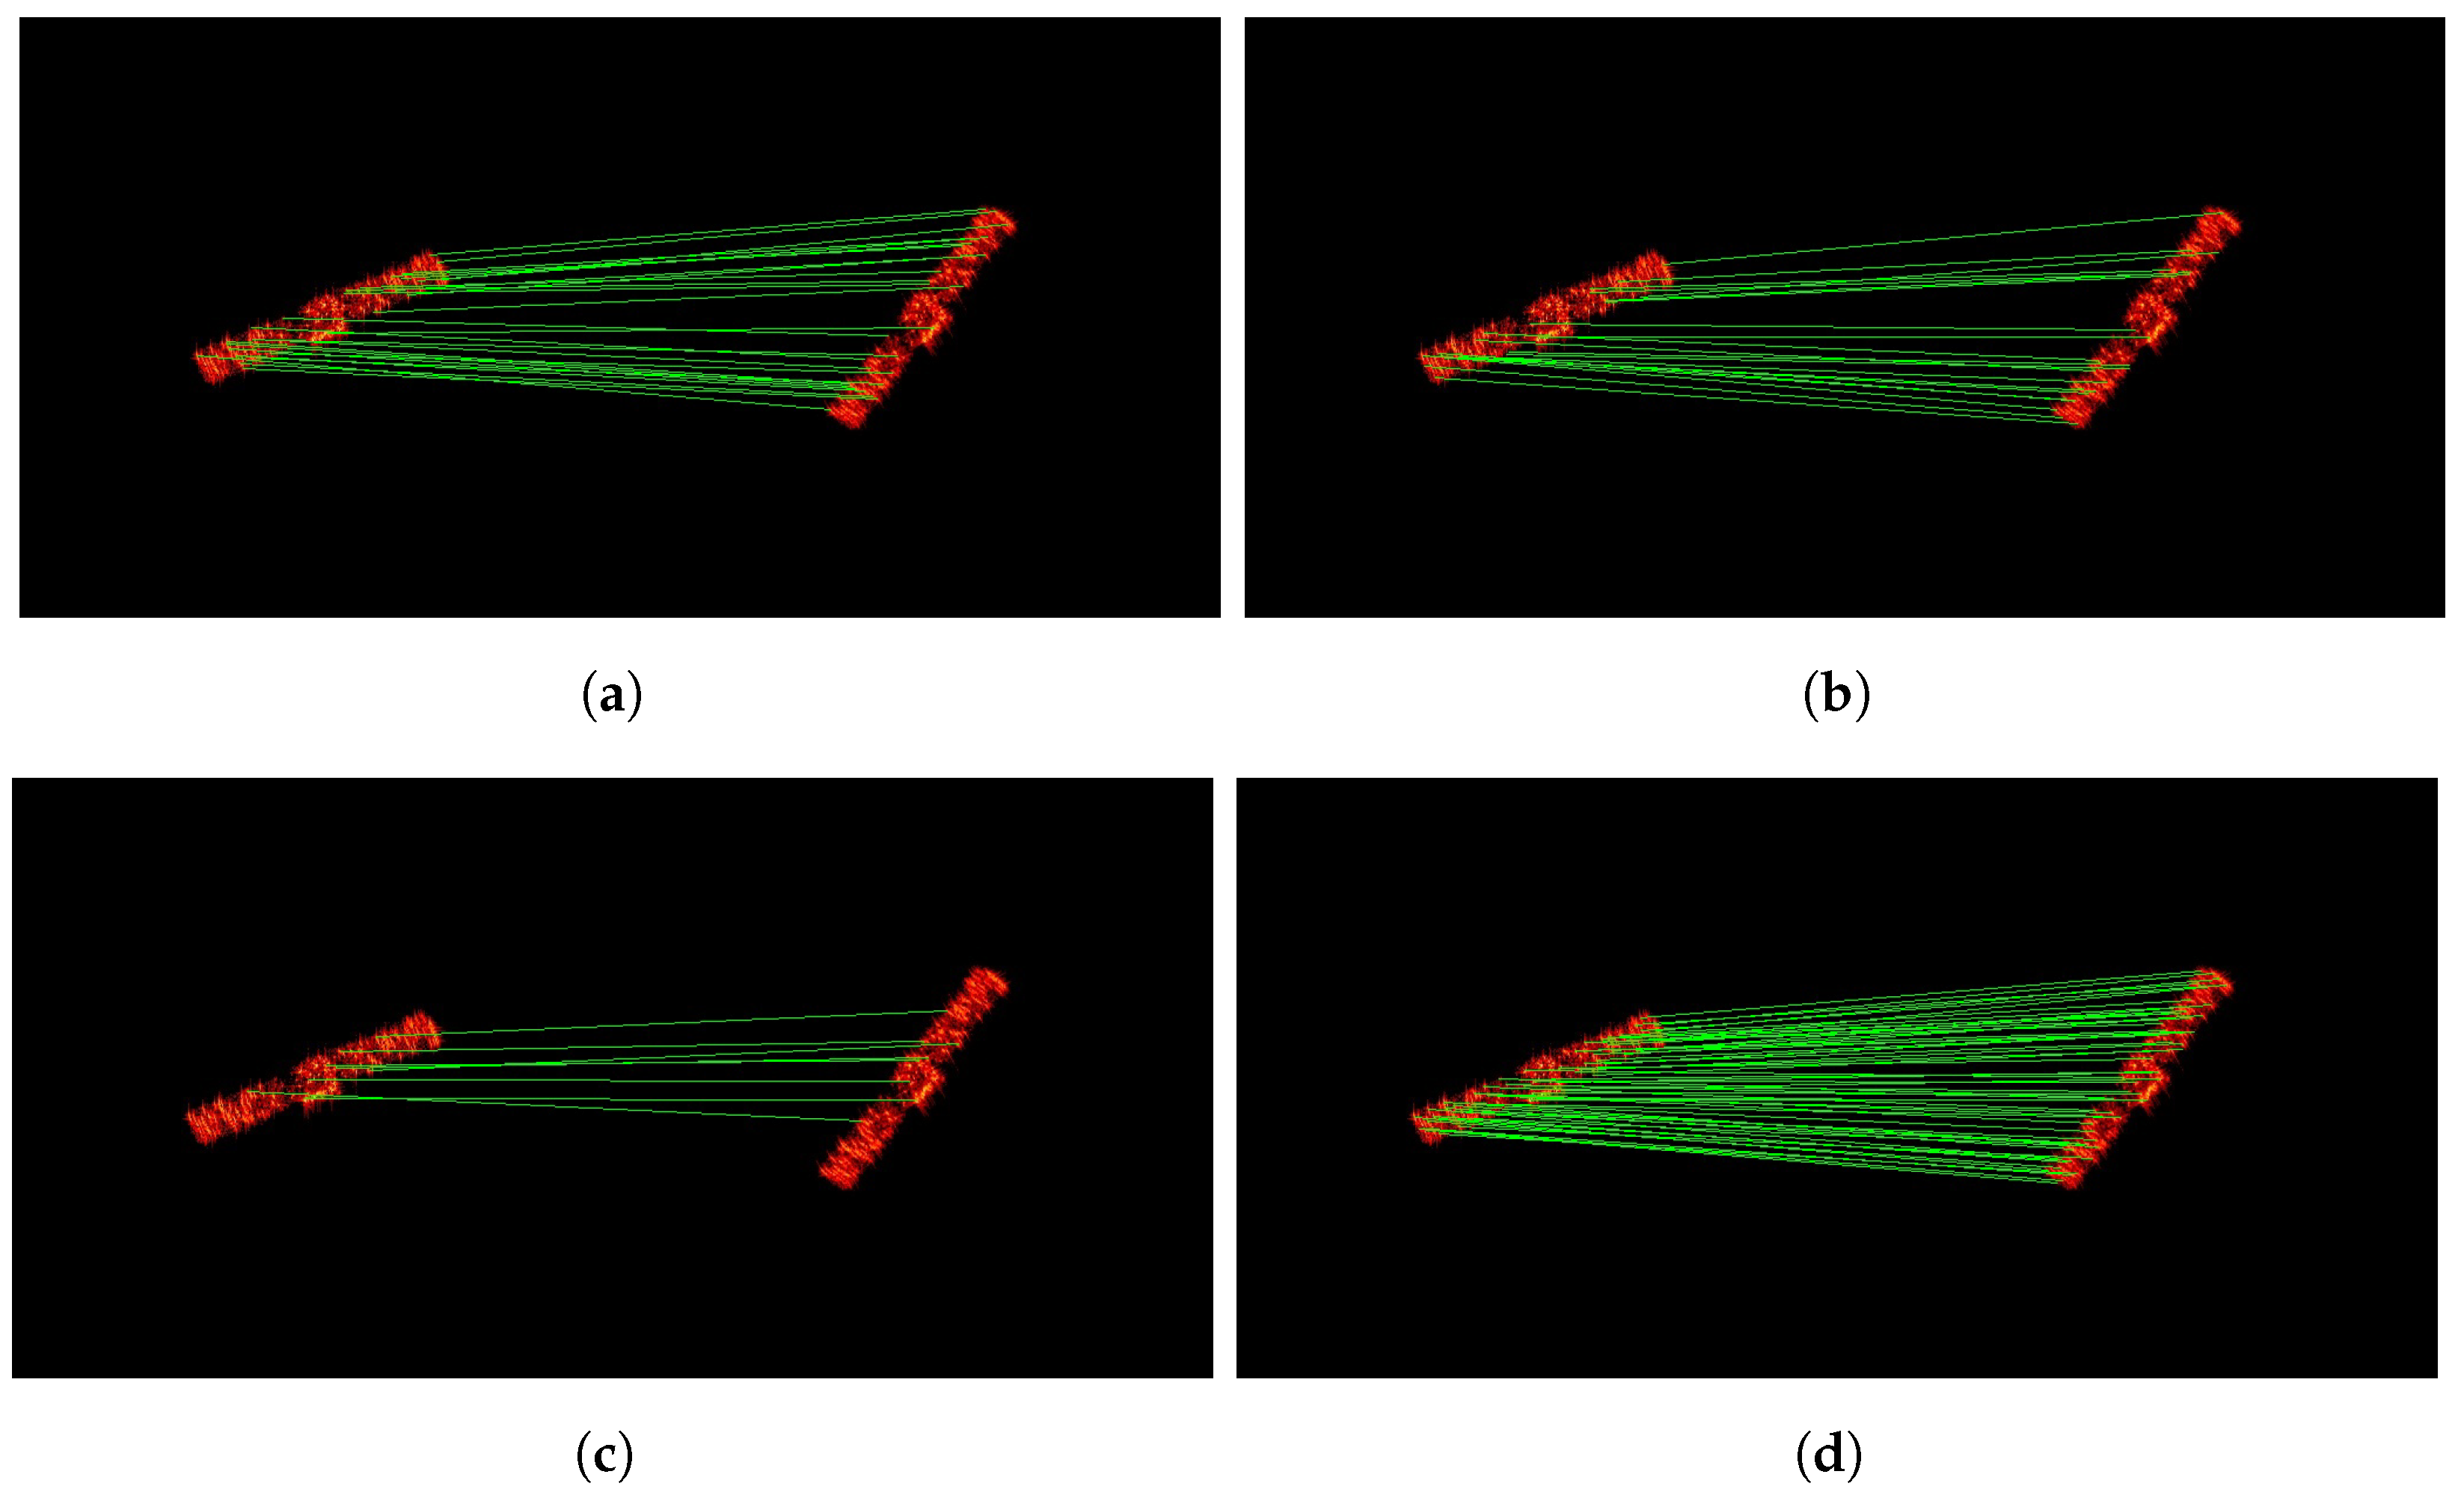
Table 8. Compared to the other three methods, SFPD demonstrates an improvement of over 96.8% in the number of correctly detected feature points and an increase of over 47.48% in feature point detection accuracy. Additionally, we present examples of feature point detection using SIFT-ISAR, SURF, KLT-ISAR, and SFPD in
Figure 19.
In addition to the number of correctly detected feature points and the detection accuracy, the running time is also an important evaluation metric. The running time can reflect computational efficiency, which is particularly crucial in practical applications, especially in scenarios where real-time processing is required. For a fair comparison, we measure the running times of SIFT-ISAR, SURF, KLT-ISAR, and SFPD using the same set of 100 ISAR images of space targets. The experiments were conducted on a computing platform equipped with an i9-13900K CPU and two 4090 GPUs. To reduce the uncertainty of the experimental results, we conducted 100 Monte Carlo experiments.
Table 9 presents the experimental results. The experimental results show that the running time of SFPD processing 100 ISAR images of space targets is only 0.1922 s, outperforming the other three algorithms. This is because SFPD has stronger parallel computing capabilities. In contrast, SIFT-ISAR needs to construct a multi-scale Gaussian pyramid, resulting in a relatively long running time. While SURF improves computational efficiency through Hessian matrix approximation, its processing speed is still slower compared to SFPD. Although KLT-ISAR detects fewer feature points, its computational efficiency is superior to that of SURF and SIFT-ISAR because it mainly relies on the optical flow calculation of local images. Overall, SFPD not only exhibits excellent feature point detection performance but also exhibits high computational efficiency, making it suitable for the task of feature point detection in ISAR images of space targets.
In addition, we simulate the ISAR images of space targets with other structures by using the physical optics method to verify the robustness of SFPD for different model structures. We selected Tiangong-I as the target, which represents one type of space target composed of a cylindrical main body plus solar panels. Its electromagnetic grid model is shown in
Figure 20a. We used SFPD to detect feature points from 100 simulated ISAR images of Tiangong-I and calculate the feature point detection accuracy for each image. The mean value of the feature point detection accuracy is 0.8759. In the above experimental results, the feature point detection accuracy of SFPD on the simulated images of Chang’e-I is 0.8865, which is consistent with that of Tiangong-I. This demonstrates that SFPD has strong robustness across different types of model structures. The satellite size of Tiangong-I is 18 m × 10.4 m × 3.35 m, and its main body is larger than that of Chang’e-I. Therefore, there are also significant differences in the main body sizes of Chang’e-I and Tiangong-I in the simulated images. Facing these two targets with significant differences in both structure and size, SFPD still demonstrates similar performance in feature point detection, which indicates that the feature point detection performance of SFPD is less affected by the model size and structure.
Figure 20b shows an example of feature point detection in the simulated image of Tiangong-I.
4.3. Feature Point Matching
In space target surveillance tasks, the purpose of feature point detection is often to provide prerequisites for downstream tasks such as feature point matching and 3D reconstruction [
39,
40,
41]. As mentioned above, SFPD not only detects the positions of feature points in ISAR images of space targets but also generates feature descriptors corresponding to the feature point positions, facilitating subsequent feature point matching. To validate the feature description performance, we selected 50 test images and employed random affine transformations for each image to generate 50 pairs of matched images. Then, we used the proposed method and the three aforementioned algorithms to perform feature point matching on these 50 pairs of images. The evaluation metrics used in the experiment are precision [
42], recall [
43], and F1 score [
44]. Furthermore, to assess whether the feature point matching is correct, we designed the following evaluation criteria:
where
p and
represent the detected feature points in the original image and affine transformed image, respectively.
is the affine transformation matrix between the two images. When the Euclidean distance between
and
is less than the matching threshold, we consider it a correct match. We conducted feature point matching experiments under matching thresholds of 1 pixel, 3 pixels, and 5 pixels. These results are depicted in
Figure 21,
Figure 22 and
Figure 23.
According to the experimental results, SFPD demonstrates good feature point matching performance across different matching thresholds. The experiments indicate that as the matching threshold decreases, the performance improvement of SFPD compared to the other three methods becomes more significant, which indicates that the feature descriptors generated by SFPD can accurately describe the image features of feature points, leading to higher precision in feature point matching. As the matching threshold increases, the requirement for matching accuracy becomes more relaxed, resulting in a relatively smaller performance improvement of SFPD. From
Figure 21,
Figure 22 and
Figure 23, the curves for SIFT-ISAR and SURF are more stable, while both KLT-ISAR and SFPD exhibit larger fluctuations in performance. What is particularly notable for KLT-ISAR is its peak F1 score reaching around 0.9 but with troughs dipping below 0.2. The main cause of this phenomenon is that random affine transformations lead to significant viewpoint differences between some pairs of matching images. When there are large viewpoint differences, the feature point features in the images change, affecting the performance of the feature point matching algorithm.
Table 10 presents the performance statistics of feature point matching experiments. When
, the F1 score of SFPD shows an improvement of over 15% compared to the other three algorithms, once again validating the feature point matching performance of SFPD. To provide a more intuitive demonstration of the feature point matching performance, we present the feature point matching examples of SIFT-ISAR, SURF, KLT-ISAR, and SFPD when the matching threshold is 3 pixels in
Figure 24.
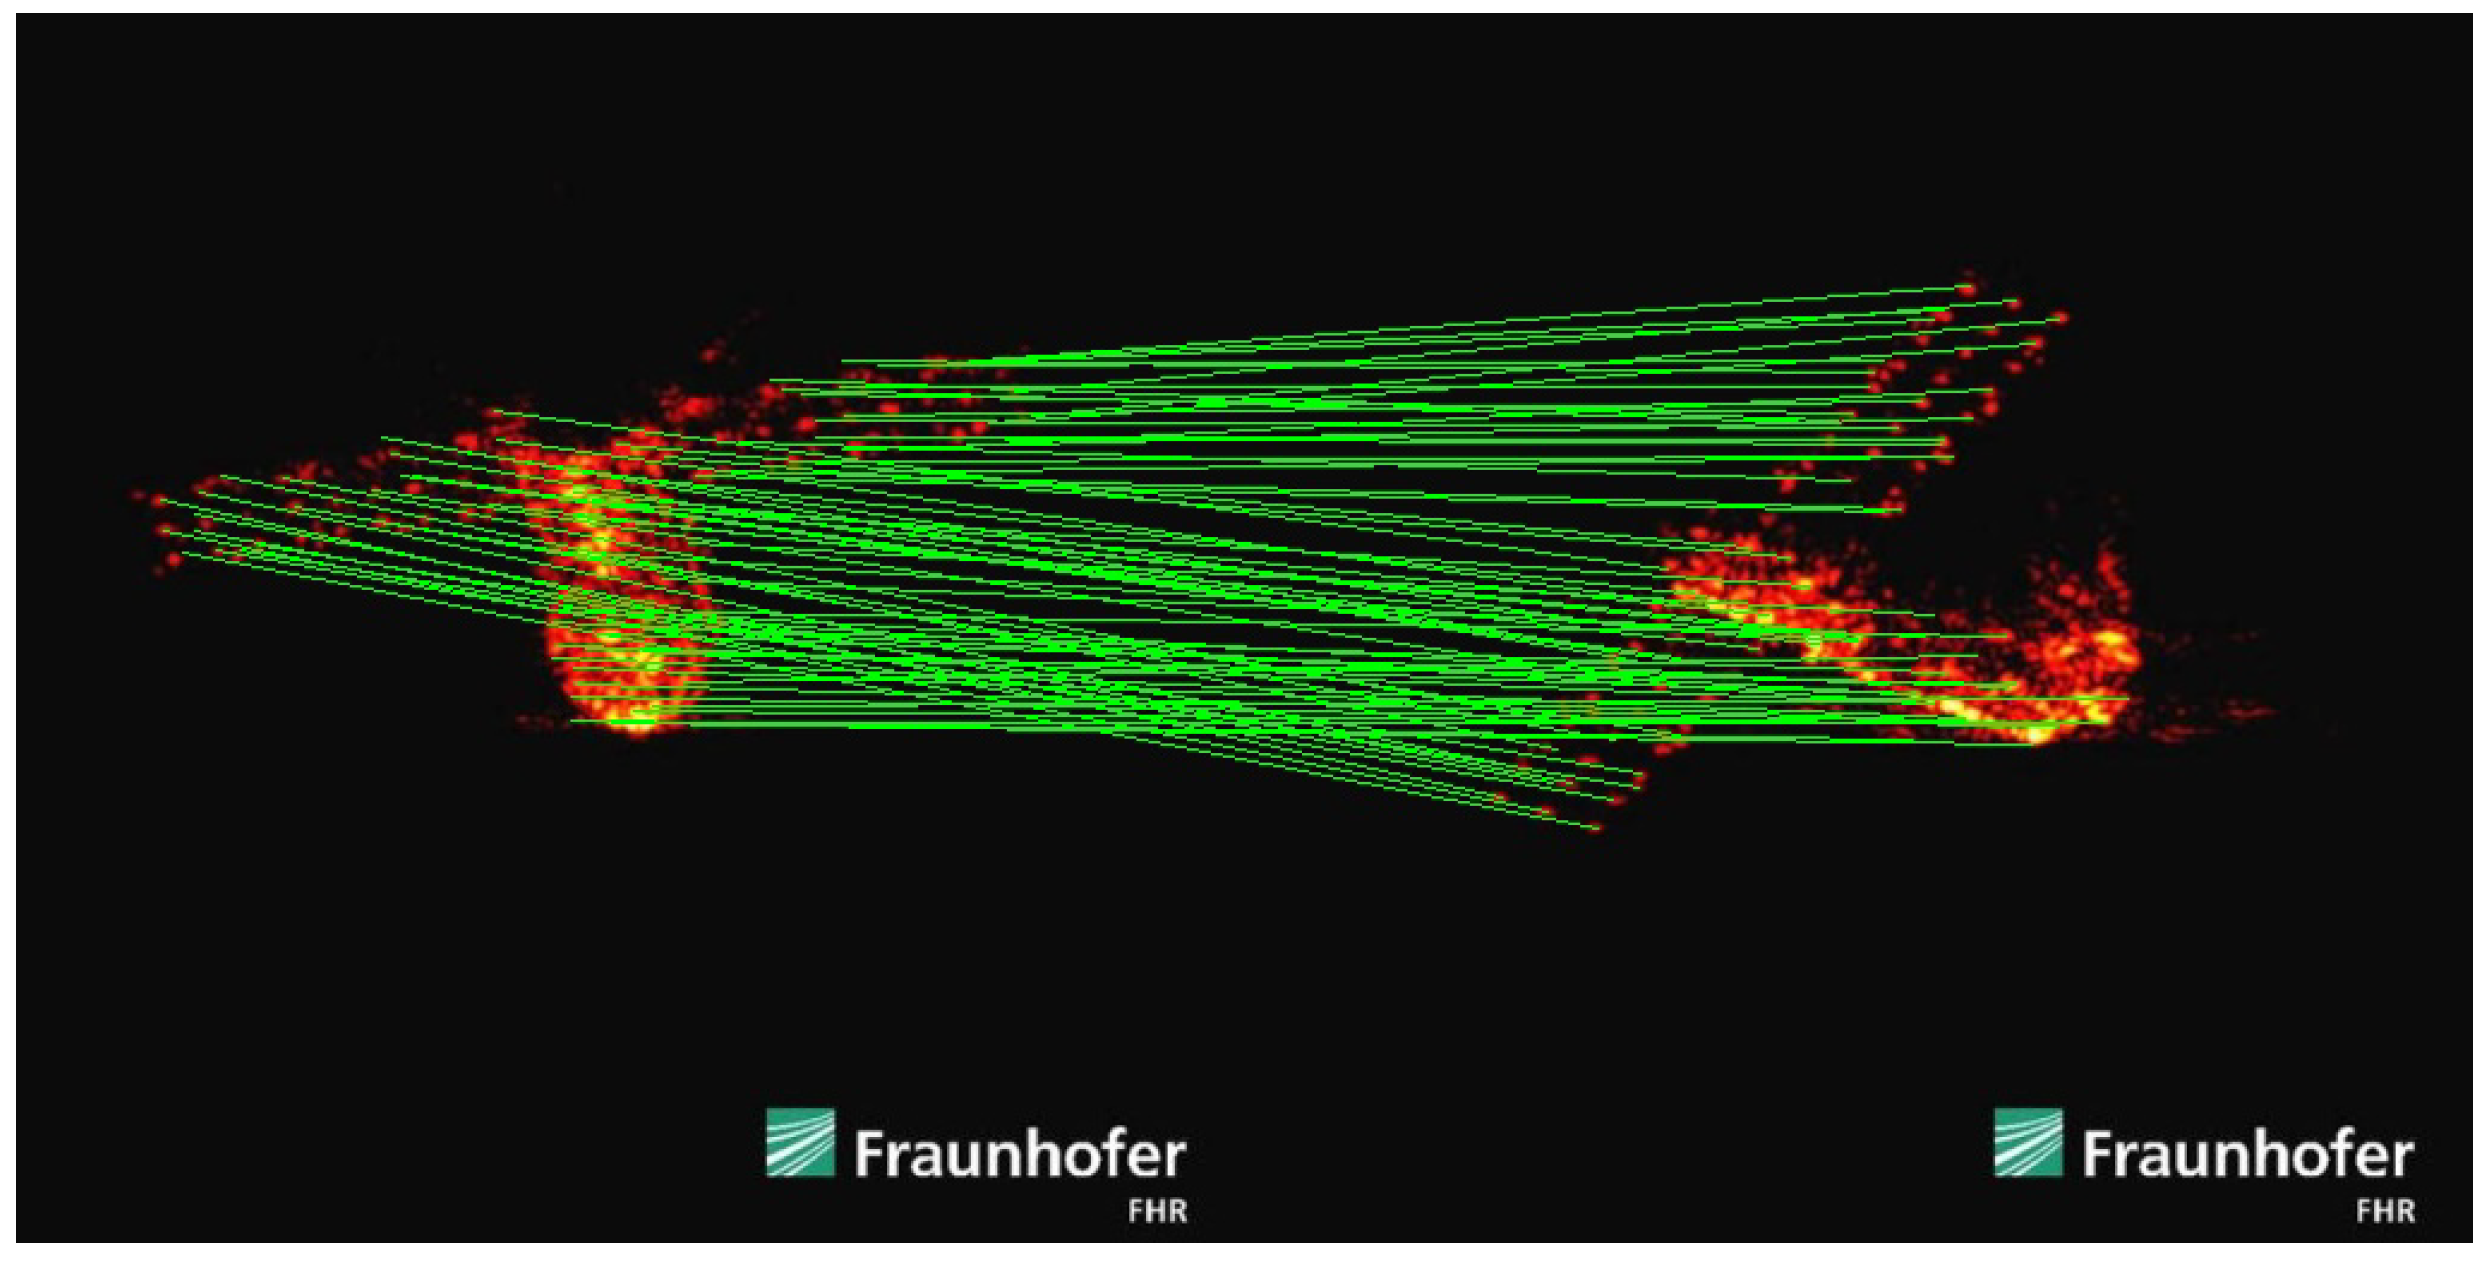
To verify the feature point detection and matching performance of SFPD more comprehensively, we process the real ISAR images using SFPD. These images were obtained by the Fraunhofer Institute for High-Frequency Physics and Radar Techniques FHR in 2018 when they used tracking and imaging radar (TIRA) to observe the fallen Tiangong-I. The experimental results are shown in
Figure 25. As shown in
Figure 25, the low texture and uneven brightness in the real ISAR images are more pronounced, presenting a greater challenge for feature point detection. It is worth noting that due to the complexity of the real ISAR images as well as the limitations of observation conditions and other factors, the ground truth of feature points is lacking, which makes it impossible to quantitatively analyze the performances of SFPD on the real data. However, by comparing and analyzing the experimental results, we can find that the feature point matching result of the two real ISAR images is highly consistent with the intuitive judgment made based on professional knowledge and experience. This is because SFPD can extract hierarchical features from the real ISAR images through a deep learning architecture based on self-supervised learning. Even in the case of low texture and uneven brightness, it can adaptively capture the latent features in the images, enabling it to accurately detect and match the feature points in the real ISAR images. In contrast, algorithms based on handcrafted descriptors, such as SIFT-ISAR, SURF, and KLT-ISAR, are not suitable for processing real ISAR images. SIFT-ISAR and SURF detect feature points through scale-space extrema and Hessian matrix approximation, which will fail when the images lack clear textures or have significant brightness variations. KLT-ISAR relies on local image information such as optical flow and gradients. The brightness changes in the real ISAR images can affect the calculation of local image information, resulting in poor performance in feature point detection and matching. This experiment indicates that SFPD also has good performance in feature point detection and matching when processing real ISAR images with severe degradation, further verifying the robustness of SFPD.
