Article

Long-Term Spatiotemporal Analysis of Crop Water Supply–Demand Relationship in Response to Climate Change and Vegetation Greening in Sanjiang Plain, China

1
State Key Laboratory of Environment Criteria and Risk Assessment, National Engineering Laboratory for Lake Pollution Control and Ecological Restoration, State Environmental Protection Key Laboratory for Lake Pollution Control, Chinese Research Academy of Environmental Sciences, Beijing 100012, China
2
Key Laboratory of Digital Earth Science, Aerospace Information Research Institute, Chinese Academy of Sciences, Beijing 100094, China
3
International Research Center of Big Data for Sustainable Development Goals, Beijing 100094, China
4
School of Geographic and Environmental Sciences, Tianjin Normal University, Tianjin 300387, China
*
Author to whom correspondence should be addressed.
Remote Sens. 2025, 17(3), 440; https://doi.org/10.3390/rs17030440
Submission received: 13 December 2024 / Revised: 24 January 2025 / Accepted: 25 January 2025 / Published: 28 January 2025

Abstract

:
The Sanjiang Plain (SJP) in Northeast China, a crucial black soil region, serves as a quintessential example of a high-intensity agricultural development zone and stands as China’s largest commercial grain production base. In the context of global climate change, pronounced global warming and increased vegetation greening are expected to significantly impact the agricultural water resource supply and its alignment with crop water requirements in the SJP. This study assesses how climate change and vegetation greening affect the crop water supply–demand relationship in the SJP, addressing the critical question of whether natural precipitation can sustain regional agricultural development. Using the extensively validated ESSI-3 distributed hydrological model, integrated with reanalysis and multi-source satellite data, we analyzed data from 1982 to 2018. The results indicate a statistically significant rise in the regional temperature and leaf area index (p < 0.05), with a notable shift around 2000. Key findings include (1) an increase in crop irrigation water requirements (IWR) post-2000, with significant spatial variation; the central and western regions experienced the highest increases, while the eastern region saw reduced risk to crop water security. Furthermore, (2) climate change accounted for approximately 37.9% of the increased IWR in central and western regions, with vegetation greening contributing about 21.2%. Conversely, in the eastern region, vegetation dynamics had a more pronounced effect (28.6%), while climate change contributed less (12.3%). These results suggest a shift in crop water deficit risk boundaries toward the east and north. To optimize water use, expanding high-water-demand crops in the eastern regions and reducing their cultivation in the west is recommended, enhancing alignment between natural precipitation and crop water needs.

1. Introduction

The Sanjiang Plain (SJP) in Northeast China, the largest contiguous forest and farmland area in the country, is pivotal for national food security due to its extensive grain production and high mechanization [1,2]. The region’s grain production, mainly corn and rice, has expanded significantly in both acreage and yield [3]. However, several challenges threaten the sustainability of this expansion:
Water resource strain: Northeast China has relatively scarce water resources, with only 30.63% of the national average [4]. Irrigation demands in the SJP have surged by 7.806 billion cubic meters since 2000 [2], leading to a decline in groundwater levels by approximately 30 cm annually [5].
Climate vulnerability: Situated in mid-to-high latitudes, the SJP is highly sensitive to climate change. The region has experienced a rapid warming trend of 0.31 °C per decade from 1951 to 2022, outpacing both the national and global averages [6,7]. This warming, coupled with increased climatic variability, poses significant risks to crop production [8,9].
Vegetation dynamics: The leaf area index (LAI), a key indicator of ecosystem health, has been increasing in many northern mid-to-high latitudes [10,11,12]. This “greening” is influenced by factors such as climate change and enhanced agricultural practices, which, while boosting productivity, also complicate the water supply–demand balance [13].
As the largest commodity grain-producing region in China, the discrepancy between water resource availability and agricultural production in the SJP is well-documented and has emerged as a major constraint on sustainable agricultural development [14,15]. The efficient utilization of water resources is a critical component of sustainable crop production. Given the increasing national food demand and escalating water scarcity, achieving higher food production with reduced water usage presents a formidable challenge [16]. Previous research has extensively explored crop water demand and irrigation water requirements using various approaches, including numerical model simulations, remote sensing techniques, and the FAO-recommended Penman–Monteith method [17]. However, existing studies have primarily relied on traditional methods that aggregate crop acreage and meteorological data at coarse regional scales, which fall short of addressing the spatial and temporal granularity required for accurate crop water assessments [18]. Most previous research has focused on administrative boundaries (e.g., county or province level) as the smallest unit of analysis, which fails to capture the fine-scale spatial heterogeneity of crop water requirements. Moreover, the estimation of effective precipitation, a key factor for irrigation planning, relies heavily on empirical formulas, neglecting the effects of regional climatic variability, soil moisture dynamics, and rainfall distribution over time, leading to significant uncertainties [19,20].
Rainfall is the primary driver of changes in irrigation demand, and optimizing rainfall utilization is regarded as an advantageous strategy [21]. However, due to the lack of long-term insights into the spatial distribution of effective rainfall and crop irrigation requirements, the SJP’s reliance on high irrigation quotas to offset water scarcity underscores the need for better management of effective precipitation. To more precisely characterize crop water availability under rainfed conditions, actual evapotranspiration provides a critical metric for evaluating water accessible to crops. Advances in satellite remote sensing and reanalysis data allow for the generation of high-resolution spatial and temporal estimates of AET across entire crop growth periods, incorporating the effects of precipitation, soil evaporation, crop transpiration, water stress, and soil moisture dynamics [20]. Additionally, distributed hydrological models, when integrated with these datasets, enable a more detailed understanding of the spatial and temporal variability of CWR and irrigation needs under changing climatic conditions.
Despite these advancements, significant gaps remain, particularly in the application of such methods at finer spatial scales in regions like the SJP. To address these challenges, this study aimed to explore how regional climate change and vegetation greening impact the crop water supply–demand relationship in the SJP. Using a distributed hydrological model and long-term satellite and reanalysis data, this study evaluated changes in agricultural water scarcity from 1982 to 2018. Specifically, this work sought to (i) quantify the evolving relationships among crop water requirements, effective precipitation, and irrigation needs at a high spatial resolution; (ii) investigate the mechanisms by which regional climate change and agricultural greening have affected agricultural water use in the SJP; and (iii) assess long-term adaptation and mitigation strategies to optimize the alignment between crop water needs and effective precipitation. By addressing the limitations of traditional methods and leveraging advanced tools to assess CWR and irrigation needs, this study provides novel insights into how changes in regional climate and agricultural practices influence the crop water supply–demand relationship. These findings are crucial for enabling farmers to adjust their strategies at the micro-level to mitigate income risks and informing management decisions at the macro-level. Ultimately, the insights derived from this study will contribute to ensuring regional and national food security while providing essential information for the development of adaptive water resource management strategies.

2. Materials and Methodology

2.1. Materials

2.1.1. Study Area

The SJP, located in northeastern China (43°49′55″−48°27′40″N, 129°11′20″−135°05′26″E), is formed by sediment deposition from the Heilongjiang, Songhua, and Ussuri rivers (Figure 1). The region’s topography slopes from southwest to northeast, transitioning from piedmont plateaus to alluvial plains, which cover approximately 60% of the area with average elevations of 50−60 m above sea level. The SJP experiences a temperate humid and semi-humid continental monsoon climate, characterized by cold, dry winters and warm, humid summers [22].
The SJP features a complex water system, including the Sanjiang Wetlands, one of China’s largest freshwater wetlands. The region’s flat topography is dotted with fertile plains intersected by rivers and streams [23]. The predominant soil types—black soil, meadow soil, and solonchak—are among the world’s most significant original black soil zones [24]. Agriculture flourishes in the SJP, with key crops including rice, corn, and soybeans. The region’s cropping pattern centers on spring maize and single-season rice, with middle rice sown in early May and harvested by late September, and spring maize sown in late April and harvested in early September [24].
While traditional farming practices are common, there is a growing focus on sustainable agriculture and environmental conservation. Balancing increased productivity with the preservation of unique wetland ecosystems presents a critical challenge, making the SJP a significant case study in agriculture, ecology, and regional development [22].

2.1.2. Meteorological Forcing Dataset

The grid-based meteorological dataset used in this study includes downward shortwave radiation (Rsds), incoming longwave radiation (Rlds), air temperature (Tas), precipitation (Pr), surface pressure (Ps), specific humidity (SH), and wind speed (WS) from 1982 to 2018. Data were sourced from the China Meteorological Forcing Dataset (CMFD, available at https://data.tpdc.ac.cn/en/data/8028b944-daaa-4511-8769-965612652c49/, accessed on 1 December 2023). The CMFD integrates reanalysis products, remote sensing data (e.g., TRMM precipitation), and ground-based observations using advanced modeling techniques [25]. Covering a wide temporal range and providing a comprehensive spatial resolution of 0.1°, this dataset is crucial for examining long-term climatic trends, spatial variability, and extreme weather events.

2.1.3. Remotely Sensed Data

The study utilized the GLOBMAP LAI (Version 3) product to assess long-term vegetation dynamics (available at https://zenodo.org/records/4700264, accessed on 15 December 2023). This dataset provides global LAI data at an 8 km resolution, with temporal resolutions of 16 days (1982–2000) and 8 days (2001–2018), integrating historical AVHRR and MODIS data through quantitative fusion [26]. The relationships between AVHRR observations and MODIS LAI were established pixel by pixel using two data series during the overlapped period (2000–2006).
The Gravity Recovery and Climate Experiment (GRACE) Mascon solution from the Jet Propulsion Laboratory (JPL RL06M.MSCNv02 Mascon solutions, available at https://grace.jpl.nasa.gov/data/get-data/jpl_global_mascons/, accessed on 1 March 2024), was employed in this study to derive monthly terrestrial water storage anomaly (TWSA) for the period from January 2003 to December 2016, with a spatial resolution of 0.5°. Previous analysis pointed out that the Mascon solution decreases leakage errors from land to ocean and has a superior performance compared to traditional spherical harmonic solutions [27].

2.2. Methods and Models

2.2.1. Determination of Crop Water Demand (CWD)

Following the single crop coefficient method outlined by Allen et al. [28], the calculation of CWD was performed as follows (Equation (1)):
C W D = K c × E T 0
where ET0 is the reference evapotranspiration (mm/day) and Kc signifies the single crop coefficient. The computation of the CWD for a reference crop is based on the assumption that an adequate water supply is accessible for uptake in the rooting zone. The crop coefficients for various growth stages are established by crop leaf area and phenological development. In this study, the Kc value for rice and maize in the Sanjiang Plain were derived from the FAO56 manual and relevant literature [24,29], as shown in Table 1, without consideration of spatial and temporal variations. Based on the extensively validated FAO Penman–Monteith method in China, daily ET0 was determined by Equation (2):
E T 0 = 0.408 Δ ( R n G ) + ϒ 900 T + 273 U 2 ( e s e a ) Δ + ϒ ( 1 + 0.34 U 2 )
where Rn and G represent the net radiation at the crop surface and the soil heat flux density (MJ/m2/day), respectively; T and u2 denote the mean daily air temperature (°C) and wind speed (m/s) at 2 m height, respectively; es and ea stand for the saturation and actual vapor pressure (kpa), respectively; and Δ and γ represent the slope of the vapor pressure curve and the psychrometric constant (kpa/°C), respectively.

2.2.2. Hydrological Model

Hydrological models are essential tools for quantifying the dynamic changes in regional water cycles and assessing the impacts of climate change and human activities on hydrological processes. The selection of an appropriate model depends on factors such as the scale of the research question, regional characteristics, data availability, model robustness, spatial and temporal resolution requirements, and acceptable levels of uncertainty. Commonly used models like the SWAT (Soil and Water Assessment Tool) and VIC (Variable Infiltration Capacity) are frequently applied in such studies. However, the VIC model, suited primarily for large-scale simulations, and the semi-distributed SWAT model fail to adequately capture spatial heterogeneity in regional hydrological processes [22]. Moreover, both models oversimplify vegetation dynamics, as the LAI is assumed constant within a month and does not respond to environmental changes, limiting its ability to accurately simulate vegetation transpiration and soil moisture [30].
This study utilizes the third version of the Infiltration Excess and Saturation Excess Soil–Water Integration model (ESSI-3). ESSI-3 is a grid-based, spatially distributed hydrological model designed to simulate both vertical (as presented in Figure 2) and horizontal (runoff generation and confluence) hydrological processes. It integrates diverse geographic, meteorological, and environmental conditions to provide accurate hydrological simulations [23,30,31,32,33].
For the case of SJP, the ESSI-3 model incorporates an evapotranspiration (ET) module using a remote sensing-based two-leaf Jarvis-type canopy conductance (RST-Gc) model to estimate daily actual ET. This estimation relies on available soil water and reference values for its four components. The RST-Gc model includes functions for biophysical constraints such as air temperature, green canopy fraction, and soil water deficit. It integrates vertical root distribution and a three-layer soil water balance module to simulate soil water content and water stress, while also accounting for root oxygen stress when soil approaches saturation. Thus, the total actual ET is calculated as the sum of wet canopy evaporation (ETc,wet), dry canopy transpiration (ETc,dry), moist soil evaporation (ETs,wet), and saturated soil evaporation (ETs,sat):
E T = E T c , w e t + E T c , d r y + E T s , w e t + E T s , s a t
The ESSI-3 hydrological model, utilizing remote sensing and reanalysis datasets, simulated daily hydrological processes from 1982 to 2018 in the Sanjiang Plain, as detailed by Xu et al. [23]. The model’s performance was validated using a multi-variable and multi-objective calibration approach (see Figure 3), with observed discharge, remote sensing-based evapotranspiration, and TWS as key assessment components. Compared to discharge data from four hydrological stations in three sub-basins, the model achieved coefficients of determination (R2) and Nash–Sutcliffe Efficiency (NSE) of between 0.81 and 0.92 and 0.74 and 0.89, respectively. Simulated evapotranspiration correlations with MOD16 data exceeded 0.9 across most regions. Additionally, the TWS anomalies simulated by ESSI-3 aligned more closely with mascon data products (JPL/CSR/GSFC) than those from GLDAS models (VIC and Noah). These results demonstrate the model’s reliability in simulating baseline rainfed conditions. The outputs from Xu et al. [23] served as inputs for this study.
This study established a baseline period from 1982 to 1999 and evaluated two simulation scenarios for 2000 to 2018 to isolate the effects of climate and vegetation changes on irrigation water requirement (IWR). Both scenarios used consistent meteorological data (daily, 2000–2018) but differed in vegetation inputs. The first scenario employed static vegetation conditions, using fixed Land Use/Land Cover (LULC) and LAI data, to assess IWR changes attributable solely to climate variations. The second scenario incorporated dynamic vegetation changes, with annual LULC and daily LAI data, to evaluate IWR impacts from vegetation dynamics. Comparing these scenarios with the baseline allowed for a quantitative analysis of IWR responses to vegetation changes.

2.2.3. Determination of IWR

The IWR is the additional supplied water to meet CWR, beyond the effective rainfall. Both effective precipitation and actual evapotranspiration for crops are related concepts in agriculture and hydrology. Normally, effective precipitation focuses on the water supply side, representing the available water from precipitation after accounting for losses [34]. Typically, effective rainfall is estimated using measured precipitation and an empirically derived utilization coefficient, such as the Soil Conservation Service method proposed by the United States Department of Agriculture [24]. However, the accurate determination of effective rainfall is complex as it requires consideration of many factors such as canopy interception, surface runoff, and water percolating to layers below the root zone. In addition, the spatial heterogeneity of precipitation and the complexity of the terrain lead to particularly large uncertainties in the calculation of effective rainfall.
Actual evapotranspiration for crops focuses on the demand side, representing the actual uptake of water required to meet crop growth. From the perspective of actual water uptake for the ‘reference’ crop, this study established a baseline scenario for rainfed conditions, which represents the natural hydrological cycle. This baseline scenario was designed based on the ESSI-3 model to simulate purely rainfed conditions, where precipitation serves as the sole source of CWR and irrigation is not taken into account. In this scenario, irrigated crops face constraints due to water availability under rainfed conditions. Consequently, the crop-specific actual evapotranspiration simulated by the hydrological model represents green consumption, while the differences observed between the crop water requirement and the crop-specific actual evapotranspiration are attributed to irrigation consumption, which represents blue consumption. Hence, the IWR is quantified at a daily temporal scale with a spatial resolution of 1 km, using the discrepancies between CWD and rainfed actual evapotranspiration:
I W R = C W D A E T r a i n f e d

2.2.4. CropWat Model and Statistical Analysis

The CropWat model, developed by the Food and Agriculture Organization (FAO), is a widely used tool for estimating crop water requirements and scheduling irrigation. It integrates meteorological data, crop parameters, and soil characteristics to predict water consumption under various conditions [35]. The model’s reliability has been demonstrated in numerous studies [34,35]. To validate the accuracy of the crop water consumption methodology proposed in this study, it was compared with the CropWat model under similar conditions. This evaluation used three performance indicators: the root mean square error (RMSE), bias, and coefficient of determination (R2), following established practices [32]. The Mann–Kendall (MK) test and Sen’s Slope estimator were used to analyze the long-term trends of various hydrological, vegetation, and meteorological variables. Specifically, Sen’s Slope was used to calculate the magnitude of the trend, while the MK test was applied to assess the statistical significance of the observed trends, following established practices [36].

2.2.5. Calculating the Irrigation Water Scarcity Index (IWSI) on a Grid Level

Building upon the concepts of the blue water (WSIblue) and green water scarcity indexes (WSIgreen) from the research of Mekonnen and Hoekstra [37] and Xie et al. [38], this study employed the computational grid as the fundamental unit to compute the IWSI in the SJP. This index serves to indicate the extent to which crop water requirements rely on natural rainfed conditions and the scarcity of irrigation water resources, as follows:
I W S I = I W R C W D = C W D A E T E S S I 3 C W D
The IWSI value ranges from 0 to 1, where an IWSI value of 0 indicates that natural rainfed conditions are sufficient to meet the maximum evapotranspiration demand for crop yield maximization, eliminating the need for irrigation. An IWSI value of 1 indicates that all crop water requirements are met through irrigation. Referring to similar index grading standards [37,38], the scarcity of irrigation water consumption is classified into five levels: negligible (IWSI < 0.15), low (0.15 ≤ IWSI < 0.30), moderate (0.30 ≤ IWSI < 0.45), high (0.45 ≤ IWSI < 0.60), and severe (IWSI ≥ 0.60). IWSI helps identify irrigation hotspots, where crop irrigation demands are high, potentially leading to increased agricultural water resource conflicts in the region’s socio-economic and environmental systems.

3. Results

3.1. Spatial-Temporal Variation of Climate and Vegetation Factors

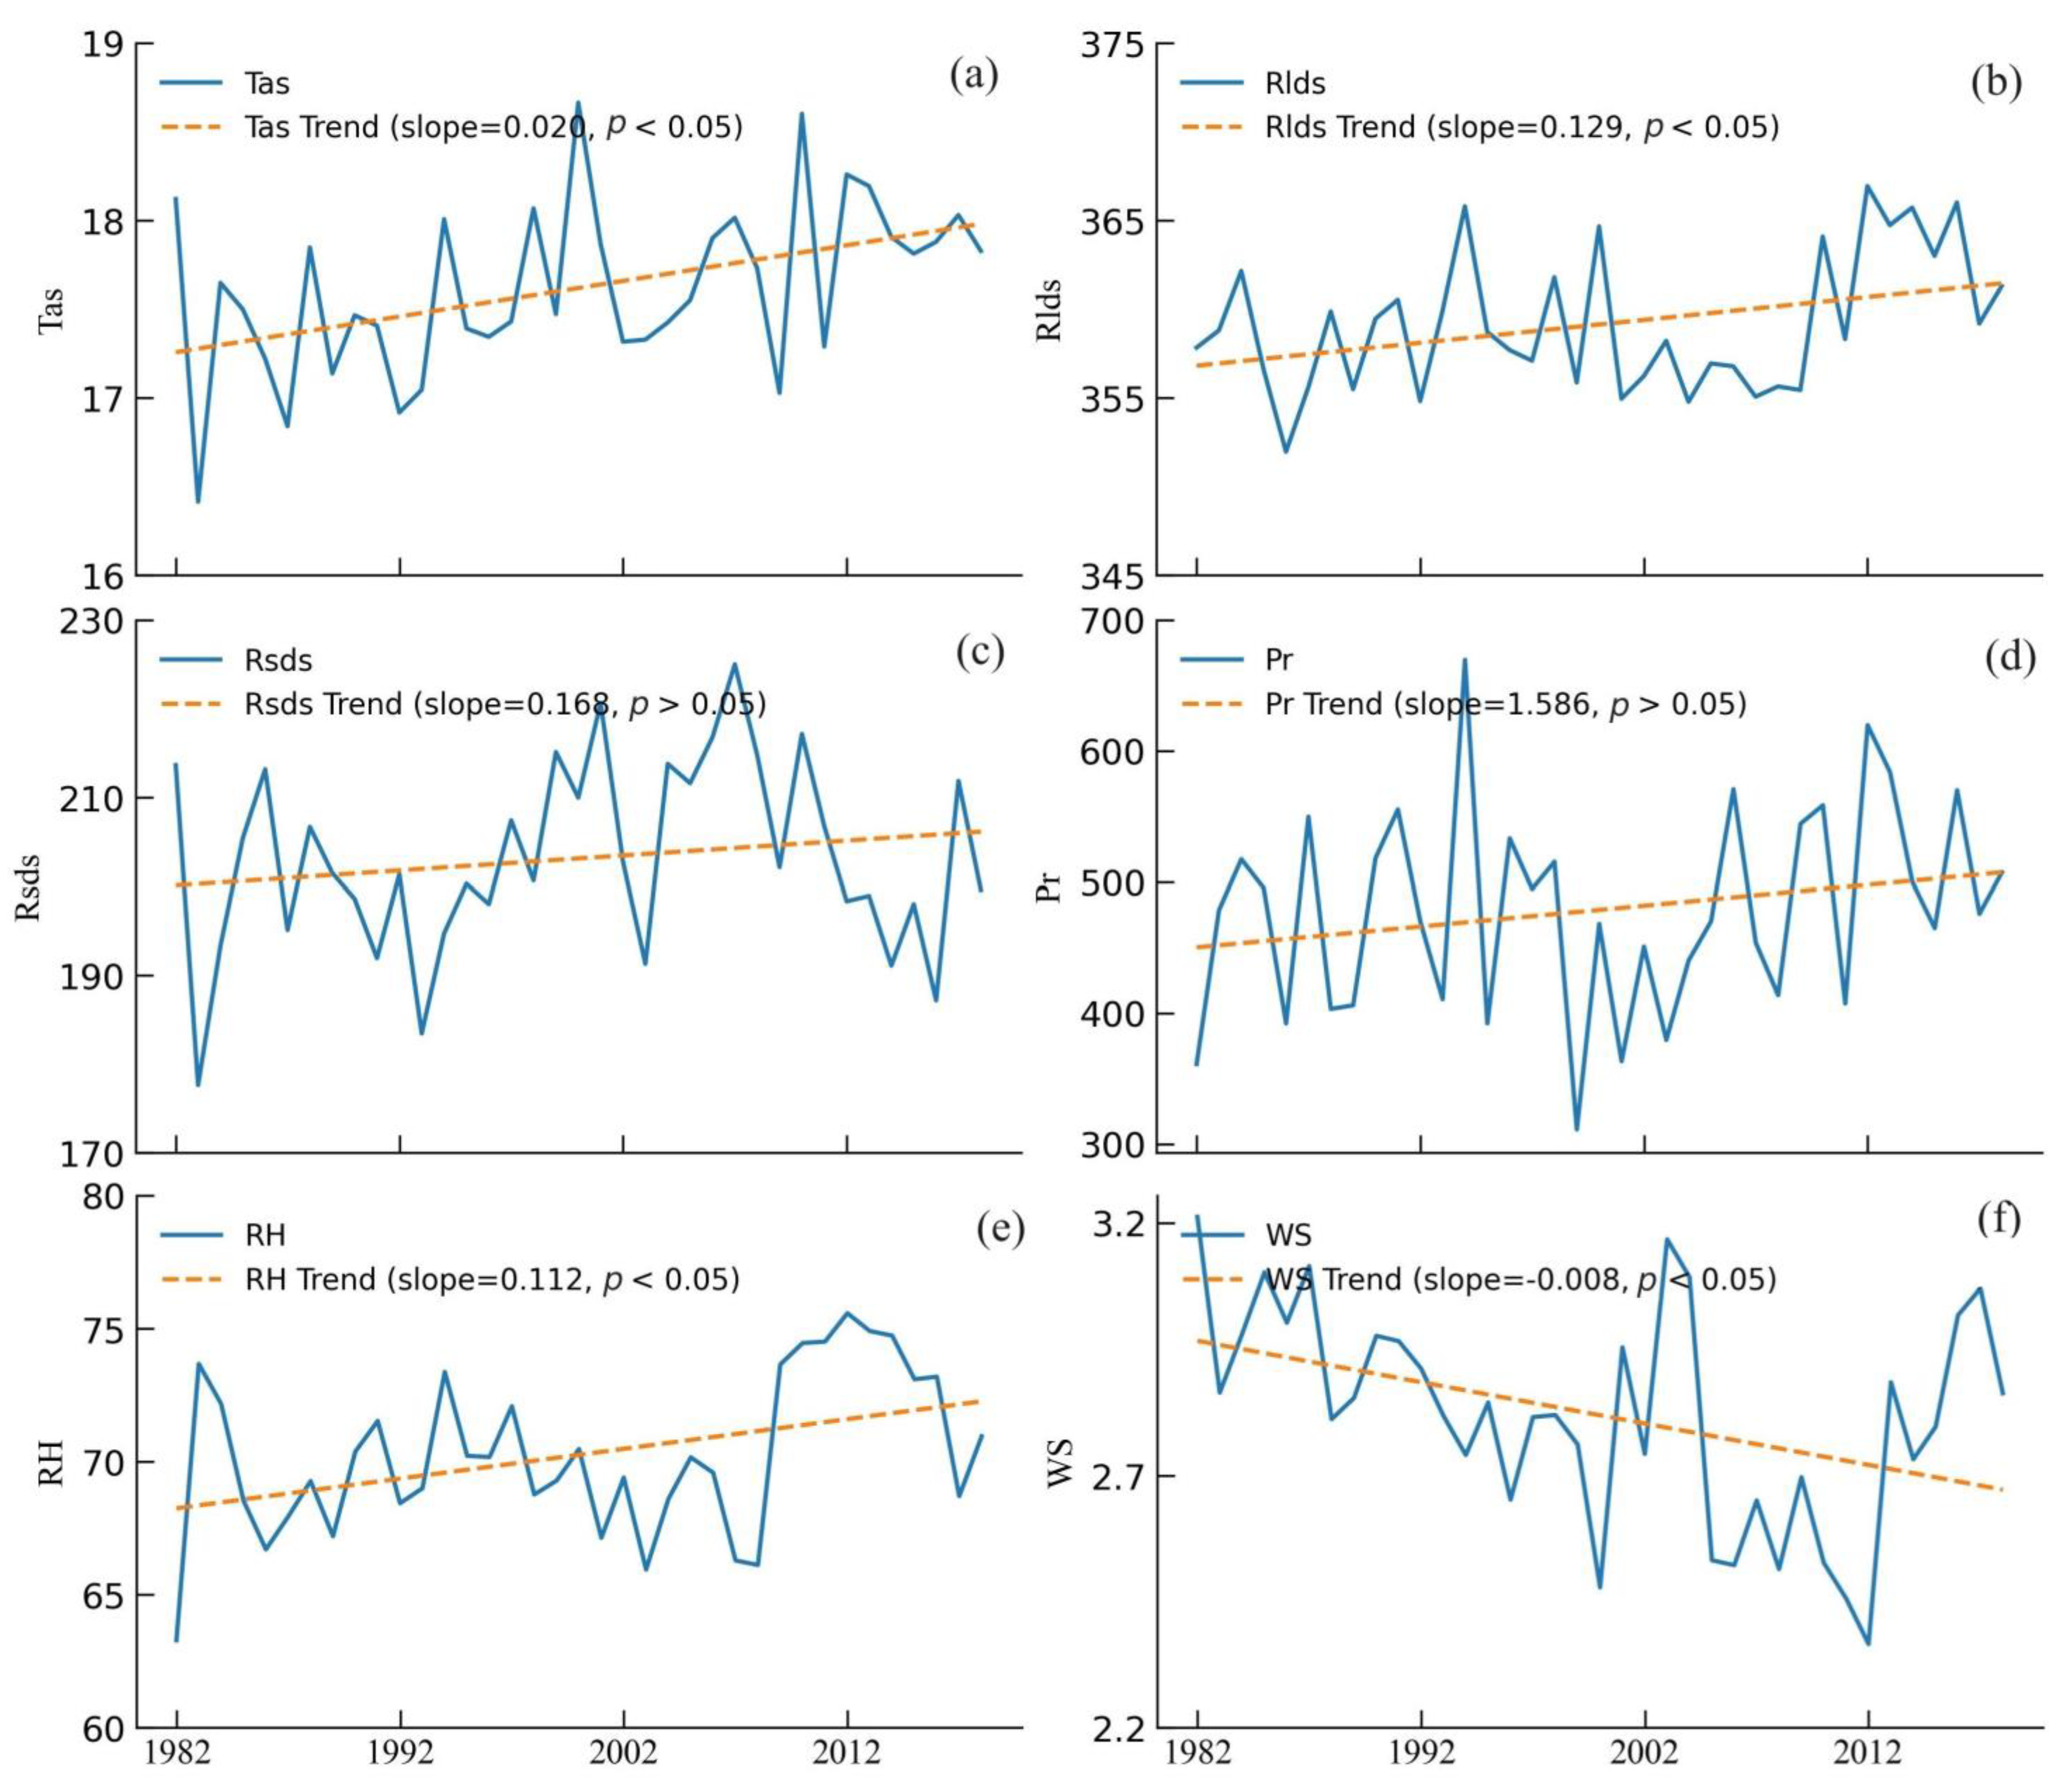
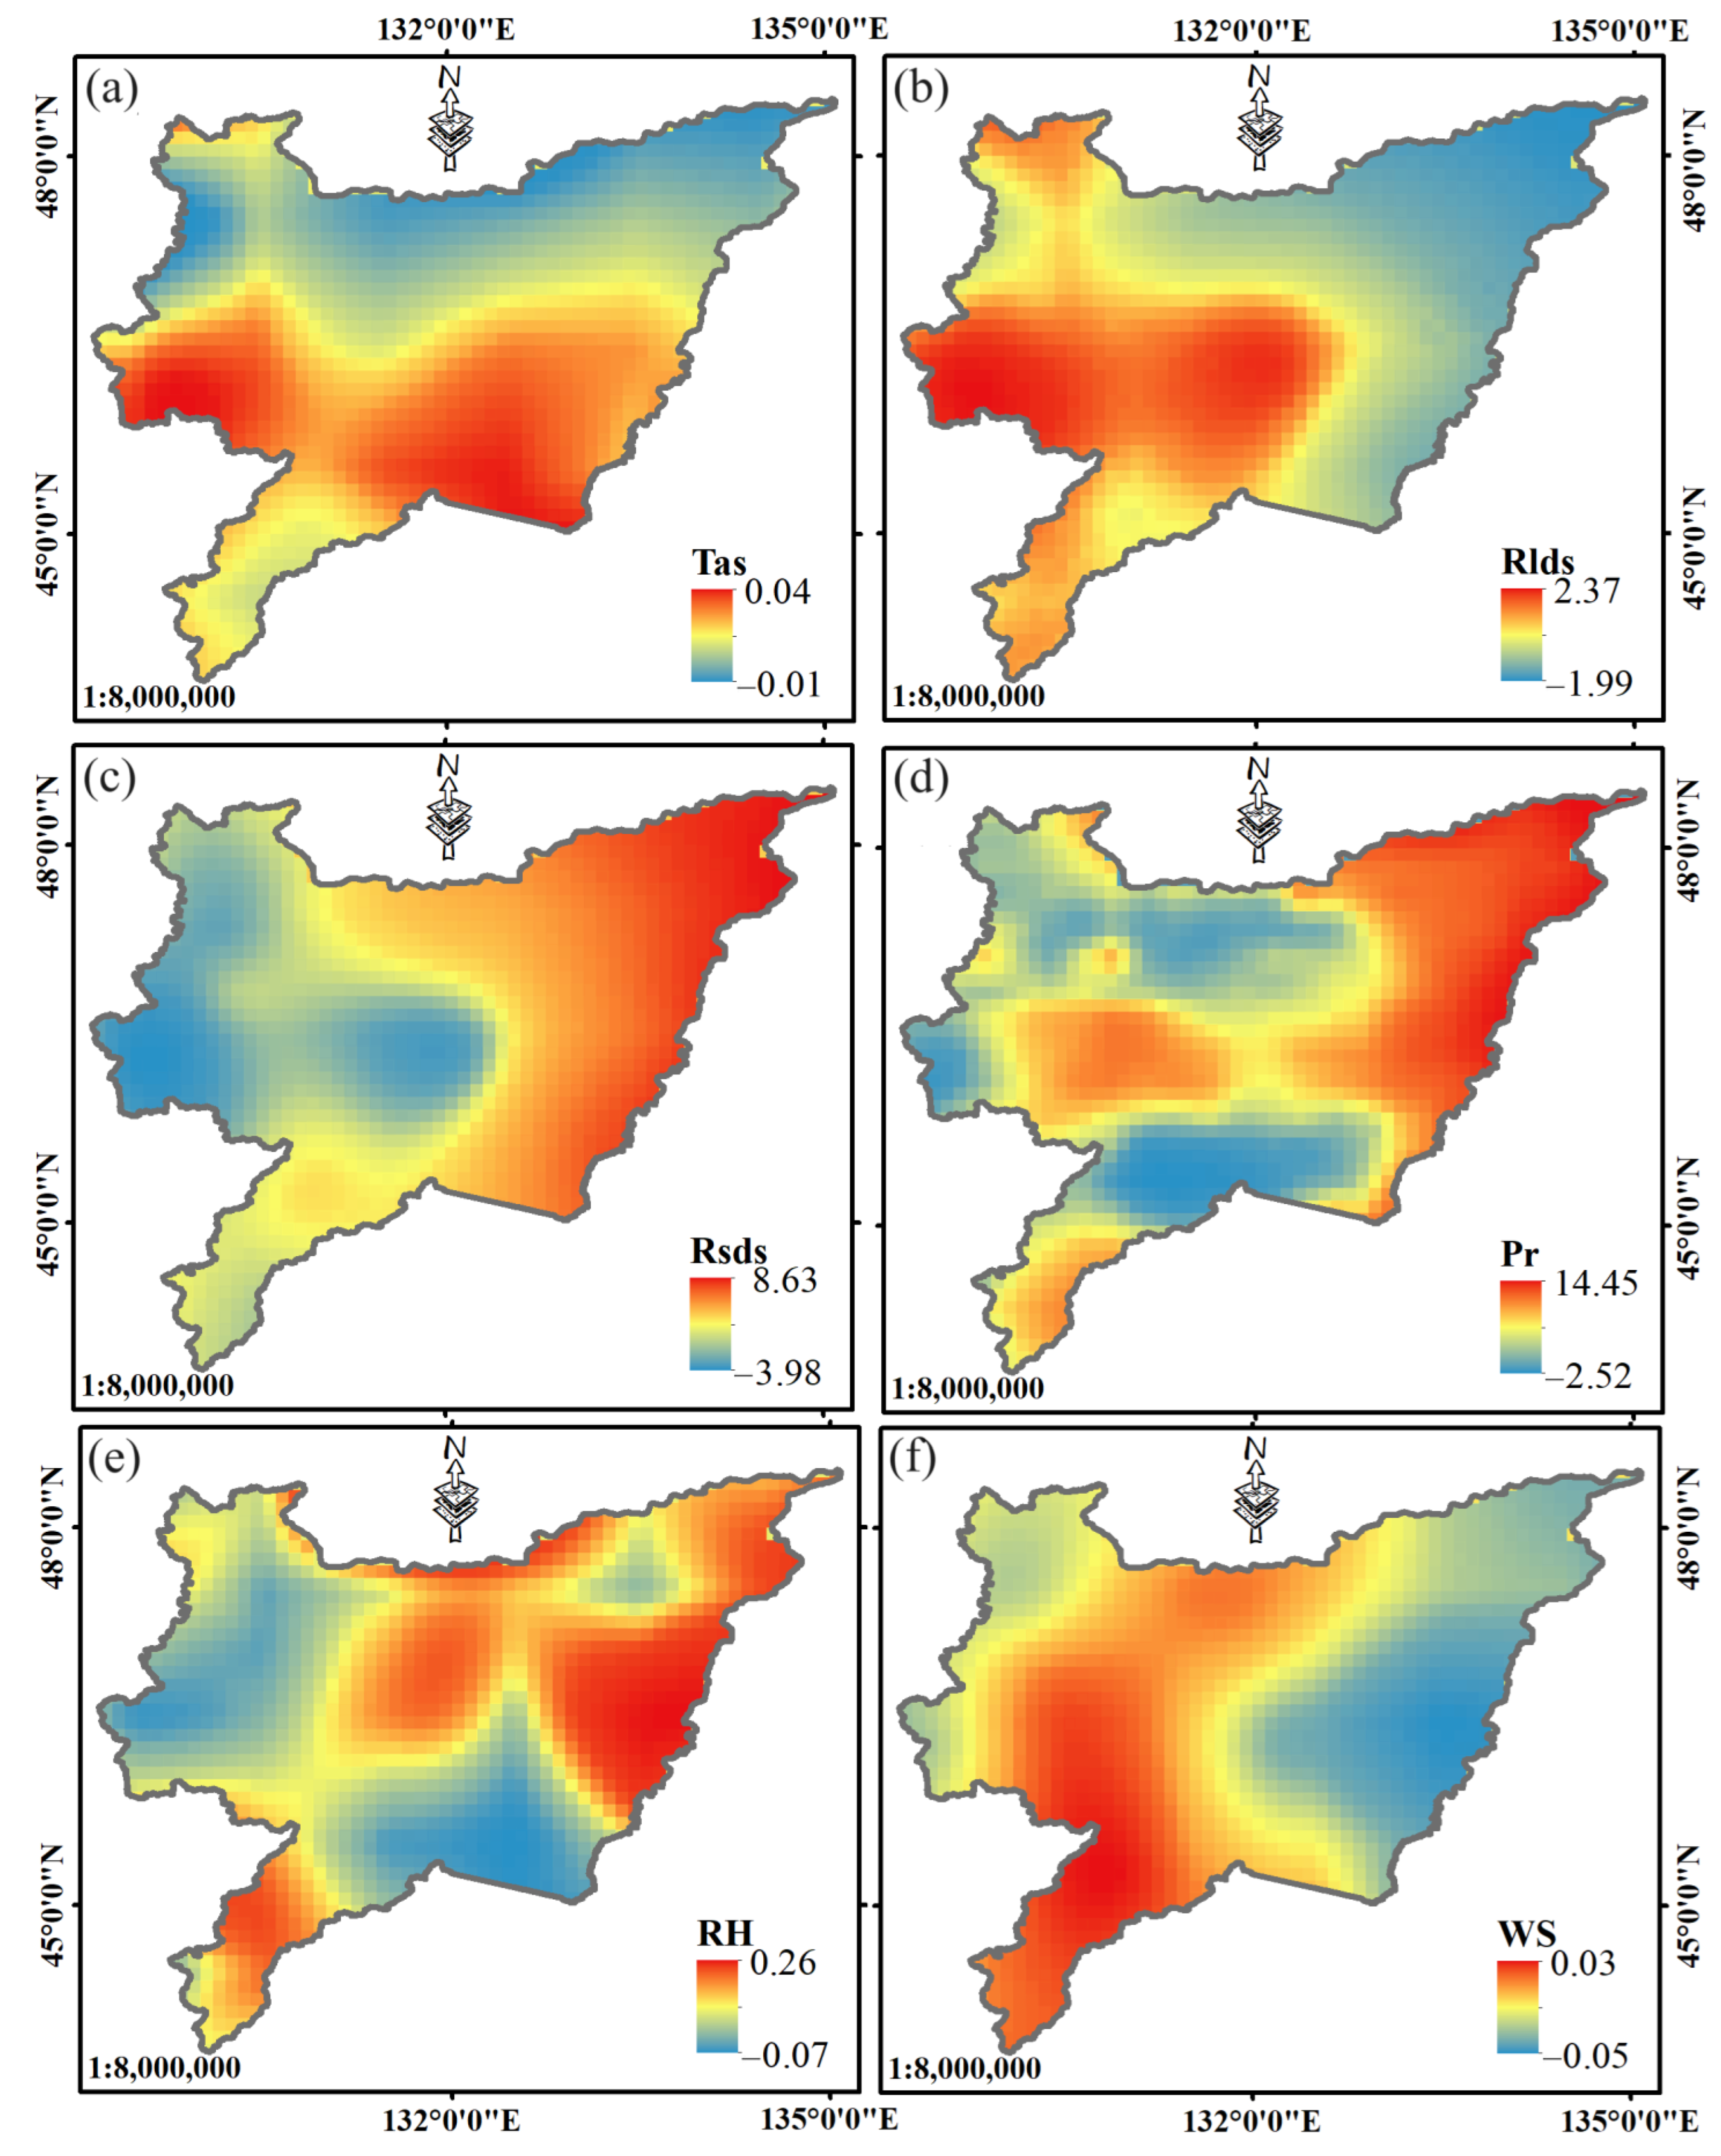
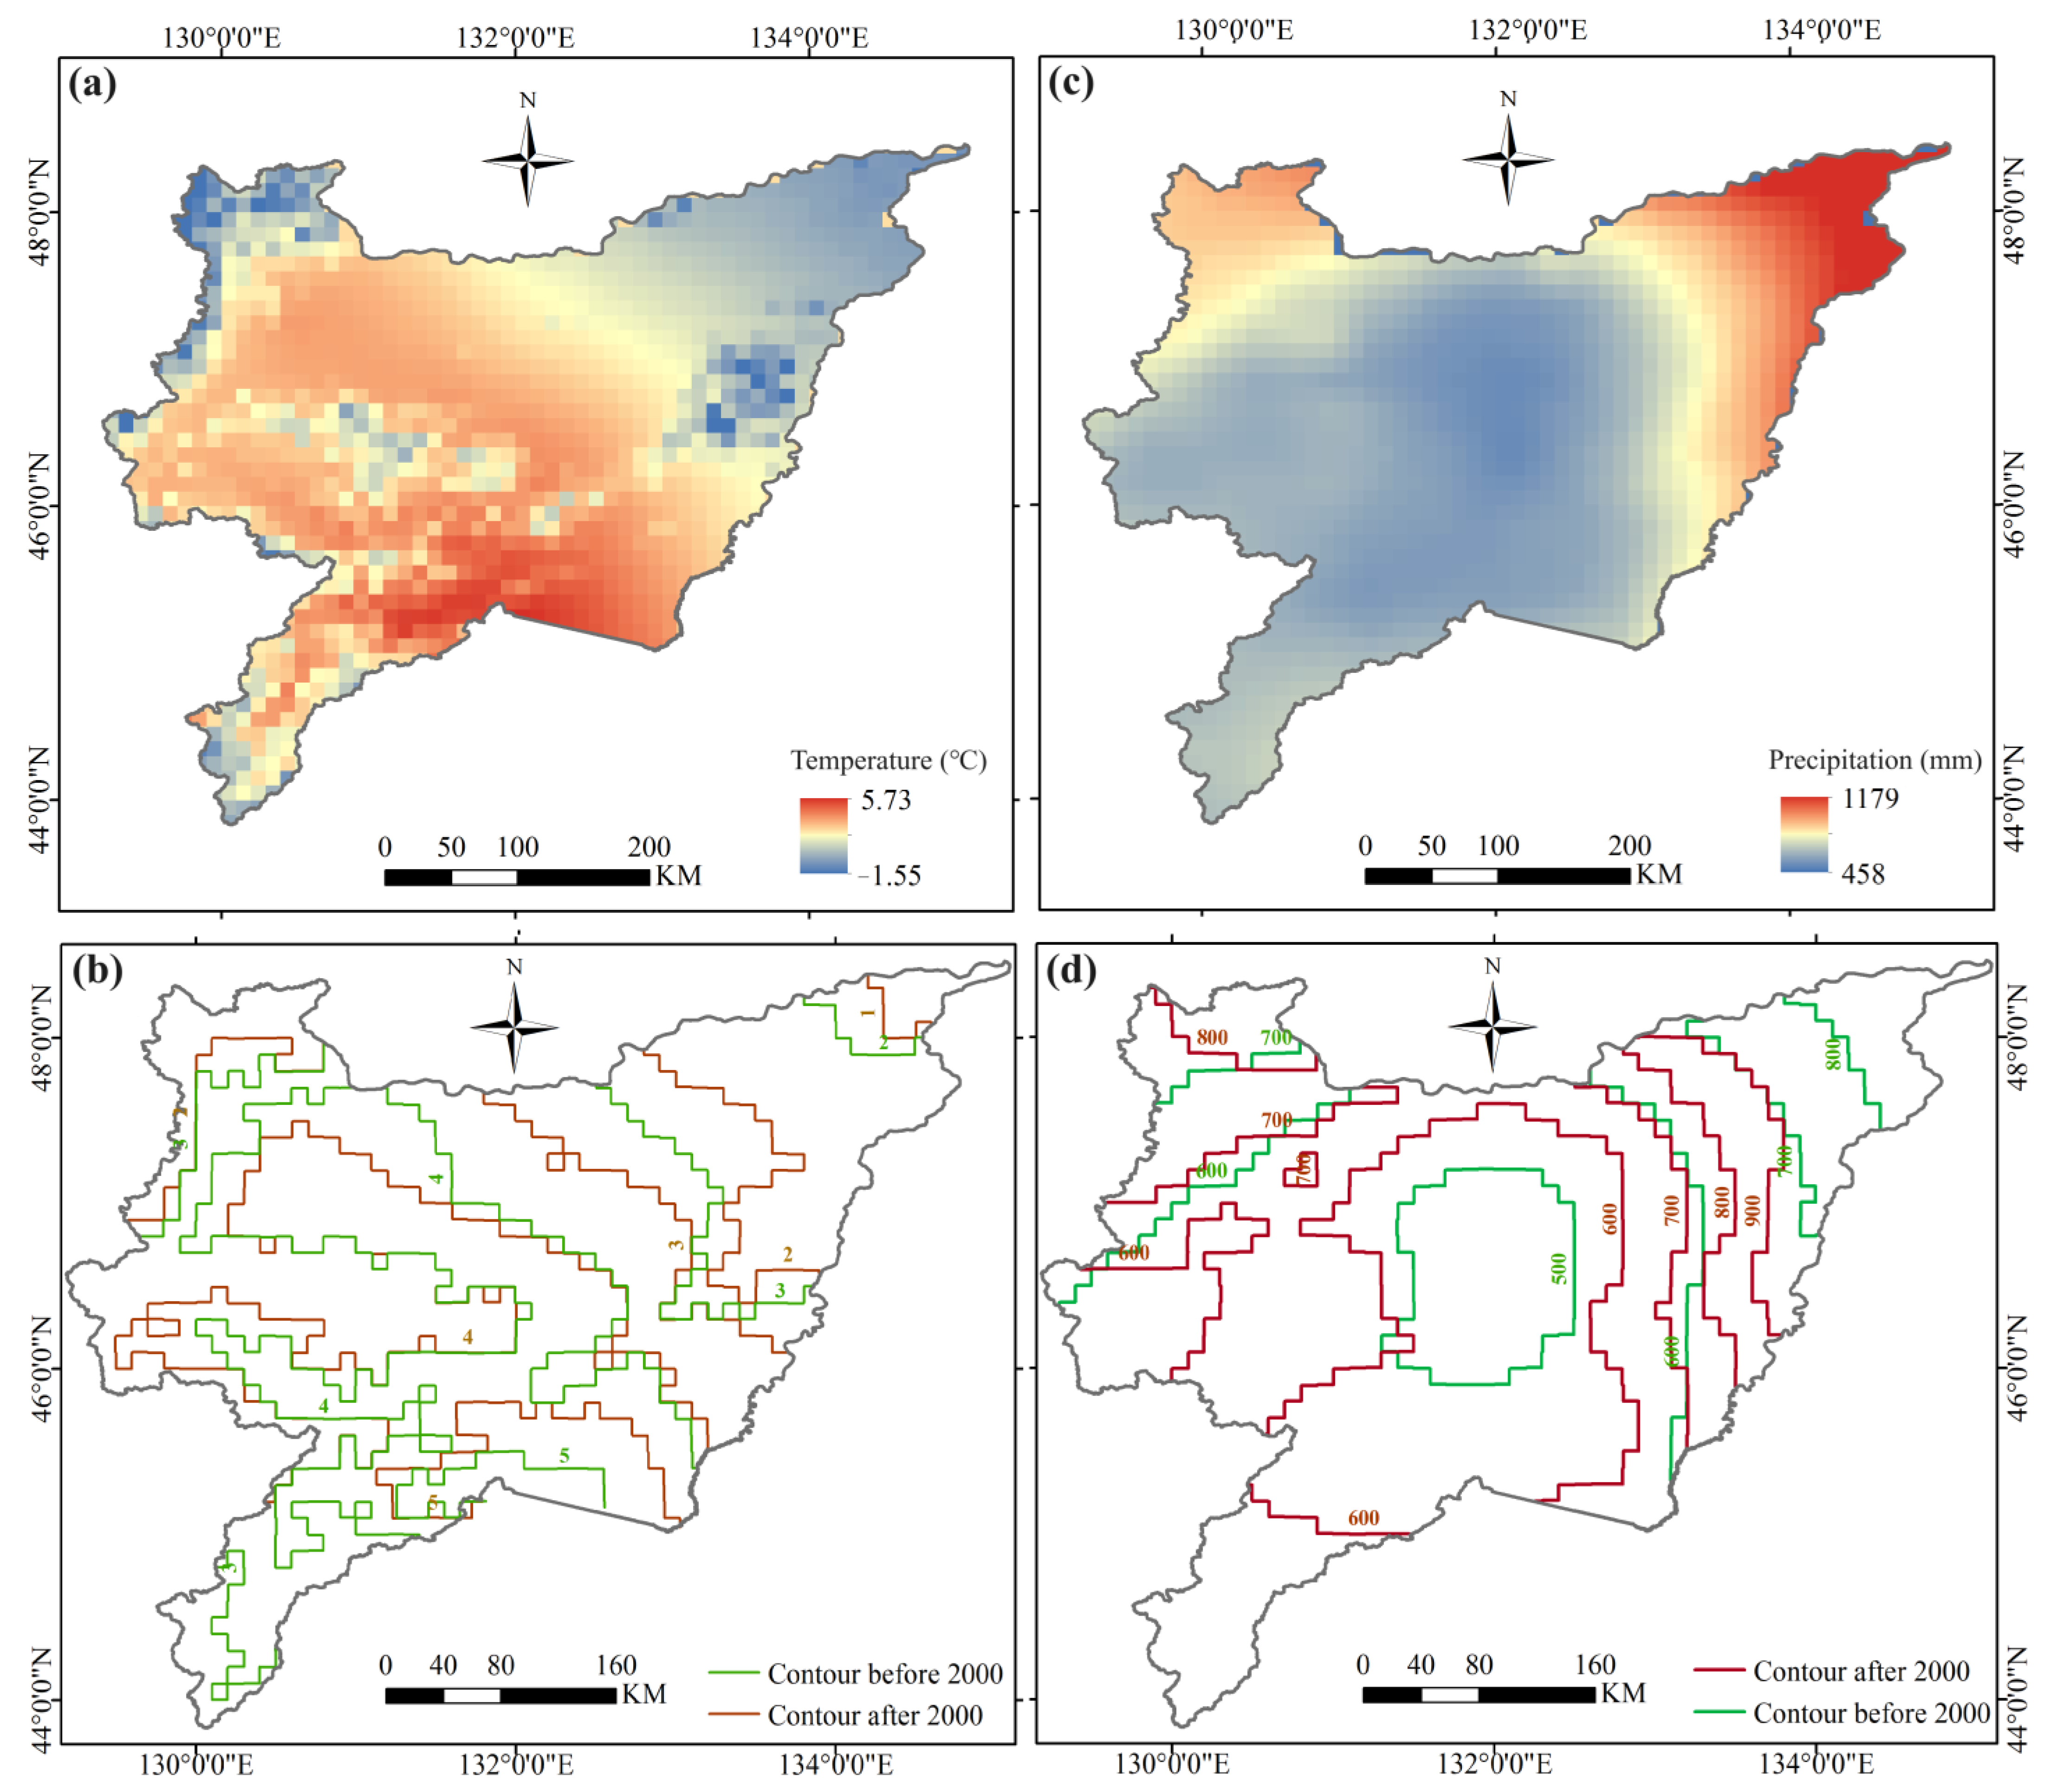
3.1.1. Changes in Meteorological Factors

Figure 4 illustrates the temporal variation of key meteorological variables during crop growth periods from 1982 to 2018 in the SJP. The annual mean Tas increased significantly at a rate of approximately 0.02 °C per year (p < 0.05), indicating consistent regional warming. Surface energy inputs, represented by Rlds and Rsds, both showed increasing trends, with Rlds rising by 0.13 W·m−2 per year (p < 0.05) and Rsds increasing by 0.17 W·m−2 per year (p > 0.05). The trend in area-averaged annual mean Pr was positive, at 1.59 mm per year, but not statistically significant (p > 0.05). RH increased at 0.11% per year (p < 0.05), while WS decreased by −0.008 m·s−1 per year (p < 0.05). These changes indicate significant shifts in climatic conditions, with rising temperatures, increased humidity, and reduced wind speeds, potentially affecting the region’s hydrological cycle and agricultural systems.
Figure 5 illustrates the spatial distribution of trends in meteorological parameters from 1982 to 2018 in the SJP. Temperature trends (Figure 5a) reveal a general increase across the region, with the most pronounced warming in the central and southern areas, showing trends from −0.01 °C/year to 0.04 °C/year, reflecting heterogeneous warming. Radiation trends display contrasting spatial patterns: the eastern SJP experienced the greatest increase in Rsds, while the central and western regions saw the highest increases in Rlds. Pr and RH trends exhibited complex variations, with the central and eastern regions showing increases, while some southern and southwestern areas experienced declines. WS notably decreased in the southeastern SJP. Overall, the spatial distribution highlights significant regional variability in meteorological parameters, demonstrating the intricate interactions among climatic and environmental factors in the SJP.

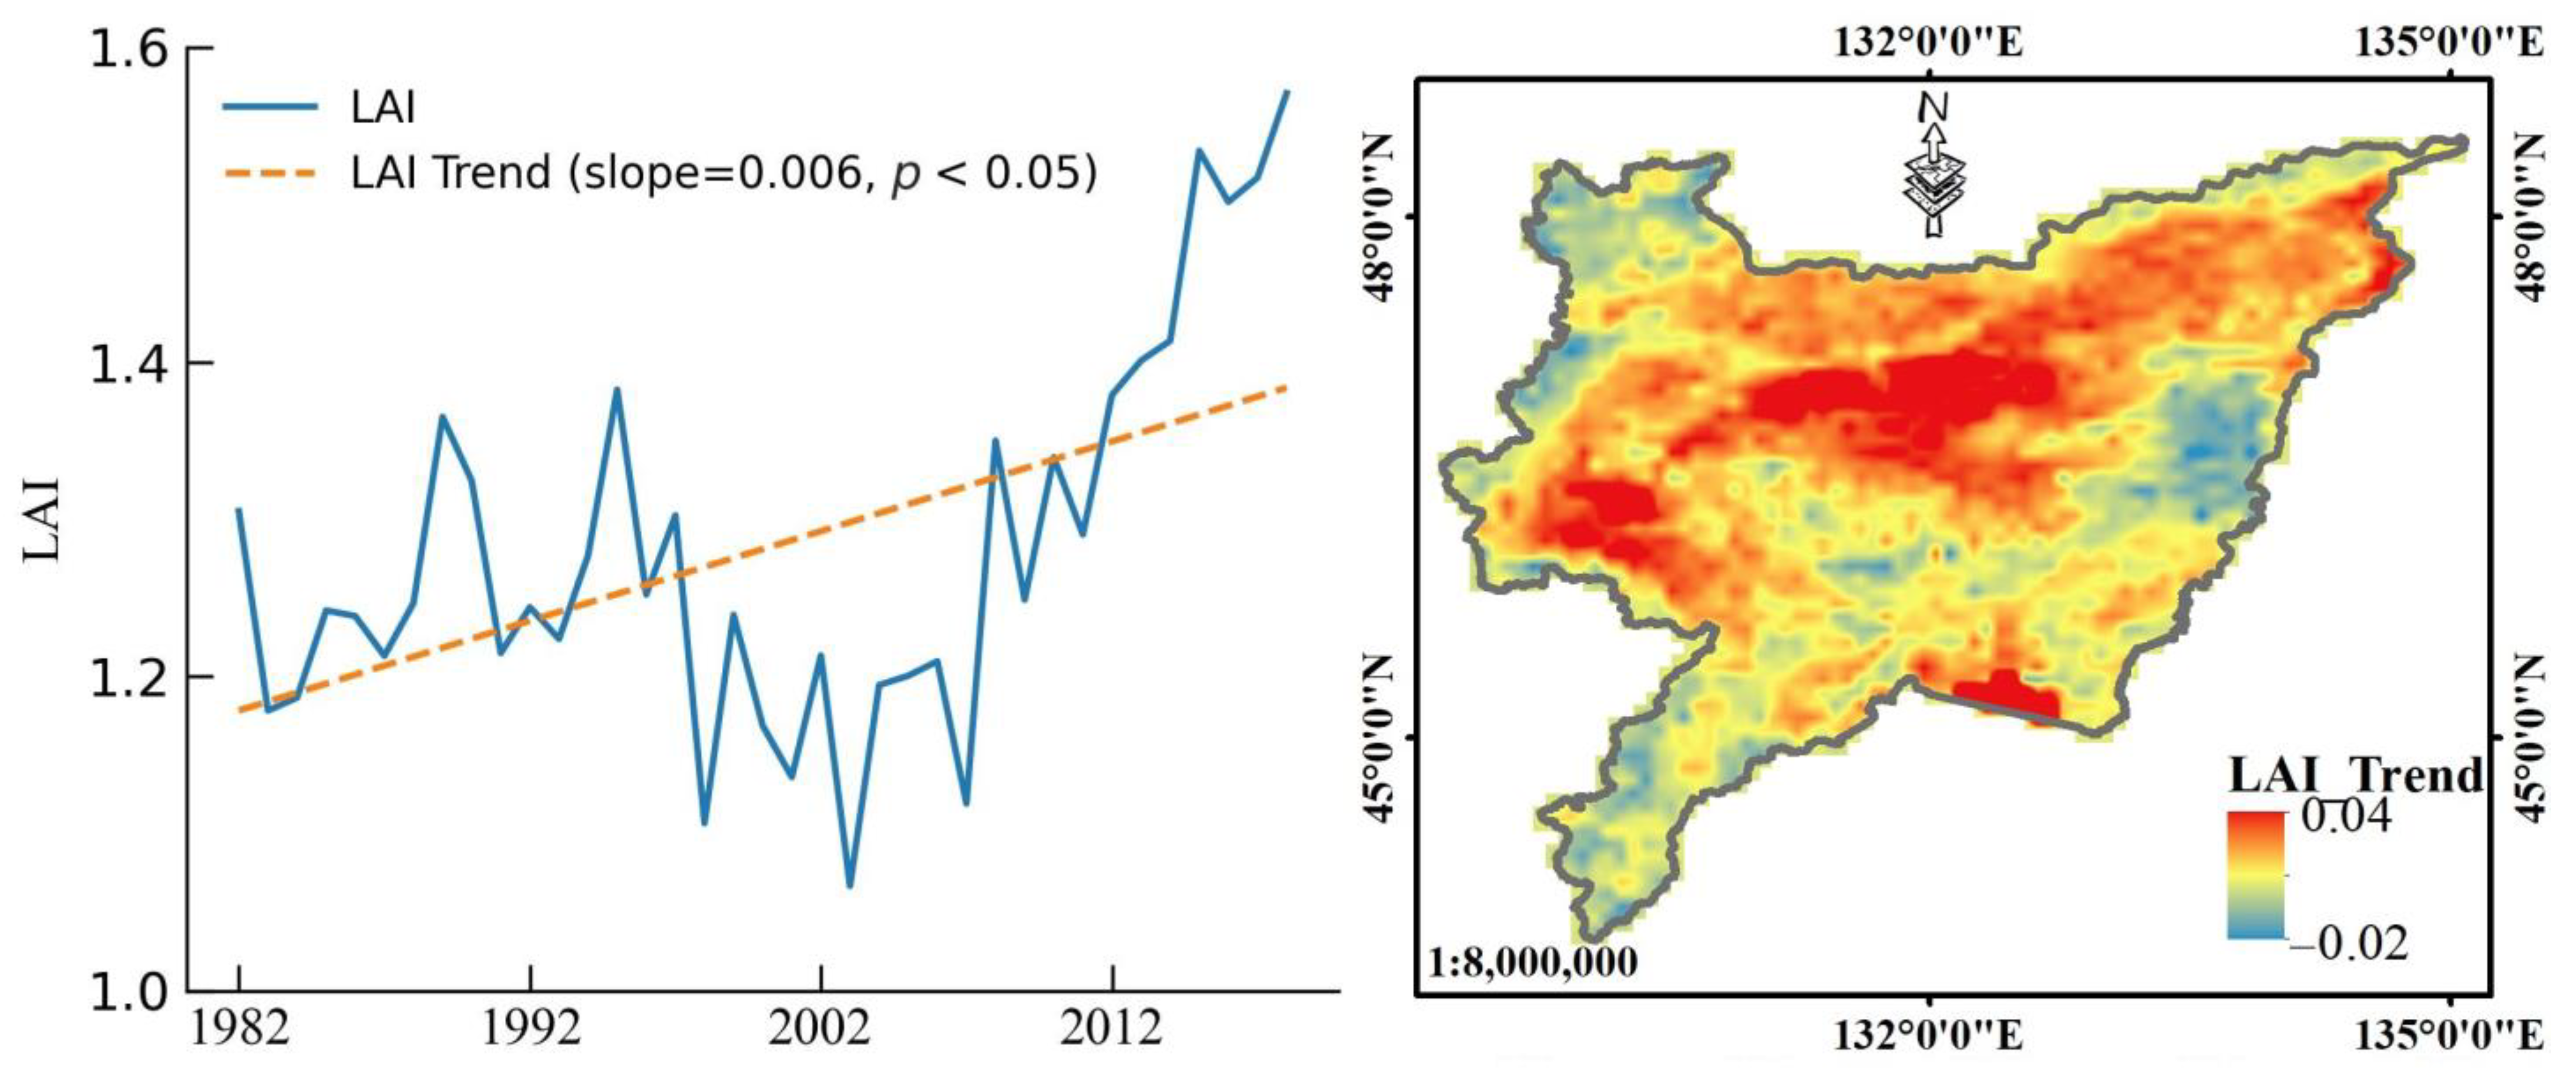
3.1.2. Changes in LAI

Figure 6 illustrates the intra-annual variations and spatial distribution of the LAI trends from 1982 to 2018 in the SJP. The analysis reveals a statistically significant upward trend with a slope of 0.006 (p < 0.05), indicating a gradual increase in vegetation density and productivity. Although the LAI in the SJP experienced a slight decline around the year 2000, it quickly showed a rapid recovery and upward trend, particularly after 2007, with LAI values reaching a peak at the end of the study period. This phenomenon was observed not only in the SJP but also across the Amur River Basin, potentially reflecting the underlying characteristics of regional vegetation changes. According to Zhou et al. [36], this trend was primarily driven by shifts in regional wet and dry conditions. Spatially, the LAI trends varied considerably: the central and northeastern SJP experienced the most significant increases, with trends reaching up to 0.04 per year. Conversely, the southeastern SJP showed negative trends and the western regions exhibited moderate positive trends. Overall, while LAI increased across the SJP, the rate of increase was more pronounced in the plains areas compared to the hilly and mountainous regions.

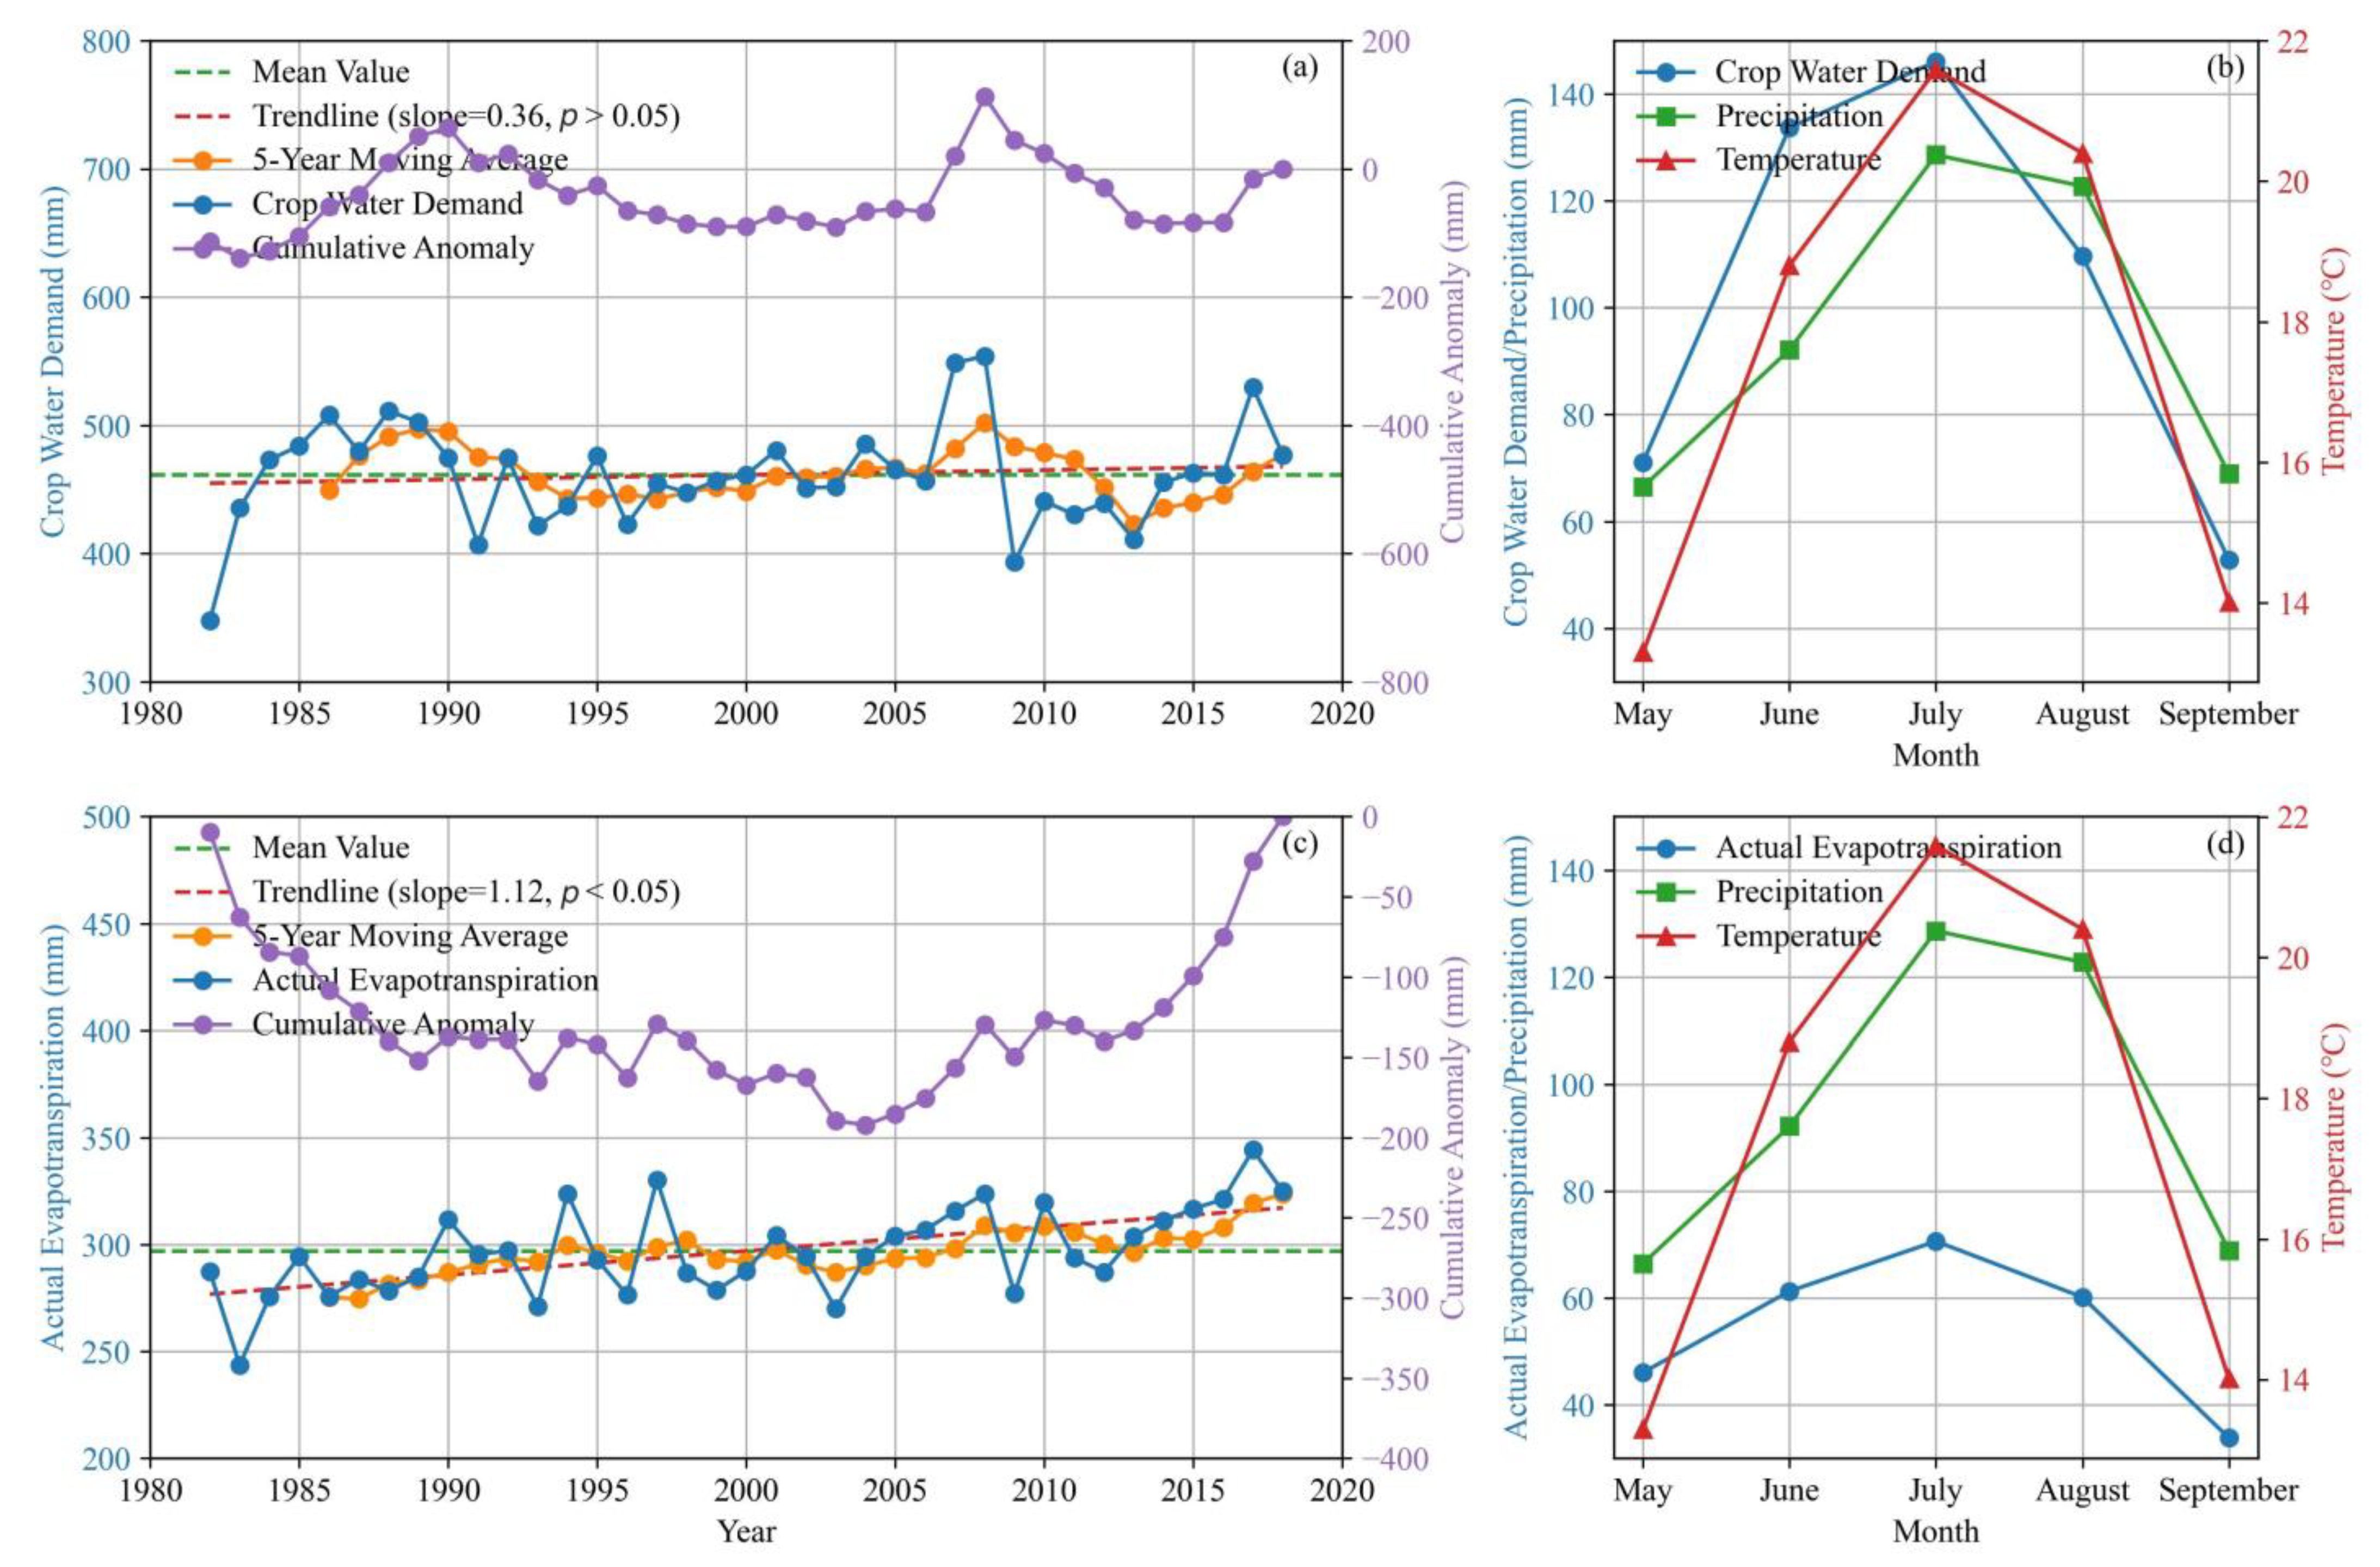
3.2. Spatial-Temporal Variation of CWD and Rainfed AET

Figure 7 shows the spatial patterns of average annual CWD and rainfed AET from 1982 to 2018, derived using the crop coefficient method and the ESSI-3 model at a 1 km2 resolution. The average annual CWD and rainfed AET for the SJP were 461 mm and 297 mm, respectively. High CWD and rainfed AET values were concentrated in the Jiamusi region and the Naoli River Basin, areas known for intensive rice cultivation. In contrast, lower CWD and rainfed AET values were found in regions with low NDVI and rainfed cropland.
Figure 8 illustrates the inter-annual and monthly variations of CWD and rainfed AET. Over the inter-annual scale, CWD showed an increasing trend with a slope of 0.36 mm/year (p > 0.05), despite fluctuations. CWD was lowest in 1982 and peaked at approximately 554 mm in 2008. Cumulative anomalies and moving averages indicated an upward trend from the early 1980s to the late 1990s, followed by a decline and subsequent gradual increase, reflecting a more variable water demand pattern. In contrast, rainfed AET exhibited a consistent upward trend with a slope of 1.12 mm/year (p < 0.05), reaching its maximum of about 344 mm in 2017. The AET cumulative anomaly showed a V-shaped pattern, with a notable recovery in the later years after a sharp decline in the early 2000s.
Monthly trends revealed that both CWD and rainfed AET increased from May to July and decreased from July to September. July recorded the highest values for CWD (approximately 146 mm) and rainfed AET (71 mm). This pattern corresponds with increases in Pr and Tas from May to July, followed by decreases from July to September. July is thus identified as a critical month with peak values for CWD, AET, Tas, and Pr, suggesting heightened evapotranspiration and potential water stress, potentially mitigated by increased precipitation.

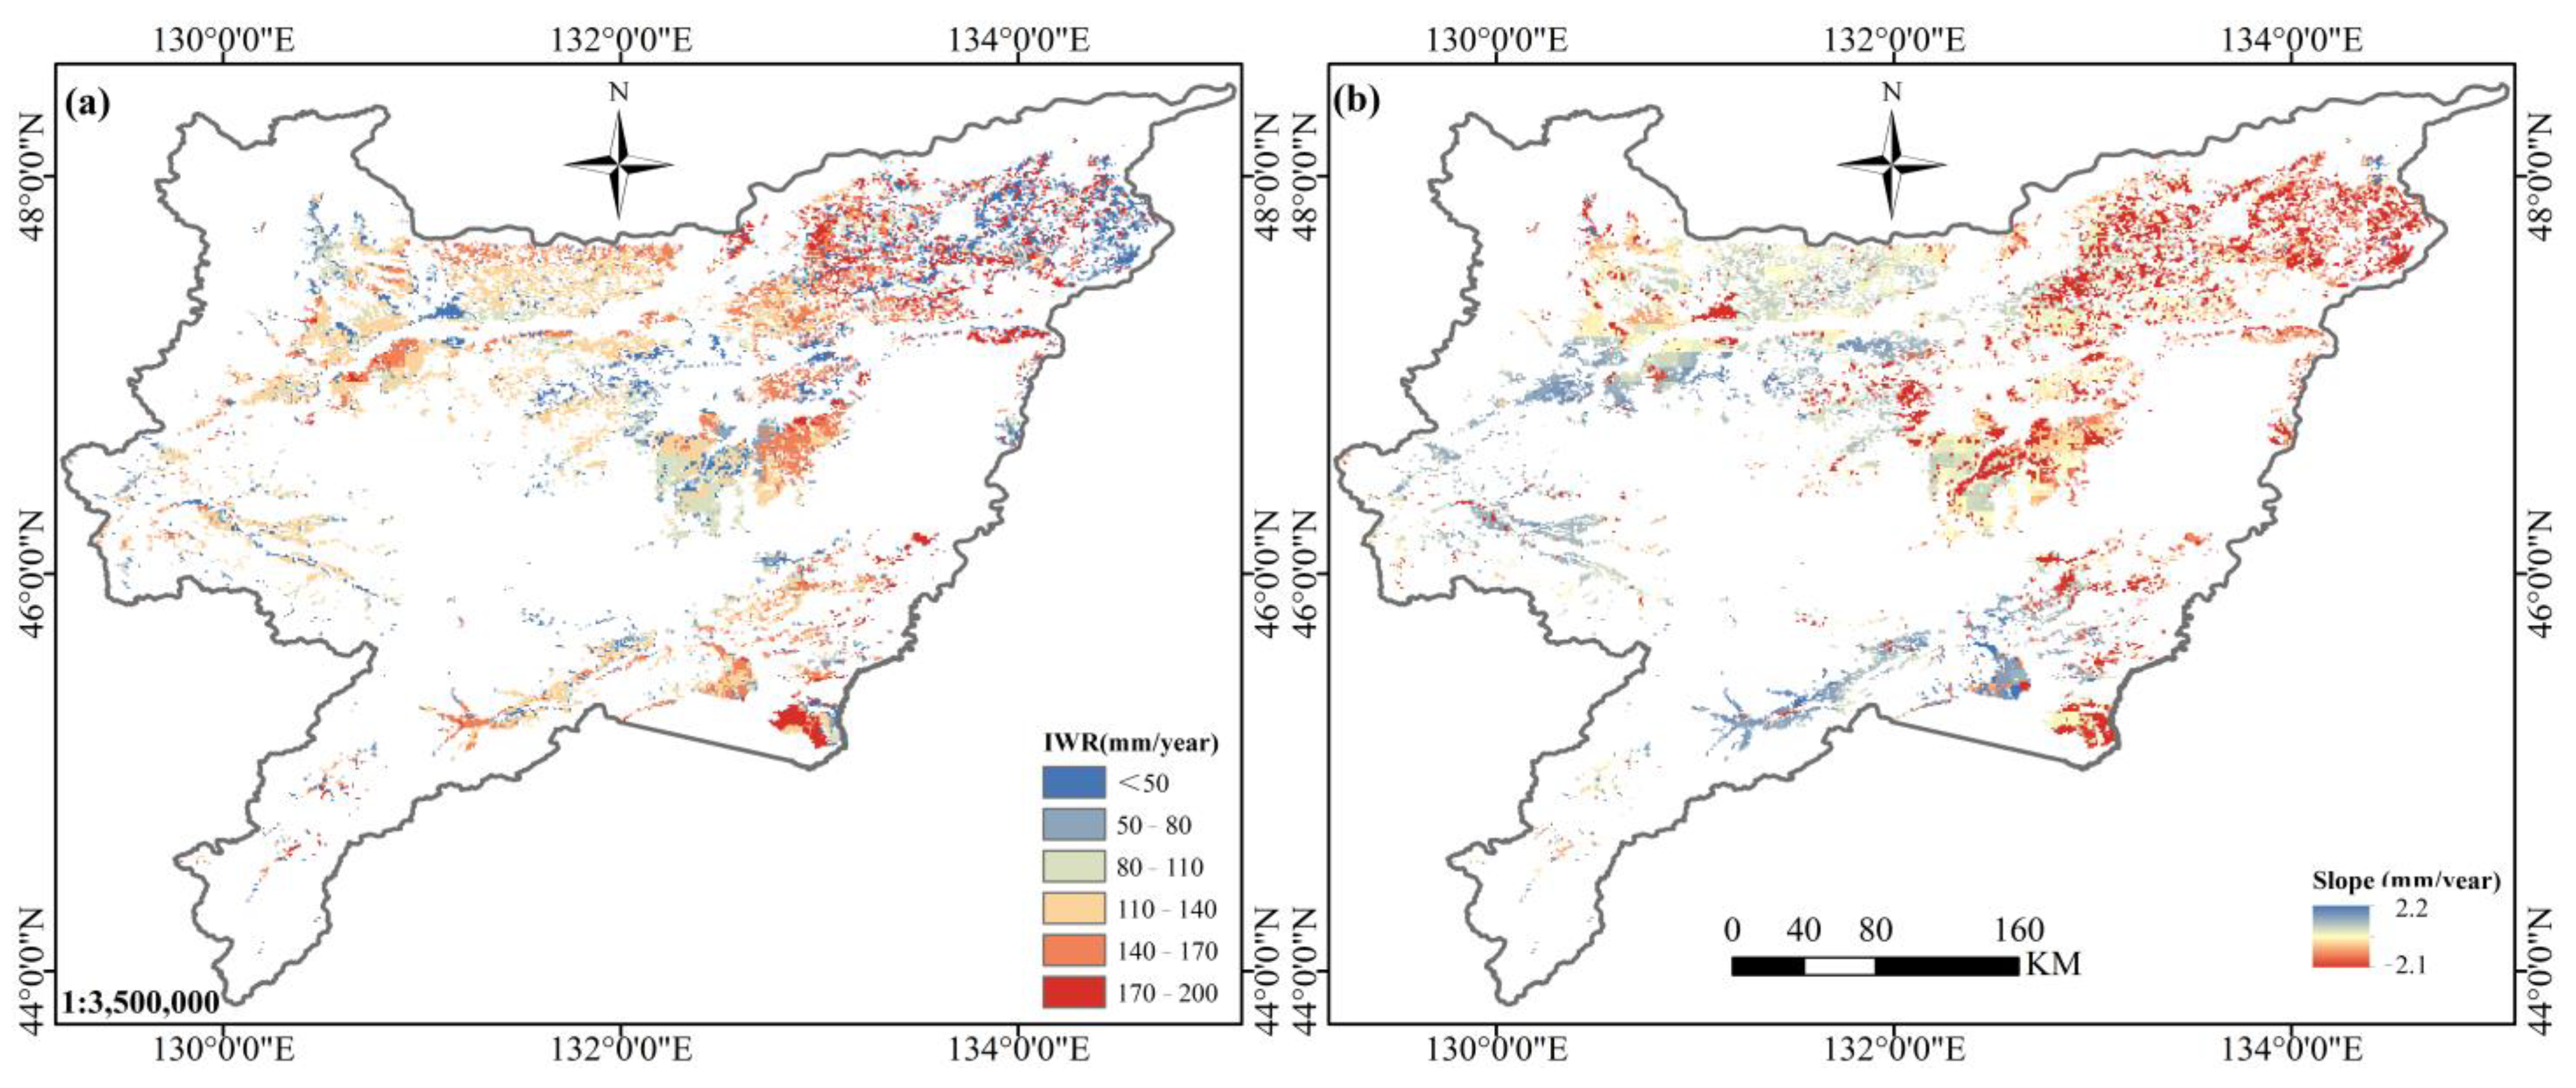
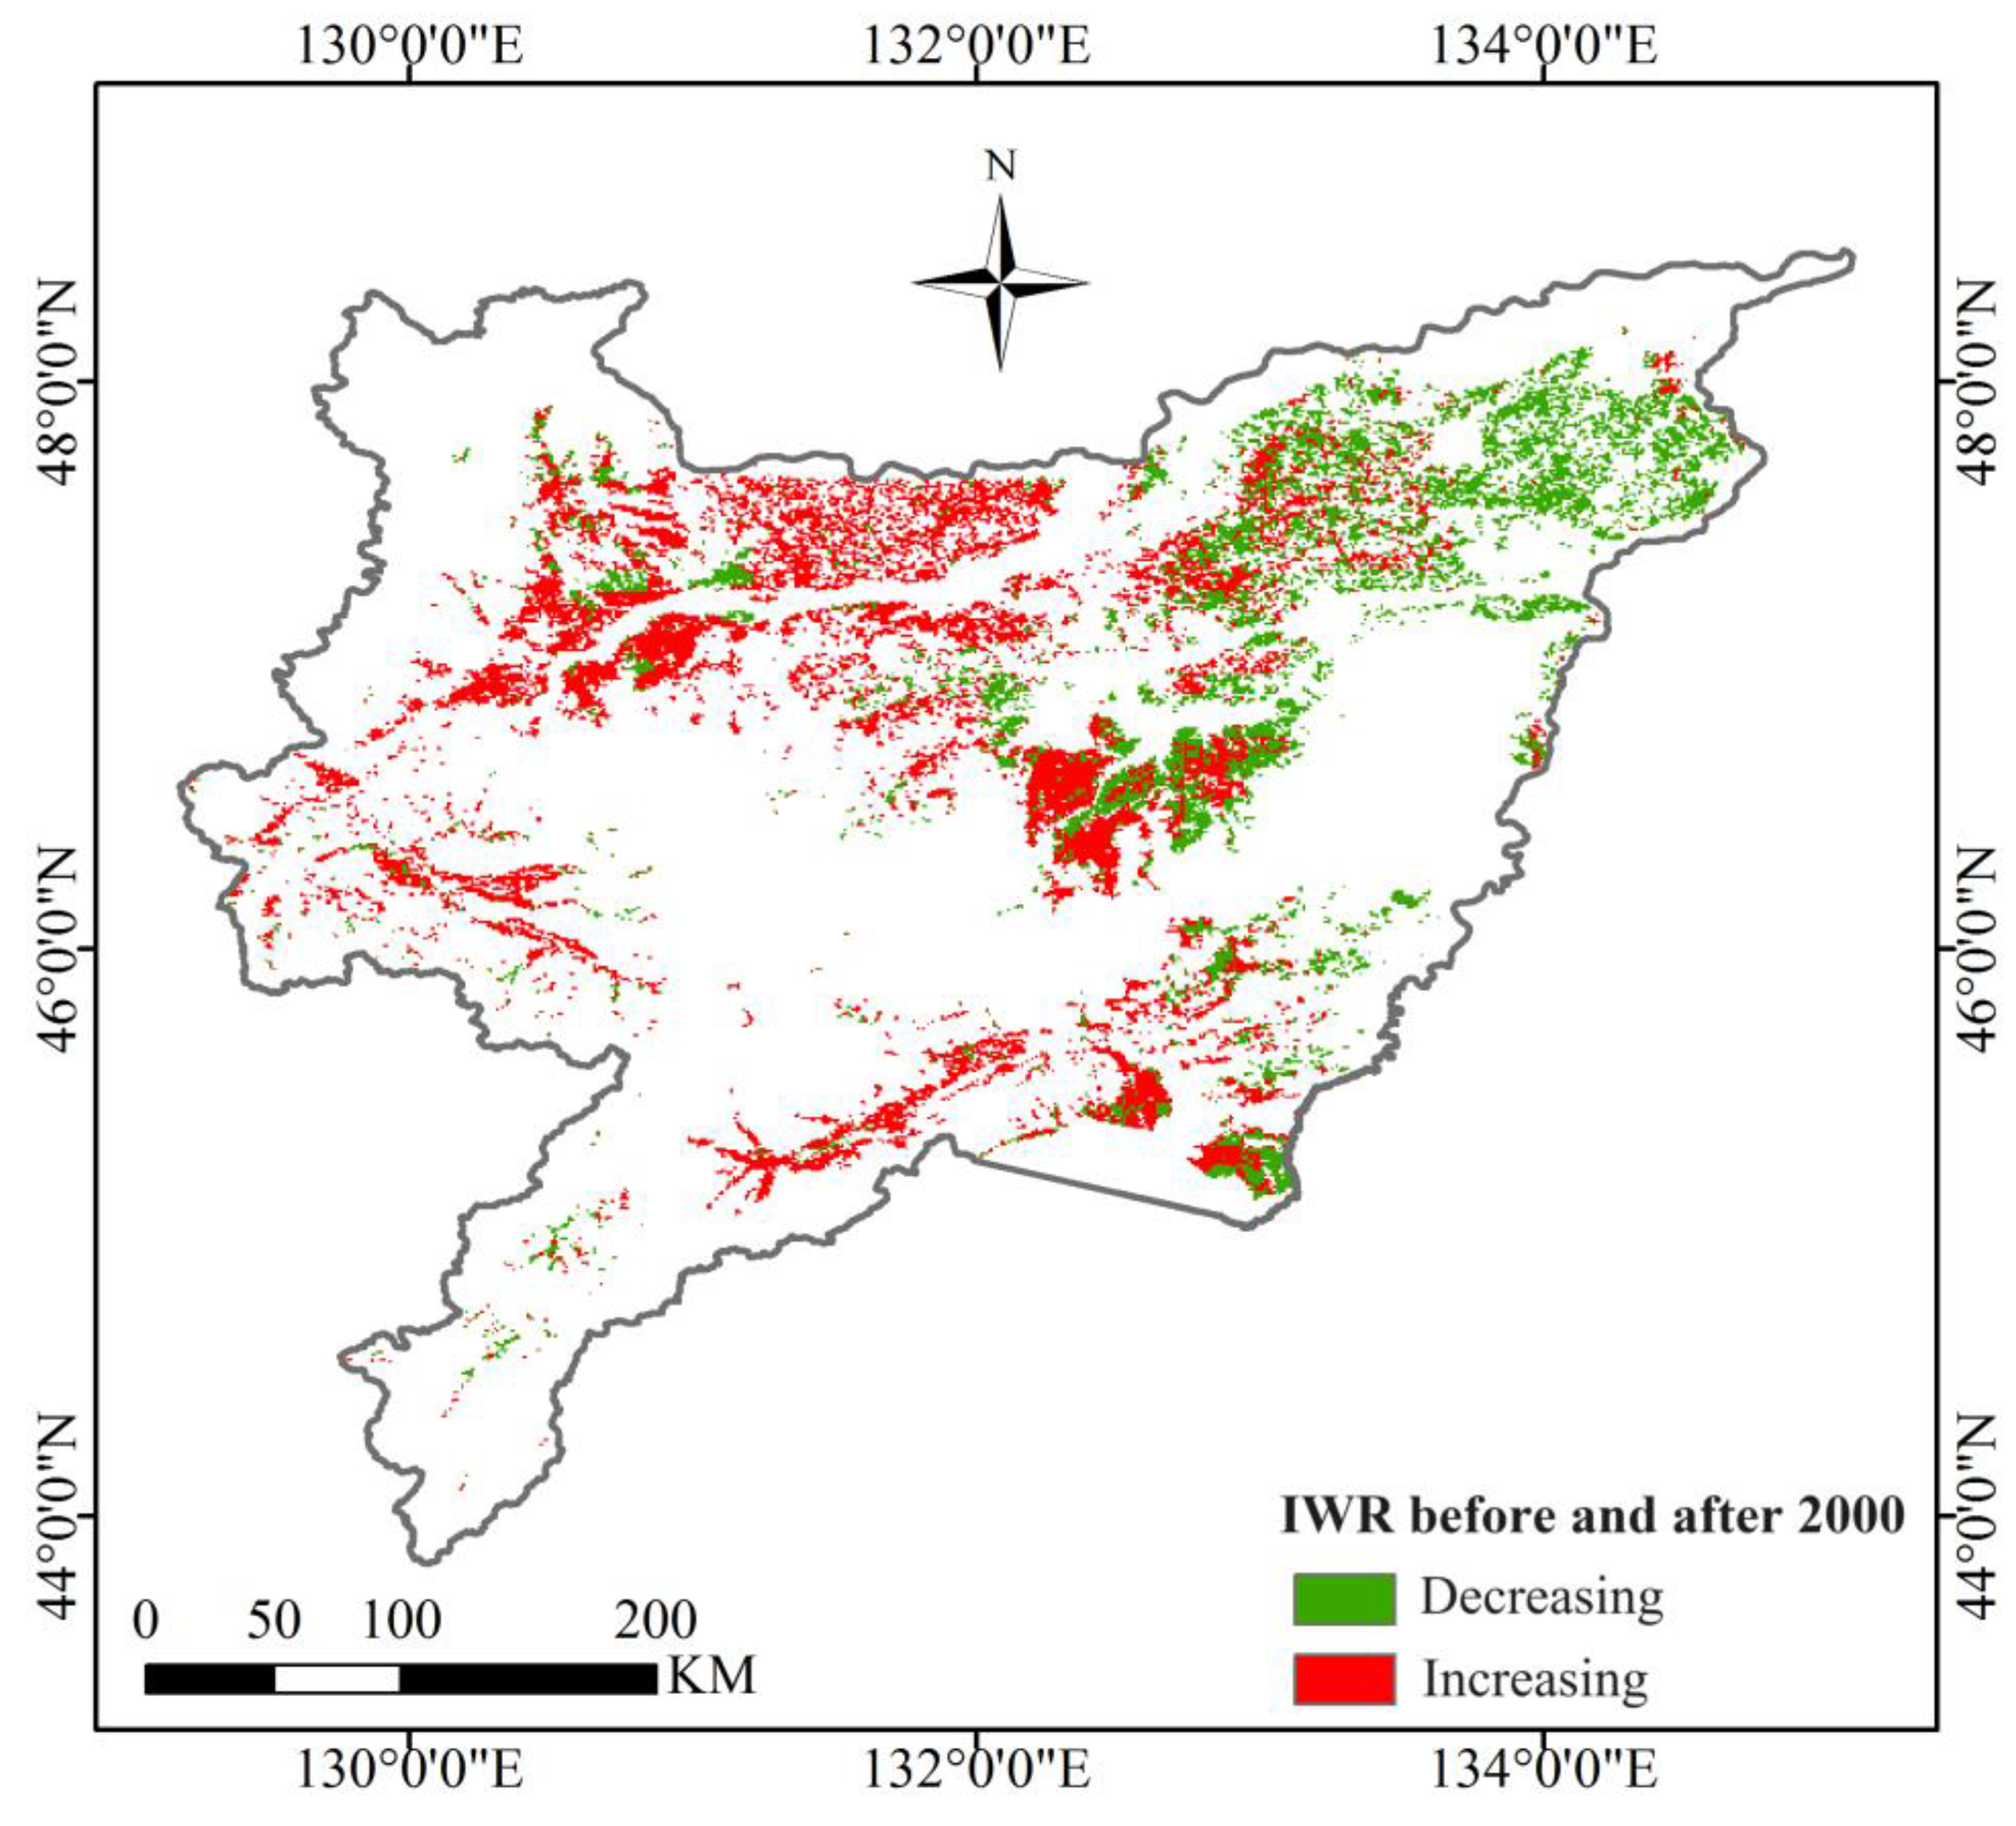
3.3. Spatial-Temporal Variation of IWR

Figure 9 illustrates the spatial distribution of IWR in the SJP, highlighting significant spatial heterogeneity. Based on Sen’s Slope and the MK test, approximately 53.0% of the area exhibited a decreasing IWR trend, with 20.8% showing a significant decrease and 32.2% a non-significant decrease. Conversely, 47.0% of the region displayed an increasing IWR trend, with 7.7% showing a non-significant increase and 39.3% showing a significant increase. The spatial patterns reveal distinct boundaries: the western SJP shows a general increase in IWR, while the eastern regions, particularly in the northeast and southeast, demonstrate a significant decrease.
Figure 10 presents the inter-annual and monthly variations of IWR. Over the years, IWR showed fluctuations with an overall increasing trend, averaging a rise of 0.21 mm/year (p > 0.05). The lowest IWR occurred in 1982, while the highest was observed in 2007, at approximately 233 mm. Cumulative anomalies and moving averages indicated a decreasing trend from the mid-1980s to the early 1990s, followed by a gradual increase and subsequent decline. This pattern suggests significant variability and a high irrigation demand.
Monthly variations displayed an inverted V-shaped pattern, with July recording the peak IWR of about 75 mm. Although Pr and Tas in June were lower than in July, IWR values were similar for both months (approximately 72 mm in June and 75 mm in July). This similarity is attributed to reduced precipitation in June compared to July.

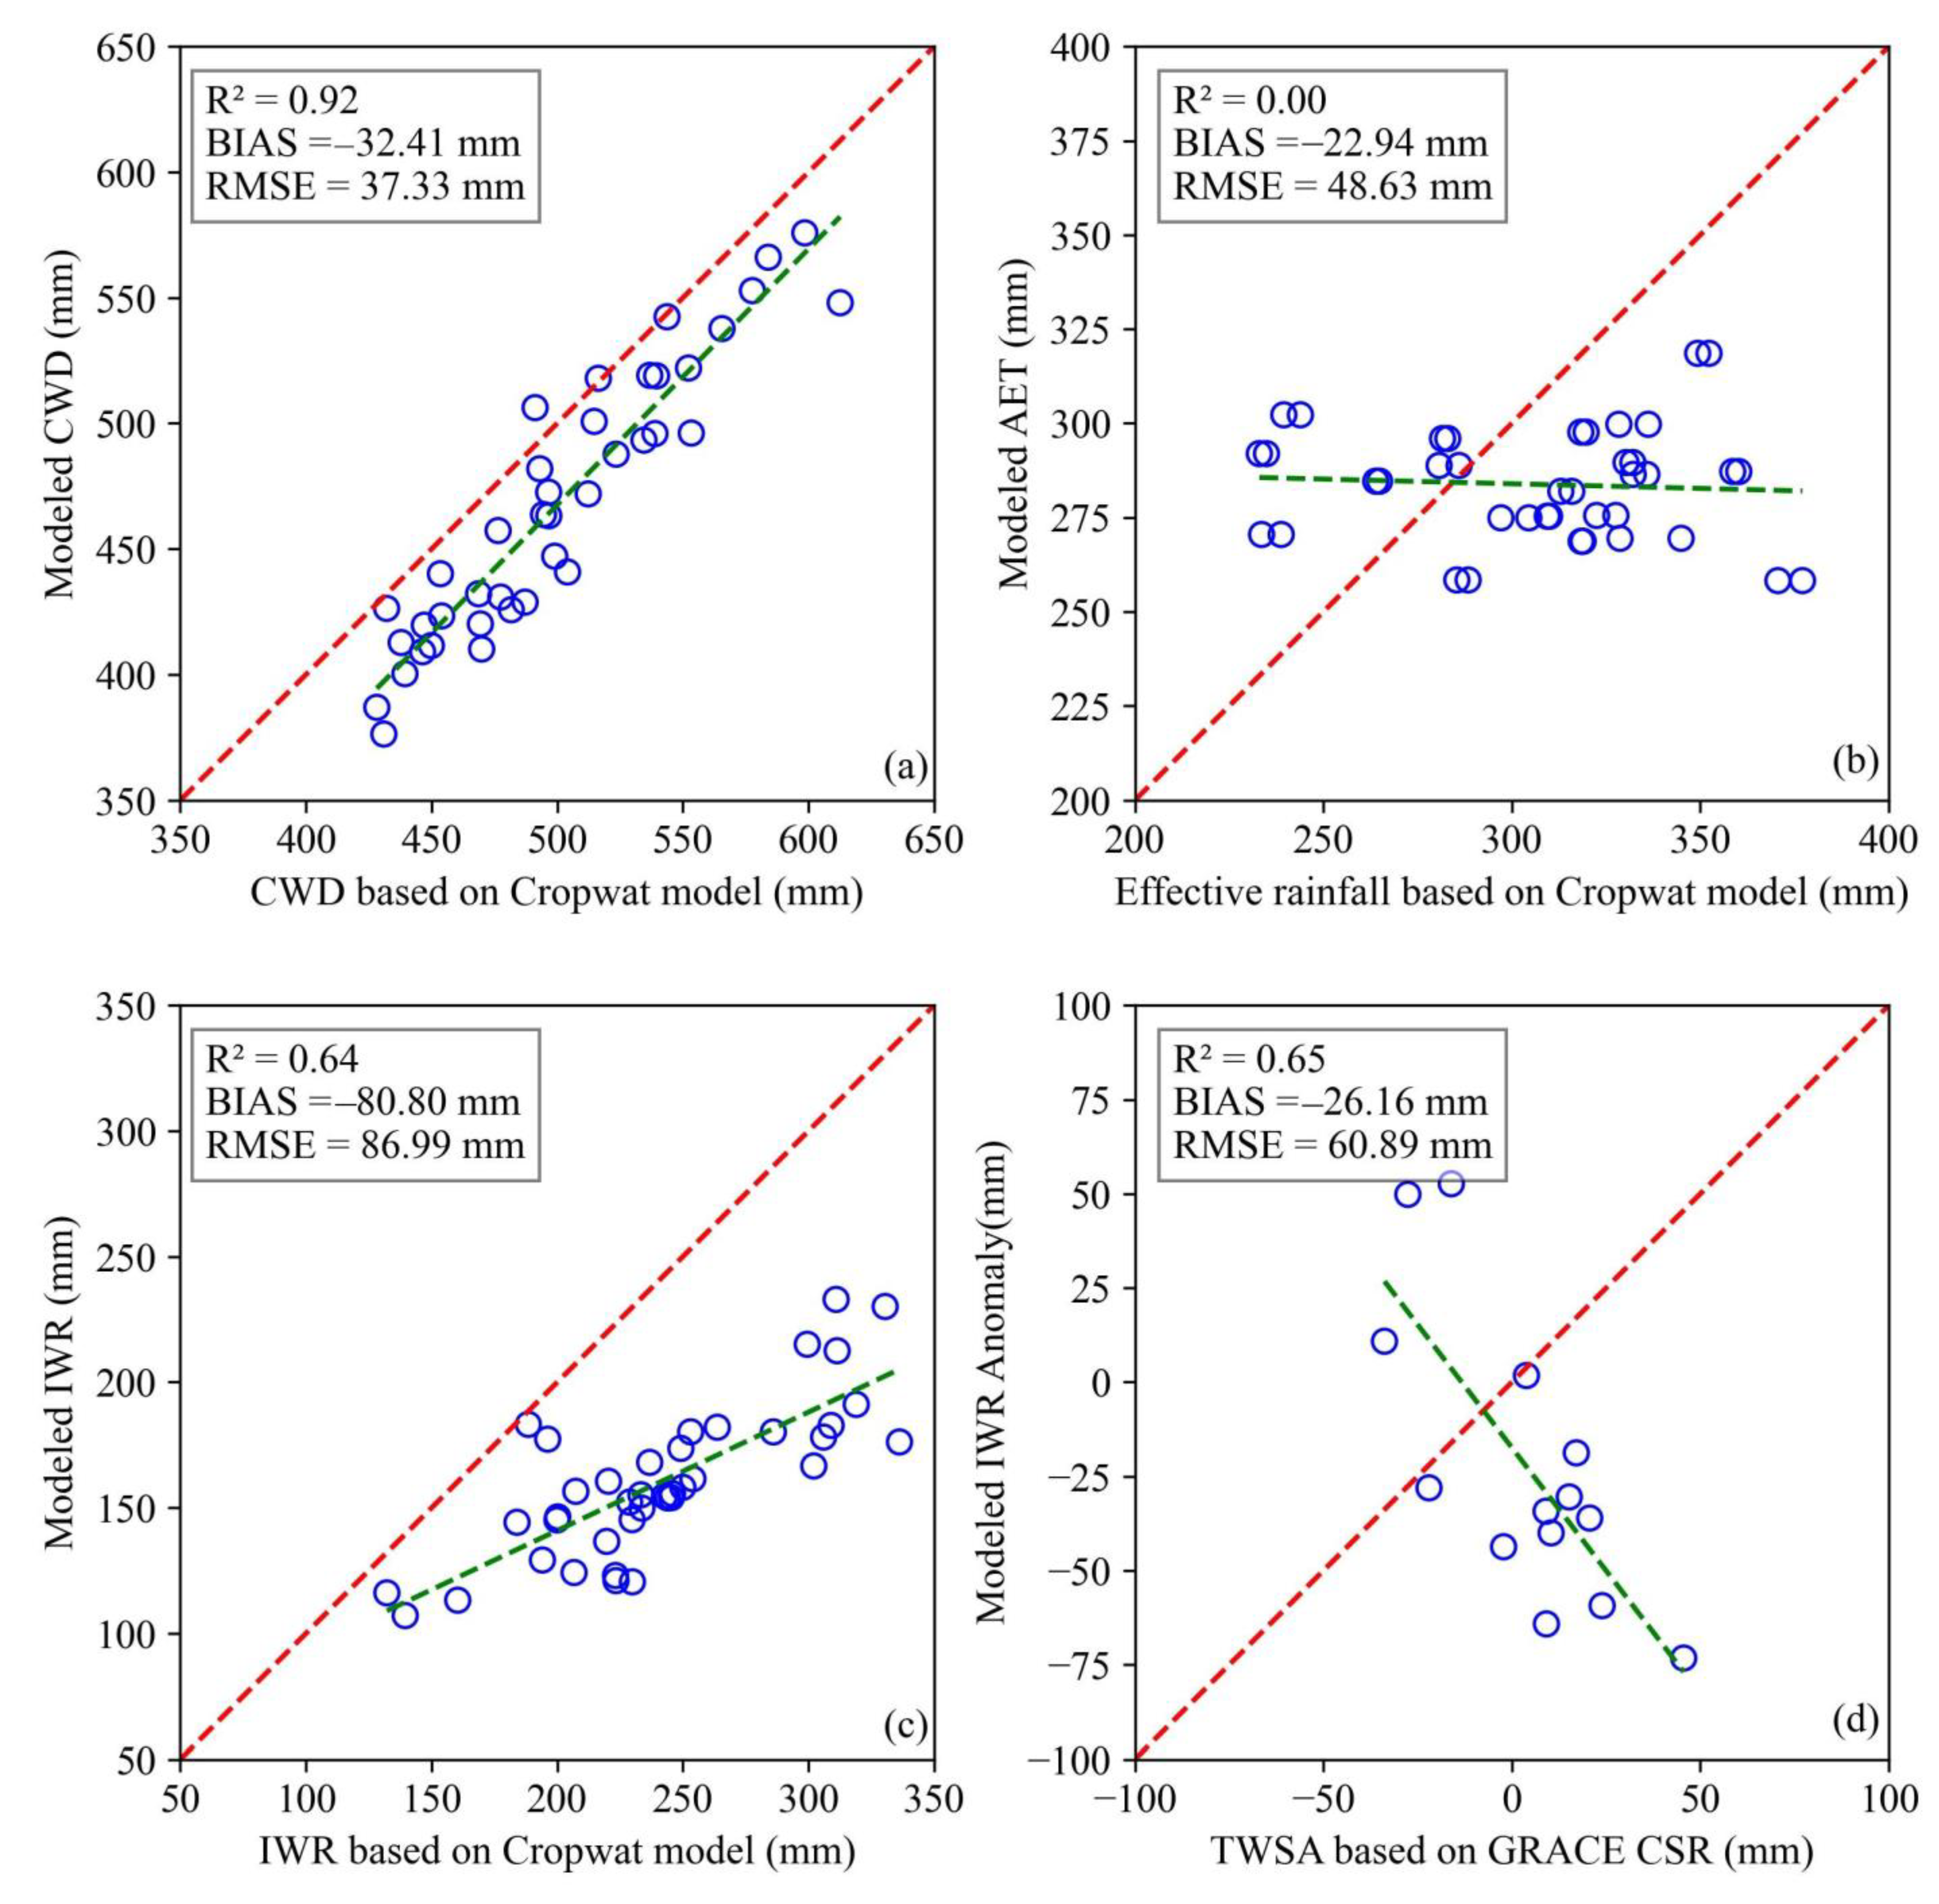
3.4. Evaluation of Effective Precipitation and Irrigation Requirement

To validate the performance of the developed method, the CWD, effective rainfall, and IWR at the regional scale based on the CropWat model were estimated and used for comparison (as shown in Figure 11a–c). Firstly, it should be emphasized that there were significant differences in data scale and spatial resolution between the two calculation methods. The calculations in this study were based on a grid scale, which were then aggregated to a regional scale, while the CropWat model indeed directly utilized regional average values as inputs, and this approach simplified the modeling process by providing a broad estimation for the entire region based on averaged parameters.
In terms of CWD, there was good consistency between the results of this study and those of the Cropwat model, with an R2 of 0.92, indicating that the annual variation characteristics of CWD were well captured. However, compared to the results of the CropWat model, there was a certain degree of underestimation in this study, with a bias of −32.4 mm and RMSE of 37.3 mm. The discrepancy in magnitude, such as the observed underestimation, can be attributed to the differences in modeling scale, particularly in how spatial variability was handled.
The correlation between the rainfed AET simulated by the ESSI-3 model and the effective precipitation estimated by the CropWat model was weak, with an R2 of 0.00. This was attributed to the inherent inconsistency in the definitions of effective rainfall by the CropWat model and this research. Mechanistically, the concept of rainfed AET, relative to effective precipitation, allowed for a more comprehensive consideration of spatial heterogeneity in meteorological factors and soil moisture stress, which aligned better with the actual conditions in the study area. However, it was noteworthy that despite the weak correlation, there was still numerical consistency between the rainfed AET and the effective precipitation estimated by the CropWat model, with a bias of −22.9 mm and RMSE of 48.6 mm. Therefore, it can be argued that, based on its verified higher rationality, rainfed AET simulated by the model can better substitute for the effective precipitation estimated by the CropWat model, providing a more realistic reflection of water utilization for crops.
The IWR estimates showed good interannual consistency with an R2 of 0.64, though CropWat significantly overestimated irrigation volumes, with a bias of −80.8 mm and an RMSE of 87.0 mm. This overestimation is attributable to the differences in modeling approaches.
To further illustrate the advantages of simulated IWR using the proposed approach, IWR was compared with GRACE observations. In the agricultural activities of the SJP, there are a large number of underground water-irrigated farmlands. Consequently, it can be inferred that in years with less precipitation and higher crop irrigation water requirements, the underground water reservoirs of the SJP would likely dwindle; whereas during years of abundant precipitation and reduced crop irrigation demands, the groundwater resources should be at a relatively higher level. Therefore, for regions like the SJP with extensive extraction of groundwater, the dynamics of terrestrial water storage are largely influenced by changes in groundwater reserves, and the fluctuations in regional terrestrial water storage observed through GRACE measurements to some extent reflect the characteristics of changes in regional groundwater reserves. Hence, this study boldly attempted to compare the estimated IWR with the TWSA observed by GRACE, aiming to unveil potential correlations between the two. A significant correlation, with an R2 of 0.65, was discovered, emphasizing the validity and sophistication of the estimation outcomes presented in this study.
Overall, in this study, the detailed grid-scale calculations allow for a more localized and potentially accurate estimation of CWD, effective rainfall, and IWR, capturing nuances and spatial variations that cannot be fully accounted for in the regional averages used by the CropWat model.

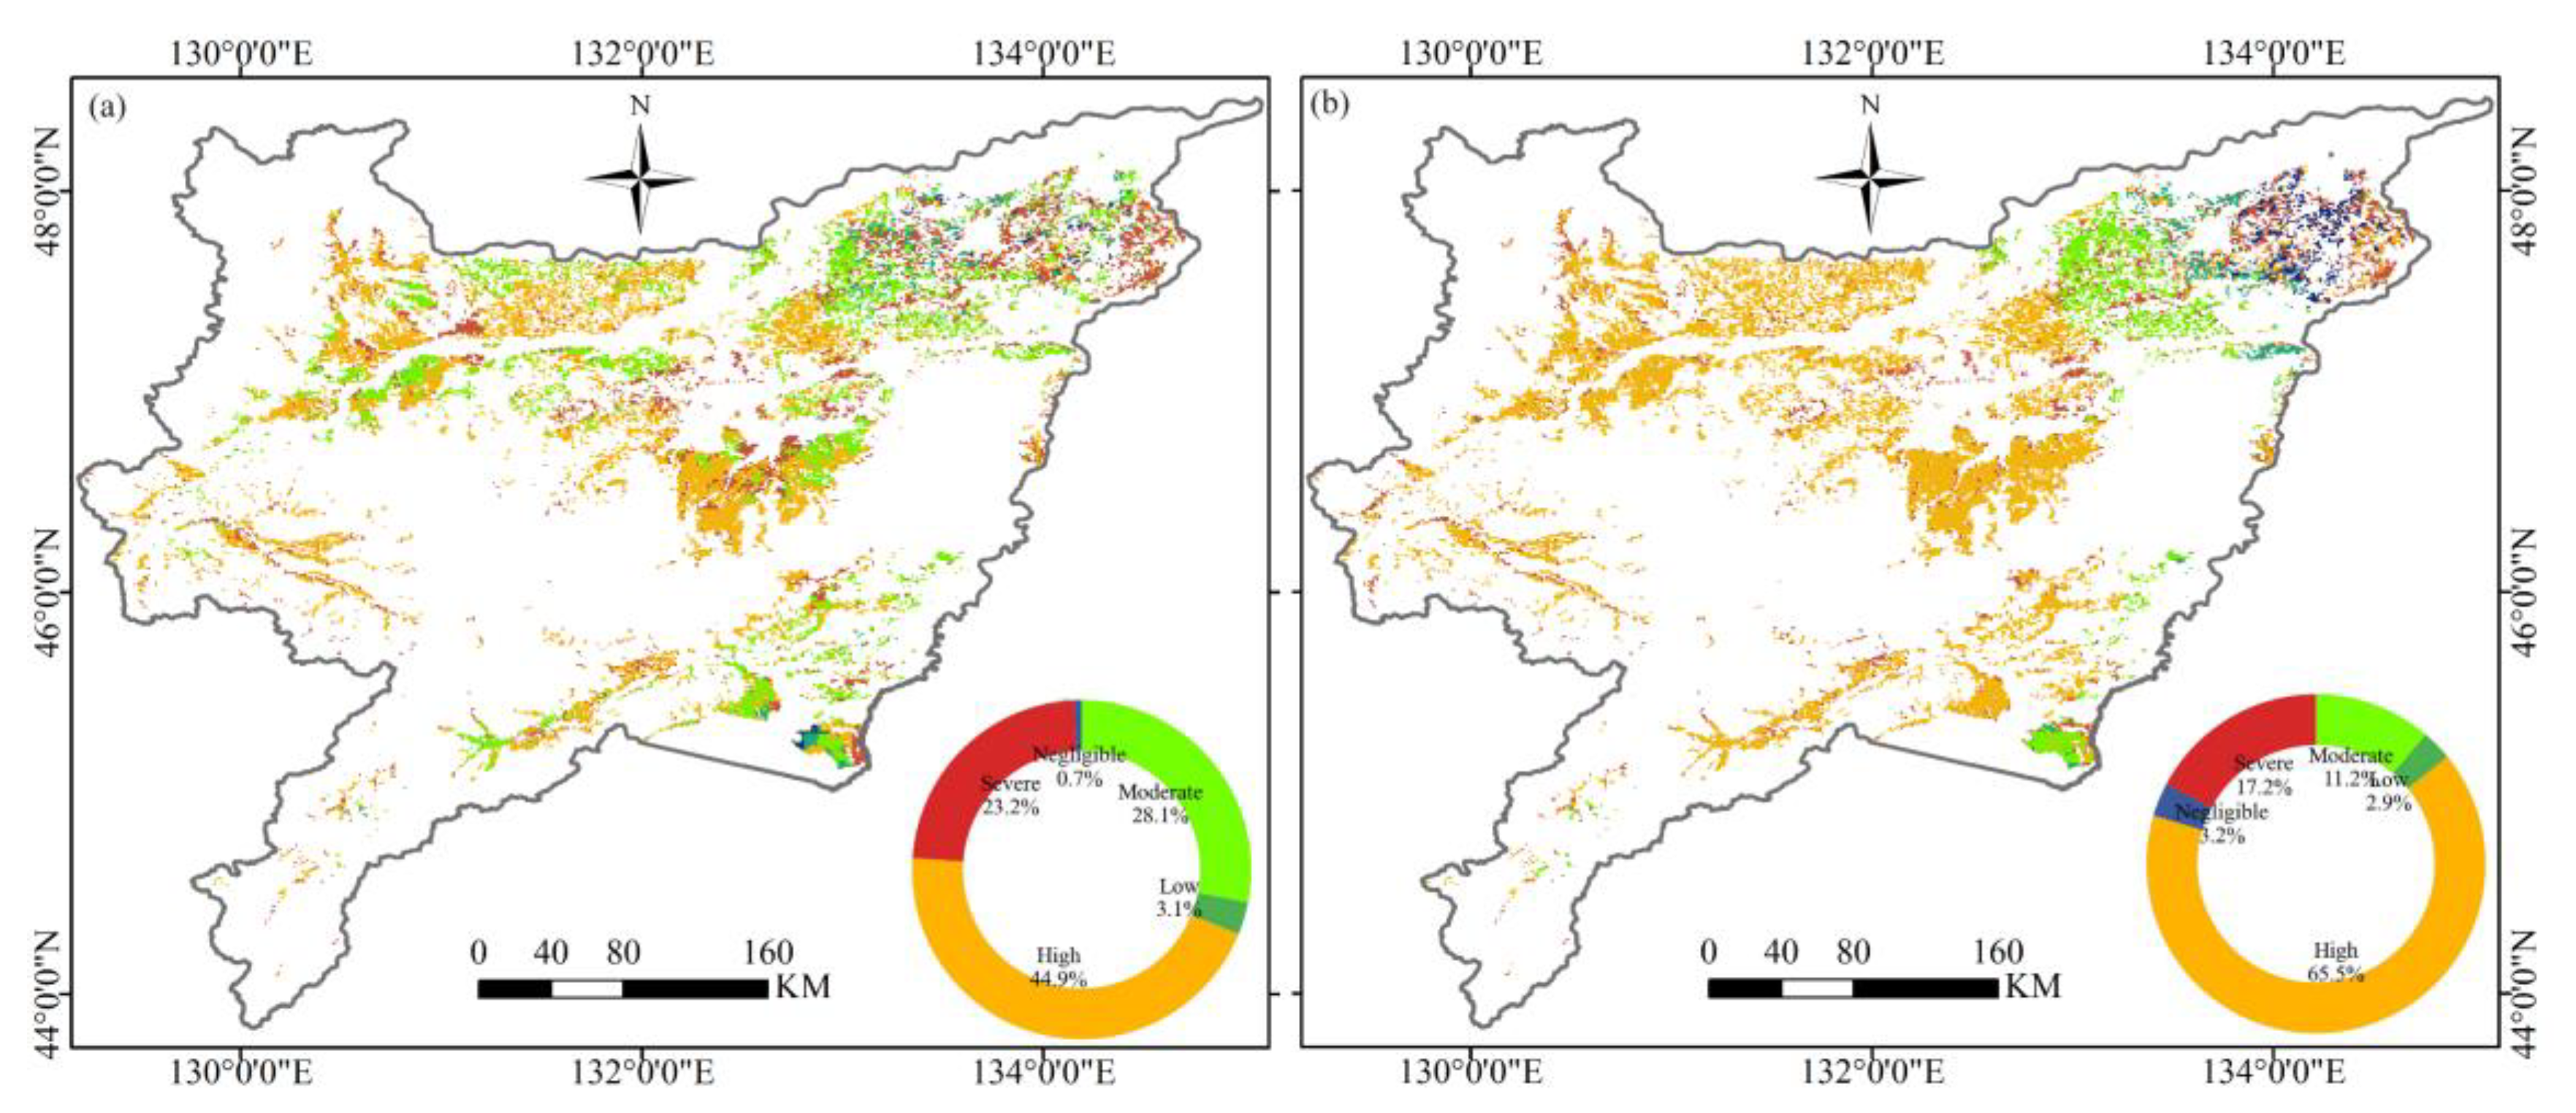
3.5. Water Demand and Supply Risks Under Climate Change and Vegetation Greening

Previous studies revealed that the SJP and the encompassing Amur River Basin experienced significant climatic changes and vegetation greening, with the year 2000 marking a critical climatic and vegetation transition point [23,36]. During the periods before and after the year 2000, the regional climate transitioned from a warm and relatively arid climate to a notably warmer and more humid climate regime [23]. Concurrently, there was a rapid escalation observed after the year 2000 across three vegetation indices [36], encompassing the LAI, Fraction of Vegetation Cover (FVC), and Gross Primary Productivity (GPP). Therefore, to explore the impacts of regional climate transition and vegetation greening on the supply–demand relationship of agricultural water use, this study analyzed the differences in IWR between the periods before and after the year 2000 (as shown in Figure 12). Overall, 58.0% of the regional areas experienced an increase in IWR after 2000, with an average increase of approximately 24 mm. Conversely, 42.0% of the regional areas saw a decrease in IWR. Spatially, areas of increased IWR in the SJP were primarily concentrated in the middle and western regions after 2000, while decreases were observed in the eastern part of the plain.
Figure 13 depicts the temporal and spatial dynamics of CWD, rainfed AET, and IWR in the SJP before and after 2000. Prior to 2000, the spatial distribution of water resource pressure between IWR and CWD was dispersed, lacking distinct boundaries. High water resource scarcity (IWSI) was the most prevalent, covering approximately 45% of the region, followed by moderate and severe categories at around 28% and 23%, respectively. After 2000, areas experiencing high crop water deficits increased to about 66% of the total region, a 21% rise from the earlier period. Conversely, regions with moderate and severe deficits decreased to approximately 11% and 17%, reflecting reductions of 17% and 6%, respectively. Areas with low and negligible deficits grew by around 2%. Post-2000, the spatial distribution of irrigation water scarcity showed clearer boundaries, with the western regions predominantly experiencing severe and high deficits. Meanwhile, the eastern regions, especially in the northeast, displayed a more complex pattern with multiple levels of water deficit coexisting.

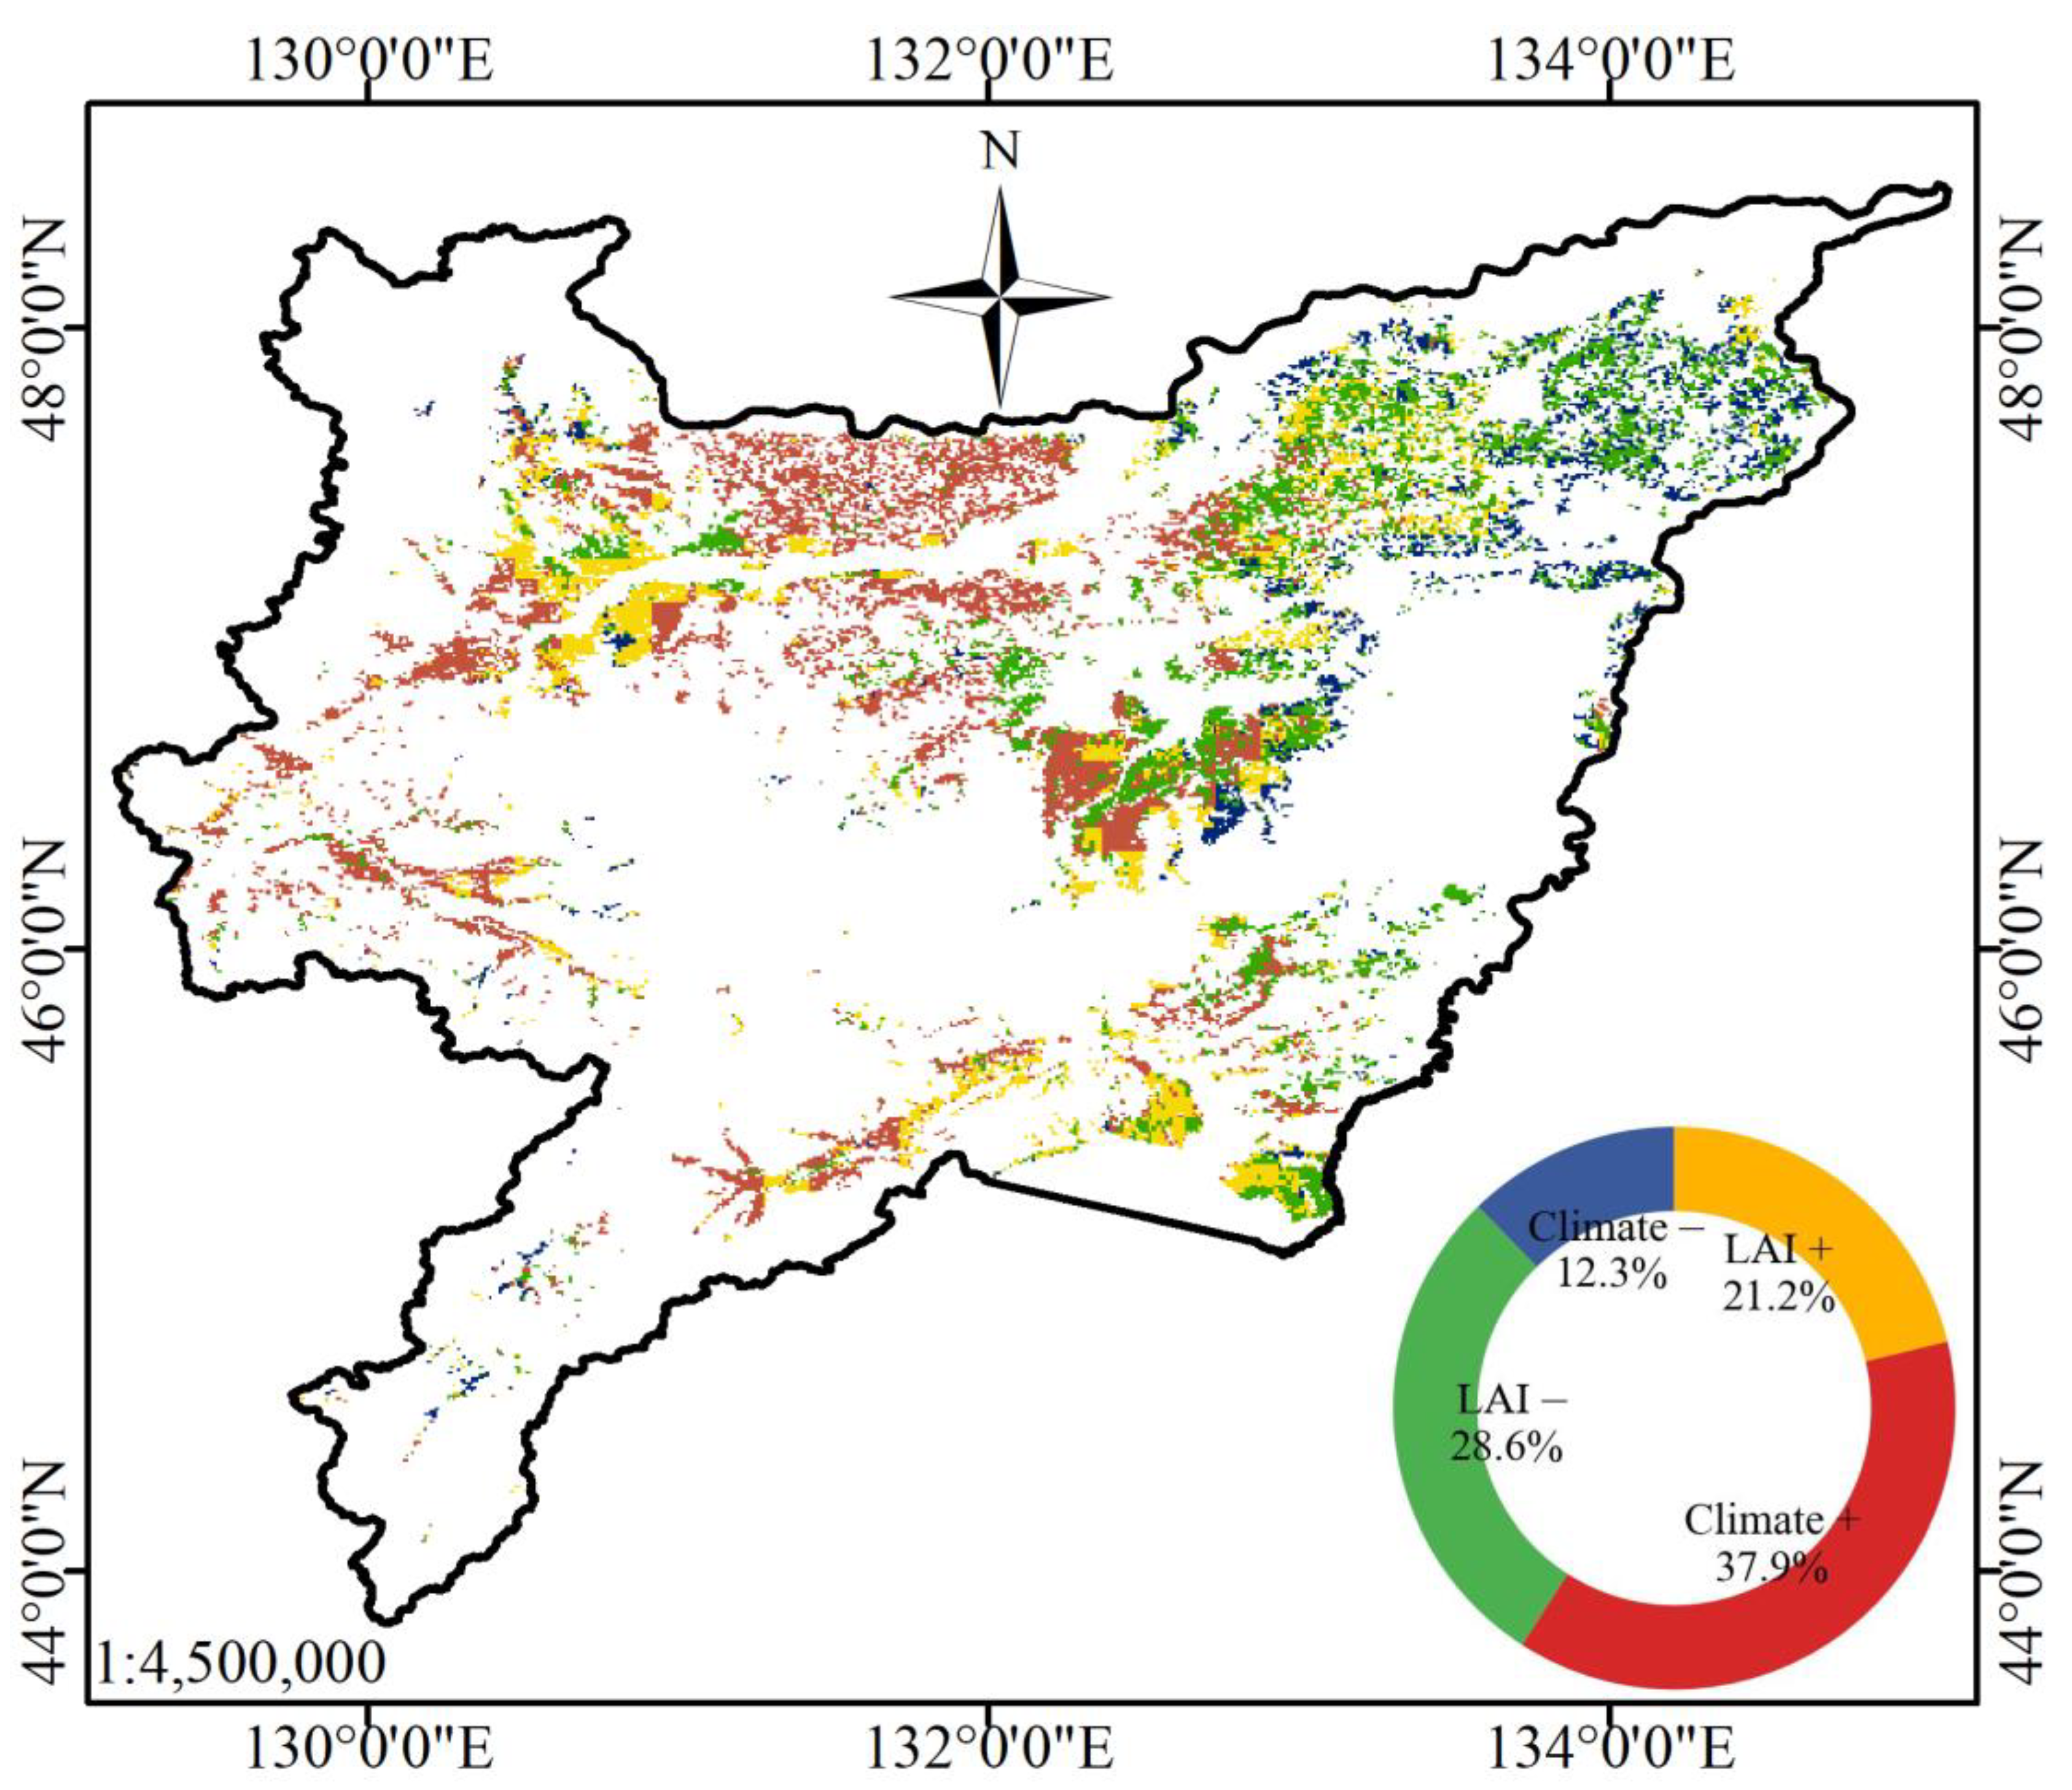
3.6. Dominant Factors Influencing IWR Variation

Figure 14 illustrates the correlation between CWD, rainfed AET, and IWR with various climatic and vegetative factors. Key climatic determinants include solar radiation factors (Rlds and Rsds) and variables related to water vapor dynamics (Pr and RH). RH, closely linked to precipitation, exhibited a significant negative correlation with both IWR and CWD, with a high correlation coefficient of −0.77 for IWR and −0.8 for CWD. Rlds showed a significant upward trend but a negative correlation with IWR and CWD, while Rsds had a non-significant upward trend but a positive correlation with these variables. Rainfed AET was significantly positively correlated only with LAI, with other climatic factors showing no significant correlation. Despite a notable increase in Tas over the growing season from 1982 to 2018, its correlations with CWD, rainfed AET, and IWR remained insignificant.
In summary, Pr and RH are crucial in influencing CWD, rainfed AET, and IWR, highlighting their importance in managing crop water needs. Radiation factors also affect these variables, though with varying impacts. LAI positively influences rainfed AET, underscoring the role of vegetation management in optimizing water resource use.
To elucidate the spatial determinants of IWR variations, this study analyzed the impacts of climate change and vegetation change on IWR at the pixel scale for periods around the year 2000 (as shown in Figure 15). A factor was deemed dominant if it contributed more than 50% to the IWR variation of a pixel. The results showed that climate change was the primary influence on IWR in 50.2% of the area, positively affecting 37.9% and negatively impacting 12.3% of these regions. Conversely, changes in LAI were the main driver in 49.8% of the area, with LAI increases leading to higher IWR in 21.2% of regions and decreases in 28.6%.
Additionally, it was noteworthy that in the western regions where both vegetation greening and climate change predominantly exerted a positive impact on IWR variations, more grids were dominated by climate change. This indicated that, compared to vegetation greening, climate change played a more significant role in driving the increase in IWR in the western regions. Conversely, in the eastern regions where dynamic vegetation changes and climate change mainly exerted a negative impact on IWR, more grids were dominated by dynamic vegetation changes. This suggested that, compared to climate change, vegetation greening had a more pronounced effect on reducing IWR in the eastern regions.

4. Discussion

4.1. Influence of Meteorological Factors on IWR

Crop cultivation is a complex system influenced by various anthropogenic and natural factors. Previous studies reported that over the past three decades (1980–2010), the northern boundary of crop planting in Northeast China had expanded from approximately 48°N to about 52°N [39]. Dong et al. [40] quantified the latitude changes in paddy rice cultivation in Northeast Asia through trajectory analysis and phenology-based mapping algorithm using MODIS time-series images. Their analysis indicated that from 2000 to 2014, the centroid of rice paddies in Northeast Asia moved northward from 41.2°N to 43.7°N (approximately 310 km), while a notable expansion in rice cultivation area was also detected in higher latitude areas (44.0°N to 47.5°N).
Climate change is considered the primary factor influencing the northward movement and expansion of crop planting boundaries. For example, climate warming has significantly affected the rapid increases in crop farming in Northeast China, resulting in a pronounced northward shift in China’s national production centroid, especially for paddy rice. This shift is largely attributed to the northward movement of the cumulative temperature zone [40]. In addition to climate change, increases in crop production may be influenced by various anthropogenic factors, including the advancements in production techniques, adoption of new varieties, development of irrigation infrastructure, population dynamics, fluctuations in rice prices, land-use policies, and global trade patterns [41]. However, there still exists a significant gap in our knowledge, and there is a lack of quantitative analysis regarding how crop water demand and irrigation water requirements may shift in boundaries and geographic ranges due to climate change in SJP.
The findings of this study indicate that since 2000, widely regarded as a turning point for climate change in this region according to previous studies, IWR across the western and middle regions has exhibited an increasing trend throughout the entire growing season (April–September) in the later period. Additionally, there is a distinct boundary where regions experiencing increases and decreases in IWR converge, approximately ranging from 132.5°W to 133°W. The findings from the spatial analysis of IWSI further corroborate this conclusion. In comparison to the period preceding 2000, instances of crop water deficits under rainfed conditions became notably concentrated west of the boundary spanning 132.5°W to 133°W longitude after 2000, with severity levels predominantly classified as severe or high. Consequently, it can be inferred that the SJP has experienced a northward and eastward expansion of severe crop water deficits following a climatic transition centered around the year 2000.
Climate change has exerted a significant influence on the geographic distribution and intensity of crop water deficits under rainfed conditions. Our analysis indicated that spatial patterns of temperature change had a clear northeastward influence on the expansion of crop water deficits. While the trend of temperature increases or decreases in the SJP is bounded by approximately 46.5°N latitude, the zone experiencing relatively higher temperatures over multiple years (Figure 16a) is predominantly concentrated in the central and western regions of the area. Furthermore, changes in spatial patterns of the temperature contour around 2000 exhibit a notable southwest–northeastward expansion (Figure 16b), particularly evident in the range of the 3 °C temperature contour. This spatial expansion aligns closely with the enlargement of regional water scarcity boundaries, indicating a high degree of consistency between temperature variations and shifts in regional water deficit dynamics.
Figure 16d illustrates a westward expansion in spatial patterns of precipitation contours. However, the spatial distribution of precipitation impacts exhibits variability. While increased precipitation generally augments water availability for crops, crop water requirements have also risen over the same period. This was expected, as the zone experiencing consistently lower precipitation levels over multiple years (Figure 16c) in the SJP is also predominantly concentrated in its central and western regions. Thus, it can be hypothesized that the total amount of precipitation is likely more critical in determining crop water deficits under rainfed conditions than changes in precipitation trends per se.
Our findings suggest that the sustained increase in precipitation can mitigate the imbalance between the supply and demand of agricultural water resources in the SJP region, yet it remains insufficient to completely address the issue of agricultural water scarcity. As illustrated in Figure 13 and Figure 16, the boundaries of crop water security risk during both analyzed periods closely align with the 600–700 mm precipitation isohyet. This alignment indicates a notable reduction in crop irrigation demand in regions where baseline precipitation from May to September exceeds 600–700 mm. Nevertheless, in the context of climate change, the risk area boundary is projected to shift eastward from the 600 mm precipitation isohyet to the 700 mm precipitation isohyet. In other words, regions within this study area receiving less than 600–700 mm of precipitation are at elevated risk of encountering crop water deficits.

4.2. Influence of Vegetation Greening on IWR

The spatiotemporal patterns of precipitation and evaporation are crucial determinants of agricultural water supply and demand security [42]. Previous research in this field predominantly focused on the effects of climate change on IWR [42,43], often overlooking the response of IWR to dynamic vegetation changes. This investigation into the spatiotemporal dynamics of regional LAI of this area uncovered a significant greening trend (p < 0.05) post-2000. This increase in vegetation greening was poised to markedly influence crop evapotranspiration processes, thereby exerting a significant impact on IWR. Consequently, incorporating the effects of vegetation greening into IWR offers a more holistic perspective on the evolving spatiotemporal characteristics and trends in crop water security risks under the dual influences of climate change and vegetation greening.
The results of this study demonstrated that, relative to the baseline period, IWR had exhibited a marked increasing trend since 2000, with pronounced spatial heterogeneity observed at the grid level. The increase in IWR was primarily concentrated in the central and western regions, suggesting a shift in water security risks: while the risks associated with crop water security were expected to diminish in the eastern regions, they were likely to escalate significantly in the central and western regions.
Although the increase in IWR in the central and western regions was predominantly controlled by climate change (accounting for approximately 37.9%), the contribution of vegetation greening in these areas was also significant (accounting for around 21.2%). This suggested that the intensification of vegetation coverage had further amplified the rising trend in crop water demand, particularly in the context of increased evaporation driven by climate warming. These findings pose new challenges for regional water resource management, particularly in the central and western regions, where maintaining agricultural water security under the dual pressures of climate change and vegetation dynamics will become a critical issue in the near future.
In contrast, within the eastern regions, the influence of vegetation dynamics on IWR is more pronounced (approximately 28.6%), while the impact of climate change is comparatively modest (around 12.3%). This observation starkly contrasts with prior research, which has predominantly focused on the effects of climate change, highlighting the necessity of accounting for changes in vegetation coverage when evaluating IWR. This also implies that in future agricultural planning, the eastern regions may need to prioritize vegetation management to counteract the increasing trend in IWR, thereby ensuring the stability and sustainability of agricultural production.
In summary, this study provides a novel perspective on the integrated impacts of climate change and vegetation greening on crop water security. Future research should continue to explore the interactions between vegetation and climate change, with the aim of reducing uncertainties in predictive models and offering more scientifically sound guidance for the development of irrigated agriculture in northeastern regions. Furthermore, policymakers and agricultural managers should place greater emphasis on monitoring and managing vegetation dynamics when developing irrigation strategies, to promote the sustainable utilization of water resources within the region.
Moreover, the approach of estimating CWD by applying a crop coefficient (Kc) to the reference evapotranspiration has been widely acknowledged as a robust and reliable method [44]. Nevertheless, this study employed a fixed Kc recommended by the FAO in the estimation of CWD, without accounting for the dynamic influence of LAI on Kc. This methodological limitation could compromise the accuracy of estimating IWR, thereby impacting both the interpretation of research outcomes and their applicability in practical scenarios. Specifically, LAI, as a critical indicator of vegetation coverage and growth conditions, exerts a direct effect on the evapotranspiration process. Typically, an increase in LAI correlates with heightened evapotranspiration rates, thereby elevating the crop’s water requirements [45]. Consequently, neglecting variations in LAI may lead to either the underestimation or overestimation of crop irrigation needs, especially in regions where significant changes in vegetation cover occur. Such discrepancies could introduce spatial biases in IWR estimates, subsequently affecting the assessment of regional water resource security.
However, it is important to note that, to date, no large-scale empirical models have been developed to adjust Kc based on LAI variations, nor are there well-established and reliable remote sensing products for Kc estimation at the regional level. Existing studies are often grounded in terrestrial measurements of vegetation indices or rely on high-resolution optical satellite data, SAR, or UAV imagery to investigate LAI-adjusted Kc within limited spatial extents [46,47,48]. Additionally, research utilizing eddy covariance systems to examine the temporal variability of Kc and their interannual stability suggests that, even amidst long-term environmental changes, Kc can maintain a relatively stable state over extended periods [45]. Furthermore, the crop coefficient modeling approach recommended by the FAO has demonstrated substantial reliability.
In summary, considering the inherent stability of Kc and the demonstrated reliability of FAO-recommended Kc values, the estimation of CWD and IWR without explicitly incorporating LAI variability is scientifically well-founded. While incorporating dynamic Kc values derived from LAI could enhance precision under certain circumstances, the lack of operational large-scale models or products currently limits the feasibility of such an approach. Future research integrating advanced remote sensing and hydrological modeling may address this gap and further refine CWD and IWR estimates.

4.3. Policy Recommendations for Optimizing Crop Layout in the SJP

The irrigation rate of farmland in Northeast China remains at a relatively low level, approximately 30%, which is significantly lower than the national average of 55% [42]. The SJP has historically adhered to a single-cropping system due to prolonged cold and dry winters. This study reveals that, within the context of ongoing climate change, the IWR in the central and western regions of the SJP is expected to increase further, thereby driving up irrigation demand and exacerbating risks to agricultural water security. Consequently, strategically formulating and optimizing the agricultural production layout in this region has emerged as a critical measure to ensure consistent and reliable crop yields and productivity. Effective and rational development and utilization of water resources, coupled with the implementation of spatial equilibrium strategies, are essential for enhancing water resource efficiency and benefits. Therefore, when optimizing the planning and agricultural layout of crop planting areas in the SJP, several considerations should be taken into account:
(1)
Scientific zoning of crop types: In the western regions of the SJP where there is a poor mismatch between agricultural water demand and rainfed water resources, it is advisable to allocate more agricultural areas for C4 crops such as maize and sorghum. These C4 crops are more adapted to water-deficient conditions and can thrive under high temperatures and strong sunlight. Normally, C4 crops have the ability to partially close their stomata during periods of drought, which helps to reduce transpiration and minimize water loss. As a result, the reduction in the photosynthetic rate is comparatively smaller, leading to improved water use efficiency in C4 crops. These traits provide C4 crops with a distinct advantage over C3 crops in the SJP region. In contrast, in areas with relatively ample water resources like the Jiansanjiang Agricultural Farming Zone in the northeast region, it is more suitable to allocate more agricultural areas for C3 crops such as rice, spring wheat, and soybeans. These C3 crops typically require higher water inputs due to their origins in tropical regions and their reliance on a different photosynthetic pathway.
(2)
In regions with relatively abundant water resources, particularly in the eastern areas, initiatives should be undertaken to endorse policies incentivizing water conservation among farmers. This includes measures to reduce irrigation intensity, promote deficit irrigation techniques, and optimize the utilization of rainfed resources. Conversely, in the central and western regions where water availability is comparatively constrained, it is advisable to implement comprehensive irrigation and drainage initiatives. These projects should leverage the beneficial water retention characteristics inherent to black soil. Adjustments to irrigation allocations should be meticulously tailored to meet the specific water requirements of crops in these regions, augmenting irrigation planning and integrating cohesive cultivation practices to effectively address crop water needs throughout their growth stages.
In summary, these measures aim to systematically promote the implementation of judicious water management schemes, thereby enhancing agricultural productivity and ensuring the sustainable utilization of water resources across the SJP.

4.4. Limitations and Future Prospects

Investigating the crop water supply–demand relationship should encompass the following aspects: (1) the spatiotemporal dynamics of crop water supply and demand under historical precipitation conditions, (2) the relationship between groundwater consumption and crop water supply, and (3) the changes and responses in the regional crop water supply–demand balance under future scenarios. A stepwise exploration of the regional agricultural water balance under varying environmental conditions is essential for developing targeted agricultural layouts and water resource optimization strategies at each stage, ultimately contributing to the sustainable management of agricultural water resources in the SJP.
Groundwater resources play a critical role in ensuring both the sustainability of regional groundwater systems and food security, particularly in the intensively farmed SJP. However, a research gap exists regarding the balance between regional groundwater consumption and food supply. Future studies should integrate GRACE satellite data with hydrological models to analyze regional groundwater dynamics and explore their relationship with irrigation demand as estimated in this study. This approach holds significant practical implications for regional agricultural production.
Moreover, studies on hydrological responses under future climate scenarios indicate that anticipated warming during winter and spring may lead to notable changes in the timing of spring snowmelt runoff peaks, shifting from April to March [30]. Since April is a critical period for runoff recharge and soil moisture replenishment, coupled with the increased crop evapotranspiration demand driven by farmland expansion, these changes may exacerbate water shortages during the early crop growth stages. Addressing the challenges posed by these future scenarios to agricultural practices should be a key focus of subsequent research.
Moreover, previous studies also highlighted that different irrigation strategies (e.g., furrow, sprinkler, drip, and subsurface drip irrigation), irrigation regimes (full, deficit, and supplementary irrigation), and mulching practices (no mulching, organic, and synthetic mulching) affect water use efficiency and overall water demand. For example, in the SJP, optimizing nitrogen application by maintaining an optimal nitrogen input of approximately 100 kg ha−1, combined with drip or subsurface drip irrigation and synthetic mulching, has been shown to maximize water–fertilizer synergy and improve water and fertilizer use efficiency [49]. Therefore, reasonable irrigation and nitrogen application also should be considered to effectively increase crop yield and water and nitrogen use efficiency and reduce nitrogen leaching.

5. Conclusions

This study provided a detailed characterization of the significant climate and vegetation changes observed in the region, with the results indicating a marked increase in both regional temperatures and the LAI. By utilizing a hydrological model that incorporates regional climatic variability and soil moisture stress and integrating reanalysis and multi-source remote sensing data, this study obtained accurate estimates of CWD, rainfed AET, and IWR. This approach overcomes the limitations of traditional effective precipitation calculation methods.
The findings revealed that the combined effects of climate transition and vegetation greening had led to a phase of increased water demand and irrigation requirement during the crop growing season after 2000, compared to the baseline period. Moreover, the crop water supply–demand relationship in the SJP had consistently exhibited a state of deficit, with a 22% increase in areas experiencing severe water shortages. A distinct spatial disparity was observed, with the western regions facing more severe water shortages compared to the eastern regions. Notably, the risk boundary for water shortages had expanded eastward and northward. Climate change primarily dominated the increase in IWR in central and western regions, while vegetation changes mainly accounted for the reduction in IWR in the eastern region.
To sustainably manage agricultural water resources in the SJP, it is crucial to address the impacts of climate change on the crop water supply–demand relationship. In the water-stressed central and western regions, promoting drought-resistant C4 crops and optimizing irrigation strategies are recommended. Conversely, in the relatively water-abundant eastern region, adopting water-efficient irrigation technologies and optimizing cropping patterns for C3 crops can enhance water-use efficiency and agricultural productivity.
Nevertheless, this study is limited by the lack of a comprehensive analysis of the dynamic interactions and feedback mechanisms between crop irrigation requirements and regional groundwater storage. Future research should aim to develop high-resolution groundwater storage datasets, such as those obtained from the GRACE satellite mission, to further delineate and quantify the effects of climate change and anthropogenic activities, particularly the increasing demand for crop irrigation, on groundwater dynamics. Such insights would be instrumental in informing the optimization and adjustment of regional agricultural cropping patterns, facilitating more precise management strategies under the constraints imposed by groundwater resources.

Author Contributions

Conceptualization, C.X. and W.Z.; data curation, C.X., H.C. and B.Z.; formal analysis, C.X., H.C. and S.W.; methodology, C.X. and H.C.; software, C.X., H.C. and Z.Z.; writing—original draft, C.X. and H.C.; writing—review and editing, W.Z., Z.F. and X.J. All authors have read and agreed to the published version of the manuscript.

Funding

This study was jointly financed by the National Natural Science Foundation of China (42101034), the Basic Scientific Research Fund of the Chinese Research Academy of Environmental Sciences (Grant No. 2024YSKY-15), and the National Key R & D Program of China [Grant No. 2023YFC3209102 and Grant No. 2023YFC3206202].

Data Availability Statement

The data presented in this study are available upon request from the corresponding author.

Acknowledgments

Open discussions in weekly seminars with the graduate students in Wanchang Zhang’s Lab are acknowledged. The authors are grateful to the National Tibetan Plateau Data Center, the Goddard Earth Sciences Data and Information Services Center (GES DISC), and other agencies for providing datasets.

Conflicts of Interest

The authors declare no conflicts of interest.

References

  1. Li, Z.; Liu, M.; Hu, Y.; Xue, Z.; Sui, J. The spatiotemporal changes of marshland and the driving forces in the Sanjiang Plain, Northeast China from 1980 to 2016. Ecol. Process. 2020, 9, 24. [Google Scholar] [CrossRef]
  2. Li, D.; Zhai, Y.; Lei, Y.; Li, J.; Teng, Y.; Lu, H.; Xia, X.; Yue, W.; Yang, J. Spatiotemporal evolution of groundwater nitrate nitrogen levels and potential human health risks in the Songnen Plain, Northeast China. Ecotoxicol. Environ. Saf. 2021, 208, 111524. [Google Scholar] [CrossRef] [PubMed]
  3. Zhang, Y.; Zang, S.; Sun, L.; Yan, B.; Yang, T.; Yan, W.; Meadows, M.E.; Wang, C.; Qi, J. Characterizing the changing environment of cropland in the Songnen Plain, Northeast China, from 1990 to 2015. J. Geogr. Sci. 2019, 29, 658–674. [Google Scholar] [CrossRef]
  4. Chen, H.; Zhang, W.; Gao, H.; Nie, N. Climate Change and Anthropogenic Impacts on Wetland and Agriculture in the Songnen and Sanjiang Plain, Northeast China. Remote Sens. 2018, 10, 356. [Google Scholar] [CrossRef]
  5. Guo, Y.; Song, C.; Zhang, J.; Wang, L.; Sun, L. Influence of wetland reclamation on land-surface energy exchange and evapotranspiration in the Sanjiang plain, Northeast China. Agric. For. Meteorol. 2021, 296, 108214. [Google Scholar] [CrossRef]
  6. Li, Q.; Sheng, B.; Huang, J.; Li, C.; Song, Z.; Chao, L.; Sun, W.; Yang, Y.; Jiao, B.; Guo, Z.; et al. Different climate response persistence causes warming trend unevenness at continental scales. Nat. Clim. Change 2022, 12, 343–349. [Google Scholar] [CrossRef]
  7. Wen, K.; Ren, G.; Ren, Y.; Cao, L.; Qin, Y.; Zhang, P.; He, J.; Xue, X.; Sun, X. Long-term changes in surface air temperature over the Chinese mainland during 1901-2020. Clim. Res. 2023, 90, 95–115. [Google Scholar] [CrossRef]
  8. Quinteiro, P.; Rafael, S.; Villanueva-Rey, P.; Ridoutt, B.; Lopes, M.; Arroja, L.; Dias, A.C. A characterisation model to address the environmental impact of green water flows for water scarcity footprints. Sci. Total. Environ. 2018, 626, 1210–1218. [Google Scholar] [CrossRef]
  9. Rigden, A.J.; Mueller, N.D.; Holbrook, N.M.; Pillai, N.; Huybers, P. Combined influence of soil moisture and atmospheric evaporative demand is important for accurately predicting US maize yields. Nat. Food 2020, 1, 127–133. [Google Scholar] [CrossRef] [PubMed]
  10. Chen, C.; Park, T.; Wang, X.; Piao, S.; Xu, B.; Chaturvedi, R.K.; Fuchs, R.; Brovkin, V.; Ciais, P.; Fensholt, R.; et al. China and India lead in greening of the world through land-use management. Nat. Sustain. 2019, 2, 122–129. [Google Scholar] [CrossRef] [PubMed]
  11. Lan, X.; Li, Y.; Shao, R.; Chen, X.; Lin, K.; Cheng, L.; Gao, H.; Liu, Z. Vegetation controls on surface energy partitioning and water budget over China. J. Hydrol. 2021, 600, 125646. [Google Scholar] [CrossRef]
  12. Song, W.; Feng, Y.; Wang, Z. Ecological restoration programs dominate vegetation greening in China. Sci. Total. Environ. 2022, 848, 157729. [Google Scholar] [CrossRef]
  13. Sun, G.-Q.; Li, L.; Li, J.; Liu, C.; Wu, Y.-P.; Gao, S.; Wang, Z.; Feng, G.-L. Impacts of climate change on vegetation pattern: Mathematical modeling and data analysis. Phys. Life Rev. 2022, 43, 239–270. [Google Scholar] [CrossRef]
  14. Liu, D.; Chen, W.; Li, L. Disentangling the relative effects of climate change and anthropogenic activities on paddy expansion in the northern Sanjiang Plain of China. Ecol. Indic. 2023, 154, 110543. [Google Scholar] [CrossRef]
  15. Sun, Q.; Xu, C.; Gao, X.; Lu, C.; Cao, B.; Guo, H.; Yan, L.; Wu, C.; He, X. Response of groundwater to different water resource allocation patterns in the Sanjiang Plain, Northeast China. J. Hydrol. Reg. Stud. 2022, 42, 101156. [Google Scholar] [CrossRef]
  16. Carracelas, G.; Hornbuckle, J.; Rosas, J.; Roel, A. Irrigation management strategies to increase water productivity in Oryza sativa (rice) in Uruguay. Agric. Water Manag. 2019, 222, 161–172. [Google Scholar] [CrossRef]
  17. Liu, C.; Jiang, W.; Wu, Y.; Liu, Y.; Liang, L. Estimation of regional farmland irrigation water requirements and water balance in Northeast China. Environ. Sci. Pollut. Res. 2022, 29, 71840–71856. [Google Scholar] [CrossRef]
  18. Liang, J.; Liu, Q.; Zhang, H.; Li, X.; Qian, Z.; Lei, M.; Li, X.; Peng, Y.; Li, S.; Zeng, G. Interactive effects of climate variability and human activities on blue and green water scarcity in rapidly developing watershed. J. Clean. Prod. 2020, 265, 121834. [Google Scholar] [CrossRef]
  19. Gong, X.; Zhang, H.; Ren, C.; Sun, D.; Yang, J. Optimization allocation of irrigation water resources based on crop water requirement under considering effective precipitation and uncertainty. 2020; 239, 106264. [Google Scholar] [CrossRef]
  20. Zhang, K.; Li, X.; Zheng, D.; Zhang, L.; Zhu, G. Estimation of Global Irrigation Water Use by the Integration of Multiple Satellite Observations. Water Resour. Res. 2022, 58, e2021WR030031. [Google Scholar] [CrossRef]
  21. Luo, W.; Chen, M.; Kang, Y.; Li, W.; Li, D.; Cui, Y.; Khan, S.; Luo, Y. Analysis of crop water requirements and irrigation demands for rice: Implications for increasing effective rainfall. Agric. Water Manag. 2021, 260, 107285. [Google Scholar] [CrossRef]
  22. Xu, C.; Zhang, Z.; Fu, Z.; Xiong, S.; Chen, H.; Zhang, W.; Wang, S.; Zhang, D.; Lu, H.; Jiang, X. Impacts of Climatic Fluctuations and Vegetation Greening on Regional Hydrological Processes: A Case Study in the Xiaoxinganling Mountains–Sanjiang Plain Region, Northeastern China. Remote. Sens. 2024, 16, 2709. [Google Scholar] [CrossRef]
  23. Xu, C.; Zhang, W.; Wang, S.; Chen, H.; Azzam, A.; Zhang, B.; Xu, Y.; Nie, N. Spatiotemporal green water dynamics and their responses to variations of climatic and underlying surface factors: A case study in the Sanjiang Plain, China. J. Hydrol. Reg. Stud. 2023, 45, 101303. [Google Scholar] [CrossRef]
  24. Zhang, Q.; Sun, J.; Zhang, G.; Liu, X.; Wu, Y.; Sun, J.; Hu, B. Spatiotemporal dynamics of water supply–demand patterns under large-scale paddy expansion: Implications for regional sustainable water resource management. Agric. Water Manag. 2023, 285, 108388. [Google Scholar] [CrossRef]
  25. He, J.; Yang, K.; Tang, W.; Lu, H.; Qin, J.; Chen, Y.; Li, X. The first high-resolution meteorological forcing dataset for land process studies over China. Sci. Data 2020, 7, 25. [Google Scholar] [CrossRef] [PubMed]
  26. Liu, Y.; Liu, R.; Chen, J.M. Retrospective retrieval of long-term consistent global leaf area index (1981–2011) from combined AVHRR and MODIS data. J. Geophys. Res. Biogeosci. 2012, 117, G04003. [Google Scholar] [CrossRef]
  27. Watkins, M.M.; Wiese, D.N.; Yuan, D.; Boening, C.; Landerer, F.W. Improved methods for observing Earth’s time variable mass distribution with GRACE using spherical cap mascons. J. Geophys. Res. Solid Earth 2015, 120, 2648–2671. [Google Scholar] [CrossRef]
  28. Allen, R.G.; Pereira, L.S.; Raes, D.; Smith, M. Crop Evapotranspiration-Guidelines for Computing Crop Water Requirements-FAO Irrigation and Drainage Paper 56; FAO: Rome, Italy, 1998; Volume 300, p. D05109. [Google Scholar]
  29. Sun, J.; Chen, L.; Qi, P.; Zhang, G. Agricultural Irrigation Water Requirement and Its Response to Climatic Factors Based on Remote Sensing and Single Crop Coefficient Method. Water Resour. Manag. 2024, 38, 5215–5233. [Google Scholar] [CrossRef]
  30. Liu, C.; Xu, C.; Zhang, Z.; Xiong, S.; Zhang, W.; Zhang, B.; Chen, H.; Xu, Y.; Wang, S. Modeling hydrological consequences of 21st-Century climate and land use/land cover changes in a mid-high latitude watershed. Geosci. Front. 2024, 15, 101819. [Google Scholar] [CrossRef]
  31. Chen, L.; Zhang, Z.; Liu, C.; Xiong, S.; Zhang, W.; Gao, H.; Yi, Y. Incorporating glacier processes into hydrological simulations in the headwaters of the Yangtze and yellow Rivers. Sci. Total. Environ. 2024, 951, 175474. [Google Scholar] [CrossRef] [PubMed]
  32. Gao, H.; Zhang, Z.; Chen, H.; Zhang, W.; Xu, C.; Yi, Y.; Liu, J.; Xiao, Z. Impacts of seasonally frozen soil hydrothermal dynamics on the watershed hydrological processes inferred from a spatially distributed numerical modelling approach. J. Hydrol. 2023, 624, 129947. [Google Scholar] [CrossRef]
  33. Wang, S.; Xu, C.; Zhang, W.; Chen, H.; Zhang, B. Human-Induced water loss from closed inland Lakes: Hydrological simulations in China’s Daihai lake. J. Hydrol. 2022, 607, 127552. [Google Scholar] [CrossRef]
  34. Tsakmakis, I.D.; Zoidou, M.; Gikas, G.D.; Sylaios, G.K. Impact of Irrigation Technologies and Strategies on Cotton Water Footprint Using AquaCrop and CROPWAT Models. Environ. Process. 2018, 5, 181–199. [Google Scholar] [CrossRef]
  35. Moseki, O.; Murray-Hudson, M.; Kashe, K. Crop water and irrigation requirements of Jatropha curcas L. in semi-arid conditions of Botswana: Applying the CROPWAT model. Agric. Water Manag. 2019, 225, 105754. [Google Scholar] [CrossRef]
  36. Zhou, S.; Zhang, W.; Wang, S.; Zhang, B.; Xu, Q. Spatial–Temporal Vegetation Dynamics and Their Relationships with Climatic, Anthropogenic, and Hydrological Factors in the Amur River Basin. Remote. Sens. 2021, 13, 684. [Google Scholar] [CrossRef]
  37. Mekonnen, M.M.; Hoekstra, A.Y. Blue water footprint linked to national consumption and international trade is unsustainable. Nat. Food 2020, 1, 792–800. [Google Scholar] [CrossRef] [PubMed]
  38. Xie, P.; Zhuo, L.; Yang, X.; Huang, H.; Gao, X.; Wu, P. Spatial-temporal variations in blue and green water resources, water footprints and water scarcities in a large river basin: A case for the Yellow River basin. J. Hydrol. 2020, 590, 125222. [Google Scholar] [CrossRef]
  39. Liu, Z.; Yang, P.; Tang, H.; Wu, W.; Zhang, L.; Yu, Q.; Li, Z. Shifts in the extent and location of rice cropping areas match the climate change pattern in China during 1980–2010. Reg. Environ. Change 2015, 15, 919–929. [Google Scholar] [CrossRef]
  40. Dong, J.; Xiao, X.; Zhang, G.; Menarguez, M.A.; Choi, C.Y.; Qin, Y.; Luo, P.; Zhang, Y.; Moore, B. Northward expansion of paddy rice in northeastern Asia during 2000–2014. Geophys. Res. Lett. 2016, 43, 3754–3761. [Google Scholar] [CrossRef] [PubMed]
  41. Hu, Y.; Fan, L.; Liu, Z.; Yu, Q.; Liang, S.; Chen, S.; You, L.; Wu, W.; Yang, P. Rice production and climate change in Northeast China: Evidence of adaptation through land use shifts. Environ. Res. Lett. 2019, 14, 024014. [Google Scholar] [CrossRef]
  42. Sun, J.; Zhang, G.; Wu, Y.; Chen, L.; Qi, P.; Hu, B.; Xu, Y. Risk assessment of agricultural green water security in Northeast China under climate change. Sci. China Earth Sci. 2024, 67, 2178–2194. [Google Scholar] [CrossRef]
  43. Khaydar, D.; Chen, X.; Huang, Y.; Ilkhom, M.; Liu, T.; Friday, O.; Farkhod, A.; Khusen, G.; Gulkaiyr, O. Investigation of crop evapotranspiration and irrigation water requirement in the lower Amu Darya River Basin, Central Asia. J. Arid. Land 2021, 13, 23–39. [Google Scholar] [CrossRef]
  44. Ding, R.; Tong, L.; Li, F.; Zhang, Y.; Hao, X.; Kang, S. Variations of crop coefficient and its influencing factors in an arid advective cropland of northwest China. Hydrol. Process. 2015, 29, 239–249. [Google Scholar] [CrossRef]
  45. Guo, H.; Li, S.; Kang, S.; Du, T.; Tong, L.; Hao, X.; Ding, R. Crop coefficient for spring maize under plastic mulch based on 12-year eddy covariance observation in the arid region of Northwest China. J. Hydrol. 2020, 588, 125108. [Google Scholar] [CrossRef]
  46. Allen, R.G.; Pereira, L.S. Estimating crop coefficients from fraction of ground cover and height. Irrig. Sci. 2009, 28, 17–34. [Google Scholar] [CrossRef]
  47. Beeri, O.; Netzer, Y.; Munitz, S.; Mintz, D.F.; Pelta, R.; Shilo, T.; Horesh, A.; Mey-Tal, S. Kc and LAI Estimations Using Optical and SAR Remote Sensing Imagery for Vineyards Plots. Remote. Sens. 2020, 12, 3478. [Google Scholar] [CrossRef]
  48. Shao, G.; Han, W.; Zhang, H.; Liu, S.; Wang, Y.; Zhang, L.; Cui, X. Mapping maize crop coefficient Kc using random forest algorithm based on leaf area index and UAV-based multispectral vegetation indices. Agric. Water Manag. 2021, 252, 106906. [Google Scholar] [CrossRef]
  49. Song, J.; Wang, J.; Hou, Q.; Xing, Z.; Zhang, Z.; Du, S.; Liu, M. Short-term effects of irrigation and nitrogen management on paddy soil carbon pools under deep placement of basal fertilizer nitrogen. Sci. Rep. 2024, 14, 11329. [Google Scholar] [CrossRef]
Figure 1. The geographical location, geomorphology, river systems, and other relevant information of the SJP.
Remotesensing 17 00440 g001
Figure 2. The structure diagram of the ESSI-3 hydrological model.
Remotesensing 17 00440 g002
Figure 3. The evaluation of ESSI-3 model performance in Sanjiang Plain for streamflow (a,b), evapotranspiration (c), and terrestrial water storage anomalies (d).
Remotesensing 17 00440 g003
Figure 4. Inter-annual variations of regionally averaged meteorological parameters during the crop growth periods spanning from 1982 to 2018 in the SJP. (a) Tas (units: °C), (b) Rlds (units: W/m2), (c) Rsds (units: W/m2), (d) Pr (units: mm), (e) RH (units: %), and (f) WS (units: m/s).
Remotesensing 17 00440 g004
Figure 5. Spatial distribution of trends in meteorological parameters during the growth period from 1982 to 2018 in the SJP. (a) Tas (units: °C/yr), (b) Rlds (units: W·m−2/yr), (c) Rsds (units: W·m−2/yr), (d) Pr (units: mm/yr), (e) RH (units: %/yr), and (f) WS (units: m·s−1/yr).
Remotesensing 17 00440 g005
Figure 6. Intra-annual variations and spatial distribution of trend in LAI during the growth period from 1982 to 2018 in the SJP.
Remotesensing 17 00440 g006
Figure 7. The spatial distribution of multi-year average (1982–2018) CWD (a) and rainfed AET (b) during the growth period.
Remotesensing 17 00440 g007
Figure 8. The inter-annual and monthly variation of CWD (a,b) and rainfed AET (c,d) during the growth period.
Remotesensing 17 00440 g008
Figure 9. The spatial distribution of multi-year average IWR and IWR change rate in SJP during the growth period.
Remotesensing 17 00440 g009
Figure 10. The inter-annual and monthly variation of IWR during the growth period.
Remotesensing 17 00440 g010
Figure 11. Comparison of estimated yearly CWD (a), effective rainfall (b), and IWR (c) based on the developed method in this study and the Cropwat model, and the relationship between yearly IWR anomaly (d) calculated in this study and GRACE-derived TWSA.
Remotesensing 17 00440 g011
Figure 12. Spatial distribution of IWR changes in the SJP before and after 2000.
Remotesensing 17 00440 g012
Figure 13. Spatial distribution of irrigation water scarcity index levels before (a) and after 2000 (b).
Remotesensing 17 00440 g013
Figure 14. Correlation coefficients of CWD, AET, and IWR with each climatic and vegetation factor. Note: * indicates statistical significance at the p < 0.05 level.
Remotesensing 17 00440 g014
Figure 15. The leading factor controlling the IWR change at the pixel scale in SJP. + /− indicates the positive/negative effects of IWR change.
Remotesensing 17 00440 g015
Figure 16. Spatial distribution of multi-year averages and contours of temperature (a,b) and precipitation (c,d) for the period spanning 1985 to 2018 in SJP region.
Remotesensing 17 00440 g016
Table 1. Growth stages and crop coefficients of main crops in SJP.
Growth StagesMiddle RiceSpring Maize
DateKcDateKc
Initial20 May–15 June1.0525 April–20 May0.4
Development16 June–15 July1.1521 May–25 June0.8
Middle16 July–30 August1.226 June–20 August1.12
Late31 August–30 September0.9521 August–15 September0.5
Disclaimer/Publisher’s Note: The statements, opinions and data contained in all publications are solely those of the individual author(s) and contributor(s) and not of MDPI and/or the editor(s). MDPI and/or the editor(s) disclaim responsibility for any injury to people or property resulting from any ideas, methods, instructions or products referred to in the content.

