
Combining InSAR and Time-Series Clustering to Reveal Deformation Patterns of the Heifangtai Loess Terrace


Abstract
1. Introduction
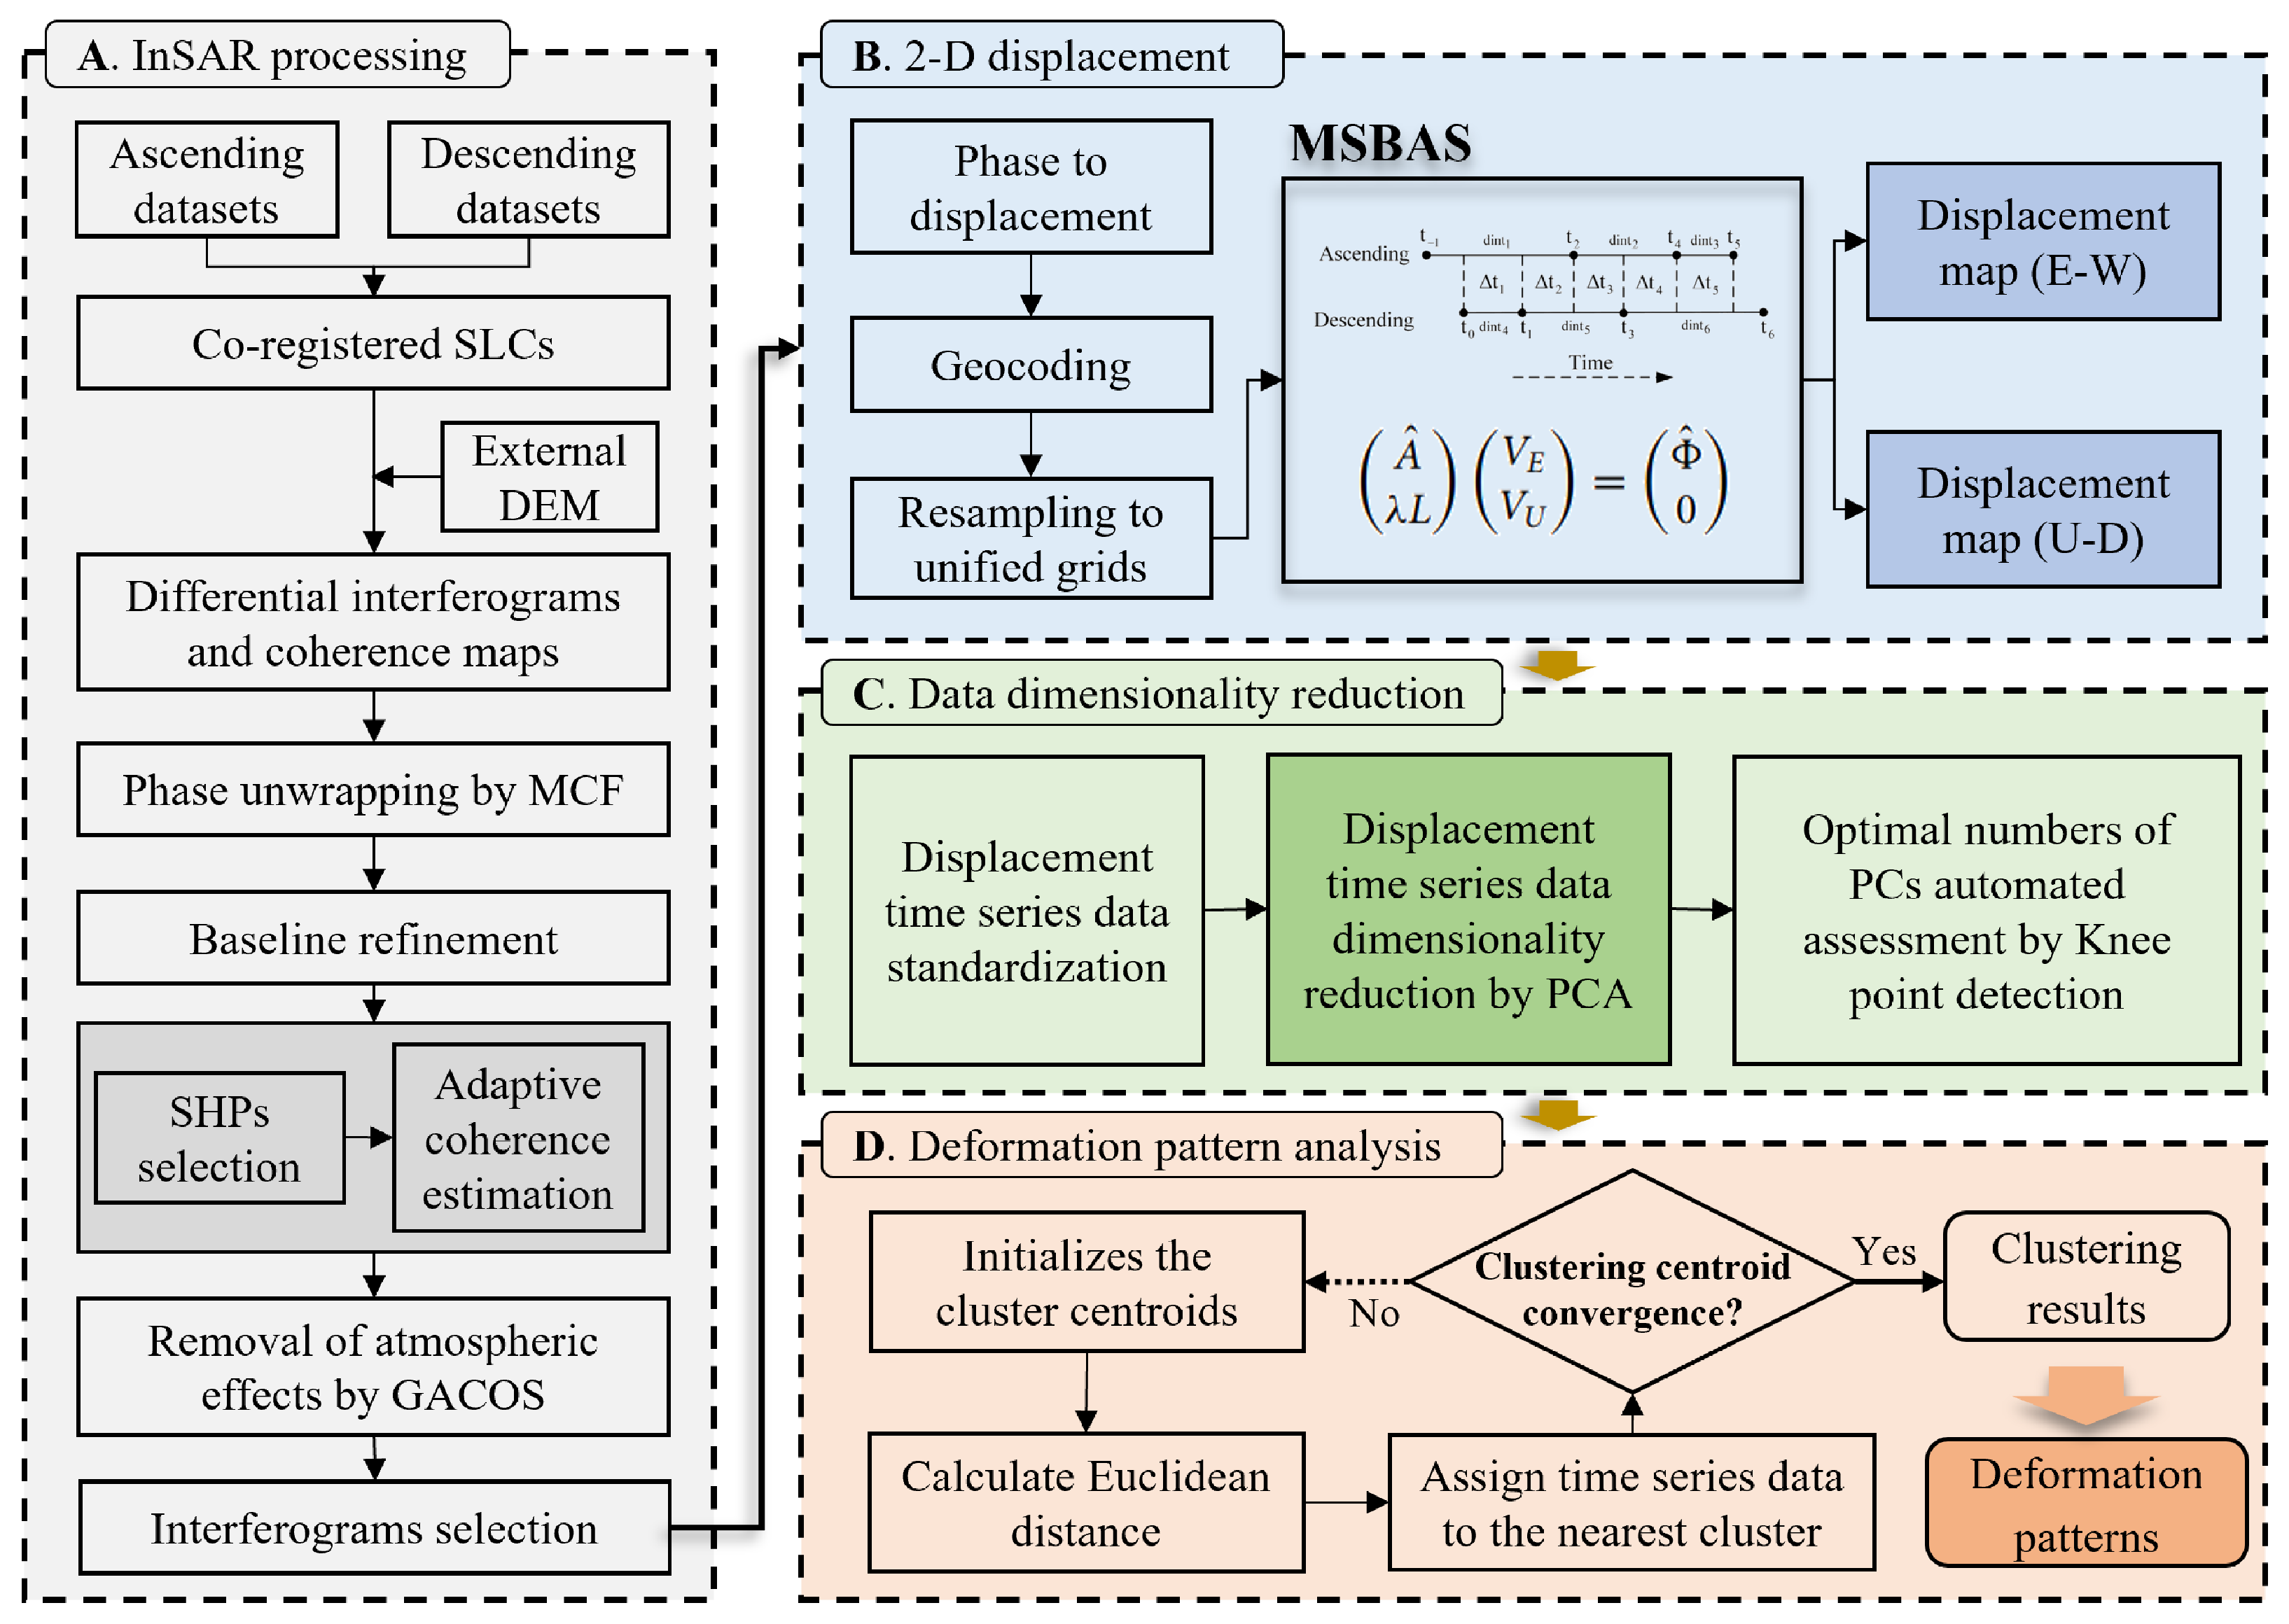
2. Methodology
2.1. Interference Processing Based on Distributed Scatterers
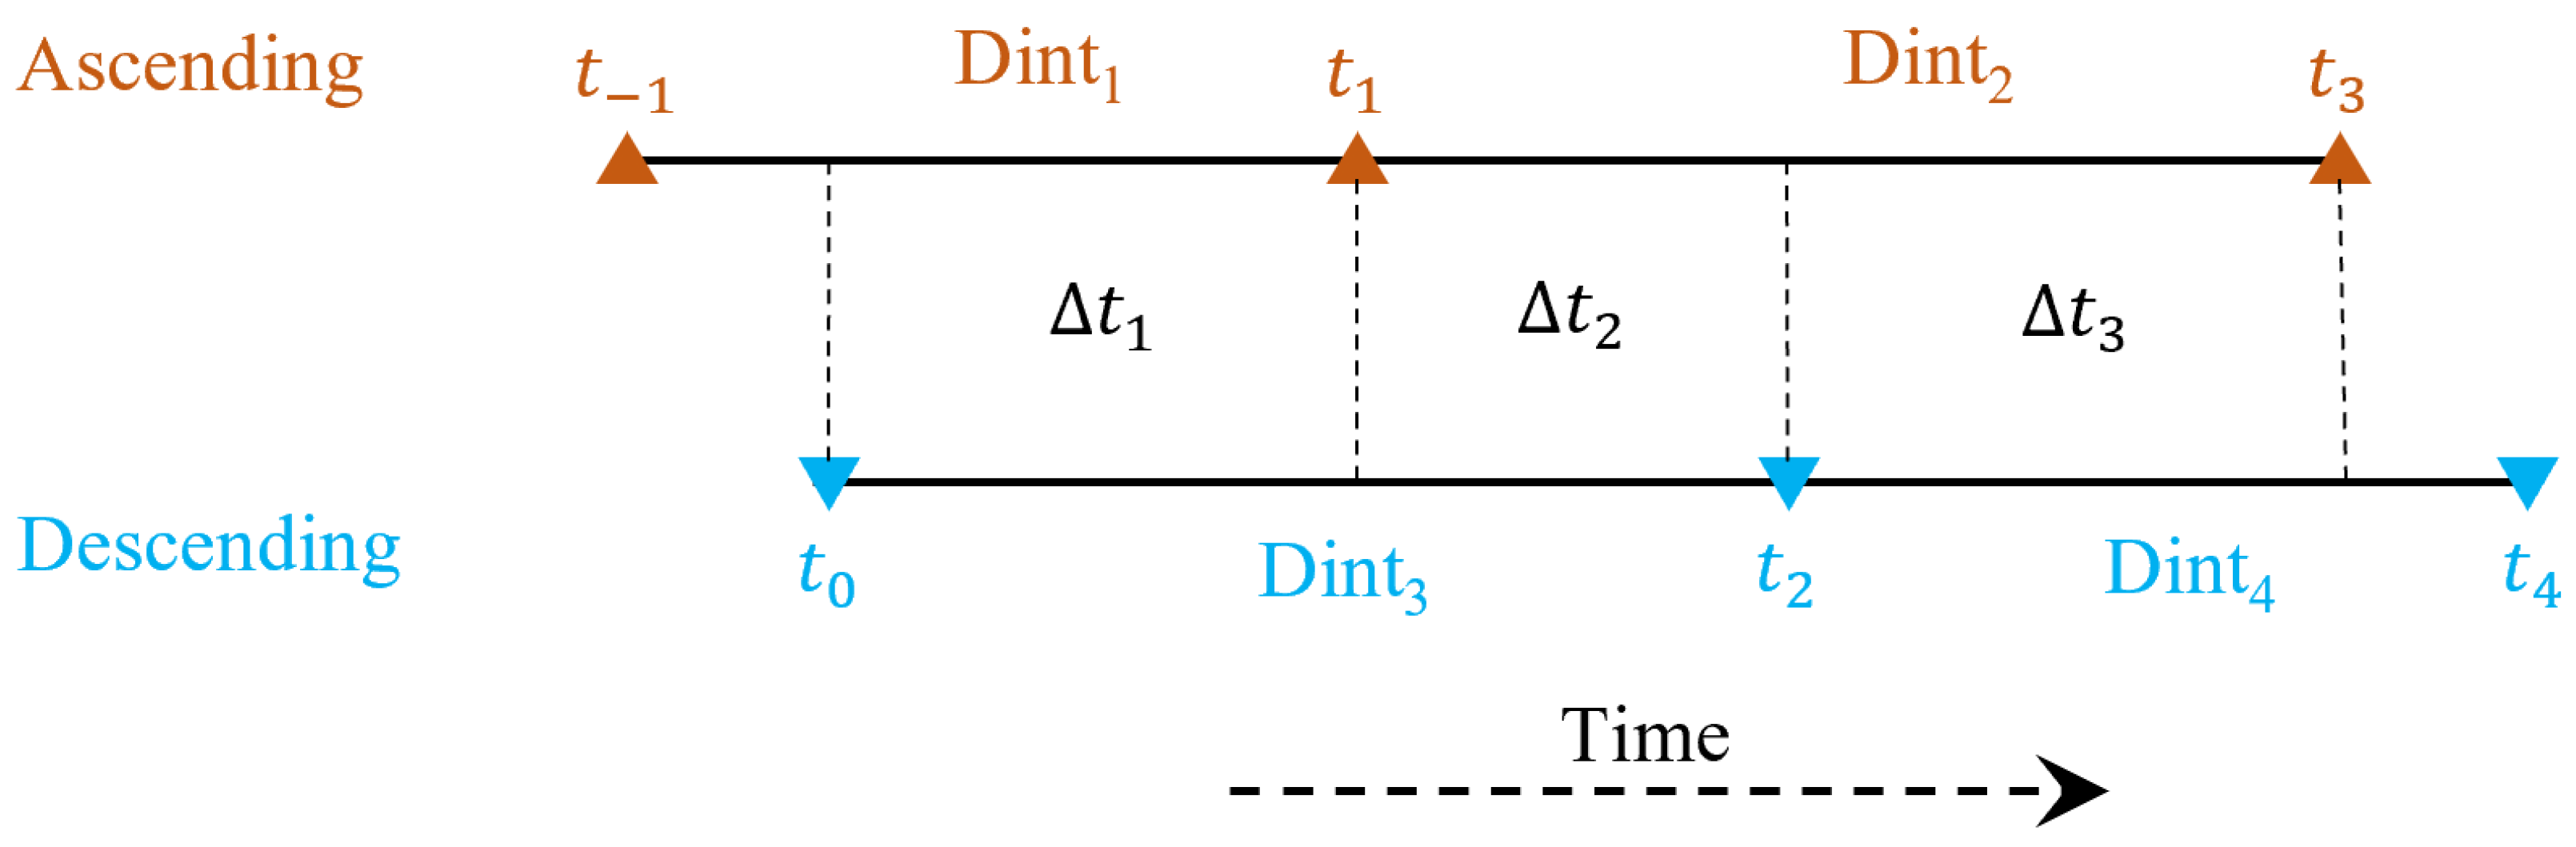
2.2. Calculating 2-D Displacement Using MSBAS
2.3. Dimensionality Reduction in Time Series Using PCA
2.4. Analyzing Surface Deformation Patterns Using K-Means
3. Study Area and Datasets
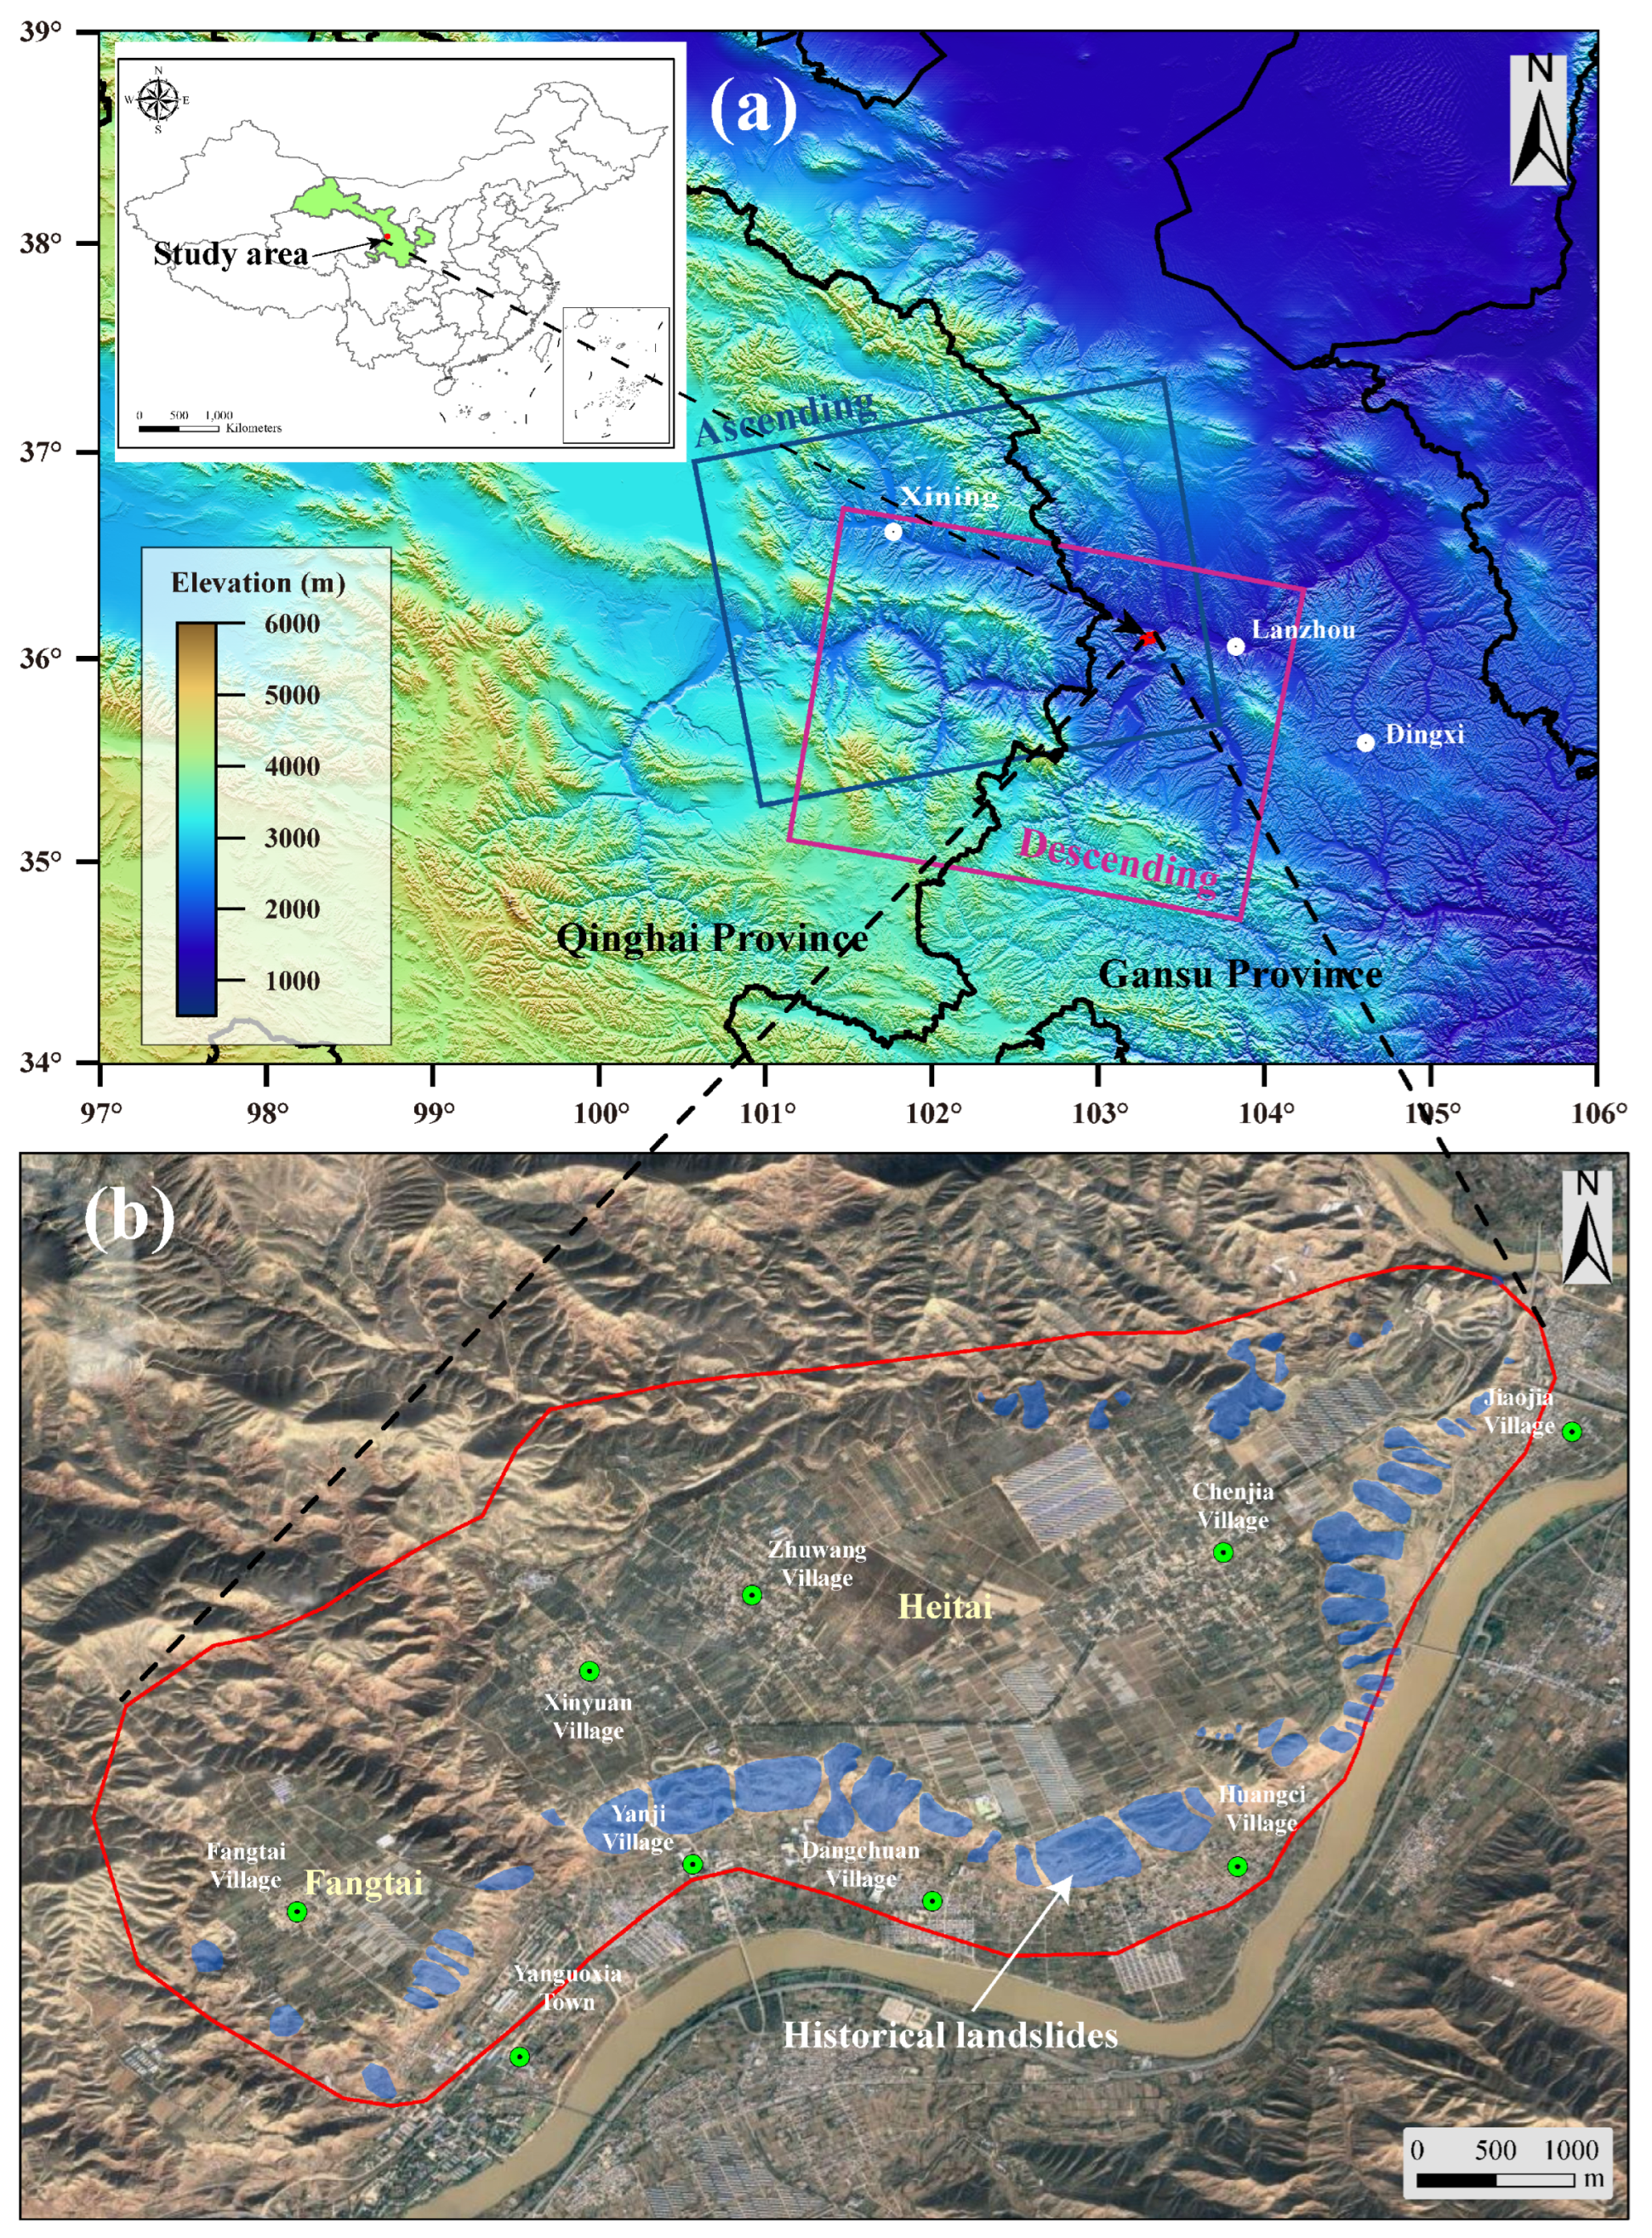
3.1. Study Area
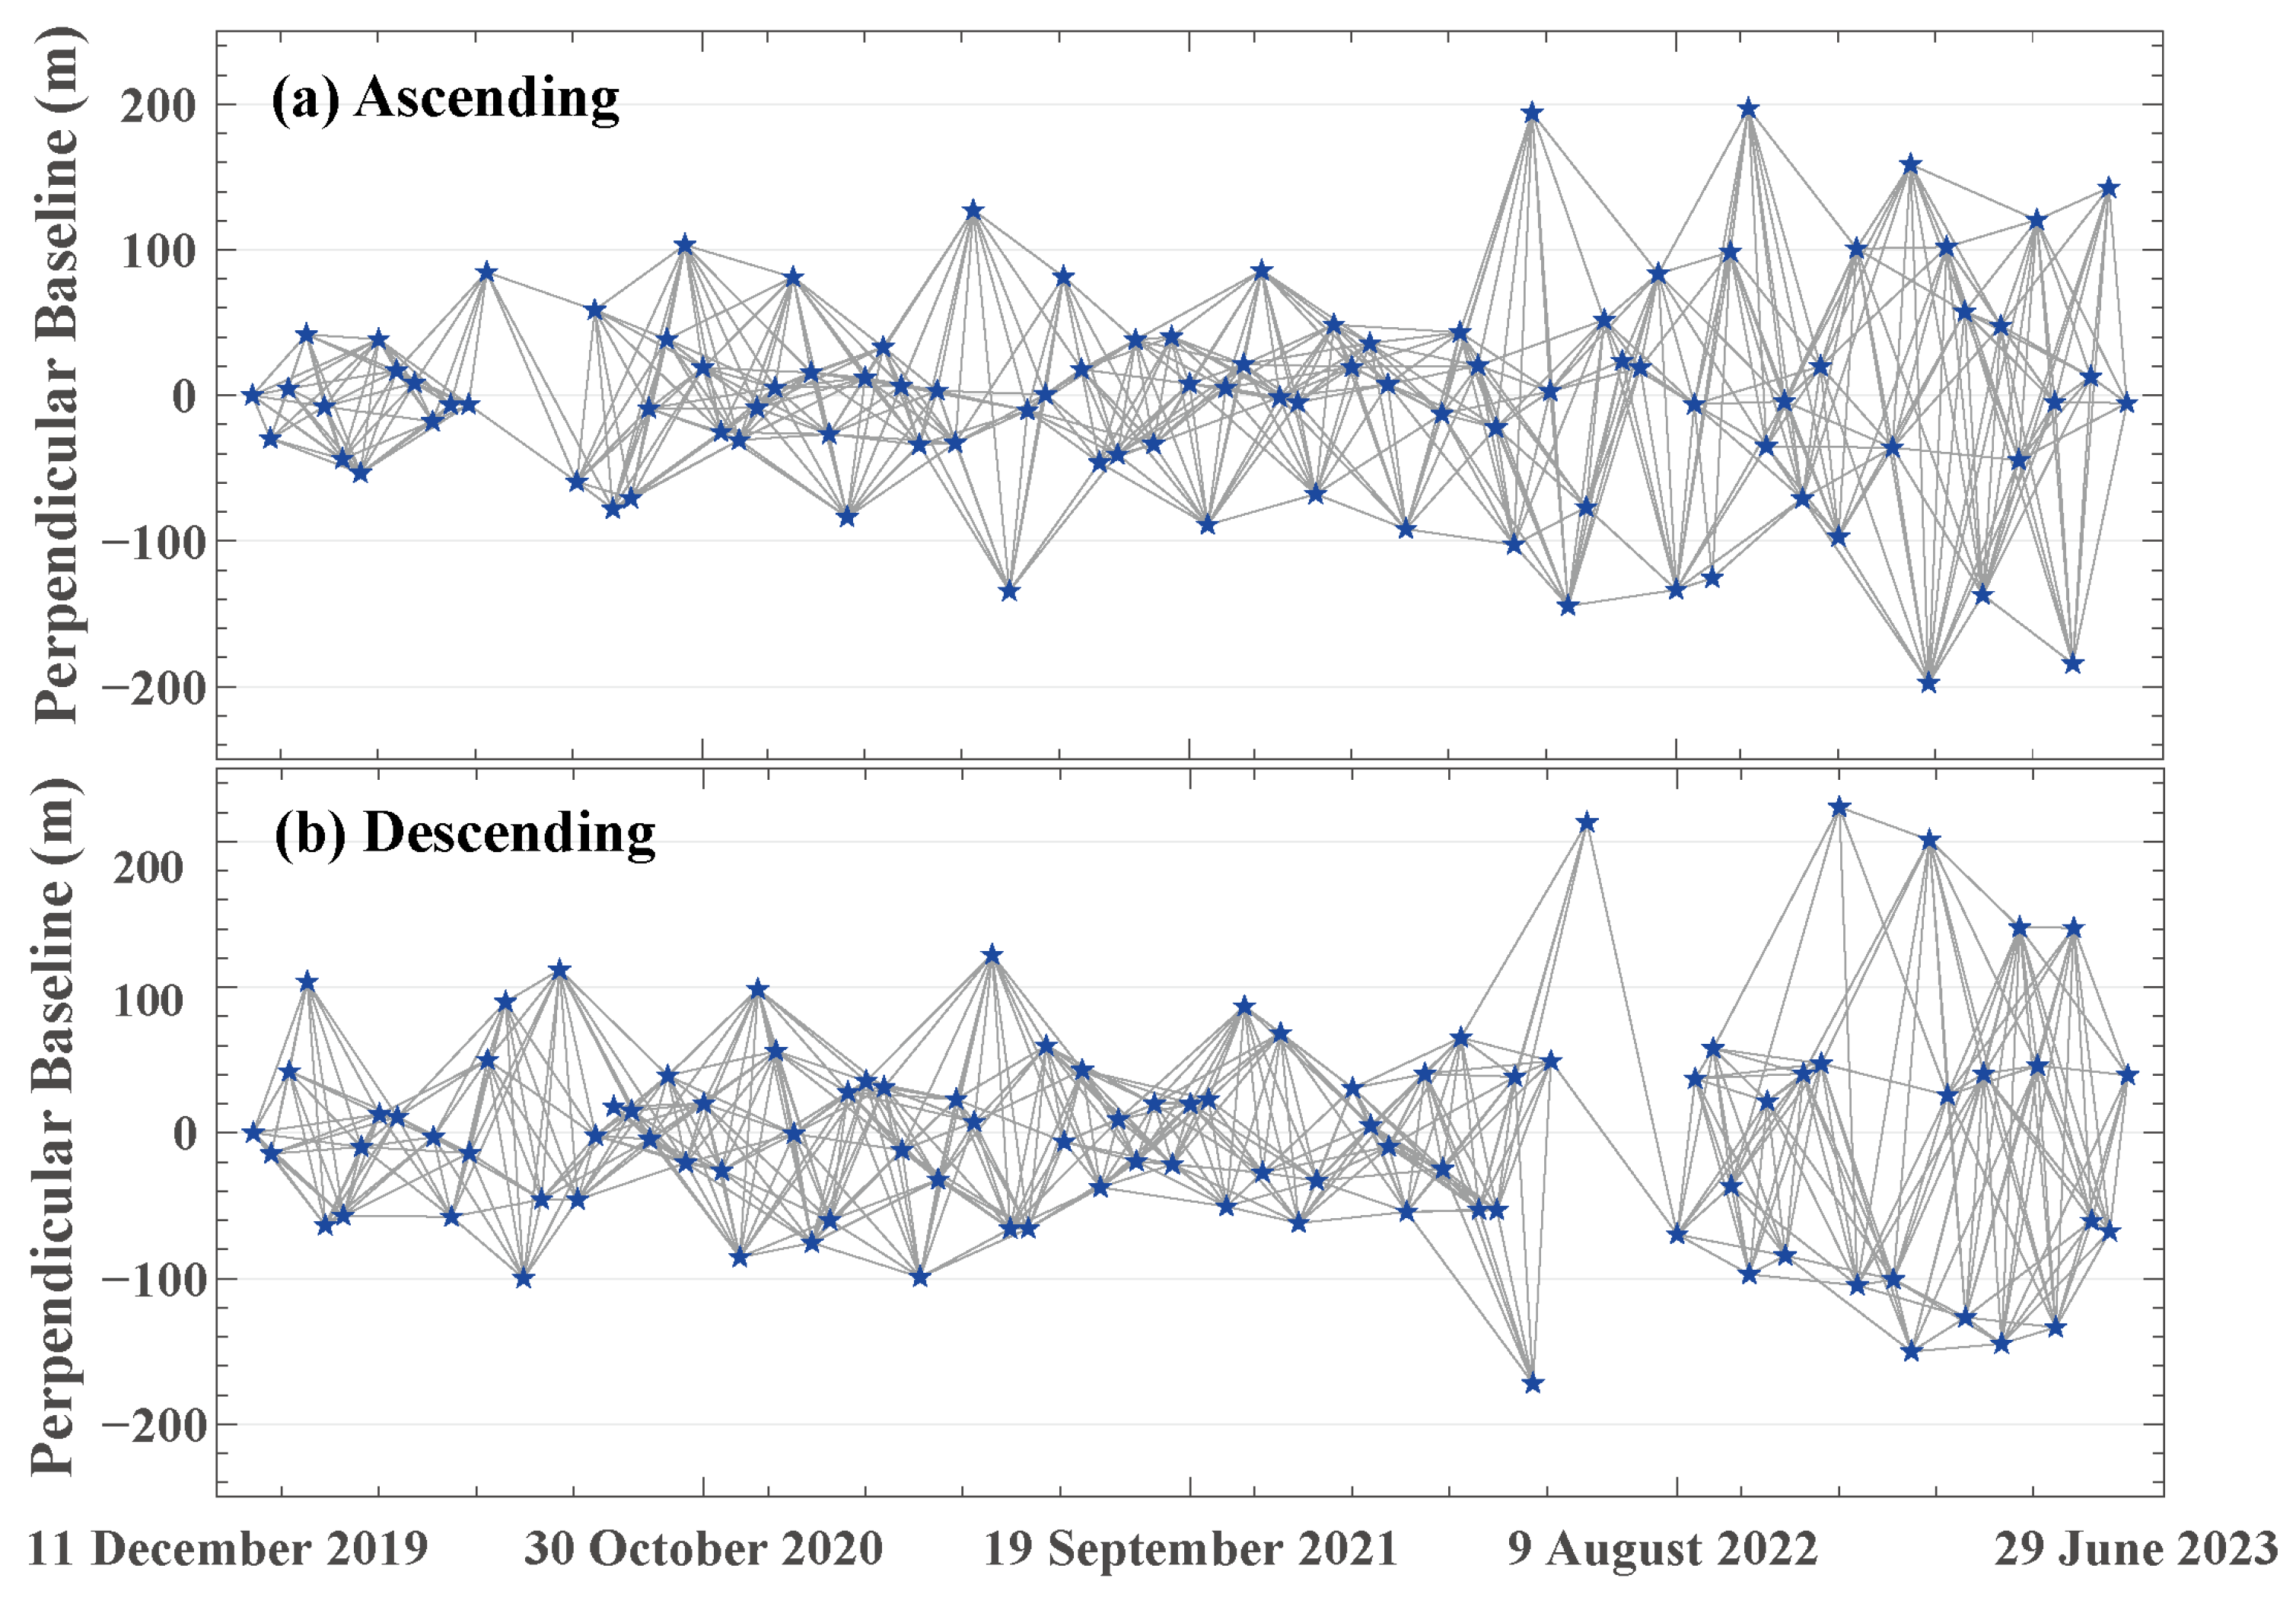
3.2. Datasets
4. Results
4.1. Interference Processing Results Based on Distributed Scatterers
4.2. Two-Dimensional Deformation Velocity Maps
4.3. Principal Components of the Displacement Time Series
4.4. Revealing Deformation Patterns Using K-Means Clustering
5. Discussion
5.1. Response Relationship Between Deformation Patterns and Rainfall
5.2. Prospects and Limitations
6. Conclusions
- (1)
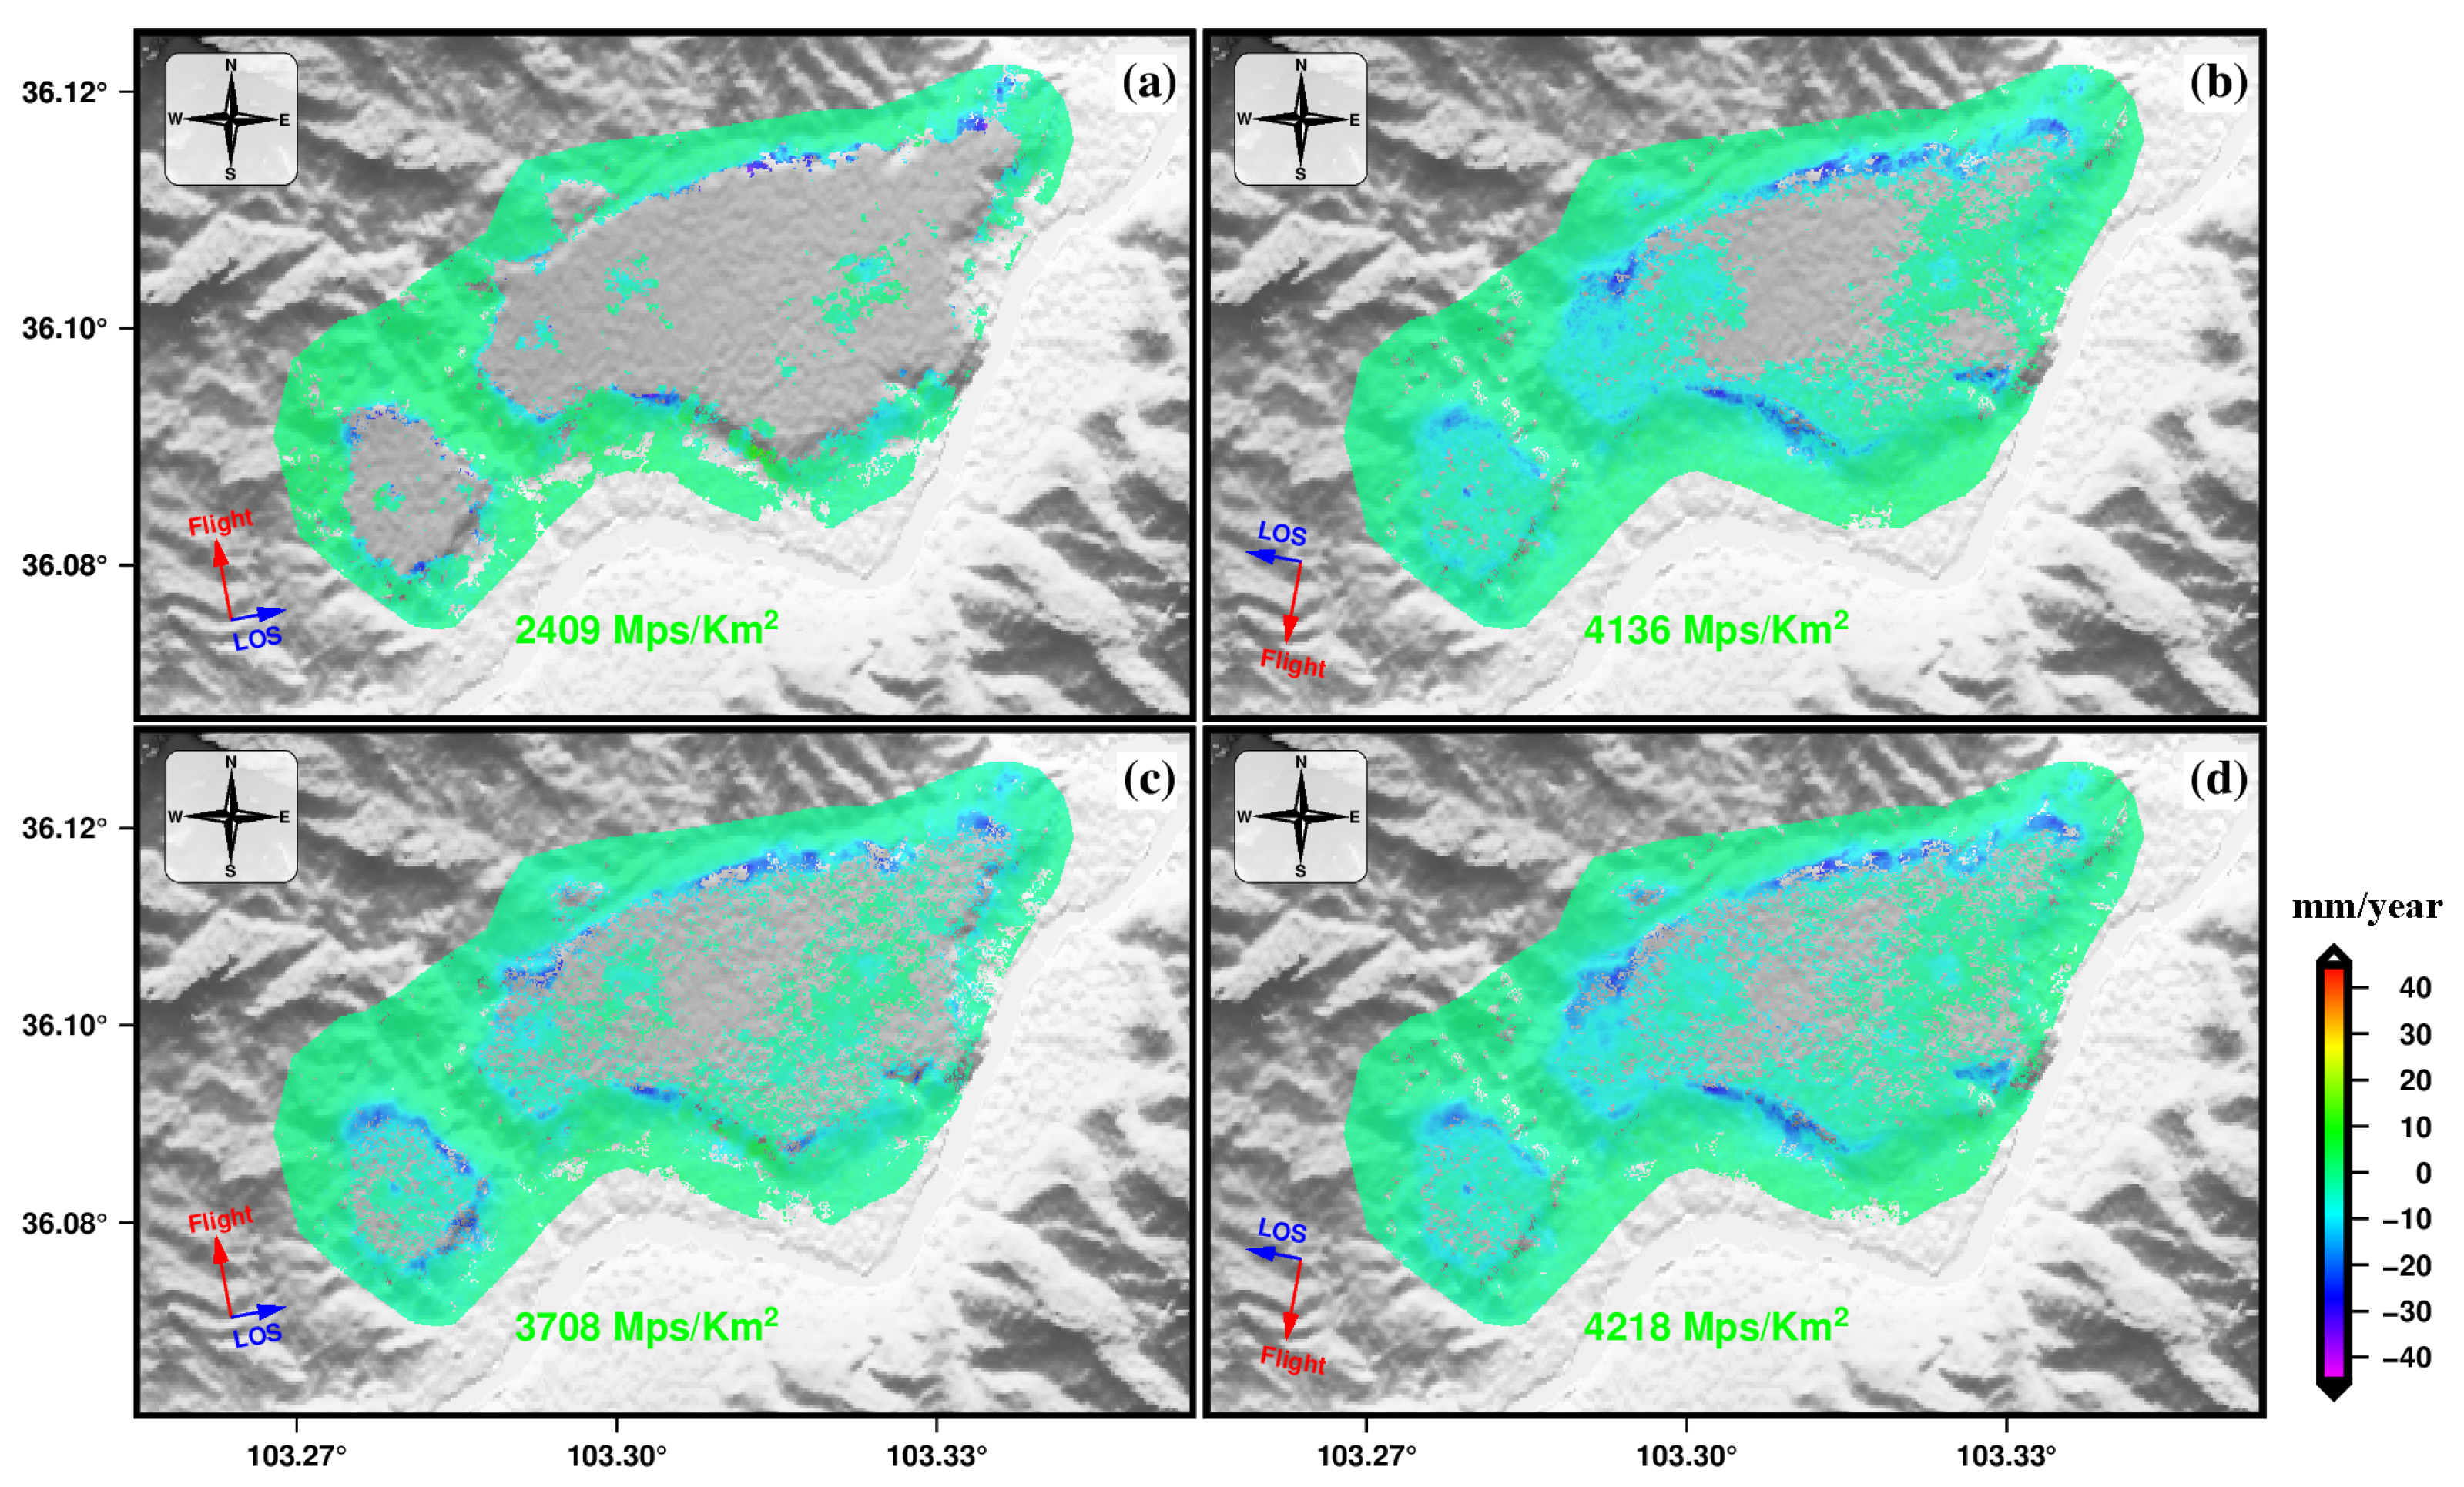
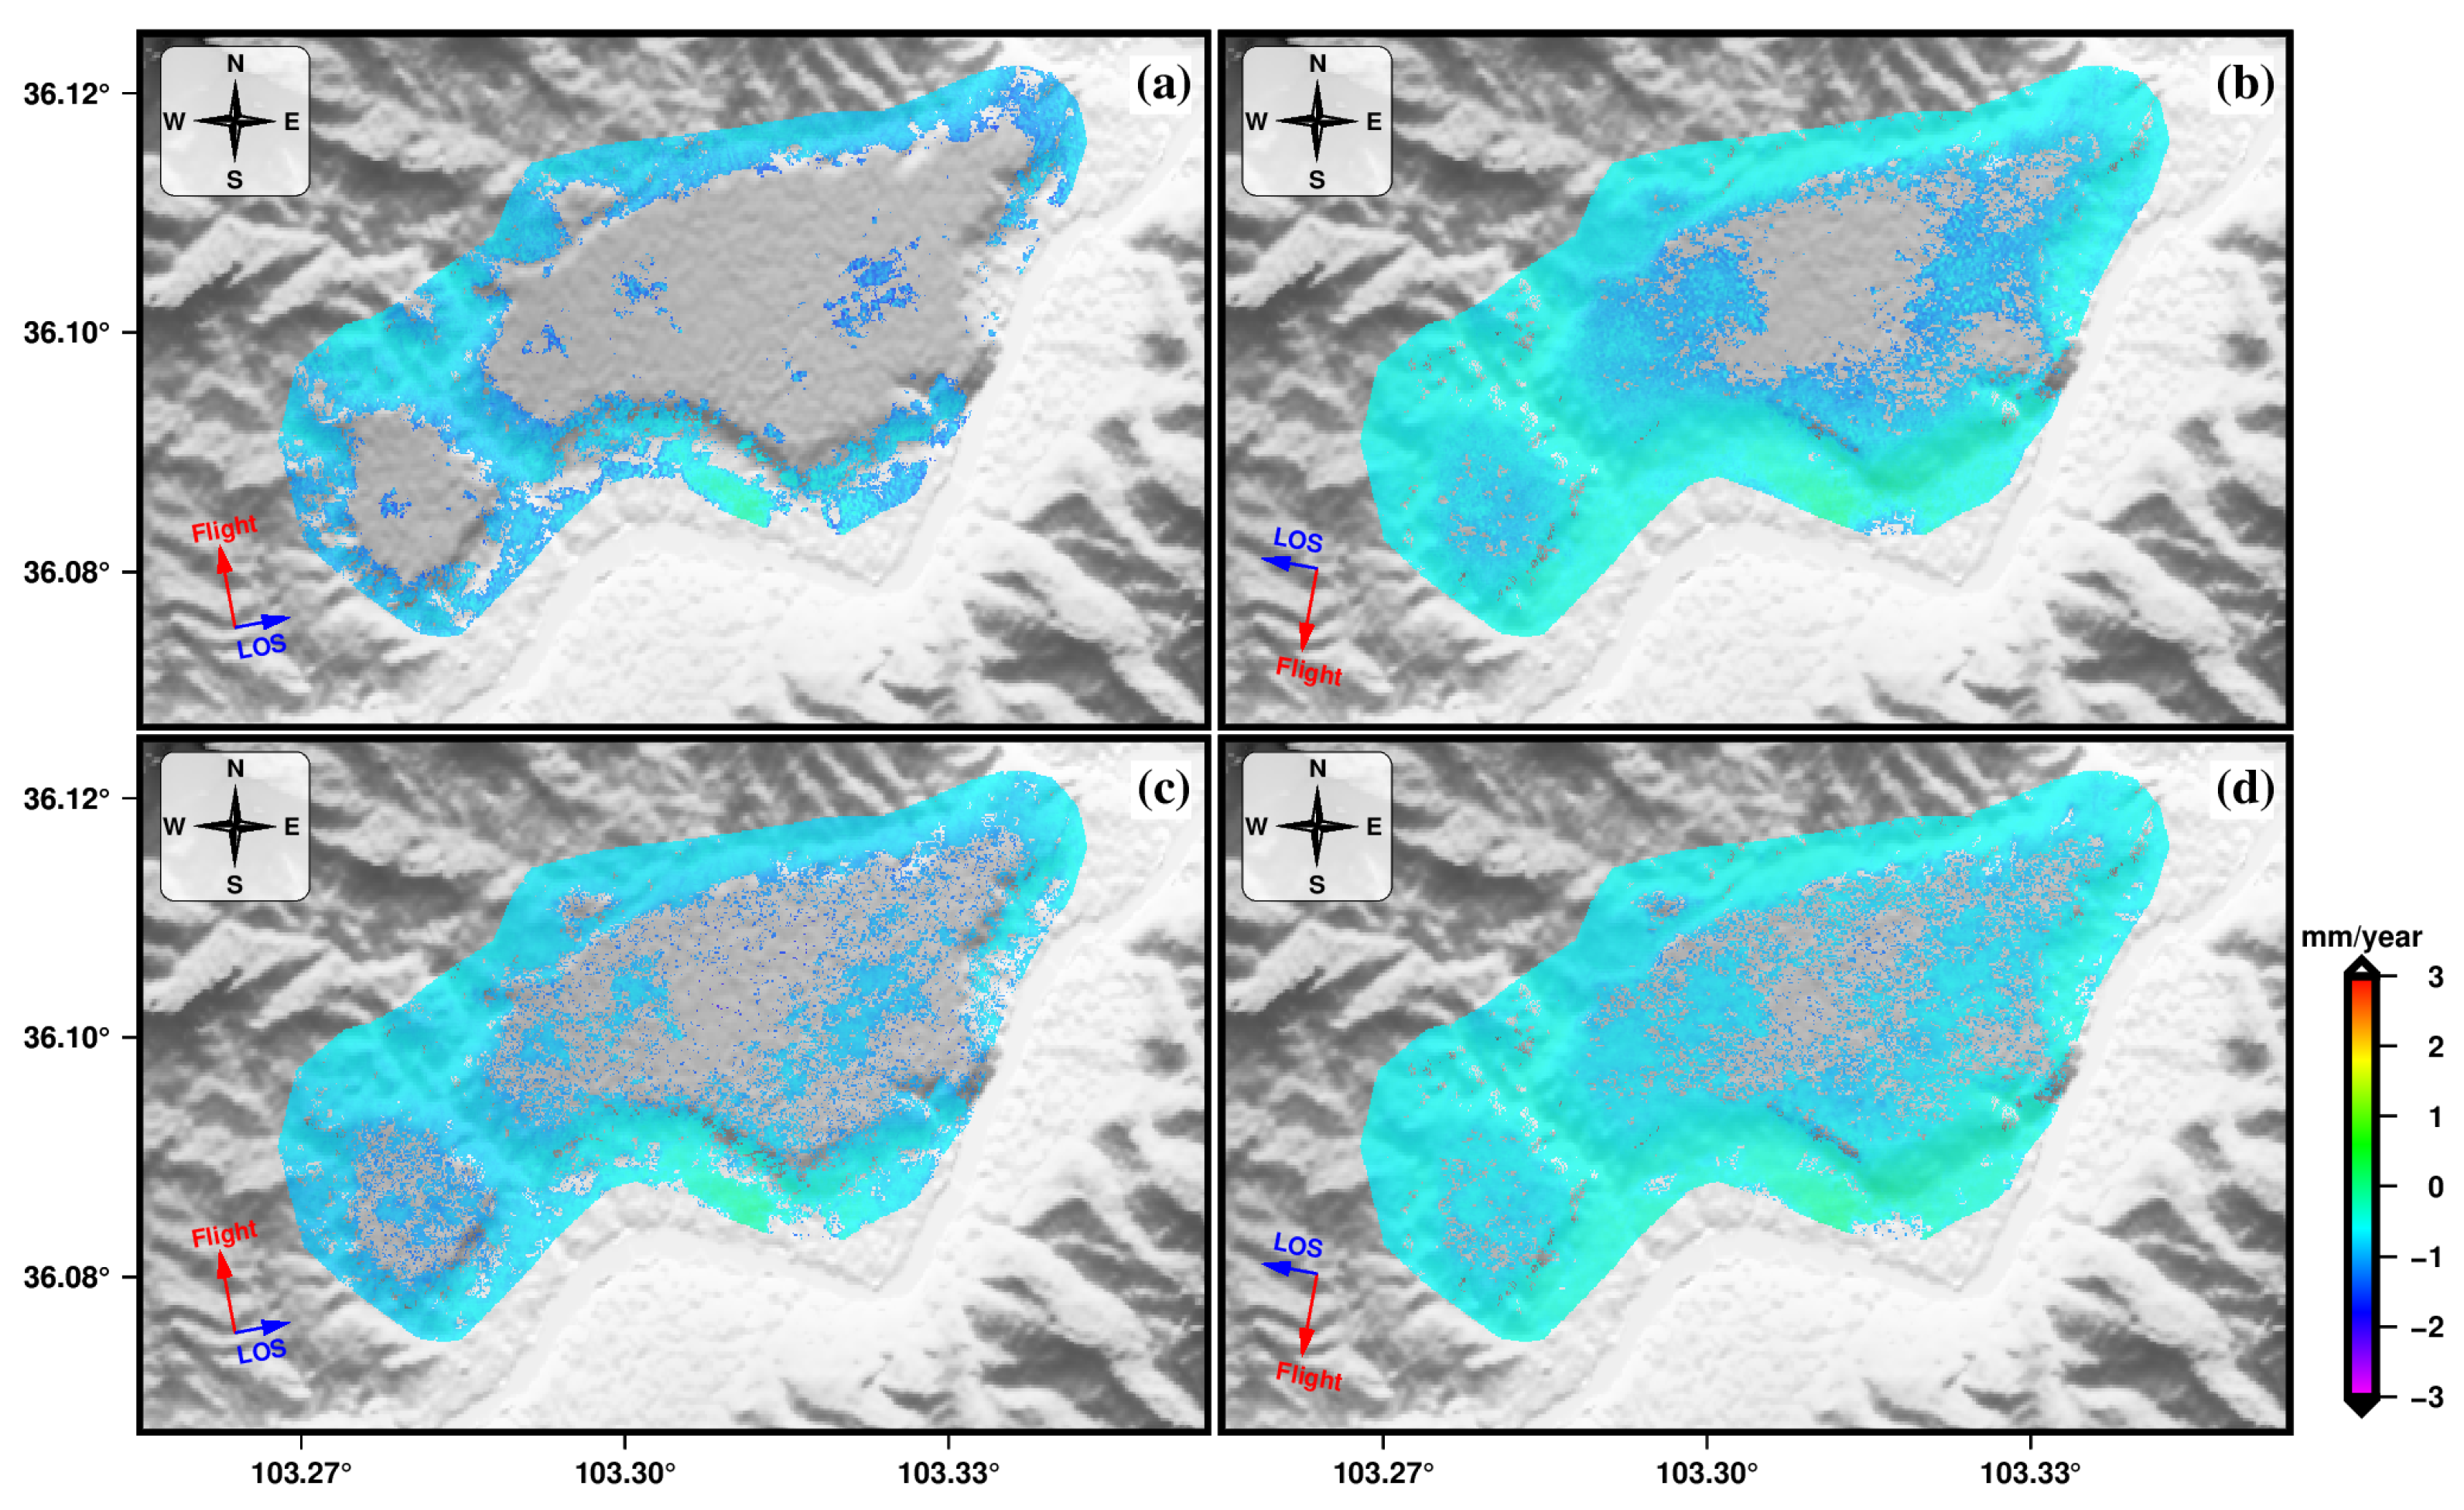
- Based on the characteristics of DSs, the spatial resolution of coherence can be effectively improved to reduce the noise level of differential interferometric phases, thereby increasing the density of MPs. In the Heifangtai area, the deformation signals are primarily distributed along the edges of the Heitai and Fangtai terraces. Compared to conventional SBAS, DS-based SBAS provides more comprehensive deformation information, particularly enhancing the density of MPs by 53.9% in the ascending SAR dataset.
- (2)
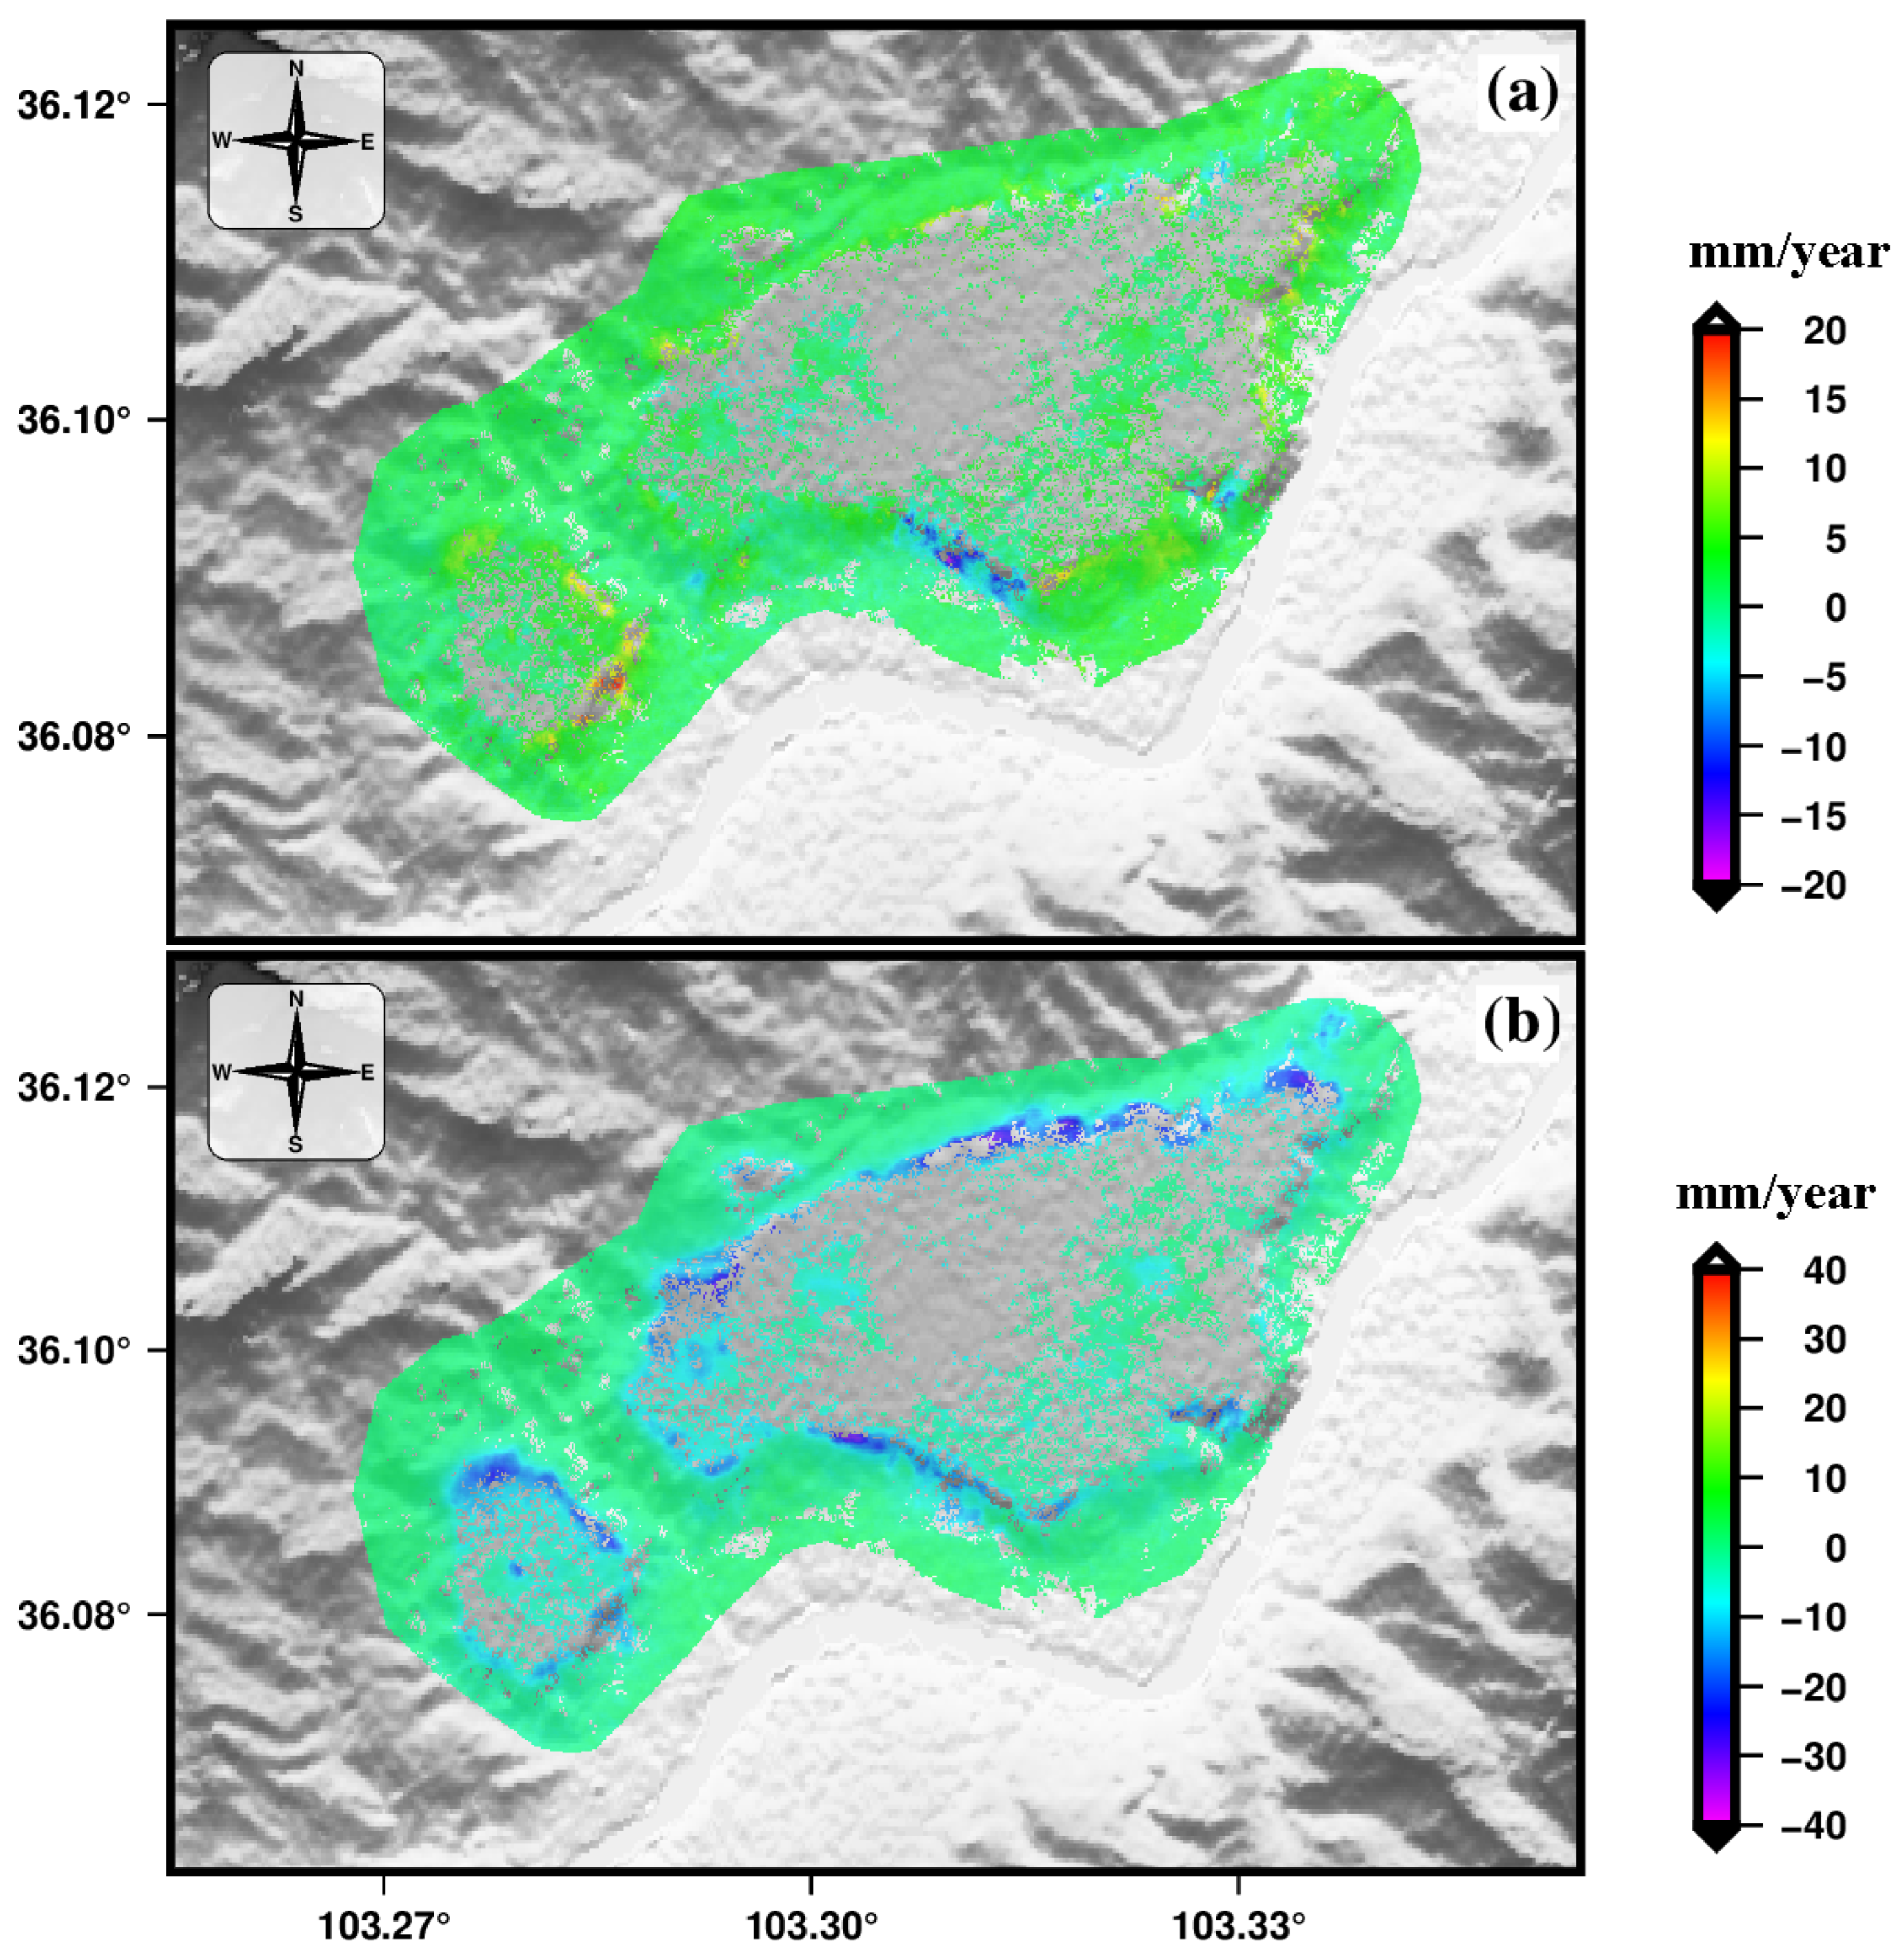
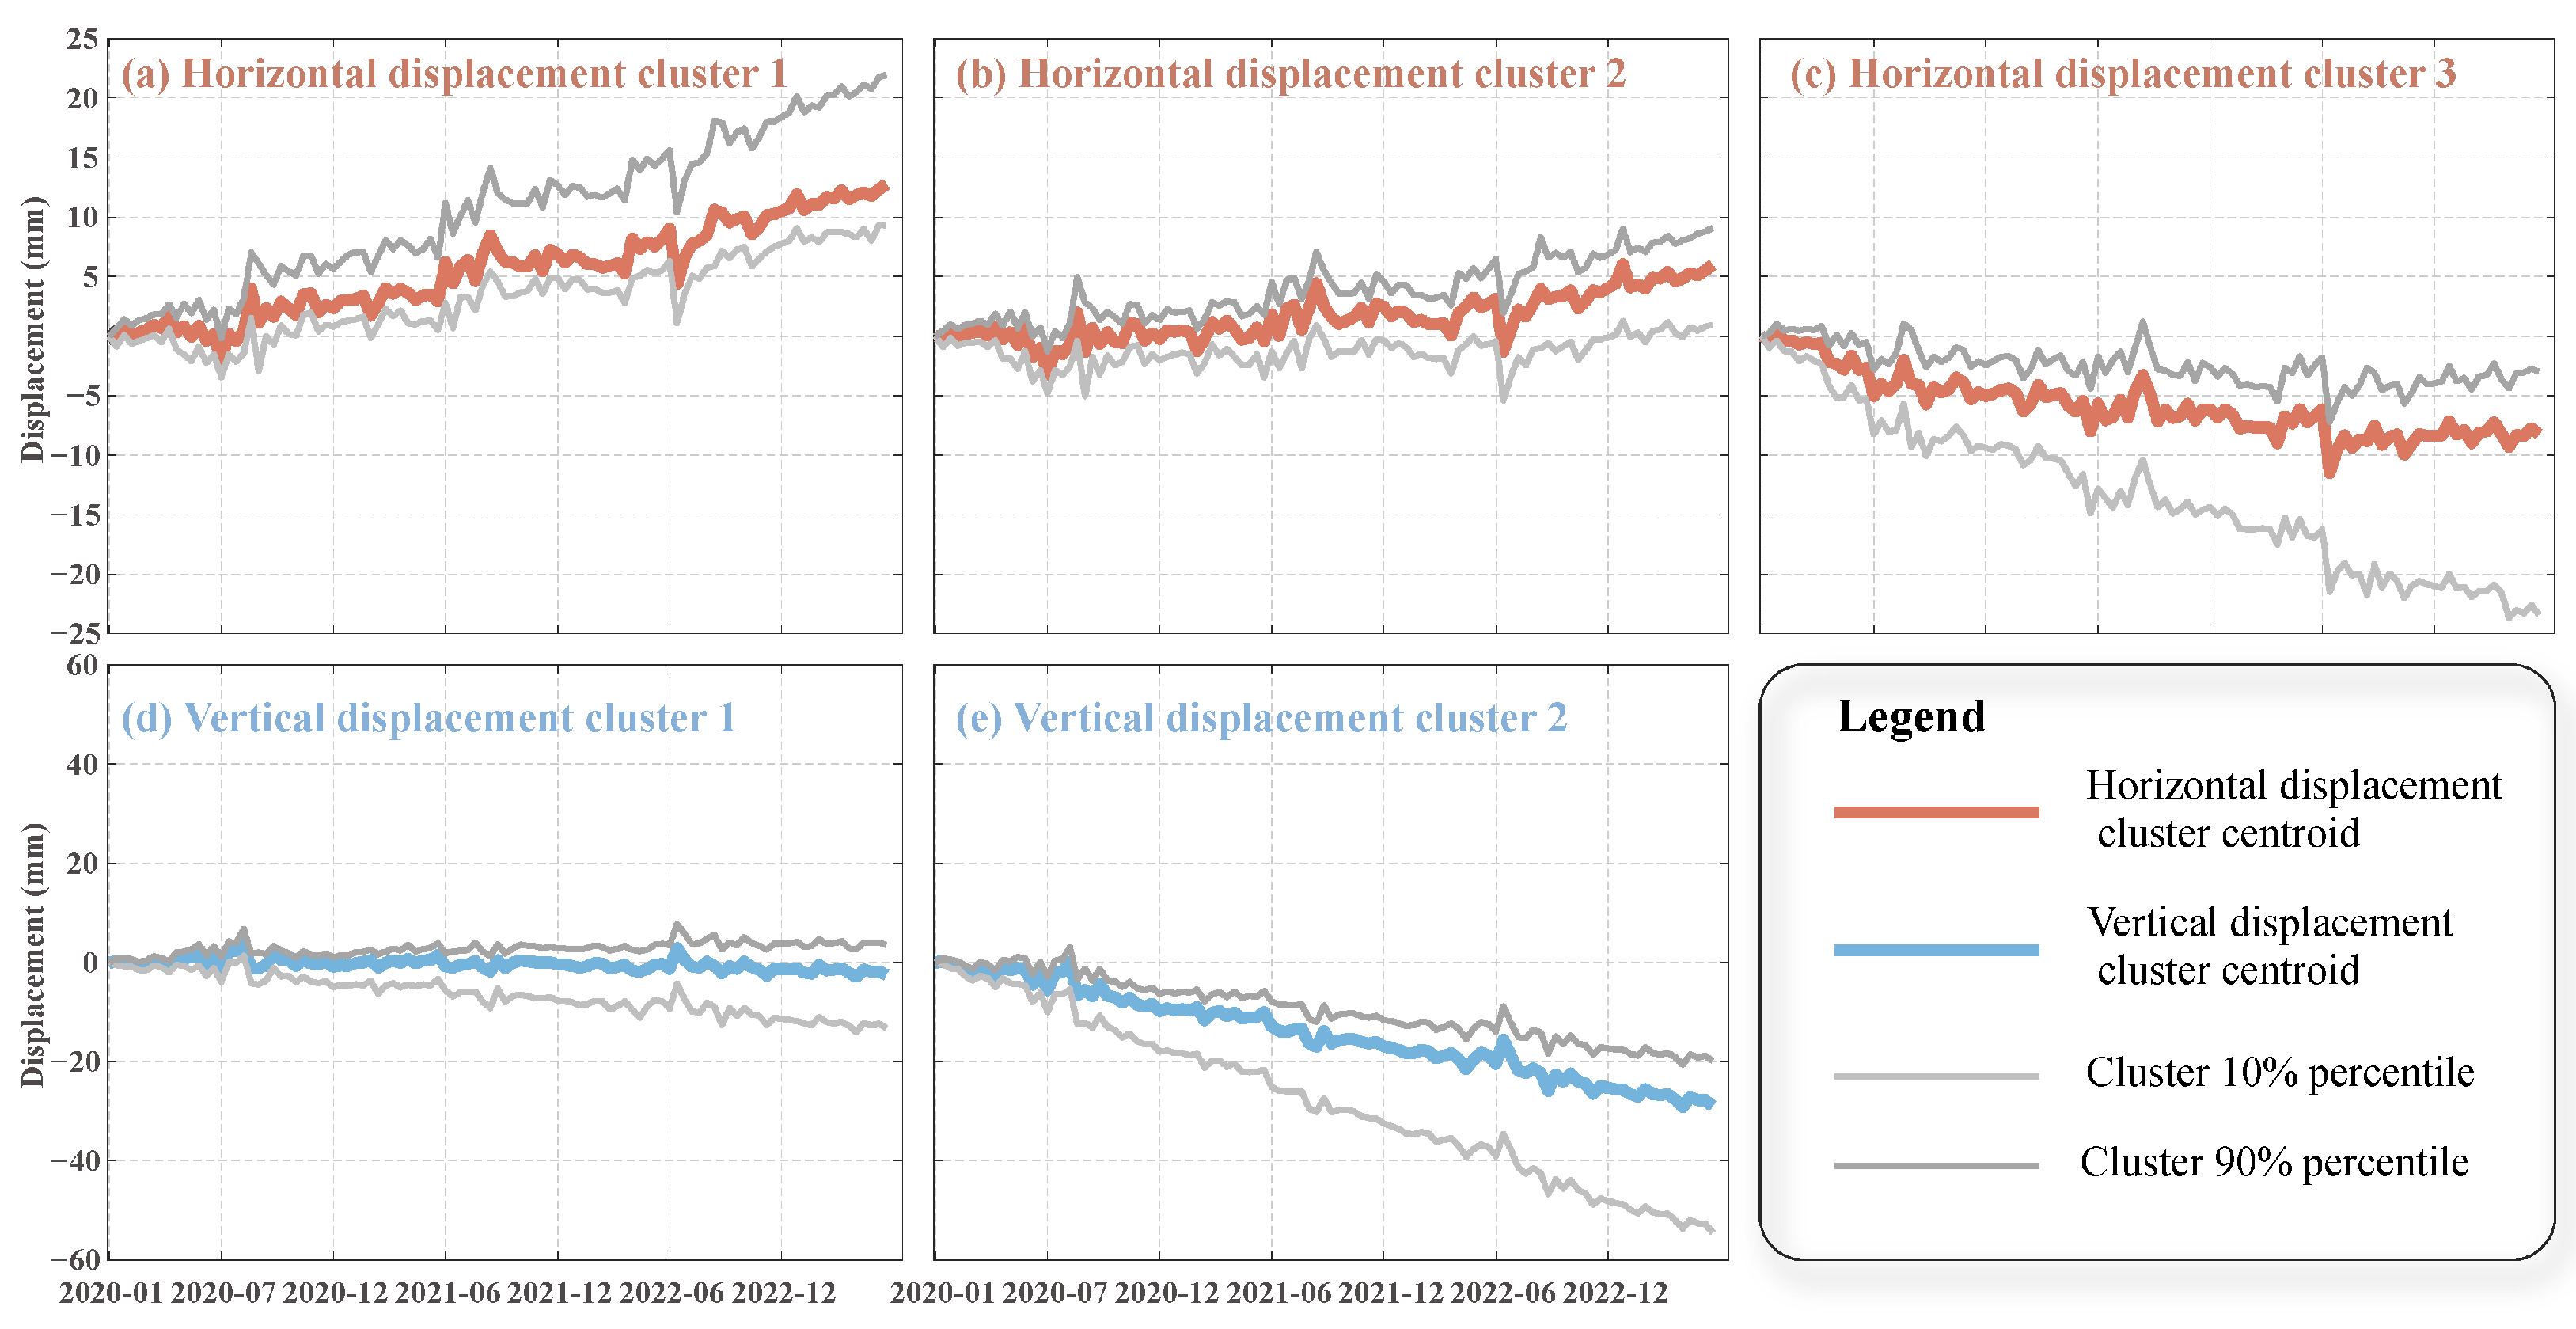
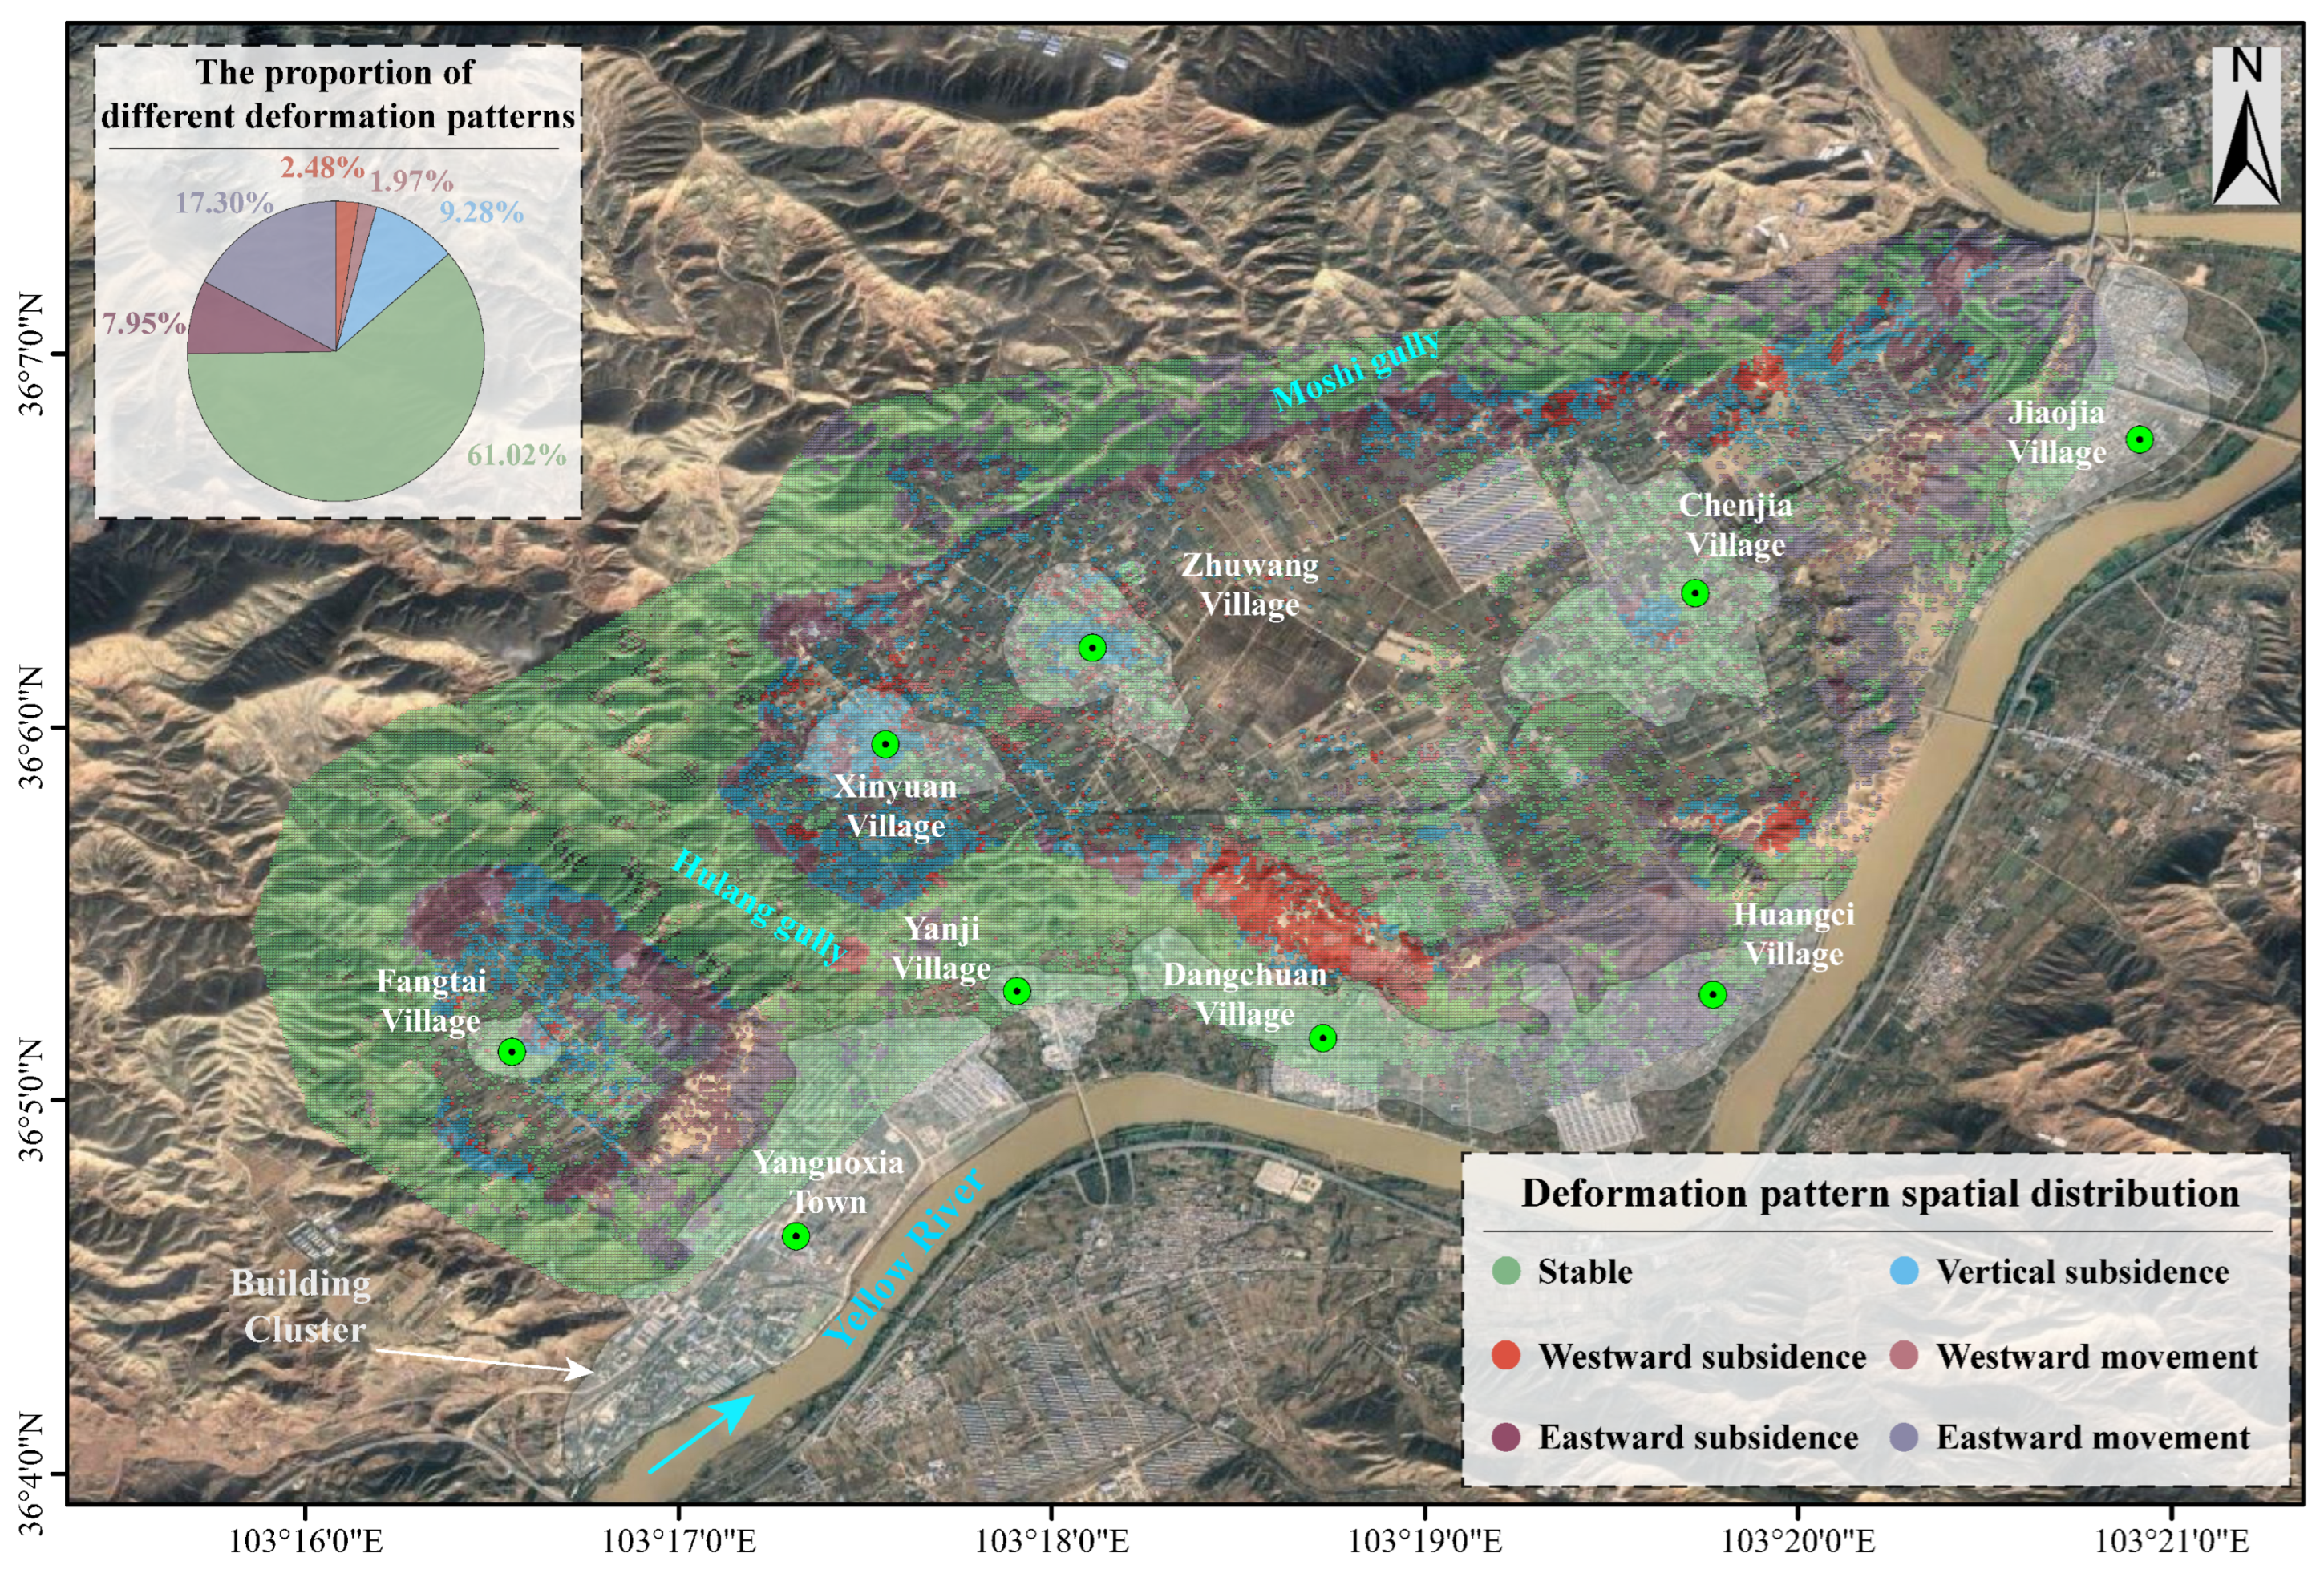
- A total of 77,292 two-dimensional deformation time series MPs for the Heifangtai terrace were calculated using MSBAS. Further analysis using PCA and K-Means revealed five coexisting deformation patterns: eastward subsidence, westward subsidence, vertical subsidence, eastward movement, and westward movement, with subsidence deformation signals being notably stronger than horizontal movements. The spatial distribution of deformation patterns indicates that continuous monitoring of the slopes near Yanguoxia Town and Dangchuan Village should be strengthened in the future.
- (3)
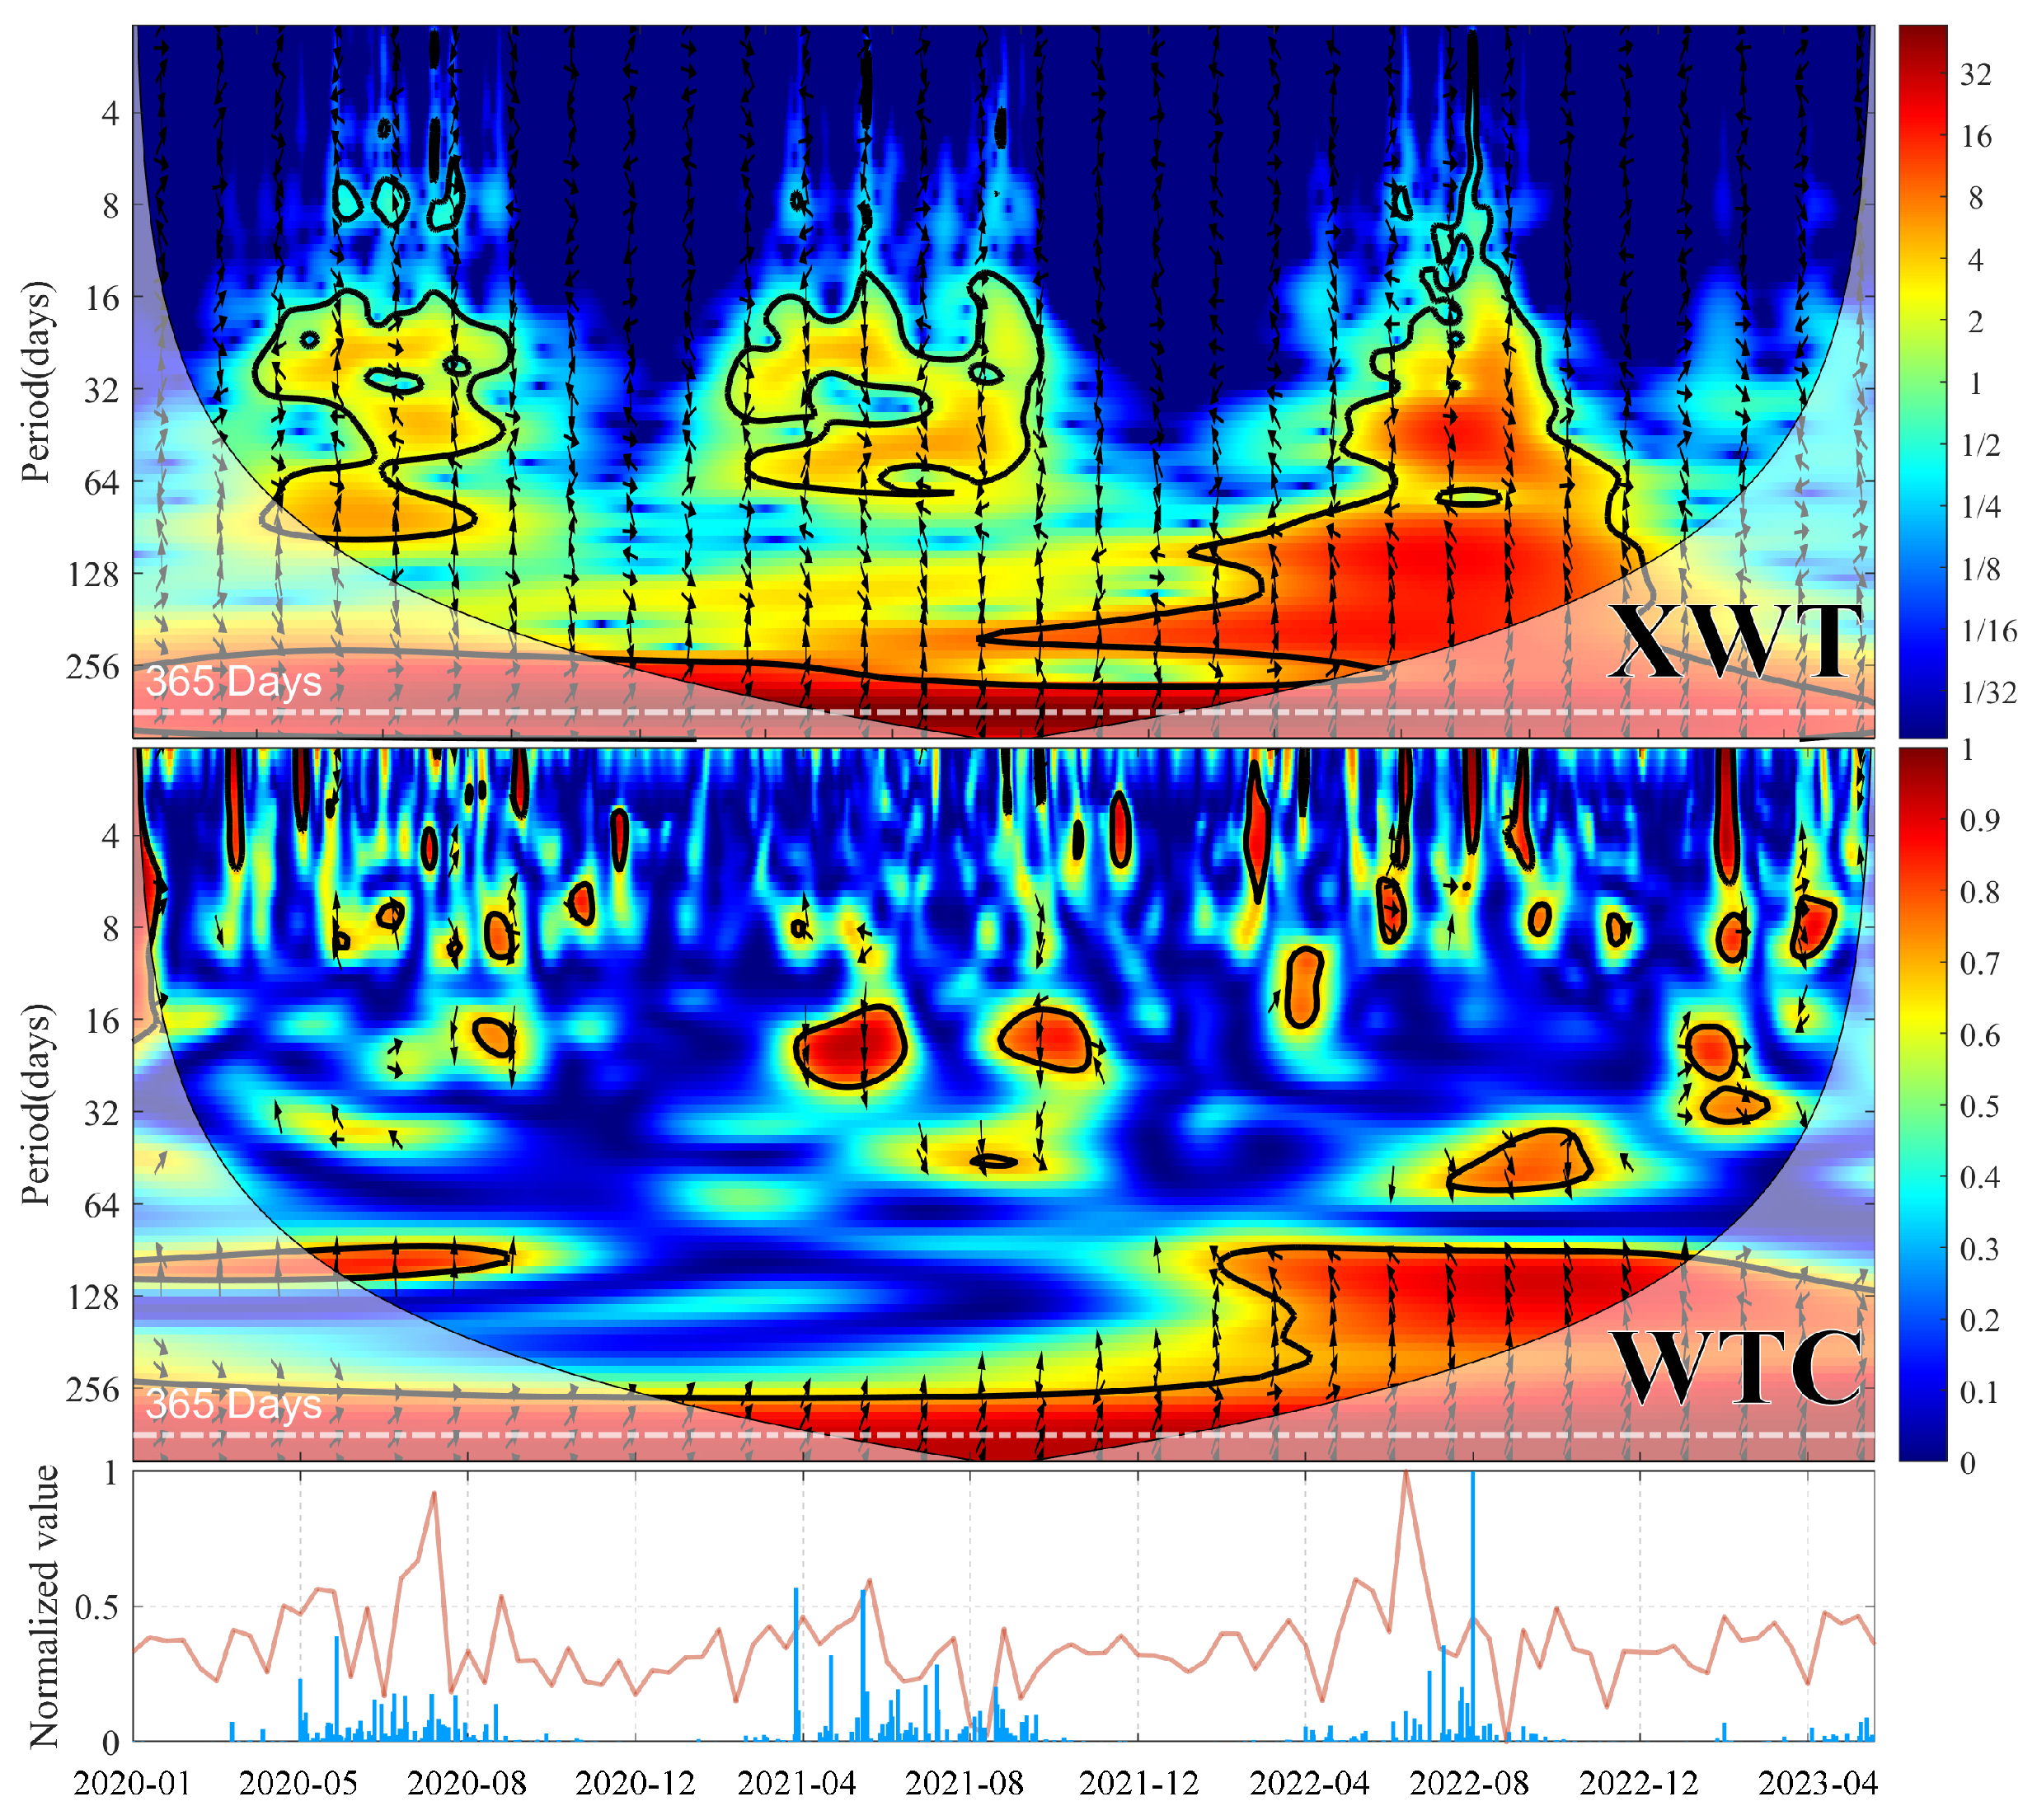
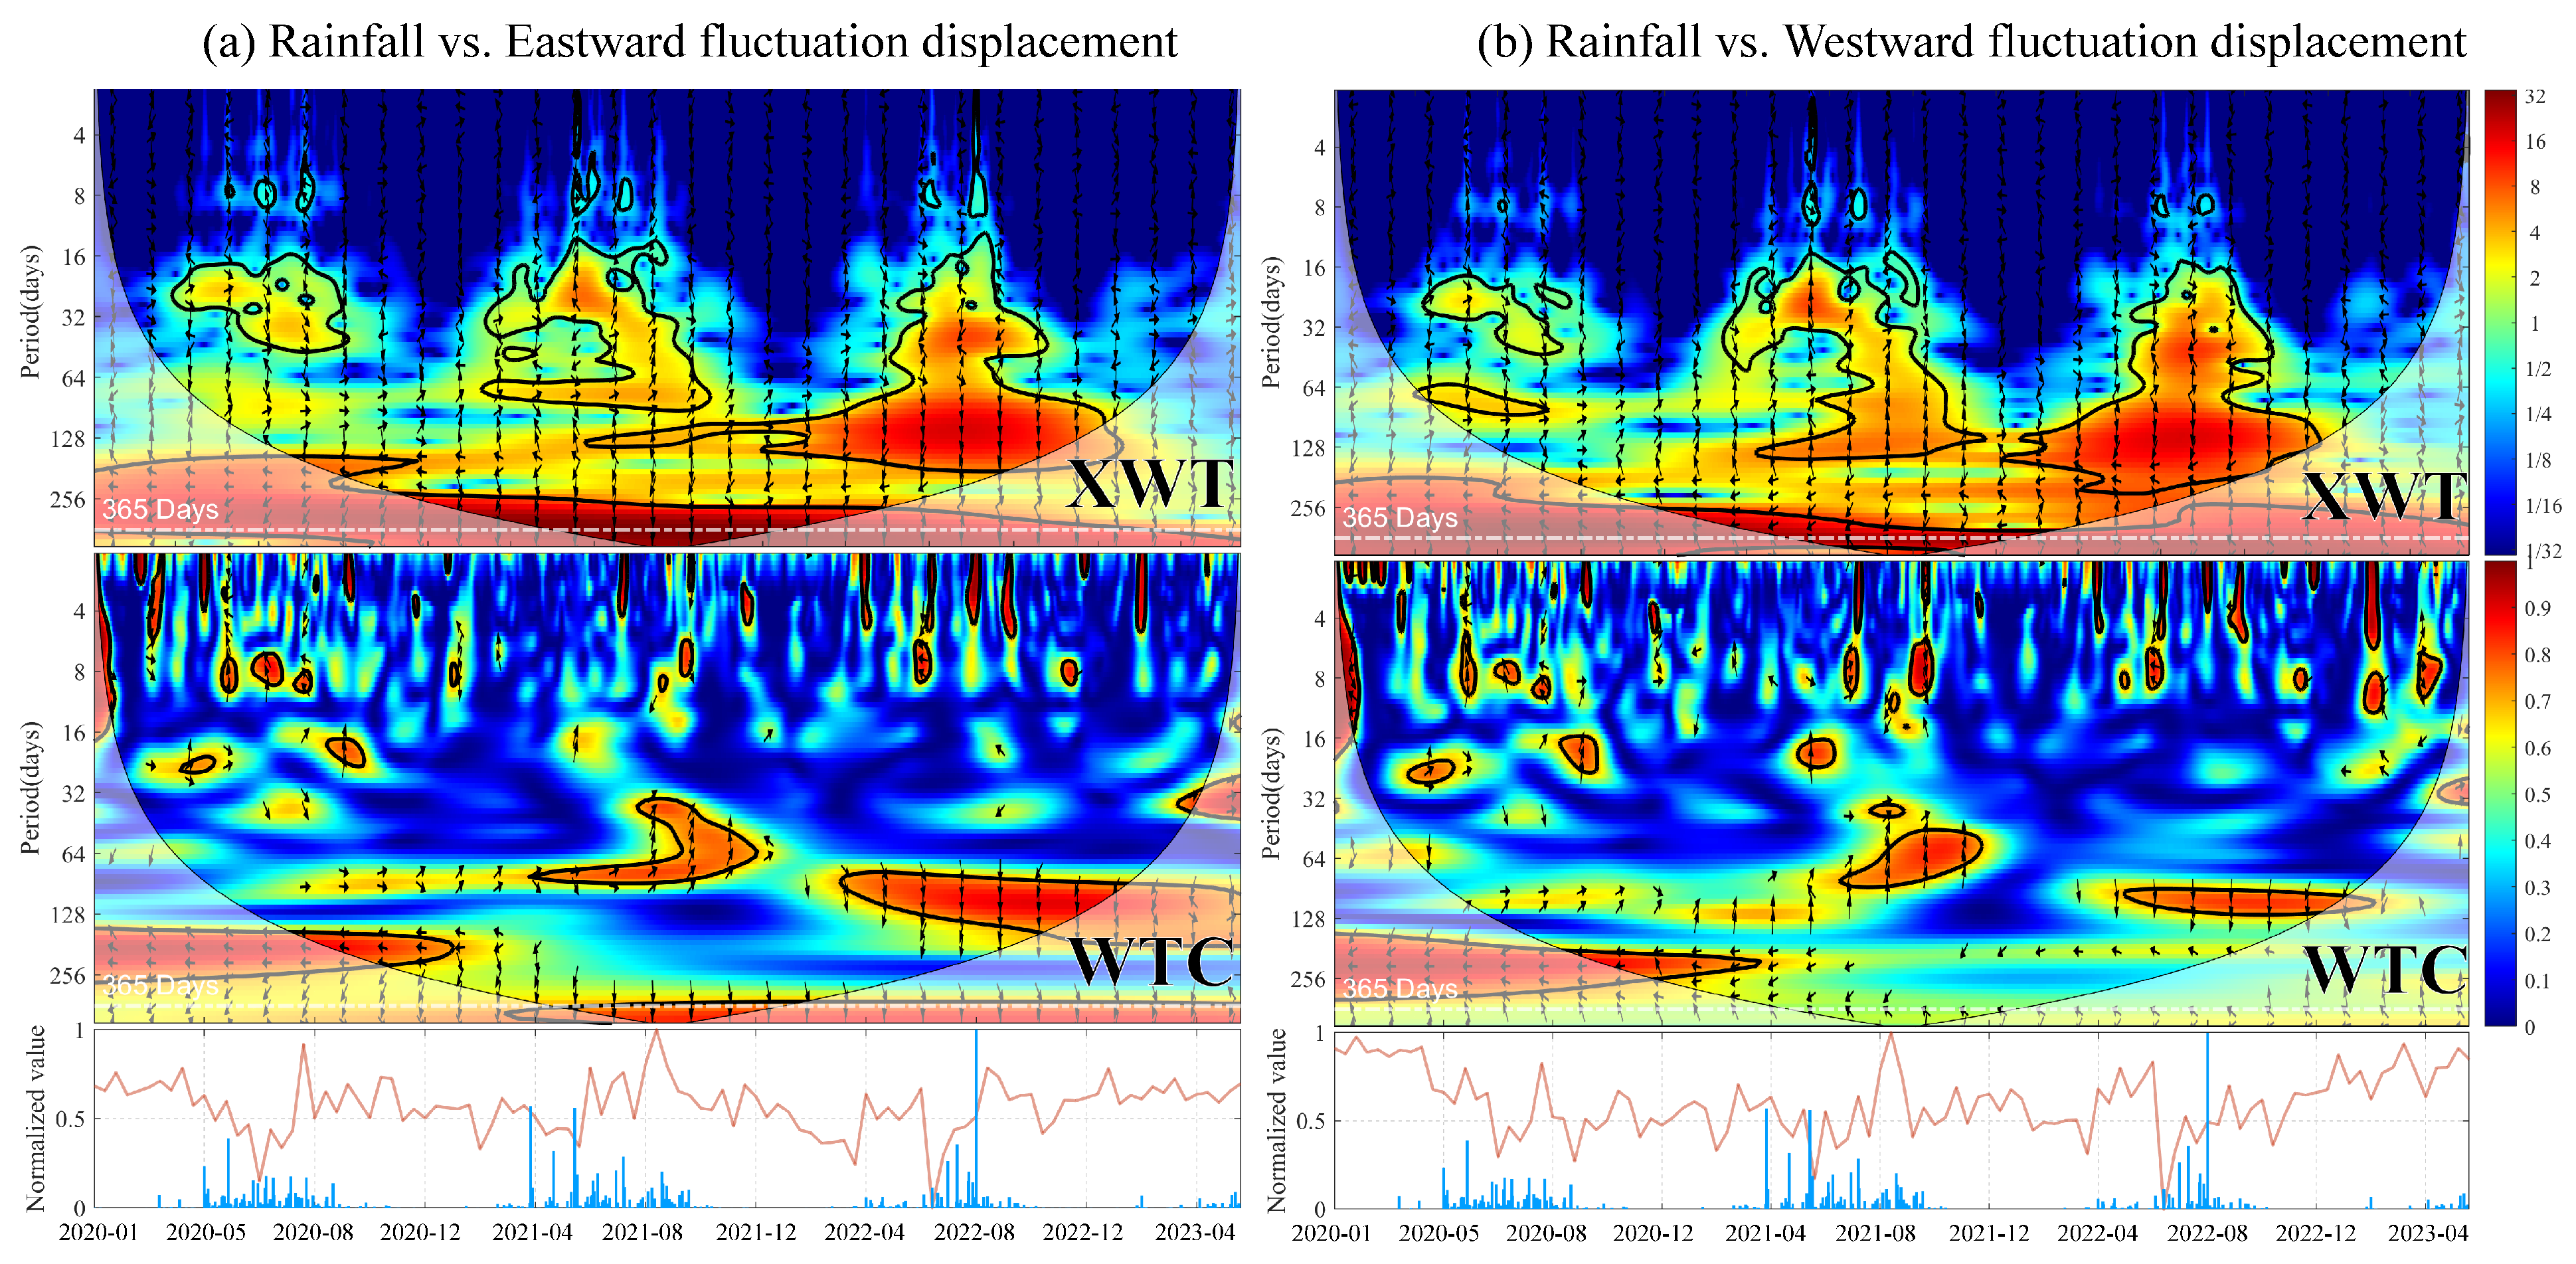
- Wavelet tools were employed to analyze the response relationships between rainfall and various deformation patterns, further deepening the understanding of surface deformation patterns. The fluctuation displacements of different deformation patterns exhibited significant common power within a one-year period, with subsidence deformation showing a negative correlation with rainfall, lagging approximately 45 days behind the rainfall. In contrast, the east–west horizontal deformation did not exhibit such a strong relative phase relationship with rainfall.
Author Contributions
Funding
Data Availability Statement
Acknowledgments
Conflicts of Interest
References
- Derbyshire, E. Geological hazards in loess terrain, with particular reference to the loess regions of China. Earth-Sci. Rev. 2001, 54, 231–260. [Google Scholar] [CrossRef]
- Zhuang, J.; Peng, J.; Wang, G.; Javed, I.; Wang, Y.; Li, W. Distribution and characteristics of landslide in Loess Plateau: A case study in Shaanxi province. Eng. Geol. 2018, 236, 89–96. [Google Scholar] [CrossRef]
- Zhao, C.; Liu, X.; Zhang, Q.; PENG, J.; XU, Q. Research on loess landslide identification, monitoring and failure mode with InSAR technique in Heifangtai, Gansu. Geomat. Inf. Sci. Wuhan Univ. 2019, 44, 996–1007. [Google Scholar]
- Cui, S.h.; Pei, X.j.; Wu, H.y.; Huang, R.q. Centrifuge model test of an irrigation-induced loess landslide in the Heifangtai loess platform, Northwest China. J. Mt. Sci. 2018, 15, 130–143. [Google Scholar] [CrossRef]
- Zhou, Q.; Xu, Q.; Peng, D.; Fan, X.; Ouyang, C.; Zhao, K.; Li, H.; Zhu, X. Quantitative spatial distribution model of site-specific loess landslides on the Heifangtai terrace, China. Landslides 2021, 18, 1163–1176. [Google Scholar] [CrossRef]
- Yang, D.; Qiu, H.; Hu, S.; Zhu, Y.; Cui, Y.; Du, C.; Liu, Z.; Pei, Y.; Cao, M. Spatiotemporal distribution and evolution characteristics of successive landslides on the Heifangtai tableland of the Chinese Loess Plateau. Geomorphology 2021, 378, 107619. [Google Scholar] [CrossRef]
- Xu, L.; Dai, F.; Tu, X.; Tham, L.G.; Zhou, Y.; Iqbal, J. Landslides in a loess platform, North-West China. Landslides 2014, 11, 993–1005. [Google Scholar] [CrossRef]
- Kong, J.; Zhuang, J.; Peng, J.; Ma, P.; Zhan, J.; Mu, J.; Wang, J.; Zhang, D.; Zheng, J.; Fu, Y.; et al. Failure mechanism and movement process of three loess landslides due to freeze-thaw cycle in the Fangtai village, Yongjing County, Chinese Loess Plateau. Eng. Geol. 2023, 315, 107030. [Google Scholar] [CrossRef]
- Zhang, F.; Wang, G.; Peng, J. Initiation and mobility of recurring loess flowslides on the Heifangtai irrigated terrace in China: Insights from hydrogeological conditions and liquefaction criteria. Eng. Geol. 2022, 302, 106619. [Google Scholar] [CrossRef]
- Qi, X.; Xu, Q.; Liu, F. Analysis of retrogressive loess flowslides in Heifangtai, China. Eng. Geol. 2018, 236, 119–128. [Google Scholar] [CrossRef]
- Zhang, F.; Wang, G. Effect of irrigation-induced densification on the post-failure behavior of loess flowslides occurring on the Heifangtai area, Gansu, China. Eng. Geol. 2018, 236, 111–118. [Google Scholar] [CrossRef]
- Xu, Q.; Peng, D.; Zhang, S.; Zhu, X.; He, C.; Qi, X.; Zhao, K.; Xiu, D.; Ju, N. Successful implementations of a real-time and intelligent early warning system for loess landslides on the Heifangtai terrace, China. Eng. Geol. 2020, 278, 105817. [Google Scholar] [CrossRef]
- Cigna, F.; Bianchini, S.; Casagli, N. How to assess landslide activity and intensity with Persistent Scatterer Interferometry (PSI): The PSI-based matrix approach. Landslides 2013, 10, 267–283. [Google Scholar] [CrossRef]
- Bürgmann, R.; Rosen, P.A.; Fielding, E.J. Synthetic aperture radar interferometry to measure Earth’s surface topography and its deformation. Annu. Rev. Earth Planet. Sci. 2000, 28, 169–209. [Google Scholar] [CrossRef]
- Samsonov, S.V.; d’Oreye, N. Multidimensional small baseline subset (MSBAS) for two-dimensional deformation analysis: Case study Mexico City. Can. J. Remote Sens. 2017, 43, 318–329. [Google Scholar] [CrossRef]
- Samsonov, S.; Dille, A.; Dewitte, O.; Kervyn, F.; d’Oreye, N. Satellite interferometry for mapping surface deformation time series in one, two and three dimensions: A new method illustrated on a slow-moving landslide. Eng. Geol. 2020, 266, 105471. [Google Scholar] [CrossRef]
- Liu, X.; Zhao, C.; Zhang, Q.; Peng, J.; Zhu, W.; Lu, Z. Multi-temporal loess landslide inventory mapping with C-, X-and L-band SAR datasets—A case study of Heifangtai Loess Landslides, China. Remote Sens. 2018, 10, 1756. [Google Scholar] [CrossRef]
- Liu, X.; Zhao, C.; Zhang, Q.; Yang, C.; Zhu, W. Heifangtai loess landslide type and failure mode analysis with ascending and descending Spot-mode TerraSAR-X datasets. Landslides 2020, 17, 205–215. [Google Scholar] [CrossRef]
- Shi, X.; Xu, Q.; Zhang, L.; Zhao, K.; Dong, J.; Jiang, H.; Liao, M. Surface displacements of the Heifangtai terrace in Northwest China measured by X and C-band InSAR observations. Eng. Geol. 2019, 259, 105181. [Google Scholar] [CrossRef]
- Rygus, M.; Novellino, A.; Hussain, E.; Syafiudin, F.; Andreas, H.; Meisina, C. A clustering approach for the analysis of InSAR Time Series: Application to the Bandung Basin (Indonesia). Remote Sens. 2023, 15, 3776. [Google Scholar] [CrossRef]
- Wang, G.; Li, P.; Li, Z.; Liang, C.; Wang, H. Coastal subsidence detection and characterization caused by brine mining over the Yellow River Delta using time series InSAR and PCA. Int. J. Appl. Earth Obs. Geoinf. 2022, 114, 103077. [Google Scholar] [CrossRef]
- Zhu, K.; Zhang, X.; Sun, Q.; Wang, H.; Hu, J. Characterizing spatiotemporal patterns of land deformation in the Santa Ana Basin, Los Angeles, from InSAR time series and independent component analysis. Remote Sens. 2022, 14, 2624. [Google Scholar] [CrossRef]
- Festa, D.; Novellino, A.; Hussain, E.; Bateson, L.; Casagli, N.; Confuorto, P.; Del Soldato, M.; Raspini, F. Unsupervised detection of InSAR time series patterns based on PCA and K-means clustering. Int. J. Appl. Earth Obs. Geoinf. 2023, 118, 103276. [Google Scholar] [CrossRef]
- Jolliffe, I.T.; Cadima, J. Principal component analysis: A review and recent developments. Philos. Trans. R. Soc. A Math. Phys. Eng. Sci. 2016, 374, 20150202. [Google Scholar] [CrossRef]
- Jiang, M.; Yong, B.; Tian, X.; Malhotra, R.; Hu, R.; Li, Z.; Yu, Z.; Zhang, X. The potential of more accurate InSAR covariance matrix estimation for land cover mapping. ISPRS J. Photogramm. Remote Sens. 2017, 126, 120–128. [Google Scholar] [CrossRef]
- Jiang, M.; Guarnieri, A.M. Distributed scatterer interferometry with the refinement of spatiotemporal coherence. IEEE Trans. Geosci. Remote Sens. 2020, 58, 3977–3987. [Google Scholar] [CrossRef]
- Yu, C.; Penna, N.T.; Li, Z. Generation of real-time mode high-resolution water vapor fields from GPS observations. J. Geophys. Res. Atmos. 2017, 122, 2008–2025. [Google Scholar] [CrossRef]
- Yu, C.; Li, Z.; Penna, N.T.; Crippa, P. Generic atmospheric correction model for interferometric synthetic aperture radar observations. J. Geophys. Res. Solid Earth 2018, 123, 9202–9222. [Google Scholar] [CrossRef]
- Yu, C.; Li, Z.; Penna, N.T. Interferometric synthetic aperture radar atmospheric correction using a GPS-based iterative tropospheric decomposition model. Remote Sens. Environ. 2018, 204, 109–121. [Google Scholar] [CrossRef]
- Chaussard, E.; Farr, T.G. A new method for isolating elastic from inelastic deformation in aquifer systems: Application to the San Joaquin Valley, CA. Geophys. Res. Lett. 2019, 46, 10800–10809. [Google Scholar] [CrossRef]
- Pedregosa, F.; Varoquaux, G.; Gramfort, A.; Michel, V.; Thirion, B.; Grisel, O.; Blondel, M.; Prettenhofer, P.; Weiss, R.; Dubourg, V.; et al. Scikit-learn: Machine learning in Python. J. Mach. Learn. Res. 2011, 12, 2825–2830. [Google Scholar]
- Satopaa, V.; Albrecht, J.; Irwin, D.; Raghavan, B. Finding a “kneedle” in a haystack: Detecting knee points in system behavior. In Proceedings of the 2011 31st International Conference on Distributed Computing Systems Workshops, Minneapolis, MN, USA, 20–24 June 2011; pp. 166–171. [Google Scholar]
- Xu, Q.; Ding, C.; Liu, J.; Luo, B. PCA-guided search for K-means. Pattern Recognit. Lett. 2015, 54, 50–55. [Google Scholar] [CrossRef]
- Grinsted, A.; Moore, J.C.; Jevrejeva, S. Application of the cross wavelet transform and wavelet coherence to geophysical time series. Nonlinear Process. Geophys. 2004, 11, 561–566. [Google Scholar] [CrossRef]
- Tomás, R.; Li, Z.; Lopez-Sanchez, J.M.; Liu, P.; Singleton, A. Using wavelet tools to analyse seasonal variations from InSAR time-series data: A case study of the Huangtupo landslide. Landslides 2016, 13, 437–450. [Google Scholar] [CrossRef]
- Dai, K.; Chen, Y.; Xu, Q.; Hancock, C.; Jiang, M.; Deng, J.; Zhuo, G. A functional model for determining maximum detectable deformation gradients of InSAR considering the topography in mountainous areas. IEEE Trans. Geosci. Remote Sens. 2023, 61, 5211211. [Google Scholar] [CrossRef]
- Mirzaee, S.; Amelung, F.; Fattahi, H. Non-linear phase linking using joined distributed and persistent scatterers. Comput. Geosci. 2023, 171, 105291. [Google Scholar] [CrossRef]
- Manjusree, P.; Roy, A.; Martha, T.; Rajkumar, R.; Bhatwdekar, S. The NISAR Mission for Enhanced Disaster Monitoring. In Proceedings of the 2021 IEEE International India Geoscience and Remote Sensing Symposium (InGARSS), Virtual, 6–10 December 2021; pp. 332–335. [Google Scholar]


| Orbit Direction | Ascending | Descending |
|---|---|---|
| Track | 128 | 135 |
| Incidence angle () | 43.80 | 33.75 |
| Azimuth angle () | ||
| Resolution (azimuth × range) | 13.9 m × 2.3 m | 13.9 m × 2.3 m |
| Number of images | 98 | 97 |
| Time spans | 4 January 2020∼5 June 2023 | |
Disclaimer/Publisher’s Note: The statements, opinions and data contained in all publications are solely those of the individual author(s) and contributor(s) and not of MDPI and/or the editor(s). MDPI and/or the editor(s) disclaim responsibility for any injury to people or property resulting from any ideas, methods, instructions or products referred to in the content. |
© 2025 by the authors. Licensee MDPI, Basel, Switzerland. This article is an open access article distributed under the terms and conditions of the Creative Commons Attribution (CC BY) license (https://creativecommons.org/licenses/by/4.0/).
Share and Cite
Xu, H.; Shu, B.; Zhang, Q.; Xiong, G.; Wang, L. Combining InSAR and Time-Series Clustering to Reveal Deformation Patterns of the Heifangtai Loess Terrace. Remote Sens. 2025, 17, 429. https://doi.org/10.3390/rs17030429
Xu H, Shu B, Zhang Q, Xiong G, Wang L. Combining InSAR and Time-Series Clustering to Reveal Deformation Patterns of the Heifangtai Loess Terrace. Remote Sensing. 2025; 17(3):429. https://doi.org/10.3390/rs17030429
Chicago/Turabian StyleXu, Hao, Bao Shu, Qin Zhang, Guohua Xiong, and Li Wang. 2025. "Combining InSAR and Time-Series Clustering to Reveal Deformation Patterns of the Heifangtai Loess Terrace" Remote Sensing 17, no. 3: 429. https://doi.org/10.3390/rs17030429
APA StyleXu, H., Shu, B., Zhang, Q., Xiong, G., & Wang, L. (2025). Combining InSAR and Time-Series Clustering to Reveal Deformation Patterns of the Heifangtai Loess Terrace. Remote Sensing, 17(3), 429. https://doi.org/10.3390/rs17030429