Abstract
In this study, we present an innovative methodology for the identification of giant aerosols using cloud radar. The methodology makes use of several insects studies in order to separate radar-derived atmospheric plankton signatures into the contributions of insects and giant aerosols. The methodology is then applied to a 6-year-long cloud radar dataset in Potenza, South Italy. Forty giant aerosol events per year were found, which is in good agreement with the site’s climatological record. A sensitivity study on the effects of the giant aerosols on three atmospheric variables and under different atmospheric stability conditions showed that the presence of giant aerosols (a) increased the aerosol optical depth in all the atmospheric stability conditions, (b) decreased the Ångström exponent for the highest and lowest stability conditions and had the opposite effect for the intermediate stability condition, and (c) increased the accumulated precipitation in all the atmospheric conditions, especially in the most unstable ones.
1. Introduction
Aerosols affect the meteorological and climate system in many ways: by interacting with solar radiation through absorption, scattering and emission; by acting as cloud condensation nuclei (CCN) and ice nuclei (IN), upon which cloud droplets and ice crystals form; and by carrying nutrients to oligotrophic ecosystems, such as oceans. Moreover, they also have a large impact on human health by causing or enhancing respiratory, cardiovascular, infectious, and allergic diseases [1] and can affect air transport, as happened during the spring of 2010, when the Eyjafjallajökull volcano eruption in Iceland caused an enormous disruption to air traffic across Western and Northern Europe [2].
Aerosol sizes range from few nanometers to tenths of micrometers, can be of natural or anthropogenic origin, and have different compositions. The aerosols’ effects and importance depend on their concentration and characteristics. Cloud condensation nuclei (CCN) and ice nuclei (IN) particles determine, to a large extent, cloud microstructure and, consequently, cloud albedo and the dynamic response of clouds to aerosol-induced changes to precipitation [3]. The aerosol size distribution, and in particular the availability of giant CCN (GCCN), has a major impact on cloud development and rain formation [4]. By acting as GCCN, giant (>1 m radius) and ultragiant particles (>2.5 m radius) can determine the concentration of the initial cloud droplets, the cloud’s albedo and lifetime, and the precipitation formation, expediting especially warm rain processes [5,6]. In addition, depending on their composition, they can also act as IN. Mineral dust, for instance, is efficient IN [7], with the bigger particles with larger surface areas being the first to nucleate [8]. In a cloud seeding experiment by Ghate et al. [9], it was found that although the giant nuclei introduced into a cloud were only a small fraction of the total aerosols, they dominated the cloud response. In addition, during a field campaign in Barbados (BACEX, March–April 2010), it was found that during dusty periods, aerosol concentrations increased substantially in the size range between 0.5 and 10 m (diameter) [10], which might have an important impact on aerosol–cloud–precipitation interactions, because the most effective GCCN size lies within this range [10,11,12]. Nevertheless, other studies have reported a minor or no effect of GCCN on the initiation of rain in warm convective clouds, i.e., [13,14,15].
Although aerosol LiDAR and photometer are the main instruments in aerosol monitoring, they do not account for giant and ultragiant aerosols bigger than a few microns. Specifically, given the operating wavelengths of these two instruments, the retrieval of microphysical properties by Raman LiDAR is limited to 10 m [16], whereas, similarly, sun photometers have a 15 m cutoff [17]. Giant dust particles have been observed at great distances from their source: van der Does et al. [18], for example, reported observations of individual giant Saharan dust particles of up to 450 m in diameter sampled in air over the Atlantic Ocean at 2400 and 3500 km from the West African coast. In Europe, giant dust particles were found >4000 km from their Saharan source by using sediment traps [19], and dust particles up to 300 m in diameter were sampled during aircraft campaigns over Northwest Africa [20]. Therefore, the complete distribution and impact in the atmosphere and climate of these particles is not well known, and the aerosol transport models largely underestimate them [21]. Conversely, cloud radars can complement the existing gap and detect giant (>1 m radius) and ultragiant (>2.5 m radius) particles, and even though we have not found in the literature dust giant particle observations made by cloud radars at a long distance from the source, a Ka-band cloud radar detected volcanic ultragiant particles far from the source [22], with observed values of radar reflectivity that are consistent with a particle effective radius larger than 50–75 m [23].
In this work, we present an approach to separate radar-derived atmospheric plankton signatures into the contributions of insects and non-insects. Thereby, the non-insect component is defined as giant aerosol. This innovative methodology is developed on the basis of entomology studies to discriminate the contribution of insects from aerosol in the low troposphere.
The instrumentation and the methodology are presented in Section 2. In Section 3, the methodology is applied to 6 years of continuous measurements, where the effects of giant aerosols are studied by comparing different atmospheric variables under different atmospheric stability conditions. The paper closes with conclusions and suggestions for further applications and improvements.
2. Materials and Methods
2.1. Instruments
This study was carried out at the CNR-IMAA Atmospheric Observatory (CIAO, www.ciao.imaa.cnr.it, accessed on 20 November 2024), located in Tito Scalo, Potenza, Southern Italy, on the Apennine mountains (°N, °E), 760 m above sea level (a.s.l.), less than 150 km from the west, south, and east coasts [24]. The site is on a plain surrounded by low mountains (<1300 m a.s.l.) and has a coastal Mediterranean climate (Köppen type Csb), characterized by dry, warm summers and wet, cold winters. The site is of particular interest for studying aerosol properties because it is affected by quite a large number of Saharan dust intrusions per year [25] and it is located 300 km away from the Etna volcano [26].
The main instrument used in this study is a Ka-band Doppler radar. Ancillary data acquired by other instruments, such as a microwave radiometer and a weather station, as well as the output of a numerical weather prediction (NWP) model, were also used to achieve the purposes of this study.
A millimeter-wavelength cloud radar (MIRA36) from METEK GmbH has been operating at CIAO since March 2009. It is a mono static magnetron-based pulsed Ka-band Doppler radar operating at mm wavelength; it has a sensitivity of −55 dBZ at 1 km and −40.3 dBZ at 5 km [24]. According to its configuration, the time and range resolution are 10 s and 30 m, respectively. A linearly polarized signal is transmitted, while co- and cross-polarized signals are received simultaneously to detect Doppler spectra and the linear depolarization ratio (LDR). From the Doppler spectra, the signal-to-noise ratio (SNR), the Doppler velocity (VEL), the peak width (RMS), and the equivalent reflectivity (Z) are retrieved.
Measurements from three additional ground-based remote sensing instruments, a microwave radiometer profiler (MWR), a ceilometer, and a sun photometer are used. The MWR (MP3014 from Radiometrics) measures the sky brightness temperature (BT) at 12 frequencies; the inversion of this quantity provides temperature, humidity, and cloud liquid water profiles up to 10 km as well as an estimation of the integrated water vapor (IWV) and the cloud liquid water path (LWP) [24]. The ceilometer (CT25K from VAISALA) is continuously measuring the cloud base height and the signal backscattered by atmospheric particles at 905 nm up to km [24]. The sun photometer (CE-318 from CIMEL) measures the direct solar irradiance and sky radiance at Earth’s surface. It is operational within the AERosol RObotic NETwork (AERONET), performs columnar measurements, and one of its main products is the multi-wavelength aerosol optical depth (AOD), which can be used to estimate the aerosol size distribution [24].
In situ measurements are used as well: standard surface variables (pressure, temperature, humidity and wind) are routinely monitored using the MILOS520 Automatic Weather Station [24], while radiosounding observations of temperature, pressure, humidity, and winds are considered when available.
Moreover, data outputs from the European Centre for Medium-Range Weather Forecasts (ECMWF) Integrated Forecast System Model, with an horizontal resolution of 39 km, 60 vertical levels, and a forecast temporal range between 12 and 35 h, are also used in this study.
2.2. Cloud Radar Aerosols Observation
In this study, giant aerosols are observed by cloud radar in a systematic way and for a long time period. In this section, first, the radar equations are presented. Afterwards, we use scattering simulations to determine the sizes of the atmospheric particles that can be detected by the cloud radar according to its sensitivity. Finally, we present the novel methodology that has been developed to detect giant aerosol particles by using the MIRA36 cloud radar.
2.2.1. Radar Equations
The radar reflectivity Z depends on the number and size of the atmospheric particles. However, the most commonly used parameter is the radar equivalent reflectivity factor . In the following, the radar equation and the definition of the radar equivalent reflectivity factor are presented.
The radar equation for a point target is
where is the received power, is the transmitted power, is the antenna gain, is the normalized antenna pattern, is the radar wavelength, L is the power loss introduced by the components between the antenna and the low noise amplifier (LNA), R is the distance to the target, and is the radar backscattering cross-section of the target.
The radar equation for the mean power for volume filling distributed targets is
where V is the radar resolution volume. The radar reflectivity is used instead of the backscattering cross-section:
Then, assuming that the radar reflectivity is uniform within the radar resolution volume and substituting , we obtain
Introducing the equivalent radar resolution volume at the distance R, , the radar equation for a distributed target is
The equivalence between the radar reflectivity and the radar equivalent reflectivity factor is
where is the dielectric constant of the observed target. For the MIRA36 cloud radar, the dielectric constant used is the one relative to water, which is , with an estimated maximum error of and an influence on of dB [27]. As the dielectric constant affects the results and its value for dust at GHz is unknown, the uncertainty introduced by this could be high.
Assuming that the Rayleigh approximation is valid and all the targets are spherical, :
where N corresponds to the number of particles and D to their diameter. It is usually expressed in dBZ, decibel relative to Z, with Z being measured in mm6 m−3.
Finally, using the radar equation can be written as
For simplicity, in this study the radar equivalent reflectivity factor will be denominated as reflectivity Z.
Regarding the radar polarization measurements, the LDR gives an indication of the asphericity of the targets, is usually expressed in dB, and is calculated as the ratio between the power received in the cross-polarized channel and in the co-polarized channel:
2.2.2. Scattering Simulations and Sensitivity Limits
The cloud radar operating wavelength determines the atmospheric constituents it can detect. Since most airborne aerosols are smaller than cloud droplets or rain drops, it is important to quantify the radar capability to detect aerosols with different particle effective radii.
The interaction of electromagnetic radiation with a particle cannot be solved analytically; therefore, accurate calculations for real particles are difficult. Moreover, these interactions are conditioned by many different parameters, such as the wavelength of the radiation, size, shape, composition, and roughness of the particle and its complex refractive index. Nevertheless, good results can be obtained by approximating the particles using simplified shapes such as homogeneous spheres and spheroids. The Mie theory describes the scattering using the spherical approximation, which is valid for many categories of real particles, such as urban and sea-salt particles. Many of the particles, though, cannot be accounted for as spheres, and for those, the Mie theory does not give satisfactory results. This is the case for mineral dust and volcanic ash. Several approaches have been proposed to model the optical properties of such particles. The most widely used approach is to approximate the aerosol population by a mixture of randomly oriented spheroids [28,29]. While the true shape of the atmospheric aerosols is probably not spheroidal, the light scattered by an ensemble of particles with random orientations and shapes makes the individual scattering characteristics of each particle less pronounced.
In the specific case of non-spherical particles with rotational symmetry scattering field calculation, the T-matrix approach is especially suited [30]. The T-matrix method is based on the expansion of the incident and scattered fields in vector spherical wave functions, which are used to compute the electromagnetic scattering by single, homogeneous non-spherical particles [31]. The T-matrix approach has been shown to be an efficient method for scattering calculations involving rotationally symmetric non-spherical particles, such as spheroids, cylinders, two-sphere clusters, and Chebyshev particles [32].
At every scattering process, either the degree or the nature of the electromagnetic wave polarization can change. A convenient way to describe the polarization state of light is through the Stokes vector. The Stokes vector can be defined through a set of ideal measurements [33] and is defined as
where the Stokes parameters, , are a complete description of the state of light [34]: represents the total intensity beam, the horizontally or vertically polarized light, the ° or ° polarized light, and the circularly polarized light.
The change in the state of light caused by the scattering processes can be defined as
where and are the incident and scattered light state in the format of Stokes vectors, and F is the Müller matrix:
The elements of this matrix depend on the direction of radiation propagation and the wavelength, and completely describe the properties of a scattering element.
In this study, we use the T-matrix method for randomly oriented, rotationally symmetric scatterers [35] to compute the Müller matrix of aerosols at the cloud radar wavelength.
From the Müller matrix, which is the output of Mishchenko’s scattering code, the equivalent reflectivity () and linear depolarization ratio (LDR) can be calculated [36]:
where corresponds to the Müller matrix elements (Equation (12)) and N to the number concentration.
The range of considered T-matrix input parameters is reported in Table 1. The number concentration range was set based on Lasher-Trapp and Stachnik [37], who studied the variability of giant and ultragiant aerosols over the eastern Great Lakes region during a campaign with aircraft data. As we were unable to find the complex refractive index for dust at the cloud radar wavelength ( mm), we searched for the refractive indices of dust reported in the literature at other wavelengths. In Zhang et al. [38], they presented a recollection of refractive indexes for dust with different mineralogical compositions between 0.2 and 50 m, which shows that the refractive index changes significantly between different wavelengths. At 800 nm, the refractive index real part ranges between 1.4 and 2.9, whilst the imaginary part falls between and 0.015. At 50 m, the ranges are 1.8–5.9 and 0.02–1.5 for the real and imaginary parts, respectively. In the study of Weinzierl et al. [39], they presented the refractive index of volcanic aerosols and dust between 350 and 800 nm. At 800 nm, the same wavelength that we selected from [38], the refractive index for dust was , and for volcanic it was . Given the high variability of the complex refractive index that we see at different wavelengths, and that the values for dust and volcanic particles are relatively similar at the same wavelength (800 nm), we decided to use the complex refractive index found by Adams et al. [40] for volcanic particles at the radar operating frequency ( GHz): .

Table 1.
Input parameters for the T-matrix calculations at the cloud radar wavelength (8.45 mm). In the axis ratio, “h” and “v” stand for horizontal and vertical axes, respectively.
Figure 1 reports the estimated theoretical reflectivity at mm for spherical particles depending on their size and number concentration, assuming a gamma particle distribution. The reflectivity is increasing together with the particle effective radius, which is the surface-area-weighted mean radius, and the number concentration; with the highest increase associated with the particle size. The signal is the result of the complex size distribution, which can be represented using different aerosol modes. As previously mentioned, according to the manufacturer, the radar sensitivity threshold is dB at 1 km at a time resolution of 10 s and averaging 200 spectra; reflectivity values above this value are highlighted using white horizontal lines. These values are in line with giant aerosol observations in the atmosphere, such as Exton et al. [41], who found total particle concentrations of a few-per-centimeter cubed in the range 1–23.5 m, and of about 0.1–0.5 cm−3 in the range 5–150 m, and with the measurements performed during the First Aerosol Characterization Experiment (ACE-1), which measured particles with dry radii on the order of 6 to 12 m in concentrations between and cm−3 [5].
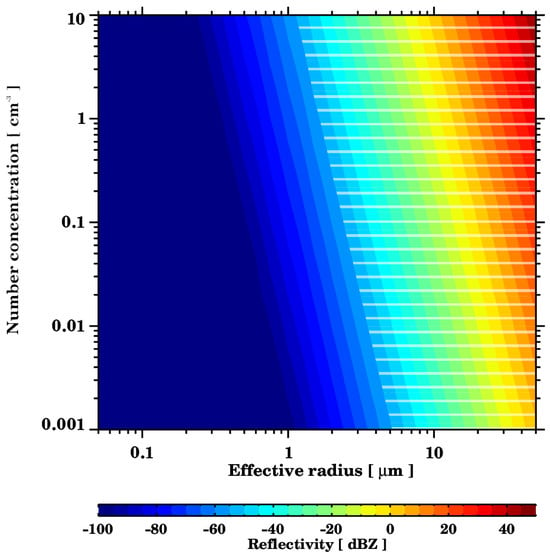
Figure 1.
Reflectivity calculations from the output of Mishchenko’s T-matrix scattering code, depending on the particle effective radius and the number of particles. These values correspond to spherical particles at a wavelength of mm, to a complex refractive index of , and to a scattering angle of 180°. The white horizontal lines highlight reflectivities over dB, the radar sensitivity threshold at 1 km.
Therefore, given the radar sensitivity, the T-matrix scattering calculations, and the aerosols’ size and number concentration in the atmosphere, we can affirm that the cloud radar is sensitive to giant and ultragiant aerosols.
2.2.3. Detection Methodology
The microwave radiation emitted by the radar probes the atmospheric vertical structure and receives echoes caused by different kinds of scatterers (hereinafter: targets). The target discrimination is essential for interpreting the cloud radar observations, and in many cases, this operation can be accomplished by using the different Doppler velocities and LDR. In the cloud radar MIRA36 algorithms, following the noise (the so-called clutter) removal, the targets are classified into clouds, rain, and plankton, with the latter being the radar term used to describe non-hydrometeor targets (i.e., insects). Ka and W-band cloud radars (35 and 94 GHz, respectively) detect almost exclusively insect targets on warm cloudless days [42,43]. Indeed, radar has been applied to the study of insects for more than 40 years. Since wind-borne insect migration occurs on a colossal scale, far exceeding (at least in numerical terms) the migratory flux of birds [44], and giant and ultragiant volcanic aerosols can be detected by Ka-band radars [22,23,45,46], it can be assumed that the non-hydrometeor (plankton) echoes consist of insect and aerosol returns only. Therefore, a strategy was developed based on insect characteristics and behavior to detect and subtract them from the radar signals, keeping the aerosol returns only.
The first of the insect characteristics that have to be taken into account is their vertical evolution throughout the day. The depth of the insect layer follows the diurnal variation of the atmospheric boundary layer (ABL) with a minimum during the night-time, sharply increasing in the morning, and reaching a maximum in the afternoon. According to this daily evolution, represented in Figure 2, crepuscular, diurnal, and nocturnal insects can be identified with almost no overlap between them. Crepuscular species take off during the morning twilight period, with small numbers and a generally short-lived flight, although they occasionally continue for some time, and day-time layers are reported [44]. Day-flying migrants take off from mid-morning onward, as atmospheric convection develops, and generally descend in the late afternoon; occasionally, small numbers of day-flying species continue their migration into the night [44]. Nocturnal species typically have a mass take off at dusk and fly throughout the night following the stratification of the nocturnal BL [47,48,49,50,51]. Therefore, they tend to concentrate into layers of shallow depth but broad horizontal extent [52,53,54,55].

Figure 2.
Insect daily schematic evolution, in three distinguished groups: crepuscular (green), diurnal (orange), and nocturnal (blue). The height reached by the insects depends on the geographical location and meteorological conditions. Elaborated based on Chapman et al. [44,47], Drake [52], Drake and Farrow [53], Gatehouse [54], Reynolds et al. [48,49,55], and Wood et al. [50,51]. The sun and moon icons represent the sunrise and sunset respectively.
In Figure 3, the daily evolution of the Doppler vertical velocity measured by the cloud radar for two continuous days in July 2013 is presented. During these two days, there were clear sky conditions except for some cirrus clouds around 4 km a.s.l. on 29 July 2013 after 18 UTC. The insects’ daily evolution can be observed for both days. On 28 July 2013, a layer of nocturnal insects is detected between 00:00 and 03:30 UTC, approximately. Then, at dawn, the diurnal insects start to take off, progressing throughout the day, reaching higher altitudes (up to 2.5 km a.s.l.) along with the evolution of the convective atmospheric boundary layer (ABL). After sunset, two layers of nocturnal insects can be observed, which continue onto the next day. On 29 July, the two nocturnal insect layers from the previous day merge into the diurnal insects group layer, which was detected starting from dawn. A similar evolution for the daily insect group is observed, even though on the second day the measured vertical Doppler velocities and the height reached by the insects are lower. Around 15 UTC, during the day-time, a group of insects is lifted. After sunset, nocturnal insects take off as well, but in this case, their flight ends well before midnight.
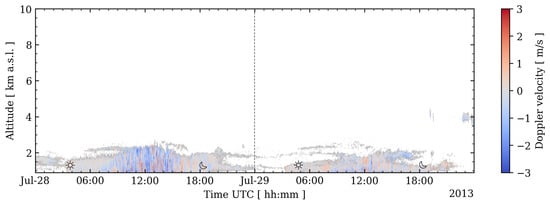
Figure 3.
Daily time–range evolution of the Doppler vertical velocity measured by the MIRA36 cloud radar for 28 and 29 July 2013. The sun and moon icons represent the sunrise and sunset, respectively, whilst the dashed vertical line indicates the change in day.
Typically, the insect size range is of the order of millimeters, whereas the aerosol size range after atmospheric transport can reach up to a few hundred microns. Considering that the radar reflectivity is proportional to the sixth power of the diameter of the scatterers, aerosols are only detectable in range gates free of insects. Therefore, only the lofted layers relative to the areas where the insects fly are searched for and further processed.
Figure 4 illustrates the approach developed with this purpose. First, according to the cloud radar original classification [56], the plankton (non-hydrometeor) layers are looked for. Due to the speckled nature of the cloud radar images, it was established that the lofted layers should have 600 pixels at least (10 samples in height × 60 samples in time), which corresponds to a 300 m thick layer that lasts for 10 min. Second, the misclassification of the outer cloud and rain pixels into the plankton category that is frequently performed by the original cloud radar classification algorithm needs to be overcome. With this purpose, the cloud and rain areas are expanded 2 min in time and 120 m in range to create a cloud mask. This mask includes the clouds and rain regions, including their outer originally misclassified pixels. Third, the cloud base height detected by the ceilometer is also included into the mask in order to avoid inserting misclassified clouds into the process. Finally, after applying the cloud mask, the remaining layers are classified into lofted or not lofted, depending on their minimum height. In Figure 5, an example of the plankton layers identification is presented.

Figure 4.
Methodology adopted for the identification of non-hydrometeor targets lofted layers. The green arrow indicates that the condition is fulfilled, and the red one that it is not.
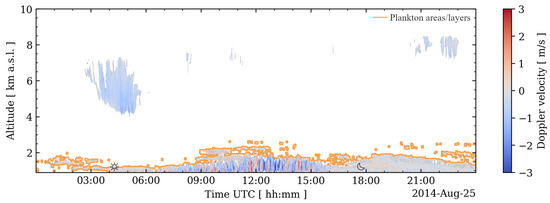
Figure 5.
Daily time–range evolution of the Doppler vertical velocity for 25 August 2014. The orange lines show the plankton layers identified by our methodology, whilst the sun and the moon indicate the sunrise and sunset times, respectively.
After the identification of the plankton lofted layers via the process that we just described, a series of tests based on the insect behavior in the atmosphere are carried out to distinguish between the aerosol and insect layers. The different criteria are based on entomology studies and consider atmospheric variables such as the temperature and the wind. The key features of insects layers are explained next.
Two aspects of the insects’ relationship with temperature were considered: (a) the ceiling (maximum height) of the insect layer can be approximated by the 10 °C isotherm in most cases, even though there is a tendency of insects to tolerate lower temperatures after prolonged periods with temperatures lower than average [57]; and (b) the insect layers during the night-time are frequently located near the inversion top height [48].
Regarding the insects’ behavior with respect to the wind, it was found that (a) they do not fly at a wind speed on the Beaufort wind force scale higher than 5 close to the ground [58], which corresponds to a mean wind speed of 10 m s−1; and that (b) the aerosol layers tend to follow the 3D wind vector, while insects usually have more random behavior.
Finally, concerning the relationship of the insects with the convection, the ABL, and the height, it is known that (a) insects tend to be concentrated in plumes of rising air [59]; (b) there are usually many more insects within the convective ABL than above it [60]; and (c) migrating insects typically fly at high altitudes, sometimes as high as 2 or 3 km above the ground [54].
Figure 6 illustrates the developed methodology based on the entomology criteria outlined above. In order to perform the following screening steps, ancillary information is required. Temperature and wind profiles from radiosondes are used, if available, within a temporal difference of 2 h (we assume that within this time interval the measured profiles are still representative of the actual conditions). In any other case, profiles provided by the MWR and the ECMWF model are used for temperature and wind, respectively.
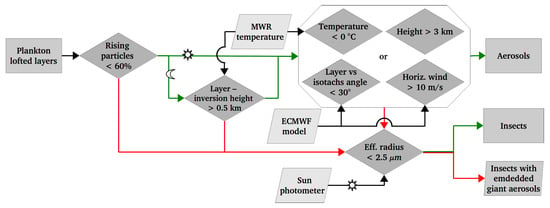
Figure 6.
Methodology used for the creation of the aerosol–insect dataset, applying tests based on entomology studies. Green arrows indicate that the condition is fulfilled, and red arrows that it is not. The sun and moon icons indicate day- and night-time conditions respectively.
In the first step, the layers that have more than 60% upward Doppler velocities are classified as insects. If not, then it is a possible aerosol layer and moves through the second screening step. In the second step, which is only applied during the night, the layer location relative to the temperature inversion height is used as the screening metric. If more than 10% of the layer is located within 500 m higher or lower than the temperature inversion height, it is classified as an insect layer. If not, it moves ahead in the classification procedure. In the third screening step, four tests are applied:
- Is the temperature of more than 90% of the points below 0 °C? This test is based on Luke et al. [57] (the ceiling of the insect layer can be approximated by the 10 °C isotherm, even though they can tolerate lower temperatures after prolonged periods with temperatures lower than average). We set the temperature threshold to 0 °C to account for the insects’ behavior during periods colder than average.
- Are more than 90% of the layer pixels located above 3 km? This test is based on Gatehouse [54] (migrating insects typically fly at high altitudes, sometimes as high as 2 or 3 km above the ground), from which we used the maximum height.
- Is the corresponding horizontal wind speed of at least 90% of the layer pixels over 10 m s−1? This test is based on Møller [58] (insects do not fly at a wind speed on the Beaufort wind force scale higher than 5 close to the ground, which corresponds to a mean wind speed of 10 m s−1).
- Is the difference in angle between the layer and the isotachs time–height cross-section orientation lower than °? This test is based on Møller [58] (the aerosol layers tend to follow the 3D wind vector, while insects usually have a more random behavior); therefore, we are comparing the layer orientation to the isotachs, which are the lines connecting points of equal wind speed.
The layer that meets at least one of these conditions is classified as aerosol. If not, it falls into the insect category. In the definition of these four tests, we decided to be conservative in order to avoid misclassifying insects as aerosol layers. Also, in the first three tests, we defined that the criteria should be met by ≥90% of the points in order to account for the speckled nature of the cloud radar images. In the fourth test, this was not possible because the time–height cross-section orientation of the layers is used.
As radar measurements alone cannot provide unique information on whether giant aerosols are embedded in the insect layers due to their highly differing sizes, it is necessary to check independent measurements to further scrutinize the results obtained from the cloud radar. For this reason, the insect layers are submitted to an additional screening criterion. The size distribution retrievals from the AERONET sun photometer during the insect layer are averaged. Then, if the effective radius of the coarse mode is smaller than m, it is considered to be an insect layer, whilst otherwise we assume that is a layer of insects with embedded giant aerosols. This means that in both cases the layers contain insects, but when the effective radius of the coarse mode retrieved by the sun photometer is ≥2.5 m, giant aerosols are also present. The AERONET aerosol size distribution is only used in the case of lofted layers during the day-time, when the sun photometer is operating. As this criterion was defined for our relatively pollution-free station and AERONET measurements are columnar, our classification could be affected by pollution in the lower part in the atmosphere. During the night-time, the atmospheric conditions are generally more stable and, in addition, the cases occurring in this period are checked for the temperature inversion.
During the definition of our methodology, the thresholds used in the different steps to classify a layer as aerosols were defined in a conservative way to ensure that insect layers are not classified as aerosols (i.e., setting the temperature threshold at the layer height at 0 °C or using the maximum height of 3 km). The downside of this is that some giant aerosol layers might be classified as insect layers.
3. Results
3.1. Giant Aerosols Dataset
The described methodology was applied to all the cloud radar observations in Potenza within the period of March 2009–June 2015, resulting in the identification of 328 giant aerosol layers, 684 insect layers, and 18 insect layers with embedded giant aerosols. The selection of this time interval was based on having the longest data records at the station without gaps due to maintenance, tests, and temporary instrument shut-downs.
Table 2 shows the day/night distribution of the identified layers.

Table 2.
Giant aerosols, insects, and insects with embedded giant aerosol lofted layers dataset (March 2009–June 2015). Between parentheses is the percentage of layers of the total. Note that some layers have a long duration and occur both during the day- and night-time.
The number of giant aerosol layers during the day and the night is very similar, while the number of insect layers during the night is much higher than during the day. As our algorithm is identifying lofted layers, the insects that are found within the convective ABL during the day-time are not accounted for, whilst nocturnal species flying in layers of shallow depth but broad horizontal extent are. This is in line with the entomology study’s description of the insects’ behavior that we previously described in Figure 2: they mainly fly within the convective ABL during the day and follow the stratification of the nocturnal stable boundary layer during the night. Nevertheless, this could also be caused by one of the steps in the screening procedure, in which the temperature inversion height is compared to the height of the aerosol/insect layer. The information from the sun photometer, used to detect embedded giant aerosol layers, was available for the 48.3% of the total insect cases, and it was found that the 12.9% of the insect layers to which this criterion could be applied contained giant aerosols. Henceforth, only the aerosol and insect layers without embedded giant aerosols will be considered in order to compare the two targets.
The frequency distributions of the reflectivity (Z) and LDR for aerosols and insects are shown in Figure 7 and Figure 8. The reflectivity distribution (Figure 7) is very similar for both targets. Nonetheless, some small differences are observed: low reflectivity values are observed more frequently for insects, while aerosols reach higher values. The LDR distribution (Figure 8) is bi-modal for the aerosols and unimodal for the insects, with the low values being more common for the aerosols. This indicates that the SNR difference between the co- and the cross-channel is, in general, higher for aerosols. This effect might be due to the effective irregularities of the two targets; for aerosols, non-zero LDR values indicate the presence of non-spherical aerosols and can be highly sensitive to particle shapes and sizes [61].
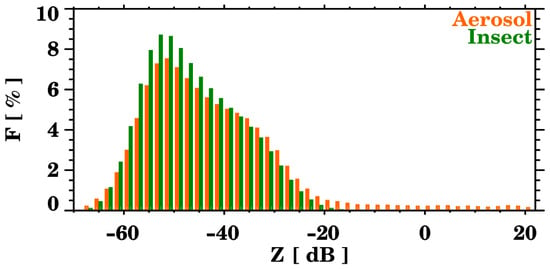
Figure 7.
Frequency distribution of reflectivity for all the giant aerosols (in orange) and insect cases (in green).
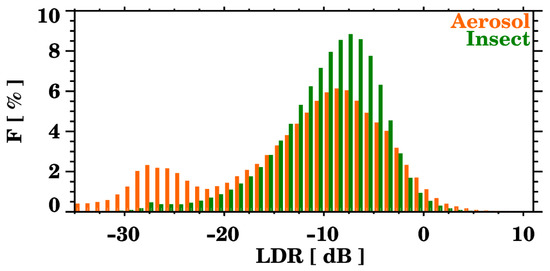
Figure 8.
Frequency distribution of LDR for all the aerosols (in orange, bi-modal distribution) and insect cases (in green, mono-modal distribution).
In Figure 9, the occurrence of the aerosol layers throughout the year is presented. The maximum number of aerosol layers observed occurs during summer (July and August), whilst the minimum occurs during winter. The number of aerosol cases decreases gradually from summer to winter. From winter to summer, there is a gradual increase in the aerosol layers detected, with the exception of a relative maximum in April. These features are in accordance with climatological studies of the site [25,62]. Most likely, the peak during spring is caused by pollen and dust, and the one during summer by dust.
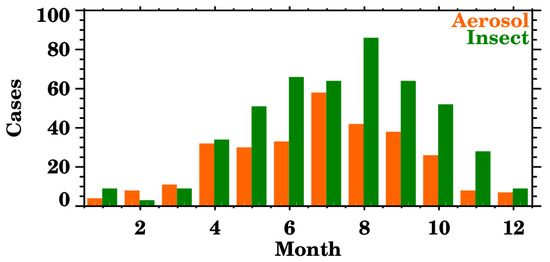
Figure 9.
Number of giant aerosol (in orange) and insect layers (in green) per month. As the total number of cases is presented instead of the frequency distribution, the total number of insect layers is much higher than the number of giant aerosol layers.
The annual evolution of aerosol optical depth (AOD) retrieved by the AERONET sun photometer is presented in Figure 10 together with the normalized frequency distribution of giant aerosol cases. The AOD curves and the distribution of the giant aerosol observations yield a good agreement: the highest AOD values are observed during the months in which more giant aerosol cases occur. The enhanced AOD values during spring and summer agree with the annual cycle of dust outbreaks [25,63], suggesting the presence of coarse-mode aerosols over Potenza.
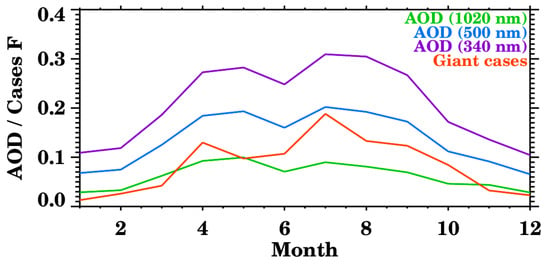
Figure 10.
Frequency distribution of giant aerosols cases (“Cases F” on the y-axis, orange line in the plot) as observed by the cloud radar together with AOD measured by AERONET at 340, 500, and 1020 nm.
Concerning the layers’ vertical distribution (Figure 11), aerosols are usually located at higher altitudes compared to insects. This is caused by the preference of insects to stay within the ABL. Figure 12 shows the distribution of the percentage of rising particles of the layers: most of the time, the aerosol layers have a vertical velocity close to zero (of the total number of particles in each layer, between 40 and 60% have ascending velocities), and in some cases most of the particles are falling (lower percentage of rising particles within each layer). This characteristic helps to distinguish these layers from the insect ones, as insects tend to follow the upward motion of the air parcels.
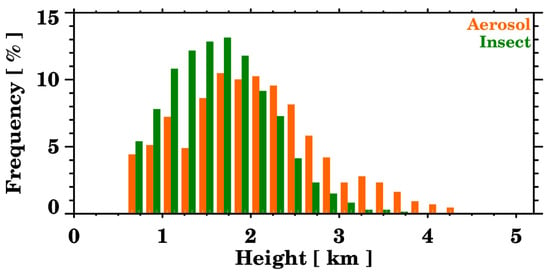
Figure 11.
Frequency distribution of the height location of the insect (in green) and giant aerosol layers (in orange).
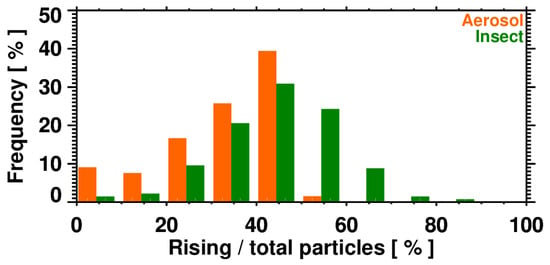
Figure 12.
Frequency distribution of the proportion of particles with upwards velocity within the insect (in green) and giant aerosol layers (in orange).
The fact that there are no aerosol layers that contain more than 60% of rising particles is a consequence of our algorithm for the giant aerosols’ detection.
3.2. Giant Aerosol Effects
The ultimate goal of observing giant aerosols is to study their effects to obtain a better understanding of the processes that they are involved in and their importance for meteorology and the climate. For this purpose, we made a comparison of the values of some atmospheric variables depending on whether giant aerosols were observed or not. Control cases are days in which giant aerosols were not observed by the cloud radar. The variables that were considered are the aerosol optical depth (AOD), the Ångström exponent, and the accumulated precipitation.
In order to study the giant aerosol effects on these variables, it is necessary to account for the diurnal cycle and the meteorological situation.
The diurnal cycle is an important factor in the development of the ABL, the convective activity, and the formation of clouds and rain; therefore, it needs to be taken into account. To account for it, a time period of the day needs to be selected and used for all the cases. The time interval selected here is from 13:00 to 14:00 local time (LT), selected on the basis of Koren et al. [64], who conducted a study on the aerosol-induced intensification of rain from the tropics to the mid-latitudes and set the time for his study at 13:30 LT.
The meteorological situation is assessed by sorting the data into cases with different pressure vertical velocities () of the upper troposphere (400 hPa), as in [64]. Negative pressure vertical velocities indicate a net upward air motion, related with more developed clouds and higher rain rates (R). Positive pressure vertical velocities indicate net downward motion, related to fair weather. According to the pressure vertical velocities from the ECMWF model, three stability levels were defined for this study:
- Stability Condition 1: Pa s−1.
- Stability Condition 2: Pa s−1.
- Stability Condition 3: Pa s−1.
The use of the vertical velocity measured by the cloud radar in the higher troposphere was considered to establish the different atmospheric stability conditions, but we disregarded it because it could be affected by cloud vertical dynamics (i.e., the ice cloud targets normally show significant terminal falling velocities), because imperfect pointing of the vertical beam can generate an offset that is large compared to the synoptic -values, and because it was not always available (i.e., clouds not present).
The selection of control cases (not giant aerosol observations) is based on the size distribution retrievals from AERONET and for the same time interval (13:00–14:00 LT). Therefore, days in which there were no giant aerosol cloud radar observations and the effective radius of the coarse mode was lower than m were flagged as control cases. This retrieval was available for 212 of the 2107 considered days (March 2009–June 2015), and the screening filter was met for 173 cases.
The giant aerosol observations were selected from the cloud radar giant aerosols dataset. The cases were selected if they occurred less than 4 h before or after the predefined time interval, limiting, thus, the cases to a fully developed ABL. From the initial 328 cases of giant aerosol observations, 150 passed this specific filter.
After the selection of the two datasets (giant aerosols and control) and their classification according to the meteorological situation, 150 giant aerosol and 159 control cases were found. Table 3 reports the number of cases classified according to their atmospheric stability category.

Table 3.
Number of giant and not-giant cases for the initial conditions (giant cases within the time interval defined and not-giant cases with a coarse mode effective radius <2.5 m) and with available pressure vertical velocity () data. The stability types defined are the following: 1 ( Pa s−1), 2 ( Pa s−1), and 3 ( Pa s−1).
In the following, we make an inferential analysis of the giant aerosol effects on three independent parameters: the aerosol optical depth (AOD), the Ångström exponent, and the accumulated precipitation. Given that these variables may be affected by others, cross-correlations exist, and, as only the effect of the ABL diurnal cycle and the atmospheric stability conditions were considered, the results presented in this section are based upon some assumptions and simplifications.
3.2.1. Aerosol Optical Depth
The mean AODs during the control and giant aerosol events at 340, 500, and 1020 nm are presented in Figure 13 and summarized in Table 4. For all the atmospheric conditions and all the wavelengths, we noted an increase in the mean AOD values when giant aerosol were observed. This increase ranged from 0.004 to 0.164 in absolute values, and from 6% to 90% in relative terms.
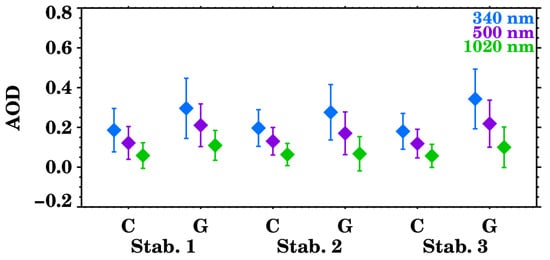
Figure 13.
Mean aerosol optical depth (AOD) values at 340, 500, and 1020 nm during control and giant aerosol cases according to the atmospheric stability. The error bars correspond to the standard deviation. “C” stands for control cases, “G” for giant aerosols observations, and “Stab.” for atmospheric stability condition, where “1” has the lower stability and “3” the highest.

Table 4.
Mean aerosol optical depth (AOD) values during control and giant aerosol cases according to the atmospheric stability, where “1” has the lower stability and “3” the highest. The values after the ± sign correspond to the standard deviation.
The highest differences were found for Conditions 1 and 3, whereas for Condition 2 the effect was less pronounced. At 340 nm, for example, the AOD went from 0.187 to 0.297 for Condition 1 (0.11 increase, 59%), and from 0.183 to 0.347 for Condition 3 (0.164 increase, 90%). These higher increases during the most stable and unstable atmospheric conditions can be linked to the meteorological situation affecting the site at the time of the observations. Figure 14 presents a schematic of a theoretical meteorological situation affecting the site for the stability Conditions 1 and 3. The site is affected by low pressures in Condition 1 (blue) and by high pressures in Condition 3 (in red). According to the seasonality of the giant aerosols observations (Figure 9), it is likely that most particles observed over Potenza originate in the Sahara desert. Therefore, the higher increases in AOD caused by giant aerosols can be related to the flow of desert dust particles towards the site, both in low- and high-pressure conditions. The dust particles reaching the observational site, though, will most likely have different characteristics, as under low-pressure conditions the particles will be fresher, whilst under high-pressure conditions they will be more aged due to a longer-range transport.
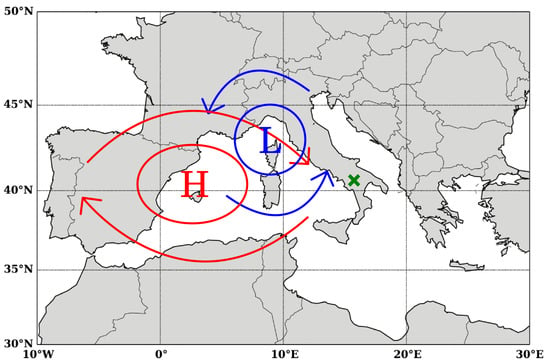
Figure 14.
Scheme of the synoptic situation corresponding to the atmospheric stability conditions “1” (blue) and “3” (red). “L” stands for a low-pressure system (cyclone) and “H” for a high-pressure system (anticyclone). The green cross indicates the observatory location.
3.2.2. Ångström Exponent
The Ångström exponent, which is an aerosol-size-related parameter, is also affected by the presence of giant aerosols. Figure 15 represents the change at three wavelength pairs (380–500 nm, 440–675 nm, and 500–870 nm) for control and giant observations, classified according to the atmospheric stability condition. The values are reported in Table 5. In this case, an Ångström exponent decrease is observed for all the pairs of wavelengths for the lower atmospheric stability (Stab. 1): around for all of them. The highest difference is observed for the 440–675 nm pair, where the Ångström exponent decreases from 1.5 to 1.06 ( change). The opposite behavior is observed for the neutral atmospheric stability (Stab. 2), for which the Ångström exponent increases in the presence of giant aerosols between 16 and 22%. For the same wavelength pair as before, it went from 1.39 to 1.61 (). Finally, for the most stable atmospheric condition (Stab. 3), the absolute difference with respect to the other meteorological conditions is the smallest, with the changes in the Ångström exponent ranging from () to ().
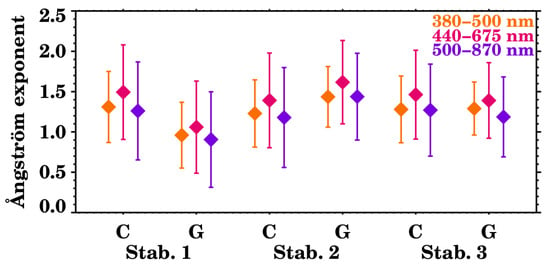
Figure 15.
Mean Ångström exponent values during control and giant aerosol cases according to the atmospheric stability for three wavelength pairs: 380–500 nm, 440–675 nm, and 500–870 nm. The error bars correspond to the standard deviation. “C” stands for control cases, “G” for giant aerosols observations, and “Stab.” for atmospheric stability condition, where “1” has the lower stability and “3” the highest.

Table 5.
Mean Ångström exponent values during control and giant aerosol cases according to the atmospheric stability, where “1” has the lower stability and “3” the highest. The values after the ± sign correspond to the standard deviation.
The Ångström exponent gives a rough indication of the particle size: lower values indicate the presence of big particles, and higher values of smaller particles. Accordingly, during giant aerosol cloud radar observations, the sun photometer measured coarser particles in low atmospheric stability conditions, finer in neutral conditions, and particles roughly of the same size for stable atmospheric conditions. As the sun photometer measurements are columnar and cover a broad range of the aerosol size spectrum, the changes in Ångström exponent can be attributed to major or minor fraction, and, thus, presence, of coarse aerosol particles. For Condition 1, the traveled path of desert dust particles prior to reaching the site (see Figure 14) is the shortest; therefore, a smaller fraction of the coarse mode is removed due to gravitational settling. For Condition 3, instead, the dust particles reach the observational site after traveling through a longer path, and most of the big particles could have been removed from the atmosphere in the meantime. Furthermore, the presence of marine particles cannot be neglected for any of these conditions, and aerosols belonging to Condition 3 might also contain continental pollution due to the air masses’ trajectories. For Condition 2, the Ångström exponent increase (observation of smaller particles overall), given that AERONET measurements are columnar, might be related to a higher proportion of marine particles and local aerosol particles in the atmospheric column, where local aerosol particles could be of natural (pollen) or anthropogenic origin (pollution from nearby sources). This can be supported by the findings from different studies, for example, Toledano et al. [65], where they presented the relationship between the AOD and the Ångström exponent, comparing the SAMUM-1, SAMUM-2, and SALTRACE campaigns, showing that the Ångström exponent for marine particles can range between values of −0.2 and 1.2, and with Deaconu et al. [66], where the same relation was presented, showing that the Ångström exponent can reach values up to 1.2 for marine particles and up to 2.5 for continental particles. Nevertheless, further checks are needed in order to understand this effect better.
3.2.3. Accumulated Precipitation
In this section, we perform an inferential analysis to assess how the presence of giant particles affects the accumulated precipitation, given that giant aerosols can act as GCCN and IN, affecting the precipitation formation and the temperature at which ice nucleation initiates. Hence, the giant aerosol, together with the aerosol-giant-free, observations are compared to precipitation measurements in order to investigate the effect on the accumulated precipitation.
The analysis is performed at a regional scale, assuming that lofted aerosol layers can be considered homogeneous within a range of ≤100 km and 10 h. The selected criteria follow the adopted strategy by Pappalardo et al. [67] for correlative EARLINET-CALIPSO measurements. That study found that in a range of ≤100 km, for aerosol layers in the free troposphere, above 2 km of altitude, the mean differences profiles do not change significantly with the time shifts that they considered (between 10 and 720 min). The precipitation measurements that we used were performed by the Basilicata Regional Civil Protection: its rain gauges network comprises 46 stations, which are distributed into eight hydrological basins [68] and are a maximum of 100 km away from our observational site.
Table 6 presents the mean precipitation accumulation during 6, 12, 18, and 24 h after giant aerosols and control observations. The minimum time interval was chosen considering wind speed data and the distance (∼100 km) from the furthest of the network’s rain gauges. Pappalardo et al. [67] reported that the typical wind speed in the free troposphere at EARLINET stations ranged between 5 and 20 m/s. The rest of the time intervals are 6 h steps so as to facilitate the inferential analysis.

Table 6.
Mean precipitation accumulation in mm during the 6, 12, 18, and 24 h after giant aerosols and control observations according to the atmospheric stability conditions, where “1” has the lower stability and “3” the highest. The values after the ± sign correspond to the standard deviation.
The mean accumulated rain following the event was found to be higher after giant aerosol observations for all the atmospheric stability conditions and for all the time intervals, with only one exception: a decrease was registered for Condition 2 for the longest time period. The biggest increase in accumulated precipitation was registered for Condition 1 during the 12 h following the giant aerosols observations, and it was of mm (from 1.3 to mm). In relative difference, though, the highest increase occurred, also for Condition 1, during the 6 h after the event: the accumulated precipitation went from 0.7 to mm, almost 20 times higher. Among all the time intervals, the lowest accumulated rain increase was detected for Condition 2 (intermediate atmospheric stability).
For the 6 h time interval, the highest increase corresponds to Condition 1 ( mm). For the 12 h period, the maximum increase was registered for Condition 1 as well, and corresponds to a relative increase in respect to the control of 1446%. For the 18 and 24 h time intervals, the relative increases were lower: 142% after 18 h (Condition 1) and 50% after 24 h (Condition 3), but given the time scales for these longer time intervals and the complex impact that giant aerosols may have due to the multitude of interacting factors at the mesoscale, it is difficult to attribute the effect on the presence of giant particles.
When comparing the accumulated precipitation following the observation of giant aerosols across different time intervals and atmospheric conditions, it becomes evident that the increase in rainfall occurs predominantly within the first few hours. This trend persists even when considering longer intervals. For instance, under Condition 1, the precipitation increases by 13.7, 18.8, 17.6, and mm during the 6, 12, 18, and 24 h intervals, respectively. Notably, the absolute difference begins to decrease after the 12 h mark. Similarly, for Condition 3, this reduction is observed even earlier—after the 6 h interval—with an increase of mm at 6 h compared to mm at 12 h. These findings suggest that the impact of giant aerosols on accumulated precipitation is most pronounced during the first few hours following their observation.
4. Summary and Conclusions
This work intended to fill the observational gap in the characterization of the aerosol size distribution in the region of the giant and ultragiant fraction by using a Ka-band cloud radar ( mm wavelength) and to obtain a deeper understanding of their characteristics and their effects on some atmospheric variables, both at a local and at a regional scale.
With this purpose, a novel methodology for giant and ultragiant aerosols detection was developed, which enabled the systematic classification of observations and characterization of giant aerosols using cloud radar measurements. In summary, this new methodology consists of separating the cloud radar observations of non-hydrometeor targets into aerosols and insects, for which the findings of several entomology studies regarding the insects’ behavior in the atmosphere were used. The application of the methodology to approximately six years of measurements (March 2009–June 2015) yielded the identification of more than 300 giant aerosol layers. The maximum number of layers observed occurred during summer, and a relative maximum was observed in spring. Together with a minimum during winter, the seasonal evolution of giant aerosols is in agreement with climatological studies of the site realized using LiDAR measurements, i.e., [63]. Lastly, considering the continuous cloud radar operation, the developed methodology could be very useful for monitoring, in near-real time, the coarse aerosol fraction of aerosol particles such as dust, pollen, and volcanic aerosols.
After the systematic identification of giant aerosols in cloud radar measurements, their effects on the local meteorology were studied by correlating the observations of giant particles with three atmospheric variables and comparing them to control observations (cases in which giant particles were not observed). The approach followed in this investigation is based on the selection of a day-time interval and the screening of the data according to atmospheric stability, which was estimated by the pressure vertical velocity in the upper atmosphere.
An increase in the aerosol optical depth (AOD) was measured together with the giant aerosol observations. It ranged from 6% to 90% with respect to the control cases, suggesting that giant aerosols are likely contributing to an increase in the aerosol load for all the atmospheric stability conditions.
The Ångström exponent was also affected during giant aerosols observations: it decreased for the highest and lowest atmospheric stability and it increased for the intermediate stability conditions. This means that coarser aerosols were observed for the most extreme conditions and finer particles were observed for the intermediate situation. The decrease ranged between 5% and 43%, while the increase ranged between 17% and 22%. Considering that the AOD and Ångström exponent measurements are columnar, the large changes observed for these two variables suggest that giant aerosols probably represent an important fraction of the columnar aerosol load in our dataset.
Finally, an increase in the accumulated precipitation was found after the observations of giant aerosols. This increase was found for all time intervals, and more significantly for the most unstable atmospheric conditions, which, expectedly, favors convection processes. These results are in line with findings from other studies, such as Eagan et al. [6] and Feingold et al. [5], who found that a GCCN concentration of cm−3 is enough to increase the amount of rain in stratocumuli by up to 100%; Jung et al. [12], where they artificially introduced GCCN into stratocumulus clouds and found an increase in the average drizzle rates during the 30–60 min after the seeding; and Liu et al. [69], where they found that the raindrop size, concentration, and rain rate increased in the presence of coarse sea spray aerosols. Given that precipitation can be affected by several factors and conditions as well as the uncertainties of our analysis, this study suggests that giant particles may have a role in precipitation, and this calls for further research.
In conclusion, we found that giant aerosols had an effect on the AOD, the Ångström exponent, and the accumulated precipitation. Nevertheless, the standard deviations associated with the variables indicate high variability, and considering that these variables can be affected by a number of parameters, this study highlights a role of giant aerosols in the regional and local meteorology, but does not allow us to fully disentangle their effect. Thus, we need to expand our dataset with a longer data record in order to vigorously assess the effects on the different meteorological variables and draw accurate conclusions. This could be achieved by categorizing the cases according to the aerosol type (i.e., dust/marine/pollen), by associating them with the cloud type formation (i.e., cumuli vs. stratocumuli), or by assessing the different atmospheric variables’ seasonality.
Although uncertainties remain, the importance and utility of the proposed methodology is supported by our preliminary findings, and the impact that the giant aerosols can have on some meteorological variables is displayed.
Author Contributions
Conceptualization, P.G.-C., F.M. and A.A.; methodology, P.G.-C.; software, P.G.-C.; validation, F.M., A.A., M.B.-P. and N.P.; resources, G.P.; writing—original draft preparation, P.G.-C.; writing—review and editing, F.M., A.A., N.P., M.B.-P. and M.R.; visualization, P.G.-C.; supervision, F.M., A.A. and M.B.-P.; project administration, A.A.; funding acquisition, G.P. All authors have read and agreed to the published version of the manuscript.
Funding
This research was funded by the European Community through the ACTRIS Research Infrastructure Action under the 7th Framework Programme under ACTRIS Grant Agreement n° 262254 and ITaRS Grant Agreement n° 289923, by the Italian national project “Programma Operativo Nazionale (PON) Regione Basilicata 2000/2006”, and by IR0000032—ITINERIS, Italian Integrated Environmental Research Infrastructures System (D.D. no. 130/2022—CUP B53C22002150006), funded by the EU—Next Generation EU PNRR-Mission 4 “Education and Research”—Component 2: “From research to business”—Investment 3.1: “Fund for the realization of an integrated system of research and innovation infrastructures”.
Data Availability Statement
The MIRA36 Ka-band Doppler radar data and the ECMWF NWP model outputs can be accessed through the CLOUDNET website ( https://cloudnet.fmi.fi/search/data?site=potenza, accessed on 14 October 2024), whilst the sun photometer (CE-318) data can be found in the AERONET website (https://aeronet.gsfc.nasa.gov/cgi-bin/draw_map_display_aod_v3?level=3, accessed on 14 October 2024). The data from the MWR (MP3010), the MILOS weather station and the ceilometer (CT25K) are stored at the CIAO facilities, and can be made available upon request.
Conflicts of Interest
The authors declare no conflicts of interest. The funders had no role in the design of the study; in the collection, analyses, or interpretation of data; in the writing of the manuscript; or in the decision to publish the results. Author Dr. Matthias Bauer-Pfundstein was and is currently employed by the company METEK GmbH, Elmshorn, Germany. The remaining authors declare that the research was conducted without commercial or financial relationships that could be construed as potential conflicts of interest.
Abbreviations
The following abbreviations are used in this manuscript:
| ABL | Atmospheric boundary layer |
| AERONET | Aerosol Robotic Network |
| AOD | Aerosol optical depth |
| BT | Brightness temperature |
| CCN | Cloud condensation nuclei |
| CIAO | CNR-IMAA Atmospheric Observatory |
| COD | Cloud optical depth |
| ECMWF | European Centre for Medium-Range Weather Forecasts |
| GCCN | Giant cloud condensation nuclei |
| IN | Ice nuclei |
| IWP | Integrated water vapor |
| LDR | Linear depolarization ratio |
| LT | Local time |
| LWP | Liquid water path |
| MWR | Microwave radiometer |
| NWP | Numerical weather prediction |
| R | Rain rate |
| RMS | Peak width |
| SNR | Signal-to-noise ratio |
| VEL | Doppler velocity |
| Z | Equivalent reflectivity |
References
- Pöschl, U. Atmospheric Aerosols: Composition, Transformation, Climate and Health Effects. Angew. Chem. Int. Ed. 2005, 44, 7520–7540. [Google Scholar] [CrossRef]
- Pappalardo, G.; Mona, L.; D’Amico, G.; Wandinger, U.; Adam, M.; Amodeo, A.; Ansmann, A.; Apituley, A.; Alados Arboledas, L.; Balis, D.; et al. Four-dimensional distribution of the 2010 Eyjafjallajökull volcanic cloud over Europe observed by EARLINET. Atmos. Chem. Phys. 2013, 13, 4429–4450. [Google Scholar] [CrossRef]
- Rosenfeld, D.; Andreae, M.O.; Asmi, A.; Chin, M.; de Leeuw, G.; Donovan, D.P.; Kahn, R.; Kinne, S.; Kivekäs, N.; Kulmala, M.; et al. Global observations of aerosol-cloud-precipitation-climate interactions. Rev. Geophys. 2014, 52, 750–808. [Google Scholar] [CrossRef]
- Dagan, G.; Koren, I.; Altaratz, O. Aerosol effects on the timing of warm rain processes. Geophys. Res. Lett. 2015, 42, 4590–4598. [Google Scholar] [CrossRef]
- Feingold, G.; Cotton, W.; Kreidenweis, S.; Davis, J. The Impact of Giant Cloud Condensation on Drizzle Formation in Stratocumulus: Implications for Cloud Radiative Properties. J. Atmos. Sci. 1999, 56, 4100–4117. [Google Scholar] [CrossRef]
- Eagan, R.; Hobbs, P.; Radke, L. Measurements of CCN and cloud droplet size distribution in the vicinity of forest fires. J. Appl. Meteor. 1974, 13, 537–553. [Google Scholar] [CrossRef]
- DeMott, P.J.; Sassen, K.; Poellot, M.R.; Baumgardner, D.; Rogers, D.C.; Brooks, S.D.; Prenni, A.J.; Kreidenweis, S.M. African dust aerosols as atmospheric ice nuclei. Geophys. Res. Lett. 2003, 30, 1732–1735. [Google Scholar] [CrossRef]
- Möhler, O.; Field, P.R.; Connolly, P.; Benz, S.; Saathoff, H.; Schnaiter, M.; Wagner, R.; Cotton, R.; Krämer, M.; Mangold, A.; et al. Efficiency of the deposition mode ice nucleation on mineral dust particles. Atmos. Chem. Phys. 2006, 6, 3007–3021. [Google Scholar] [CrossRef]
- Ghate, V.P.; Albrecht, B.A.; Kollias, P.; Jonsson, H.H.; Breed, D.W. Cloud seeding as a technique for studying aerosol-cloud interactions in marine stratocumulus. Geophys. Res. Lett. 2007, 34, L14807. [Google Scholar] [CrossRef]
- Jung, E.; Albrecht, B.A.; Feingold, G.; Jonsson, H.H.; Chuang, P.; Donaher, S.L. Aerosols, clouds, and precipitation in the North Atlantic trades observed during the Barbados aerosol cloud experiment—Part 1: Distributions and variability. Atmos. Chem. Phys. 2016, 16, 8643–8666. [Google Scholar] [CrossRef]
- Segal, Y.; Khain, A.; Pinsky, M.; Rosenfeld, D. Effects of hygroscopic seeding on raindrop formation as seen from simulations using a 2000-bin spectral cloud parcel model. Atmos. Res. 2004, 71, 3–34. [Google Scholar] [CrossRef]
- Jung, E.; Albrecht, B.A.; Jonsson, H.H.; Chen, Y.C.; Seinfeld, J.H.; Sorooshian, A.; Metcalf, A.R.; Song, S.; Fang, M.; Russell, L.M. Precipitation effects of giant cloud condensation nuclei artificially introduced into stratocumulus clouds. Atmos. Chem. Phys. 2015, 15, 5645–5658. [Google Scholar] [CrossRef]
- Khain, A.; Ovchinnikov, M.; Pinsky, M.; Pokrovsky, A.; Krugliak, H. Notes on the state-of-the-art numerical modeling cloud microphysics. Atmos. Res. 2000, 55, 159–224. [Google Scholar] [CrossRef]
- Reiche, C.; Lasher-Trapp, S. The minor importance of giant aerosol to precipitation development within small trade wind cumuli observed during RICO. Atmos. Res. 2010, 95, 386–399. [Google Scholar] [CrossRef]
- Minor, H.; Rauber, R.; Göke, S.; Girolamo, L. Trade Wind Cloud Evolution Observed by Polarization Radar: Relationship to Giant Condensation Nuclei Concentrations and Cloud Organization. J. Atmos. Sci. 2011, 68, 1075–1096. [Google Scholar] [CrossRef]
- Di Girolamo, P.; De Rosa, B.; Summa, D.; Franco, N.; Veselovskii, I. Measurements of Aerosol Size and Microphysical Properties: A Comparison Between Raman Lidar and Airborne Sensors. J. Geophys. Res. Atmos. 2022, 127, e2021JD036086. [Google Scholar] [CrossRef]
- Mamouri, R.E.; Ansmann, A. Potential of polarization lidar to provide profiles of CCN- and INP-relevant aerosol parameters. Atmos. Chem. Phys. 2016, 16, 5905–5931. [Google Scholar] [CrossRef]
- van der Does, M.; Knippertz, P.; Zschenderlein, P.; Harrison, R.G.; Stuut, J.B.W. The mysterious long-range transport of giant mineral dust particles. Sci. Adv. 2018, 4, eaau2768. [Google Scholar] [CrossRef] [PubMed]
- Middleton, N.; Betzer, P.; Bull, P. Long-range transport of ‘giant’ aeolian quartz grains: Linkage with discrete sedimentary sources and implications for protective particle transfer. Mar. Geol. 2001, 177, 411–417. [Google Scholar] [CrossRef]
- Ryder, C.L.; Highwood, E.J.; Rosenberg, P.D.; Trembath, J.; Brooke, J.K.; Bart, M.; Dean, A.; Crosier, J.; Dorsey, J.; Brindley, H.; et al. Optical properties of Saharan dust aerosol and contribution from the coarse mode as measured during the Fennec 2011 aircraft campaign. Atmos. Chem. Phys. 2013, 13, 303–325. [Google Scholar] [CrossRef]
- Ginoux, P.; Prospero, J.; Gill, T.; Hsu, N. Natural and anthropogenic dust: From sources to radiative forcing derived from satellite data and GFDL climate model. In Proceedings of the AGU Fall Meeting Abstracts, San Francisco, CA, USA, 5–9 December 2011. [Google Scholar]
- Madonna, F.; Amodeo, A.; D’Amico, G.; Mona, L.; Pappalardo, G. Observation of non-spherical ultragiant aerosol using a microwave radar. Geophys. Res. Lett. 2010, 37, L21814. [Google Scholar] [CrossRef]
- Madonna, F.; Amodeo, A.; D’Amico, G.; Pappalardo, G. A study on the use of radar and lidar for characterizing ultragiant aerosol. Geophys. Res. 2013, 118, 10056–10071. [Google Scholar] [CrossRef]
- Madonna, F.; Amodeo, A.; Boselli, A.; Cornacchia, C.; Cuomo, V.; D’Amico, G.; Giunta, A.; Mona, L.; Pappalardo, G. CIAO: The CNR-IMAA advanced observatory for atmospheric research. Atmos. Meas. Tech. 2011, 4, 1191–1208. [Google Scholar] [CrossRef]
- Mona, L.; Papagiannopoulos, N.; Basart, S.; Baldasano, J.; Binietoglou, I.; Cornacchia, C.; Pappalardo, G. EARLINET dust observations vs. BSC-DREAM8b modeled profiles: 12-year-long systematic comparison at Potenza, Italy. Atmos. Chem. Phys. 2014, 14, 8781–8793. [Google Scholar] [CrossRef]
- Pappalardo, G.; Amodeo, A.; Mona, L.; Pandolfi, M.; Pergola, N.; Cuomo, V. Raman lidar observations of aerosol emitted during the 2002 Etna eruption. Geophys. Res. Lett. 2004, 31, L05120. [Google Scholar] [CrossRef]
- Görsdorf, U.; Lehmann, V.; Bauer-Pfundstein, M. Ka-band radar moment statistics and aspects of accuracy. In Proceedings of the 9th International Symposium on Tropospheric Profiling, L’Aquila, Italy, 3–7 September 2012. [Google Scholar] [CrossRef]
- Mishchenko, M.; Travis, L.; Kahn, R.; West, R. Modeling phase functions for dustlike tropospheric aerosols using a mixture of randomly oriented polydisperse spheroids. J. Geophys. Res. 1997, 102, 16831–16847. [Google Scholar] [CrossRef]
- Dubovik, O.; Sinyuk, A.; Lapyonok, T.; Holben, B.N.; Mishchenko, M.; Yang, P.; Eck, T.F.; Volten, H.; Munoz, O.; Veihelmann, B.; et al. Application of spheroid models to account for aerosol particle nonsphericity in remote sensing of desert dust. J. Geophys. Res. Atmos. 2006, 111, D11208. [Google Scholar] [CrossRef]
- Mishchenko, M.I.; Travis, L.D. Capabilities and limitations of a current FORTRAN implementation of the T-matrix method for randomly oriented, rotationally symmetric scatterers. J. Quant. Spectrosc. Radiat. Transf. 1998, 60, 309–324. [Google Scholar] [CrossRef]
- Mishchenko, M.I. Light scattering by size–shape distributions of randomly oriented axially symmetric particles of a size comparable to a wavelength. Appl. Opt. 1993, 32, 4652–4666. [Google Scholar] [CrossRef]
- Mishchenko, M.I. Calculation of the amplitude matrix for a nonspherical particle in a fixed orientation. Appl. Opt. 2000, 39, 1026–1031. [Google Scholar] [CrossRef]
- Bass, M.; DeCusatis, C.; Enoch, J.; Lakshminarayanan, V.; Li, G.; Mac-Donald, C.; Mahajan, V.; Stryland, E.V. Handbook of Optics, Third Edition Volume I: Geometrical and Physical Optics, Polarized Light, Components and Instrument, 3rd ed.; McGraw-Hill Professional: New York, NY, USA, 2009. [Google Scholar]
- Van de Hulst, H. Light Scattering by Small Particles; Dover Publications: Mineola, NY, USA, 1981. [Google Scholar]
- Mishchenko, M.I.; Travis, L.D.; Mackowski, D.W. T-matrix computations of light scattering by nonspherical particles: A review. J. Quant. Spectrosc. Radiat. Transf. 1996, 55, 535–575. [Google Scholar] [CrossRef]
- Vivekanandan, J.; Adams, W.; Bringi, V. Rigorous approach to polarimetric radar modeling of hydrometeor orientation distributions. J. Appl. Meteorol. 1991, 30, 1053–1063. [Google Scholar] [CrossRef]
- Lasher-Trapp, S.; Stachnik, J.P. Giant and ultragiant aerosol particle variability over the eastern Great Lakes region. J. Appl. Meteorol. Climatol. 2007, 46, 651–659. [Google Scholar] [CrossRef]
- Zhang, Y.; Saito, M.; Yang, P.; Schuster, G.; Trepte, C. Sensitivities of Spectral Optical Properties of Dust Aerosols to Their Mineralogical and Microphysical Properties. J. Geophys. Res. Atmos. 2024, 129, e2023JD040181. [Google Scholar] [CrossRef]
- Weinzierl, B.; Sauer, D.; Minikin, A.; Reitebuch, O.; Dahlkötter, F.; Mayer, B.; Emde, C.; Tegen, I.; Gasteiger, J.; Petzold, A.; et al. On the visibility of airborne volcanic ash and mineral dust from the pilot’s perspective in flight. J. Phys. Chem. Earth. 2012, 45–46, 87–102. [Google Scholar] [CrossRef]
- Adams, R.; Perger, F.; Rose, W.; Kostinski, A. Measurements of the complex dielectric constant of volcanic ash from 4 to 19 GHz. J. Geophys. Res. 1996, 101, 8175–8185. [Google Scholar] [CrossRef]
- Exton, H.J.; Latham, J.; Park, P.M.; Smith, M.H.; Allan, R.R. The Production and Dispersal of Maritime Aerosol. In Oceanic Whitecaps: And Their Role in Air-Sea Exchange Processes; Monahan, E.C., Niocaill, G.M., Eds.; Springer: Dordrecht, The Netherlands, 1986; pp. 175–193. [Google Scholar] [CrossRef]
- Clothiaux, E.; Ackerman, T.; Mace, G.; Moran, K.; Marchand, R.; Miller, M.; Martner, B. Objective determination of cloud heights and radar reflectivities using a combination of active remote sensors at the ARM CART sites. J. Appl. Meteor. 2000, 39, 645–665. [Google Scholar] [CrossRef]
- Khandwalla, A.; Majurec, N.; Sekelsky, S.; Williams, C.; Gage, K. Characterization of radar boundary layer data collected during the 2001 multi-frequency radar IOP. In Proceedings of the 12th ARM Science Team Meeting, St. Petersburg, FL, USA, 8–12 April 2002. [Google Scholar]
- Chapman, J.; Drake, V.; Reynolds, D. Recent insights from radar studies of insect flight. Annu. Rev. Entomol. 2011, 56, 337–356. [Google Scholar] [CrossRef]
- Marzano, F.; Barbieri, S.; Vulpiani, G.; Rose, W. Volcanic cloud retrieval by ground-based microwave weather radar. IEEE Trans. Geosci. Rem. Sens. 2006, 44, 3235–3246. [Google Scholar] [CrossRef]
- Marzano, F.; Vulpiani, G.; Rose, W. Microphysical Characterization of Microwave Radar Reflectivity Due to Volcanic Ash Clouds. IEEE Trans. Geosci. Rem. Sens. 2006, 44, 313–327. [Google Scholar] [CrossRef]
- Chapman, J.; Reynolds, D.; Smith, A. Vertical-looking radar: A new tool for monitoring high-altitude insect migration. BioScience 2004, 53, 503–5011. [Google Scholar] [CrossRef]
- Reynolds, D.; Chapman, J.; Edwards, A.; Smith, A.; Wood, C.; Barlow, J.; Woiwod, I. Radar studies of the vertical distribution of insects migrating over southern Britain: The influence of temperature inversions on nocturnal layer concentrations. Bull. Entomol. Res. 2005, 95, 259–274. [Google Scholar] [CrossRef] [PubMed]
- Reynolds, D.; Smith, A.; Chapman, J. A radar study of emigratory flight and layer formation at dawn over southern Britain. Bull. Entomol. Res. 2008, 98, 35–52. [Google Scholar] [CrossRef] [PubMed]
- Wood, C.; Chapman, J.; Reynolds, D.; Barlow, J.; Smith, A.; Woiwod, I. The influence of the atmospheric boundary layer on nocturnal layers of moths migrating over southern Britain. Int. J. Biometeorol. 2006, 50, 193–204. [Google Scholar] [CrossRef]
- Wood, C.; Reynolds, D.; Wells, P.; Barlow, J.; Woiwod, I.; Chapman, J.W. Flight periodicity and the vertical distribution of high-altitude moth migration over southern Britain. Bull. Entomol. Res. 2009, 99, 525–535. [Google Scholar] [CrossRef]
- Drake, V. The vertical distribution of macroinsects migrating in the nocturnal boundary layer: A radar study. Bound.-Layer Meteorol. 1984, 28, 353–374. [Google Scholar] [CrossRef]
- Drake, V.; Farrow, R. The influence of atmospheric structure and motions on insect migration. Annu. Rev. Entomol. 1988, 33, 183–210. [Google Scholar] [CrossRef]
- Gatehouse, A. Behavior and ecological genetics of wind-born migration by insects. Annu. Rev. Entomol. 1997, 42, 475–502. [Google Scholar] [CrossRef] [PubMed]
- Reynolds, A.; Reynolds, D.; Riley, J. Does a ‘turbophoretic’ effect account for layer concentrations of insects migrating in the stable night-time atmosphere? J. R. Soc. Interface 2009, 6, 87–95. [Google Scholar] [CrossRef][Green Version]
- Bauer-Pfundstein, M.; Görsdorf, U. Target separation and classification using cloud radar Doppler-spectra. In Proceedings of the 33rd International Conference on Radar Meteorology, Cairns, Australia, 6–10 August 2007. [Google Scholar]
- Luke, E.; Kollias, P.; Johnson, K.L.; Clothiaux, E.E. A technique for the automatic detection of insect clutter in cloud radar returns. J. Atmos. Ocean. Technol. 2007, 25, 1498–1513. [Google Scholar] [CrossRef]
- Møller, A. Long-term trends in wind speed, insect abundance and ecology of an insectivorous bird. Ecosphere 2013, 4, 1–11. [Google Scholar] [CrossRef]
- Reid, D.; Wardhaugh, K.; Roffey, J. Radar studies of insect flight at Benalla, Victoria, in February 1974. CSIRO Aust. Div. Entomol. Tech. Pap. 1979, 16, 21. [Google Scholar]
- Wood, C.; O’Connor, E.; Hurley, R.; Reynolds, D.; Illingworth, A. Cloud-radar observations of insects in the UK convective boundary layer. Meteorol. Appl. 2009, 16, 491–500. [Google Scholar] [CrossRef]
- Liu, L.; Mishchenko, M.I. Spectrally dependent linear depolarization and lidar ratios for nonspherical smoke aerosols. J. Quant. Spectrosc. Radiat. Transf. 2020, 248, 106953. [Google Scholar] [CrossRef]
- Mona, L.; Amodeo, A.; Pandolfi, M.; Pappalardo, G. Saharan dust intrusions in the Mediterranean area: Three years of Raman lidar measurements. J. Geophys. Res. Atmos. 2006, 111, D16203. [Google Scholar] [CrossRef]
- Mona, L.; Pappalardo, G.; Amodeo, A.; d’Amico, G.; Madonna, F.; Boselli, A.; Giunta, A.; Russo, F.; Cuomo, V. One year of CNR-IMAA multi-wavelength Raman lidar measurements in coincidence with CALIPSO overpasses: Level 1 products comparison. Atmos. Chem. Phys. 2009, 9, 7213–7228. [Google Scholar] [CrossRef]
- Koren, I.; Altaratz, O.; Remer, L.A.; Feingold, G.; Martins, J.V.; Heiblum, R.H. Aerosol-induced intensification of rain from the tropics to the mid-latitudes. Nat. Geosci. 2012, 5, 118–122. [Google Scholar] [CrossRef]
- Toledano, C.; Torres, B.; Velasco-Merino, C.; Althausen, D.; Groß, S.; Wiegner, M.; Weinzierl, B.; Gasteiger, J.; Ansmann, A.; González, R.; et al. Sun photometer retrievals of Saharan dust properties over Barbados during SALTRACE. Atmos. Chem. Phys. 2019, 19, 14571–14583. [Google Scholar] [CrossRef]
- Deaconu, L.T.; Mereuta, A.; Radovici, A.; Stefanie, H.; Camelia, B.; Ajtai, N. Consistency of Aerosol Optical Properties between MODIS Satellite Retrievals and AERONET over a 14-Year Period in Central–East Europe. Remote Sens. 2024, 16, 1677. [Google Scholar] [CrossRef]
- Pappalardo, G.; Wandinger, U.; Mona, L.; Hiebsch, A.; Mattis, I.; Amodeo, A.; Ansmann, A.; Seifert, P.; Linné, H.; Apituley, A.; et al. EARLINET correlative measurements for CALIPSO: First intercomparison results. J. Geophys. Res. Atmos. 2010, 115, D00H19. [Google Scholar] [CrossRef]
- Centro Funzionale Decentrato, Protezione Civile Regione Basilicata. Mappa Stazioni. 2024. Available online: https://centrofunzionale.regione.basilicata.it/ (accessed on 19 November 2024).
- Liu, F.; Rosenfeld, D.; Pan, Z.; Zang, L.; Mao, F. Combined effects of fine and coarse marine aerosol on vertical raindrop size distribution. Npj Clim. Atmos. Sci. 2024, 7, 2397–3722. [Google Scholar] [CrossRef]
Disclaimer/Publisher’s Note: The statements, opinions and data contained in all publications are solely those of the individual author(s) and contributor(s) and not of MDPI and/or the editor(s). MDPI and/or the editor(s) disclaim responsibility for any injury to people or property resulting from any ideas, methods, instructions or products referred to in the content. |
© 2025 by the authors. Licensee MDPI, Basel, Switzerland. This article is an open access article distributed under the terms and conditions of the Creative Commons Attribution (CC BY) license (https://creativecommons.org/licenses/by/4.0/).