Article

Dust Intensity Across Vegetation Types in Mongolia: Drivers and Trends

1
School of Environmental and Geographical Sciences, Shanghai Normal University, Shanghai 200234, China
2
Key Laboratory of Agricultural Water Resources, Hebei Laboratory of Agricultural Water-Saving, Center for Agricultural Resources Research, Institute of Genetics and Developmental Biology, Chinese Academy of Sciences, Shijiazhuang 050021, China
3
University of Chinese Academy of Sciences, Beijing 100049, China
4
Regional Environment Conservation Division, National Institute for Environmental Studies, Tsukuba 305-8506, Japan
5
Department of Biology, School of Art and Sciences, National University of Mongolia, Ulaanbaatar 210646, Mongolia
6
College of Geographical Science, Inner Mongolia Normal University, Hohhot 010022, China
*
Author to whom correspondence should be addressed.
Remote Sens. 2025, 17(3), 410; https://doi.org/10.3390/rs17030410
Submission received: 14 December 2024 / Revised: 14 January 2025 / Accepted: 23 January 2025 / Published: 25 January 2025

Abstract

:
Dust storms, characterized by their rapid movement and high intensity, present significant challenges across atmospheric, human health, and ecological domains. This study investigates the spatiotemporal variations in dust intensity (DI) and its driving factors in Mongolia from 2001 to 2022, using data from ground observations, reanalysis, remote sensing satellites, and statistical analyses. Our findings show an increasing DI trend at approximately two-thirds of the monitoring stations, with DI rising at an average rate of 0.8 per year during the study period. Anthropogenic factors dominate as the primary drivers in regions such as Forest, Meadow Steppe, Typical Steppe, Desert Steppe, and the Gobi Desert. For example, GDP significantly impacts Forest and Meadow Steppe areas, contributing 25.89% and 14.11% to influencing factors of DI, respectively. Population emerges as the key driver in Typical Grasslands (20.77%), Desert Steppe (26.65%), and the Gobi Desert (37.66%). Conversely, climate change is the dominant factor in the Alpine Meadow regions of southern–central Hangay Uul, with temperature (20.69%) and relative humidity (20.67%) playing critical roles. These insights are vital for Mongolian authorities: promoting green economic initiatives could mitigate DI in economically active Desert Steppe regions, while climate adaptation strategies are essential for climate-sensitive Alpine Meadows. The findings also provide valuable guidance for addressing environmental issues in other arid and semi-arid regions worldwide.

1. Introduction

Dust storms are among the most significant natural disasters impacting arid and semi-arid regions, affecting approximately 330 million people annually across 151 countries worldwide [1]. These storms pose severe threats to environmental sustainability, human health, and economic stability. Globally, they contribute to atmospheric pollution, disrupt ecosystems, and influence weather patterns by altering the Earth’s radiation balance. Dust storms also exacerbate respiratory and cardiovascular diseases, presenting a critical challenge to achieving the United Nations’ Sustainable Development Goals (SDGs) [2,3,4,5]. In Asia, Mongolia is a prominent source of dust storms [6], which exacerbate regional issues such as desertification, biodiversity loss, and respiratory health problems while affecting neighboring countries like China and the broader Asia–Pacific region [7,8]. Over the past few decades, the frequency and intensity of dust storms in Mongolia have significantly increased, amplifying concerns about their implications in the context of climate change [9]. However, the uncertainty surrounding the future trajectory of these trends underscores the need to better understand their temporal and spatial characteristics and underlying driving factors.
The global significance of dust storms has been amplified by the dual influences of climate change and human activities, which have intensified their frequency and severity. Natural factors such as strong winds, high temperatures, and reduced precipitation interact with anthropogenic drivers, including land-use changes, overgrazing, and mining, to accelerate desertification and soil erosion. These interactions highlight the necessity of understanding the spatial and temporal characteristics of dust storms and their driving forces. Studies have shown that wind speed is a primary driver of dust storms, with frequency increasing as wind intensity rises [10,11,12]. The material basis of dust storms—dust particles—originates primarily from exposed, loose soil surfaces [13,14]. Additionally, unstable thermal conditions, such as high temperatures and air pressure fluctuations, enhance wind strength and atmospheric convection, facilitating the uplift and dispersion of dust particles [15]. These factors, intricately linked to climate change, are further modulated by human activities.
As climate change accelerates, the variability of natural factors has become more pronounced. Rising temperatures and reduced precipitation have exacerbated drought conditions, expanding desertified areas and increasing the prevalence of exposed, loose surfaces [16]. Concurrently, human activities such as land-use changes, overgrazing, and mining have significantly degraded grassland ecosystems, leaving larger areas of bare soil [17,18,19]. The interaction between these anthropogenic disturbances and climatic variables has further escalated the frequency and severity of dust storms. For instance, studies reveal that dust storms in desert regions are predominantly driven by atmospheric pressure variations, whereas those in grassland areas are more closely associated with land-use changes and vegetation cover [20,21]. Despite these insights, the specific impacts of natural and anthropogenic factors on dust intensity (DI) across Mongolia’s diverse vegetation types—a region highly sensitive to global warming—remain inadequately explored.
While existing research has identified key drivers of dust activity, such as wind speed, vegetation cover, and soil moisture, significant gaps persist in understanding how these factors vary across Mongolia’s different vegetation zones. Most studies have focused on regional or localized analyses, without comprehensively linking natural and anthropogenic drivers to spatial and temporal variations in DI. Furthermore, the combined effects of these drivers on diverse ecosystems have received limited attention, leaving critical uncertainties about dust dynamics across Mongolia’s varied landscapes.
This study aims to address these gaps by providing a comprehensive analysis of spatiotemporal variations in DI across Mongolia from 2001 to 2022. It focuses on identifying the dominant natural and anthropogenic factors influencing DI in distinct vegetation zones, including Forest, Meadow Steppe, Typical Steppe, Desert Steppe, the Gobi Desert, and Alpine Meadow regions. By integrating ground observations, reanalysis data, remote sensing techniques, and advanced statistical methods, this research offers valuable insights into the mechanisms driving dust storms in Mongolia. These findings are crucial for improving the accuracy of dust storm predictions and for developing targeted mitigation and adaptation strategies, not only for Mongolia, but also for other arid and semi-arid regions worldwide.

2. Materials and Methods

2.1. Study Area

Mongolia, a landlocked country in the heart of Asia, spans an area of approximately 1.56 million km2. Its coordinates range from 87°47′E to 119°57′E longitude and 41°35′N to 52°09′N latitude. As shown in Figure 1, Mongolia features diverse geographical characteristics, with elevated terrain in the northwest and lowlands in the southeast, underpinned by a complex geological structure. It is also one of the driest countries in the world. The circles in Figure 1a indicate the locations of 58 meteorological stations, which are evenly distributed throughout the country (see Table S1). These stations provide crucial data for understanding regional climatic conditions. The landscape transitions through seven distinct vegetation regions from north to south, with the Gobi Desert, covering about a third of the country [22], serving as a significant source of dust storm material (Figure 1b).

2.2. Materials

We obtained dusty weather data, including floating dust (FD, ww = 06), blowing dust (BD, ww = 07), and dust storms (DS, ww = 09, 30–35), as well as WS data [23,24], provided by the World Meteorological Organization (WMO). These data were recorded every 3 or 6 h at 58 stations during the spring from 2001 to 2022.
For the climate data, we employed data on 2 m temperature (T), total precipitation (PRCP), relative humidity (RH), and mean sea level pressure (MSLP). These data, covering the spring seasons from 2001 to 2022, were sourced from the fifth-generation ECMWF reanalysis (ERA5), which is provided at a resolution of 0.25° × 0.25°; however, the wide spacing of observation stations in certain areas may result in potential accuracy limitations.
For the underlying surface data, we selected spring 0–7 cm volumetric soil water (SW), the spring kernel normalized difference vegetation index (kNDVI), and spring snow cover data from 2001 to 2022. We also included summer kNDVI and winter snow cover data from 2000 to 2021. The SW data were obtained from the ERA5 dataset. The kNDVI data were calculated using Google Earth Engine based on MOD13Q1 data, as shown in Equation (1) [25]. Snow cover data were sourced from the MOD10A1 500 m dataset.
k N D V I = tanh ( N D V I 2 )
Data on anthropogenic factors, including population, livestock, and GDP per capita, were obtained from the Mongolia National Statistical Office, as detailed in Table 1. To identify factors influencing vulnerability to DI, livestock numbers were converted to Sheep Forage Units (SFU) using the following conversion rates: 1 sheep = 1 SFU, 1 horse = 7 SFU, 1 goat = 0.9 SFU, 1 cow = 6 SFU, and 1 camel = 5 SFU [26,27]. In this paper, all livestock are referred to in terms of SFU.

2.3. Methods

2.3.1. Dust Intensity (DI) and Maximum Wind Speed (WS)

To assess the intensity of Mongolian dust storms, we first aggregated dusty weather data, recorded every 3 or 6 h, into daily records. When instances of FD, BD, or DS were recorded multiple times at each monitoring station within a day, we labeled that day as having FD, BD, or DS weather, respectively. The monthly average count of FD, BD, or DS was then calculated for each monitoring station. Based on this, this study defines the dust intensity (DI) for Mongolia based on the concentration ratio between FD, BD, and DS, where the concentration of DS is approximately three times that of BD, or nine times that of FD, with the following Equation (2) [28,29]:
D I = F D + B D × 3 + D S × 9
Subsequently, we extracted WS data corresponding to the dust occurrence dates and calculated the monthly average WS values.

2.3.2. Theil–Sen Median and Mann–Kendall

In this study, we utilized the Theil–Sen median estimator in combination with Mann–Kendall tests to evaluate trends in DI and its influencing factors [30,31]. The Theil–Sen method was first applied to estimate trends, followed by the Mann–Kendall test, which was used to assess the statistical significance of the identified trends. This integrated approach, characterized by robustness and a non-parametric nature, ensures the accuracy and reliability of the trend analysis, making it highly applicable across various research domains. The specific calculation steps are as follows:
Step 1: Calculate the Theil–Sen median estimator (β) for time-series data (X = {x1, x2, x3, …, xn}), including the DI and its influencing factors.
β = m e d i a n x i + x j i j , i > j
In Equation (3), the variables xi and xj represent each pair of data points in the time series. If β > 0, DI shows an increasing trend; if β < 0, DI shows a decreasing trend.
Step 2: Assess the statistical significance of the identified trends. ① The Mann–Kendall time-series statistic (S) is calculated as follows:
S = i = 1 n 1 j = i + 1 n sgn ( x i x j )
In Equation (4), n represents the count of the samples and sgn(xixj) is the sign function, defined as follows:
sgn ( x i x j ) = + 1 , x i x j > 0     0 , x i x j = 0 1 , x i x j < 0
② Compute the variance of S (for n > 10).
V a r ( S ) = 1 18 n ( n 1 ) ( 2 n + 5 ) i = 1 m t i ( t i 1 ) ( 2 t i + 5 )
where m represents the number of tied groups and ti signifies the size of group i.
③ Calculate the standardized test statistics (Zk). If Zk > 0, DI shows an increasing trend; if Zk < 0, DI shows a decreasing trend. When the absolute value of Zk exceeds 1.65, 1.96, and 2.58, it signifies that the trend passes the significance test at confidence levels of 90%, 95%, and 99%, respectively.
Z k = S V a r ( S ) ( S > 0 )     0     ( S = 0 ) S + 1 V a r ( S ) ( S < 0 )

2.3.3. Feature Importance

To identify the primary factors influencing DI, we calculated the mean values of T, PRCP, RH, MSLP, SW, kNDVI, population, livestock numbers, and GDP per capita within a 10 km buffer around each station based on trend analysis. We then utilized the Gini importance measure from the random forest methodology to evaluate the relative impact of these factors on DI [32]. Gini importance is derived by assessing how much each feature reduces the Gini impurity in decision trees. Specifically, for each feature, the reduction in impurity is averaged over all the trees in the forest to determine the feature’s overall importance to the model’s accuracy. To ensure the reliability of our results, we performed 100 independent permutations for each feature and calculated the mean of the resulting accuracy degradation, thereby minimizing the impact of randomness. The Gini index G(t) for a given node t with K classes is computed using the following Formula (8):
G ( t ) = i = 1 k p ( i t ) ( 1 p ( i t ) )
where p(i|t) represents the proportion of samples belonging to class i in the node t.
The G(t) ranges from 0 to 1, where values closer to 0 signify lower impurity, while values closer to 1 signify higher impurity. During the node splitting process, the decision tree algorithm selects the feature that maximally reduces the G(t) to achieve optimal classification.
Specifically, for a node t, considering a split on feature Xj that produces left child node left and right child node right, the impurity decrease is given by
I m p u r i t y   D e c r e a s e X j ( t ) = G ( t ) N l e f t N t · G ( l e f t ) + N r i g h t N t · G ( r i g h t )
where Nt is the total number of samples in node t, while Nleft and Nright are the sample counts in the left and right child nodes, respectively.
The Gini importanceXj is then calculated as the average of Gini decreases across all nodes in all trees:
G i n i   i m p o r t a n c e X j = a l l   n o d e s I m p u r i t y   D e c r e a s e X j ( t ) N u m b e r   o f   T r e e s
The higher the Gini importance, the more influential the feature is in the random forest model for making classification decisions.

3. Results

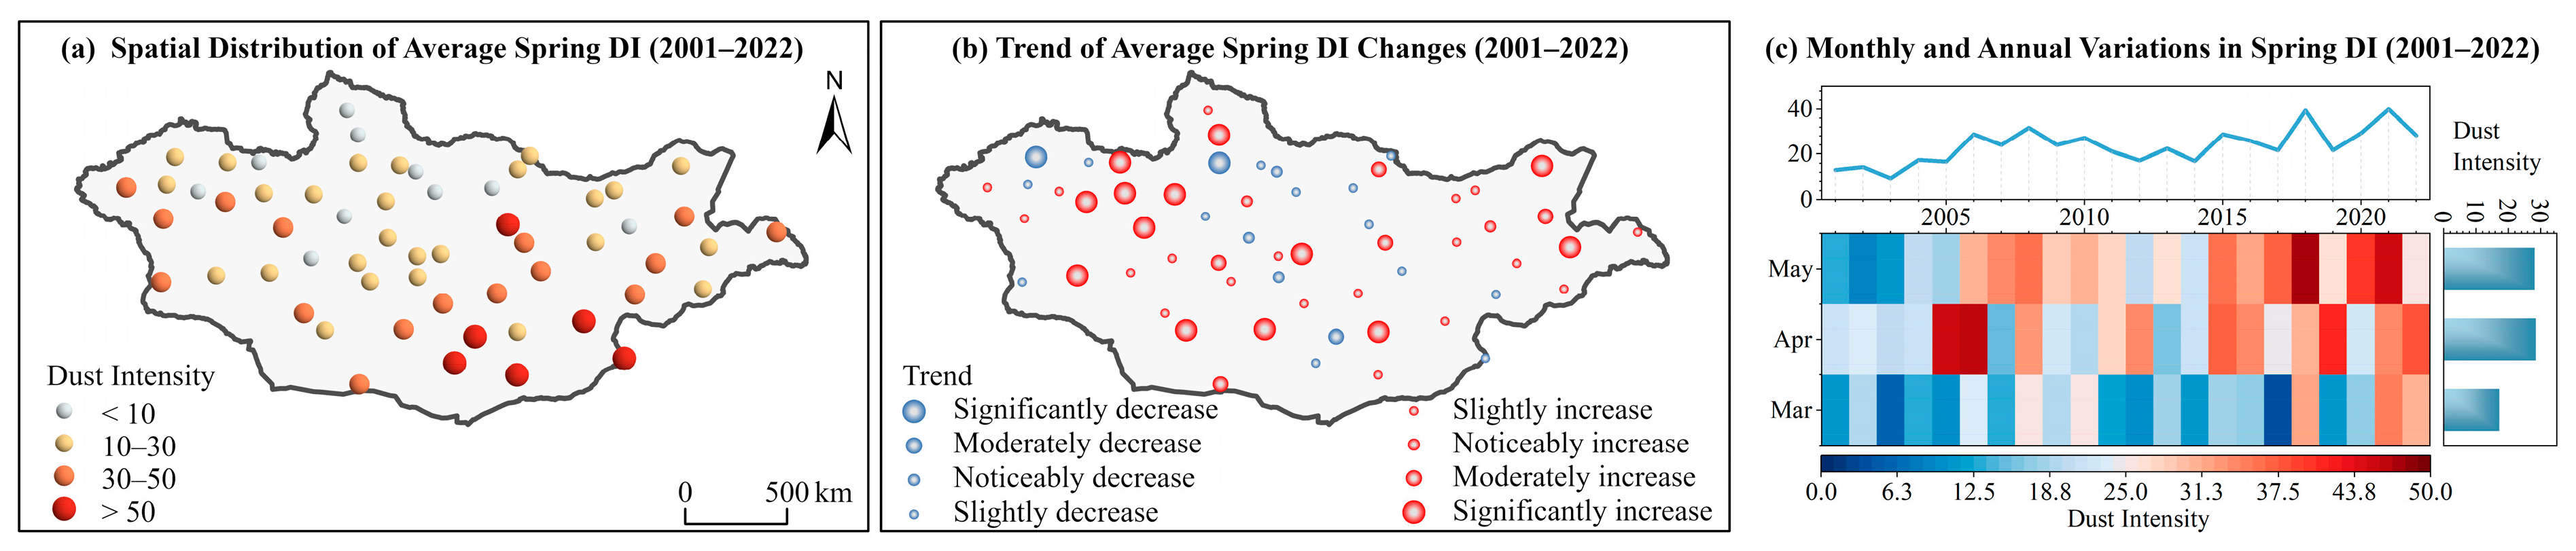
3.1. Enhancement in Dust Intensity over the Past Two Decades

Between 2001 and 2022, the average spring dust intensity (DI) in Mongolia was 25.66. Among monitoring stations, 10.34% recorded a DI above 50, while 27.59% reported values between 30 and 50. Figure 2a illustrates the spatial distribution of DI during spring, revealing significantly higher values in the southeastern Gobi Desert region of Mongolia compared to the central and northwest grassland regions. The Tsogt-Ovoo station, located in the Gobi Desert near the Mongolia–China border, recorded the highest DI of 78.73, whereas the Tariat station in the northern Khangai mountains reported the lowest DI of 3.38.
Over the past two decades, DI trends have varied across monitoring stations. As shown in Figure 2b, about two-thirds of the stations exhibited increasing DI, with over half showing a statistically significant rise (α < 0.01). On average, the spring DI across Mongolia increased from 15.14 in 2001 to 32.68 in 2022, at a rate of approximately 0.8 per year (Figure 2c). The highest annual DI was recorded in 2021 (DI = 37.95), while 2003 had the lowest values. Monthly variations indicate that DI peaks in April, followed by May and March.

3.2. Variations in Impact Factors of Dust Intensity

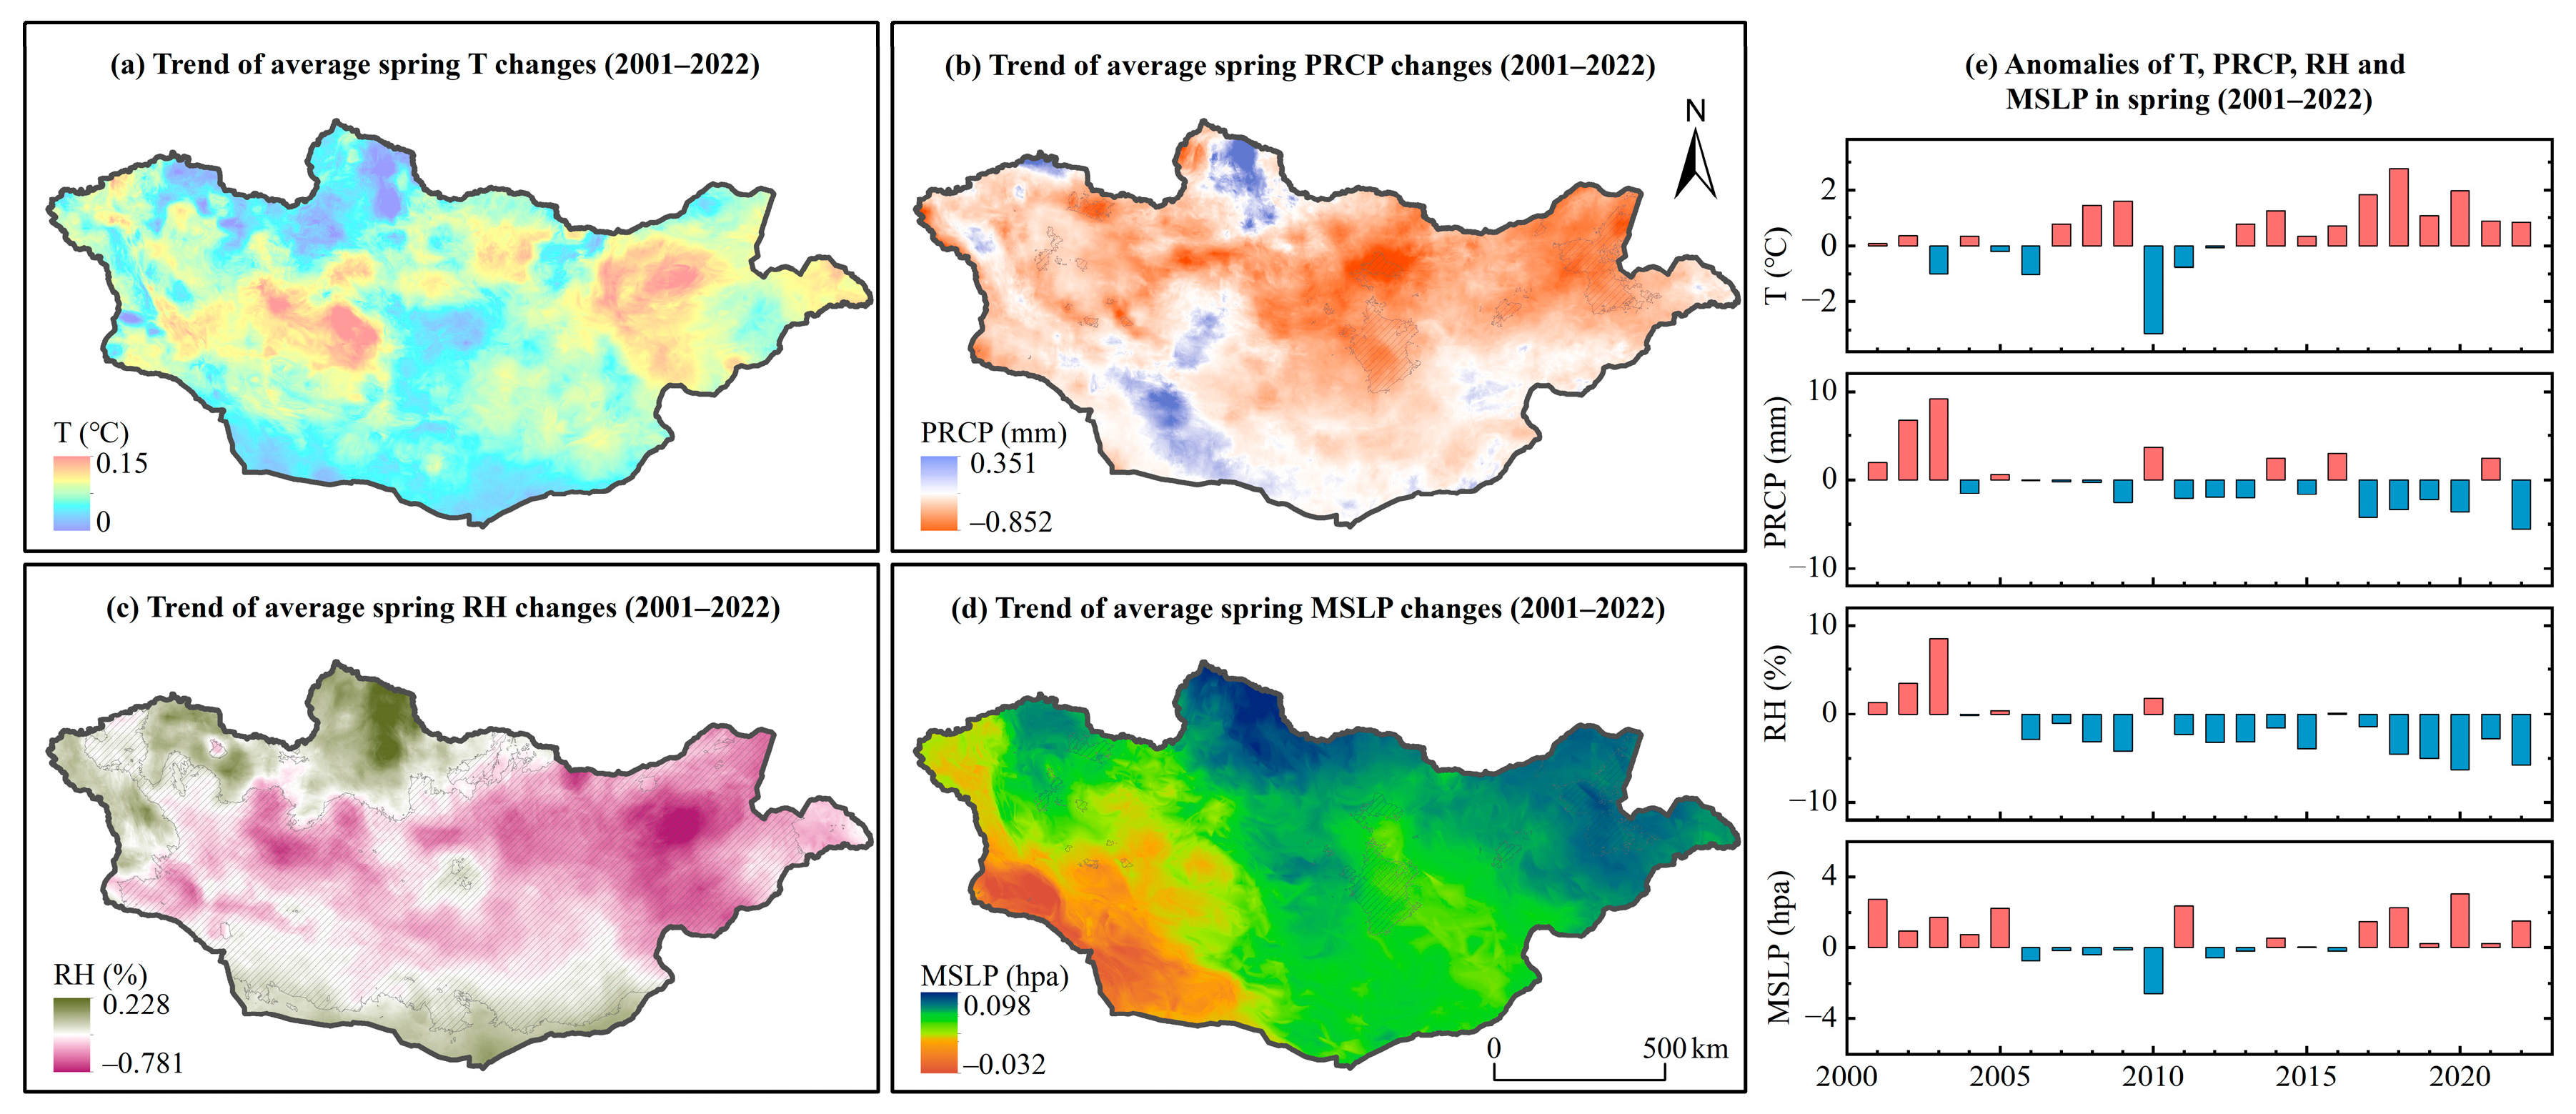
3.2.1. Climate Factors

The spatiotemporal characteristics of climatic factors influencing DI were analyzed for spring (2001–2022), focusing on wind speed (WS), temperature (T), precipitation (PRCP), relative humidity (RH), and pressure. Figure 3a shows that mean WS was higher in southeastern Mongolia, aligning with the observed DI distribution (Figure 2a). This spatial pattern highlights the influence of WS in shaping the arid conditions and elevated DI value characteristic of the Gobi Desert regions. Among the studied locations, the Tsogt-Ovoo station reported the highest monthly mean WS of 22.14 m/s, while stations in northwestern regions such as Gandan Huryee and Tsetsen Uul reported values below 10 m/s.
Interestingly, despite DI increases, 60.34% of stations reported decreasing WS trends, with 25.86% showing statistically significant declines, particularly in the southern Gobi Desert (Figure 3b). The average spring WS in Mongolia decreased from 12.59 m/s in 2001 to 10.49 m/s in 2022 at a rate of approximately 0.1 m/s annually (Figure 3c), with the lowest WS recorded in 2017 (9.42 m/s).
Figure 4 highlights the spatiotemporal variations in other climatic factors. Temperature exhibited a significant upward trend, rising from 3.15 °C in 2001 to 4.18 °C in 2022, particularly in the Hangay Uul region, where spring temperatures increased by 0.15 °C per year. Conversely, PRCP and RH showed overall declines, with significant reductions observed in 5.9% and 72.57% of the study area, respectively (α < 0.05). This drying trend enhances conditions for dust storms. Variations in pressure patterns also influenced atmospheric circulation, contributing to DI changes.

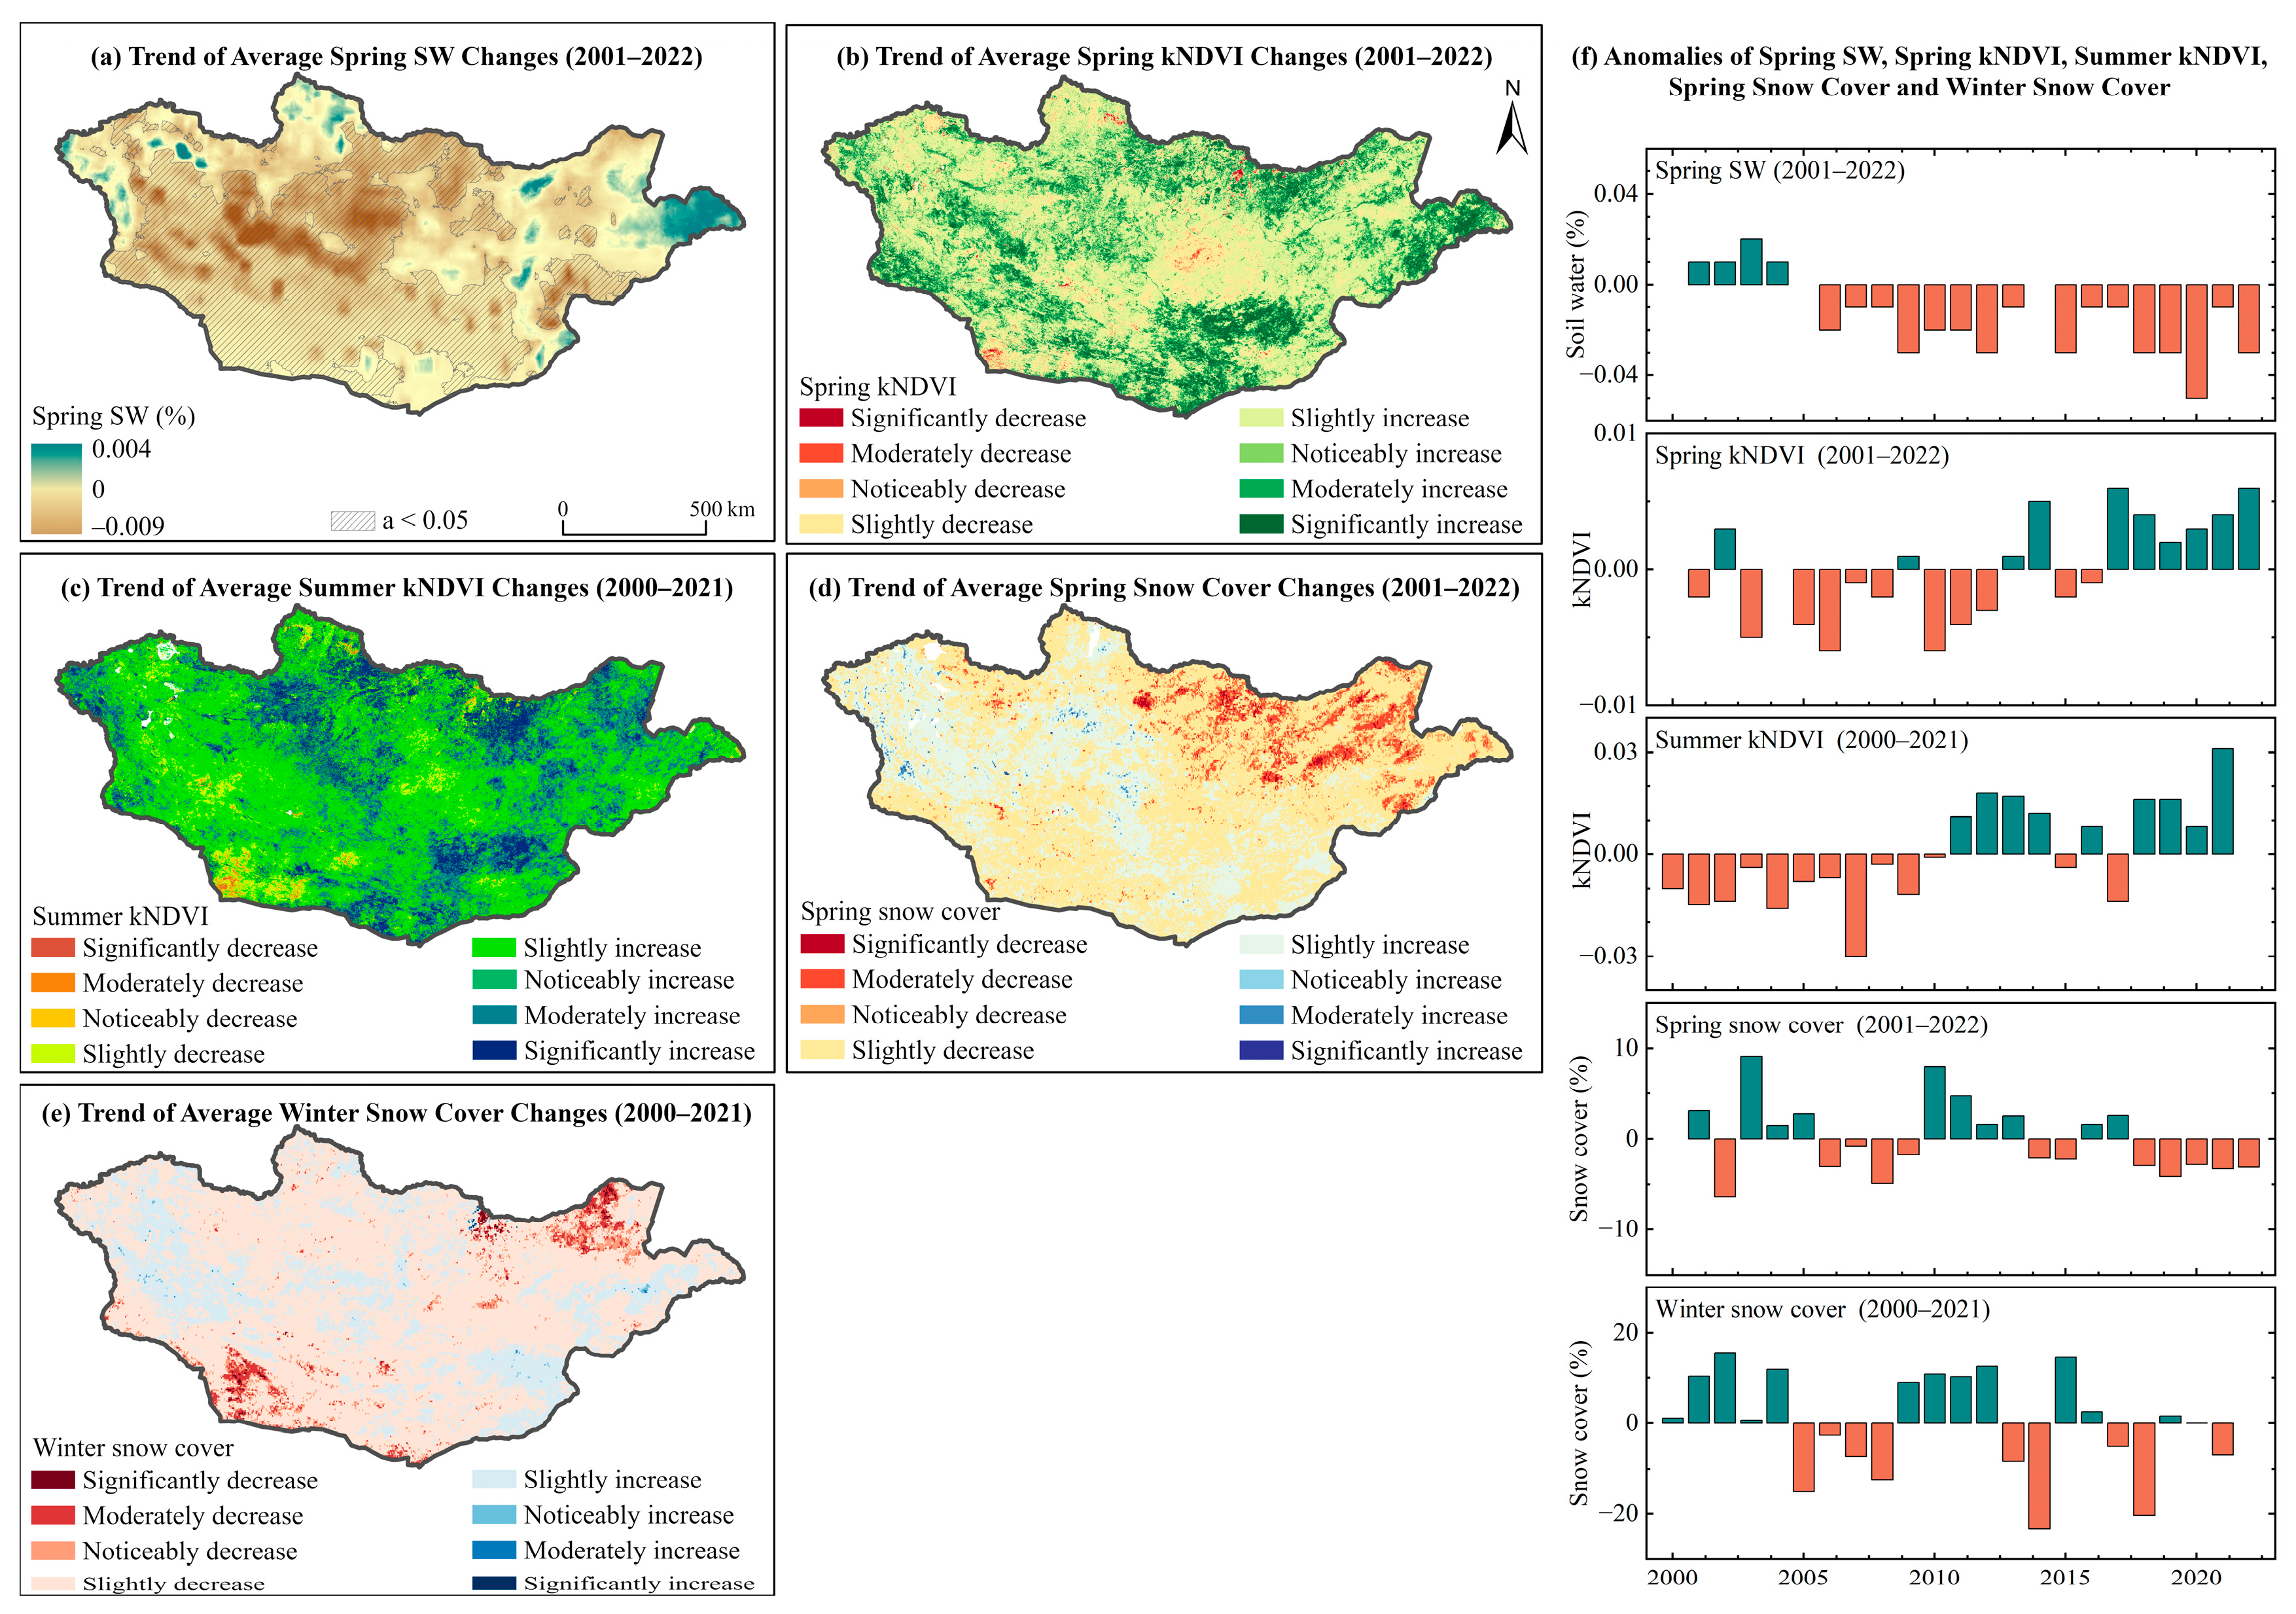
3.2.2. Underlying Surface Conditions

The formation of dust storms depends not only on climatic factors, but also on the exposed underlying surface, which serves as a critical material source [13]. Soil water (SW), the normalized difference vegetation index (kNDVI), and snow cover play key roles in influencing dust intensity (DI). To thoroughly investigate these factors, we analyzed the spatiotemporal variations in kNDVI and snow cover during spring from 2001 to 2022 (Figure 5a,b,d). Additionally, we examined the previous-summer kNDVI and winter snow cover from 2000 to 2021 (Figure 5c,e).
As shown in Figure 5a,f, over the 22-year period, 54.16% of the Mongolian regions experienced a significant decreasing trend in spring SW (α < 0.05). Meanwhile, Figure 5b,f indicate that approximately 86.43% of the regions exhibited an increasing trend in spring kNDVI. Of these, 15.67% showed a statistically moderate increase (α < 0.05), while 11.68% demonstrated a statistically significant increase (α < 0.05). However, only 1.05% of the regions displayed a statistically significant decrease (α < 0.1), primarily concentrated near Ulaanbaatar and the China–Mongolia border in the southwest. The trend in summer kNDVI mirrored that of spring, exhibiting a consistent increase (Figure 5c,f). This increase in kNDVI, despite the decline in spring SW, can be attributed to the temporary water supply provided by melting snow, which aids vegetation recovery. However, the rise in NDVI may also indicate grassland degradation, with drought-tolerant and invasive plants, such as weeds, taking over and altering the ecological structure. This could further exacerbate desertification and DI.
In contrast, snow cover trends were opposite to those of the kNDVI. As depicted in Figure 5d,f, approximately 70.46% of the regions displayed a decreasing trend in spring snow cover, with 4.37% showing a statistically moderate increase (α < 0.05) and 0.54% exhibiting a statistically significant decrease (α < 0.01). Significant decreases were primarily observed in the eastern and northern regions. However, 11.41% of the regions exhibited a significant increasing trend, mainly concentrated around the Hangay Uul and Altai Mountains in central and western Mongolia.
Winter snow cover trends followed a similar decreasing pattern to spring snow cover (Figure 5d,e). The reduction in snow cover could lead to more exposed and dry surfaces, potentially amplifying conditions favorable for increased DI.

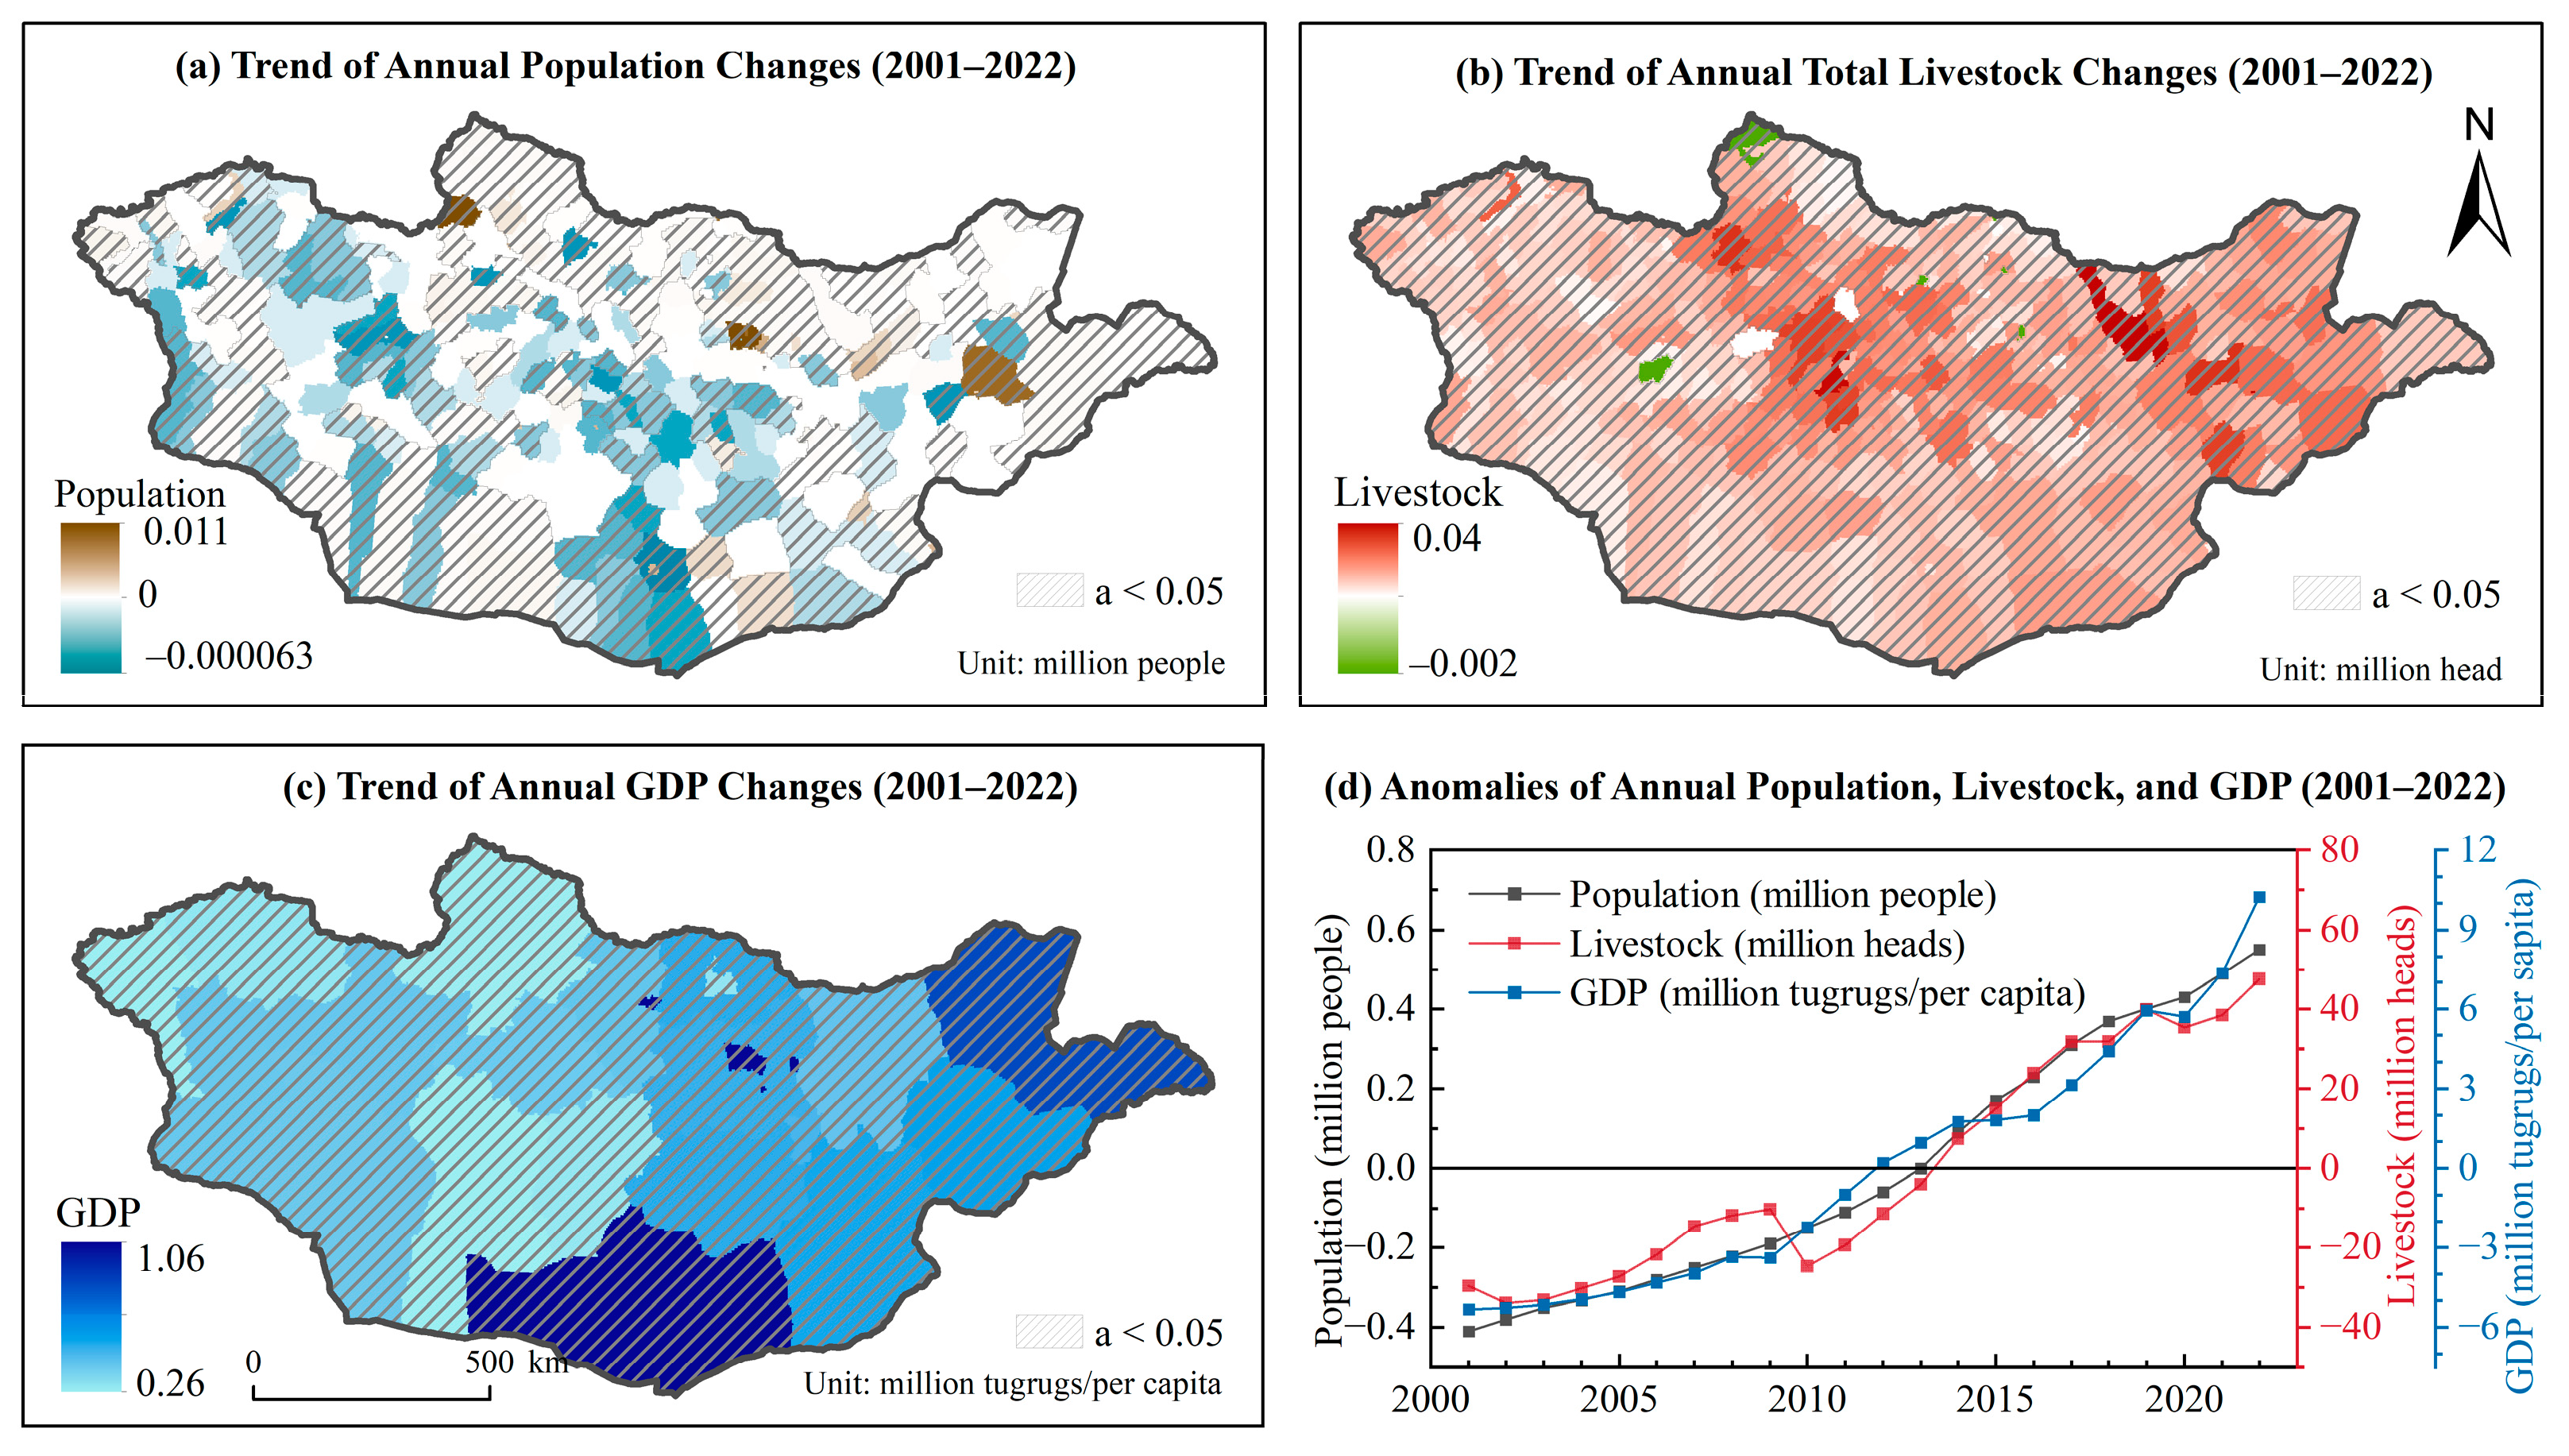
3.2.3. Anthropogenic Factors

Human activities significantly influence dust intensity (DI), alongside natural factors. To evaluate this impact, we analyzed the spatiotemporal variations in population numbers, livestock numbers per administrative unit (Soum), and Gross Domestic Product (GDP) by province (Aimag) from 2001 to 2022.
Figure 6 illustrates the upward trends in Mongolia’s population, livestock numbers, and per capita GDP, with annual increases of approximately 0.04 million people, 3.51 million livestock, and MNT 0.71 million (the national currency), respectively. Spatially, population numbers have significantly declined in the southern and western regions, while the eastern and northern regions have experienced substantial growth, particularly in Ulaanbaatar and Sukhbaatar (Figure 6a). This may be due to population mobility due to urbanization [33]. In contrast to the uneven population distribution, livestock numbers and GDP show consistent increases across most regions (Figure 6b,c).
The combined effects of population growth, economic development, and rising livestock numbers contribute to land degradation, which may intensify dust storm severity. The accelerated urbanization process has resulted in approximately 60% of the population being concentrated in Ulaanbaatar and its surrounding areas, altering soil surface conditions and creating new sources of dust. Simultaneously, nearly half of the population relies on nomadic pastoralism, and the continuous increase in livestock numbers has exceeded the carrying capacity of grasslands, further leading to grassland degradation and the expansion of dust sources. Moreover, Mongolia’s GDP heavily depends on mining and agricultural activities, which substantially influence land use and environmental conditions, thereby affecting the formation and intensity of dust storms. Collectively, these anthropogenic activities amplify the impacts of climate change, making dust storm issues increasingly severe, highlighting the need for targeted mitigation strategies.

3.3. Importance of Impact Factors on Dust Intensity

Using the spatiotemporal characteristics of spring DI and its influencing factors, we analyzed the drivers of DI across various vegetation regions. The analysis revealed that each region is governed by distinct primary drivers, as depicted in Figure 7.
In regions with dense vegetation and stable soils, such as Forest, Meadow Steppe, Typical Steppe, and Shrub, DI is predominantly influenced by climatic and anthropogenic factors. Specifically, GDP emerged as the most critical driver in Forest and Meadow Steppe regions, with influence weights of 25.77% and 14.77%, respectively. In Typical Steppe and Shrub regions, population impact is the most pronounced, accounting for 20.77% and 34.85%, respectively. For Typical Steppe regions, wind speed (WS) (11.41%) and soil water (SW) (10.42%) are the next most significant contributors. In Shrub regions, GDP (11.45%) and WS (12.44%) also play substantial roles.
In the arid Desert Steppe and Gobi Desert regions, DI is primarily influenced by anthropogenic factors and underlying surface conditions. Among these, population numbers are the most significant driver, with importance values of 26.65% in Desert Steppe and 37.66% in the Gobi Desert. Underlying surface factors also play a pivotal role, although their contributions vary. In Desert Steppe, spring kNDVI and the previous summer’s kNDVI significantly influence DI, contributing 9.98% and 9.33%, respectively. Conversely, in the Gobi Desert, spring snow cover is the dominant surface factor, accounting for 13.86% of the total DI impact.
In Alpine Meadow regions, DI is primarily driven by climatic factors and underlying surface conditions. Temperature (T) is the most significant contributor, accounting for 20.69% of the total impact, closely followed by relative humidity (RH) at 20.67%. Spring snow cover also plays a notable role, contributing 17.72% to DI in these regions.
These findings underscore the need for region-specific mitigation strategies. In regions dominated by anthropogenic influences, such as Desert Steppe and the Gobi Desert, strategies should prioritize sustainable land-use practices and population management. Conversely, in climate-sensitive regions like Alpine Meadows, climate adaptation measures must be emphasized to address the effects of rising temperatures and declining RH. Additionally, a comprehensive approach that integrates green economic initiatives with robust environmental regulations is critical to effectively address the complex interplay of natural and anthropogenic factors driving DI.

4. Discussion

Over the past two decades, the spatiotemporal variations in DI have exhibited highly complex patterns. These variations are likely the result of a combination of natural factors and human activities, including climate change, alterations in surface conditions, and the overexploitation of land. Such factors pose significant threats to both the ecological environment and human society.

4.1. Dust Intensity Spatiotemporal Variability

The higher spring DI observed in southeastern Mongolia compared to northwestern Mongolia (Figure 2a), as outlined in Section 3.1, can be attributed to several key factors. Firstly, the southeastern region experiences stronger wind speeds than the northwest (Figure 3a) and is predominantly covered by the Gobi Desert and Desert Steppe (Figure 1b). These conditions provide a sufficient dynamic and material basis for the occurrence of dust storms. Secondly, the generally higher temperatures in the southeastern region compared to the northwest result in rapid soil thawing and snowmelt, accompanied by a significant increase in evapotranspiration. Coupled with lower precipitation and reduced soil moisture, these conditions lead to a looser and more exposed ground surface (see Figure S1), thereby intensifying the frequency and intensity of dust storms. Additionally, the proximity of the southeastern region to the Sino–Mongolian border, characterized by frequent international transportation and intensive human activities, such as mineral extraction, has further intensified environmental pressures [34], contributing to the higher DI observed in this area.
From 2001 to 2022, approximately two-thirds of the monitoring stations showed an upward trend in the spring DI values (Figure 2b). This trend is linked to global warming, which has led to increased T and decreased PRCP in Mongolia. These changes have reduced SW and RH, making the surface more susceptible to wind erosion and exacerbating the formation and propagation of dust storms [35]. Additionally, the increase in livestock numbers has led to land degradation, reducing the grazing capacity of grasslands and accelerating desertification, which in turn intensifies wind erosion [17]. The correlation heatmap between the DI values and influencing factors at monitoring stations with enhanced DI (Figure 8), along with Figure 4, Figure 5 and Figure 6, further confirm this. The heatmap shows a significant positive correlation at the 0.05 level between DI and factors such as T, WS, population, livestock numbers, and GDP, while a significant negative correlation is observed with SW, PRCP, RH, kNDVI, and snow cover.
Excessive mineral extraction and vehicle trampling have also exacerbated the vulnerability of grasslands, making the soil more prone to erosion [19,36,37]. In particular, mining activities have significantly impacted soil structure through compaction, vegetation destruction, and increased pollution, leading to a reduction in soil permeability and fertility, further enhancing the DI.
Over the past 22 years, spring DI was at its lowest in 2003 and peaked in 2021 (Figure 2c). This trend may be associated with the winter dust events of 2002, which led to increased soil moisture in the subsequent spring, thereby enhancing vegetation growth and reducing the DI [38]. In contrast, the spring of 2021 experienced higher temperatures, reduced precipitation, and increased wind speed, which elevated the potential for dust generation and dispersion [39]. Based on ground observations and Cloud-Aerosol Lidar and Infrared Pathfinder Satellite Observation (CALIPSO) data, the dust event in the spring of 2021 was triggered by a cold high-pressure system. In the Gobi Desert region, the rise in near-surface temperatures led to early snowmelt and reduced precipitation, which resulted in drier and more exposed soil, thereby intensifying the DI [40].

4.2. Impacts Factors of Spatiotemporal Variability

We found that during dusty weather in Mongolia, the WS in the southeastern region is generally higher than in the northwestern region (Figure 3a), aligning with the spatial distribution of DI (Figure 2a). This phenomenon may result from the vast plains in the southeast, where reduced resistance allows higher wind speeds [41], in contrast to the northwest, where complex mountainous terrain often impedes wind flow, resulting in lower speeds. However, time-series data reveal that approximately 60.34% of monitoring stations exhibit a significant decreasing trend in WS, which contradicts the increasing trend in DI. This phenomenon may be attributed to accelerated Arctic warming, which reduces the temperature gradient between the polar and mid-latitude regions, thereby altering atmospheric circulation dynamics and leading to a decline in wind speed across Mongolia. Figure 8 shows that a significant positive correlation exists between DI and WS. This indicates that although WS serves as the primary driving force for dust activities, it is not the dominant factor contributing to the increase in DI in Mongolia over the past two decades.
In Mongolia, T has increased significantly, while PRCP and RH values have shown a notable decline (Figure 4). The rise in T accelerates evaporation, reducing SW and leading to surface aridity, while increasing atmospheric instability, which facilitates the lifting of dust particles. Reduced PRCP prevents adequate SW replenishment [42,43], causing the soil to become loose and more easily eroded by wind, while reduced snow cover further limits SW replenishment. Lower humidity decreases the natural binding forces of soil particles, making them more susceptible to wind erosion, thereby increasing the frequency and intensity of dust storms. The interaction between these meteorological changes and surface conditions creates a feedback loop that exacerbates DI.
In different vegetation regions, we observed variations in the determinants of DI (Figure 7). In lush areas such as Forest and Meadow Steppe, anthropogenic factors are the primary drivers of DI. This is largely attributed to the increasing rates of deforestation and agricultural expansion over the years [44,45], which expose more soil to wind erosion and thereby increase DI [46,47]. Additionally, climate warming and drying have led to rapid increases in temperature and decreases in SW and RH [48,49]. This has resulted in more frequent grassland and forest fires [50,51,52], further enhancing DI.
In the southern Desert Steppe and Gobi Desert regions, variations in DI are primarily influenced by both anthropogenic factors and underlying surface conditions (Figure 7). The soil characteristics in these areas—comprising gypsisols, calcisols, and leptosols—provide a stable substrate for the formation and dispersion of dust. Climate change, characterized by rising temperatures, reduced precipitation, and diminished snow cover, contributes to soil surface dryness and looseness, thereby intensifying dust activity in spring [53,54]. Concurrently, activities such as mining, population growth, and increased livestock numbers exert additional pressure on land use, potentially accelerating land degradation [55,56,57]. Moreover, the booming goat industry in the Gobi Region, particularly damaging due to goats feeding on grass roots, further aggravates DI. The number of goats in the region was significantly correlated with DI at the 0.05 level, with a correlation coefficient of 0.508 (Figure S3).
However, in Alpine Meadow regions, climatic factors predominantly influence DI variation (Figure 7). This is primarily due to the rapid increase in temperatures in the southern part of Hangay Uul in recent years, coupled with decreased precipitation. These changes directly contribute to reduced relative humidity and soil moisture (Figure 4). Additionally, the delayed rejuvenation period exposed dust-prone leptosols, further increasing DI [58,59].
In summary, this study underscores the significant combined effect of natural and anthropogenic factors on Mongolia’s increasing DI across various vegetation types from 2001 to 2022. Future research should expand the spatial scale of DI data collection, incorporating the arid regions of northern China, and extend the temporal scope to gain a more comprehensive understanding of the long-term trends. Additionally, future investigations should integrate DI with dust storm movement paths to accurately identify dust enhancement and weakening zones. This approach will not only deepen the understanding of ecological changes in Mongolia but also support the development of regional environmental management and disaster prevention and mitigation strategies.

5. Conclusions

This study presents a comprehensive analysis of dust intensity (DI) trends across Mongolia from 2001 to 2022, highlighting the complex interactions between natural and anthropogenic factors across diverse vegetation zones. The results indicate a notable increase in DI at approximately two-thirds of the monitoring stations, with an average annual growth rate of 0.8. The primary drivers of DI vary by vegetation type: anthropogenic factors such as population growth and GDP predominantly influence Forest, Meadow Steppe, Desert Steppe, and Gobi Desert regions, while climatic factors like temperature and relative humidity are the key determinants in Alpine Meadows.
To mitigate the escalating DI in Mongolia, region-specific and evidence-based strategies are critical. In the Gobi Desert and Desert Steppe regions, the implementation of sustainable land management practices, regulation of overgrazing, and promotion of green economic initiatives are essential to alleviate anthropogenic pressures on vulnerable ecosystems. Conversely, in climate-sensitive regions such as Alpine Meadows, adaptive strategies focusing on reforestation, soil moisture conservation, and water resource management are crucial to mitigate the impacts of increasing temperatures and declining precipitation.
Despite this study’s robust analytical framework, limitations exist, including the uneven spatial distribution of monitoring stations and reliance on moderate-resolution datasets, which constrain the granularity and accuracy of the findings. Expanding the monitoring network, especially in underrepresented areas, will enhance spatial coverage and data reliability. Future studies should also incorporate high-resolution satellite observations and employ advanced machine learning algorithms to improve DI modeling precision and predictive capabilities. Broadening the temporal scope to include longer-term trends and variability under different climate scenarios will further refine the understanding of dust dynamics.
Moreover, future research should focus on the movement pathways and transboundary implications of dust storms, and particularly on their impacts on neighboring regions such as northern China. This will facilitate the development of integrated and regionally coordinated mitigation strategies. Cross-sectoral collaboration among stakeholders, including environmental agencies, agricultural sectors, and local communities, is imperative for the effective implementation of these strategies. Additionally, strengthening transboundary agreements with neighboring countries will enhance collective resilience against dust storms.
By adopting regionally tailored, scientifically informed, and collaborative approaches, policymakers can effectively address the drivers of DI, mitigate ecological degradation, and foster sustainable development in Mongolia and other arid and semi-arid regions worldwide.

Supplementary Materials

The following supporting information can be downloaded at: https://www.mdpi.com/article/10.3390/rs17030410/s1: Table S1: Corresponding names of monitoring stations. Figure S1: Spatial distribution maps of spring 2 m temperature (T), precipitation (PRCP), 0–7 cm volumetric soil water (SW), and kernel normalized difference vegetation index (kNDVI) in Mongolia from 2001 to 2022. Figure S2: Spatial distribution and trends of summer precipitation and kNDVI in Mongolia (2000–2021): (a) spatial distribution of mean summer precipitation; (b) spatial distribution of mean summer kNDVI; (c) trends of summer precipitation; and (d) trends of summer kNDVI. Figure S3: (a) spatial distribution of average goat numbers between 2001 and 2022; (b) spatial variation in goat numbers (α < 0.05).

Author Contributions

Conceptualization, C.B.; methodology, C.B., H.B. and M.Y.; software, C.B., T.T. and T.L.; validation, H.B. and Q.W.; formal analysis, C.B.; data curation, C.B. and M.Y.; writing—original draft preparation, C.B.; writing—review and editing, C.B., Y.Y., H.B. and Q.W.; project administration, H.B. and B.U. All authors have read and agreed to the published version of the manuscript.

Funding

This research was funded by the National Key R&D Program of China (No. 2022YFE0119500), the Science and Technology Commission of Shanghai Municipality, China (No. 22010503600), the National Nature Science Foundation of China (No. 41771372), the Mongolian Foundation for Science and Technology (No. CHN-2022/273), and the National Institute for Environmental Studies, Japan (No. 2125AA130 and 2125AV007).

Data Availability Statement

The data that support the findings of this study are available on request from the corresponding author.

Acknowledgments

The authors gratefully acknowledge the financial support provided by the National Key R&D Program of China (No. 2022YFE0119500), the Science and Technology Commission of Shanghai Municipality, China (No. 22010503600), the National Natural Science Foundation of China (No. 41771372), the Mongolian Foundation for Science and Technology (No. CHN-2022/273), and the National Institute for Environmental Studies, Japan (No. 2125AA130 and 2125AV007). We also extend our heartfelt thanks to all team members and affiliated institutions for their active participation and contributions throughout the implementation of this research. Lastly, we extend our gratitude to the peer reviewers and editors for their valuable and constructive feedback, which greatly enhanced the quality of this manuscript.

Conflicts of Interest

The authors declare that they have no known competing financial interests or personal relationships that could have appeared to influence the work reported in this paper.

References

  1. Middleton, N.; Kang, U. Sand and dust storms: Impact mitigation. Sustainability 2017, 9, 1053. [Google Scholar] [CrossRef]
  2. United Nations Convention to Combat Desertification (UNCCD). Sand and Dust Storms Compendium: Information and Guidance on Assessing and Addressing the Risks. Bonn, Germany. 2022. Available online: https://www.unccd.int/sites/default/files/2022-08/Full%20report%20ENG.pdf (accessed on 4 December 2024).
  3. Kok, J.F.; Ward, D.S.; Mahowald, N.M.; Evan, A.T. Global and regional importance of the direct dust-climate feedback. Nat. Commun. 2018, 9, 241. [Google Scholar] [CrossRef] [PubMed]
  4. Uno, I.; Eguchi, K.; Yumimoto, K.; Takemura, T.; Shimizu, A.; Uematsu, M.; Liu, Z. Asian dust transported one full circuit around the globe. Nat. Geosci. 2009, 2, 557–560. [Google Scholar] [CrossRef]
  5. Roy, D.; Kim, J.; Lee, M.; Park, J. Adverse impacts of Asian dust events on human health and the environment—A probabilistic risk assessment study on particulate matter-bound metals and bacteria in Seoul, South Korea. Sci. Total Environ. 2023, 875, 162637. [Google Scholar] [CrossRef]
  6. Shao, Y.; Dong, C.H. A review on East Asian dust storm climate, modelling and monitoring. Glob. Planet. Change 2006, 52, 1–22. [Google Scholar] [CrossRef]
  7. Liang, P.; Chen, B.; Yang, X.; Liu, Q.; Li, A.; Mackenzie, L.; Zhang, D. Revealing the dust transport processes of the 2021 mega dust storm event in northern China. Sci. Bull. 2021, 67, 21–24. [Google Scholar] [CrossRef]
  8. Wen, H.J.; Wang, S.L.; Wu, C.D.; Liang, M.C. Association of Asian dust storms and PM2.5 with clinical visits for respiratory diseases in children. Atmos. Environ. 2024, 120631. [Google Scholar] [CrossRef]
  9. Bao, T.; Xi, G.; Deng, B.; Chang, I.S.; Wu, J.; Jin, E. Long-term variations in spatiotemporal clustering characteristics of dust events in potential dust sources in East Asia. Catena 2023, 232, 107397. [Google Scholar] [CrossRef]
  10. Fan, B.; Guo, L.; Li, N.; Chen, J.; Lin, H.; Zhang, X.; Shen, M.; Rao, Y.; Wang, C.; Ma, L. Earlier vegetation green-up has reduced spring dust storms. Sci. Rep. 2014, 4, 6749. [Google Scholar] [CrossRef]
  11. Wang, S.; Yu, Y.; Zhang, X.X.; Lu, H.; Zhang, X.Y.; Xu, Z. Weakened dust activity over China and Mongolia from 2001 to 2020 associated with climate change and land-use management. Environ. Res. Lett. 2021, 16, 124056. [Google Scholar] [CrossRef]
  12. Wu, C.; Lin, Z.; Shao, Y.; Liu, X.; Li, Y. Drivers of recent decline in dust activity over East Asia. Nat. Commun. 2022, 13, 7105. [Google Scholar] [CrossRef] [PubMed]
  13. Mayaud, J.R.; Wiggs, G.F.; Bailey, R.M. Characterizing turbulent wind flow around dryland vegetation. Earth Surf. Process. Landf. 2016, 41, 1421–1436. [Google Scholar] [CrossRef]
  14. Bao, C.; Yong, M.; Bi, L.; Gao, H.; Li, J.; Bao, Y.; Gomboludev, P. Impacts of underlying surface on the dusty weather in central Inner Mongolian steppe, China. Earth Space Sci. 2021, 8, e2021EA001672. [Google Scholar] [CrossRef]
  15. Li, Z.; Lau, W.M.; Ramanathan, V.; Wu, G.; Ding, Y.; Manoj, M.G.; Liu, J.; Qian, Y.; Li, J.; Zhou, T.; et al. Aerosol and monsoon climate interactions over Asia. Rev. Geophys. 2016, 54, 866–929. [Google Scholar] [CrossRef]
  16. Xu, S.; Wang, J.; Altansukh, O.; Chuluun, T. Spatiotemporal evolution and driving mechanisms of desertification on the Mongolian Plateau. Sci. Total Environ. 2024, 173566. [Google Scholar] [CrossRef]
  17. Munkhtsetseg, E.; Shinoda, M.; Ishizuka, M.; Mikami, M.; Kimura, R.; Nikolich, G. A livestock trampling function for potential emission rate of wind-blown dust in a Mongolian temperate grassland. Atmos. Chem. Phys. 2017, 17, 11389–11401. [Google Scholar] [CrossRef]
  18. Nandintsetseg, B.; Chang, J.; Sen, O.L.; Reyer, C.P.; Kong, K.; Yetemen, O.; Ciais, P.; Davaadalai, J. Future drought risk and adaptation of pastoralism in Eurasian rangelands. npj Clim. Atmos. Sci. 2024, 7, 82. [Google Scholar] [CrossRef]
  19. Amarsanaa, S.; Lkhagva, A.; Chogsom, B.; Bayaraa, B.; Damdin, B.; Tsooj, B.; Nyamja, J.; Baival, B.; Jamsranjav, C. Quantifying the spatial extent of roads and their effects on the vegetation in Mongolia’s Gobi Desert. Land 2022, 11, 820. [Google Scholar] [CrossRef]
  20. Liu, X.; Song, H.; Lei, T.; Liu, P.; Xu, C.; Wang, D.; Yang, Z.; Xia, H.; Wang, T.; Zhao, H. Effects of natural and anthropogenic factors and their interactions on dust events in Northern China. Catena 2021, 196, 104919. [Google Scholar] [CrossRef]
  21. Wu, J.; Kurosaki, Y.; Shinoda, M.; Kai, K. Regional characteristics of recent dust occurrence and its controlling factors in East Asia. Sola 2016, 12, 187–191. [Google Scholar] [CrossRef]
  22. Gunin, P.D.; Vastokova, E.A.; Dorofeyuj, N.I.; Tarasov, P.E.; Black, C.C. Vegetation Dynamics of Mongolia; Geobotany 1999; Kluwer Academic Publishers: Dordrecht, The Netherlands; Boston, MA, USA; London, UK, 2013; Volume 26. [Google Scholar]
  23. Kurosaki, Y.; Mikami, M. Regional difference in the characteristic of dust event in East Asia: Relationship among dust outbreak, surface wind, and land surface condition. J. Meteorol. Soc. Jpn. 2005, 83A, 1–18. [Google Scholar] [CrossRef]
  24. Shao, Y.; Klose, M.; Wyrwoll, K.H. Recent global dust trend and connections to climate forcing. J. Geophys. Res. Atmos. 2013, 118, 11–107. [Google Scholar] [CrossRef]
  25. Camps-Valls, G.; Campos-Taberner, M.; Moreno-Martínez, Á.; Walther, S.; Duveiller, G.; Cescatti, A.; Mahecha, M.D. A unified vegetation index for quantifying the terrestrial biosphere. Sci. Adv. 2021, 7, eabc7447. [Google Scholar] [CrossRef] [PubMed]
  26. Te, T.; Bagan, H.; Che, M.; Hou, X.; Uudus, B. Spatiotemporal variability of near-surface CO2 and its affecting factors over Mongolia. Environ. Res. 2023, 236, 116796. [Google Scholar] [CrossRef]
  27. Fernandez-Gimenez, M.E.; Batkhishig, B.; Batbuyan, B. Cross-boundary and cross-level dynamics increase vulnerability to severe winter disasters (dzud) in Mongolia. Glob. Environ. Change 2012, 22, 836–851. [Google Scholar] [CrossRef]
  28. Wang, X.; Huang, J.; Ji, M.; Higuchi, K. Variability of East Asia dust events and their long-term trend. Atmos. Environ. 2008, 42, 3156–3165. [Google Scholar] [CrossRef]
  29. Niu, S.J.; Sun, J.M.; Chen, Y.; Liu, H.J. Observation and analysis of mass concentration of dust and sand aerosol in spring in Helanshan area. Plateau Meteorol. 2001, 20, 82–87. (In Chinese) [Google Scholar]
  30. Neeti, N.; Eastman, J.R. A contextual mann-kendall approach for the assessment of trend significance in image time series. Trans. GIS 2011, 15, 599–611. [Google Scholar] [CrossRef]
  31. Wang, N.; Chen, J.; Zhang, Y.; Xu, Y.; Yu, W. The Spatiotemporal Characteristics and Driving Factors of Dust Emissions in East Asia (2000–2021). Remote Sens. 2023, 15, 410. [Google Scholar] [CrossRef]
  32. Chen, C.; Bagan, H.; Xie, X.; La, Y.; Yamagata, Y. Combination of sentinel-2 and palsar-2 for local climate zone classification: A case study of nanchang, China. Remote Sens. 2021, 13, 1902. [Google Scholar] [CrossRef]
  33. Dong, S.; Zheng, J.; Li, Y.; Li, Z.; Li, F.; Jin, L.; Yang, Y.; Bilgaev, A. Quantitative Analysis of the Coupling Coordination Degree Between Urbanization and Eco-environment in Mongolia. Chin. Geogr. Sci. 2019, 29, 861–871. [Google Scholar] [CrossRef]
  34. Keshkamat, S.S.; Tsendbazar, N.E.; Zuidgeest, M.H.P.; Shiirev-Adiya, S.; van der Veen, A.; Van Maarseveen, M.F.A.M. Understanding transportation-caused rangeland damage in Mongolia. J. Environ. Manag. 2013, 114, 433–444. [Google Scholar] [CrossRef]
  35. Munkhtsetseg, E.; Shinoda, M.; Gillies, J.A.; Kimura, R.; King, J.; Nikolich, G. Relationships between soil moisture and dust emissions in a bare sandy soil of Mongolia. Particuology 2016, 28, 131–137. [Google Scholar] [CrossRef]
  36. Duniway, M.C.; Pfennigwerth, A.A.; Fick, S.E.; Nauman, T.W.; Belnap, J.; Barger, N.N. Wind erosion and dust from US drylands: A review of causes, consequences, and solutions in a changing world. Ecosphere 2019, 10, e02650. [Google Scholar] [CrossRef]
  37. Moayeri, V.; Miri, A.; Shahriari, A.; Rahdari, V.; Gill, T.E. A field study of the surface disturbance effects of animals and motor vehicles on aeolian sediment emission from a silty playa surface. Environ. Res. 2023, 216, 114606. [Google Scholar] [CrossRef]
  38. Shestakovich, N. Exploratory Analysis of Spatial and Temporal Dynamics of Dzud Development in Mongolia, 1993–2004. Master’s Thesis, University of Michigan, Ann Arbor, MI, USA, 2011. Available online: https://hdl.handle.net/2027.42/85158 (accessed on 12 November 2024).
  39. Filonchyk, M. Characteristics of the severe March 2021 Gobi Desert dust storm and its impact on air pollution in China. Chemosphere 2022, 287, 132219. [Google Scholar] [CrossRef] [PubMed]
  40. Gui, K.; Yao, W.; Che, H.; An, L.; Zheng, Y.; Li, L.; Zhao, H.; Zhang, L.; Zhong, J.; Wang, Y.; et al. Record-breaking dust loading during two mega dust storm events over northern China in March 2021: Aerosol optical and radiative properties and meteorological drivers. Atmos. Chem. Phys. 2022, 22, 7905–7932. [Google Scholar] [CrossRef]
  41. Shen, J.; Jiang, X.; Sun, Z. The Influence of Topography on Dust Stormand Numerical Simulation. Plateau Meteorol. 2007, 26, 1013–1022. [Google Scholar]
  42. Dore, M.H. Climate change and changes in global precipitation patterns: What do we know? Environ. Int. 2005, 31, 1167–1181. [Google Scholar] [CrossRef] [PubMed]
  43. Vihma, T.; Screen, J.; Tjernström, M.; Newton, B.; Zhang, X.; Popova, V.; Deser, C.; Holland, M.; Prowse, T. The atmospheric role in the Arctic water cycle: A review on processes, past and future changes, and their impacts. J. Geophys. Res. Biogeosciences 2016, 121, 586–620. [Google Scholar] [CrossRef]
  44. Priess, J.A.; Schweitzer, C.; Wimmer, F.; Batkhishig, O.; Mimler, M. The consequences of land-use change and water demands in Central Mongolia. Land Use Policy 2011, 28, 4–10. [Google Scholar] [CrossRef]
  45. Sukhbaatar, G.; Purevragchaa, B.; Ganbaatar, B.; Tseveen, B. Deforestation and degradation of forests in the Khustai Nuruu mountains of Northern Mongolia. Sib. J. For. Sci. 2021, 62, 53–63. [Google Scholar] [CrossRef]
  46. Shepherd, G.; Terradellas, E.; Baklanov, A.; Kang, U.; Sprigg, W.; Nickovic, S.; Darvishi Boloorani, A. Global Assessment of Sand and Dust Storms; UN Environment Programme: Nairobi, Kenya, 2016; Available online: https://repositorio.aemet.es/bitstream/20.500.11765/4495/1/Global_assessment_sand_dust_storms-2016.pdf (accessed on 24 November 2024).
  47. Zucca, C.; Fleiner, R.; Bonaiuti, E.; Kang, U. Land degradation drivers of anthropogenic sand and dust storms. Catena 2022, 219, 106575. [Google Scholar] [CrossRef]
  48. Wu, X.; Li, X.; Li, J.; Wang, M.; Ji, M.; Cao, Y.; Hu, J. Eolian dust activity during the last~ 850 years on the southeastern margin of the arid Central Asia. Palaeogeogr. Palaeoclimatol. Palaeoecol. 2020, 560, 110022. [Google Scholar] [CrossRef]
  49. Zhou, W.; Leung, L.R.; Lu, J. The role of interactive soil moisture in land drying under anthropogenic warming. Geophys. Res. Lett. 2023, 50, e2023GL105308. [Google Scholar] [CrossRef]
  50. Hessl, A.E.; Brown, P.; Byambasuren, O.; Cockrell, S.; Leland, C.; Cook, E.; Nachin, B. Fire and climate in Mongolia (1532–2010 common era). Geophys. Res. Lett. 2016, 43, 6519–6527. [Google Scholar] [CrossRef]
  51. Nasanbat, E.; Lkhamjav, O. Wild fire risk map in the eastern steppe of Mongolia using spatial multi-criteria analysis. Int. Arch. Photogramm. Remote Sens. Spat. Inf. Sci. 2016, 41, 469–473. [Google Scholar] [CrossRef]
  52. Wen, L.; Yong, M.; Bao, Y.; Fu, R.; Jin, E. Effect of Grassland Fires on Dust Storms in Dornod Aimag, Mongolia. Remote Sens. 2023, 15, 5629. [Google Scholar] [CrossRef]
  53. Lee, J.J.; Kim, C.H. Roles of surface wind, NDVI and snow cover in the recent changes in Asian dust storm occurrence frequency. Atmos. Environ. 2012, 59, 366–375. [Google Scholar] [CrossRef]
  54. Meinander, O.; Dagsson-Waldhauserova, P.; Amosov, P.; Aseyeva, E.; Atkins, C.; Baklanov, A.; Baldo, C. Newly identified climatically and environmentally significant high-latitude dust sources. Atmos. Chem. Phys. 2022, 22, 11889–11930. [Google Scholar] [CrossRef]
  55. Ghosh, T.; Pal, I. Dust storm and its environmental implications. J. Eng. Comput. Appl. Sci. 2014, 3, 30–37. [Google Scholar]
  56. Ma, Q.; Wu, J.; He, C.; Fang, X. The speed, scale, and environmental and economic impacts of surface coal mining in the Mongolian Plateau. Resour. Conserv. Recycl. 2021, 173, 105730. [Google Scholar] [CrossRef]
  57. Nandintsetseg, B.; Boldgiv, B.; Chang, J.; Ciais, P.; Davaanyam, E.; Batbold, A.; Bat-Oyun, T. Risk and vulnerability of Mongolian grasslands under climate change. Environ. Res. Lett. 2021, 16, 034035. [Google Scholar] [CrossRef]
  58. Bao, G.; Chen, J.; Chopping, M.; Bao, Y.; Bayarsaikhan, S.; Dorjsuren, A.; Tuya, A. Dynamics of net primary productivity on the Mongolian Plateau: Joint regulations of phenology and drought. Int. J. Appl. Earth Obs. Geoinf. 2019, 81, 85–97. [Google Scholar] [CrossRef]
  59. Luo, M.; Meng, F.; Sa, C.; Duan, Y.; Bao, Y.; Liu, T.; De Maeyer, P. Response of vegetation phenology to soil moisture dynamics in the Mongolian Plateau. Catena 2021, 206, 105505. [Google Scholar] [CrossRef]
Figure 1. Map of study area. (a) Digital Elevation Model (DEM) data at 30 m resolution from USGS. The black circles indicate meteorological stations; please refer to Table S1 for the names of the monitoring stations. (b) Vegetation types from Mongolia National Statistics Office.
Remotesensing 17 00410 g001
Figure 2. Spatiotemporal variations in DI from 2001 to 2022 in spring, including (a) DI spatial distribution, (b) DI trends, and (c) monthly and annual variations.
Remotesensing 17 00410 g002
Figure 3. Spatiotemporal variations in WS from 2001 to 2022 in spring, including (a) WS spatial distribution, (b) WS trends, and (c) monthly and annual variations.
Remotesensing 17 00410 g003
Figure 4. Spatiotemporal variations in climate factors between 2001 and 2022 during spring: (a) T, (b) PRCP, (c) RH, (d) MSLP, and (e) anomalies in T, PRCP, RH, and MSLP in spring, respectively.
Remotesensing 17 00410 g004
Figure 5. Spatiotemporal variations in underlying surface conditions: (a) spatial variation in spring SW (2001–2022), (b) spring kNDVI (2001–2022), (c) previous-summer kNDVI (2000–2021), (d) spring snow cover (2001–2022), (e) previous-winter snow cover (2000–2021), and (f) anomalies in spring SW, spring kNDVI, previous-summer kNDVI, spring snow cover, and previous-winter snow cover.
Remotesensing 17 00410 g005
Figure 6. Spatiotemporal variation in anthropogenic factors between 2001 and 2022: (a) population, (b) livestock (unit: SFU), (c) GDP, and (d) anomalies in annual population, livestock, and GDP.
Remotesensing 17 00410 g006
Figure 7. Drivers of dust intensity (DI) across various vegetation regions in Mongolia.
Remotesensing 17 00410 g007
Figure 8. Correlation heatmap between DI and influencing factors at monitoring stations with enhanced DI in spring (2001–2022).
Remotesensing 17 00410 g008
Table 1. Driver factors and their data sources.
Driver FactorsData Source
Climate factorsMaximum wind speed (WS)World Meteorological Organization (WMO)
2 m temperature (T)ERA5
https://cds.climate.copernicus.eu/
(accessed on 20 November 2024)
Total precipitation (PRCP)
Relative humidity (RH)
Mean sea level pressure (MSLP)
Underlying surface factor0–7 cm volumetric soil water (SW)
Normalized difference vegetation index (NDVI)MOD13Q1, 250 m
Snow coverMOD10A1, 500 m
Anthropogenic factorsPopulationMongolia National Statistics Office https://www.1212.mn/
(accessed on 20 November 2024)
Livestock
Gross Domestic Product (GDP)
Disclaimer/Publisher’s Note: The statements, opinions and data contained in all publications are solely those of the individual author(s) and contributor(s) and not of MDPI and/or the editor(s). MDPI and/or the editor(s) disclaim responsibility for any injury to people or property resulting from any ideas, methods, instructions or products referred to in the content.

