Article

RST-DeepLabv3+: Multi-Scale Attention for Tailings Pond Identification with DeepLab

1
School of Information Engineering, China University of Geosciences, Beijing 100083, China
2
High Resolution Satellite Remote Sensing Application Department, Ningxia Institute of Remote Sensing Survey, Yinchuan 750021, China
*
Author to whom correspondence should be addressed.
Remote Sens. 2025, 17(3), 411; https://doi.org/10.3390/rs17030411
Submission received: 26 November 2024 / Revised: 22 January 2025 / Accepted: 23 January 2025 / Published: 25 January 2025

Abstract

:
Tailing ponds are used to store tailings or industrial waste discharged after beneficiation. Identifying these ponds in advance can help prevent pollution incidents and reduce their harmful impacts on ecosystems. Tailing ponds are traditionally identified via manual inspection, which is time-consuming and labor-intensive. Therefore, tailing pond identification based on computer vision is of practical significance for environmental protection and safety. In the context of identifying tailings ponds in remote sensing, a significant challenge arises due to high-resolution images, which capture extensive feature details—such as shape, location, and texture—complicated by the mixing of tailings with other waste materials. This results in substantial intra-class variance and limited inter-class variance, making accurate recognition more difficult. Therefore, to monitor tailing ponds, this study utilized an improved version of DeepLabv3+, which is a widely recognized deep learning model for semantic segmentation. We introduced the multi-scale attention modules, ResNeSt and SENet, into the DeepLabv3+ encoder. The split-attention module in ResNeSt captures multi-scale information when processing multiple sets of feature maps, while the SENet module focuses on channel attention, improving the model’s ability to distinguish tailings ponds from other materials in images. Additionally, the tailing pond semantic segmentation dataset NX-TPSet was established based on the Gauge-Fractional-6 image. The ablation experiments show that the recognition accuracy (intersection and integration ratio, IOU) of the RST-DeepLabV3+ model was improved by 1.19% to 93.48% over DeepLabV3+.The multi-attention module enables the model to integrate multi-scale features more effectively, which not only improves segmentation accuracy but also directly contributes to more reliable and efficient monitoring of tailings ponds. The proposed approach achieves top performance on two benchmark datasets, NX-TPSet and TPSet, demonstrating its effectiveness as a practical and superior method for real-world tailing pond identification.

1. Introduction

Tailing ponds are the primary facilities at mineral processing plants in mining enterprises and are typically situated at valley mouths or on flat terrain. These storage areas are surrounded by dams and are used to retain wastewater and slag generated from mining and ore processing [1]. Beyond occupying large land areas, tailings ponds contain various types of heavy metals and pollutants that severely impact the ecological environment of mining regions. Scholars have conducted research on the hazards of tailings ponds, such as Tomás Martín-Crespo et al., who used LiDAR and geochemical methods to quantify pollutants in mine ponds in order to analyze the pollutant composition in tailings ponds [2]. Therefore, tailings ponds are a potentially high source of environmental risk and can cause severe damage to the surrounding environment in the event of an accident [3]. Environmental incidents linked to tailings ponds have become increasingly common in recent years [3], causing numerous casualties and significant ecological damage. Therefore, to strengthen emergency management and achieve information security and disaster warning for tailings ponds, there is an urgent need for a fast, accurate, and comprehensive method for identifying tailings pond locations.
The location of tailings ponds is often remote [4], and the transportation infrastructure is typically underdeveloped; therefore, traditional methods for identifying tailings ponds are predominantly based on ground surveys [5], which are inefficient, labor-intensive, and unable to monitor the extent of tailings ponds in real time. However, remote sensing (RS) technology is a crucial means of data acquisition [6], offering advantages such as rapid, large-scale, and real-time identification and minimal dependence on ground conditions; thus, it can compensate for the shortcomings of traditional identification methods. For example, Zhao [7] applied RS identification to a Taishan tailings pond in Shanxi, where a large area of tailings ponds was monitored over a short period of time using 3S (geographic information system, RS, and global navigation satellite system) technology to extract information on the number of tailings ponds, their area, and the type of minerals present.
Lu [8] used tailing ponds in Hebei Province as an example to identify tailing ponds via RS. He proposed a basic RS identification process for these ponds. Owing to the significant differences in the scale, shape, and background of the tailings ponds in the RS images, it is necessary to identify them individually through visual interpretation. However, visual interpretation has several drawbacks [9], including high subjectivity, significant workload, and low efficiency when managing significant volumes of RS data. This makes it unsuitable for current environmental protection departments to rapidly obtain real-time positioning information for tailing ponds. Therefore, traditional RS technology cannot meet the current demands for large-scale and high-frequency data processing [10].
RS feature recognition has progressed significantly with rapid advancements in computer vision and deep learning. Owing to its powerful feature extraction and pattern recognition capabilities, deep learning has been widely applied for tailing pond identification, making it a popular research focus. Currently, two main methods are commonly used to identify tailings ponds in RS images. The first is target detection [11], which is a technique aimed at identifying the target of interest in an image and determining its location. In recent years, deep learning-based target detection algorithms, such as Faster Region-based Convolutional Neural Network (R-CNN) [12], You Only Look Once [13], and Single Shot MultiBox Detector (SSD) [14], have performed well in tailings pond detection. For example, Li et al. [15] developed an SSD-based fine-tuning model that extracted and analyzed data from 2221 tailings ponds in the Beijing–Tianjin–Hebei region of northern China. Their results demonstrated that deep learning methods are highly effective for detecting complex feature types in RS images. Yan et al. [16] used the Faster R-CNN model and added the feature pyramid network [17] to monitor tailings ponds in high-resolution RS images. The results showed that the method improved both the average precision and recall rate, making it highly significant for the large-scale, high precision, and intelligent identification of tailings ponds. These methods automatically learn the features of tailings ponds through Convolutional Neural Networks [18] and rapidly locate their positions in high-resolution RS images. The advantage of the target detection method lies in its ability to simultaneously identify multiple tailings ponds and provide their precise bounding boxes in the image. However, the target detection cannot accurately segment the feature types and boundaries of each pixel.
The second method is semantic segmentation, which involves classifying each pixel in a remotely sensed image to determine whether it belongs to a tailing pond, thereby enabling tailings pond recognition. Semantic segmentation models, such as U-Net [19], PSP-Net [20], and DeepLabv3+ [21], achieve precise segmentation of tailings pond areas in RS images. For example, Zhang et al. [17] used the U-Net model and Gauge-Fractional-6 (GF-6) RS images with a spatial resolution of 2 m and achieved effective tailings pond extraction, surpassing the accuracy of conventional machine learning models. This approach not only identifies the overall shape of the tailings impoundment but also captures detailed features of the complex terrain, providing a more comprehensive way to monitor the condition of tailings ponds. The DeepLabv3+ model enhances DeepLabv3 by incorporating a simple yet powerful decoder module, which improves the segmentation accuracy, particularly around the target boundaries.
Due to the complexity of the feature types in the distribution area of the tailings pond, more attention should be paid to the local segmentation effect of the high-resolution image. Additionally, it has been demonstrated that using the DeepLabv3+ model for semantic segmentation in complex scenes yields good results. For example, Chen et al. [22] proposed an improved DeepLabv3+ lightweight neural network to improve the semantic segmentation accuracy of RS images in complex scenes. They achieved this by adding a ResNet50 [23] residual network after the feature fusion of DeepLabv3+, along with a normalization-based attention module [24], to enhance shallow semantic information. Thus, the local segmentation effect was improved, and it performed well in both small- and multi-target segmentations. The above-improved method based on Deeplabv3+ has added a decoder module and a more effective feature fusion method than DeepLabv3, which can better deal with the complex background in the identification of tailing ponds and make it a significant advantage in terms of accuracy and practical application. However, there are few open-source semantic segmentation datasets for tailings ponds, making this area of research less explored.
This changed when Zhang et al. [25] developed the TPSet semantic segmentation dataset for tailings ponds by visually interpreting GF-6 panchromatic multispectral scanner (PMS) images. The training and validation sets of the TPSet dataset consist of 1389 images, each with corresponding binary mask files, all with a size of 512 × 512 pixels. The test set contains 3564 images and corresponding binary mask files, each with a size of 512 × 512 pixels, completing the missing dataset.
However, in the semantic segmentation of remotely sensed images, the images contain rich details of ground objects, such as shape, location, and texture features [26]. These details provide an image with high intra-class variance and low inter-class variance, which increases the difficulty of segmentation. To solve this problem, effective access to contextual information is needed for complex scenes. Zhao et al. [27] combined an attention mechanism with a multi-scale module to improve the annotation accuracy of high-resolution aerial images.
Based on the above research issues and drawing inspiration from the studies of Zhao et al. [27], we made the following two improvements in this study: We incorporated the Squeeze-and-Excitation (SE) module proposed by Hu et al. [28] into the encoder of the DeepLabv3+ framework to enhance the representational capabilities of the model. The SENet module aims to improve the quality of the learned features by modeling the interdependencies between the convolutional feature channels. The improved ResNeSt module proposed by Zhang et al. [29] was introduced into the encoder. Based on the special needs of the tailing pond recognition task: complex texture, multi-scale features, and high intra-class variance in high-resolution images, the SENet and ResNeSt modules are able to better capture and integrate the detailed information in tailing ponds by means of channel attention and multi-scale feature fusion, thus improving the segmentation accuracy and model robustness. ResNeSt is an improved version of ResNet [30] that aims to enhance the feature representation capability of a network, particularly in processing complex feature representations, particularly when addressing complex visual tasks. It more efficiently extracts and fuses channel and spatial features by introducing Split-Attention blocks, a mechanism that enables the model to better capture both the global and local features of an image [31], especially in tasks that require fine-grained details, such as semantic segmentation. The SENet and ResNeSt modules were integrated into the encoder to realize multi-scale module fusion, which effectively addressed the challenges of significant intra-class variability and minimal inter-class distinction present in high-resolution RS imagery. The integration of the SENet and ResNeSt modules into the DeepLabv3+ encoder not only addresses the challenges of high-resolution remote sensing image segmentation but also introduces a novel multi-scale attention fusion strategy that dynamically combines channel attention and Split-Attention mechanisms to enhance the model’s ability to capture fine-grained details and improve overall segmentation performance.

2. Materials and Methods

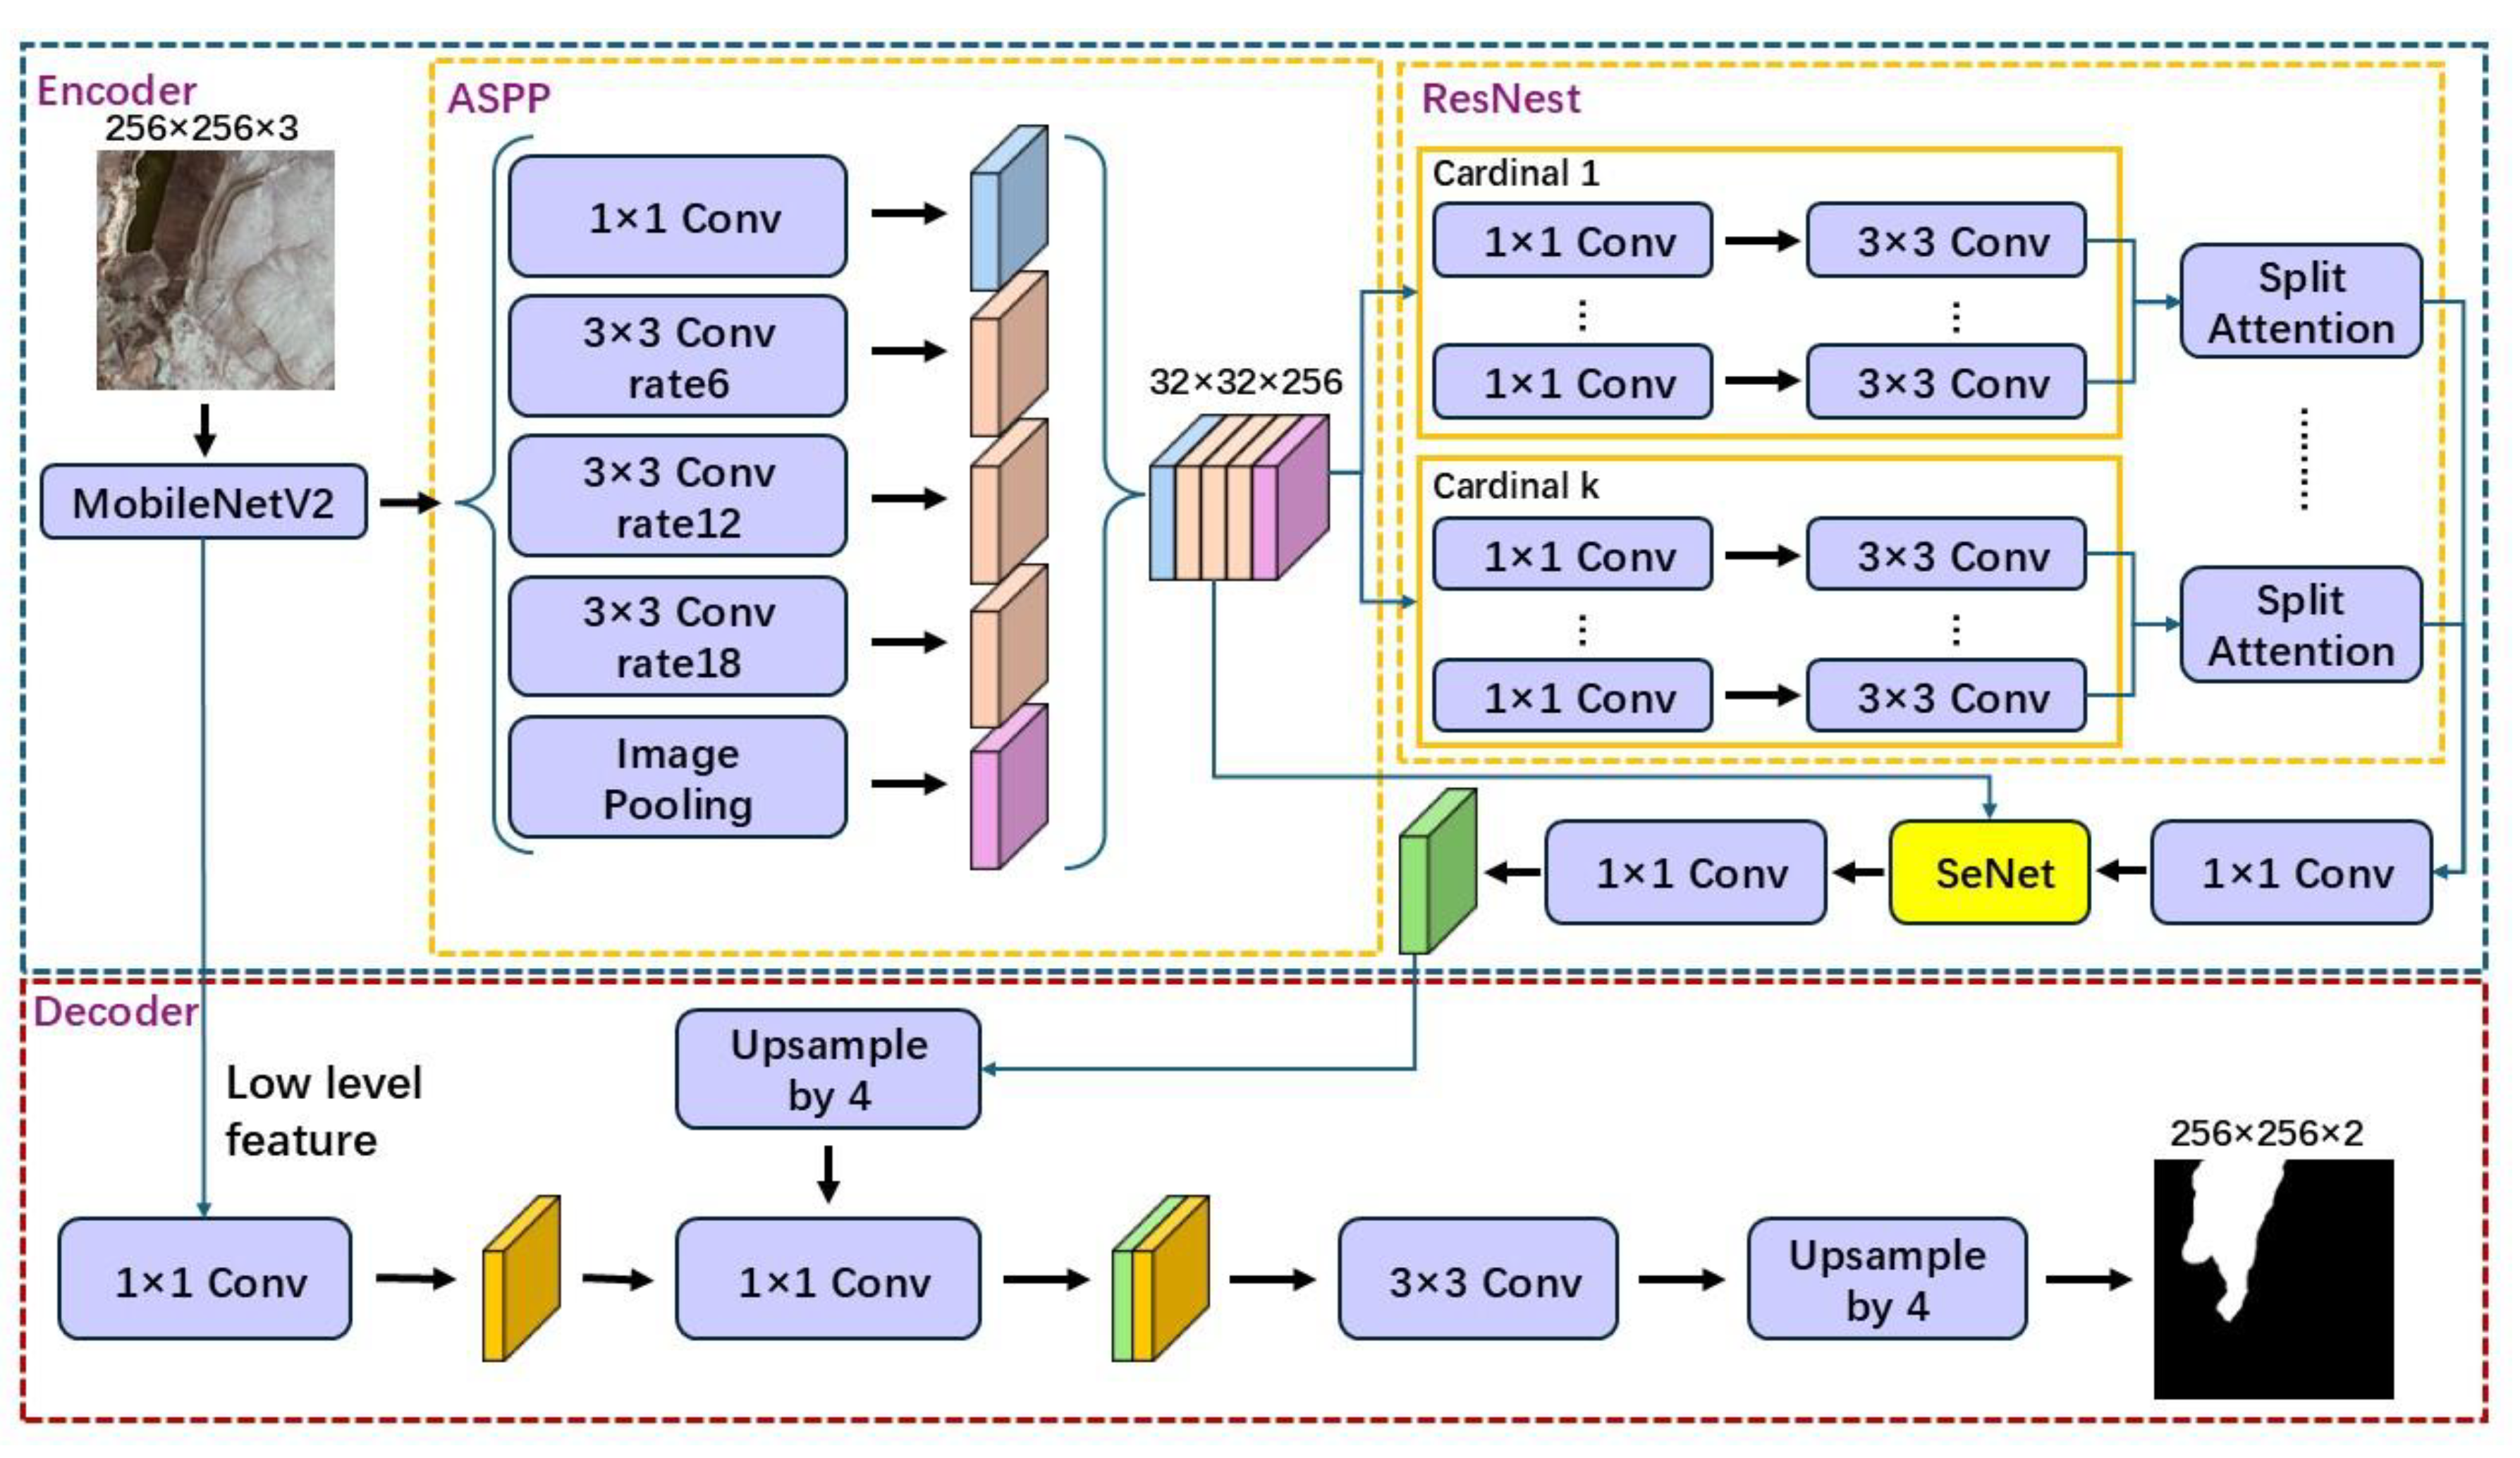
The proposed semantic segmentation network (RST-DeepLabv3+) is composed primarily of a construction module (encoder) and an enhancement module (decoder). Within the encoder, the Atrous Spatial Pyramid Pooling (ASPP) module was used to capture high-level features that included multi-scale information. The SENet and ResNeSt modules were introduced, and in the encoder, a multi-scale attention module was introduced to facilitate the dynamic merging of multi-scale feature maps. Figure 1 illustrates the architecture of the proposed RST-DeepLabv3+ model. The model uses a single tailings pond image as the input, with an image size of 256 × 256 pixels, and outputs a binary segmented image of the tailings pond, followed by a brief description of the ASPP module. The attention modules, SENet and ResNeSt, are described in detail.

2.1. Encoder Backbone Using MobileNetv2

In this study, we used MobileNetV2 [32] as the backbone of the encoder. The architecture of MobileNetV2 is based on depth-separable convolution, which primarily consists of channel-by-channel convolution and 1 × 1 convolutions; this design not only reduces computational complexity but also improves feature extraction efficiency. MobileNetV2 introduces inverted residuals and linear bottlenecks [33], which are designed to efficiently extract features while maintaining computational efficiency. This efficient feature extraction capability helps preserve high spatial resolution while reducing sampling operations, thereby alleviating the loss of location information caused by multiple downsampling in traditional networks. MobileNetV2 is designed as a lightweight architecture that uses depth-wise separable convolutions, which significantly reduces the number of parameters and calculations.

2.2. Atrous Spatial Pyramid Pooling Module

The ASPP module can efficiently classify objects of different size ranges by extracting and combining multi-scale features [34]. The module employs one 1 × 1 × 256 convolutional kernel and three 3 × 3 × 256 convolutional kernels (with dilation rates of 6, 12, and 18, respectively) to capture multi-scale feature information. Moreover, the ASPP module captures global image-level features through global average pooling, which helps address the problem of disappearing weights when using expanded convolutional kernels. In addition, null convolution can arbitrarily expand the sensory field without introducing additional parameters. The ASPP module up-samples the global feature map to the desired spatial dimensions [35] by concatenating the extracted features through a 1 × 1 × 256 convolution. Finally, the number of channels in the feature map is compressed to 256 using a 1 × 1 × 256 convolution. Overall, the ASPP module captures features with different receptive fields using hollow convolutions with varying expansion rates, obtains global information through global pooling and 1 × 1 convolution, and enhances the expressive capacity of the model by stacking and fusing these features.

2.3. Encoder with the SENet Module

In this study, we incorporated the SE [
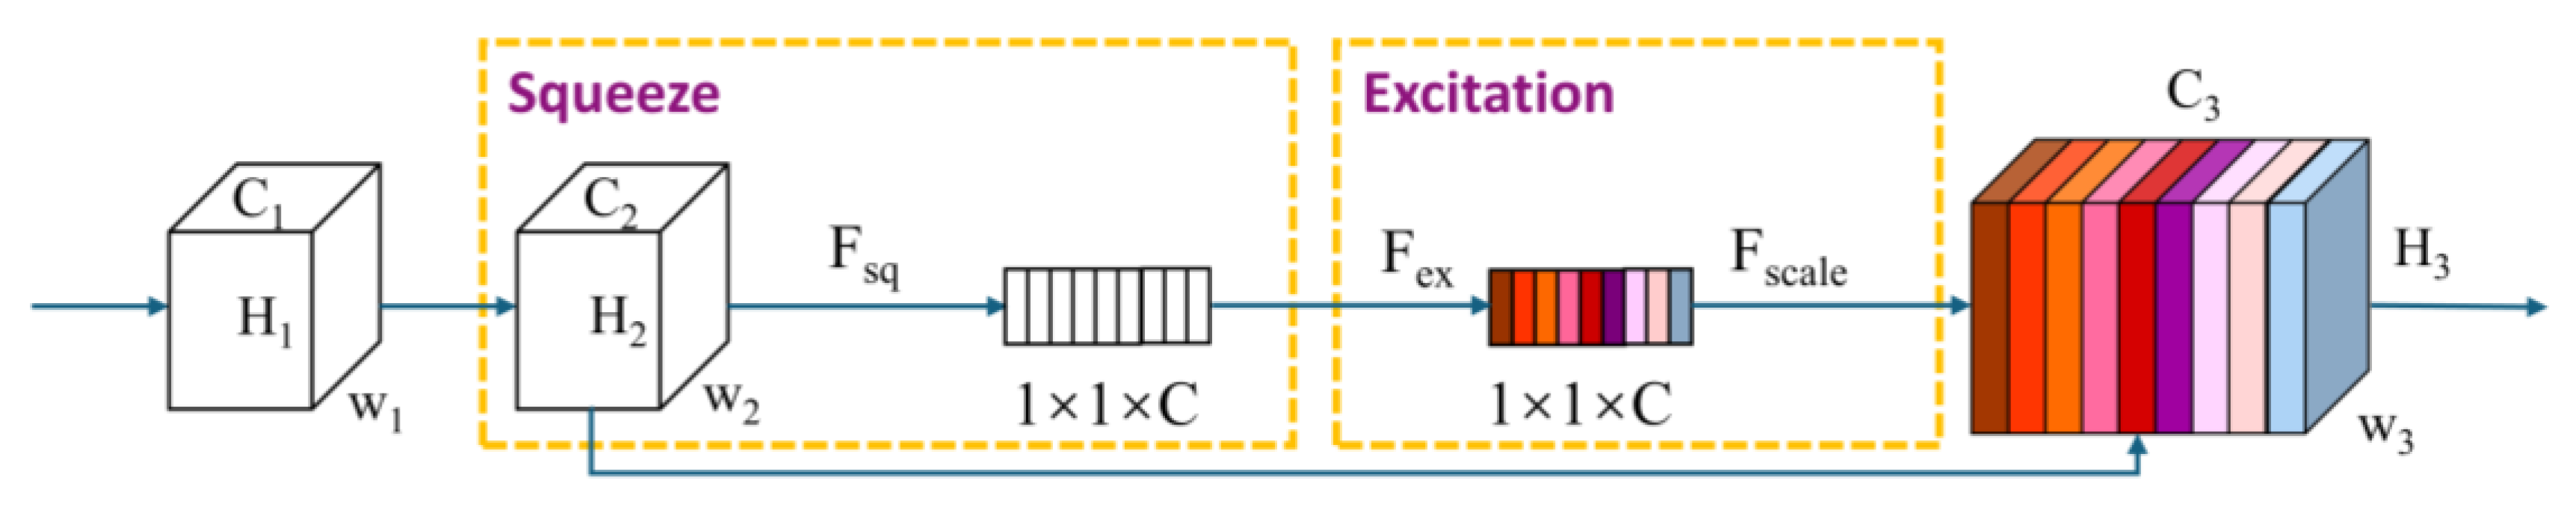
28] module, proposed by Hu et al., into the encoder of the DeepLabv3+ framework to enhance feature discrimination, specifically targeting the challenge of high intra-class variance in RS images with high resolution. The SE module improves the quality of the learned features by modeling channel interdependencies and recalibrating feature responses, thereby helping the network focus on essential information within the same class. This recalibration is achieved through two key operations: squeeze-and-excitation.
The SENet module is mainly divided into two components: squeeze-and-excitation, as well as scale. In the squeeze operation, Fsq applies global average pooling across channels, reducing the W × H × C feature map with a global context into a 1 × 1 × C vector. This is performed to transform each two-dimensional channel into a numerical value that captures the global sensing characteristics. In this case, each pixel represents a single channel, shielding the spatial distribution information and better utilizing the correlation between the channels. The formula used is as follows:
z c = F s q = 1 H × W i = 1 H j = 1 W X i , j , c
Fsq represents the excitation component. This function relies on the correlations between feature channels, assigning each channel a weight to indicate its relative importance. Feature vectors with different shades of color, that is, different degrees of importance, are obtained from the features of the C channels that were originally white. The formula is as follows:
s = σ W 2 δ W 1 z
S The weights of the excitation output were regarded as the importance of each feature channel. This is because for all values of H × W at each position of U, the weights of the corresponding channels are multiplied by the values in question to complete the recalibration of the original features. The formula is as follows:
X i , j , c ˜ = s c X i , j , c
As illustrated in Figure 2, the squeeze operation aggregates feature maps across spatial dimensions, thereby creating a compact channel descriptor using global average pooling. This step enables the network to effectively leverage the global context, which is critical for reducing intra-class variability by capturing global information from the lower layers. The excitation operation follows, in which two fully connected layers with nonlinearity, followed by sigmoid activation, generate a set of adaptive scaling factors for each channel. These factors allow the model to emphasize class-consistent features while suppressing less relevant variations, thereby mitigating intra-class variance. By integrating the SE module into DeepLabv3+, the model became more adept at capturing fine-grained details while maintaining robust class consistency.

2.4. Encoder with the ResNeSt Module

The DeepLabv3+ encoder incorporates the ResNeSt module, which employs a “split-attention” mechanism to address high intra-class variance and low inter-class variance, which are prevalent in RS images with high resolution. As illustrated in Figure 3, ResNeSt utilizes a novel “split-attention” mechanism that applies channel attention across multiple branches of the network. This mechanism enables features from different branches to interact, allowing the model to adaptively select important features and enhance the perception of targets at different scales. The architecture of ResNeSt enables the model to capture complex cross-feature interactions and learn diverse representations from various feature subspaces, which is crucial for reducing intra-class variance by isolating subtle class-specific features.
Split-attention represents a key component of ResNeSt, whereby the adaptive fusion of features is achieved by partitioning the feature map into multiple branches within the residual block, followed by the application of an attention mechanism to these branches. This module enhances the performance of the model in multi-scale scenes. The primary processes are as follows:
Feature segmentation entails partitioning the input feature map into multiple sub-feature maps, which are then convolved across different branches. The formula is as follows:
X ^ = s = 1 S α s X s
where Xs denotes the characteristics of the s-the branch and αs is a weighting factor computed through the attention mechanism.
The computation of attention involves summarizing the features of each branch and then obtaining global information through a global pooling (squeezing) operation. This information is then sent to a series of fully connected layers, from which the attention weights for each branch are computed. The input feature maps in Figure 3 were subjected to attention computation after excitation and weighted superposition; therefore, the final output was not consistent with the color depth of the input feature maps. The formula is as follows:
α = Softmax W 2 δ W 1 z
where z is the feature vector obtained through global pooling, W1 and W2 are two fully connected layers, δ represents the activation function, and α denotes the attention weights.
The reweighting of features entails weighting and summing the features of each branch in accordance with the attention weights, thereby facilitating adaptive fusion of the features. ResNeSt splits an input into multiple lower-dimensional embeddings, processes them using different sets of convolutional filters, and merges the results. This enables the model to emphasize inter-class distinctions by capturing different aspects of the input data, thereby enhancing the separability between classes. The integration of ResNeSt not only improves the model’s ability to capture inter-class differences but also enhances the network’s computational efficiency, contributing to more accurate and efficient fine-grained segmentation.

2.5. Decoder

The encoder outputs a high-level semantic feature map, and the acquired deep and shallow semantic features are passed to the decoder [36]. The deep semantic features enter the decoder after up-sampling, while the results of the shallow subsemantic feature map, following a 1 × 1 convolution, are stacked sequentially. To complete the feature fusion, a 3 × 3 convolution is then employed for feature extraction. Finally, the output image is resized through up-sampling to match the dimensions of the input image. At this point, the output image represents the species to which each pixel in the input image belongs.

2.6. Loss Function

Due to the small sample size of the tailings pond and the sample imbalance problem, the loss function selects the focal loss:
Focal loss [37] prompts the model to prioritize hard-to-classify samples (tailings reservoirs) during training by incorporating an adjustable factor. F o c a l   L o s s assigns less weight to samples that are easily categorizable and more weight to those that are challenging to categorize, thereby reducing the impact of category imbalance on model training. The formula for the focal loss is as follows:
F o c a l   L o s s p t = α t 1 p t γ l o g p t
where p t is the model’s probability of predicting the correct category, α t is the category weight used to balance the impact of different categories, and γ is a moderator used to control the model’s focus on difficult and easy samples. Using focal loss, this experiment effectively alleviates the sample imbalance problem pertaining to the relatively low number of pixels in the tailings ponds, thereby enhancing the ability of the model to recognize a few classes.

2.7. Evaluation Metrics

To evaluate the model performance, a test set was used for precise performance assessment. This study employed five main evaluation metrics: precision, recall, F 1 s c o r e , IoU, and mPA. Precision indicates the fraction of correctly predicted positive instances among all positive predictions made by the model. It is a critical metric when minimizing false positives is important, as it highlights the model’s ability to avoid classifying non-tailings pond areas as tailings ponds. R e c a l l measures the fraction of actual positive cases in the dataset that are correctly identified by the model. It indicates how well the model can detect all tailings pond regions, including harder-to-identify areas. The F1 score is calculated as the harmonic means of precision and recall, balancing both to provide a single metric that represents the trade-off between them. IoU (Intersection over Union) measures the extent to which the segmented region predicted by the model overlaps with the true labeled region. IoU improvements reduce false positives and enhance boundary accuracy, helping to avoid unnecessary resource allocation and monitoring of only the relevant areas. The mPA (Mean Pixel Accuracy) is a measure of the accuracy of the classification of each category of pixels and can reflect how well the model classifies each category over the entire image. The mPA enhancement helps to minimize confusion between the tailings ponds and the background and ensures that the tailings ponds can be accurately identified in large-area monitoring. This is especially useful in this scenario, where a balance between identifying tailings ponds (high recall) and avoiding false alarms (high precision) is crucial.
P r e c i s o n = T P T P + F P
R e c a l l = T P T P + F N
F 1 s c o r e = 2 × P r e c i s o n × R e c a l l P r e c i s i o n + R e c a l l
In this context, TP represents the number of pixels correctly predicted as tailings ponds, FN refers to the number of tailings pond pixels misclassified as background pixels, and FP denotes the number of background pixels incorrectly predicted as tailings ponds.
In addition, more comprehensive evaluation metrics include the Intersection over Union (IoU) [38] and mean pixel Accuracy (mPA). IoU refers to the fraction of correctly predicted pixels with respect to the actual pixels in the merged set, while mPA aims to calculate the proportion of correctly categorized pixels within each class. The formulas for IoU and mPA are as follows:
I o U = T P T P + F P + F N
m P A = 1 K + 1 i = 0 k T P T P + F P
When there are K classes, the current task involves only two classes: tailings ponds (class 1) and background.

3. Experiments

3.1. Study Area

The study area was located in Lingwu City, Ningxia Province (106°28′–106°47′, 37°54′–38°4′), with mines primarily situated in the areas of Nindong, Jieyaobao, Qingshuiying, Majiatan, and Shigouyi, and an annual coal production of 58,946,000 tons. In particular, coal ore mining has led to the creation of thousands of tailings ponds (Figure 4). The images of Lingwu City (Figure 4a) and Shizuishan City (Figure 4b) in Figure 4 are from the Sentinel-2 image.

3.2. Experimental Data

In this experiment, 2-m resolution GF-1 images were used, with data sources including the red, green, and blue spectral bands. We utilized ENVI software (version 5.3) to pre-process the high-resolution data for radiometric calibration and orthometric correction. The tailings ponds in Lingwu City and Shizuishan were specifically selected to create a semantic segmentation dataset using pixel-level annotation, with LabelMe software (3.16.7) employed for this purpose. However, there are fewer tailings pond data in Lingwu City and Shizuishan City, so tailings pond data from other areas with the same 2 m resolution have been added. The tailings ponds were labeled through manual visual interpretation during the annotation process. To validate the applicability of the method to other datasets, additional experiments were performed with RST-DeepLabv3+ employing the TPSet dataset [25]. TPSet covers regions in Hebei Province, China, primarily Tangshan, Chengde, Baoding, and others. TPSet is a dataset derived from images acquired by the PMS on the Gaofen-6 satellite. Images captured by Gaofen-6 have spatial resolutions of 2 m in the panchromatic band and 8 m in the multispectral band [39].
To address graphics processing unit (GPU) memory constraints, images and labels were randomly cropped into 256 × 256 sections across the three regions, with uniformly distributed cropping locations. The process generated 500 pairs of samples for the semantic segmentation dataset, which was subsequently divided into training, validation, and test sets in the ratio of 8:1:1. Figure 5a,b illustrate an example of a tailings bank dataset. Figure 5a is derived from the GF-1 data obtained from the high-resolution Earth Observation System data and the application Center in Ningxia. Figure 5b shows the result of the image in Figure 4a after LabelMe software labeled mask.
Table 1 records the proportion of all pixels of the image accounted for by the target pixels in NX-TPSet and TPSet. The number of pixels in the tailings pond was approximately 8.38% of the total number of background pixels, and there was a sample imbalance problem; therefore, the loss function selected for this experiment was the focal loss. Focus loss is a loss function proposed to solve sample imbalance problems.

3.3. Experimental Setup

Model training and testing were conducted on a laptop that used an Intel (R) Core (TM) i7-8750H CPU @ 2.40 GHz, 16 GB RAM, NVIDIA GeForce RTX 2060 GPU, and Windows 10 OS. The model was built using PyTorch 1.10.1 and Torchvision 0.11.2, and the code was written in Python 3.7.16. The training utilized focal loss as the loss function, Adam as the optimizer, and a cosine learning rate decay strategy starting at 0.0001 with a decay factor of 0.9. The input size was 256 × 256, the batch size was 15, and the training was run for a maximum of 200 epochs.

3.4. Ablation Study

Three main sets of ablation experiments were conducted to validate the effectiveness of the enhancement module proposed in the RST-DeepLabv3+ model. These included tests on SENet, ResNeSt, and RST (SENet + ResNeSt), respectively. The baseline model was defined as follows: The baseline DeepLabv3+ model, lacking any improvement modules, served as the reference point.
(1)
An experiment was conducted to evaluate the efficacy of the SENet module. The SENet module was integrated into the DeepLabv3+ encoder to assess its impact on the pixel segmentation of tailings ponds and to investigate the influence of adaptive inter-channel weight adjustment on the model.
(2)
The ResNeSt ablation experiment involved incorporating ResNeSt into the DeepLabv3+ encoder, with the objective of evaluating the impact of multi-scale feature fusion and the potential enhancement in segmentation performance.
(3)
The RST ablation experiment entailed the integration of the SENet and ResNeSt modules to create a comprehensive RST-DeepLabv3+ configuration. This approach allowed for the assessment of the combined impact of these modules on the overall performance of the model.
The experimental methodology involved training and testing each set of experiments using the same datasets (NX-TPSet and TPSet) and employing the same evaluation metrics to assess the contribution of each module to the performance of the final model.

3.5. Comparison Study

U-Net, known for its symmetric encoder−decoder structure, excels in extracting fine-grained spatial features. PSP-Net introduces a pyramid pooling module to capture multi-scale contextual information, enhancing the segmentation accuracy for scenes with complex structures. DeepLabv3+ further improves upon its predecessors by incorporating Atrous Spatial Pyramid Pooling (ASPP) and a decoder module for sharper boundary delineation. These methods were chosen for the comparison experiments because they are the most representative techniques in the field of semantic segmentation and provide a comprehensive benchmark for evaluating the effectiveness and advantages of the proposed RST-DeepLabv3+ model.
The proposed RST-DeepLabv3+ method was compared to the three widely used semantic segmentation methods listed below:
(1)
U-Net: U-Net is a network commonly used for image segmentation, adopting a symmetric “U” shape structure. It extracts features through an encoder, progressively recovers the image resolution via a decoder, and uses jump connections to preserve the details. These factors make it suitable for high-resolution segmentation tasks.
(2)
PSP-Net: PSP-Net utilizes pyramid pooling modules to capture multi-scale contextual information and enhance the model’s understanding of global and local details. It is particularly well suited for handling complex scenarios with objects at different scales.
(3)
DeepLabv3+: DeepLabv3+ integrates a dilated convolution with an encoder–decoder structure. The void convolution helps the model expand its sensory field and capture more contextual information, while the decoder improves the accuracy of detailed segmentation in complex image segmentation tasks.
In accordance with the aforementioned four methodologies, which were tested on the NX-TPSet and TPSet datasets, the training and validation of the models were conducted independently for each scenario using the same evaluation metrics.

4. Results

4.1. Results of the Ablation Experiments

In the ablation experiments, we verified the effectiveness of the proposed multi-scale attention module by comparing the effects of different combinations of modules on model performance. The results are presented in Table 2 and Table 3.
The standard DeepLabv3+ model demonstrated optimal performance across all metrics, with a precision of 92.90%, recall of 91.09%, F1 score of 91.99%, IoU of 85.16%, and mPA of 95.29%. Incorporating the SENet module into DeepLabv3+ resulted in a marginal enhancement in precision (93.60%) and an analogous improvement in the F1 score (92.15%). However, there was a slight decrease in recall (90.75%) compared to the baseline value, which may be attributed to SENet potentially overlooking minor details at the boundaries of the tailings pond while enhancing precision. Incorporating the ResNeSt module enhanced the performance of the model. Compared to the baseline, the precision (93.19%), recall (91.64%), and F1 score (92.41%) demonstrated gradual improvements. The final model, RST-DeepLabv3+, was the result of combining SENet and ResNeSt and represented the optimal solution in terms of overall performance. Both precision (93.94%) and recall (92.20%) were enhanced, resulting in the highest F1 score (92.84%). Notably, the IoU improved to 86.35%, indicating that the model could accurately delineate the tailings pond area with greater precision at the boundaries. To ascertain the generalizability of the method, the following ablation results were obtained for the TPSet dataset.
The experimental results are illustrated in Figure 6 and Figure 7. The red boxes indicate error areas, while the orange boxes represent missed areas. The results in Figure 6 are derived from the test set in the NX-TPSet datasets. The results in Figure 7 are derived from the test set in the TPSet datasets.
As shown in Table 3, Similar to the outcomes observed for the NX-TPSet dataset, the baseline DeepLabv3+ model demonstrated favorable overall performance, with an accuracy rate of 92.43%, recall rate of 90.85%, and F1 score of 91.54%. Nevertheless, the IoU (84.87%) and mPA (95.46%) values suggest that enhancements can be made in terms of boundary accuracy and class-level pixel accuracy. Incorporating SENet marginally enhanced the accuracy (93.78%), whereas the F1 score remained commendable at 92.31%. However, the recall decreased slightly to 90.69%, which was consistent with the trend observed in the NX-TPSet experiments, whereby SENet improved the precision but failed to effectively capture the entire extent of the segmented region. In contrast, ResNeSt demonstrated its strengths in recall, leading to an increase. This resulted in an F1 score of 92.62% and an IoU of 85.66%, achieving an mPA of 95.75%. These results demonstrated the model’s ability to improve image segmentation accuracy across different classes. In RST-DeepLabv3+, the combination of SENet and ResNeSt achieved optimal results across most metrics, with a precision of 93.79%, recall of 92.37%, F1 score of 92.93%, and IoU of 86.29%.
The RST-DeepLabv3+ model demonstrated consistent superiority over the DeepLabv3+ baseline for both the NX-TPSet and TPSet datasets.

4.2. Results of the Comparison Experiments

In the comparison experiments, we verified the effectiveness of the proposed RST-DeepLabv3 + method by comparing the results of different deep learning models on the NX-TPSet and TPSet datasets. The results are presented in Table 4 and Table 5.
As shown in Table 4, the RST-DeepLabv3+ model demonstrated superior performance compared to other prominent semantic segmentation models, including U-Net, PSP-Net, and the baseline DeepLabv3+ model. The RST-DeepLabv3+ model exhibited the highest accuracy (93.9%), which was significantly higher than those of the U-Net (91.96%) and PSP-Net (90.73%) models. This was particularly evident when considering the PSP-Net model, which had an IoU of 83.15%. Although the difference in mPA was relatively minor, RST-DeepLabv3+ exhibited a slight advantage with an mPA of 95.55%, demonstrating its efficacy in accurately classifying pixels across the entire dataset. To validate the general applicability of the method, we present comparative experiments of RST-DeepLabv3+ performed on the TPSet dataset.
The results are illustrated in Figure 8 and Figure 9, where the regions highlighted in red indicate error areas and those in orange represent missed areas. The results in Figure 8 are derived from the test set in the NX-TPSet datasets. The results in Figure 9 are derived from the test set in the TPSet datasets.
As shown in Table 5, The RST-DeepLabv3+ model exhibited the highest accuracy (93.79%), surpassing the performances of the U-Net (91.48%), PSP-Net (90.58%), and baseline DeepLabv3+ (92.43%) models. This demonstrates that the model exhibits a low false-alarm rate across diverse datasets, indicating its robust capacity for generalization in the identification of tailings pond regions. Regarding recall, RST-DeepLabv3+ also exhibited a high level of performance (92.37%), which was superior to that of all other models. The nearest competitor, DeepLabv3+, exhibited a recall of 90.85%, which was markedly inferior to that of RST-DeepLabv3+.
The F1 score, which balances precision and recall, further confirmed the validity of the RST-DeepLabv3+ model, as it received the highest score of 92.93%. In comparison, PSP-Net demonstrated a lower performance of 90.78%, whereas U-Net and DeepLabv3+ exhibited suboptimal results. With an IoU rate of 86.29%, RST-DeepLabv3+ again demonstrated superior performance compared to that of the other models. This indicates that the model is more effective in accurately predicting tailings pond boundaries, as it produces a higher degree of overlap between the predicted and actual tailings pond areas compared to that of the other methods, particularly PSP-Net (83.57%). While all models demonstrated adequate performance in terms of mPA, RST-DeepLabv3+ exhibited a slight advantage, with a score of 95.61%.

5. Discussion

The proposed model for tailings pond identification, based on an enhanced DeepLabv3+ architecture, demonstrates improvements in both extraction accuracy and robustness compared to those of traditional models. By integrating the ResNeSt and SENet modules, the model captures more nuanced multi-scale features and addresses key challenges in tailings pond identification, including diverse textures, complex environmental conditions, and high intra-class variance and low inter-class variance in high-resolution tailings ponds remote sensing imagery due to mixing of constituents within the tailings ponds.
One notable advantage of our approach is its ability to perform fine-grained segmentation, which is particularly useful for identifying small, irregularly shaped tailings ponds. Traditional methods, such as image processing techniques, are often prone to noise and may miss subtle features owing to variations in lighting and texture. Compared with the extraction of tailing ponds using SC-SS(Spectral–Spatial Masked Transformer With Supervised and Contrastive) [40], RST-DeepLabv3+ pays more attention to the special target of tailing ponds in the segmentation process by introducing the SENet module and ResNeSt module. Tailings ponds are usually composed of tailings residues and wastewater, and their colors and textures, as shown in Figure 3; the segmentation attention mechanism res are extremely similar to objects such as water bodies, vegetation, and clouds, and this similarity often leads to misidentification in traditional methods. Our improved model can effectively alleviate this problem and improve segmentation accuracy. However, with the addition of the SENet and ResNeSt modules, the computational complexity of the model may increase. The computational efficiency is lower than that of the original DeepLabv3+. As shown in
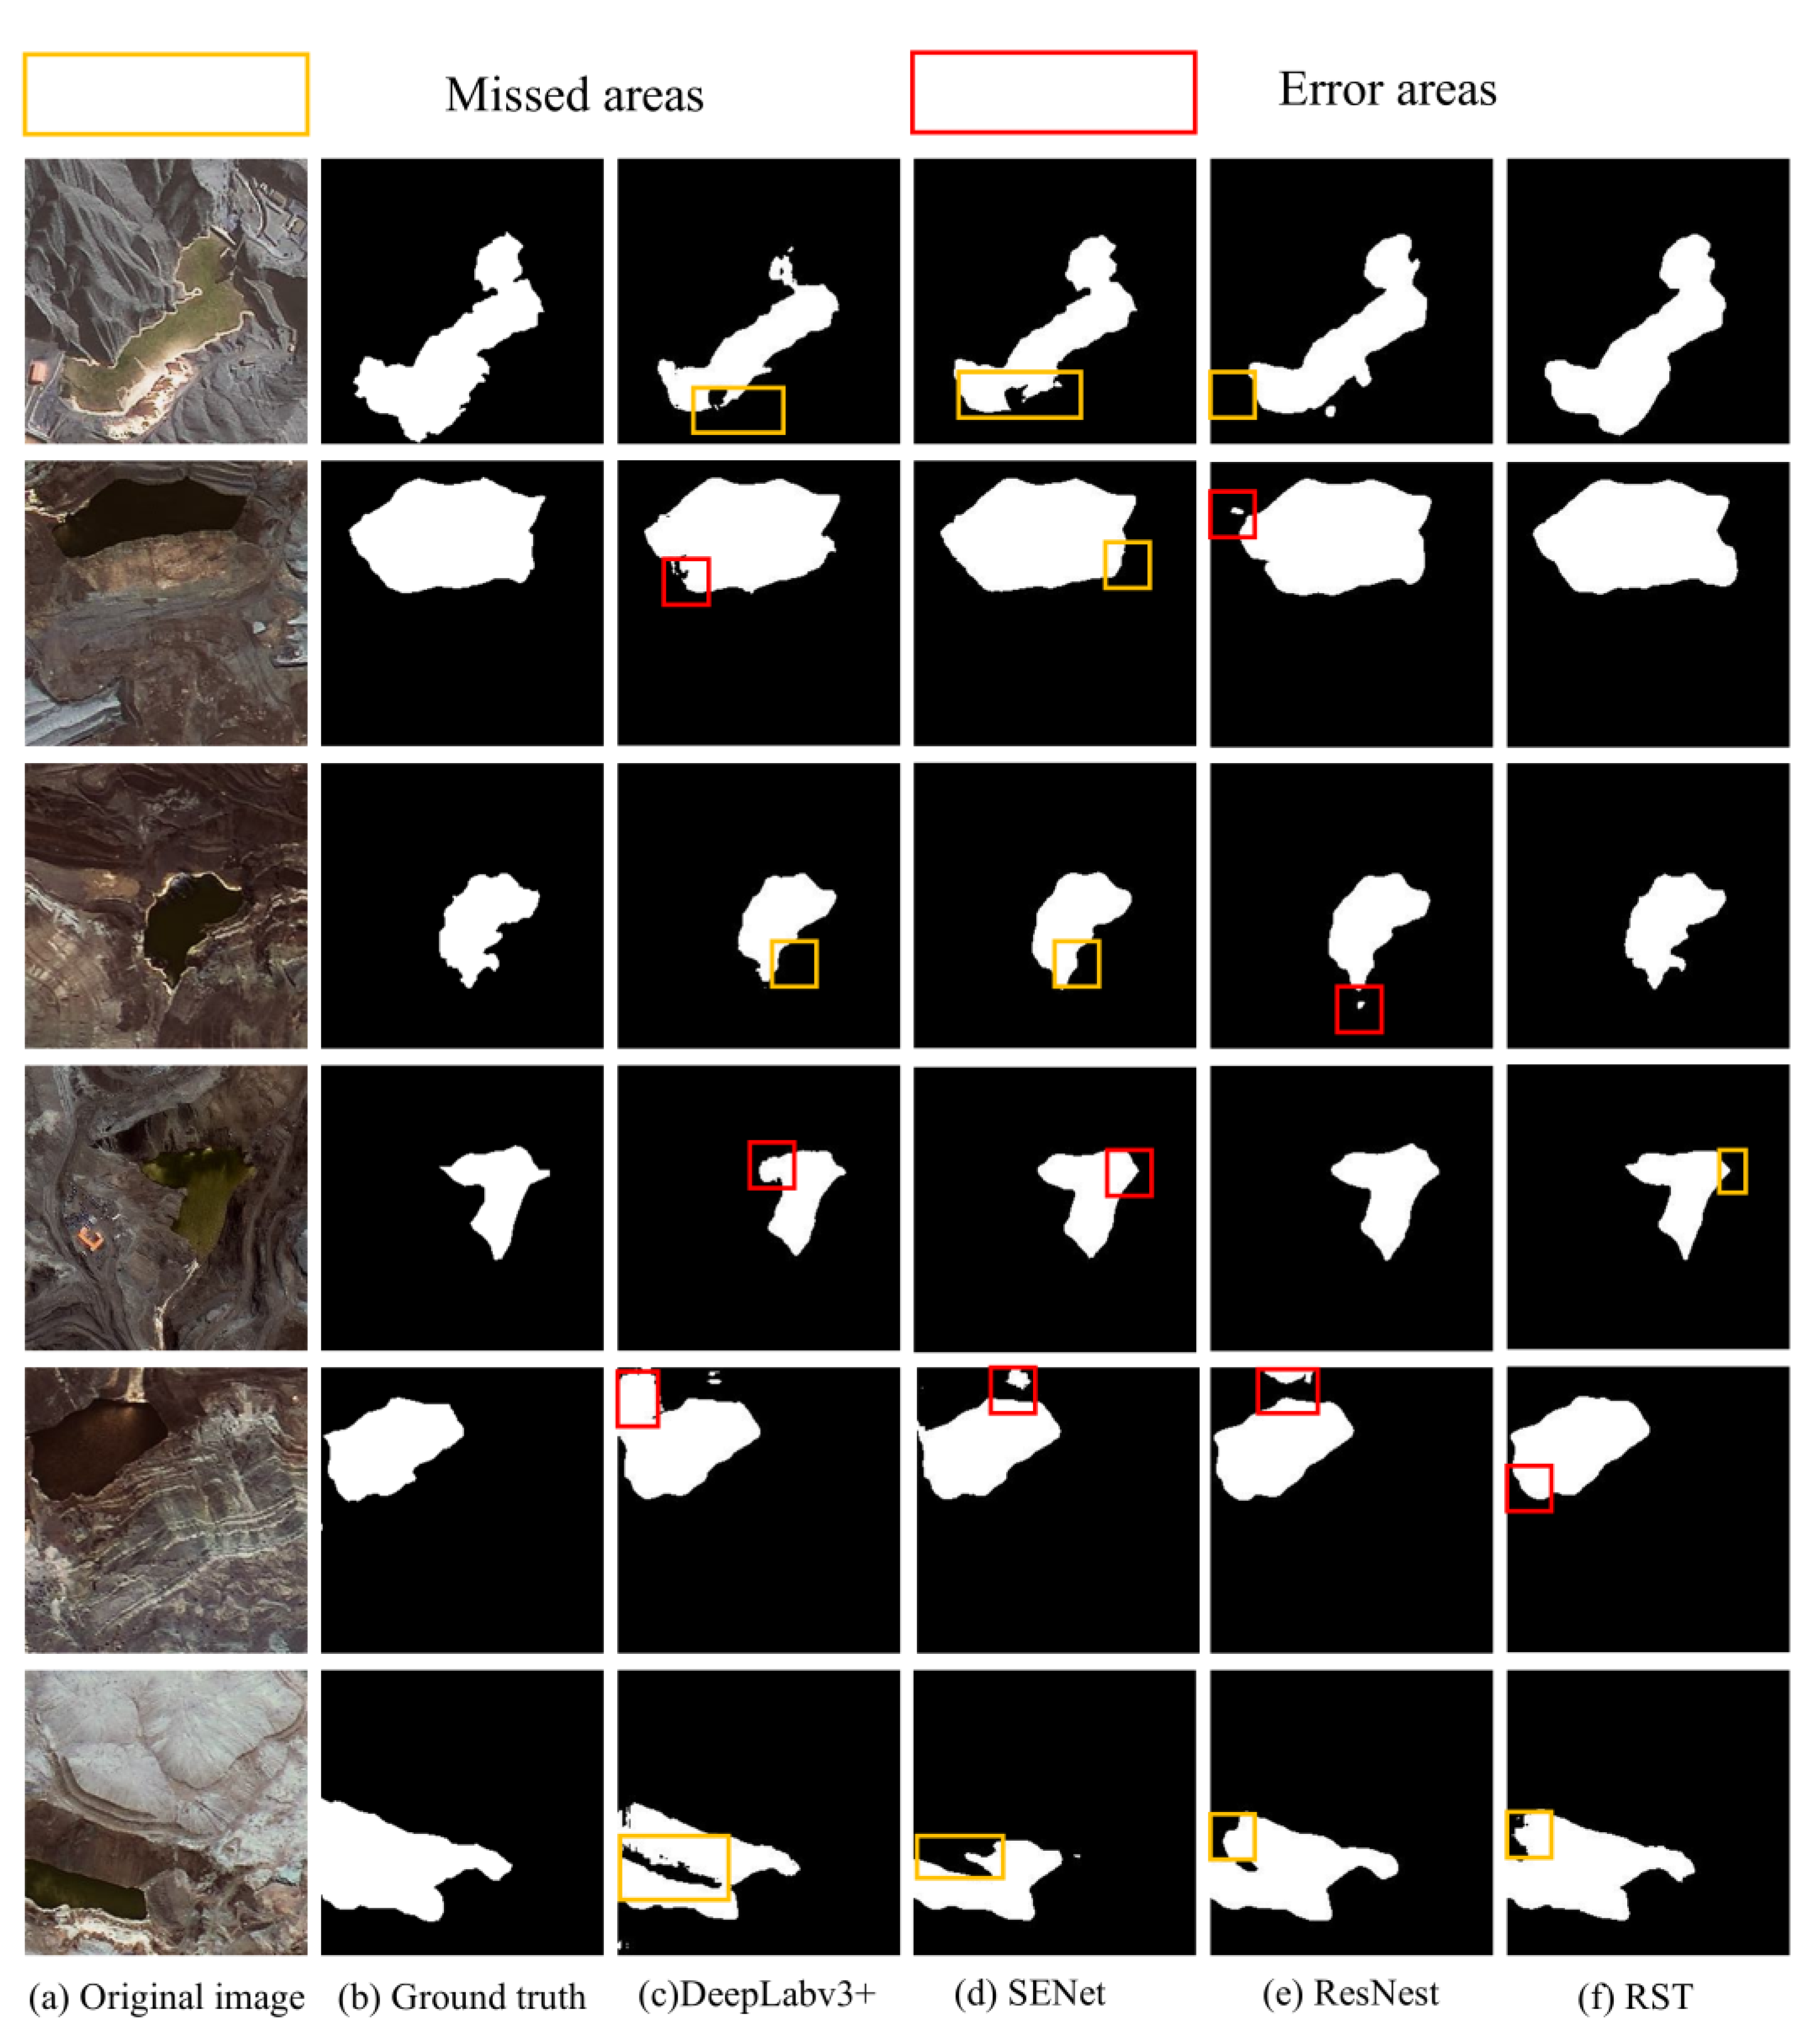
 Figure 6 and Figure 7, this resulted in more accurate predictions, especially in complex scenes where tailings ponds may be visually similar to other elements, such as water bodies, vegetation, or shadows. The efficacy of the model in multi-scale scenarios is notably enhanced by the incorporation of the SENet and ResNeSt modules. SENet’s squeezing and excitation mechanism facilitates the network’s adept utilization of global context information, while ResNeSt attains adaptive fusion of features by segmenting the feature map into multiple residual blocks and implementing the attention mechanism on these branches through the segmentation attention mechanism. This enhancement not only mitigates false positives but also substantially improves segmentation in challenging categories. This finding aligns with the observations reported in other studies, such as the enhanced performance of SSAtNet [21] in distinguishing between buildings and trees. However, misidentification is minimal, primarily because of the inherent similarities between tailings ponds and other natural elements.
The effectiveness of integrating attention modules is consistent with findings from other semantic segmentation studies [41]. Observing Figure 6, Figure 7, Figure 8 and Figure 9, we find that even the improved RST-DeepLabv3+ method still differs from the ground truth, and we speculate that it may be due to the fact that the dataset has only three bands of RGB, and some detailed information is more sensitive to other multispectral bands. We may need to add multispectral data and other sensor data to solve this problem.
However, the current model has limitations, particularly in scenarios where the dataset lacks diversity in RS imagery [42]. In this paper, only RGB images are used for image recognition, and no other spectral bands are fused, and the model may miss texture information that is more sensitive to multiple spectra. Similar to previous studies, where the generalizability of the model was limited by the size and variety of the dataset, expanding the range of images to include different sensors (such as synthetic aperture radar and light detection and ranging) and varying temporal conditions (such as seasonal variations) will further enhance the robustness and applicability of the model. Because the ground truth of the NX-TPSet dataset is subjectively labeled, there is a subjective error in the accuracy of the image of the real tailings pond identification. In addition, future research should explore the classification of tailings ponds based on their operational status, such as active or inactive, which could provide more targeted identification strategies. The status of tailings ponds may change over time as a result of changes in mining activities, environmental conditions, and waste accumulation. Temporal monitoring can be integrated into the proposed method, and we can introduce time series remote sensing data into the model in order to realize the continuous monitoring of tailing ponds. Due to the relatively decentralized distribution of tailings ponds, the number of realistic small- and medium-sized tailings ponds is still large. Therefore, when using high-resolution images to identify small tailings ponds, the sample imbalance problem can lead to low detection accuracy. Therefore, with the increasing popularity of drones, a combination of drone data and high-resolution images can be explored. UAV data can be used to identify small- and medium-sized tailings ponds, thereby improving the detection accuracy. Therefore, with the popularity of UAVs, UAV data can be combined with high-resolution images [43], and UAV data can be used to identify small- and medium-sized tailing ponds, thus improving recognition accuracy [44]. The method still needs to be tested in real scenarios and improved to meet the real-time monitoring requirements of tailings ponds in large scenarios.
The segmentation outputs can be used to track changes in the surface area or volume of the tailings pond over time, thereby providing valuable data for capacity monitoring. As tailings accumulate, the pond capacity can change, and precise segmentation can help calculate the remaining storage capacity.

6. Conclusions

In this study, we present an enhanced DeepLabv3+ model for the detection and segmentation of tailings ponds. By incorporating multi-scale attention modules—ResNeSt and SENet—into the encoder of the DeepLabv3+ model, our approach effectively captures and integrates multi-scale features for more accurate segmentation, particularly along the complex and often irregular boundaries of tailings ponds. As shown in Figure 3, the segmentation attention mechanism in ResNeSt enhances the perception of targets at different scales as a way to capture complex cross-feature interactions and learn different representations from different feature subspaces. The problem of high within-class variance and low between-class variance in the identification of tailings ponds is solved. The proposed model consistently exhibited excellent performance in comprehensive experiments on both the self-built NX-TPSet dataset, which was developed specifically for this study, and the publicly available TPSet dataset, which contained 500 pairs of samples, to provide a foundation for testing the generalizability and validity of the model. The TPSet dataset, which serves as a public benchmark, further validates the ability of the model to detect tailings ponds in various environments.
The experimental results demonstrated a recall of 92.2% and an IOU extraction accuracy of 86.35% for the RST-DeepLabv3+ model, which is an improvement of 1.11% in recall and 1.19% in IOU extraction accuracy compared to those of the DeepLabv3+ model. The augmented model exhibits robust capability in distinguishing tailings ponds from similar objects, such as water bodies, vegetation, and other landscape features.
The proposed model not only advances the development of tailings pond identification techniques but also provides a solution for the dynamic identification of tailings ponds. This study enhances tailings pond identification through the RST-DeepLabv3+ model, which improves disaster prevention by accurately monitoring tailings pond boundaries and enabling early warning systems for potential risks, thereby contributing to environmental protection.
Future research should explore multimodal and dynamic monitoring by combining InSAR or UAV data with semantic segmentation techniques to improve the accuracy and adaptability of tailings pond monitoring. This method should be actively used in regulatory and industrial settings to enable real-time monitoring of tailings ponds to prevent potential disasters.

Author Contributions

Conceptualization, X.F. and Q.Z.; methodology, X.F.; software, X.F.; validation, X.F. and X.X.; formal analysis, X.F.; investigation, Q.Z.; resources, X.X.; data curation, Q.Z. and X.X.; writing—original draft preparation, X.F.; writing—review and editing, Q.Z. and X.F.; visualization, X.F., Q.Z. and X.X.; supervision, X.L.; project administration, X.L.; funding acquisition, C.W. All authors have read and agreed to the published version of the manuscript.

Funding

This research was supported by The Key Research and Development Program of the Ningxia Hui Autonomous Region (2022BEG03063). This work was supported by the High-performance Computing Platform of China University of Geosciences, Beijing.

Data Availability Statement

Supplementary tailings pond data in NX-TPSet downloaded from (https://figshare.com/s/ee2da2d0bc6e27a2a582, dataset modified on 28 January 2021), TPSet can be downloaded from (https://geodata.pku.edu.cn/index.php?c=content&a=show&id=1945, accessed on 14 March 2024).

Acknowledgments

The authors would like to thank the editors and reviewers for their valuable comments.

Conflicts of Interest

The authors declare no conflicts of interest.

Abbreviations

The following abbreviations are used in this manuscript:
Faster R-CNNFaster Region-based Convolutional Neural Networks
FNFalse Negatives
FPFalse Positives
GF-6GaoFen-6
IOUIntersection Over Union
mPAMean Average Precision
TPTrue Positives
YOLOv5You Only Look Once v5
SSDSingle Shot Multibox Detector
SC-SSScene-Classification-Sematic-Segmentation

References

  1. Wang, C.; Harbottle, D.; Liu, Q.; Xu, Z. Current State of Fine Mineral Tailings Treatment: A Critical Review on Theory and Practice. Miner. Eng. 2014, 58, 113–131. [Google Scholar] [CrossRef]
  2. Martín-Crespo, T.; Gomez-Ortiz, D.; Pryimak, V.; Martín-Velázquez, S.; Rodríguez-Santalla, I.; Ropero-Szymañska, N.; José, C.D.I.-S. Quantification of Pollutants in Mining Ponds Using a Combination of LiDAR and Geochemical Methods—Mining District of Hiendelaencina, Guadalajara (Spain). Remote Sens. 2023, 15, 1423. [Google Scholar] [CrossRef]
  3. Komljenovic, D.; Stojanovic, L.; Malbasic, V.; Lukic, A. A Resilience-Based Approach in Managing the Closure and Abandonment of Large Mine Tailing Ponds. Int. J. Min. Sci. Technol. 2020, 30, 737–746. [Google Scholar] [CrossRef]
  4. Hu, S.; Xiong, X.; Li, X.; Chang, J.; Wang, M.; Xu, D.; Pan, A.; Zhou, W. Spatial Distribution Characteristics, Risk Assessment and Management Strategies of Tailings Ponds in China. Sci. Total Environ. 2024, 912, 169069. [Google Scholar] [CrossRef]
  5. Liu, K.; Liu, R.; Liu, Y. A Tailings Pond Identification Method Based on Spatial Combination of Objects. IEEE J. Sel. Top. Appl. Earth Obs. Remote Sens. 2019, 12, 2707–2717. [Google Scholar] [CrossRef]
  6. Yan, D.; Zhang, H.; Li, G.; Li, X.; Lei, H.; Lu, K.; Zhang, L.; Zhu, F. Improved Method to Detect the Tailings Ponds from Multispectral Remote Sensing Images Based on Faster R-CNN and Transfer Learning. Remote Sens. 2021, 14, 103. [Google Scholar] [CrossRef]
  7. Zhao, Y.M. Moniter Tailings Based on 3S Technology to Tower Mountain in Shanxi Province. Master’s Thesis, China University of Geoscience: Beijing, China, 2011. [Google Scholar]
  8. Lv, J. Research and Application of Remote Sensing Monitoring Technology for Tailings Ponds. Master’s Thesis, China University of Geoscience: Beijing, China, 2014. [Google Scholar]
  9. Pavlovic, V.I.; Sharma, R.; Huang, T.S. Visual Interpretation of Hand Gestures for Human-Computer Interaction: A Review. IEEE Trans. Pattern Anal. Mach. Intell. 1997, 19, 677–695. [Google Scholar] [CrossRef]
  10. Minaee, S.; Boykov, Y.Y.; Porikli, F.; Plaza, A.J.; Kehtarnavaz, N.; Terzopoulos, D. Image Segmentation Using Deep Learning: A Survey. IEEE Trans. Pattern Anal. Mach. Intell. 2021, 44, 3523–3542. [Google Scholar] [CrossRef]
  11. Sun, Z.; Li, P.; Meng, Q.; Sun, Y.; Bi, Y. An improved YOLOv5 method to detect tailings ponds from high-resolution remote sensing images. Remote Sens. 2023, 15, 1796. [Google Scholar] [CrossRef]
  12. Ren, S.; He, K.; Girshick, R.; Sun, J. Faster R-CNN: Towards Real-Time Object Detection with Region Proposal Networks. IEEE Trans. Pattern Anal. Mach. Intell. 2017, 39, 1137–1149. [Google Scholar] [CrossRef] [PubMed]
  13. Redmon, J.; Divvala, S.; Girshick, R.; Farhadi, A. You Only Look Once: Unified, Real-Time Object Detection. Available online: https://arxiv.org/abs/1506.02640v5 (accessed on 9 September 2024).
  14. Liu, W.; Anguelov, D.; Erhan, D.; Szegedy, C.; Reed, S.; Fu, C.-Y.; Berg, A.C. SSD: Single Shot MultiBox Detector. In Computer Vision—ECCV 2016; Lecture Notes in Computer Science; Leibe, B., Matas, J., Sebe, N., Welling, M., Eds.; Springer International Publishing: Cham, Switzerland, 2016; Volume 9905, pp. 21–37. ISBN 978-3-319-46447-3. [Google Scholar]
  15. Li, Q.; Chen, Z.; Zhang, B.; Li, B.; Lu, K.; Lu, L.; Guo, H. Detection of Tailings Dams Using High-Resolution Satellite Imagery and a Single Shot Multibox Detector in the Jing–Jin–Ji Region, China. Remote Sens. 2020, 12, 2626. [Google Scholar] [CrossRef]
  16. Yan, D.; Li, G.; Li, X.; Zhang, H.; Lei, H.; Lu, K.; Cheng, M.; Zhu, F. An Improved Faster R-CNN Method to Detect Tailings Ponds from High-Resolution Remote Sensing Images. Remote Sens. 2021, 13, 2052. [Google Scholar] [CrossRef]
  17. Lin, T.-Y.; Dollár, P.; Girshick, R.; He, K.; Hariharan, B.; Belongie, S. Feature Pyramid Networks for Object Detection. In Proceedings of the IEEE Conference on Computer Vision and Pattern Recognition, Honolulu, HI, USA, 21–26 July 2017. [Google Scholar]
  18. O’Shea, K.; Nash, R. An Introduction to Convolutional Neural Networks. arXiv 2015, arXiv:1511.08458. [Google Scholar]
  19. Ronneberger, O.; Fischer, P.; Brox, T. U-Net: Convolutional Networks for Biomedical Image Segmentation. In Medical Image Computing and Computer-Assisted Intervention–MICCAI 2015: 18th International Conference, Munich, Germany, October 5–9, 2015, Proceedings, Part III 18; Springer International Publishing: Chem, Switzerland, 2015. [Google Scholar]
  20. Zhao, H.; Shi, J.; Qi, X.; Wang, X.; Jia, J. Pyramid Scene Parsing Network. In Proceedings of the IEEE Conference on Computer Vision and Pattern Recognition, Honolulu, HI, USA, 21–26 July 2017. [Google Scholar]
  21. Chen, L.-C.; Zhu, Y.; Papandreou, G.; Schroff, F.; Adam, H. Encoder-Decoder with Atrous Separable Convolution for Semantic Image Segmentation. In Computer Vision—ECCV 2018; Ferrari, V., Hebert, M., Sminchisescu, C., Weiss, Y., Eds.; Lecture Notes in Computer Science; Springer International Publishing: Cham, Switzerland, 2018; Volume 11211, pp. 833–851. ISBN 978-3-030-01233-5. [Google Scholar]
  22. Chen, H.; Qin, Y.; Liu, X.; Wang, H.; Zhao, J. An Improved DeepLabv3+ Lightweight Network for Remote-Sensing Image Semantic Segmentation. Complex Intell. Syst. 2023, 10, 2839–2849. [Google Scholar] [CrossRef]
  23. SPANet: Successive Pooling Attention Network for Semantic Segmentation of Remote Sensing Images. Available online: https://ieeexplore.ieee.org/document/9775559 (accessed on 11 September 2024).
  24. Liu, Y.; Shao, Z.; Teng, Y.; Hoffmann, N. NAM: Normalization-Based Attention Module. arXiv 2021, arXiv:2111.12419. [Google Scholar]
  25. Zhang, C.; Xing, J.; Li, J.; Du, S.; Qin, Q. A New Method for the Extraction of Tailing Ponds from Very High-Resolution Remotely Sensed Images: PSVED. Int. J. Digit. Earth 2023, 16, 2681–2703. [Google Scholar] [CrossRef]
  26. Yu, H.; Yang, Z.; Tan, L.; Wang, Y.; Sun, W.; Sun, M.; Tang, Y. Methods and Datasets on Semantic Segmentation: A Review. Neurocomputing 2018, 304, 82–103. [Google Scholar] [CrossRef]
  27. Zhao, Q.; Liu, J.; Li, Y.; Zhang, H. Semantic Segmentation With Attention Mechanism for Remote Sensing Images. IEEE Trans. Geosci. Remote Sens. 2022, 60, 1–13. [Google Scholar] [CrossRef]
  28. Hu, J.; Shen, L.; Albanie, S.; Sun, G.; Wu, E. Squeeze-and-Excitation Networks. In Proceedings of the IEEE Conference on Computer Vision and Pattern Recognition, Long Beach, CA, USA, 15–20 June 2019. [Google Scholar]
  29. Zhang, H.; Wu, C.; Zhang, Z.; Zhu, Y.; Lin, H.; Zhang, Z.; Sun, Y.; He, T.; Mueller, J.; Manmatha, R.; et al. ResNeSt: Split-Attention Networks. In Proceedings of the 2022 IEEE/CVF Conference on Computer Vision and Pattern Recognition Workshops (CVPRW), New Orleans, LA, USA, 19–20 June 2022; IEEE: Piscataway, NJ, USA, 2022; pp. 2735–2745. [Google Scholar]
  30. He, K.; Zhang, X.; Ren, S.; Sun, J. Deep Residual Learning for Image Recognition. In Proceedings of the IEEE Conference on Computer Vision and Pattern Recognition, Boston, MA, USA, 7–12 June 2015. [Google Scholar]
  31. Chen, T.; Liu, H.; Ma, Z.; Shen, Q.; Cao, X.; Wang, Y. End-to-End Learnt Image Compression via Non-Local Attention Optimization and Improved Context Modeling. IEEE Trans. Image Process. 2021, 30, 3179–3191. [Google Scholar] [CrossRef]
  32. Dong, K.; Zhou, C.; Ruan, Y.; Li, Y. MobileNetV2 Model for Image Classification. In Proceedings of the 2020 2nd International Conference on Information Technology and Computer Application (ITCA), Guangzhou, China, 18–20 December 2020; IEEE: Piscataway, NJ, USA, 2020; pp. 476–480. [Google Scholar]
  33. Dlamini, S.; Kuo, C.-F.J.; Chao, S.-M. Developing a Surface Mount Technology Defect Detection System for Mounted Devices on Printed Circuit Boards Using a MobileNetV2 with Feature Pyramid Network. Eng. Appl. Artif. Intell. 2023, 121, 105875. [Google Scholar] [CrossRef]
  34. He, K.; Zhang, X.; Ren, S.; Sun, J. Spatial Pyramid Pooling in Deep Convolutional Networks for Visual Recognition. IEEE Trans. Pattern Anal. Mach. Intell. 2014, 8691, 346–361. [Google Scholar]
  35. Sun, X.; Zhang, Y.; Chen, C.; Xie, S.; Dong, J. High-Order Paired-ASPP for Deep Semantic Segmentation Networks. Inf. Sci. 2023, 646, 119364. [Google Scholar] [CrossRef]
  36. Zhou, S.; Nie, D.; Adeli, E.; Yin, J.; Lian, J.; Shen, D. High-Resolution Encoder–Decoder Networks for Low-Contrast Medical Image Segmentation. IEEE Trans. Image Process. 2019, 29, 461–475. [Google Scholar] [CrossRef]
  37. Li, X.; Lv, C.; Wang, W.; Li, G.; Yang, L.; Yang, J. Generalized Focal Loss: Towards Efficient Representation Learning for Dense Object Detection. IEEE Trans. Pattern Anal. Mach. Intell. 2022, 45, 3139–3153. [Google Scholar] [CrossRef] [PubMed]
  38. Garcia-Garcia, A.; Orts-Escolano, S.; Oprea, S.; Villena-Martinez, V.; Garcia-Rodriguez, J. A Review on Deep Learning Techniques Applied to Semantic Segmentation. arXiv 2017, arXiv:1704.06857. [Google Scholar]
  39. Li, M.; Wu, P.; Wang, B.; Park, H.; Yang, H.; Wu, Y. A Deep Learning Method of Water Body Extraction From High Resolution Remote Sensing Images With Multisensors. IEEE J. Sel. Top. Appl. Earth Obs. Remote Sens. 2021, 14, 3120–3132. [Google Scholar] [CrossRef]
  40. Huang, L.; Chen, Y.; He, X. Spectral–Spatial Masked Transformer With Supervised and Contrastive Learning for Hyperspectral Image Classification. IEEE Trans. Geosci. REMOTE Sens. 2023, 61, 1–18. [Google Scholar] [CrossRef]
  41. Zheng, Z.; Zhang, X.; Xiao, P.; Li, Z. Integrating Gate and Attention Modules for High-Resolution Image Semantic Segmentation. IEEE J. Sel. Top. Appl. Earth Obs. Remote Sens. 2021, 14, 4530–4546. [Google Scholar] [CrossRef]
  42. Hong, D.; Gao, L.; Yokoya, N.; Yao, J.; Chanussot, J.; Du, Q.; Zhang, B. More Diverse Means Better: Multimodal Deep Learning Meets Remote-Sensing Imagery Classification. IEEE Trans. Geosci. Remote Sens. 2020, 59, 4340–4354. [Google Scholar] [CrossRef]
  43. Ren, H.; Zhao, Y.; Xiao, W.; Hu, Z. A Review of UAV Monitoring in Mining Areas: Current Status and Future Perspectives. Int. J. Coal Sci. Technol. 2019, 6, 320–333. [Google Scholar] [CrossRef]
  44. Wang, K.; Zhang, Z.; Yang, X.; Wang, D.; Zhu, L.; Yuan, S. Enhanced Tailings Dam Beach Line Indicator Observation and Stability Numerical Analysis: An Approach Integrating UAV Photogrammetry and CNNs. Remote Sens. 2024, 16, 3264. [Google Scholar] [CrossRef]
Figure 1. Overall architecture of the RST-DeepLabv3+ model. We incorporated a multi-attention module into DeepLabv3+ to dynamically reallocate weights across different channels.
Remotesensing 17 00411 g001
Figure 2. Architecture of the Squeeze-and-Excitation (SE) block. The SE module introduces a novel architectural unit that performs feature recalibration by explicitly modeling channel-wise relationships. This process consists of two main operations: squeeze-and-excitation.
Remotesensing 17 00411 g002
Figure 3. Architecture of the split-attention networks.
Remotesensing 17 00411 g003
Figure 4. Geographical location of Lingwu City, Shizuishan City, Ningxia Province, China. (a) Sentinel-2 satellite image of Shizuishan City. (b) Sentinel II satellite image of Lingwu city.
Remotesensing 17 00411 g004
Figure 5. Example of semantic segmentation datasets for tailings ponds.
Remotesensing 17 00411 g005
Figure 6. Visualization results of ablation experiments on the NX-TPSet semantic segmentation dataset. (a) is listed as original image, (b) is listed as ground truth, (c) is listed as DeepLabv3+, (d) is listed as DeepLabv3++SENet, (e) is listed as DeepLabv3++ResNest, and (f) is listed as RST-DeepLabv3+. Orange rectangles are missed areas, and red rectangles are error areas.
Remotesensing 17 00411 g006
Figure 7. Visualization results of ablation experiments on the TPSet semantic segmentation dataset. (a) is listed as the original image, (b) is listed as ground truth, (c) is listed as DeepLabv3+, (d) is listed as DeepLabv3++SENet, (e) is listed as DeepLabv3++ResNest, and (f) is listed as RST-DeepLabv3+. Orange rectangles are missed areas and red rectangles are error areas.
Remotesensing 17 00411 g007
Figure 8. Comparison of experimental results on the NX-TPSet semantic segmentation datasets. (a) is listed as the original image, (b) is listed as ground truth, (c) is listed as PSP-Net, (d) is listed as U-Net, (e) is listed as DeepLabv3+, and (f) is listed as RST-DeepLabv3+. Orange rectangles are missed areas; red rectangles are error areas.
Remotesensing 17 00411 g008
Figure 9. Comparison of experimental results on the TPSet semantic segmentation datasets. (a) is listed as the original image, (b) is listed as ground truth, (c) is listed as PSP-Net, (d) is listed as U-Net, (e) is listed as DeepLabv3+, and (f) is listed as RST-DeepLabv3+. Orange rectangles are missed areas; red rectangles are error areas.
Remotesensing 17 00411 g009
Table 1. The number of tailings pond pixels and their proportion in the total image pixels in the statistical dataset.
DatasetObject Pixels Ratio
NX-TPSet
Object Pixels (Proportion)
TPSet
Object Pixels (Proportion)
Training30,032,627 (5.03%)15,196,644 (4.17%)
Validation10,006,875 (1.68%)1,899,580 (0.52%)
Test10,014,485 (1.68%)1,904,352 (0.52%)
Total50,054,379 (8.38%)18,995,806 (5.22%)
Table 2. Results of RST-DeepLabv3+ ablation experiments on the NX-TPSet dataset.
Methods NX-TPSet
Precision (%)Recall (%)F1_Score (%)IoU (%)mPA (%)
DeepLabv3+92.9091.0991.9985.1695.29
DeepLabv3+ with SENet93.6090.7592.1585.4595.15
DeepLabv3+with ResNeSt93.1991.6492.4185.8995.57
RST-DeepLabv3+93.992.292.8486.3595.55
Table 3. Results of RST-DeepLabv3+ ablation experiments on the TPSet dataset.
MethodsTPSet
Precision (%)Recall (%)F1_Score (%)IoU (%)mPA (%)
DeepLabv3+92.4390.8591.5484.8795.46
DeepLabv3+ with SENet93.7890.6992.3185.3195.23
DeepLabv3+with ResNeSt93.2491.5592.6285.6695.75
RST-DeepLabv3+93.7992.3792.9386.2995.61
Table 4. Comparison of RST-DeepLabv3+ on the NX-TPSet dataset.
Methods NX-TPSet
Precision (%)Recall (%)F1_Score (%)IoU (%)mPA (%)
U-Net91.9690.5991.7784.895.5
PSP-Net90.7389.7590.7883.1594.37
DeepLabv3+92.991.0991.9985.1695.29
RST-DeepLabv3+93.992.292.8486.3595.55
Table 5. Comparison results of the experiments on the TPSet dataset.
MethodsTPSet
Precision (%)Recall (%)F1_Score (%)IoU (%)mPA (%)
U-Net91.4890.1891.4984.7695.28
PSP-Net90.5889.6590.7883.5794.29
DeepLabv3+92.4390.8591.5484.8795.46
RST-DeepLabv3+93.7992.3792.9386.2995.61
Disclaimer/Publisher’s Note: The statements, opinions and data contained in all publications are solely those of the individual author(s) and contributor(s) and not of MDPI and/or the editor(s). MDPI and/or the editor(s) disclaim responsibility for any injury to people or property resulting from any ideas, methods, instructions or products referred to in the content.

