1. Introduction
A fast-moving coronal mass ejection (CME), observed leaving the Sun on 9 October 2024, triggered a geomagnetic storm that began at 15:22 UT on 10 October. This storm ranks among the most intense since the Halloween storms of 2003, alongside the event on 10 May 2024. A recent study has identified a direct connection between this storm and the orbital decay of Starlink satellites [
1]. Notably, the sharp altitude drop of the Starlink-1089 (SL1089) satellite coincided with the onset of the storm’s main phase. Although SL1089 was initially scheduled for reentry on 22 October, it reentered 10 days earlier, on 12 October. Aurora was visible in several northern mid-latitude regions, including New York, England, France, and Daqing in Heilongjiang Province, China—an event considered rare for these locations (
https://www.space.com/spectacular-auroras-photos-thrill-skywatchers-from-geomagnetic-storm-october-2024, accessed on 11 October 2024,
http://en.people.cn/n3/2024/1011/c90000-20228406.html, accessed on 11 October 2024). This indicates that the immense energy of the solar wind directly affected mid- to high-latitude regions during the event, further highlighting the significant importance of conducting in-depth research on this phenomenon.
Field-aligned currents (FACs) serve as the primary mechanism for transferring energy and momentum between the magnetosphere and ionosphere. Polar electrojets (PEJs) flow transversely to the ionospheric electric and magnetic fields in the E region and can significantly impact electrical infrastructure by generating geomagnetically induced currents on the ground [
2]. Consequently, comprehending storm-time FACs and PEJs is essential for understanding the complex interactions that drive space weather and its terrestrial effects. Additionally, since the latitudes of FACs and PEJs can indicate auroral locations, this study could provide observational evidence for the occurrence of auroras at mid-latitudes.
Previous studies have investigated the latitudinal evolution of FACs during storms. For example, Fujii et al. (1992) [
3] documented dynamic variations in FACs during the 13–14 March 1989 storm, noting that the latitudinal extent of the FAC region expanded, particularly in the evening sector. Anderson et al. (2002) [
4] used Active Magnetosphere and Planetary Electrodynamics Response Experiment (AMPERE) data to analyze variations in FAC intensity and the poleward retreat speed during two geomagnetic storm recovery phases. They found that during storms with rapid recovery, the FAC intensity returned to pre-storm levels in one hour, together with a swift poleward retreat. By contrast, storms with a gradual recovery exhibited slower poleward movement and sustained strong FACs.
Several studies have explored the relationship between storm-time FACs, PEJs, interplanetary magnetic field (IMF), and geomagnetic indices. However, there are still challenges in predicting the density and latitudinal evolution of FACs and PEJs during geomagnetic storms. Wang et al. (2006) [
5] analyzed FACs using Challenging Minisatellite Payload (CHAMP) satellite data during the strong geomagnetic storms of October and November 2003, finding a strong correlation between the strength of dayside FACs and Pd, with the equatorward shift in dayside FACs mainly influenced by southward IMF Bz. Meanwhile, the latitudinal variations in nightside FACs were more strongly associated with Disturbance storm time (Dst). Wang et al. (2008) [
6] studied storm-time PEJ characteristics using CHAMP data and Space Weather Modeling Framework (SWMF) simulations during the 31 March 2001 storm, with a minimum Dst of −387 nT. They concluded that the equatorward shift in PEJs during the daytime was driven by the southward IMF, while the nighttime variations were more closely linked to Dst. Le et al. (2016) [
7] reported a significant intensification of daytime FACs and their equatorward movement to approximately 60° magnetic latitude (MLat) after a prolonged southward IMF, as observed by AMPERE. Pedersen et al. (2022) [
8] analyzed 28 storms (Dst ≤ −50 nT) from high-speed streams (2010–2017), finding a strong correlation between integrated FACs, equivalent currents, and Akasofu parameters, with stronger currents observed during high-pressure events. In a subsequent study, Pedersen et al. (2023) [
9] examined 45 storms driven by interplanetary CMEs, noting that currents peaked about an hour after storm onset, with high-pressure events seeing earlier and stronger current peaks. These previous studies did not consider the entire local time sectors and did not conduct quantitative correlation analyses with various external parameters. Therefore, they only qualitatively identify external factors that are strongly correlated with FACs or PEJs without specifying which external factor has the best correlation. More recently, Wang et al. (2024) [
10] studied the relationship between peak current densities, latitudes, solar wind IMF parameters, and Dst during the May 2024 geomagnetic storm. They found that the dawnside and duskside FACs most strongly correlated with Dst or Pd, while dayside (nightside) FACs in both hemispheres were primarily linked to Pd (Em or Pd). The PEJs showed a strong correlation with Dst across most local time sectors, and current latitudes were most strongly related to Dst or Pd. Storm-time FACs and PEJs may not follow a uniform pattern, and they vary depending on the specific geomagnetic storm event, thus requiring further investigation. Since the external parameters during the May and October magnetic storms changed differently over time, it is unclear whether the dominant external factors were the same or different. Further investigation is required to clarify this.
Some studies have explored dawn–dusk asymmetries in FAC density and latitude. Anderson et al. (2005) [
11] found that the IMF By component and partial ring current contributed to stronger currents on the duskside, causing them to expand equatorward when compared to the dawnside. By contrast, Lukianova et al. (2020) [
12] showed that the dawn–dusk asymmetry manifested as an enhanced region 2 (R2) FAC density on the duskside, with minimal differences in the equatorward shift in FACs between the two hemispheres during the September 2017 storm. Wang et al. (2024) [
10] investigated the May 2024 geomagnetic storm and found that in the Northern Hemisphere, maximum FACs and PEJs occurred at dawn, while in the Southern Hemisphere, these phenomena were more prominent at dusk. Additionally, duskside currents were observed at lower latitudes than dawnside currents. Therefore, the contradictory issue of dawn–dusk asymmetry needs to be further investigated by examining more geomagnetic storm events. Wang et al. (2024) [
10] found that current strengths in the Northern Hemisphere during summer were larger than in the Southern Hemisphere during winter, with northern currents located more poleward than their southern counterparts. These hemispheric differences are believed to stem from seasonal variations in ionospheric conductivity, although further research is required to confirm this hypothesis.
This study further investigated the temporal and spatial variations in FACs and PEJs during the geomagnetic storms of 10–12 October 2024. The three Swarm satellites, positioned in dawn–dusk and daytime–nighttime sectors, offer an optimal configuration for examining local time asymmetries in relation to external factors. Wang et al. (2024) [
10] first conducted a quantitative study on the correlation between auroral currents and external parameters during geomagnetic storms, and this paper extends their research. The novelty behind this study is as follows: FACs and PEJs during storms may not follow a uniform pattern but instead vary depending on the specific geomagnetic storm event. Moreover, during the geomagnetic storms in May and October, the variation patterns of solar wind external parameters over time were different. For example, during the May event, Pd increased throughout the main and recovery phases of the storm, whereas during the October event, Pd only increased during the main phase. Therefore, it remains unclear whether the dominant external factors that correlate best with the observed phenomena are the same or different, and this study aims to clarify this issue. Although the Swarm satellites were located in similar local time sectors as during the May 2024 storm, the October storm occurred when the two hemispheres were in opposite seasons. This unique timing provides an opportunity to explore whether hemispheric differences in FAC and PEJ behavior are linked to seasonal variations in ionospheric conductivity or to hemispheric differences in geomagnetic field configuration. Finally, the differences in the density and location of the dawn and dusk auroral currents also require further verification through additional super geomagnetic storm events. Thus, this study presents a valuable opportunity to further investigate the local time and hemispheric asymmetries of FACs and PEJs in response to severe geomagnetic storms.
The remainder of this paper is organized as follows:
Section 2 outlines the instrumentation and data processing methods used in this study. The analysis of the observations for the event is presented in
Section 3.
Section 4 discusses the results, and
Section 5 provides the conclusions.
2. Methods
The European Space Agency Swarm satellites operate in near-polar orbits with inclination angles of about 87.5°. They orbit at altitudes of around 500 km, completing each orbit in roughly 93 min. The orbital constellation for the first mission phase was finalized on 17 April 2014. Swarms A and C fly in close formation with a 1.4° longitudinal separation at approximately 450 km altitude. Swarm B maintains an altitude of around 510 km.
FACs are obtained from vector magnetic field measurements from Swarms A and C using Ampère’s integral law:
where the integral is calculated around a closed loop enclosing the measurement quadrilateral defined by the orbit tracks of Swarms A and C (e.g., please refer to Lühr et al., 2020 [
13] for more details of the inversion method).
B, the disturbance magnetic field in the horizontal plane, is derived by subtracting the CHAOS-6 magnetic field model;
dl is the line element along the integration path;
A is the closed quadrilateral area;
i is the inclination angle; and
is the vacuum permeability.
For Swarm B, FACs are computed using the following formula:
where
is the disturbance magnetic eastward component parallel to the current sheet, and
is the velocity perpendicular to the current sheet in the mean-field-aligned system [
14]. The large-scale FACs from Swarms A/C and B are low-pass-filtered for 20 s to suppress small-scale FAC structures smaller than 150 km [
13]. Thus, the variation in small-scale FACs (below 150 km) is not within the scope of this study. Positive (negative) FACs represent currents flowing out of (into) the ionosphere. FACs with absolute values less than 50 µA/m
2 were considered in the present work to exclude outliers.
PEJs were calculated from the scalar magnetic field observed by Swarms A and B by using the line current method [
15,
16,
17]. This method approximates auroral PEJs as infinite line current elements in the E region (at about 115 km altitude), separated from each other by 1°. The residuals of the total field were inverted using the least-squares fitting approach to determine every line current density (please refer to [
15] for more details of the inversion method). Here, positive (negative) values indicate eastward (westward) currents. To ensure reliable results, the absolute PEJ density should be between 0.03 and 3 A/m. In this work, we used apex latitudes for FACs and quasi-dipole MLat for PEJs [
18].
3. Results
Throughout the storm period of 10–12 October 2024, Swarm orbits primarily remained within the same local time sector in the Sun–Earth reference frame. Specifically, Swarm A and C satellites were positioned near the dawn–dusk meridian (~6 and ~18 MLT), while Swarm B was located in the daytime–nighttime sector (~10 and ~22 MLT). This orbital configuration provided a unique opportunity to investigate the relationship between large-scale FACs and PEJs and solar wind IMF parameters for four local time sectors, including day, night, dawn, and dusk. Furthermore, the interhemispheric comparison allowed for the exploration of hemispheric/seasonal asymmetries.
The hourly mean solar wind/IMF parameters and Dst variations from 10 to 12 October 2024 are illustrated in
Figure 1. The event analyzed was triggered by a CME observed in the solar wind. The solar wind speed (Vsw) was greater than the background (
Figure 1d). The solar wind mass density (Nsw) and dynamic pressure (Pd,
Figure 1c,e) showed pronounced variations, which were typical CME characteristics. The IMF By component underwent a sign change shortly before the Bz component reached its minimum, which was consistent with the passage of the CME-related flux rope (
Figure 1a,b). The sudden storm commencement occurred around 15 UT on 10 October (see the black vertical dashed line) due to a jump in Pd (
Figure 1e). Dst attained its minimum of about −341 nT around 25 storm-time (see the blue vertical dashed line) before slowing and returning to −50 nT on 12 October (
Figure 1g). During the storm’s main phase, IMF Bz remained predominantly southward and reached a minimum value of approximately −41 nT at 24 storm-time (
Figure 1b). Pd attained two peaks, 30 and 25 nPa, around 16.5 and 21 storm-time within the storm’s main phase (
Figure 1e). One can notice that Pd and Nsw reached two peaks simultaneously; however, Vsw changed more gradually. The second peak in Pd was lower than the first, while for Nsw, the second peak was comparable to the first. As a result, we attribute the Pd surge to the combined contributions of both Nsw and Vsw. It is also worth noting that Em reached several peaks throughout the storm’s main and recovery periods (
Figure 1f).
Peak upward and downward FACs were selected out for each satellite’s orbit crossing the auroral region during the magnetic storm. The storm-time variation in peak FAC density and latitude together with the Dst index are shown in
Figure 2. The circle size indicates FAC densities, with red (blue) depicting upward (downward) currents flowing out of (into) the ionosphere. The maximum upward and downward FAC densities throughout the storm periods are marked by red and blue dots. The most equatorward latitudes of upward and downward FACs are highlighted in brown and green. The left and right panels represent the Northern and Southern Hemispheres, respectively.
Compared to the quiet period before 15 UT on 10 October 2024, the FAC density increased significantly during the magnetic storm, as bracketed by gray vertical dashed lines. The maximum values of upward (red dots) and downward (blue dots) FACs generally appeared during the main phase of the storm. For example, the peak values of upward and downward FACs (red and blue dots) on the dawnside, duskside, and dayside of both hemispheres all occurred during the main phase of the geomagnetic storm, with the peaks in the Southern Hemisphere generally occurring earlier than in the Northern Hemisphere (except for the upward FACs on the dawnside and the FACs on the dayside, where the peaks in the Northern Hemisphere occurred earlier than in the Southern Hemisphere). The timing of peak upward and downward FACs also varied (except on the duskside and dayside of the Northern Hemisphere). During the nighttime, FACs mostly reached their peaks during the recovery phase of the storm (except for the upward FACs in the Southern Hemisphere). Thus, the timing when FACs attained peaks varied across local times and between two hemispheres.
As the storm progressed, FACs initially shifted toward lower latitudes, and as the storm entered the recovery phase, they returned to higher latitudes. It is evident that the time when FACs reached their lowest latitude did not necessarily coincide with the minimum Dst value but rather occurred either during the main or recovery phase of the storm. For instance, on the dawnside and dusksides of both hemispheres, the lowest latitudes of upward and downward FACs (marked in brown and green, respectively) occurred during the main phase of the geomagnetic storm. On the dayside and nightside, the currents in the Northern Hemisphere appeared during the main phase (except for the downward FACs on the dayside, which occurred during the recovery phase), while in the Southern Hemisphere, the currents primarily occurred during the recovery phase (except for the downward FACs during the nighttime, which occurred during the main phase). Thus, the timing of FACs reaching the lowest latitude differed across local times and between the hemispheres. In summary, the variations in FAC density and latitude differed across local times and hemispheres, suggesting that the relevant highly correlated external factors may vary with local times and hemispheres.
We calculated the average FAC density and latitude during the 12–48 storm-time period at various locations, with the results shown in
Table 1. The 12–48 storm-time was chosen as it captures the period of intense FACs while minimizing influences of quiet-time conditions, as bracketed by two gray vertical dashed lines (see
Figure 2 and
Figure 3). For the dawn–dusk sector, we distinguished between R1 and R2 currents, while on the dayside and nightside, we differentiated between peak upward and downward FACs due to the presence of multiple current sheets.
In the study by Iijima and Potemra (1978) [
19], it was reported that under relatively quiet conditions (AL > −100 nT), the highest FAC densities occur near noon, with an average value of about 1.6 µA/m
2. During more active periods (AL ≤ −100 nT), the peak current density regions shift toward the nightside, with the average current density increasing to approximately 2.2 µA/m
2. The total average current strength (integrated FACs over the auroral region) is approximately 2.7 × 10
6 A during quiet periods and around 5.2 × 10
6 A during disturbed periods.
Notably, the present study focused specifically on FAC density rather than total current strength. Additionally, we calculated the average FAC density during the 12–48-h storm period (rather than the maximum value), as shown in
Table 1. For example, the maximum upward FAC densities observed during the storm could reach 8.72 µA/m
2 (6.62 µA/m
2) at dusk in the Southern (Northern) Hemisphere. The storm-time peak FAC densities were stronger than those reported by Iijima and Potemra (1978) [
19], likely due to the occurrence of superstorm events.
As shown in
Table 1, both R1 and R2 FAC densities at dawn were generally higher than those at dusk, except for northern R1 FACs. The upward FACs in the nighttime exceeded those at daytime, whereas the downward FACs on the dayside were greater than those on the nightside. In general, the FACs in the Southern Hemisphere were stronger than those in the Northern Hemisphere, except for the downward FACs on the nightside. Additionally, R1 and R2 FACs at dusk were shown at lower latitudes when compared to those at dawn. Nightside FACs were found at lower latitudes than dayside FACs. In the Southern Hemisphere, R1, R2, and downward FACs were positioned more poleward than those in the Northern Hemisphere, except for upward FACs.
Figure 3 illustrates the storm-time and latitudinal evolution of peak PEJs in the auroral oval in four local time sectors. Swarms A and C fly in close formation with a 1.4° longitudinal separation; thus, Swarm C’s results are similar to those of Swarm A and, thus, are not repeated. Around dusk, the PEJ current flows eastward, while in the rest of the local times, they are predominantly westward. The size of the circles reflects the strength of PEJs, with red circles representing eastward currents and blue circles indicating westward currents. The maximum current during the storm is marked by dots, where brown and green dots denote the lowest latitudes of eastward and westward PEJ currents, respectively.
The maximum PEJs on the dawnside–duskside primarily occurred during the storm’s main phase, whereas on the dayside and nightside, they mainly occurred during the recovery phase, except for the northern dayside. The latitude at which PEJs reached their lowest position does not coincide with the minimum Dst value. Consequently, PEJs showed variations in both local time and hemisphere as the storm progressed, suggesting that the optimal external parameters influencing PEJs may differ across local times and hemispheres.
We also calculated the average PEJ density and latitude during the 12–48 storm-time period, as listed in
Table 2. In both hemispheres, PEJs were higher on the dawnside compared to the duskside. The daytime PEJs were comparable to the northern nighttime PEJs, but the daytime PEJs were larger than the southern nighttime PEJs. Specifically, the southern PEJs were higher in the dusk and daytime than the northern PEJs, while on the dawnside and nightside, the northern PEJs were higher than the southern PEJs. PEJs at dusk appeared at lower latitudes when compared to those at dawn. At night, PEJs occurred at lower latitudes than PEJs in the daytime. The northern PEJs were found at lower latitudes compared to the southern PEJs, with the exception of the daytime.
4. Discussion
This study investigated the variations in FACs and PEJs during the intense geomagnetic storm of 10–12 October 2024 separately in four local time sectors (dawn/dusk, day/night) and in two hemispheres. The Swarm orbital local time during this geomagnetic storm was similar to those during the May 2024 geomagnetic storm. This provides an opportunity to further investigate the not-well-understood issue of the dawn–dusk asymmetry of FACs and PEJs. Moreover, in October (May), the northern auroral region is in winter (summer) while the southern auroral region is in summer (winter). This seasonal contrast allows for an investigation into whether the observed hemispheric asymmetries in FACs and PEJs are mainly linked to the different seasonal conditions in each hemisphere.
4.1. Correlation Analysis
Figure 2 and
Figure 3 show that the timing of the maximum FACs and PEJs, as well as the moment they reached the lowest latitude, exhibited differences in the four local times and two hemispheres. This suggests that the external parameters most influencing FACs and PEJs vary by local time and hemisphere. As outlined in the Introduction section, previous studies have shown that factors such as Em, Pd, IMF By, Bz, and Dst can affect the density and latitude of polar currents during storm periods. Therefore, we performed a Spearman rank correlation analysis between the peak FAC densities/latitudes and external solar wind parameters and geomagnetic indices. The
p-value in the context of Spearman’s rank correlation helps assess whether the correlation is likely to be real or if it might be due to random chance. A smaller
p-value generally below 0.05 (a commonly accepted significance level in the field of study) generally indicates stronger evidence for a true relationship. There were 62 events, respectively, in the dusk and dawn sectors of the Northern and Southern Hemispheres, while there were 61 events in the daytime and nighttime sectors of the two hemispheres.
With the exception of IMF By, the
p-values for the other IMF and geomagnetic parameters were generally below 0.05, indicating relatively significant non-zero correlations. The reason for the weak By correlation is that geomagnetic storms are mainly driven by southward IMF Bz, which can drive rapid and large-scale reconnection between the IMF and the Earth’s magnetic field, resulting in significant auroral currents. During geomagnetic quiet periods, the influence of IMF By becomes more prominent [
20,
21]. The effects of the solar wind mass density and velocity are considered separately, which both contribute to Pd. Averages of the external parameters were taken within 10–20 min before Swarm detections. The choice of 10–20-min averages was made to accommodate the time delay from the bow shock to the ionosphere. Specifically, we used IMF data at the bow shock and computed the solar wind and IMF parameters by averaging the values over a 10 to 20 min interval prior to the observed FACs, in line with our previous work [
20,
21,
22]. Vennerstrøm et al. (2002) [
23] considered a typical delay of 15 min for the development of FACs, from the magnetopause to the ionospheric response. Laundal et al. (2018) [
24] averaged the solar wind and IMF parameters over the 20 min preceding the corresponding Swarm/CHAMP measurements. Holappa et al. (2023) [
25] employed 1 h averaged IMF components from 1981 to 2019 to investigate the effect of IMF Bx on the AL index. The averaging time window employed in the current study aligns well with these earlier works.
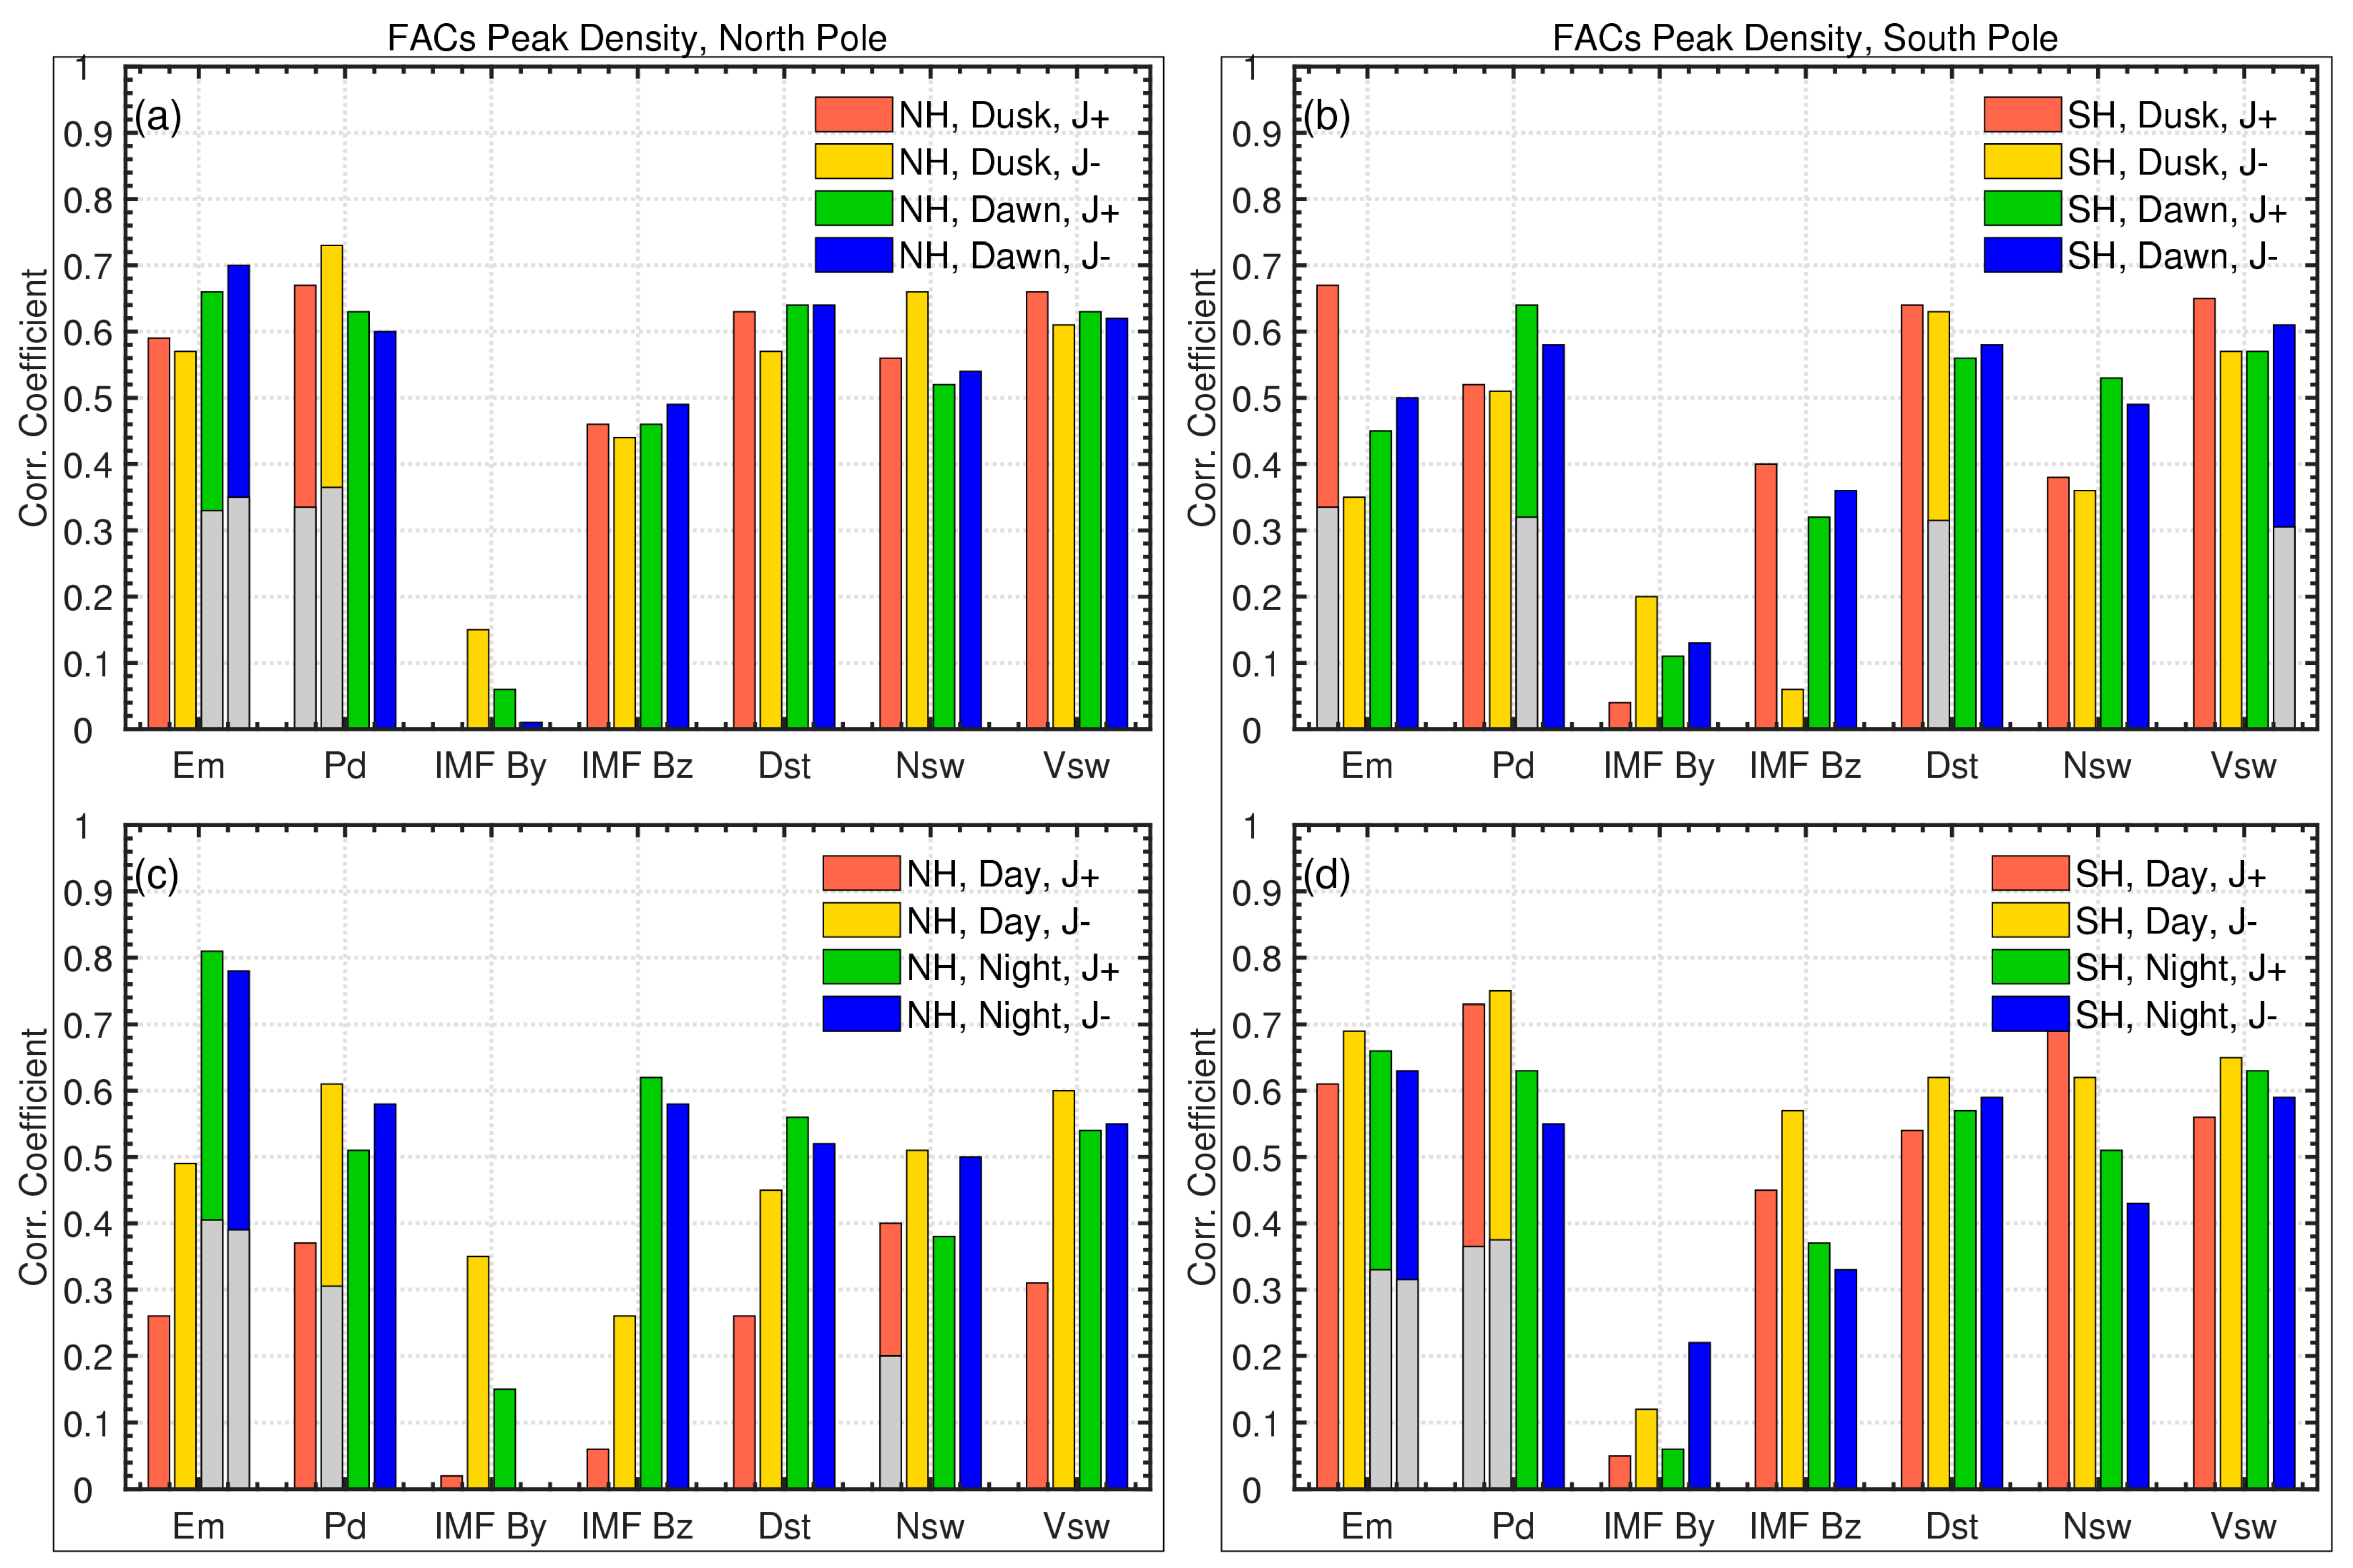
Figure 4 shows the correlation coefficients between the peak density of the upward and downward FACs and different external parameters, like the merging electric field, solar wind dynamic pressure, IMF By and Bz components, Dst index, and solar wind mass density and velocity. The left and right panels represent the Northern and Southern Hemispheres, respectively. The top panel corresponds to the dusk and dawn sectors, while the bottom panel corresponds to the daytime and nighttime sectors. Different colors represent different polarities of FACs (upward or downward) in different local times. The best correlation coefficient for each local time sector is specifically indicated in half gray bars.
As shown in
Figure 4, the correlation with IMF By is generally weak, suggesting that its influence on the local time and hemispherical differences in FAC peak density during geomagnetic storms is not significant. The correlation coefficients of Nsw and Vsw are both high, indicating that they play essential roles in the evolution of FACs during geomagnetic storms. For the northern duskside, Pd shows the best correlation with both upward and downward FAC peak density, while for the northern dawnside, Em shows the strongest correlation with FAC peak density. For the southern duskside, the upward FAC (R1 FACs) peak density has the strongest correlation with Em, while the downward FAC (R2 FACs) peak density is most strongly correlated with Dst. On the southern dawnside, Pd and Vsw show the best correlation with both upward and downward FAC peak density. On the dayside, Nsw and Pd (Pd) show the best correlation with FAC peak density in the Northern (Southern) Hemisphere, while on the nightside, Em shows the strongest correlation with FAC peak density.
Wang et al. (2005) [
14] studied the 2003 Halloween storm and found that the dayside FACs were primarily correlated with Pd. In a subsequent study, Wang et al. (2024) [
10] examined the May 2024 storm and discovered that most of the dayside (nightside) FACs exhibited stronger correlations with Pd (Em or Pd). Comparing this with previous studies, it can be seen that during the October 2024 storm, the dayside FAC peak density was correlated predominantly with Pd (Nsw), while the nightside FAC peak density was correlated with Em, which is consistent with these earlier findings. This also explains why the FAC peaks on the dayside occurred primarily during the main phase of the storm, as Pd reached its peak during this phase. Similarly, it explains why the FAC peaks on the nightside were mainly observed during the recovery phase, as Em remained at a high level throughout the recovery period. The comparison with the May storm and previous superstorms suggests that the intensity of the dayside FACs was correlated with Pd, and the nightside FACs were correlated mainly with Em or Pd during geomagnetic storms, which should be a relatively general rule during superstorm periods.
Wang et al. (2024) [
10] reported that dawnside FACs were most strongly correlated with Pd, while duskside FACs were most strongly correlated with Dst during the May 2024 storm. This seems to align with the present results in the south pole during this October storm but deviates from those in the north pole. In the October storm, Em correlates best with dawnside FACs in the north, while Pd correlates best with duskside FACs. In summary, the external correlation factors of FACs in the dawn and dusk sectors indeed vary from storm event to storm event.
The Spearman correlation coefficients between the latitudes of peak FACs and seven external parameters are presented in
Figure 5. It is evident that the latitudes of peak FACs on the dawnside–duskside show the strongest correlation with Em. In the Northern Hemisphere, the correlation with Em is most significant on the nightside, while on the dayside, the correlation with Pd is strongest. In the Southern Hemisphere, the latitudes of dayside upward FACs are most strongly correlated with Pd, while downward FACs on the dayside show the strongest correlation with IMF Bz. On the nightside, upward FACs are most strongly correlated with Dst, and downward FACs are most strongly correlated with Vsw.
Previous research showed that the equatorward extension of dayside FACs was primarily influenced by IMF Bz, while the latitudinal variation in nightside FACs was more closely related to Dst during the Halloween storm in 2003 [
5]. Note that Wang et al. (2006) [
5] did not distinguish FAC polarity. This finding largely aligns with our results for upward FACs on both the southern dayside and nightside. Wang et al. (2024) [
10] also found that the latitudes of peak FACs were most strongly correlated with Pd and Dst during the May 2024 storm, while the correlation with Em was not particularly dominant. However, during this October 2024 storm, Em is the main correlated factor for the MLat of FACs on the dawnside–duskside. On the dayside of the Northern Hemisphere, Pd is the dominant factor, while on the nightside, Em again plays the dominant role. The comparison with the May storm suggests that the dayside FAC MLat is primarily correlated with Pd, and the nightside FAC MLat is mainly correlated with Em or Pd during geomagnetic storms, which should be a relatively common result. However, it further suggests that the correlation factors of the position of dawnside–duskside FAC MLat vary depending on the specific geomagnetic storm event. In summary, during geomagnetic storms, the peak values and latitudes of FACs may be correlated with different factors depending on the local time and hemisphere, which also helps explain why the timing of their peaks and lowest latitudes differ.
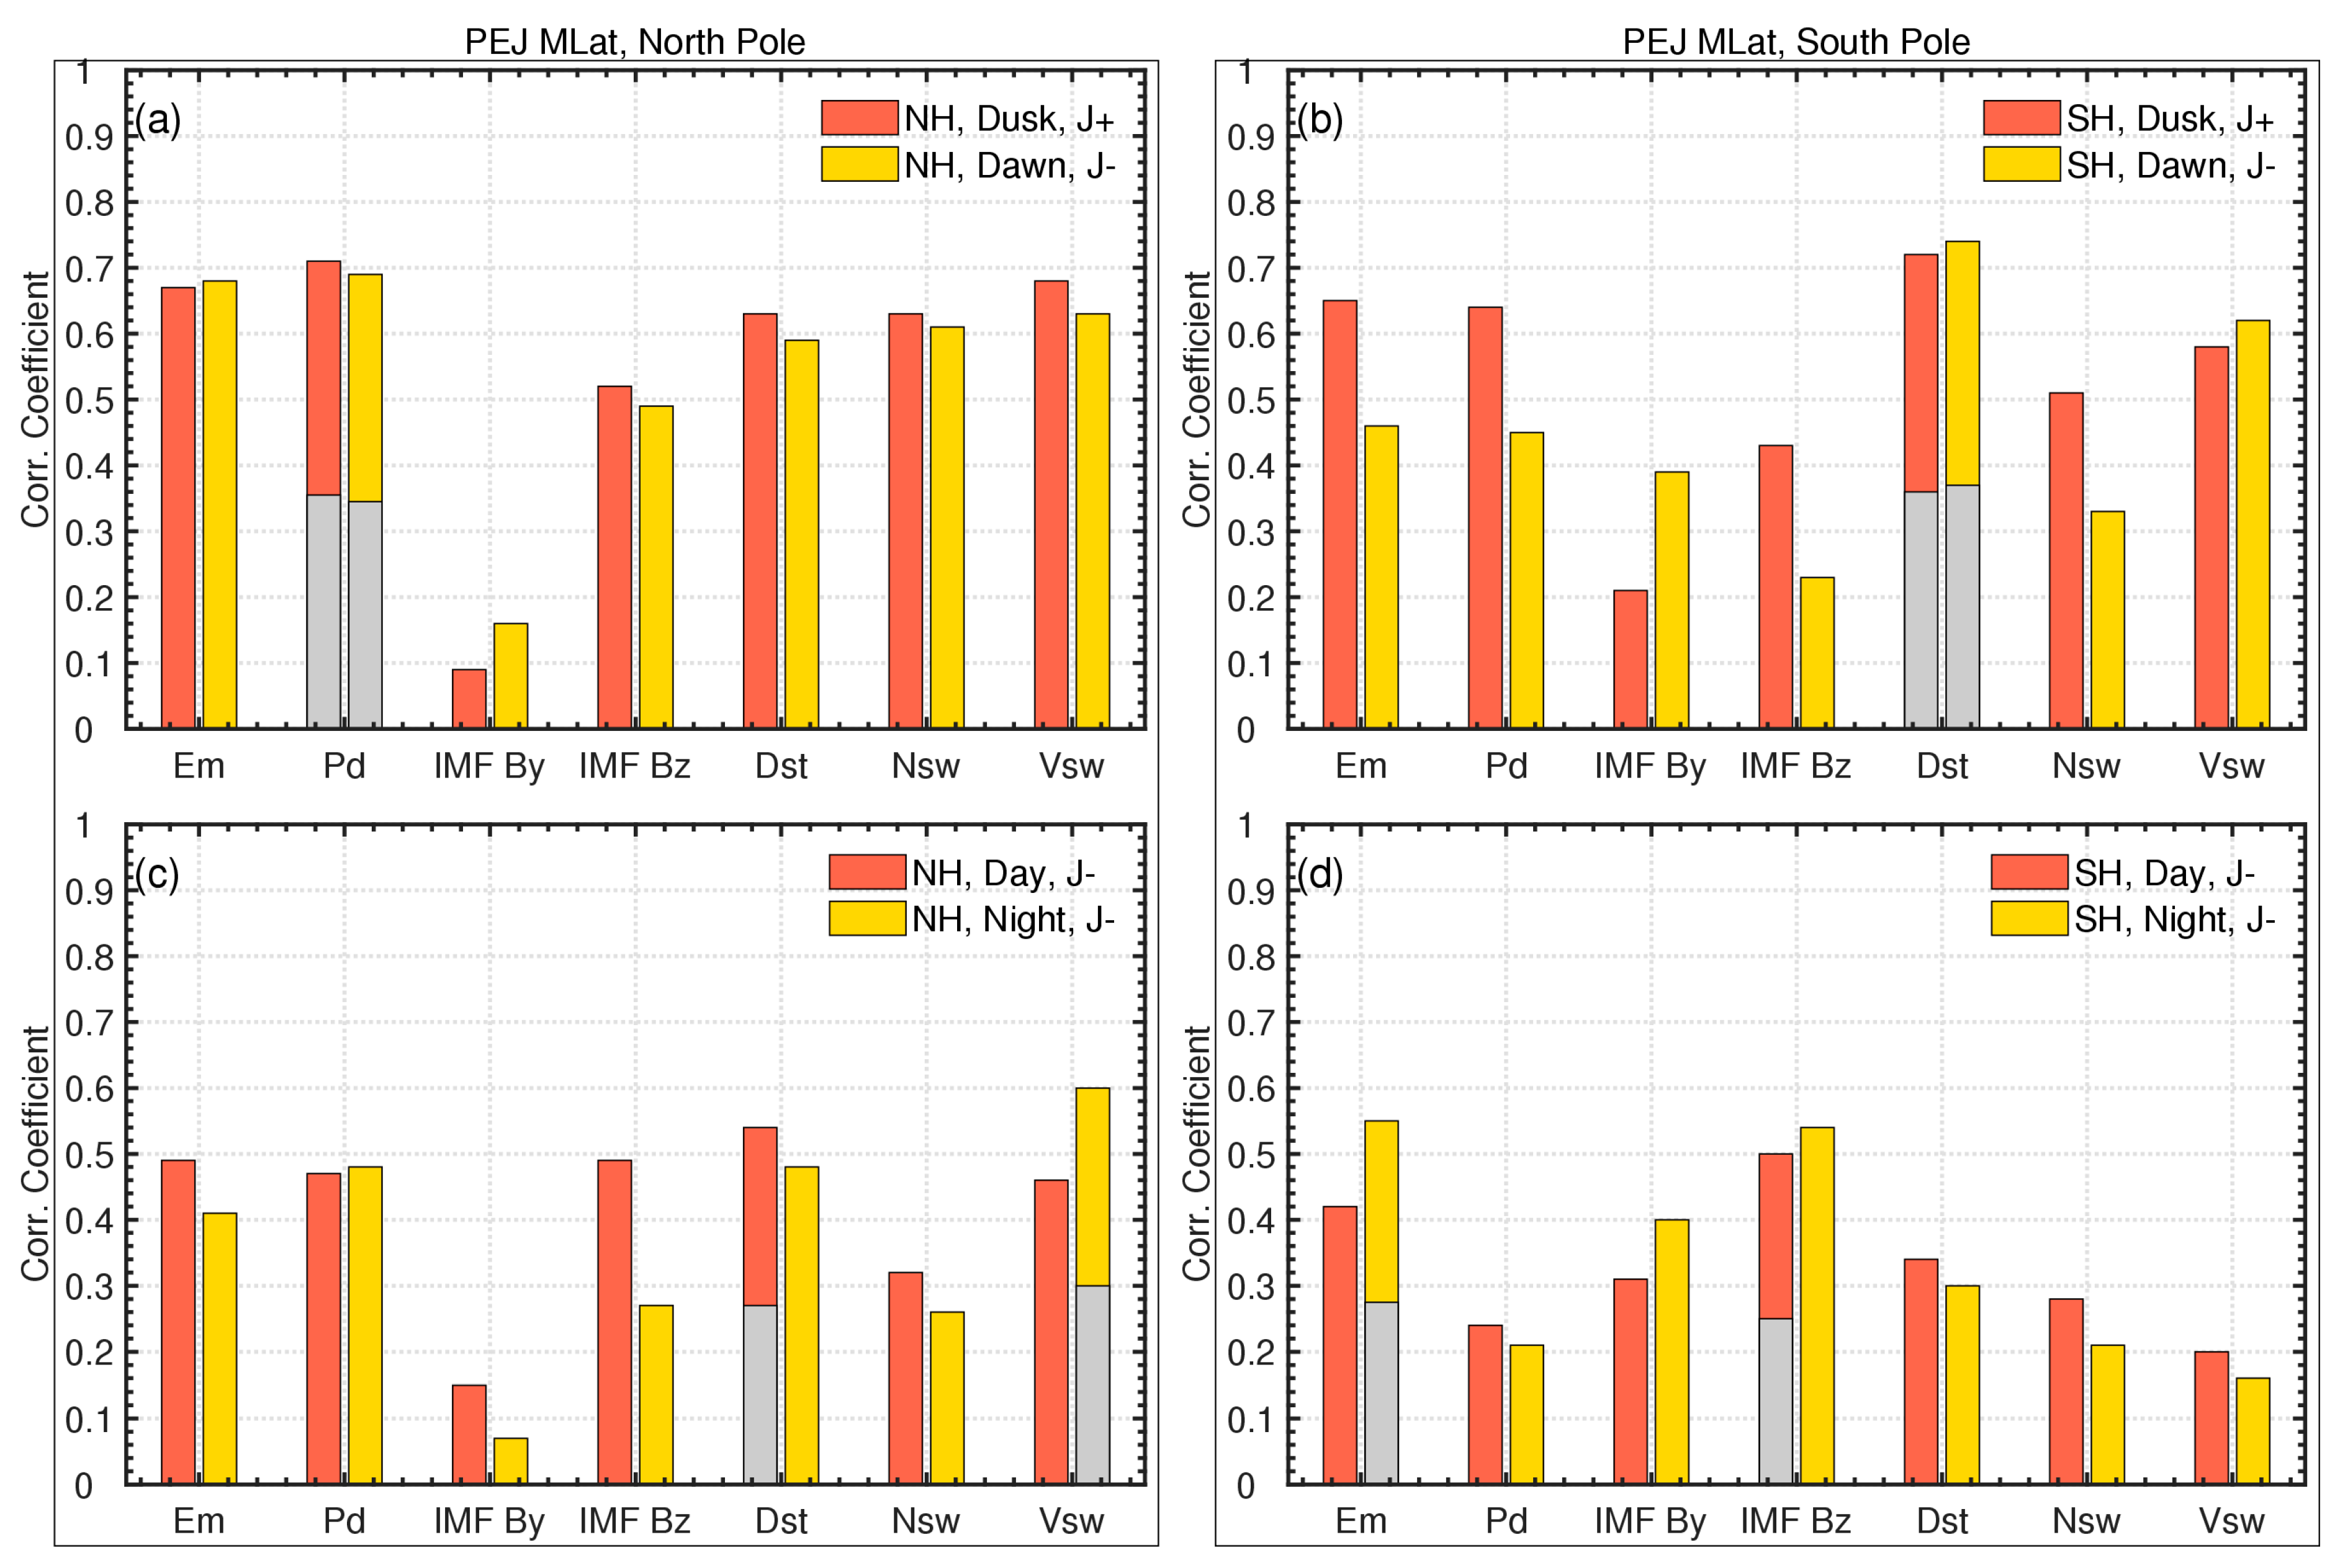
Figure 6 presents the Spearman correlation study between PEJ peak values in the auroral oval of two hemispheres and seven solar wind and geomagnetic parameters across four local time sectors. At northern dawn and dusk and northern and southern nighttime, Em shows the largest correlation with the PEJ peak values. At southern dusk (dawn), the PEJ peak value is most strongly correlated with Nsw (Dst). On the dayside, the PEJ peak in the Northern Hemisphere is most strongly correlated with Vsw, while in the Southern Hemisphere, it is most strongly correlated with Pd. Unlike the May 2024 geomagnetic storm, where the PEJ peak density was primarily correlated with Dst [
10], the PEJ peak density during this October storm was largely correlated with Em and Pd.
Figure 7 shows the correlation coefficients between the latitudes of PEJ peaks in the auroral oval and seven solar wind and geomagnetic parameters. The northern PEJ latitude at dawn–dusk is best correlated with Pd, while the southern PEJ MLat is most strongly correlated with Dst. In the Northern Hemisphere, the PEJ latitude on the dayside is most strongly correlated with Dst, while on the nightside, it is most strongly correlated with Vsw. The southern PEJ MLat on the dayside is most strongly correlated with IMF Bz, while on the nightside, it is most strongly correlated with Em. Wang et al. (2024) found that the latitudes of PEJ peaks across most local time sectors tend to show strong correlations with Pd and Dst, which is consistent with the results of this study.
Thus, by comparing PEJ during the magnetic storm events in May and October, the following conclusions can be drawn: the correlation factors of PEJ intensity vary between different magnetic storm events. During the May 2024 magnetic storm, the PEJ intensity was primarily correlated with Dst, whereas during the October 2024 storm, it was mainly correlated with Em and Pd. However, the latitude of PEJs is predominantly correlated with Pd and Dst during most local time sectors. This finding provides valuable reference for future magnetic storm research.
During this October storm, both Em and Pd played crucial roles in the variations in FAC and PEJ densities and latitudes across different local time sectors. Em reflects the combined influence of IMF By, Bz, and solar wind velocity, while Pd is determined by the product of Nsw and the square of Vsw. Both Em and Pd incorporate the effect of Vsw, but Em does not account for Nsw, and Pd does not include IMF By or Bz. Shue and Kamide (2001) [
26] identified a positive correlation between Nsw and auroral current intensities, as indicated by the AL and AU indices, with a stronger relationship under southward IMF conditions. Wing et al. (2011) [
27] found that around noon, R1 currents are predominantly influenced by Vsw, while R2 currents are more strongly affected by Nsw. Therefore, it is suggested that future solar wind electric field coupling parameters incorporate solar wind mass density, as this could further optimize the correlation coefficients with FACs and PEJs.
One should note that in this paper, Spearman’s rank correlation analysis was primarily employed to examine the relationship between FACs, PEJs, and external parameters. However, this method only identifies monotonic relationships between the variables and does not provide evidence of causality. Therefore, causality cannot be directly inferred from correlation alone. The reliability of the conclusions could be strengthened by complementing the analysis with additional methods or by incorporating relevant physical mechanisms in future work.
4.2. Mean Current Density and Latitude
R1 and R2 FACs and PEJs on the dawnside were higher than those on the duskside in the summer (i.e., southern) hemisphere during this October storm. Such dawnside preference in the summer hemisphere is consistent with the May 2024 storm [
10]. This preference can be explained by the combined (mutually canceling) influence of the convective electric-field-driven westward DP-2 current and the substorm-driven westward DP-1 current at dawn (dusk). However, during the May storm, both FACs and westward PEJs in the winter (i.e., southern) hemisphere showed higher values at dusk than at dawn, as the substorm DP-1 current extended more into the duskside in the winter hemisphere [
10]. Clearly, this duskside extension of intense westward DP-1 currents did not occur during this October storm, and as a result, both PEJs and R2 FACs on the dawnside were still higher than on the duskside.
During this October storm, the downward FAC density on the dayside was generally greater than at night in the two hemispheres. In the summer pole, the PEJ density during the daytime also exceeded that during the night, consistent with the results of the May 2024 storm event [
10]. These phenomena are mainly related to ionospheric conductivity variations induced by solar illumination, where the daytime experiences stronger sunlight than the nighttime, leading to significantly higher conductivity on the dayside compared to the nightside. Conversely, the upward FAC density on the nightside exceeds that on the dayside, and in the winter hemisphere, the PEJ densities during the day and night are comparable. This can be attributed to the important influence of energetic particle precipitation on the nighttime conductivity, which primarily affects the upward FAC region.
Notably, the daytime–nighttime differences in FAC densities varied between the May and October storms: in the May storm, the upward FAC density on the dayside was higher than that on the nightside in the summer hemisphere, while in the October storm, the upward FAC density on the dayside was lower than on the nightside in the summer hemisphere. This suggests that the differences between the two hemispheres are not only simply related to seasonal variations but may also be influenced by geomagnetic geometry differences between the hemispheres. For example, the magnetic dipole tilt angle (the angle between the geographic and geomagnetic axes) in the Southern Hemisphere is larger than in the Northern Hemisphere, which might affect the sunlight intensity and particle precipitation processes in the two hemispheres [
24].
During this October storm, most FACs in the summer hemisphere were stronger than those in the winter hemisphere, with the exception of the downward FACs on the nightside, which is generally consistent with the May storm results [
10]. These hemispheric differences might come from the larger ionospheric conductivity in the summer than the winter hemisphere. Those subtle differences lie in the fact that during the October storm, the downward FACs at night were more intense in the winter than in the summer hemisphere, while for the May storm, the upward FACs at night were more prominent in the local winter than in the local summer hemisphere.
PEJs in the daytime and dusk are higher in the summer hemisphere when compared to the winter hemisphere, confirming the May storm results, which is due to seasonal variations in ionospheric conductivity. In the evening and dawn sectors, PEJs are stronger in local winter than in local summer; however, in the May storm, both hemispheric PEJs were quite comparable. This was likely due to the fact that the diffuse precipitation becomes more important for conductance enhancement in the evening and early morning sectors [
28].
Concerning latitudinal differences, FACs and PEJs shift more equatorward at dusk (night) compared to dawn (day). These local time differences in MLat of the ionospheric current system are also consistent with the May storm results. As both hemispheres exhibit a similar duskward equatorward displacement compared to dawn, and due to the poor correlation with IMF By, IMF By may not significantly influence the duskside latitudinal displacement. The duskside partial ring current might be a plausible reason, which could extend the ionospheric currents to lower latitudes at dusk [
11].
FACs and PEJs in the summer hemisphere tend to be positioned more poleward than in the winter hemisphere in most cases, which is generally consistent with the May storm, due to the summer–winter difference in ionospheric conductivity. However, there were differences between these two geomagnetic storm events: during the May storm, the upward FACs and PEJs on the nightside were located at a higher MLat in the winter hemisphere when compared to the summer hemisphere, while in the October storm, in addition to the upward FACs at night, both the daytime FACs and PEJs were also located more poleward in the winter hemisphere when compared to the summer hemisphere.
The May and October 2024 storms provide a unique opportunity to distinguish hemispheric and seasonal differences, as they occurred at opposite seasons in two hemispheres. Generally, the hemispheric asymmetries in FACs, PEJ density, and latitude can be attributed to seasonal variations in ionospheric conductivity. However, subtle hemispheric differences persist, which cannot be explained by the seasonal differences but may be due to hemispheric asymmetries in the geomagnetic field geometry.
Last but not least, our analysis confirmed that the auroral oval represented by FACs and PEJs might extend to approximately 51° MLat around midnight, making mid-latitude aurora sightings possible. Thus, it provides further evidence that the aurora observed at mid-latitudes should be an electromagnetic phenomenon associated with geomagnetic storms or solar wind activity rather than a phenomenon that occurs due to chemical reactions in the upper atmosphere, for example, sky airglow.


