Article

Selecting the Optimal Approach for Individual Tree Segmentation in Euphrates Poplar Desert Riparian Forest Using Terrestrial Laser Scanning

1
Institute of Ecology, College of Urban and Environmental Sciences, Peking University, Beijing 100871, China
2
State Key Laboratory for Vegetation Structure, Function and Construction (VegLab), Peking University, Beijing 100871, China
3
Ministry of Education Key Laboratory of Oasis Ecology, College of Ecology and Environment, Xinjiang University, Ürümqi 830017, China
4
College of Tourism, Xinjiang University, Ürümqi 830046, China
5
State Key Laboratory of Desert and Oasis Ecology, Xinjiang Institute of Ecology and Geography, Chinese Academy of Sciences, Ürümqi 830011, China
*
Author to whom correspondence should be addressed.
Remote Sens. 2025, 17(23), 3852; https://doi.org/10.3390/rs17233852
Submission received: 8 October 2025 / Revised: 19 November 2025 / Accepted: 26 November 2025 / Published: 28 November 2025
(This article belongs to the Special Issue Close-Range LiDAR for Forest Structure and Dynamics Monitoring)

Highlights

What are the main findings?
  • We benchmark six tree segmentation algorithms on TLS data from 507 P. euphratica trees and identify two approaches—deep-learning trunk extraction and leaf–wood separation—as the reliable methods.
  • Field validation demonstrates that these two methods accurately extract tree crown structure, enabling a rapid, plot-scale inventory of the desert riparian forests.
What is the implication of the main finding?
  • Managers use TLS with trunk-based or leaf–wood-separation pipelines to quickly create accurate tree lists in P. euphratica stands. This approach not only directly im-proves biomass and carbon measurements, health checks, and restoration monitor-ing, but also reduces manual effort.
  • Furthermore, trunk-based or leaf–wood-separation-based approaches outperform crown height model methods in clustered, overlapping crowns. This offers clear guidance for an algorithm that can be applied to similar arid riparian forests.

Abstract

Individual tree segmentation (ITS) is essential for forest inventory, health assessment, carbon accounting, and evaluating restoration efforts. Populus euphratica, a widely distributed desert riparian tree species found along the inland rivers of Central Asia, presents challenges for accurately identifying individual trees and conducting forest inventories due to its complex stand structure and overlapping crowns. To determine the most effective ITS approach for P. euphratica, we benchmarked six commonly used tree segmentation approaches for terrestrial laser scanning (TLS) data: canopy height model segmentation (CHMS), point cloud segmentation (PCS), comparative shortest-path algorithm (CSP), stem location seed point segmentation (SPS), deep-learning trunk-based segmentation (TBS), and leaf–wood separation-based segmentation (LWS). All methods followed a unified preprocessing and tuning protocol. We evaluated these methods based on tree-count accuracy, crown delineation, and structural attributes such as tree height (H), diameter at breast height (DBH), and crown diameter (CD). The results indicated that the TBS and LWS methods performed the best, achieving a mean tree-count accuracy of 98%, while the CHMS method averaged only 46%. These two methods provide the basic branch structure within the tree crown, reducing the likelihood of incorrect segmentation. Validation against field-measured values for H, DBH, and CD showed that both the TBS and LWS methods achieved accuracies exceeding 80% (RMSE = 0.8 m), 86% (RMSE = 0.02 m), and 73% (RMSE = 0.7 m), respectively. For TLS data in P. euphratica desert riparian forests, these two methods provide the most reliable results, facilitating rapid plot-scale inventory and monitoring. These findings establish a practical basis for conducting high-accuracy inventories of Euphrates poplar desert riparian forests.

1. Introduction

The Euphrates poplar (Populus euphratica Oliv.) establishes desert riparian forests across a broad native range from Central Asia to western China, forming floodplain ecosystems distributed along rivers [1,2,3]. Approximately 60% of P. euphratica forests are located along the Tarim River in northwestern China, covering an area of 1.14 million hectares [4,5]. These deciduous forests are vital for maintaining ecological integrity and environmental protection in arid regions [6,7,8]. However, P. euphratica populations have declined in recent decades due to climatic change and human activities [7,8,9]. Therefore, individual-tree-level monitoring is essential for accurate forest inventories, health assessments, carbon quantification, and restoration in these vulnerable ecosystems [10,11,12,13].
Individual-tree segmentation (ITS) is the process of identifying individual trees and delineating their crowns [14,15,16]. Although traditional high-resolution remote sensing images can provide accurate tree identification and stand-level segmentation, precisely locating individual trees and assessing their structural attributes remains challenging [11,17,18]. Light detection and ranging (LiDAR) is an active remote sensing technology that can penetrate the forest canopy, providing detailed three-dimensional (3D) information about the under-crown structure. This capability enables accurate ITS in forests [19,20]. Among the LiDAR platforms, terrestrial laser scanning (TLS) is a high-precision platform that provides millimeter- to centimeter-scale 3D geometric data for stems, branches, and the understory, offering significant advantages for tree-level mapping [21,22].
Over the past decade, TLS has rapidly developed into a fundamental technology for accurately characterizing forest structure. It complements traditional ground surveys and airborne laser scanning methods. Early reviews confirmed TLS as a reliable tool for measuring key inventory attributes, such as tree height, diameter, stem taper, and basal area, with centimeter-level accuracy [17,18,19]. Subsequent advances in TLS hardware, including faster scanning rates, improved ranging accuracy, and increasingly lightweight systems, have substantially lowered operational costs and expanded TLS applications across various forest types [23]. Recent comprehensive syntheses further emphasize the role of TLS in modern forest inventories, highlighting its superiority in capturing the detailed 3D structure of stems, branches, and understory vegetation, which remain largely inaccessible to photogrammetry or airborne LiDAR. For example, TLS has proven highly effective in quantifying crown dimensions, foliage clumping, canopy rugosity, standing deadwood volume, and other metrics that significantly enhance assessments of forest productivity, competition, and habitat complexity [23]. In addition, breakthroughs in co-registration, wood–leaf separation, deep learning-based segmentation, and automated tree extraction pipelines have brought TLS closer to operational use in national forest inventory programs [16]. Despite these advancements, challenges remain in densely packed or multi-stemmed stands where crown overlap and understory occlusion constrain segmentation accuracy—conditions typical of P. euphratica forests.
A variety of segmentation methods have been developed to extract individual trees from plot-level LiDAR data in a semi-automated manner [24,25,26,27,28,29,30,31,32,33,34]. These tree segmentation approaches can be categorized into two main groups: (a) top-to-bottom segmentation methods and (b) bottom-to-top segmentation methods. Top-to-bottom methods identify trees by first locating the highest points of the crowns and then proceeding downward to segment the trees from the upper parts. This is typically done using the Canopy Height Model (CHM), which is generated from the uppermost first-return points. CHM-based segmentation methods often face challenges with crown overlap [21,22,32]. An advanced variant within this category is the top-down region-growing point cloud segmentation (PCS), which is particularly effective in complex mixed forests [33]. PCS has demonstrated an overall accuracy of 94% in the Sierra National Forest, outperforming traditional marker-controlled watershed segmentation [34].
In contrast, bottom-to-top methods begin at the ground level by first identifying stem bases. From these bases, tree segmentation expands upward through branches and twigs to reconstruct entire crowns [35,36]. For instance, the comparative shortest-path algorithm (CSP) identifies individual trees by mapping the shortest path from each stem base to its branches [37]. Another method, point-cloud region-growing segmentation based on seed points derived from stem locations (SPS), often requires manual adjustments to improve quality control due to potential errors in the point cloud. Recent advancements in deep learning have significantly improved the ability to separate trunk and leaf wood [36], thereby enhancing individual-tree segmentation.
Previous studies indicate that P. euphratica stands display aggregated spatial distribution patterns [24]. In arid regions, P. euphratica enhances sexual reproduction through root suckering, whereby new ramets emerge from parent tree roots [38,39]. This mechanism forms small, patchy clusters, resulting in crown overlap at fine scales and thereby challenging accurate crown delineation and tree segmentation, even with dense LiDAR point clouds [24]. Additionally, P. euphratica often exhibits crowns that partially envelop the stem, complicating stem detection at breast height (DBH; Figure 1) and further hindering automated ITS.
Existing TLS benchmarks rarely examine multiple ITS methods simultaneously, nor do they consider desert riparian trees with clonal root suckering, multi-stem clusters, and highly overlapping crowns. To our knowledge, no study has systematically compared CHM-based, point-cloud region-growing, seed-point-driven, graph-based shortest-path, deep-learning trunk-extraction, and leaf–wood separation approaches within the same P. euphratica stands yet. Our present work differs from previous TLS evaluations by incorporating six representative ITS methods that span both top-down and bottom-up segmentation logics and by testing them under the unique structural challenges posed by P. euphratica. This comprehensive cross-paradigm comparison enhances our understanding of how sensitive these methods are to crown overlap, stem enclosure, and clonal clustering—conditions that have been inadequately explored in earlier TLS segmentation studies.
This study aims to address the existing gap by systematically evaluating TLS-based segmentation methods for P. euphratica forests. Our specific objectives are (1) to quantitatively evaluate the accuracy and computational efficiency of each ITS method using ground measurement data, and (2) to verify the accuracy of crown boundary identification for the optimal single-tree segmentation method using measured tree structure parameters. We directly compare six ITS methods using TLS point clouds from P. euphratica stands, evaluating segmentation accuracy and responses to structural obstacles, such as crown overlap, stem enclosure, and multi-stem clustering. Our results provide practical guidance for selecting ITS strategies for long-term monitoring and restoration assessment in desert riparian ecosystems.

2. Materials and Methods

2.1. Site Characteristics and Data Collection

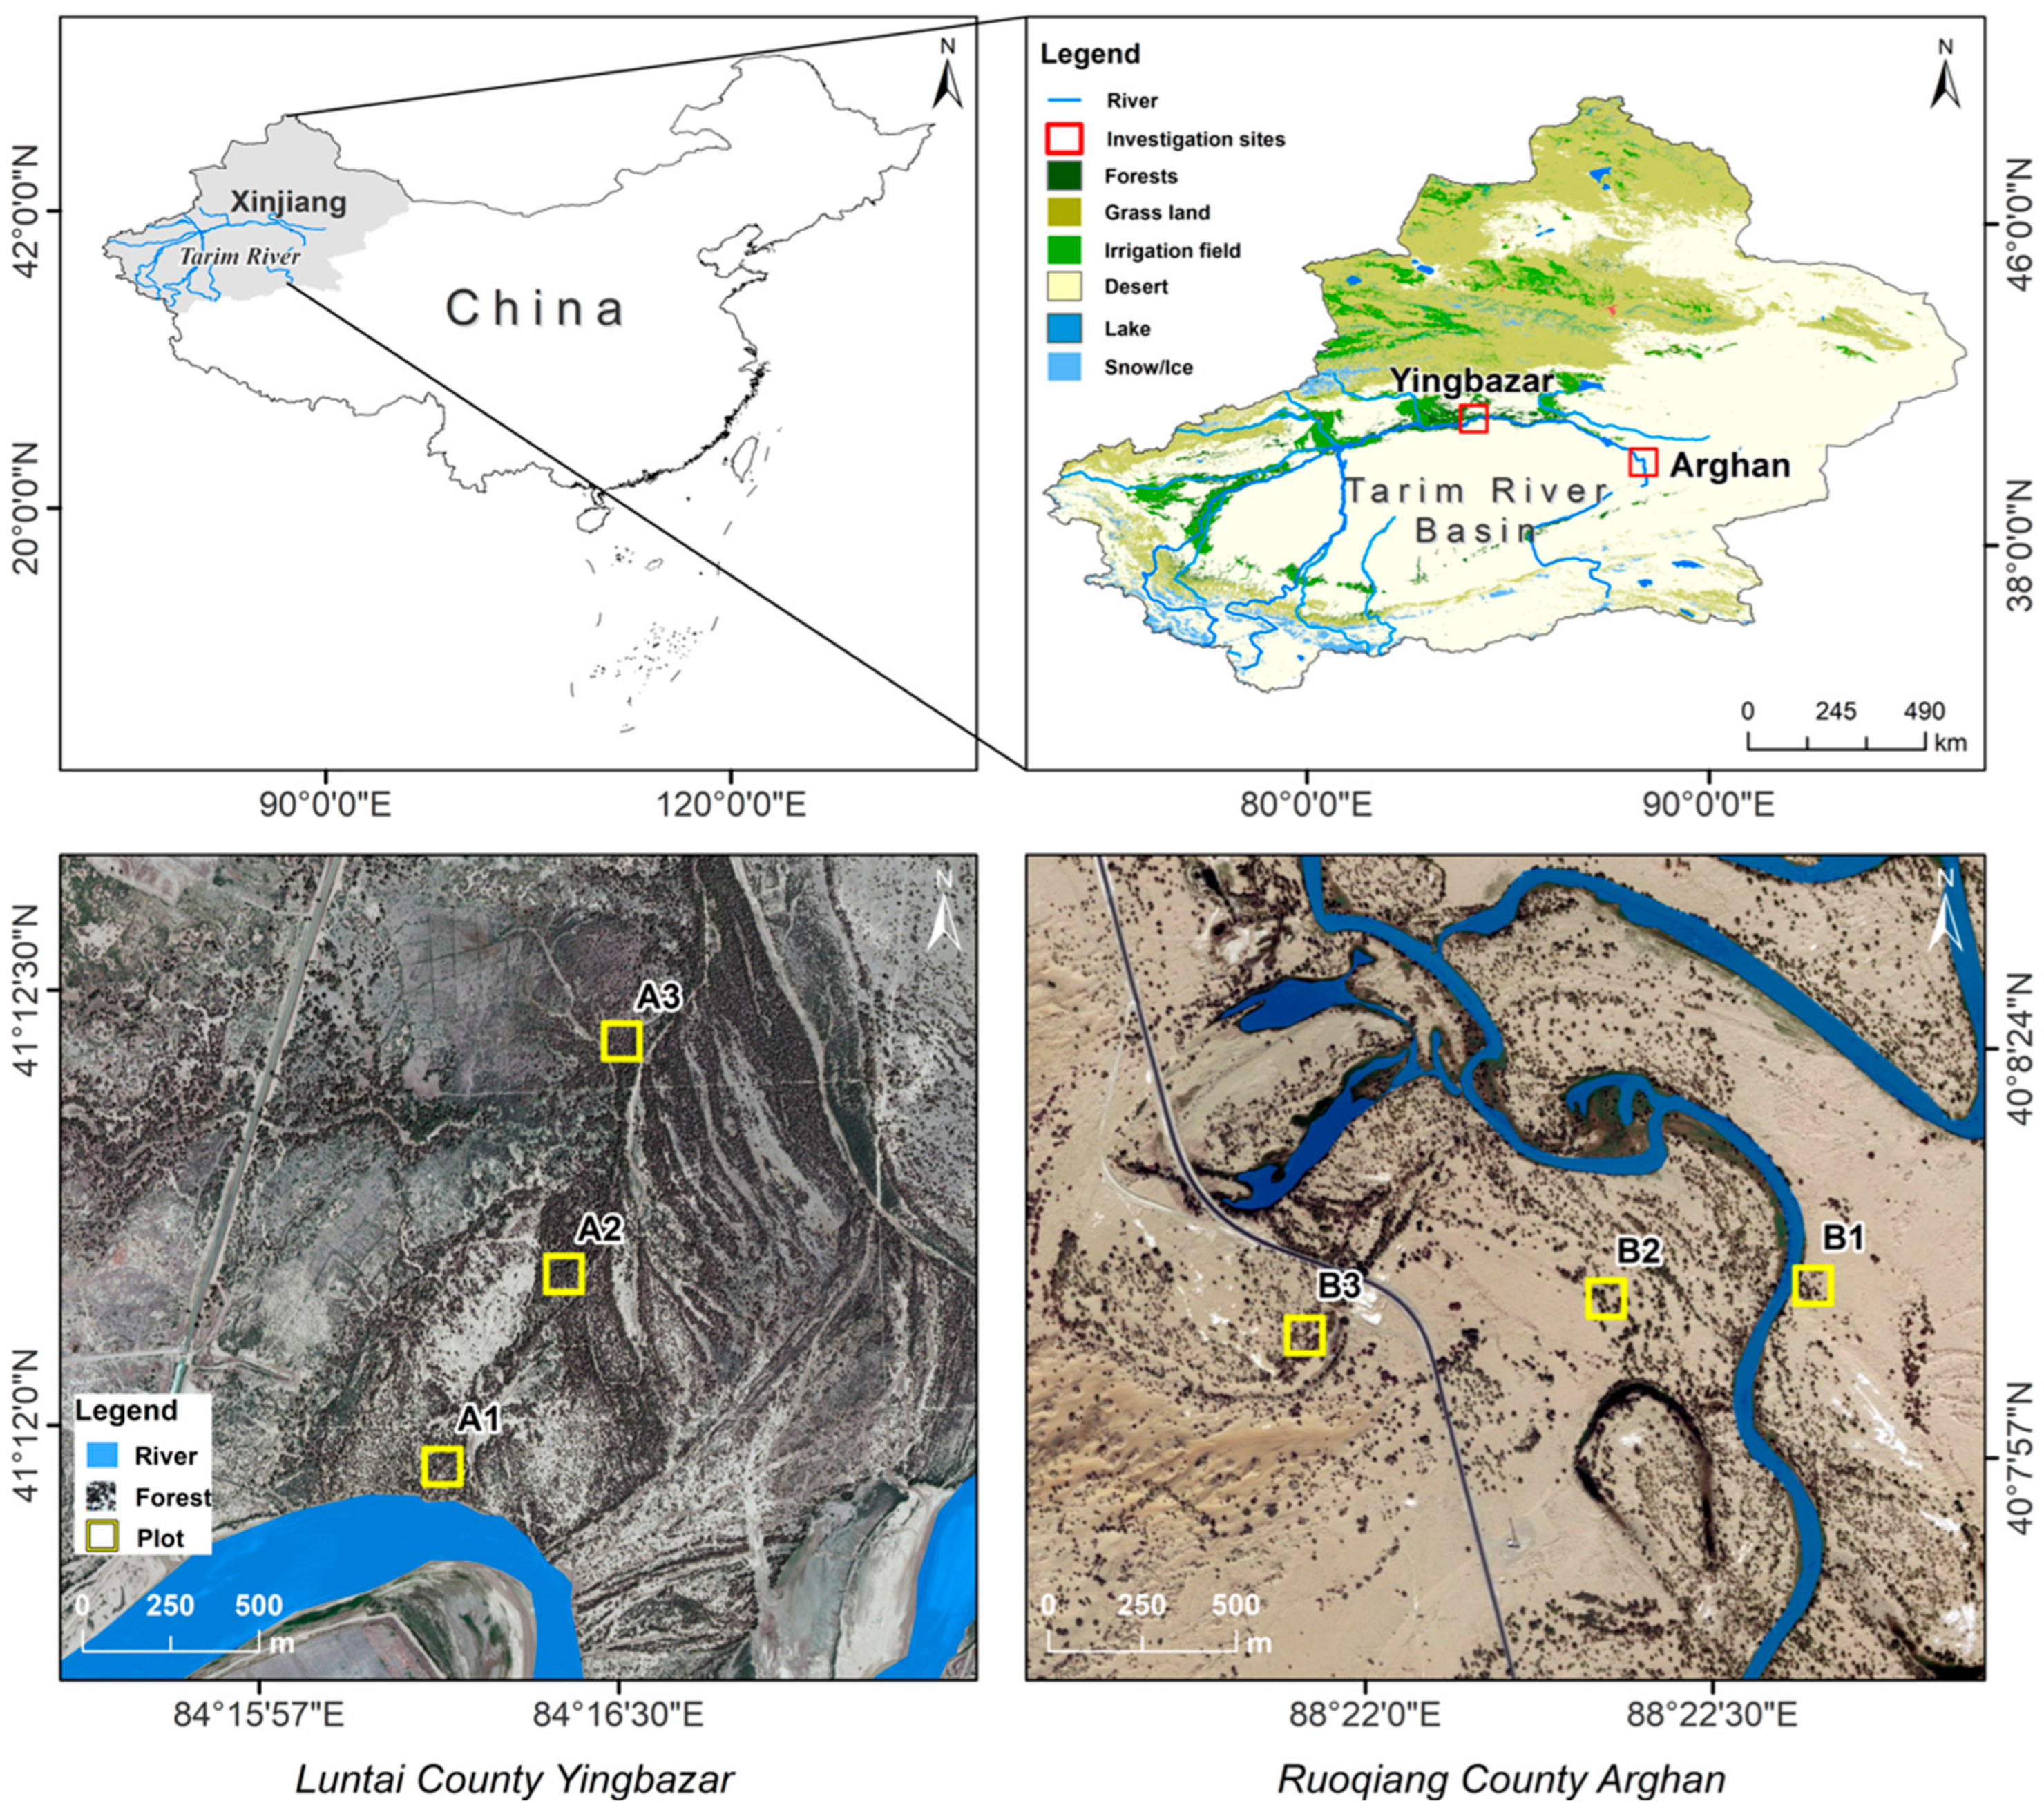
TLS data were acquired by scanning six plots along two separate transects of the Tarim River in northwestern China: one at Yingbazar (41°12′ N, 84°16′ E) and one at Arghan (40°08′ N, 88°21′ E) (Figure 2; Table 1). Data collection at both sites used identical TLS survey methods for each plot. The region has an extremely arid desert climate [40], characterized by mean annual precipitation of 20–50 mm, and potential evaporation ranges from 2429–2910 mm yr−1. Mean annual sunshine totals about 2900 h. The mean annual temperature is about 10 °C; July maxima reach 45 °C, while January minima fall to −30 °C. This makes the region one of the most extreme arid areas worldwide [41]. The dominant tree species is P. euphratica. The main shrubs include Tamarix ramosissima, Tamarix hispida, and Lycium ruthenicum. Dominant herbaceous species are Phragmites australis, Hexinia polydichotoma, Alhagi sparsifolia, Karelinia caspia, Apocynum venetum, and Glycyrrhiza inflata [42]. Shrubs and herbaceous plants mainly grow around P. euphratica stands and are sparsely distributed under its canopy.
At each plot, we acquired LiDAR data with a RIEGL VZ-1000 terrestrial laser scanner (RIEGL Laser Measurement Systems GmbH, Horn, Austria), collecting a set of scans on a regular grid of scan positions (Table 2). To aid co-registration among scan positions, we manually placed spherical reflectors as tie targets. Following data collection, preprocessing in RiSCAN PRO (v2.7) co-registered individual scans to a common coordinate frame on a per-plot basis, yielding a registration standard deviation of <0.005 m. Subsequently, the merged point clouds were denoised, classified, and exported to LAS 2.0 format using LiDAR360 (v8.2; GreenValley Co., Ltd., Beijing, China) [43,44].

2.2. Tree Segmentation Methods

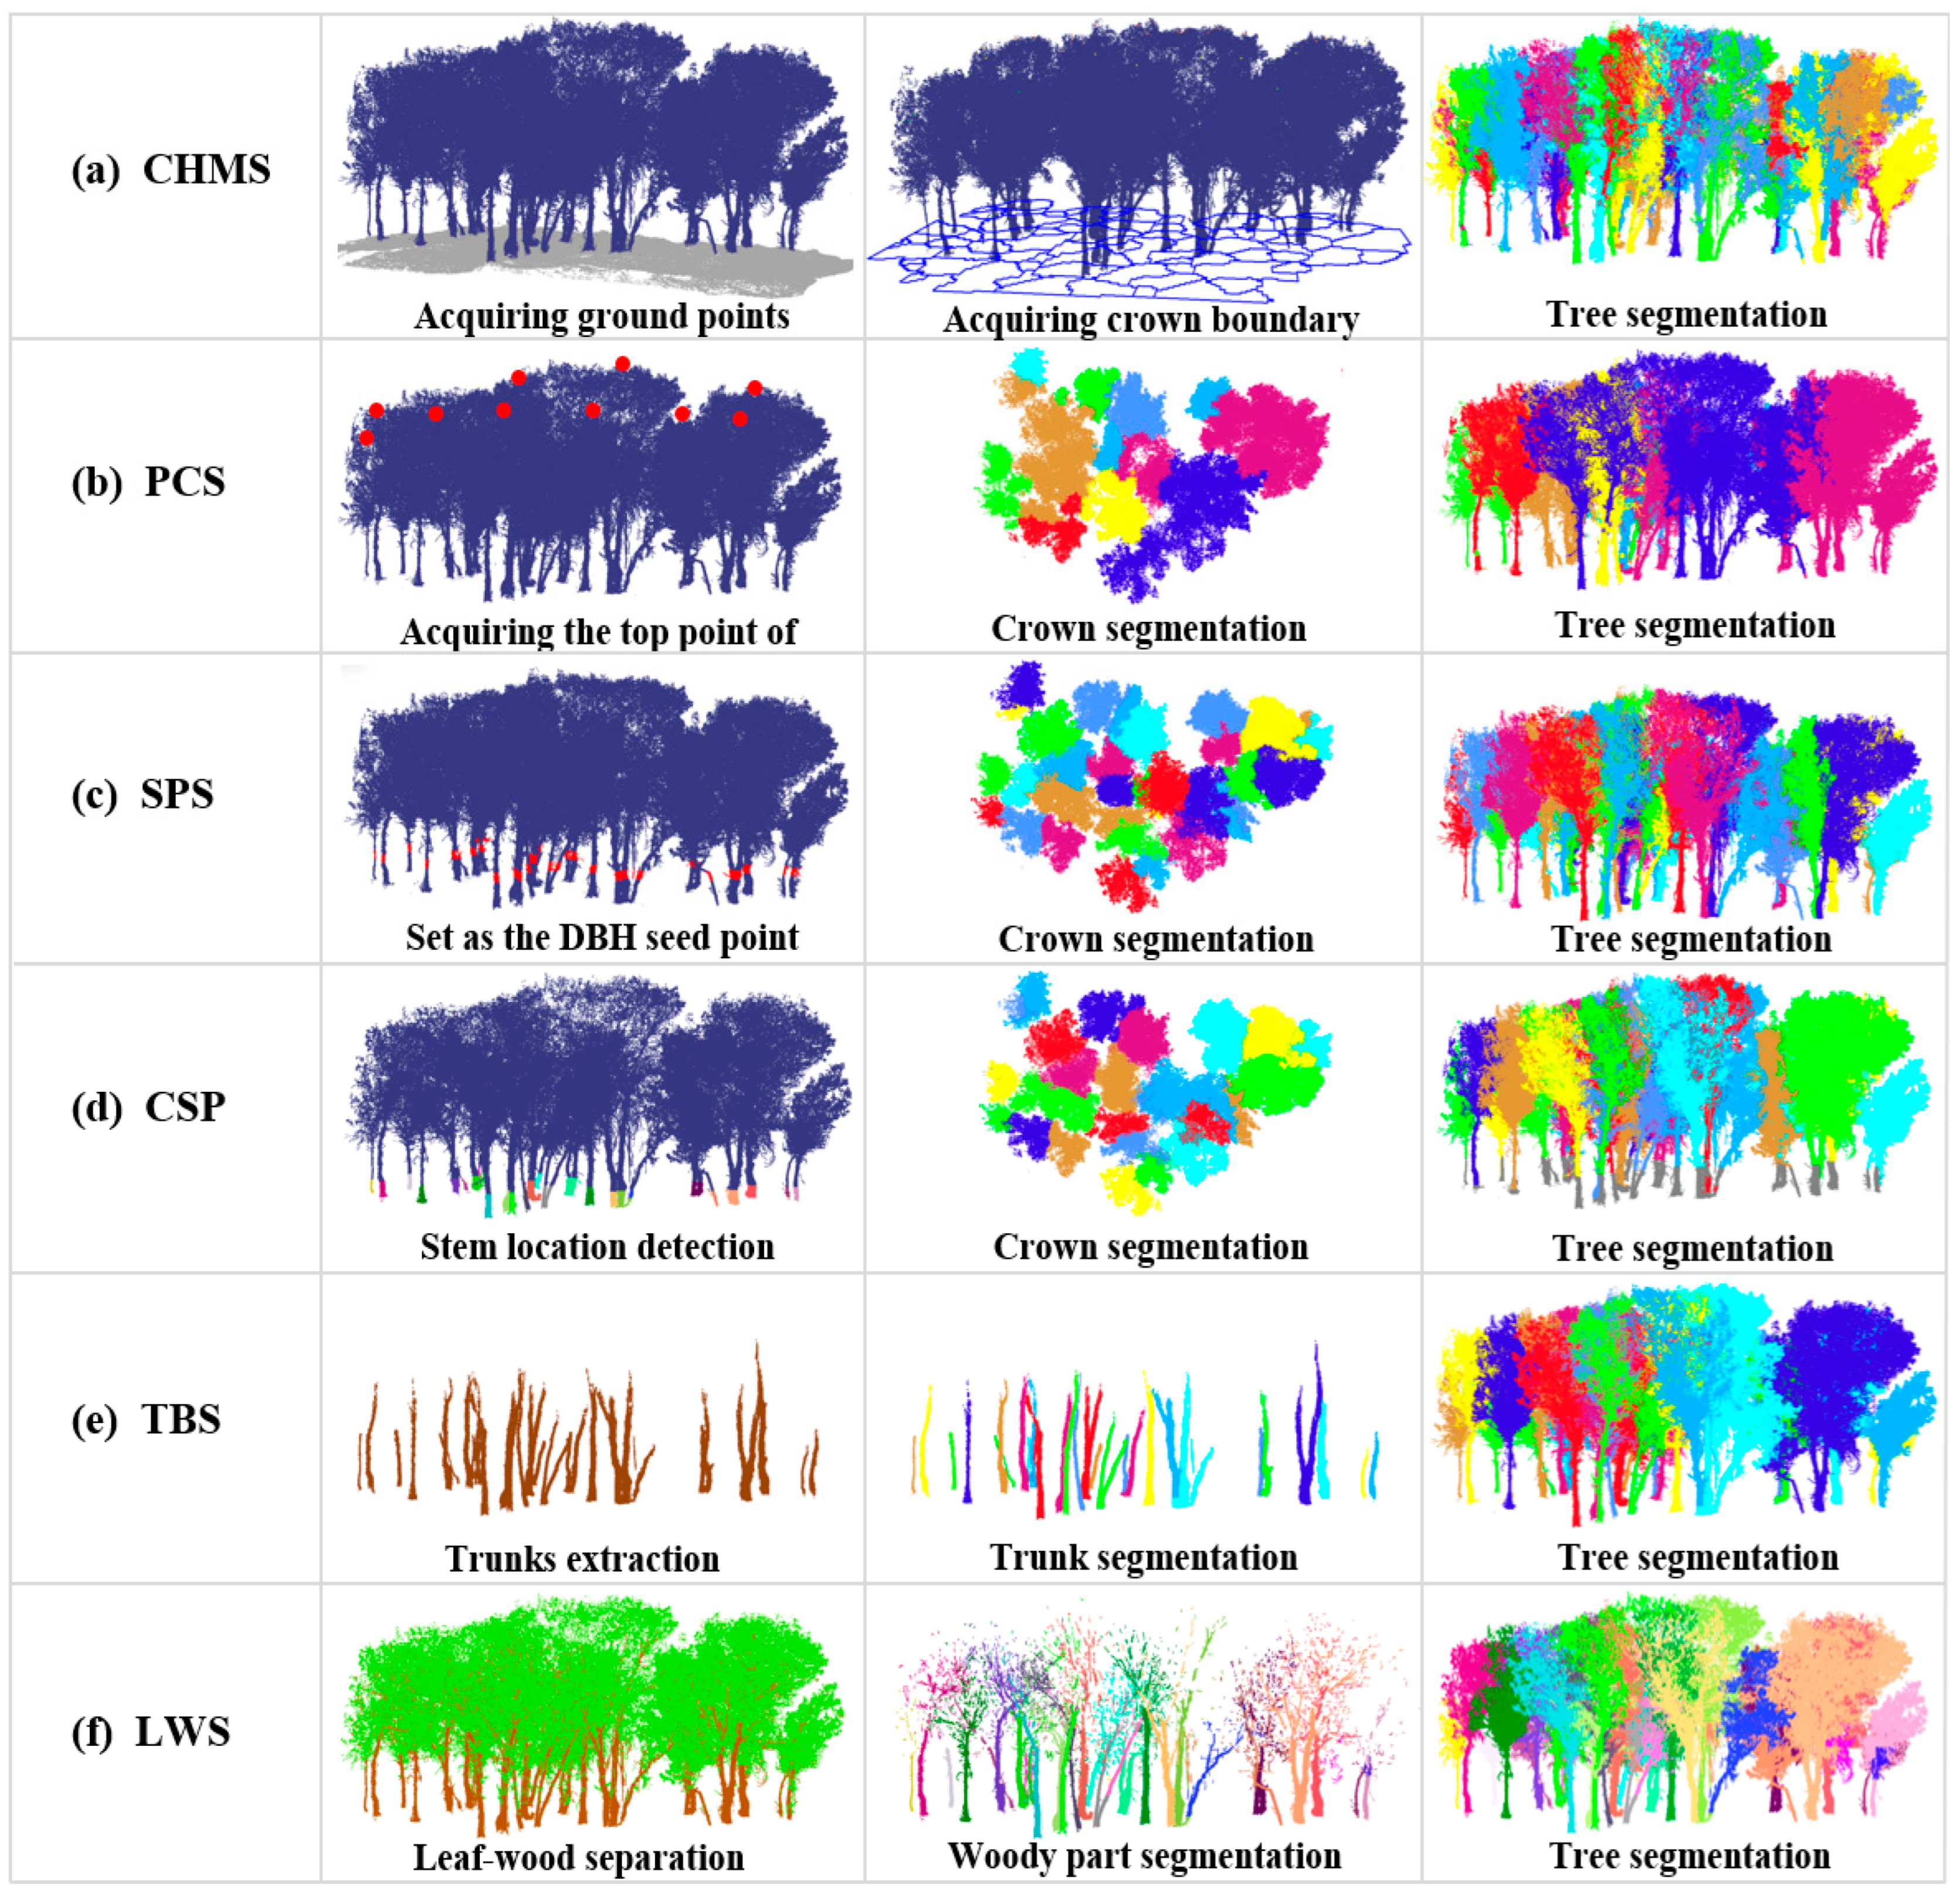
We evaluated six individual-tree segmentation (ITS) algorithms: canopy height model segmentation (CHMS), point cloud segmentation (PCS), seed-point segmentation (SPS), comparative shortest-path algorithm segmentation (CSP), trunk extraction-based deep learning segmentation (TBS), and leaf–wood separation-based segmentation (LWS). Regarding the application of these methods to P. euphratica, we confirm that no algorithmic modifications were introduced. Outputs from each algorithm were compared against field measurements, including tree counts, tree height (H), diameter at breast height (DBH), and crown diameter (CD). Figure 3 summarizes the processing pipelines for the six representative algorithms. To provide further clarity, a brief description of each method is provided below.
(a)
CHMS method: Typically, trees are identified from Canopy Height Models (CHMs), which are made by creating a surface of the forest canopy from the tallest detected points, and, if possible, adjusting for ground height using a terrain map. For example, Hyyppa et al. [45] used a region-growing technique to identify individual conifer trees in CHMs. In our approach, the CHM was generated following a series of standardized steps. First, the pre-processed point clouds were filtered to separate ground and vegetation points. A digital elevation model (DEM) with a 0.5 m spatial resolution was constructed from ground points, while a corresponding 0.5 m digital surface model (DSM) was derived from the combined vegetation and ground points. The CHM was then obtained by subtracting the DEM from the DSM. To delineate individual tree crowns, we applied a watershed segmentation method [46], which treats local maxima in the CHM as “peaks” and local minima as “valleys”. When simulating the process of water accumulation, adjacent valleys may merge; therefore, watershed lines are imposed to prevent merging and to define crown boundaries. Based on the height characteristics of young P. euphratica, we defined a minimum tree height of 1.5 m for detectable individuals, and initiated crown delineation only above a 1 m height threshold to avoid segmenting low vegetation or ground artefacts (Figure 4a).
(b)
PCS method: Li et al. [33] developed a top-down region-growing point-cloud segmentation (PCS) approach for complex mixed forests. The method assumes the presence of inter-tree gaps and uses a gap or spacing threshold to prevent crown merging. Implementation proceeds in several steps: first, the highest unassigned point (canopy apex) is selected as a seed; next, a candidate crown is grown by adding neighboring points that meet distance and height-continuity criteria; crown growth stops when the gap to surrounding points exceeds the spacing threshold; the segmented crown is then removed; and finally, the process repeats from the next highest unassigned apex. Throughout, distances between the current crown and unassigned points are evaluated iteratively to decide membership, enabling step-by-step individual-tree segmentation (Figure 4b).
In this study, several preprocessing operations and parameter settings were applied to ensure stable crown detection. First, all point clouds were height-normalized using ground points to represent vegetation height above ground level. To identify potential apex candidates, we defined a raster grid with a resolution set to one-fifth of the average crown diameter. Given that the average crown width of P. euphratica in the study area ranges from approximately 3 to 4 m, the grid resolution was fixed at 0.6 m. This resolution provided a sufficient balance between detecting local canopy maxima and minimizing false apex detections. A minimum tree height threshold of 1.5 m was imposed to exclude low shrubs and noise points from the seed selection process.
(c)
SPS method: Seed-point segmentation (SPS) generates seeds at breast height. Heights are first normalized to the ground (Figure 4c). A thin horizontal slice at 1.3 m is then extracted. Stem cross-sections are detected using the circular Hough transform [47]. For each detected stem, the center of the circle defines the seed location. The estimated radius initializes the neighborhood. Using the 3D coordinates of these seeds, points within the DBH-based radius—or the nearest point if the slice is sparse—are assigned as the initial seed cluster. This cluster is subsequently grown to delineate the full individual tree. The algorithm searches for points within the DBH-based radius—or the nearest available points when the slice is sparse—around the 3D seed coordinates to form the initial seed-point cluster for subsequent segmentation. In our approach, a clustering threshold of 0.2 m was applied for segmentation.
(d)
CSP method: Tao et al. [37] developed the Comparative Short Past (CSP) algorithm to segment tree crowns using terrestrial LiDAR data. CSP runs in two stages. First, it localizes stems using near-ground slices to detect axes. Second, it assigns crowns by comparing the shortest geodesic paths from each stem base or axis to candidate canopy points or voxels. The method is based on metabolic ecology and vascular transport theory. Crown elements of the same tree minimize their transport path length to the stem. Each point is assigned to the stem with the lowest normalized path cost, resulting in individual crown partitions (Figure 4). In this study, the CSP algorithm was implemented with the following parameter settings. A clustering threshold of 0.2 m was applied when aggregating points around detected stem axes. Each stem cluster was required to contain at least 500 points to be retained as a valid stem. The stem-detection slice height was set to 1 m to ensure reliable localization of the main stem structure near the ground. Consistent with the other segmentation methods, a minimum tree height of 1.5 m was imposed to exclude low shrubs and non-tree objects from subsequent crown assignment.
(e)
TBS method: This approach has two stages: trunk extraction and crown segmentation. First, trunks are detected in the point cloud using a deep-learning model [48]. Following López-Serrano et al. [48], the normalized point cloud is converted into a series of 2-D raster slices at predefined heights (typically every 0.10–0.20 m, with a ground-plane resolution of 1 cm). Each slice is treated as an input image for a Faster R-CNN detector with an Inception-V2 backbone, trained on manually annotated stem-section datasets sampled from multiple forest plots with diverse stand structures. The training dataset contains thousands of labelled cross-sections (≈5000 for training and ≈1200 for validation), allowing the model to generalize across species, stem forms, and understory conditions. During inference, detections were filtered using a 0.6 confidence threshold and linked vertically based on ≥70% planimetric overlap to reconstruct continuous trunk axes. These reconstructed trunk axes serve as spatial seeds and constraints for crown delineation. Neighboring canopy points are iteratively assigned to the nearest trunk based on 3-D proximity and vertical continuity, allowing each crown to expand outward from its stem and ultimately producing individual-tree segments (Figure 4).
(f)
LWS method: Wang et al. [49] developed a leaf–wood segmentation algorithm known as LeWoS. This method recursively partitions the point cloud into small, near-pure clusters using a proximity–normal-verticality graph. It assigns each cluster a leaf/wood probability based on linearity and cluster-size cues, which are evaluated over a grid of decision thresholds. The method was evaluated using a comprehensive dataset of 61 large tropical trees spanning 15 species, ranging from 20,000 to 10 million points per tree, each accompanied by manually labeled leaf–wood references for validation. The algorithm requires only a single tunable parameter—Nz_thres, which defines the permissible difference in point-wise verticality between neighbors during recursive graph segmentation. Sensitivity analysis demonstrated that Nz_thres values between 0.125–0.15 provide the highest point-wise classification accuracy (≈0.91); therefore, in this study, Nz_thres = 0.15 was adopted as the default setting in the original implementation.
Building on leaf-wood separation, Wilkes et al. [50] developed a scalable geometry-driven tree segmentation algorithm, “TLS2trees,” for terrestrial LiDAR data. The method first performs leaf–wood separation on the point cloud. It then segments the leafless woody (stem/branch) points and finally assigns the remaining leaf points to the corresponding individual stems (Figure 4). According to Wilkes et al. [50], the method was evaluated on a diverse benchmark dataset of 71 TLS plots across multiple forest types, with manually delineated stem positions and tree IDs used for validation. The pipeline begins by generating a ground-normalized point cloud, followed by height-stratified clustering of points within 0.5-m vertical slices to detect stem-like structures. Points are grouped using Euclidean distance thresholds between 0.15–0.30 m, and clusters are merged vertically when their 2-D footprints overlap by ≥20–30% across adjacent height strata.
A key parameter is the cluster tolerance, which controls how aggressively vertical segments are connected; TLS2trees recommends a value of 0.2 m for typical forest conditions. Stem-top detection is stabilized using fixed-height slices (0.5–2 m above ground), allowing robust identification of stem locations even under dense foliage. To avoid over-segmentation, the algorithm applies minimum cluster size filters, typically requiring >50–100 points per vertical segment, and uses height continuity checks to ensure segments belong to the same tree axis. The final 3D region-growing step expands each segmented stem into its neighboring crown region, using spatial proximity and a maximum expansion radius of 0.5–1.0 m, depending on the scan density. All parameters are explicitly designed to be species-agnostic and portable across datasets, enabling TLS2trees to operate at both plot and forest scales with consistent performance and without requiring retraining.

2.3. Accuracy Assessment of Segmentation

The outputs of each ITS method were validated against field measurements. A segmented tree that corresponds to a field-mapped tree is labeled a true positive (TP) (Figure 5a). Otherwise, when a tree is omission segmented as belonging to another nearby tree, the result is considered false negative (FN) (Figure 5b). When no individual tree exists but data points are segmented as belonging to one, the result is considered false positive (FP) (Figure 5c). Finally, we selected the best-performing individual tree segmentation method and compared its extracted tree height and DBH with field measurements via regression analysis.
In general, high TP together with low FP and low FN indicates better segmentation performance. Based on these counts, we compute tree detection rate (R), precision rate (P), and their harmonic mean (F) as:
R = T P T P + F N
P = T P T P + F P
F = 2 × R × P R + P

2.4. Field Measurements

To assess the accuracy of the TLS-derived metrics, we selected 10 representative trees in each plot and manually measured tree height (H), diameter at breast height (DBH), and crown diameter (CD). Tree height was measured with a Blume–Leiss altimeter (Harbin Optical Instrument Factory Ltd., Harbin, China), while DBH and CD were measured with a DBH tape and a measuring tape, respectively. In addition, the geographic coordinates of all trees in each plot were recorded with a handheld GPS receiver (GARMIN GPSMAP 65, Garmin Ltd., Olathe, KS, USA). A linear correlation analysis was performed between the TLS-derived and field-measured parameters using Origin (v. 2024b, OriginLab Corporation, Northampton, MA, USA) to quantify the consistency and accuracy of TLS measurements.

3. Results

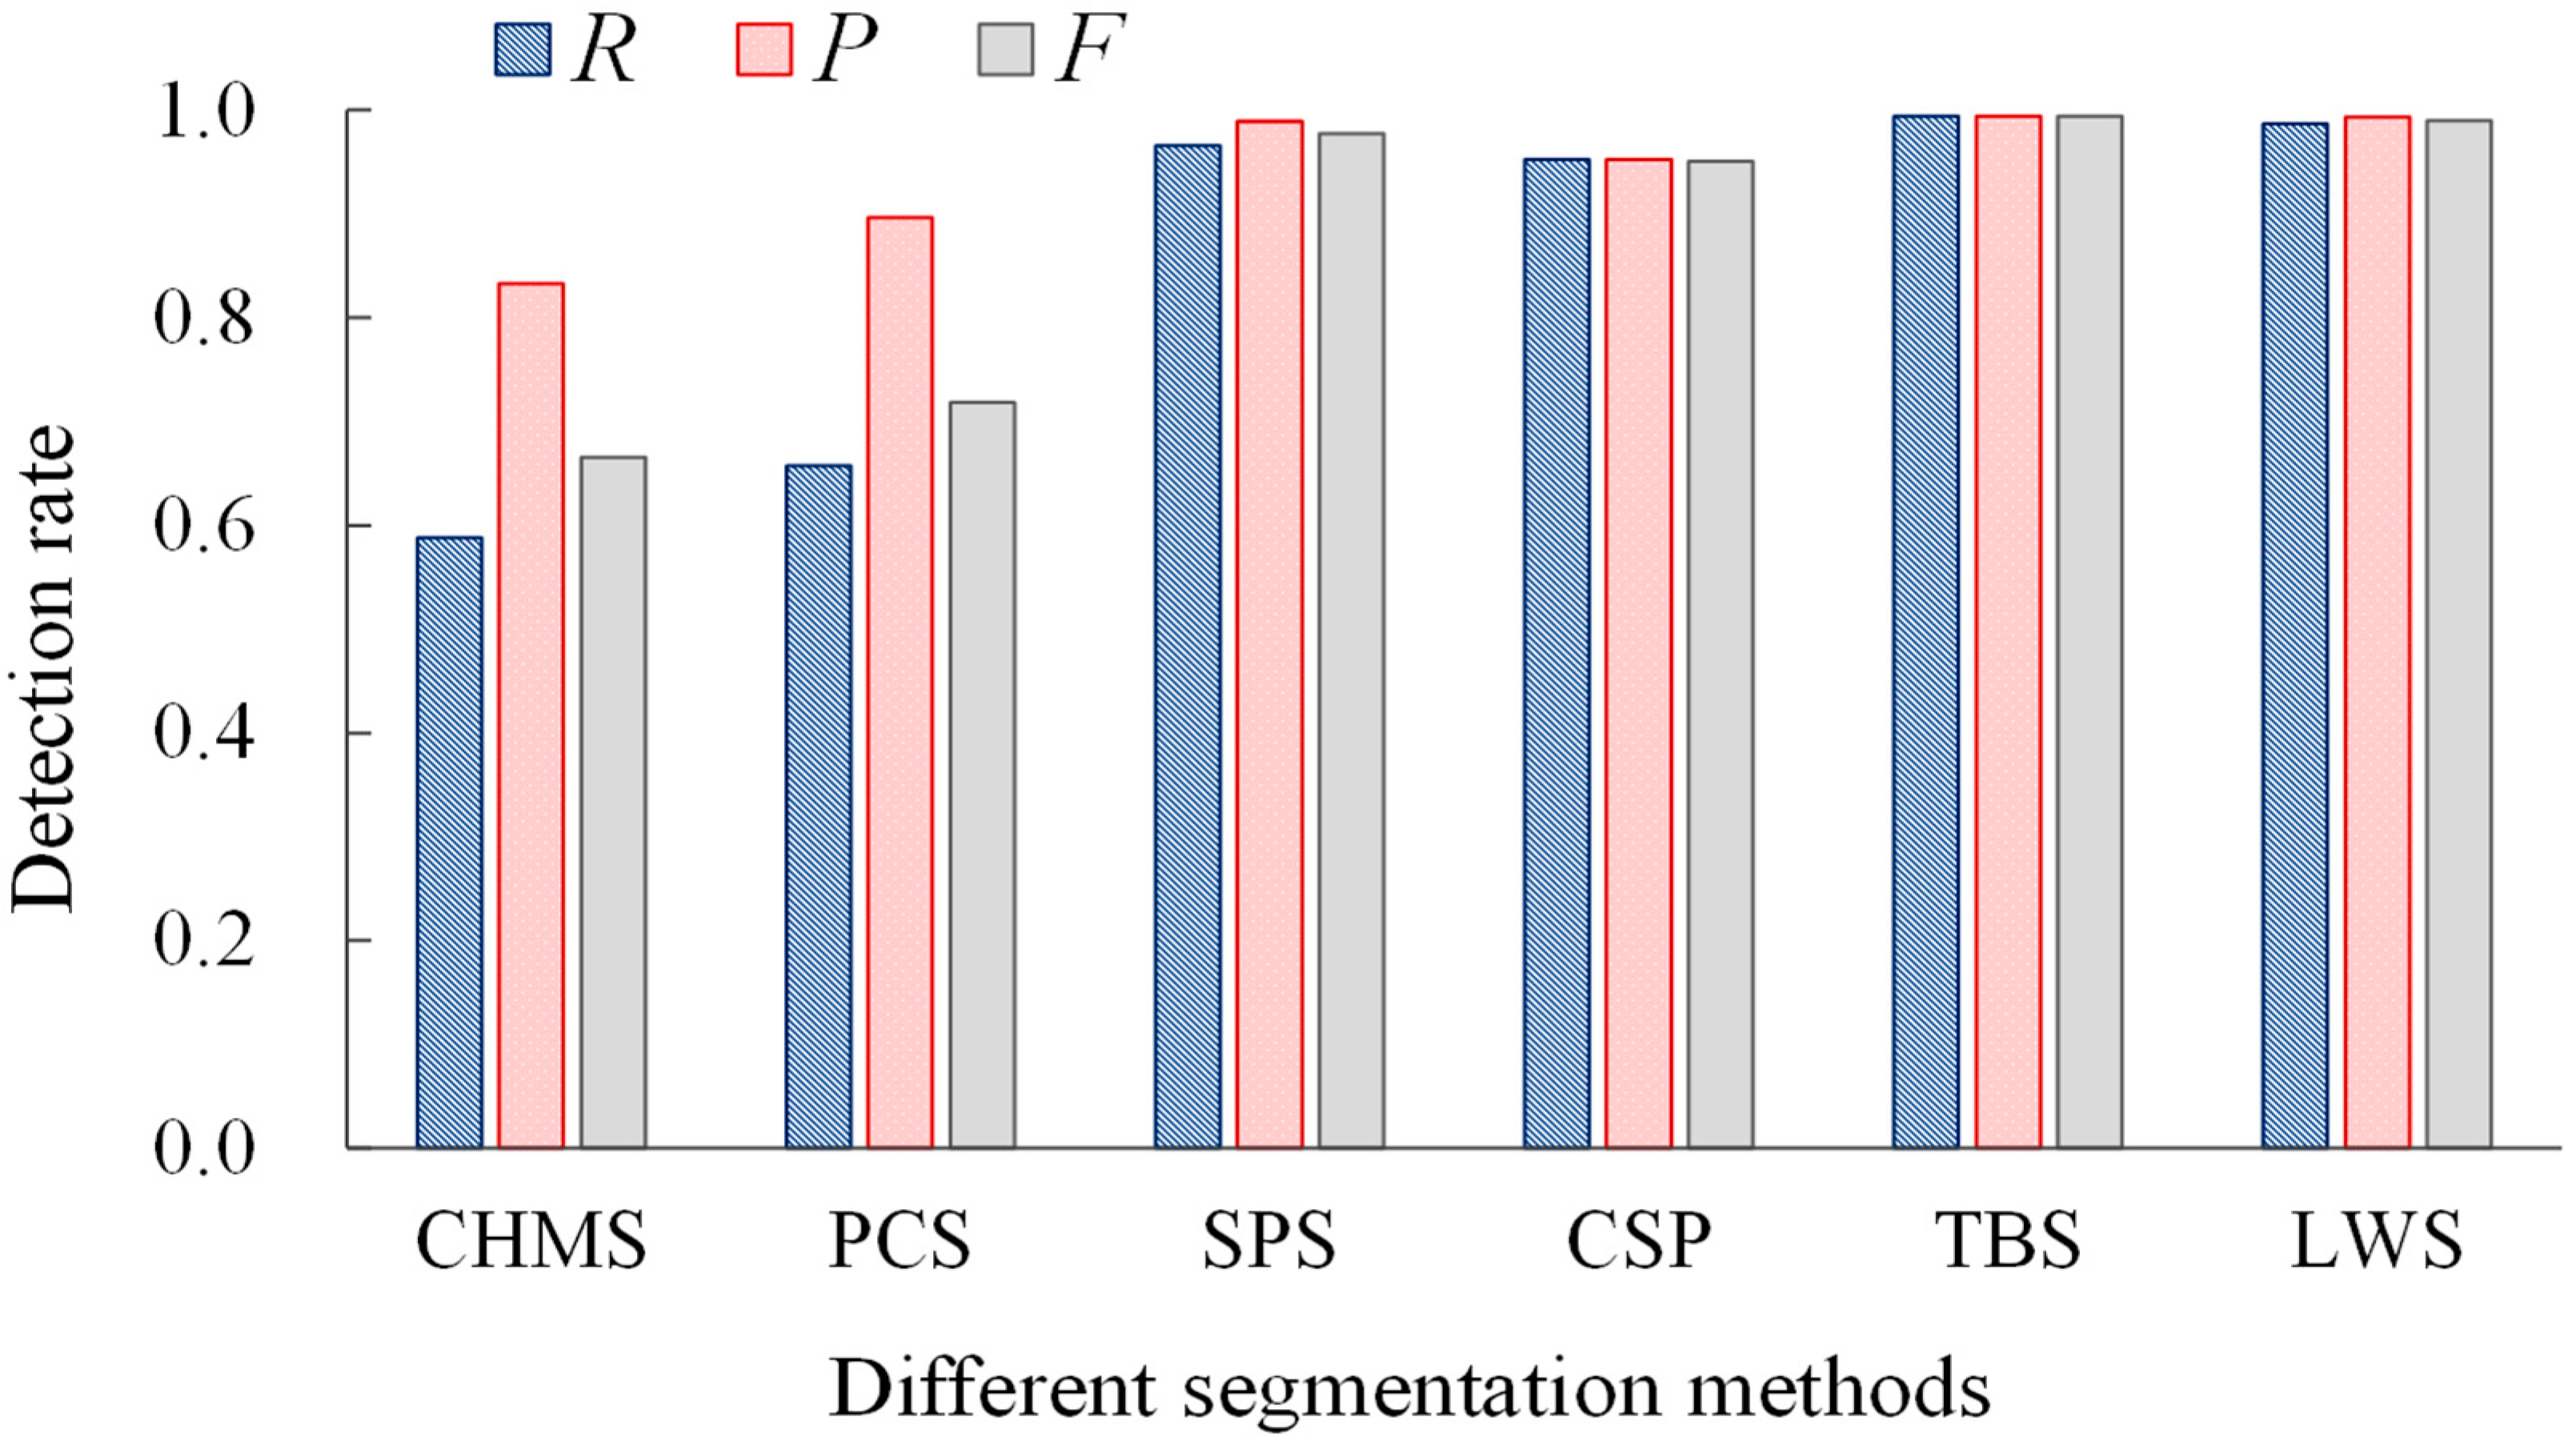
Across six plots (507 trees), the deep-learning trunk extraction-based segmentation (TBS) method achieved the highest overall mean F (0.99; TP = 497, FP = 3, FN = 3), with LWS narrowly trailing (F = 0.98, Figure 6). SPS also performed well (F = 0.97) but sometimes missed detections due to DBH-slice stem detection. In contrast, CSP achieved high detection but slightly lower precision (F = 0.95), primarily due to over-segmentation in clustered crowns (e.g., FP = 13 in A1, FP = 8 in A2). PCS and CHMS were vulnerable to crown overlap, exhibiting very low R values in the challenging A1–A2 plots (CHMS R = 0.49/0.18; PCS R = 0.30/0.19) and low mean F values (0.72, 0.67). However, in regular stands (A3, B2, B3), TBS and LWS both achieved perfect scores (F = 1.0), whereas PCS and CHMS improved but still lagged (max F ≈ 0.93 and 0.87, respectively). Overall, for TLS data in P. euphratica desert riparian forests, TBS and LWS are the most accurate and robust, while SPS serves as a fast alternative when stems are easily detected at breast height (Table 3).
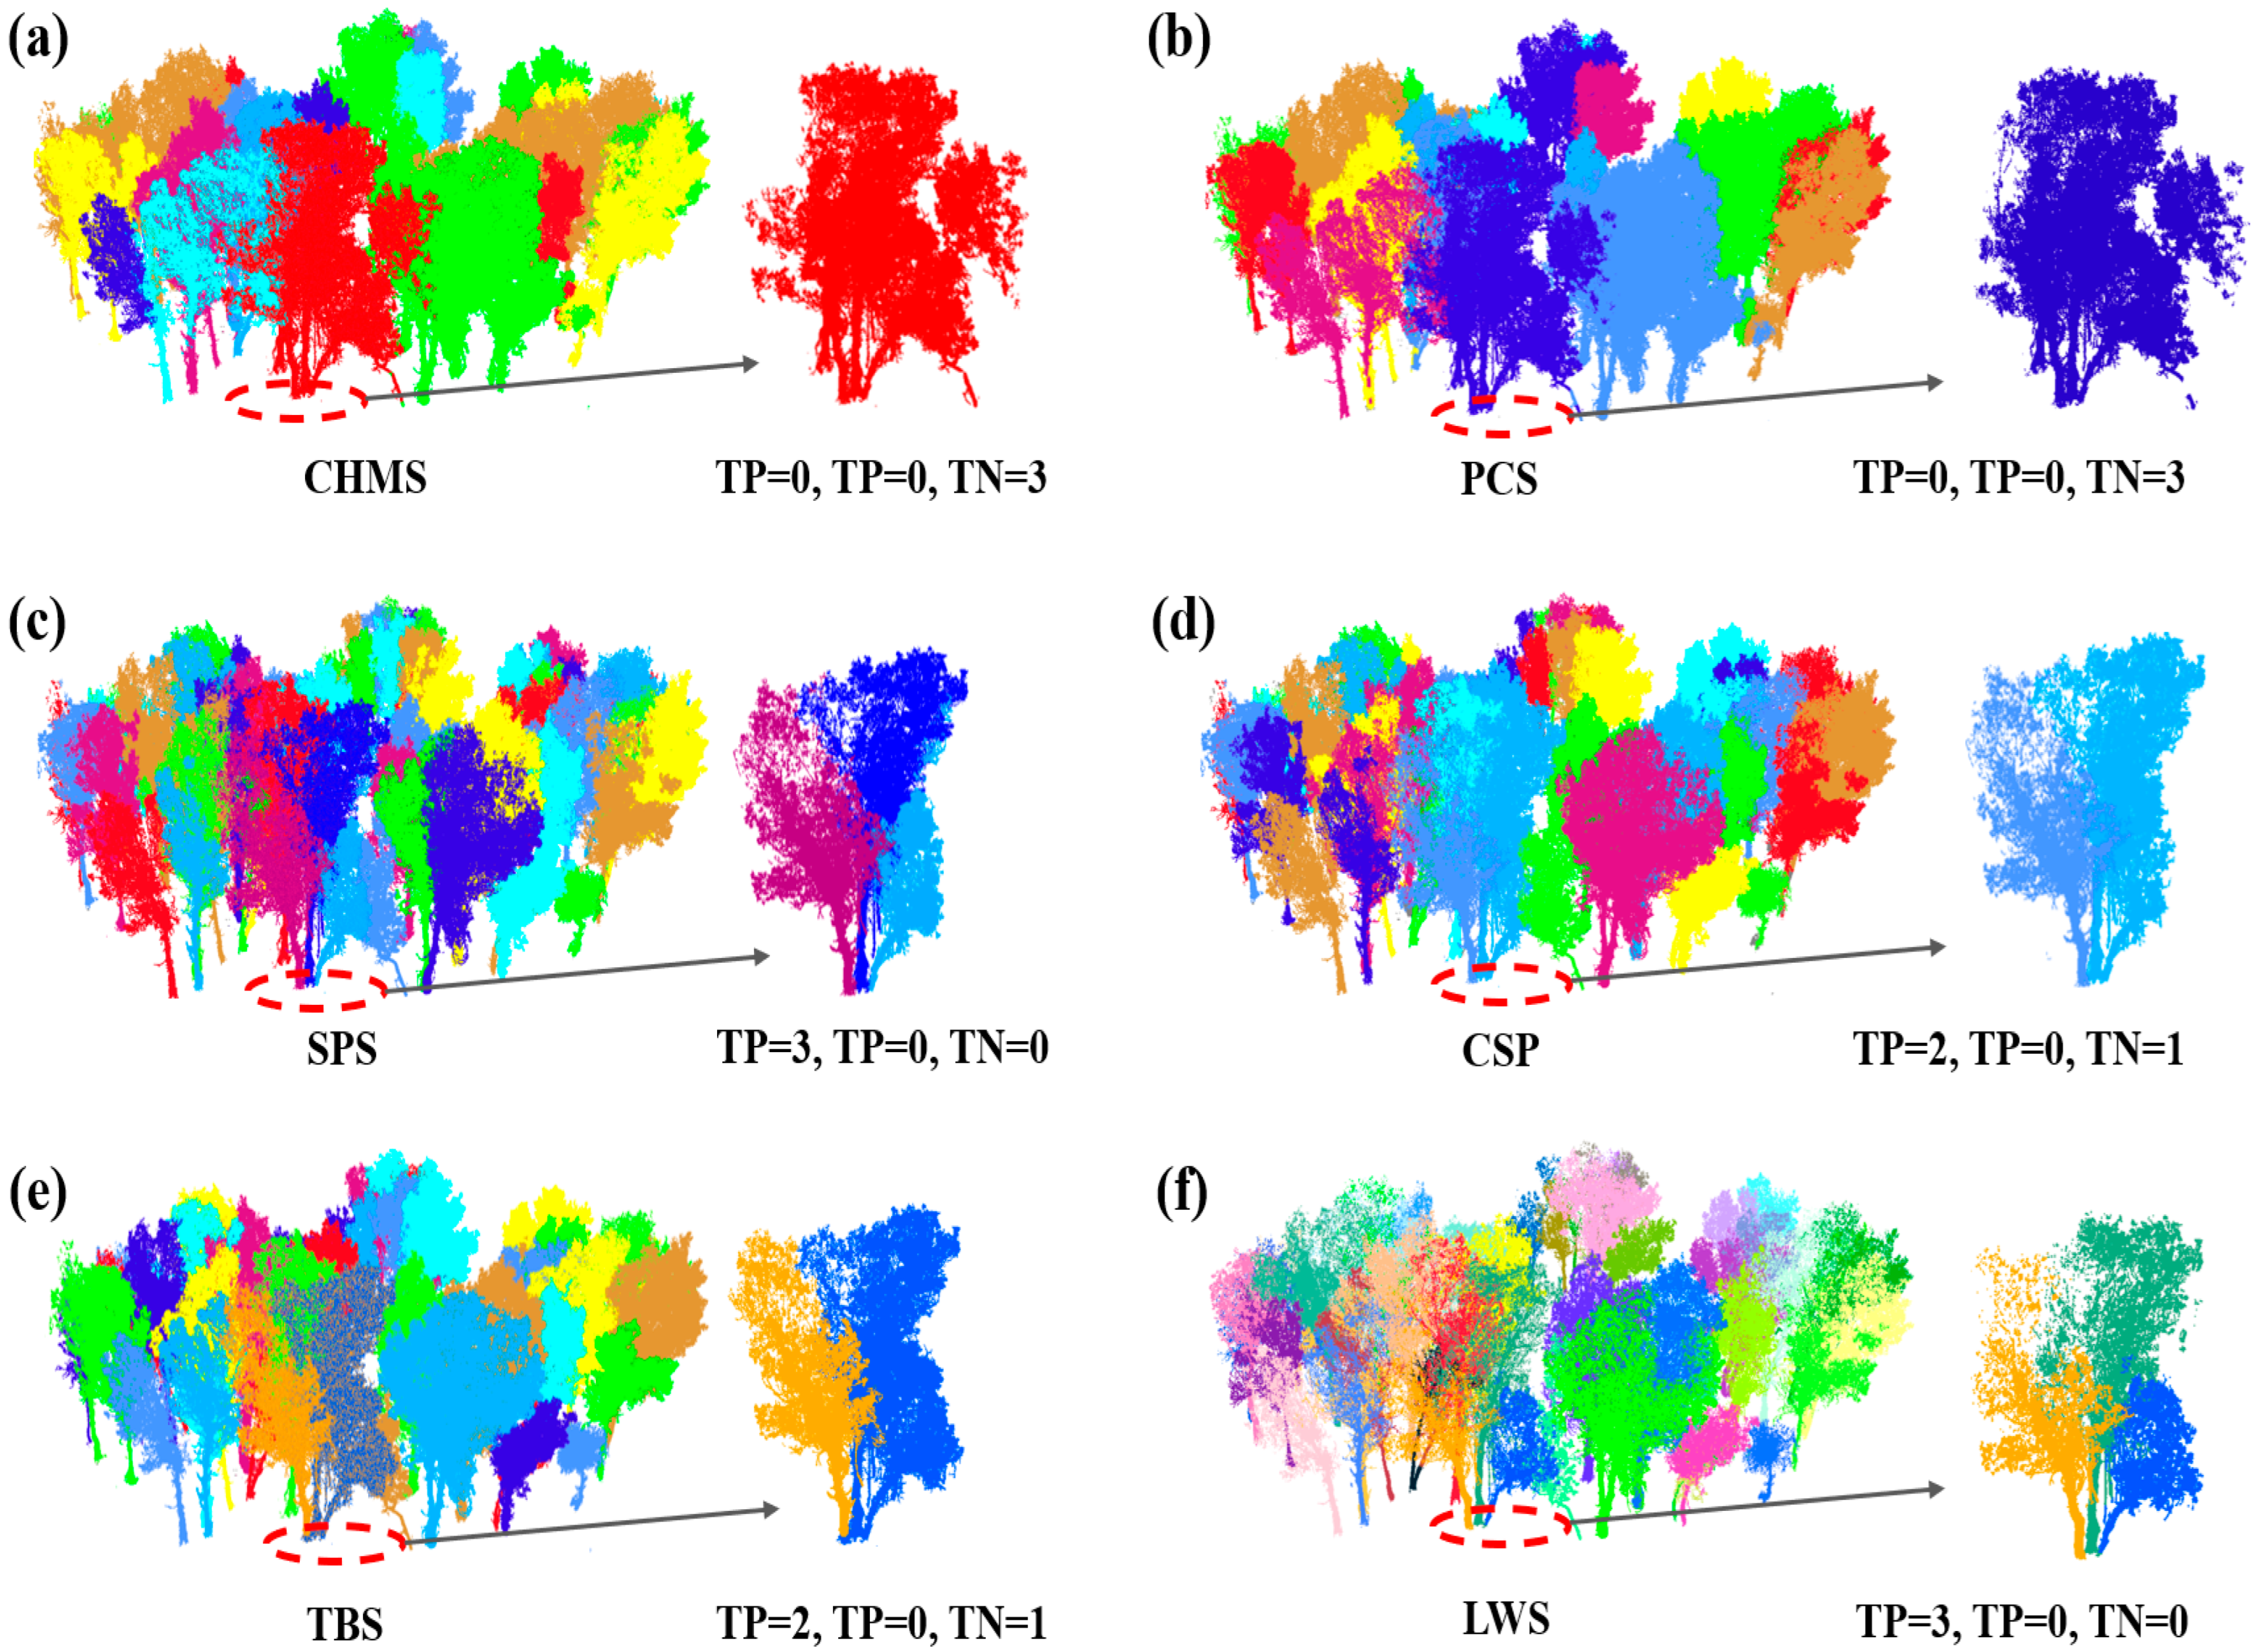
In clustered distributed P. euphratica stands, top-down canopy-surface approaches (CHMS, PCS) are under-segmented by merging adjacent, ambiguously separated crowns (Figure 7a,b). The seed-point strategy (SPS) achieves near-perfect delineation with reliable DBH-level seeds (Figure 7c), but this approach is labor-intensive as it requires prior manual or auxiliary detection of stem locations. Path-based CSP and trunk-based deep learning (TBS) methods improve crown boundary tracing and reduce commission errors (Figure 7d,e), but when stems are close, they still under-segment by assigning multiple crowns to one tree. In contrast, leaf–wood separation-based segmentation (LWS) delivers the most consistent results (Figure 7f): isolating woody points before crown assignment prevents crown fusion and yields complete, well-defined boundaries without clear misclassification. A practical caveat is computational cost—LWS is more efficient with point-cloud down-sampling, which does not visibly affect segmentation quality.
To evaluate the practical efficiency of the six ITS approaches, we measured the total processing time (preprocessing + segmentation) for a representative TLS plot of 1600 m2, containing approximately 35 million points, with 10,000–15,000 points per individual tree (approximately 10,000 points per square meter). All algorithms were executed on a standard desktop computer (Intel i7-12700K CPU, 32 GB RAM). The results show clear differences in computational demand. PCS was the fastest (20 min), followed by CHMS (30 min). CSP and the deep-learning-based TBS each required around 40 min. LWS took 60 min due to the additional leaf–wood classification, while SPS was the slowest (90 min), reflecting its iterative seed-point refinement. These efficiency benchmarks provide practical guidance for selecting suitable ITS tools under varying computational budgets and accuracy requirements.
Among the six single-tree segmentation methods tested, we selected the Trunk-Based Segmentation (TBS) and Leaf–Branch Separation (LWS) approaches for detailed evaluation because they provided the best balance between segmentation accuracy and computational efficiency. The SPS method also showed high accuracy but required substantial manual processing and was therefore excluded from further analysis. Figure 8 shows the spatial comparison of LWS-derived stem positions align more closely with ground-measured locations than those from TBS, and both methods achieve generally good agreement with the field-measured tree positions.
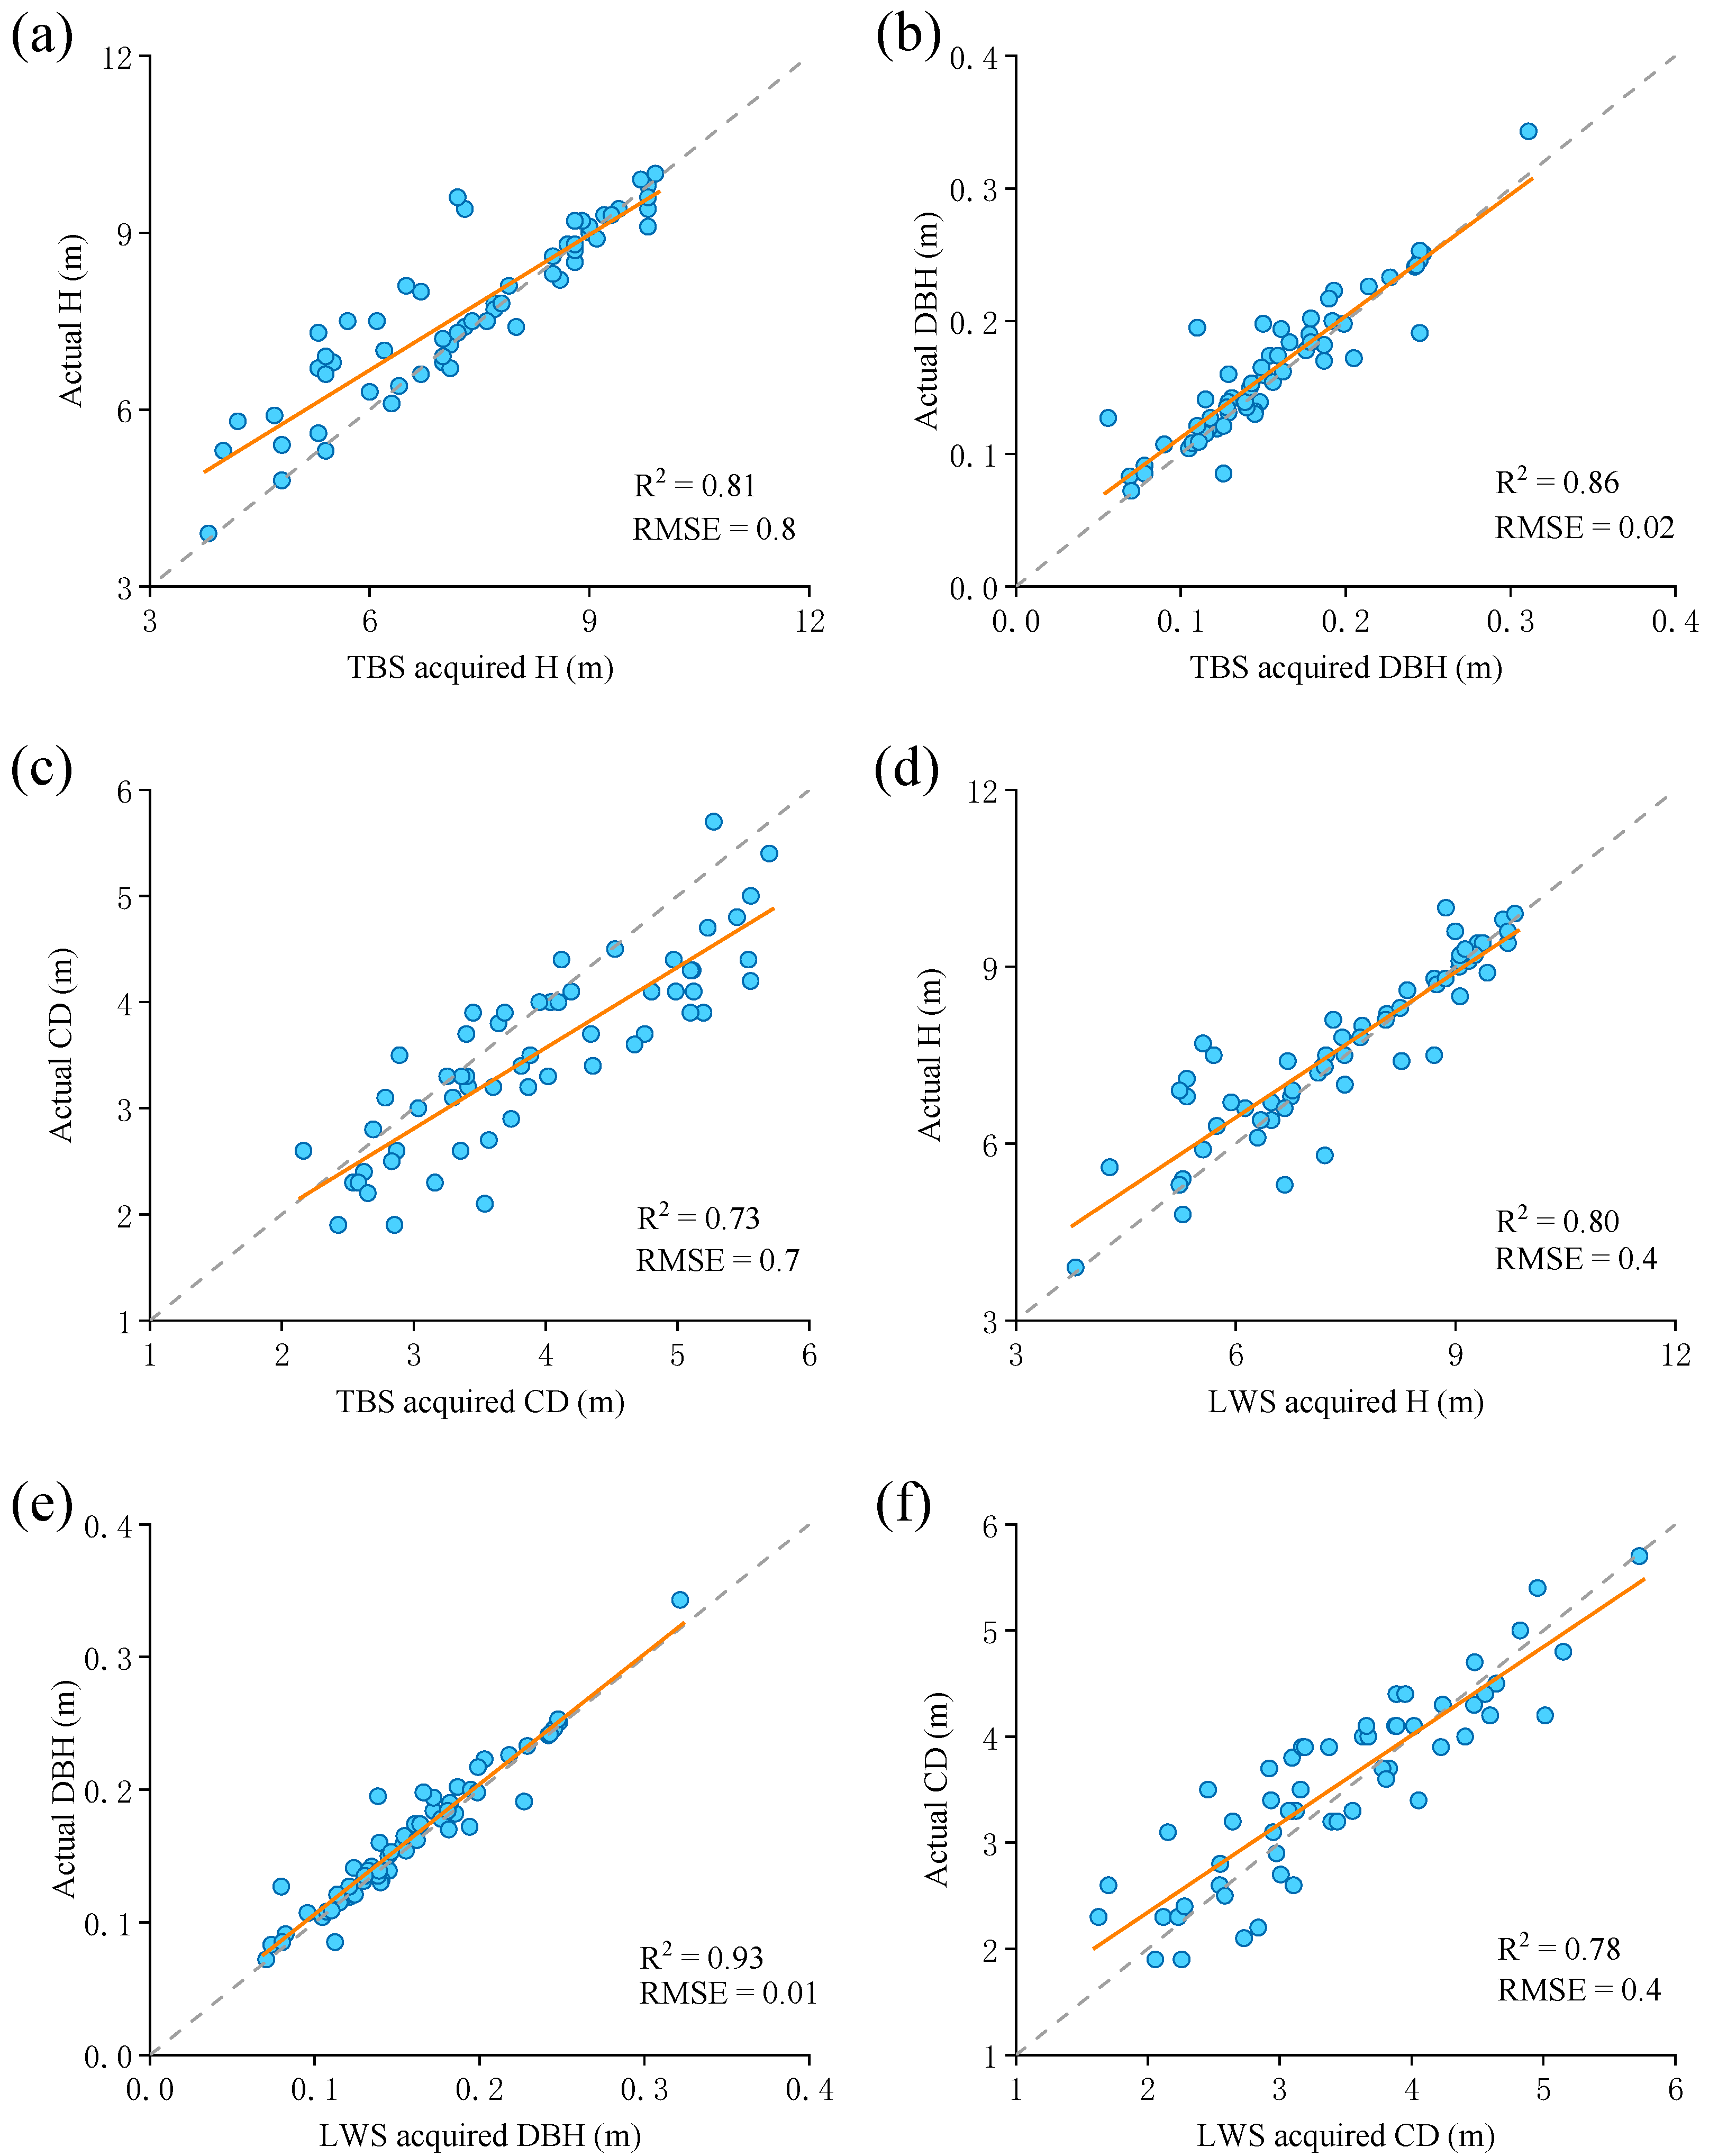
The accuracy assessment against field measurements shows that both TBS and LWS provide reliable estimates of tree structural attributes (Figure 9). DBH exhibited the highest accuracy, with R2 values of 0.86 for TBS and 0.93 for LWS (Figure 9b,e). Tree height was also well retrieved by both methods (R2 = 0.80, Figure 9a,d), although a slightly wider spread was observed due to the difficulty of capturing tree tops in TLS data.
Crown delineation is the most critical component of single-tree segmentation. In field surveys, it is not feasible to measure the exact crown projection area; only the mean crown diameter can be reliably obtained. Therefore, the crown diameter was used as an indirect indicator to evaluate the crown segmentation accuracy of the two methods. The results show that both methods achieved R2 values greater than 0.7 (Figure 9c,f). LWS achieved slightly higher accuracy than TBS, suggesting that identifying internal branch structures improves the precision of crown boundary extraction. Overall, both methods showed regression lines close to the 1:1 line, indicating minimal systematic bias. LWS offers a moderate advantage in crown delineation and provides the most accurate DBH estimates.

4. Discussion

Individual-tree identification is fundamental for forest inventory and monitoring [36]. We benchmarked six segmentation approaches using TLS data from P. euphratica desert riparian stands: CHMS, PCS, SPS, CSP, a trunk-based deep-learning method (TBS), and a leaf–wood separation method (LWS). Their performance on identical point clouds differed markedly (Table 3). TBS and LWS performed best, both yielding a mean F ≈ 0.99, with precision and recall ≥ 0.98 across plots. In three plots, both reached a value of F = 1.0. SPS also performed well (F ≈ 0.97) but sometimes missed trees when stem detection at the DBH slice failed. CSP achieved high recall but lower precision (F ≈ 0.95), reflecting over-segmentation in clustered crowns. PCS and CHMS were highly sensitive to crown overlap, showing very low recall in challenging plots A1–A2 (CHMS R = 0.49/0.18; PCS R = 0.30/0.19) and the lowest mean F (≈0.71 and 0.67). These outcomes are consistent with the mechanics of each method. TBS anchors segmentation on reliably detected stems, while LWS isolates the woody skeleton before assigning foliage, both reducing errors from crown interpenetration and clumped growth. In contrast, CHMS (2-D, grid-based) and PCS (assumes inter-tree gaps) are more likely to merge or omit trees when crowns overlap, and CSP’s path-based assignment sometimes admits neighboring crowns. In summary, TBS or LWS are preferred for TLS-based mapping of P. euphratica. SPS is a viable alternative when DBH-slice stems are well detected. CHMS and PCS are not recommended for dense, highly overlapping stands.
The inconsistency across methods stems from fundamentally different segmentation paradigms [51]. CHMS and PCS employ a top-down, canopy-driven strategy, where they locate treetops and grow crowns downward. SPS and the deep-learning TBS are bottom-up and stem-anchored. LWS separates leaf and wood before instance segmentation. CSP assigns points to stems by shortest-path costs. Top-down approaches are sensitive to crown shape and overlap. Diffuse or multi-apex crowns and sub-canopy individuals make treetop localization uncertain [21]. Uneven point density or occlusion further degrades clustering [52,53]. These factors explain why CHMS and PCS have low recall in the most clustered plots (A1–A2; CHMS R = 0.49/0.18; PCS R = 0.30/0.19) and more false negatives (CHMS FN = 126; PCS FN = 101 across all plots). In contrast, stem-anchored methods mitigate crown interpenetration. TBS had the most balanced errors (TP = 497, FP = 3, FN = 3; F ≈ 0.99), and LWS performed similarly well (TP = 492, FP = 3, FN = 7; F ≈ 0.99). SPS also performed well (TP = 461, FN = 17; F ≈ 0.97), although occasional omissions occurred when the 1.3-m slice had few stem returns, and commissions were made for multi-stem trees or large lateral branches that the method treated as stems. CSP showed high recall but lower precision (TP = 452, FP = 23; F ≈ 0.95) due to path-cost leakage, which allows neighboring crowns to be included in tightly packed areas. Overall, these results show that bottom-up stem constraints (TBS) and leaf–wood first pipelines (LWS) are most robust for P. euphratica TLS data. CHMS/PCS often omit trees under crown overlap, and CSP needs stronger regularization to suppress over-segmentation.
Secondly, method performance depends on the stand structure. The algorithm choice should match the application’s objective and structural context [54]. In our monospecific P. euphratica stands, clumped growth and overlapping crowns strongly affected processing. CHMS and PCS rely on top-down canopy cues and lose significant accuracy when neighboring crowns intersect. Indistinct boundaries and partially visible over-topped crowns made treetop localization unreliable, causing omissions. This limitation is consistent with prior work: CHM-based approaches work best in conifer forests with well-defined crowns [55,56], but degrade in broadleaf and mixed stands. PCS also lacks explicit constraints to separate interpenetrating canopies, which depresses recall and segmentation quality [14]. In contrast, stem-anchored or leaf–wood first pipelines (e.g., TBS, LWS) are less sensitive to crown overlap. They constrain the assignment around detected stems or the woody skeleton. These points indicate that the segmentation method is dependent on vegetation type and growth form. Site-specific priors—forest type, species, stem density, mean inter-tree spacing, and crown width/overlap—should be locally calibrated to optimize segmentation.
Studies focusing on individual-tree identification in arid and semi-arid ecosystems remain comparatively limited, particularly for sparsely distributed desert riparian species such as P. euphratica. Existing research in these regions has predominantly relied on very-high-resolution (VHR) satellite imagery combined with deep learning to delineate individual crowns. For example, Wang et al. [57] developed a constrained 2-D bin-packing framework that integrates semantic segmentation and template matching to detect over 22,000 individual P. euphratica trees from WorldView-2 imagery in sparse desert forests of the Tarim Basin, achieving F-scores of 0.87–0.90 across varying levels of crown clustering. At broader spatial scales, Tucker et al. [58] mapped nearly 10 billion individual dryland trees across sub-Saharan Africa using 50-cm commercial satellite imagery and neural networks, demonstrating the feasibility of large-scale individual-tree extraction in open dryland ecosystems where trees are spatially isolated and crown shadows are well defined. These studies highlight that remote sensing in arid regions benefits from low canopy cover and reduced occlusion, making satellite-based individual tree delineation an effective approach for monitoring tree distribution, carbon stocks, and restoration outcomes.
However, despite the rapid development of satellite-based individual tree detection, research on high-precision, ground-based LiDAR individual tree segmentation in arid ecosystems remains scarce. Unlike VHR imagery, TLS captures detailed three-dimensional crown and stem structure, providing the ground-truth reference necessary for validating large-scale satellite products, refining model generalization, and calibrating species-specific segmentation algorithms. Therefore, advancing TLS-based segmentation methods in desert riparian forests not only fills a methodological gap but also provides essential high-quality reference data for optimizing and validating large-area, satellite-based tree-mapping frameworks.
This study also has some limitations. (1) The field of individual-tree segmentation is developing rapidly, yet our comparison includes only six commonly used algorithms. Many recently proposed and highly competitive methods—such as SegmentAnyTree, ForAINet, Point2Trees, YOLOv5-CHM, and Vision-Transformer-based frameworks—were not incorporated into the present benchmark. Future studies should expand the evaluation to a broader suite of classical, deep learning, and foundation-model-driven ITS approaches to provide a more comprehensive assessment. (2) Our analysis is based solely on static terrestrial LiDAR. With the increasing deployment of handheld LiDAR, backpack/mobile systems, and UAV-borne LiDAR in arid ecosystems, it is necessary to evaluate how these platforms perform for P. euphratica and other desert tree species under varying point densities, occlusion patterns, and acquisition geometries. Developing robust multi-platform segmentation workflows and cross-sensor harmonization strategies will be essential for supporting future operational monitoring and for integrating TLS-derived structural priors into UAV- or satellite-level individual-tree detection.

5. Conclusions

This study evaluated six individual-tree segmentation methods using TLS data from Populus euphratica desert riparian forests. The trunk-based deep learning approach (TBS) and the leaf–wood separation method (LWS) achieved the highest overall accuracy (mean F ≈ 0.98–0.99). This confirms our hypothesis that stem-anchored and leaf–wood first pipelines are inherently more robust than canopy-surface-based techniques in stands with strong crown overlap. TBS showed stable performance across heterogeneous crown structures. LWS provided the most accurate structural estimates—especially DBH and crown diameter—due to its ability to utilize detailed internal crown and branch information captured by TLS. In contrast, CHMS and PCS were highly sensitive to crown interpenetration. SPS and CSP exhibited intermediate performance, restricted by the quality of stem detection and crown proximity. Overall, the results indicate that TBS and LWS represent the most reliable strategies for high-precision, TLS-based individual-tree mapping. These approaches support accurate forest inventory, structural assessment, and restoration monitoring in arid riparian ecosystems.

Author Contributions

A.Y. and Ü.H.: Conceived the ideas and designed the methodology; A.A.: Field investigation; A.Y.: writing—original draft preparation; X.H. and M.K.: Assisted with data analysis; Ü.H. and S.T.: Led the writing of the manuscript. All authors have read and agreed to the published version of the manuscript.

Funding

This study was supported by the National Natural Science Foundation of China [32260285, 32471554], the Postdoctoral Fellowship Program of CPSF [GZC20230067], China Postdoctoral Science Foundation [2024M750066], and the Third Xinjiang Scientific Expedition and Research Program [2022xjkk0301].

Data Availability Statement

The TLS data are freely available from LiDARNET (https://lidar.pku.edu.cn, accessed on 25 November 2025).

Acknowledgments

We sincerely thank the Xinjiang LiDAR Applied Engineering Technology Center for providing TLS equipment support for this study.

Conflicts of Interest

The authors declare no conflicts of interest.

Abbreviations

The following abbreviations are used in this manuscript:
CHMSCanopy height model-based segmentation
PCSCrown top point cloud segmentation
CSPComparative short path algorithm segmentation
TBSDeep learning trunk extraction-based segmentation
LWSLeaf–wood separation-based segmentation

References

  1. Wang, S.; Chen, B.; Li, H. Euphrates Poplar Forest, 1st ed.; Zhang, X., Ed.; China Environmental Science Press: Beijing, China, 1995; pp. 19–30. [Google Scholar]
  2. Buras, A.; Thevs, N.; Zerbe, S.; Wilmking, M. Productivity and carbon sequestration of Populus euphratica at the Amu River, Turkmenistan. Forestry 2013, 86, 429–439. [Google Scholar] [CrossRef]
  3. Thomas, F.; Lang, P. Growth and water relations of riparian poplar forests under pressure in Central Asia’s Tarim River Basin. River Res. Appl. 2021, 37, 233–240. [Google Scholar] [CrossRef]
  4. Li, J.; Yu, B.; Zhao, C.; Nowak, R.S.; Zhao, Z.; Sheng, Y.; Li, J. Physiological and morphological responses of Tamarix ramosissima and Populus euphratica to altered groundwater availability. Tree Physiol. 2013, 33, 57–68. [Google Scholar] [CrossRef]
  5. Gärtner, P.; Foerster, M.; Kleinschmit, B. The benefit of synthetically generated RapidEye and Landsat 8 data fusion time series for riparian forest disturbance monitoring. Remote Sens. Environ. 2016, 177, 237–247. [Google Scholar] [CrossRef]
  6. Halik, Ü.; Aishan, T.; Betz, F.; Kurban, A.; Rozi, A. Effectiveness and challenges of ecological engineering for desert riparian forest restoration along China’s largest inland river. Ecol. Eng. 2018, 127, 11–22. [Google Scholar] [CrossRef]
  7. Keram, A.; Halik, Ü.; Keyimu, M.; Aishan, T.; Mamat, Z.; Rouzi, A. Gap Dynamics of Natural Populus euphratica Floodplain Forests Affected by Hydrological Alteration Along the Tarim River: Implications for Restoration of the Riparian Forests. For. Ecol. Manag. 2019, 438, 103–113. [Google Scholar] [CrossRef]
  8. Arkin, A.; Yusup, A.; Halik, Ü.; Abliz, A.; Ainiwaer, A.; Tian, A.; Mijiti, M. Unveiling population structure dynamics of Populus euphratica riparian forests along the Tarim River using terrestrial LiDAR. Forests 2025, 16, 368. [Google Scholar] [CrossRef]
  9. Keyimu, M.; Halik, Ü.; Betz, F.; Dulamsuren, C. Vitality variation and population structure of a riparian forest in the lower reaches of the Tarim River, NW China. J. For. Res. 2017, 29, 749–760. [Google Scholar] [CrossRef]
  10. Wei, Z.C.; Halik, Ü.; Aishan, T.; Abliz, A.; Welp, M. Spatial distribution patterns of trunk internal decay of Euphrates poplar riparian forest along the Tarim River, northwest China. For. Ecol. Manag. 2022, 522, 120434. [Google Scholar] [CrossRef]
  11. Peng, Y.; He, G.J.; Wang, G.Z. Spatial–temporal analysis of changes in Populus euphratica distribution in the Tarim National Nature Reserve over the past 60 years. Int. J. Appl. Earth Obs. Geoinf. 2022, 113, 103000. [Google Scholar] [CrossRef]
  12. Gärtner, P.; Förster, M.; Kurban, A.; Kleinschmit, B. Object-based change detection of Central Asian Tugai vegetation with very high spatial resolution satellite imagery. Int. J. Appl. Earth Obs. Geoinf. 2014, 31, 110–121. [Google Scholar] [CrossRef]
  13. Ling, H.B.; Zhang, P.; Guo, B.; Xu, H.L.; Ye, M.; Deng, X.Y. Negative feedback adjustment challenges reconstruction study from tree rings: A case study of the response of Populus euphratica to river discontinuous flow and ecological water conveyance. Sci. Total Environ. 2017, 574, 109–119. [Google Scholar] [CrossRef]
  14. Liu, Q.; Ma, W.; Zhang, J.; Liu, Y.; Xu, D.; Wang, J. Point-cloud segmentation of individual trees in complex natural forest scenes based on a trunk-growth method. J. For. Res. 2021, 32, 2403–2414. [Google Scholar] [CrossRef]
  15. Wang, D. Unsupervised semantic and instance segmentation of forest point clouds. ISPRS J. Photogramm. Remote Sens. 2020, 165, 86–97. [Google Scholar] [CrossRef]
  16. Cherlet, W.; Dayal, K.; Chen, S.; Cooper, Z.; Disney, M.; Hanzl, A.; Levick, S.; Nightingale, J.; Origo, N.; Senf, C.; et al. Benchmarking tree instance segmentation of terrestrial laser scanning point clouds. ISPRS J. Photogramm. Remote Sens. 2026, 231, 230–247. [Google Scholar] [CrossRef]
  17. Mamat, Z.; Halik, Ü.; Keyimu, M.; Keram, A.; Nurmamat, K. Variation of the floodplain forest ecosystem service value in the lower reaches of the Tarim River, China. Land. Degrad. Dev. 2017, 29, 47–57. [Google Scholar] [CrossRef]
  18. Li, H.; Shi, Q.D.; Wan, Y.B.; Shi, H.B.; Imin, B. Using Sentinel-2 images to map the Populus euphratica distribution based on the spectral difference acquired at the key phenological stage. Forests 2021, 12, 147. [Google Scholar] [CrossRef]
  19. Ayrey, E.; Fraver, S.; Kershaw, J.; Kenefic, L.; Hayes, D.; Weiskittel, A.; Roth, B. Layer stacking: A novel algorithm for individual forest tree segmentation from LiDAR point clouds. Can. J. Remote Sens. 2017, 43, 16–27. [Google Scholar] [CrossRef]
  20. Guo, Q.H.; Su, Y.J.; Hu, T.Y. (Eds.) LiDAR Principles, Processing, and Applications in Forest Ecology, 1st ed.; Higher Education Press: Beijing, China, 2018; pp. 111–129. [Google Scholar]
  21. Reitberger, J.; Schnörr, C.; Krzystek, P.; Stilla, U. 3D segmentation of single trees exploiting full-waveform LiDAR data. ISPRS J. Photogramm. Remote Sens. 2009, 64, 561–574. [Google Scholar] [CrossRef]
  22. Calders, K.; Adams, J.; Armston, J.; Bartholomeus, H.; Bauwens, S.; Bentley, L.P.; Chave, J.; Danson, F.M.; Demol, M.; Disney, M.; et al. Terrestrial laser scanning in forest ecology: Expanding the horizon. Remote Sens. Environ. 2020, 251, 112102. [Google Scholar] [CrossRef]
  23. Maeda, E.E.; Brede, B.; Calders, K.; Disney, M.; Herold, M.; Lines, E.R.; Nunes, M.H.; Raumonen, P.; Rautiainen, M.; Saarinen, N.; et al. Expanding forest research with terrestrial LiDAR technology. Nat. Commun. 2025, 16, 8853. [Google Scholar] [CrossRef]
  24. Yusup, A.; Halik, Ü.; Abliz, A.; Aishan, T.; Keyimu, M.; Wei, J. Population structure and spatial distribution pattern of Populus euphratica riparian forest under environmental heterogeneity along the Tarim River, Northwest China. Front. Plant Sci. 2022, 13, 844819. [Google Scholar] [CrossRef]
  25. Hu, B.; Li, J.; Jing, L.; Judah, A. Improving the efficiency and accuracy of individual tree crown delineation from high-density LiDAR data. Int. J. Appl. Earth Obs. Geoinf. 2014, 26, 145–155. [Google Scholar] [CrossRef]
  26. Raumonen, P.; Casella, E.; Calders, K.; Murphy, S.; Åkerblom, M.; Kaasalainen, M. Massive-scale tree modelling from TLS data. ISPRS Ann. Photogramm. Remote Sens. Spat. Inf. Sci. 2015, 2, 189–196. [Google Scholar] [CrossRef]
  27. Trochta, J.; Krucek, M.; Vrska, T.; Kral, K. 3D Forest: An application for descriptions of three-dimensional forest structures using terrestrial LiDAR. PLoS ONE 2017, 12, e0176871. [Google Scholar] [CrossRef] [PubMed]
  28. Burt, A.; Disney, M.; Calders, K.; Goslee, S. Extracting individual trees from LiDAR point clouds using treeseg. Methods Ecol. Evol. 2018, 10, 438–445. [Google Scholar] [CrossRef]
  29. Yrttimaa, T.; Saarinen, N.; Kankare, V.; Liang, X.; Hyyppä, J.; Holopainen, M.; Vastaranta, M. Investigating the feasibility of multi-scan terrestrial laser scanning to characterize tree communities in southern boreal forests. Remote Sens. 2019, 11, 1423. [Google Scholar] [CrossRef]
  30. Hui, Z.; Jin, S.; Li, D.; Ziggah, Y.Y.; Liu, B. Individual tree extraction from terrestrial LiDAR point clouds based on transfer learning and Gaussian mixture model separation. Remote Sens. 2021, 13, 223. [Google Scholar] [CrossRef]
  31. Hui, Z.; Cheng, P.; Yang, B.; Zhou, G. Multi-level self-adaptive individual tree detection for coniferous forest using airborne LiDAR. Int. J. Appl. Earth Obs. Geoinf. 2022, 114, 103028. [Google Scholar] [CrossRef]
  32. Yun, J.; Hou, A.; Chen, J.; Li, X. Rubber tree crown segmentation and property retrieval using ground-based mobile LiDAR after natural disturbances. Remote Sens. 2019, 11, 903. [Google Scholar] [CrossRef]
  33. Li, W.; Guo, Q.; Jakubowski, M.; Kelly, M. A new method for segmenting individual trees from the LiDAR point cloud. Photogramm. Eng. Remote Sens. 2012, 78, 75–84. [Google Scholar] [CrossRef]
  34. Tao, S.; Guo, Q.; Li, L.; Xue, B.; Kelly, M.; Li, W.; Xu, G.; Su, Y. Airborne LiDAR-derived volume metrics for aboveground biomass estimation: A comparative assessment for conifer stands. Agric. For. Meteorol. 2014, 198, 24–32. [Google Scholar] [CrossRef]
  35. Lu, X.; Guo, Q.; Li, W.; Flanagan, J. A bottom-up approach to segment individual deciduous trees using leaf-off LiDAR point cloud data. ISPRS J. Photogramm. Remote Sens. 2014, 94, 1–12. [Google Scholar] [CrossRef]
  36. Wang, D.; Liang, X.; Mofack, G.; Martin-Ducup, O. Individual tree extraction from terrestrial laser scanning data via graph pathing. For. Ecosyst. 2021, 8, 67. [Google Scholar] [CrossRef]
  37. Tao, S.; Wu, F.; Guo, Q.; Wang, Y.; Li, W.; Xue, B.; Hu, X.; Li, P.; Tian, D.; Li, C.; et al. Segmenting tree crowns from terrestrial and mobile LiDAR data by exploring ecological theories. ISPRS J. Photogramm. Remote Sens. 2015, 110, 66–76. [Google Scholar] [CrossRef]
  38. Wiehle, M.; Eusemann, P.; Thevs, N.; Schnittler, M. Root suckering patterns in Populus euphratica (Euphrates poplar, Salicaceae). Trees 2009, 23, 991–1001. [Google Scholar] [CrossRef]
  39. Hoppe, J.H.; Zhang, X.; Thomas, F.M. Below-ground inter-ramet water transport capacity in Populus euphratica, a Central-Asian desert phreatophyte. Plant Biol. 2019, 21, 1003–1012. [Google Scholar] [CrossRef]
  40. Kottek, M.; Grieser, J.; Beck, C.; Rudolf, B.; Rubel, F. World map of the Köppen–Geiger climate classification updated. Meteorol. Z. 2006, 15, 259–263. [Google Scholar] [CrossRef] [PubMed]
  41. Thomas, F.; Jeschke, M.; Zhang, X.; Lang, P. Stand structure and productivity of Populus euphratica along a gradient of groundwater distances at the Tarim River (NW China). J. Plant Ecol. 2016, 10, 753–764. [Google Scholar] [CrossRef]
  42. Kurban, A.; Xu, H.L.; Halik, Ü.; Wubuli, W.; Jappar, T.; Yang, P.N. Theory and Practice of Ecosystem Restoration in the Lower Tarim River, 1st ed.; Lin, H., Ed.; Xinjiang Science and Technology Press: Urumqi, China, 2019; pp. 50–69. [Google Scholar]
  43. Yusup, A.; Hu, X.; Halik, Ü.; Aishan, T.; Keyimu, M.; Bai, H.; Tao, S. Developing new allometric models for estimating aboveground woody biomass and volume of Populus euphratica using terrestrial laser scanning. J. Remote Sens. 2025, 5, 0697. [Google Scholar] [CrossRef]
  44. Yusup, A.; Halik, Ü.; Keyimu, M.; Aishan, T.; Abliz, A.; Dilixiati, B.; Wei, J. Trunk volume estimation of irregular-shaped Populus euphratica riparian forest using TLS point cloud data and multivariate prediction models. For. Ecosyst. 2023, 10, 100082. [Google Scholar] [CrossRef]
  45. Hyyppa, J.; Kelle, O.; Lehikoinen, M.; Inkinen, M. A segmentation-based method to retrieve stem volume estimates from 3-D tree height models produced by laser scanners. IEEE Trans. Geosci. Remote Sens. 2001, 39, 969–975. [Google Scholar] [CrossRef]
  46. Chen, Q.; Baldocchi, D.; Gong, P.; Kelly, M. Isolating individual trees in a savanna woodland using small-footprint LiDAR data. Photogramm. Eng. Remote Sens. 2006, 72, 923–932. [Google Scholar] [CrossRef]
  47. Hough, B.P. Methods and Means for Recognizing Complex Patterns. U.S. Patent US3069654A, 18 December 1962. [Google Scholar]
  48. López Serrano, F.R.; Rubio, E.; García Morote, F.A.; Andrés Abellán, M.; Picazo Córdoba, M.I.; García Saucedo, F.; Martínez García, E.; Sánchez García, J.M.; Serena Innerarity, J.; Carrasco Lucas, L.; et al. Artificial intelligence-based software (AID-FOREST) for tree detection: A new framework for fast and accurate forest inventorying using LiDAR point clouds. Int. J. Appl. Earth Obs. Geoinf. 2022, 113, 103014. [Google Scholar] [CrossRef]
  49. Wang, D.; Momo Takoudjou, S.; Casella, E. LeWoS: A universal leaf–wood classification method to facilitate the 3D modelling of large tropical trees using terrestrial LiDAR. Methods Ecol. Evol. 2019, 11, 376–389. [Google Scholar] [CrossRef]
  50. Wilkes, P.; Disney, M.; Armston, J.; Bartholomeus, H.; Bentley, L.; Brede, B.; Burt, A.; Calders, K.; Chavana-Bryant, C.; Clewley, D.; et al. TLS2trees: A scalable tree segmentation pipeline for TLS data. Methods Ecol. Evol. 2023, 14, 3083–3099. [Google Scholar] [CrossRef]
  51. Wang, D.; Hollaus, M.; Puttonen, E.; Pfeifer, N. Automatic and self-adaptive stem reconstruction in landslide-affected forests. Remote Sens. 2016, 8, 974. [Google Scholar] [CrossRef]
  52. Ferraz, A.; Saatchi, S.; Mallet, C.; Meyer, V. LiDAR detection of individual tree size in tropical forests. Remote Sens. Environ. 2016, 183, 318–333. [Google Scholar] [CrossRef]
  53. Xu, S.; Sun, X.; Yun, J.; Wang, H. A new clustering-based framework to the stem estimation and growth fitting of street trees from MLS data. IEEE J. Sel. Top. Appl. Earth Obs. Remote Sens. 2020, 13, 3240–3250. [Google Scholar] [CrossRef]
  54. Liang, X.; Hyyppä, J.; Kaartinen, H.; Lehtomäki, M.; Pyörälä, J.; Pfeifer, N.; Holopainen, M.; Brolly, G.; Pirotti, F.; Hackenberg, J.; et al. International benchmarking of terrestrial laser scanning approaches for forest inventories. ISPRS J. Photogramm. Remote Sens. 2018, 144, 137–179. [Google Scholar] [CrossRef]
  55. Paris, C.; Valduga, D.; Bruzzone, L. A hierarchical approach to three-dimensional segmentation of LiDAR data at single-tree level in a multilayered forest. IEEE Trans. Geosci. Remote Sens. 2016, 54, 4190–4203. [Google Scholar] [CrossRef]
  56. Yang, Q.; Su, Y.; Jin, S.; Kelly, M.; Hu, T.; Ma, Q.; Li, Y.; Song, S.; Zhang, J.; Xu, G.; et al. The influence of vegetation characteristics on individual tree segmentation methods with airborne LiDAR data. Remote Sens. 2019, 11, 2880. [Google Scholar] [CrossRef]
  57. Wang, H.Y.; Li, J.L.; Voorde, T.V.; Zhou, C.H.; Philippe, D.M.; Ma, Y.B.; Shen, Z.F. Individual Populus euphratica tree detection in sparse desert forests based on constrained 2-D Bin Packing. IEEE Trans. Geosci. Remote Sens. 2024, 62, 1–19. [Google Scholar] [CrossRef]
  58. Tucker, C.; Brandt, M.; Hiernaux, P.; Kariryaa, A.; Rasmussen, K.; Small, J.; Igel, C.; Reiner, F.; Melocik, K.; Meyer, J.; et al. Sub-continental-scale carbon stocks of individual trees in African drylands. Nature 2023, 615, 80–86. [Google Scholar] [CrossRef] [PubMed]
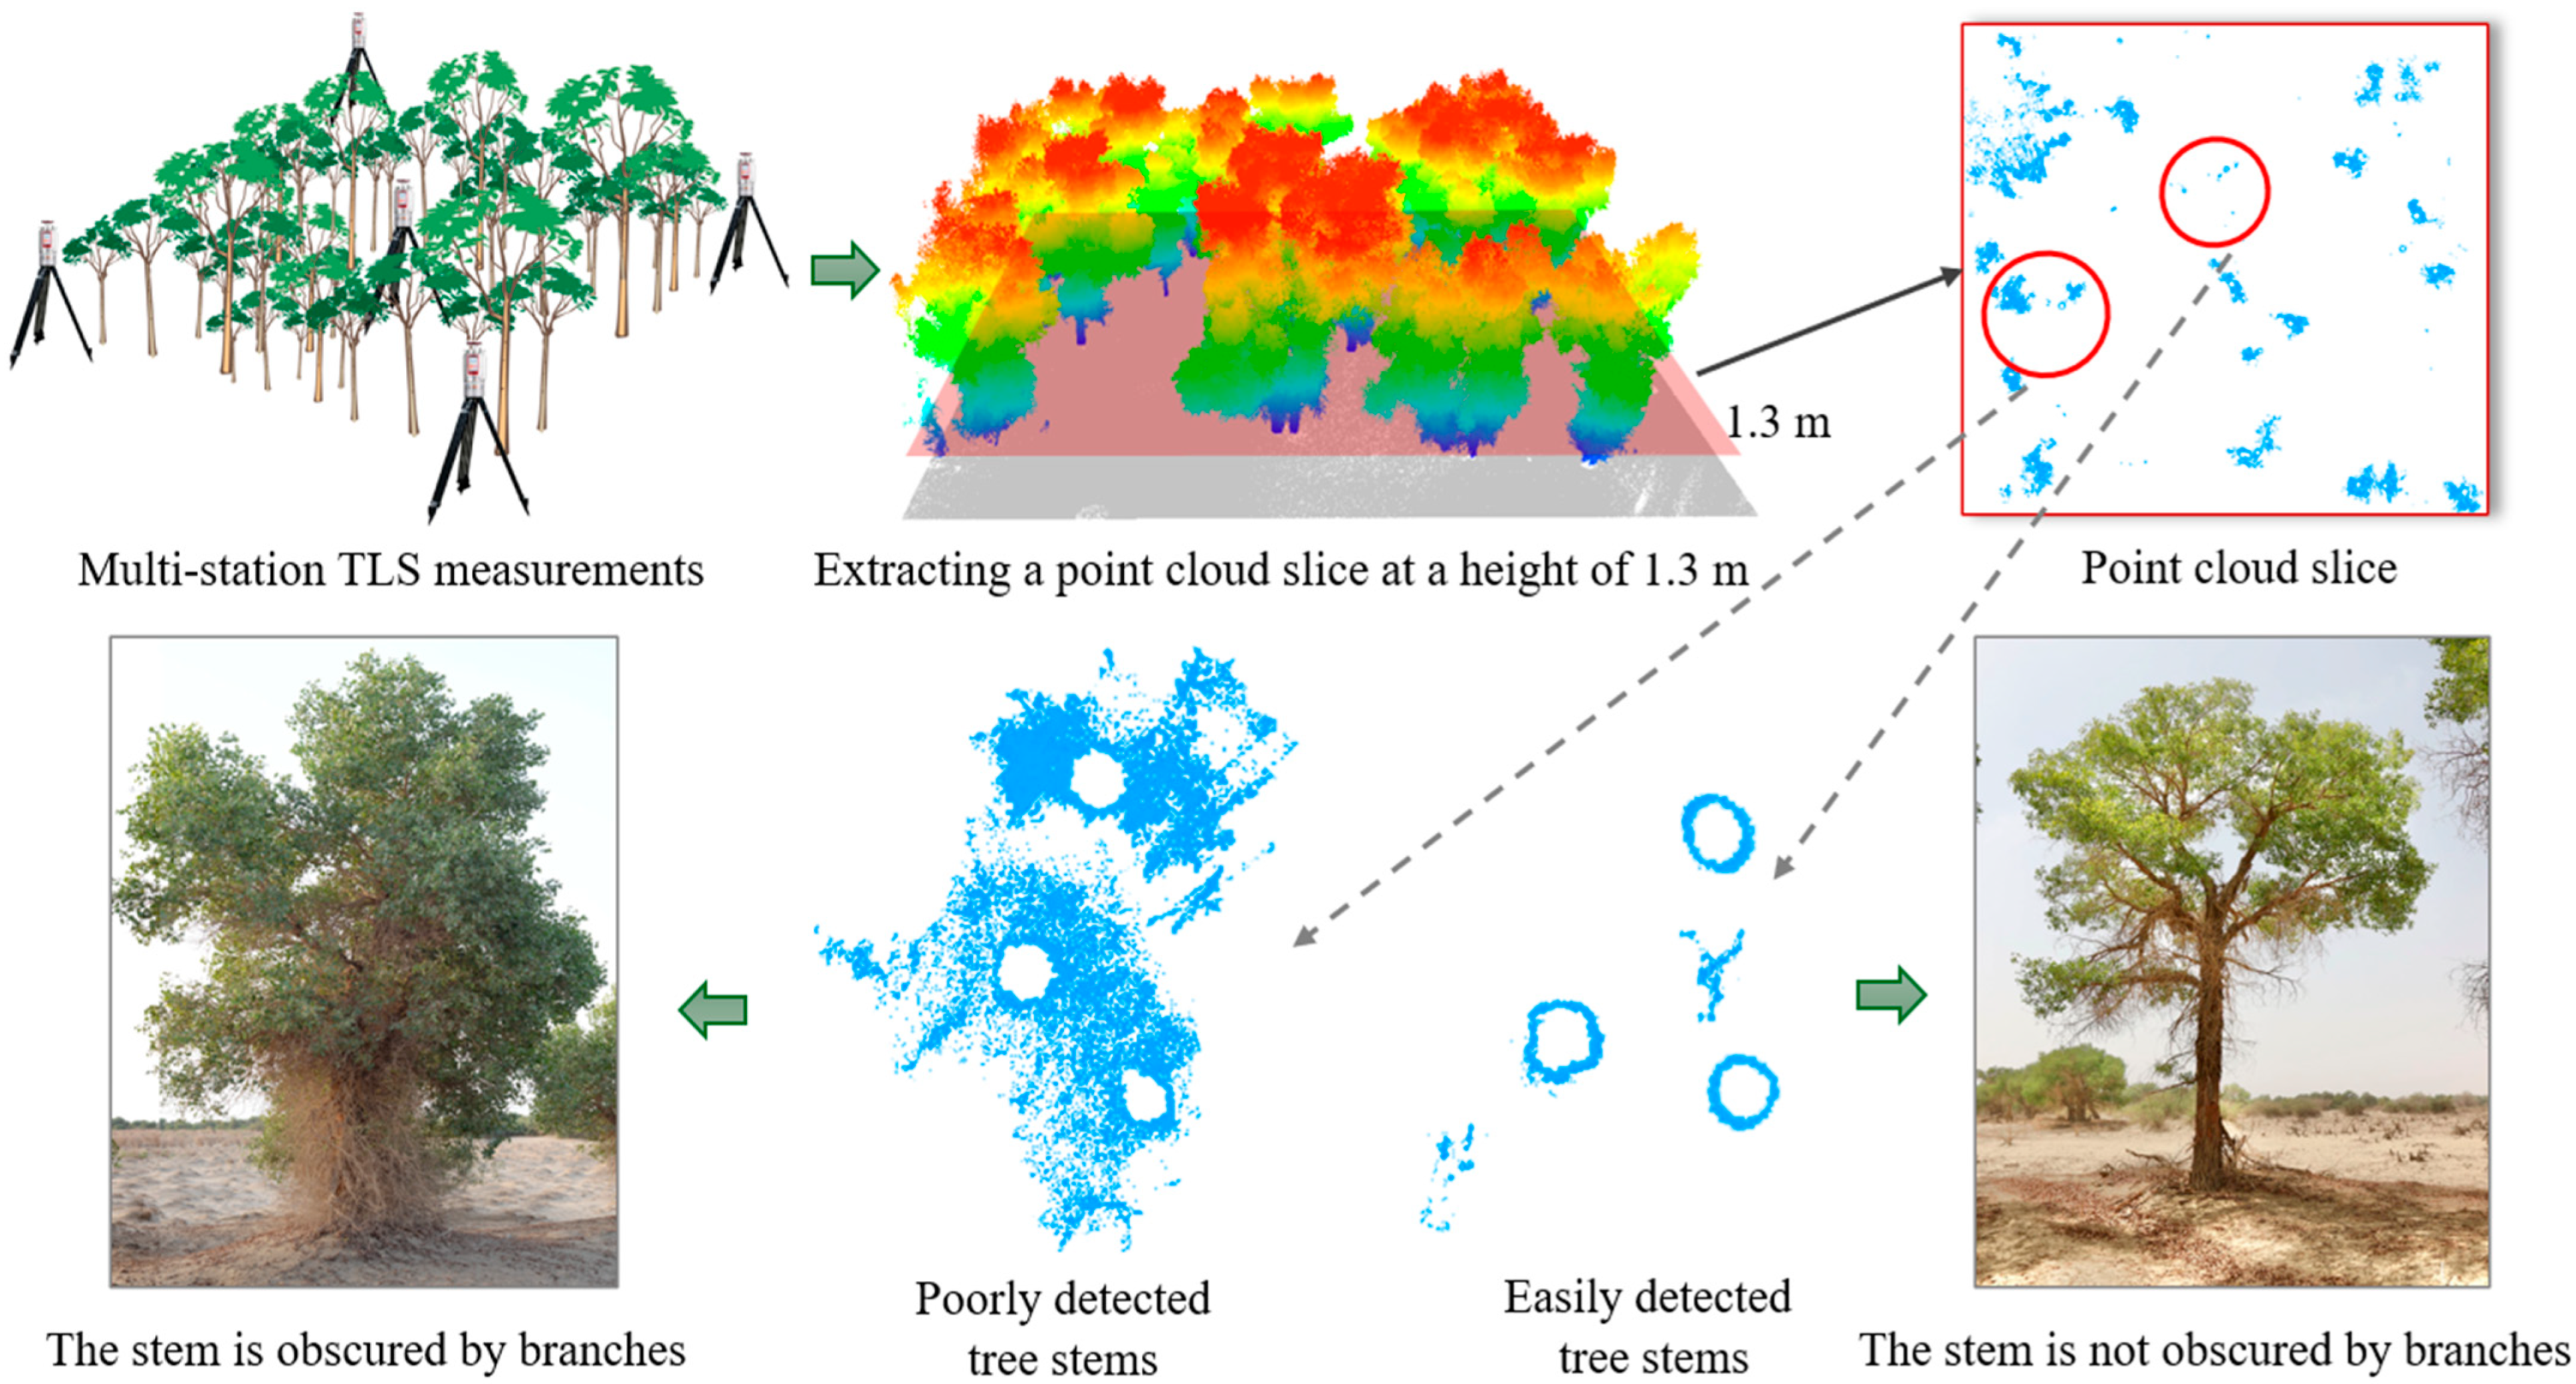
Figure 1. Structural characteristics of P. euphratica stems as revealed by the point cloud data.
Remotesensing 17 03852 g001
Figure 2. Map of the ground survey transects (indicated by red squares) and plots (indicated by yellow squares).
Remotesensing 17 03852 g002
Figure 3. Flowchart of the proposed protocol.
Remotesensing 17 03852 g003
Figure 4. Processing steps of the tree segmentation methods used in this study. Different colors represent the segmented individual trees.
Remotesensing 17 03852 g004
Figure 5. Different individual tree segmentation results. (a). True positive (TP): Accurate segmented; (b). False negative (FN): omission errors; (c). False positive (FP): commission errors. Different colors represent the segmented individual trees.
Remotesensing 17 03852 g005
Figure 6. Comparison of the mean detection rates of six ITS methods across all plots.
Remotesensing 17 03852 g006
Figure 7. Examples of individual-tree segmentation results for P. euphratica under fine-scale clustered stand conditions. Different colors represent the segmented individual trees. The red circles indicated by arrows represent specific examples of segmentation results obtained by each method.
Remotesensing 17 03852 g007
Figure 8. Comparison of individual-tree segmentation and stem-position accuracy between TBS and LWS methods. (a) Visualization of tree segmentation results produced by the LWS method using colored point clouds. Different colors represent the segmented individual trees. (b) Comparison between ground-measured stem positions and those detected by the TBS segmentation method. (c) Comparison between ground-measured stem positions and those detected by the LWS segmentation method.
Remotesensing 17 03852 g008
Figure 9. Validation of TLS-derived tree height (H), diameter at breast height (DBH), and crown diameter (CD) obtained from trunk-based (TBS) and leaf–wood separation (LWS) based segmentations against field measurements. The grey dotted line represents the 1:1 reference line. The orange line represents the linear fitting line. Subfigures (ac) show the comparison between the tree structure parameters obtained using TBS and the field measured values. Subfigures (df) show the comparison between the tree structure parameters obtained using LWS and the field measured values.
Remotesensing 17 03852 g009
Table 1. Forest plots scanned using the Riegl VZ 1000 terrestrial LiDAR system for testing the segmentation algorithm.
PlotSize (m2)Number of TreesStand Density (n/hm2)Min/Max DBH (cm)Min/Max H (m)Number of Scans
A140 × 40734566.9/47.12.2/15.15
A240 × 409358112.1/49.32.6/15.25
A340 × 40835195.3/149.92.3/14.45
B140 × 401046505.2/42.32.1/9.45
B240 × 40845254.7/73.13.4/11.35
B340 × 40704384.5/45.32.0/9.55
Table 2. Specification of the Riegl VZ-1000 terrestrial LiDAR system.
EquipmentParametersDetailsParametersDetails
Riegl VZ-1000Horizontal view0 to 360°; Minimum range1.5 m
Vertical view−30° to 130°Stationing height2 m
Measurement rateUp to 122,000 measurements/sScanning accuracy5 mm at 100 m distance
Detection rangeSet as 450 mLaser wave lengthNear-infrared
Laser beam
divergence
0.3 mradScanner weight10.5 kg
Table 3. Comparison of six individual-tree segmentation (ITS) algorithms across plots in P. euphratica TLS data.
PlotsNumber of TreesSegmentation MethodsNumber of Segmented TreesTPFPFNRPF
A173CHMS48223230.490.880.63
PCS45131310.300.930.45
SPS7169020.971.000.99
CSP75591330.950.820.88
TBS7472110.990.990.99
LWS7673301.000.960.98
A293CHMS4984370.180.670.28
PCS3972300.190.780.30
SPS8381020.981.000.99
CSP9886840.960.910.93
TBS8987110.990.990.99
LWS9189020.981.000.99
A383CHMS57310260.541.000.70
PCS89718100.880.900.89
SPS8179020.981.000.99
CSP7873050.941.000.97
TBS8383001.001.001.00
LWS8077030.961.000.98
B1104CHMS793919210.650.670.66
PCS87628170.780.890.83
SPS9884680.910.930.92
CSP9890260.940.980.96
TBS103101110.990.990.99
LWS102100020.981.000.99
B284CHMS69518100.840.860.85
PCS7363460.910.940.93
SPS8280020.981.000.99
CSP8178030.961.000.98
TBS8484001.001.001.00
LWS8383001.001.001.00
B370CHMS5744490.830.920.87
PCS6353370.880.950.91
SPS6968010.991.000.99
CSP6866020.971.000.99
TBS7070001.001.001.00
LWS7070001.001.001.00
Disclaimer/Publisher’s Note: The statements, opinions and data contained in all publications are solely those of the individual author(s) and contributor(s) and not of MDPI and/or the editor(s). MDPI and/or the editor(s) disclaim responsibility for any injury to people or property resulting from any ideas, methods, instructions or products referred to in the content.