Article

A High-Fidelity Star Map Simulation Method for Airborne All-Time Three-FOV Star Sensor Under Dynamic Conditions

1
State Key Laboratory of Optical Field Manipulation Science and Technology, Chinese Academy of Sciences, Chengdu 610209, China
2
Key Laboratory of Science and Technology on Space Optoelectronic Precision Measurement, Chinese Academy of Sciences, Chengdu 610209, China
3
Institute of Optics and Electronics, Chinese Academy of Sciences, Chengdu 610209, China
4
University of Chinese Academy of Sciences, Beijing 100149, China
*
Author to whom correspondence should be addressed.
Remote Sens. 2025, 17(23), 3853; https://doi.org/10.3390/rs17233853
Submission received: 6 July 2025 / Revised: 18 October 2025 / Accepted: 9 November 2025 / Published: 28 November 2025

Highlights

What are the main findings?
  • A comprehensive star map simulation method for airborne All-Time Three-FOV star sensors is proposed, integrating coordinate transformation, energy transfer, and image degradation models.
What are the implications of the main findings?
  • The method offers a reliable technical basis for optimizing the design and assessing the performance of airborne All-Time Three-FOV star sensors under dynamic conditions.
  • It enables the validation of star centroid extraction and identification algorithms under controlled disturbance scenarios, reducing dependency on costly and time-consuming real-world stargazing experiments.

Abstract

To address the lack of reliable test data for evaluating star sensor performance in dynamic airborne environments, this paper presents a high-fidelity star map simulation method for all-time three-Field of View (FOV) star sensors. A comprehensive simulation framework integrating stellar radiation, atmospheric transmission, and detector noise models was developed to accurately model star trailing effects under dynamic conditions. First, a stellar position calculation model incorporating atmospheric refraction correction and platform motion parameters was established through coordinate transformations between the Geocentric Celestial Reference System (GCRS) and FOV coordinate system. Next, a complete energy transfer chain was constructed by combining star catalog data, atmospheric radiative properties, and detector noise characteristics. Finally, a quantitative evaluation system was introduced, employing metrics such as signal-to-noise ratio (SNR), total grayscale value (Gtotal), grayscale concentration index (GCI), and dynamic star displacement (DSD). Field experiments at 2388 m altitude (100.23°E, 26.86°N) demonstrated the average relative error of all evaluation metrics below 9% for static conditions and approximately 8% for dynamic scenarios between simulated and real star maps. The method effectively reproduces stellar radiation, atmospheric noise, and dynamic degradation, providing reliable simulation conditions for airborne star sensor testing and star trailing restoration algorithm development.

1. Introduction

With the continuous development of aerospace technology, navigation is becoming increasingly important in near-Earth space and atmospheric missions, and star sensors have become core components of navigation systems [1,2,3,4]. The star sensor is a high-precision optoelectronic attitude measurement device that utilizes stars as observation targets. By capturing and analyzing stellar distributions in real-time, it provides spacecraft with precise three-axis attitude information relative to an inertial reference frame [5,6,7]. As one of the most accurate attitude sensors for spacecraft, star sensors achieve measurement precision at the sub-arcsecond level, significantly outperforming other attitude determination instruments such as sun sensors [8,9]. Compared with traditional inertial navigation systems, star sensors offer multiple advantages, including (1) superior attitude measurement accuracy, (2) non-cumulative errors, (3) strong resistance to electromagnetic interference, (4) high concealment capability, and (5) independence from external attitude references. These advantages have led to their widespread adoption in extraterrestrial satellite platforms [10,11]. In recent years, with growing demands for high-precision, interference-resistant, and fully autonomous navigation systems among atmospheric platforms-including high-altitude vehicles (e.g., missiles, aircraft), marine mobile platforms (e.g., ships), and stratospheric aerostats (e.g., high-altitude balloons)-star sensor research has gradually expanded from traditional deep-space exploration to atmospheric platform applications [12,13,14,15].
However, compared to star sensors deployed on satellite platforms, all-time star sensors for airborne platforms face significant challenges from sky background radiation [16]. To effectively suppress sky background radiation, enhance detection capability, and increase detectable star counts, their optical systems typically adopt a combined strategy of long focal length with small FOV and multiple FOVs, while preferentially operating in the short-wave infrared (SWIR) band. This design is referred to as an all-time multi-FOV star sensor (typically configured with three FOVs) [17].
The core functionality of all-time three-FOV star sensors relies on stellar optical imaging and identification: First, the optical system images detected stars onto the image sensor located at the focal plane. Subsequently, star centroid extraction algorithms is employed to determine stellar centroid coordinates and match them with a star catalog stored in the system memory. Finally, attitude determination algorithms compute the spacecraft’s attitude relative to the inertial reference frame [18]. Among these processes, the design and optimization of high-precision star centroid extraction algorithms and robust star identification algorithms under strong sky background radiation and dynamic conditions have become critical technical challenges limiting the realization of all-time autonomous navigation capability for star sensors.
To thoroughly investigate the performance and verify the reliability of these algorithms, evaluation using real star maps is essential. However, obtaining star maps captured by star sensors on actual airborne platforms is considerably challenging due to experimental constraints and costs [19]. This scarcity of real airborne star map data creates a critical bottleneck: without sufficient test data, it is impossible to systematically validate the performance of star centroid extraction and identification algorithms under diverse dynamic airborne conditions (e.g., platform angular motion and random vibrations) or optimize the design of all-time three-FOV star sensors. In this context, high-fidelity star map simulation emerges as an indispensable solution. It can generate controllable, repeatable, and low-cost simulated star maps that replicate the key characteristics of real airborne scenarios (including stellar radiation, atmospheric interference, detector noise, and dynamic star trailing). These simulated star maps not only fill the gap regarding the scarcity of real test data but also enable quantitative evaluation of algorithm robustness and sensor performance under extreme or variable conditions. Thus, reliable star map simulation methods are of significant importance: they serve as a foundational prerequisite for advancing the development and practical application of airborne all-time three-FOV star sensors and provide effective validation means for the development of star spot extraction and star map recognition algorithms.
Zhao et al. proposed a star map simulation method for airborne star sensors, detailing the calculation of stellar projection positions on the detector focal plane [20]. Building upon this, Wu et al. further incorporated atmospheric refraction effects and derived formulas for calculating star position offsets [19]. Li et al. employed Moderate-Resolution Atmospheric Transmission (MODTRAN) software to construct a sky background radiation model that comprehensively considers parameters including viewing zenith angle (VZA), solar zenith angle (SZA), solar azimuth angle (SAA), observation band, and altitude, enabling daytime star map simulation for airborne star trackers across different bands [21]. Wang et al. developed atmospheric interference and detector noise models for the star map simulation process. The aforementioned studies focus on static stellar imaging models, but the influence of platform motion on such imaging has not been taken into account [22]. Zheng et al. established a stellar radiation transfer model based on blackbody radiation laws while considering the impact of airborne platform motion on star imaging. However, this study has several limitations: First, the relative spectral distribution of stars based on blackbody radiation deviates from actual spectra; Second, simplifying complex vibrational motion into one-dimensional rapid simple harmonic motion results in significant discrepancies from actual star map motion blur characteristics, failing to accurately represent motion properties and complex blur effects in real physical scenarios [23].
Currently, existing star map simulation methods primarily focus on coordinate transformation, stellar radiation transfer modeling, and sky background radiation transfer modeling in the simulation workflow. Relatively few studies have addressed the construction and validation of dynamic star imaging models for daytime airborne conditions.
Since the flight speed of the platform considered in this study is below 4 Ma, the influence of aero-optical effects on the star sensor is negligible [12], so such effects are not included in the current model scope. Building upon existing research, this study establishes a systematic star map simulation model for all-time three-FOV star sensors and generates corresponding simulated star maps. Specifically, the work conducts in-depth investigations into the dynamic star imaging mechanism under airborne conditions, developing corresponding mathematical models and constructing a multi-dimensional evaluation metric system to systematically analyze the impact patterns of platform motion on star imaging quality. Finally, through comparative analysis between real star maps and simulation results, the effectiveness of the proposed simulation method is validated. This research lays a solid theoretical foundation for subsequent studies on high-precision star extraction algorithms and robust star map identification algorithms under daytime dynamic conditions.

2. The Fundamental Workflow of Star Map Simulation

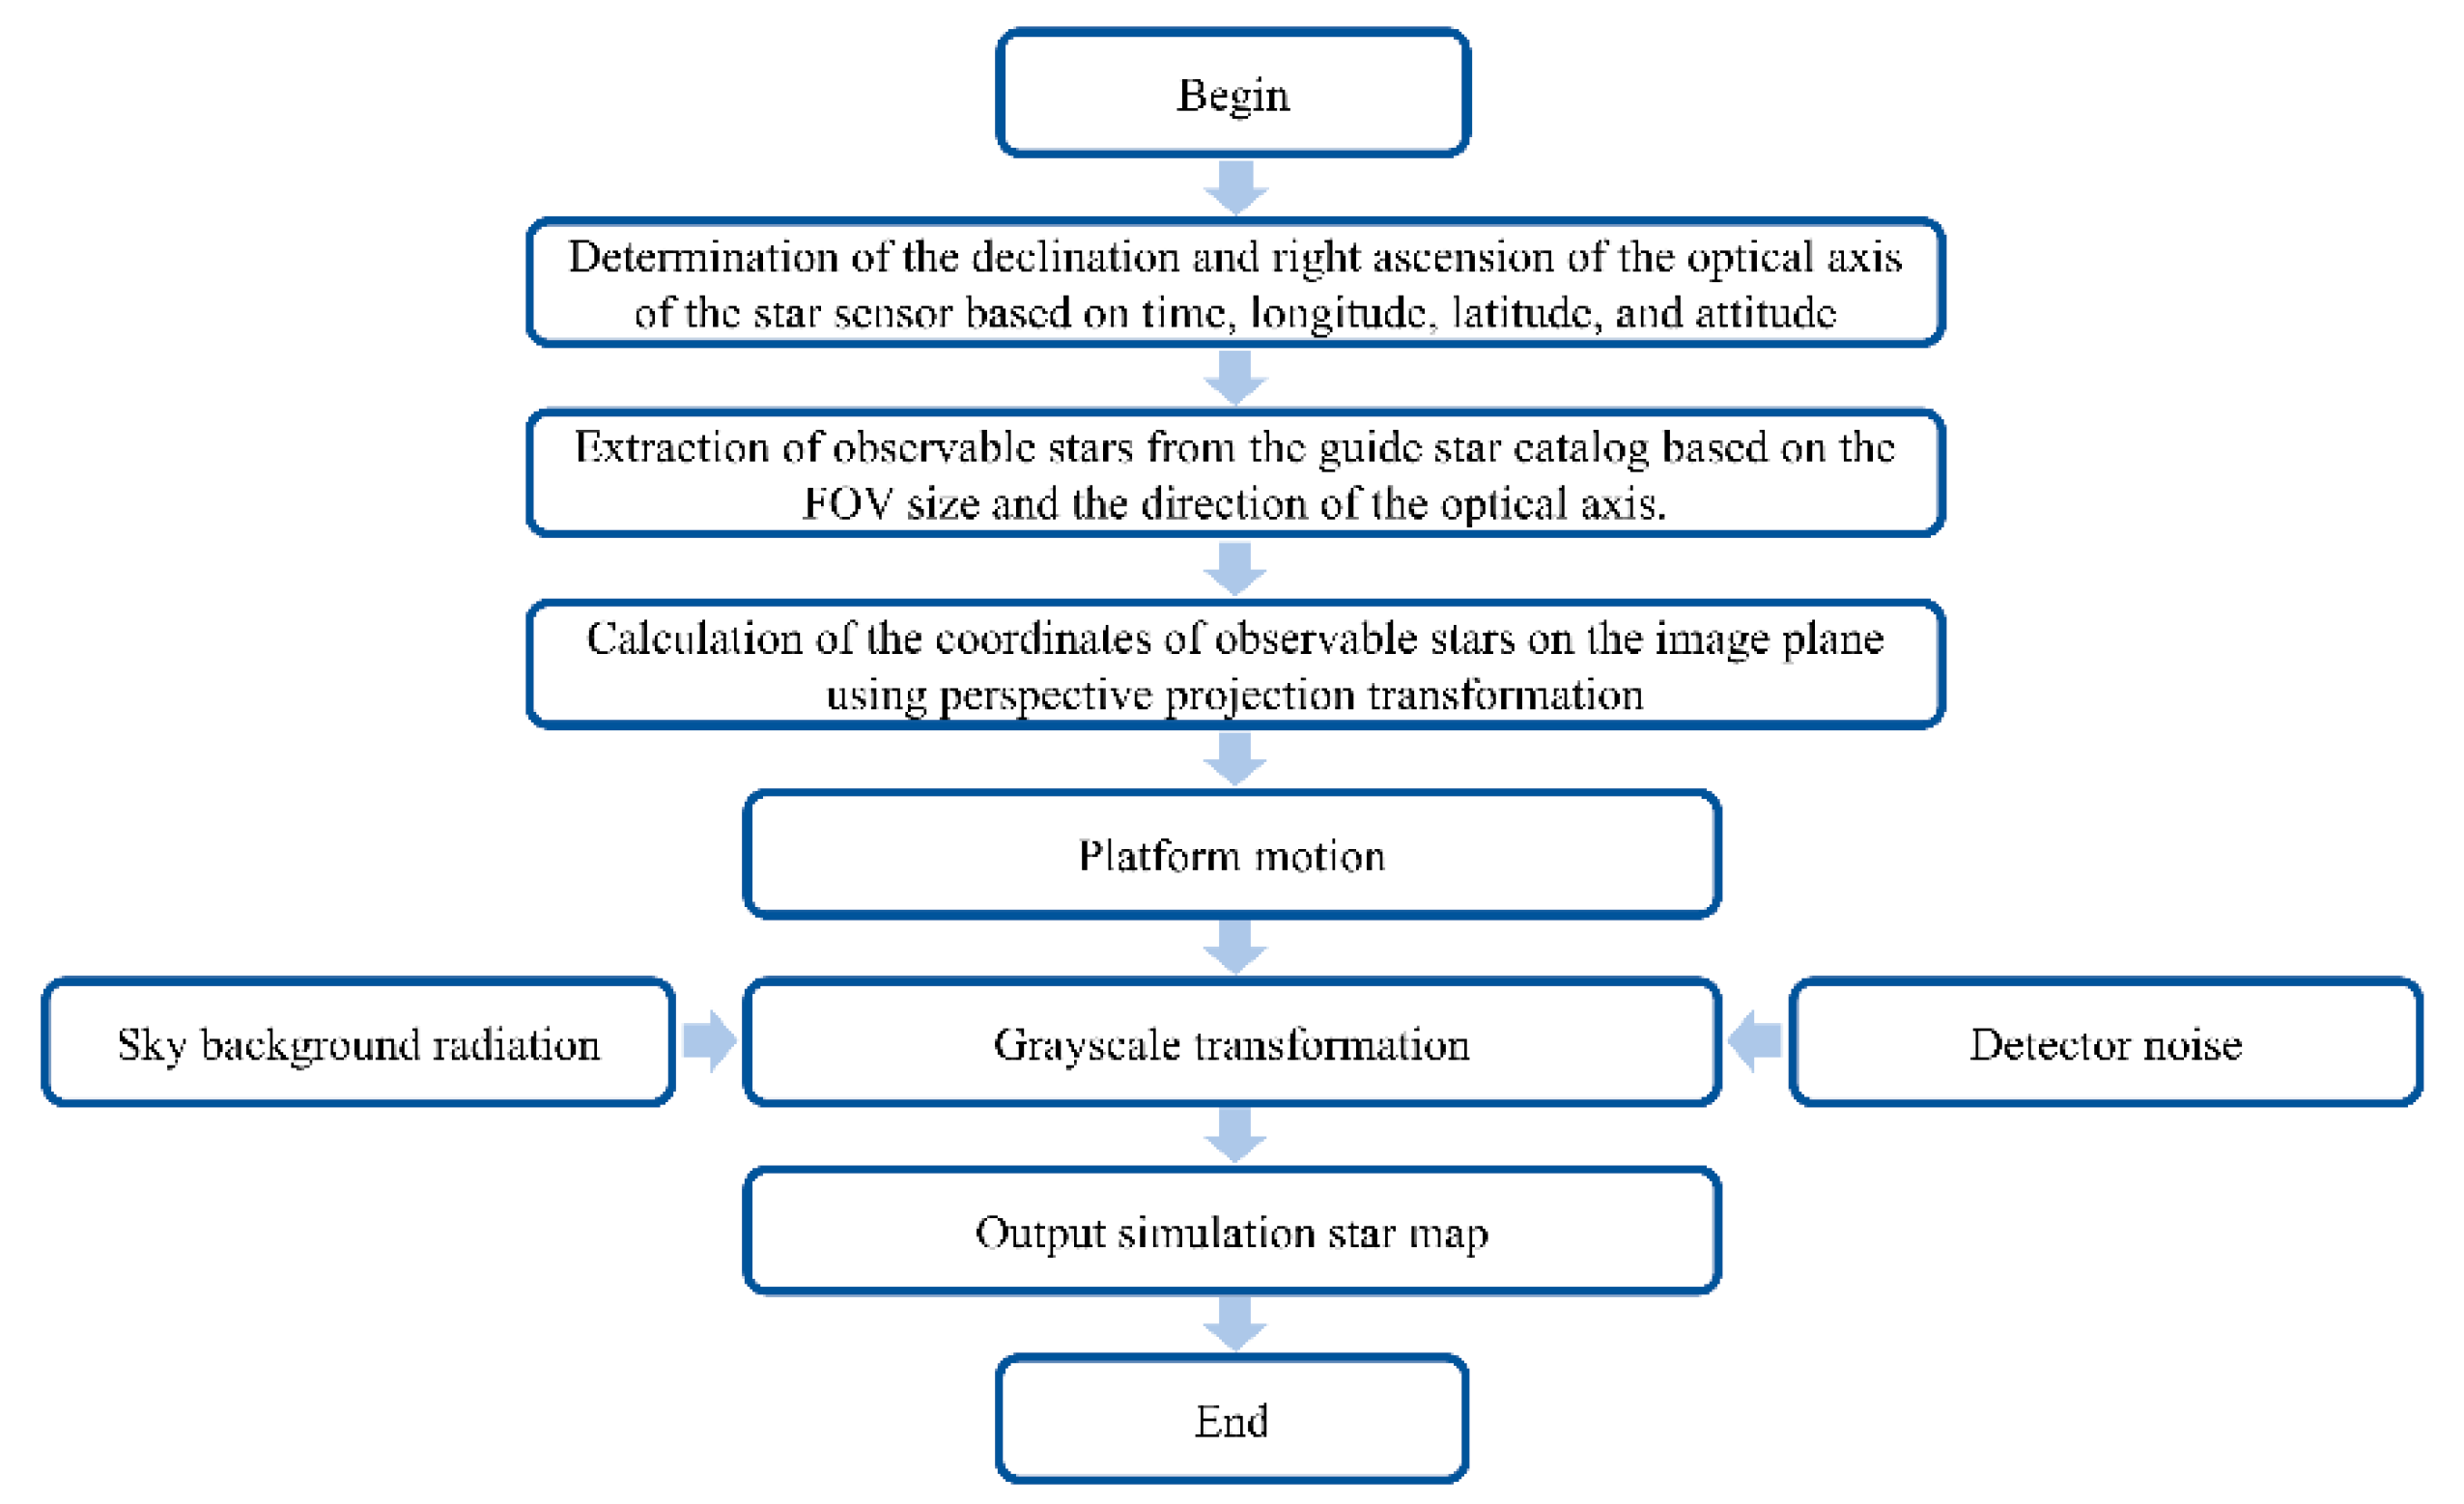
The system architecture of the all-time three-FOV star sensor employed in this study is illustrated in Figure 1. The system adopts a tri-optical configuration, featuring three independent optical systems with identical structural parameters arranged in a 120° symmetrical distribution azimuthally. Each optical axis has an elevation angle of 45°, with an inter-axis angle of 75.5° between adjacent optical axes. Figure 2 presents the star map simulation workflow for this star sensor: First, based on the geographic coordinates (longitude, latitude), attitude, and local time of the observation point, the right ascension (RA) and declination (Dec) parameters of the three optical axes in the GCRS are calculated. Second, according to the FOV parameters and optical axis orientation, observable star data within each FOV are retrieved and extracted from the star catalog. Subsequently, using a perspective projection transformation algorithm, the ideal projection coordinates of observable stars on the corresponding image plane are computed, with precise corrections applied to these coordinates through the introduction of optical system distortion and atmospheric refraction models. Finally, by comprehensively considering platform motion parameters, detector noise characteristics, stellar magnitudes, and sky background radiation intensity, the required simulated star maps are generated through the establishment of a grayscale calculation model.

2.1. Coordinate Transformation

2.1.1. Coordinate System Definition

In star simulation, the precise description of celestial body positions and airborne platform attitude relies on multiple coordinate systems and their transformation relationships. The primary coordinate systems used in this study are defined as follows:
I. Geocentric Celestial Reference System (GCRS, Oxiyizi): With its origin at the Earth’s center of mass, the Oxi axis points toward the vernal equinox, the Ozi axis aligns with the Earth’s rotation axis, and the Oyi axis completes the right-handed orthogonal system. The GCRS is commonly used to describe celestial body positions in inertial space.
II. Earth-Centered, Earth-Fixed Coordinate System (ECEF, Oxeyeze): Also centered at the Earth’s mass center, the Oxe axis points toward the intersection of the prime meridian and the equator, the Oze axis aligns with the geographic North Pole, and the Oye axis is determined by the right-hand rule. This system rotates synchronously with the Earth.
III. East-North-Up Coordinate System (ENU, Oxgygzg): With its origin at the platform’s center of mass, the Oxg, Oyg, and Ozg axes point toward geographic east, north, and the local zenith, respectively. This system is typically used to characterize the airborne platform’s attitude relative to the Earth.
IV. Star Sensor Coordinate System (Oxsyszs): Serving as the measurement reference frame, this coordinate system maintains a fixed rotational transformation matrix C b s relative to the body coordinate system (Oxbybzb).
V. FOV Coordinate System (Oxfyfzf): The origin of each FOV coordinate system lies at the optical axis center, with the Ozf axis aligned along the optical axis. The Oxf and Oyf axes are parallel to the detector edges. For FOV1 Coordinate System, the Ozf1 axis projects along the Oxs axis in the star sensor coordinate system.
VI. Image Coordinate System (Oxpyp): Taking the image plane center point as coordinate origin, the Oxp and Oyp axes are parallel to Oxf and Oyf, respectively, representing the two-dimensional star position on the image plane.

2.1.2. Extraction of Observable Stars

When calculating the projection positions and grayscale values of observable stars on the detector focal plane, it is essential to obtain key parameters such as stellar magnitudes, RA, and Dec, all of which are sourced from the star catalog. Considering that the observation bands of The Two Micron All-Sky Survey (2MASS) cover the J-band (1.235 µm, bandwidth: 0.162 µm), H-band (1.662 µm, bandwidth: 0.251 µm), and Ks-band (2.159 µm, bandwidth: 0.262 µm), which significantly overlap with the SWIR band adopted in this study, we selected 2MASS as the data source for the star catalog. The 2MASS catalog contains an extensive collection of stellar data. Therefore, preprocessing of the 2MASS catalog data is necessary to ensure the reliability of subsequent analysis results. The specific screening criteria are determined based on the magnitudes of the J, H, and K infrared bands provided by the catalog, combined with the magnitude measurement uncertainty flag (Rd_flg) and source confidence flag (Cc_flg): only stellar samples with an H-band magnitude less than or equal to 6; an Rd_flg value of “1”, “2”, or “3” (this range of values corresponds to the highest observation quality grade in the catalog); and a Cc_flg value of 0 (this value indicates that the target source is minimally affected by image artifacts or contamination from nearby sources of equal or higher luminosity) are retained.
To accurately identify observable stars within the three FOVs, a filtering process is performed based on the optical axis orientation, FOV parameters, and the RA/Dec coordinates of stars. Assuming the directional vector of the optical axis in the FOV coordinate system is denoted as Zf, the corresponding RA and Dec in the GCRS can be calculated using Equation (1).
Z i = C f i Z f = cos ( α i ) cos ( δ i ) sin ( α i ) cos ( δ i ) sin ( δ i )
where αi and δi represent the RA and Dec of the optical axis in the GCRS, respectively, while C f i denotes the coordinate transformation matrix from the FOV coordinate system to GCRS. The detailed derivation of this transformation matrix is presented in Section 2.1.3 of this paper, and Zi corresponds to the directional vector of the optical axis in GCRS.
Given that the optical axes of the three FOVs are all located at the geometric center of their respective FOVs, Equation (2) can be subsequently utilized to determine the coverage range of RA and Dec in the GCRS for the circular FOV with a half-angle R centered on each optical axis. More specifically, any stellar object whose directional vector Zₛ in GCRS satisfies the condition defined by Equation (2), and whose instrument magnitude is below the extreme detection magnitude, will be classified as an observable star.
arccos Z s Z i Z s 2 Z i 2 < R R = F O V 2

2.1.3. Transformation from Celestial to Image Coordinate Systems

In this study, the conversion from GCRS to ECEF is achieved using a vernal equinox-based transformation method [24], implemented via the rotation matrix C i e (Equation (3)).
C i e = W ( t ) R ( GAST ) N ( t ) P ( t )
where P(t) represents the precession matrix, N(t) denotes the nutation matrix, and R(GAST) is the rotation matrix transforming coordinates from the instantaneous true celestial reference system to the instantaneous true terrestrial reference system, computed based on the Greenwich Apparent Sidereal Time (GAST) referenced to the true equinox. Additionally, W(t) corresponds to the polar motion matrix, where t denotes the number of Julian centuries elapsed.
Based on the geographic longitude and latitude of the airborne platform, the rotation matrix from the ECEF coordinate system to the ENU coordinate system, denoted as C, can be derived, as shown in Equation (4).
C e g = 1 0 0 0 cos ( π 2 φ g ) sin ( π 2 φ g ) 0 sin ( π 2 φ g ) cos ( π 2 φ g ) cos ( π 2 + λ g ) sin ( π 2 + λ g ) 0 sin ( π 2 + λ g ) cos ( π 2 + λ g ) 0 0 0 1 = sin λ g cos λ g 0 cos λ g sin φ g sin λ g sin φ g cos φ g cos λ g cos φ g sin λ g cos φ g sin φ g
where λg and φg represent the geographic longitude and latitude of the airborne platform, respectively.
Using the airborne platform’s attitude, the rotation matrix from the ENU coordinate system to the body coordinate system can be derived, as expressed mathematically in Equation (5).
C g b = cos ( β b ) cos ( γ b ) cos ( β b ) sin ( γ b ) sin ( β b ) cos ( γ b ) sin ( α b ) sin ( β b ) cos ( α b ) sin ( γ b ) cos ( α b ) cos ( γ b ) + sin ( α b ) sin ( β b ) sin ( γ b ) cos ( β b ) sin ( α b ) sin ( α b ) sin ( γ b ) + cos ( α b ) cos ( γ b ) sin ( β b ) cos ( α b ) sin ( β b ) sin ( γ b ) cos ( γ b ) sin ( α b ) cos ( α b ) cos ( β b )
where αb, βb, and γb denote the attitude angles of the airborne platform.
Since the star sensor is equipped with three independent FOVs, the rotation matrices from the star sensor coordinate system to each individual FOV coordinate system must be derived separately. Let C s f i (i = 1,2,3) denote the rotation matrices from the star sensor coordinate system to the three FOV coordinate systems, which can be uniformly expressed as:
C s f i = cos ( π 4 ) 0 sin ( π 4 ) 0 1 0 sin ( π 4 ) 0 cos ( π 4 ) cos ( ( i 1 ) 2 π 3 ) sin ( ( i 1 ) 2 π 3 ) 0 sin ( ( i 1 ) 2 π 3 ) cos ( ( i 1 ) 2 π 3 ) 0 0 0 1
In the subsequent processes of star map identification and attitude determination, the system processor must accurately compute the positions of stars in the image coordinate system. To achieve this, the three-dimensional star vectors in the FOV coordinate system must be projected onto the two-dimensional image plane via perspective projection. FOV1 is used here as an example for illustration. The three-dimensional star vector S1 in the FOV1 coordinate system can be calculated using Equation (7).
S 1 = C i f 1 cos ( α 1 ) cos ( δ 1 ) sin ( α 1 ) cos ( δ 1 ) sin ( δ 1 ) = X 1 Y 1 Z 1
where C i f 1 denotes the rotation matrix from the GCRS to the FOV1 coordinate system, and X1, Y1, and Z1 represent the components of the vector S1 along the three coordinate axes of the FOV1 coordinate system, respectively.
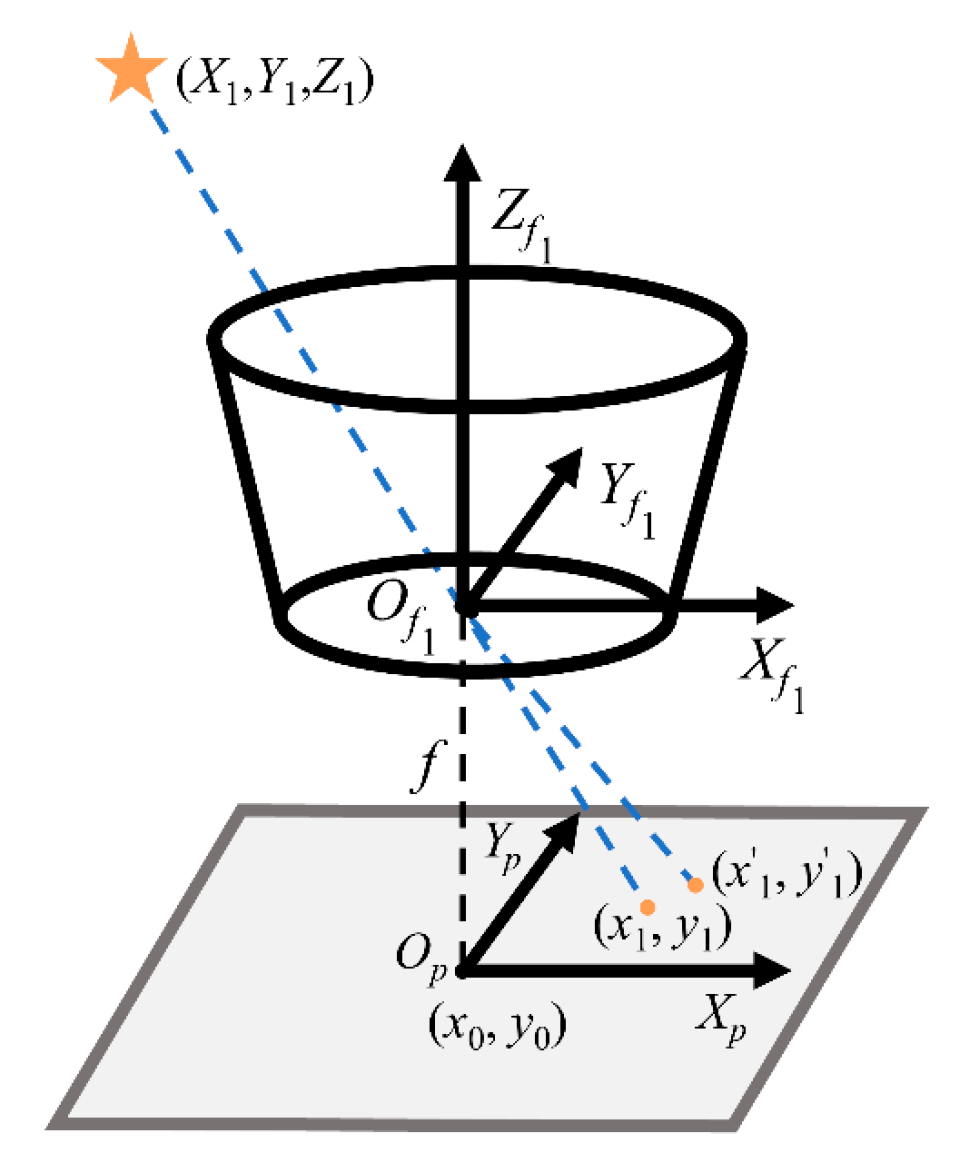
The spatial geometric relationship between the FOV coordinate system and the image coordinate system is illustrated in Figure 3. Based on the principles of perspective projection, the coordinate position of the star in the image coordinate system can be derived. The corresponding transformation relationship is given in Equation (8).
x 1 = X 1 Z 1 f d p i x e l y 1 = Y 1 Z 1 f d p i x e l
where x1 and y1 represent the horizontal and vertical coordinates of the star in the image coordinate system, respectively, f denotes the focal length of the optical system, and dpixel is defined as the pixel size of the detector.
In addition, to improve imaging accuracy, the effect of optical system distortion on the star’s imaged position must be taken into account. In this study, a first-order radial distortion model is introduced for correction. The corresponding calculation is shown in Equation (9).
x 1 = x 1 + x 1 g 1 r 2 y 1 = y 1 + y 1 g 1 r 2 r = x 1 2 + y 1 2
where x 1 and y 1 represent the star coordinates corrected by the first-order radial distortion model, g1 denotes the radial distortion coefficient, and r is the Euclidean distance from the point (x1, y1) to the principal point Op.
During the generation of the simulated star map, the computer screen uses an image coordinate system with its origin located at the top-left corner of the image. Therefore, the star coordinates must be transformed into this coordinate system using the transformation relationship presented in Equation (10).
x 2 = N x 2 + x 1 y 2 = N y 2 y 1
where x2 and y2 represent the horizontal and vertical coordinates of the star in the image coordinate system with the origin located at the top-left corner of the image, while Nx and Ny denote the total number of pixels in each row and column of the detector, respectively.
After obtaining the coordinates of the stars, it is necessary to further verify the accuracy of the results. According to the principle of invariant stellar angular distance, the angular distance between stars in the GCRS should be consistent with that in the FOV coordinate system. Building on this, suppose there are two observable stars in the FOV1 coordinate system, whose right ascension and declination are (αx, δx) and (αy, δy), respectively. Their corresponding coordinates in the image coordinate system are (mx, nx) and (my, ny), respectively. The direction vectors of these two stars in the GCRS can be expressed as Zx = [cosαxcosδx, sinαxcosδx, sinδx]T and Zy = [cosαycosδy, sinαycosδy, sinδy]T, while their direction vectors in the FOV1 coordinate system are Sx = [mx, nx, -f]T and Sy = [my, ny, -f]T, respectively. Based on these direction vectors, the angular distances θαδ in the GCRS and θmn in the FOV 1 coordinate system can be calculated using Equation (2).
If the condition |θαδ-θmn| ≤ ε is satisfied, where ε denotes a predefined threshold for coordinate transformation accuracy, the coordinate transformation can be considered sufficiently accurate. This criterion provides a quantitative basis for verifying the correctness of the star positions and ensures the reliability of the coordinate transformation results.

2.1.4. Impact of Atmospheric Refraction on Stellar Imaging

Unlike star sensors deployed on satellite platforms, those designed for airborne platforms operating within the atmosphere must additionally consider the effects of atmospheric refraction on the imaging positions of stars. Atmospheric refraction reduces the VZA of the stars. Its magnitude primarily depends on the VZA, atmospheric pressure, and temperature, as expressed in Equation (11) [22,25].
R = 0.000383 T 1 + 0.00367 T + H ( 1 0.00264 cos 2 φ 0.000163 ( T T ) ) 760 R 0 n g R 0 = 0.006734 + 60.13008 tan ( V Z A ) 0.025433 tan 2 ( V Z A ) 0.058699 tan 3 ( V Z A ) n g = 0.965 + 0.0164 λ m 2 + 0.00028 λ m 4
where R denotes the atmospheric refraction, and R0 represents the reference atmospheric refraction, both expressed in arcseconds (″). R0 is defined as the atmospheric refraction under standard conditions at sea level with a temperature of 0 °C, pressure of 760 mmHg, and latitude of 45°, and its specific value is closely related to the VZA. The approximate calculation formula for R0 is obtained by fitting data from the atmospheric refraction tables provided in the Chinese Astronomical Almanac, and it is valid for VZAs ranging from 0° to 76°. T is the ambient air temperature during observation, and T′ is the temperature of mercury in the barometer, both measured in degrees Celsius (°C). H′ denotes the atmospheric pressure during observation, measured in millimeters of mercury (mmHg). Additionally, ng is the atmospheric refraction correction factor, which depends on the detector’s response band; λm is the central wavelength of the detector’s response band, expressed in micrometers (µm).
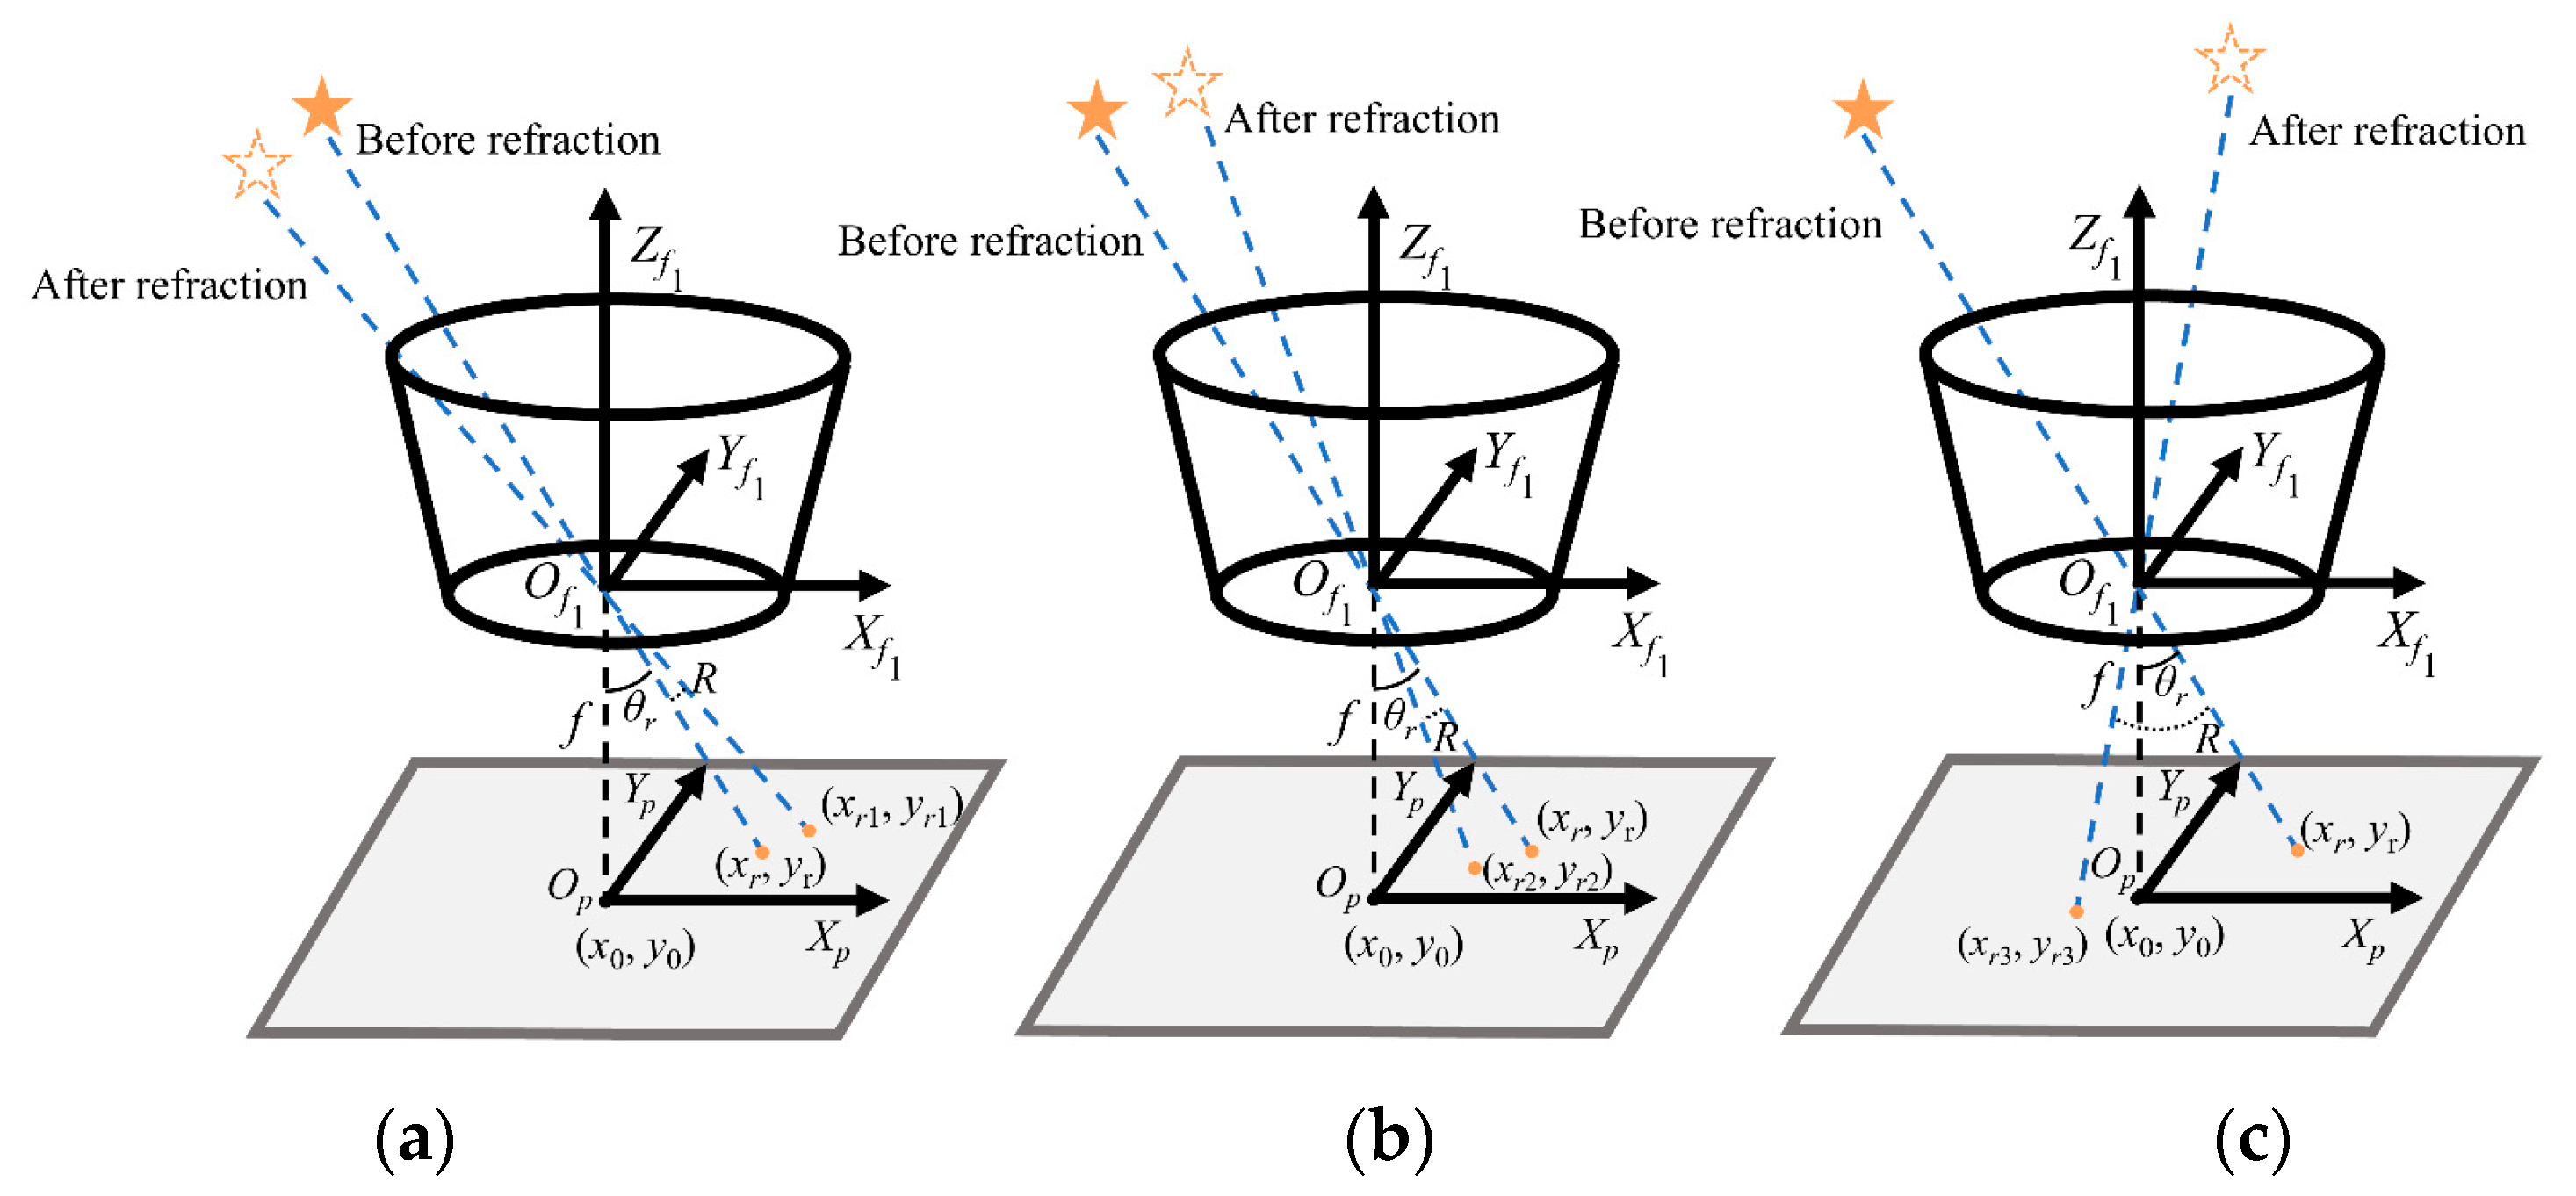
Based on the atmospheric refraction R, the stellar coordinates can be corrected. As illustrated in Figure 4, atmospheric refraction induces three typical imaging scenarios. Assuming the angle between the starlight and the optical axis before refraction is θr, its specific value can be calculated using Equation (12) according to the geometric relationships depicted in Figure 4.
θ r = arctan x r 2 + y r 2 d p i x e l f
where xr and yr represent the projected position of the star.
Atmospheric refraction alters the angle between incident starlight and the optical axis, resulting in three typical imaging scenarios, as illustrated in Figure 4. In Case 1, when the star’s altitude angle is greater than that of the optical axis, refraction increases the angle between starlight and the optical axis to θr + R; in Case 2, when the star’s altitude angle is below that of the optical axis and θr > R, refraction decreases this angle to θr-R; in Case 3, when the star’s altitude angle is below that of the optical axis and θr < R, refraction causes the angle between starlight and the optical axis to become R-θr. Based on the law of similar triangles, the projected positions of the refracted starlight in the image coordinate system under these three cases, denoted as (xr1, yr1), (xr2, yr2), and (xr3, yr3), can be derived. The corresponding formulas are provided in Equations (13)–(15).
x r 1 = x r f tan ( θ r + R ) x r 2 + y r 2 d p i x e l y r 1 = y r f tan ( θ r + R ) x r 2 + y r 2 d p i x e l
x r 2 = x r f tan ( θ r R ) x r 2 + y r 2 d p i x e l y r 2 = y r f tan ( θ r R ) x r 2 + y r 2 d p i x e l
x r 3 = x r f tan ( R θ r ) x r 2 + y r 2 d p i x e l y r 3 = y r f tan ( R θ r ) x r 2 + y r 2 d p i x e l
Through the aforementioned procedures, the imaging position of the star can be determined.

2.2. Star Imaging Model Under Dynamic Conditions

The above study focused on the star imaging model of the all-time three-FOV star sensor under static conditions. However, in practical applications, angular motion and angular vibration of the airborne platform induce trailing and distortion of star spots during exposure. Therefore, it is necessary to analyze the platform’s motion characteristics and develop a corresponding dynamic star imaging model.

2.2.1. Rotation of the Airborne Platform About an Arbitrary Axis

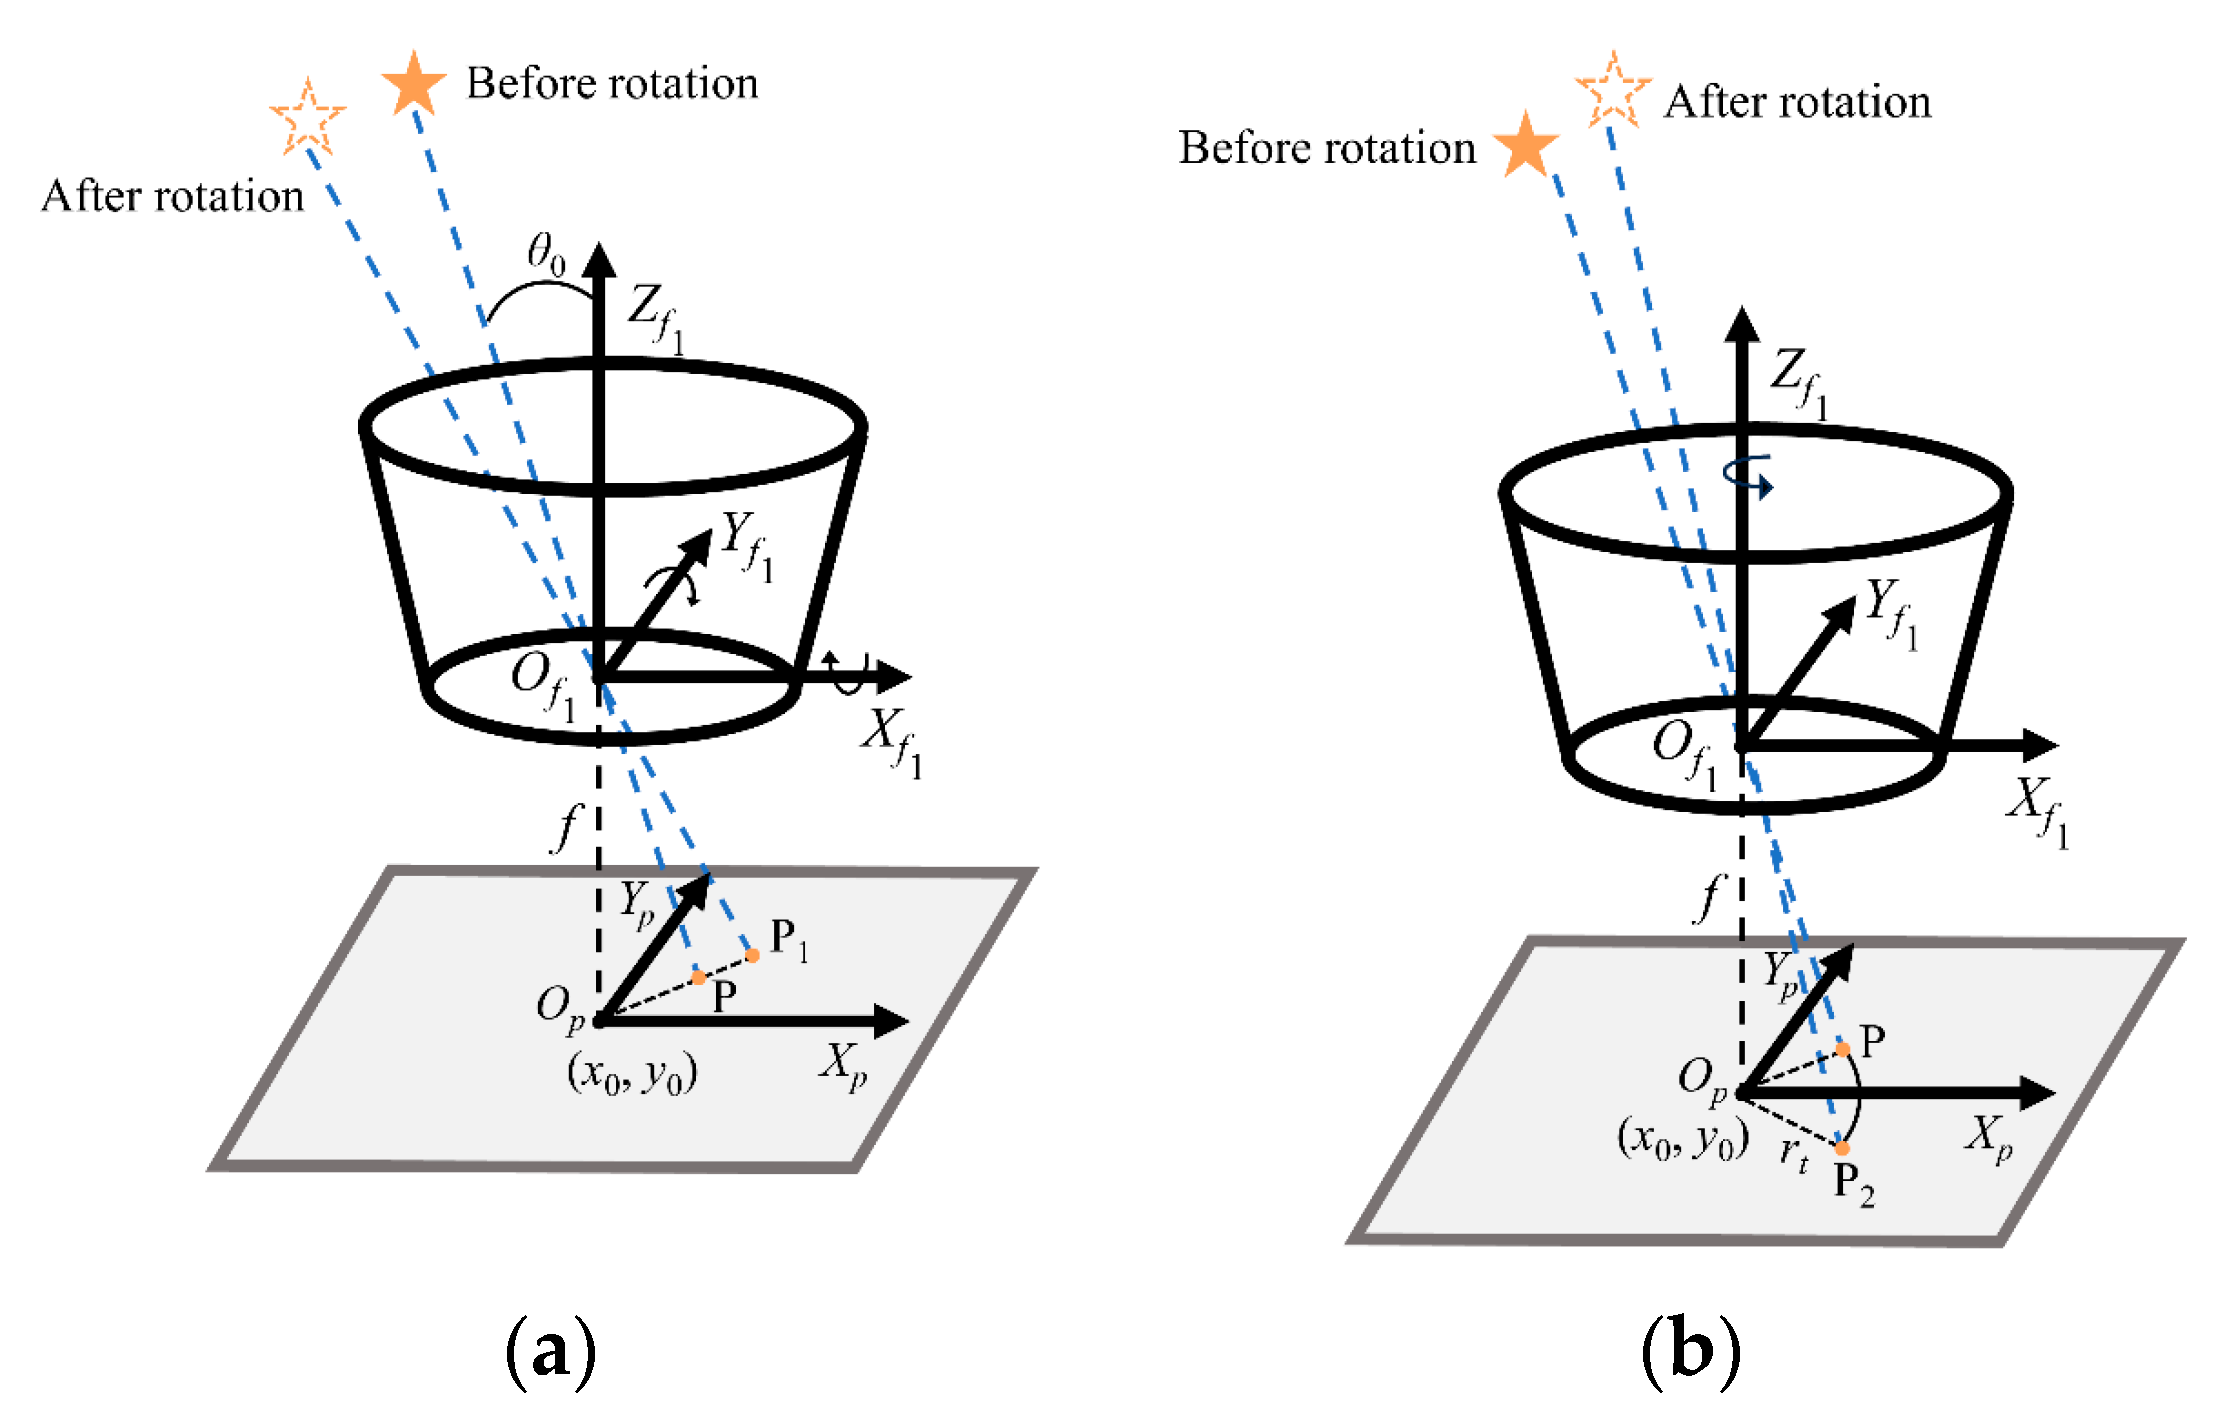
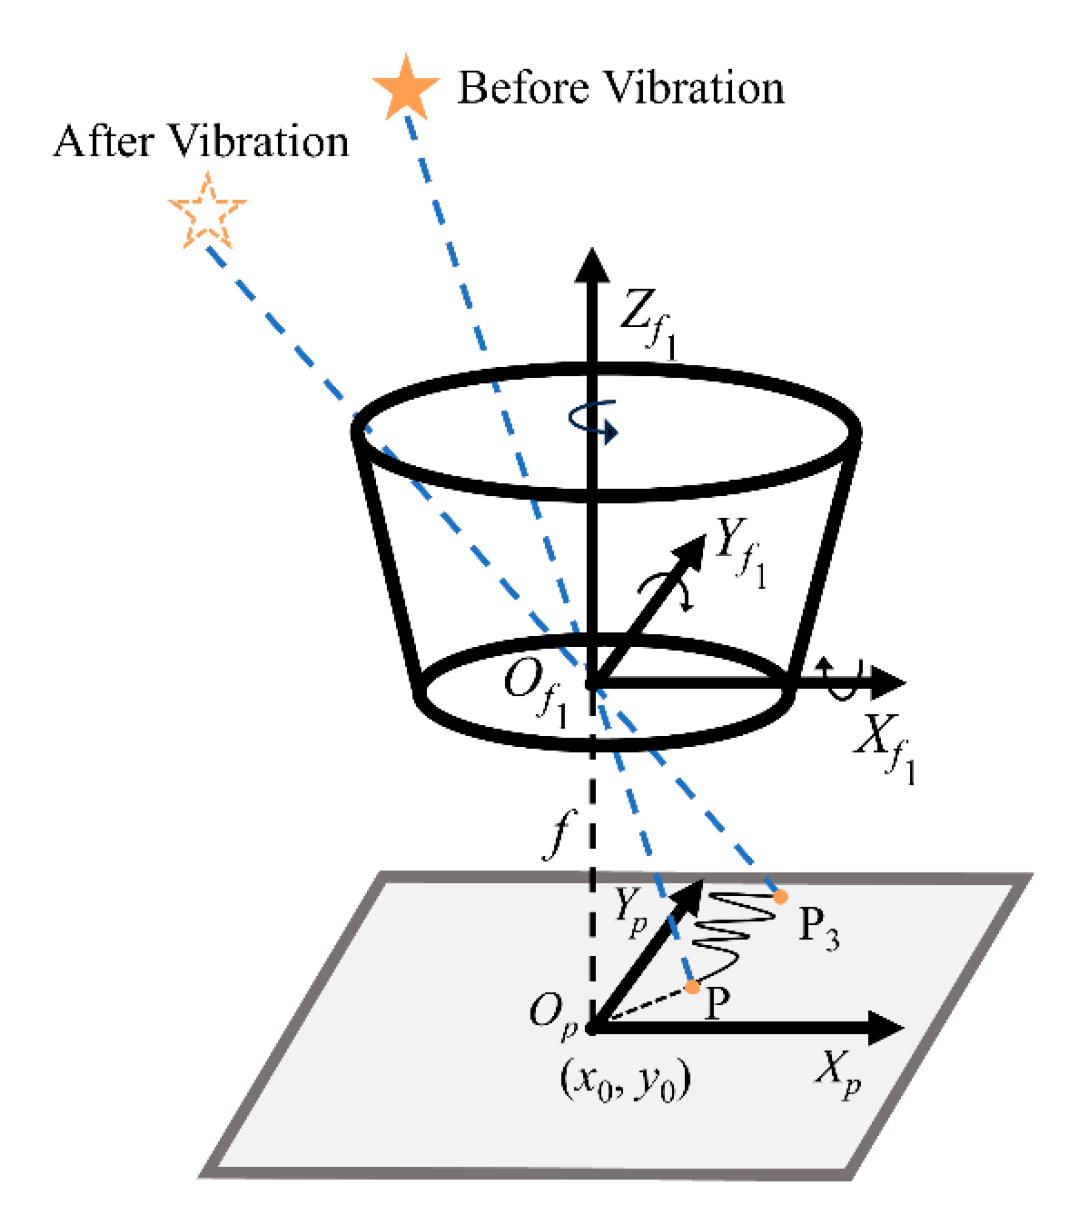
The angular motion of an airborne platform about an arbitrary axis can be decomposed into rotational components about the non-optical axes (Xf1, Yf1) and the optical axis (Zf1) (taking one FOV as an example, see Figure 5). To establish a mathematical model of stellar position offset, the platform’s angular velocity vector is defined as ω = [ωx, ωy, ωz]T. Given the initial stellar coordinates P(x,y) and the angle θ0 between the starlight and the optical axis, the stellar image position during exposure time te is affected by composite rotation [26]:
  • Non-optical axes component contribution: The angular velocities ωx and ωy induce linear displacement of the star spot, as illustrated in Figure 5a. At time t, the displacement components along the image coordinate system axes Xp and Yp, denoted Lx1(t) and Ly1(t) respectively, are given by:
L i ( t ) = f 1 + t a n 2 θ 0 ω j t d p i x e l , i { x 1 , y 1 } , j { y , x }
where t ∈ [0, te]. Under the initial conditions, when θ0 is sufficiently small, the approximation tan(θ0) ≈ 0 can be adopted, allowing the nonlinear terms to be neglected and the model to be simplified as a linear offset model.
2.
Optical-axis component contribution: The angular velocity ωz induces circumferential motion of the star spot about point Op. At time t, the corresponding arc length Lz(t) is given by:
L z ( t ) = r t ω z t = x 2 + y 2 ω z t
Here, rt represents the radial distance between point P(x,y) and point Op. Notably, star spots farther from the optical axis exhibit longer blur trajectories, resulting in more pronounced blurring effects in the peripheral regions of the star map. Let αstart denote the initial angle between the line connecting P(x,y) to Op and the Xp axis. At time t, the star spot moves to position P2(x,y) (Figure 5b), with the corresponding angle relative to the Xp axis being α(t). Based on geometric analysis, the displacement components Lx2(t) and Ly2(t) at this moment can be derived as:
L x 2 ( t ) = r t ( cos α ( t ) cos α s t a r t ) L y 2 ( t ) = r t ( sin α ( t ) sin α s t a r t )
Therefore, by combining the displacement components Lx1(t), Ly1(t), Lx2(t), and Ly2(t), the stellar position offsets Lxr(t) and Lyr(t) induced by the platform’s angular motion can be expressed as:
L x r ( t ) = L x 1 ( t ) + L x 2 ( t ) L y r ( t ) = L y 2 ( t ) L y 1 ( t )

2.2.2. Angular Vibration of the Airborne Platform About an Arbitrary Axis

The imaging quality of the all-time three-FOV star sensor is susceptible to disturbances caused by random angular vibrations of the airborne platform about arbitrary axes. Since starlight can be approximated as a parallel beam due to its long-distance propagation, the effect of vibration on the star spot imaging can be decomposed into angular motions about the platform’s three axes, while the influence of translational components on the star spot position is negligible, as illustrated in Figure 6. During the exposure time te, angular vibrations lead to dispersion in the energy distribution of the star spot on the imaging plane, accompanied by random shifts in the centroid position. The cumulative effect ultimately results in dynamic blurring phenomena.
To accurately model the blurring effects induced by random vibrations, it is essential to analyze the statistical characteristics of the angular vibration signal from the frequency-domain perspective. Assuming that the single-axis angular vibration signal X(t) is a stationary random process that satisfies the Dirichlet conditions, the time-domain signal can be decomposed into a linear superposition of discrete frequency components [27]:
X ( t ) = n = 1 A n cos ( ω n t θ n )
where An denotes the amplitude of the nth frequency component, and θn is the corresponding random initial phase, which follows a uniform distribution over the interval [0, 2π].
To quantify the vibration energy, the mean square value of the signal E[X2(t)] is introduced, which is related to the angular vibration power spectral density function S(ν) as follows:
E [ X 2 ( t ) ] = 1 2 n = 1 A n 2 = + S ( ν ) d ν
With reference to the angular vibration power spectral data developed for the US Altair UAV and ESA’s OLYMPUS satellite, we employ Equation (22) to generate the corresponding angular vibration power spectral density data [27]. The angular vibration power spectral data from the Altair UAV was selected as a reference because it is representative of high-altitude, high-endurance unmanned aerial platforms. The Altair UAV operates at altitudes of 15.8–18.3 km, which is analogous to the operational environment considered for our platform. On this basis, the discrete formulation for the vibration amplitude An can be derived as follows:
S ( ν ) = A 1 + ν 2
A n = 2 ν n 1 ν n S n ( ν ) d ν
where A denotes the angular vibration amplitude coefficient, νn and νn−1 represent the upper and lower bound frequencies, respectively, of the nth sampling band in the vibration power spectrum, and ν is the central frequency of that band.
Considering that vibration energy is predominantly concentrated in the low-frequency band, a logarithmically uniform sampling strategy is adopted in this study to more accurately capture low-frequency-dominated vibration characteristics. By simultaneously solving Equations (16), (18)–(20), and (22)–(23), the random positional deviations Lxa(t) and Lxb(t) of the star spot induced by airborne platform angular vibrations at time t can be obtained. Further combining with the stellar position offsets Lxr(t) and Lyr(t) generated by platform angular motion, the complete expressions for the total stellar position offsets Lx(t) and Ly(t) at time t are derived as:
L x ( t ) = L x r ( t ) + L x a ( t ) L y ( t ) = L y r ( t ) + L y a ( t )

2.3. Energy Modeling of Star Map

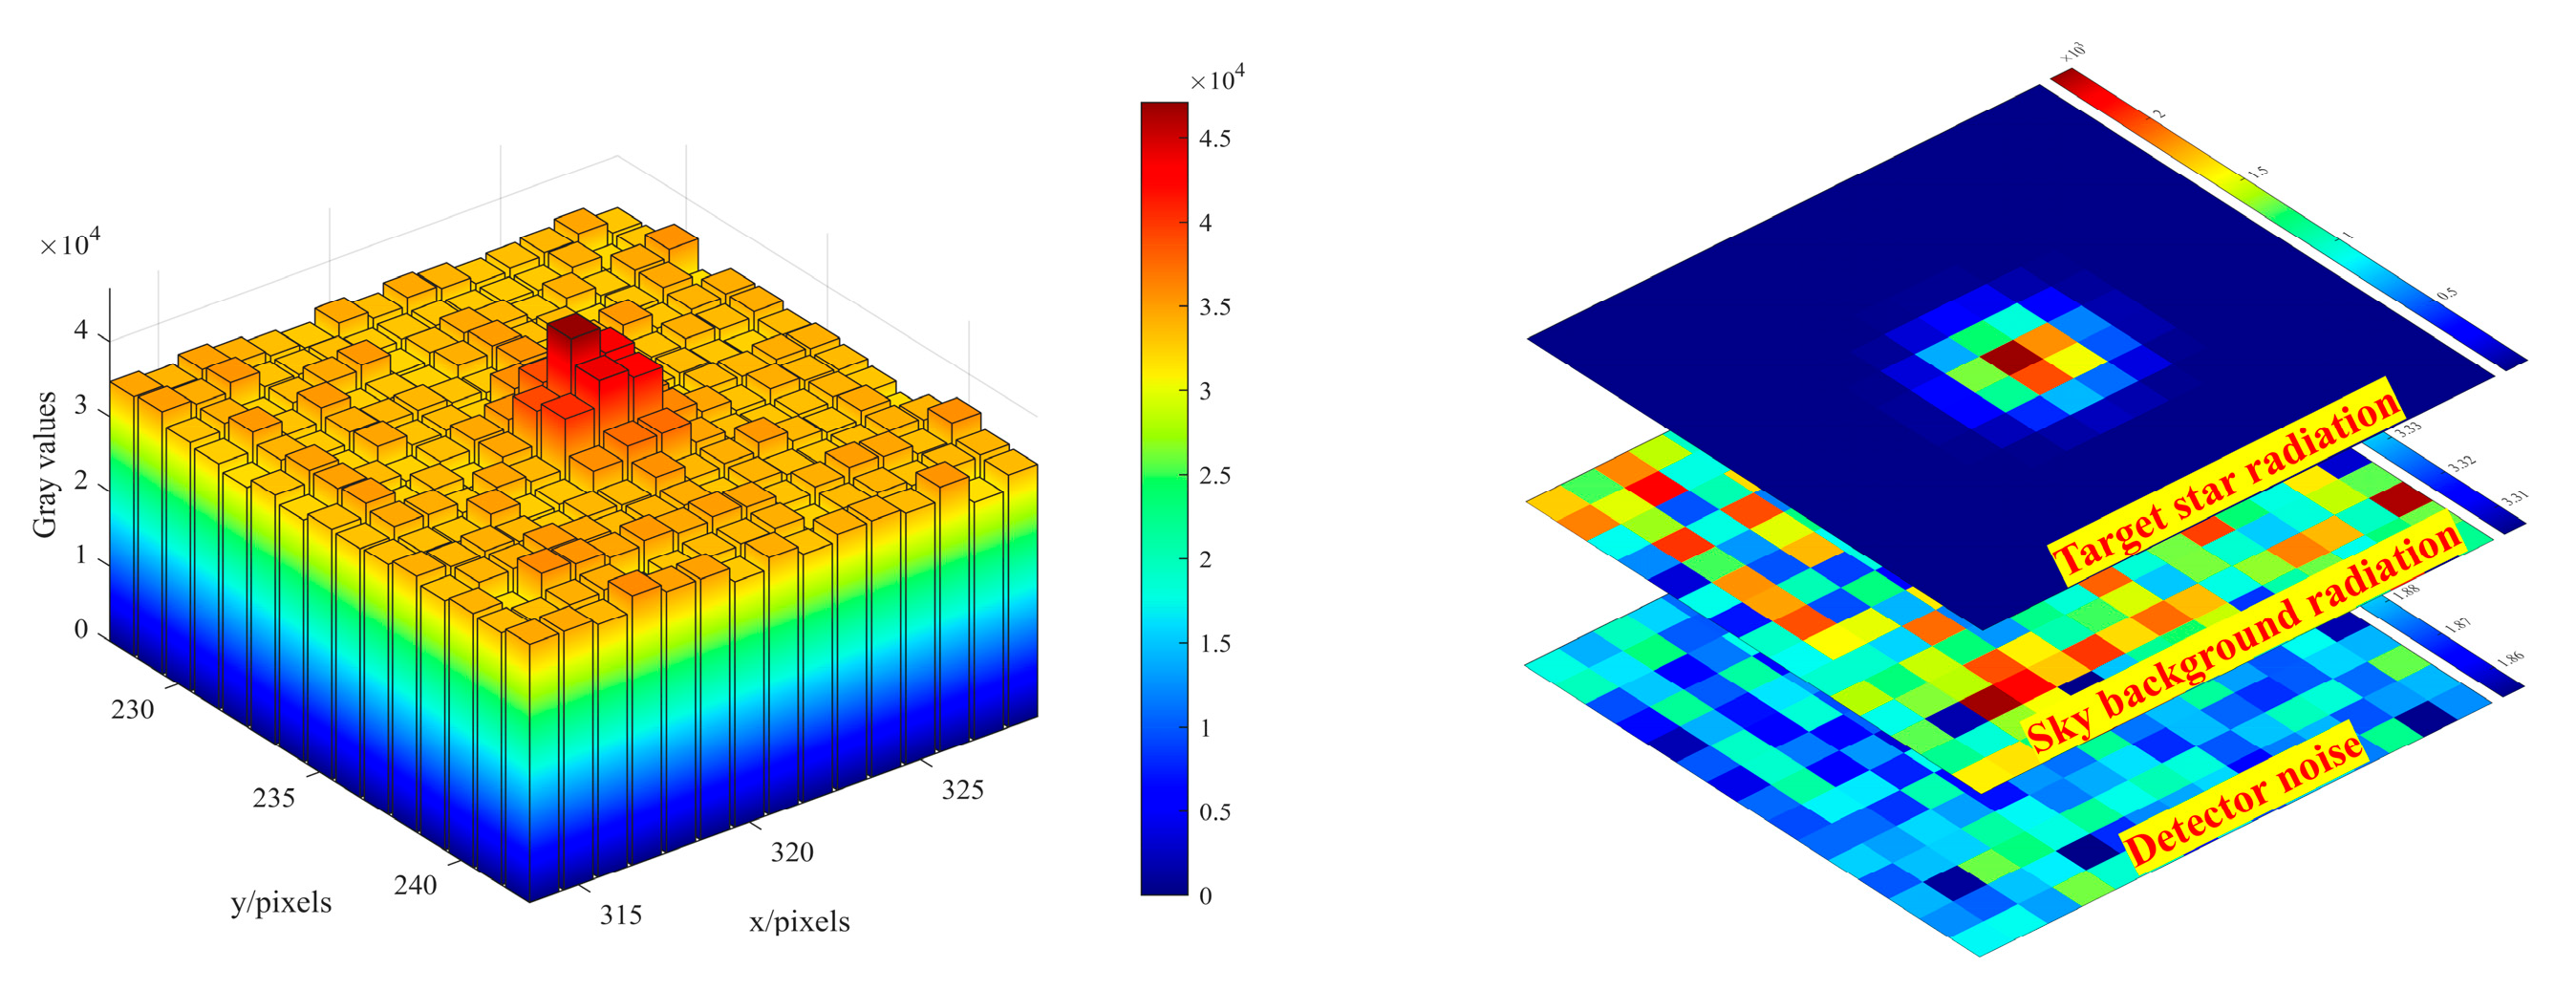
The grayscale values of star maps primarily consist of three key components: (1) the radiant energy from target stars, (2) sky background radiation, and (3) detector noise, as illustrated in Figure 7. To accurately characterize the energy distribution properties of star maps, each component requires individual modeling analysis. Specifically, stellar radiation modeling captures the brightness information of stars, sky background modeling characterizes interference from atmospheric or spatial backgrounds, while detector noise modeling quantifies random errors introduced by the sensor. By integrating these three modeling components, a comprehensive energy model of star maps can be established.

2.3.1. Stellar Radiation Model

Since the detector operates based on photon counting, it is essential to accurately calculate the number of photons radiated by the star. The photon count is closely related to the star’s instrument magnitude, color temperature, and absolute spectral distribution. To precisely determine the photon count, the first step is to establish the star’s relative spectral distribution. In traditional methods, the relative spectral distribution is typically derived from the star’s color temperature. By cross-validating the 2MASS and High-Precision Parallax-Collecting Satellite (HIPPARCOS) catalogs, the spectral type of the star can be determined, from which the color temperature is inferred. Based on the color temperature data, the relative spectral distribution of the star can be approximated using Planck’s law of blackbody radiation, expressed mathematically as follows:
I ( λ , T ) = 2 π h c 2 λ 5 ( e h c / λ k B T 1 )
where h represents Planck’s constant, with a value of 6.626 × 10⁻³⁴ Js; c denotes the speed of light, given as 2.997 × 10⁸ m/s; λ is the wavelength, expressed in micrometers (μm); kB stands for the Boltzmann constant, valued at 1.38 × 10⁻²³ J/K; and T corresponds to the color temperature, measured in Kelvin (K).
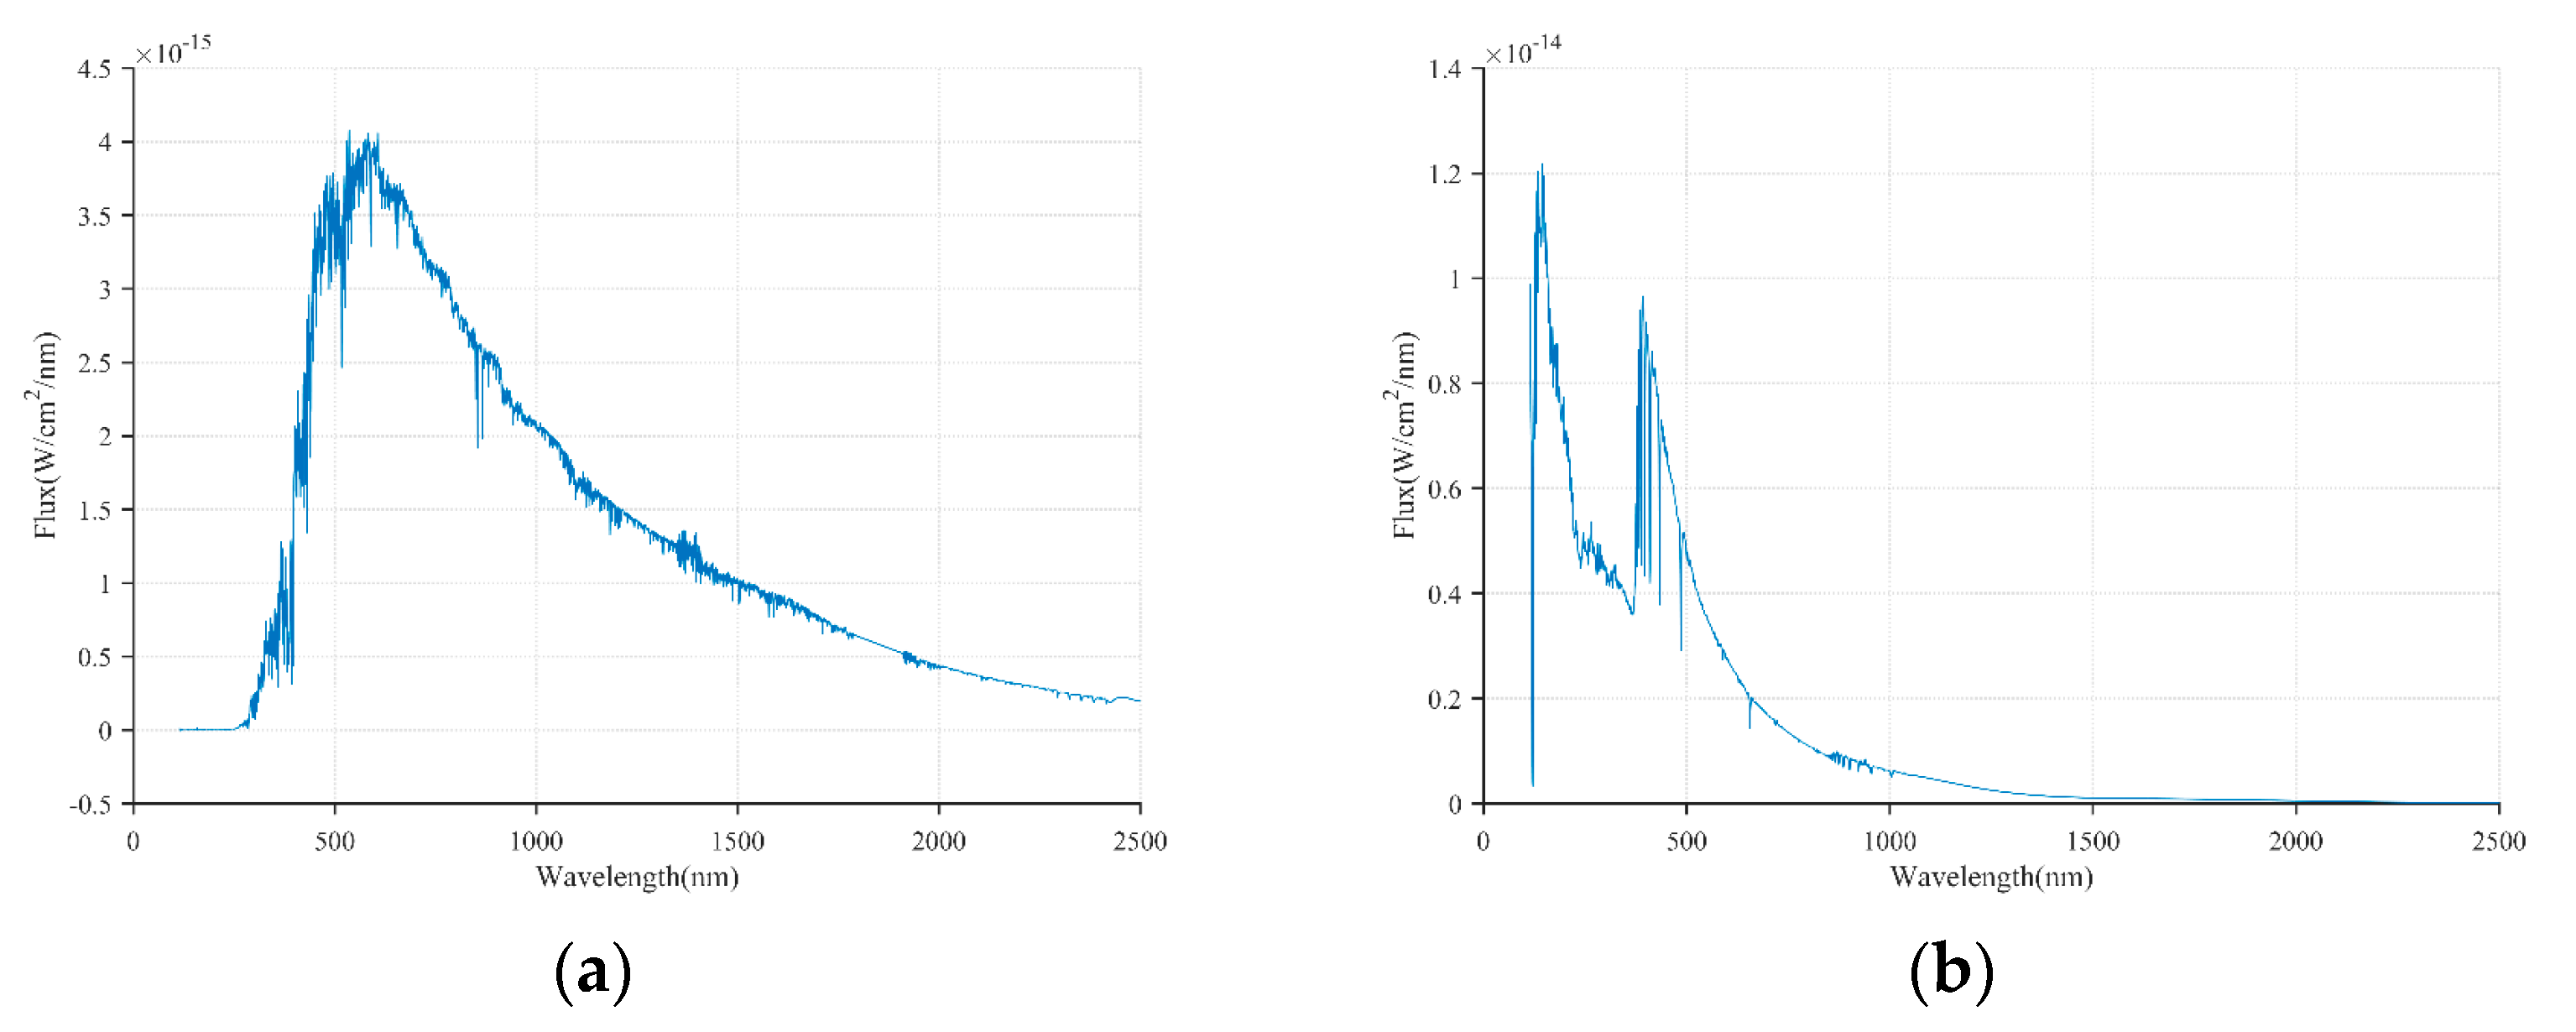
However, the relative spectral distribution of stars approximated using Planck’s law of blackbody radiation may exhibit certain deviations from the actual spectral distribution. To improve the accuracy of the spectral distribution, this study employs stellar spectral data from the INGS and Pickles stellar spectral catalogs to approximate the relative spectral distribution of stars. The INGS stellar spectral catalog integrates 143 stellar spectra from three catalogs (IUE, NGSL, and SpeX/IRTF), while the Pickles stellar spectral catalog contains 131 stellar spectra. By merging these two catalogs, we established a comprehensive spectral catalog comprising 161 stellar spectra [28,29]. As illustrated in Figure 8, the relative spectral distribution curves of two representative stellar types (e.g., K-type and B-type stars) are presented. These databases provide extensive spectral data, enabling a more accurate representation of the true spectral characteristics of stars, thereby offering reliable data support for the precise calculation of stellar photon counts.
Since the absolute spectral distribution of a star is closely related to its magnitude, and the detector’s response band is the SWIR band, this study calibrates the relative spectral distribution using the H-band magnitude to derive the absolute spectral distribution. Based on the absolute spectral distribution, the photon count Sm incident on the detector can be further calculated, as expressed in Equation (26) [30].
S m = λ 1 λ 2 f ( λ ) τ 0 ( H , μ , λ ) π D 2 4 T 0 ( λ ) t e λ h c Q E ( λ ) d λ
where f(λ) represents the absolute spectral distribution of the target star in units of W·m−2·μm−1, τ0(H,μ,λ) denotes the atmospheric transmittance at the observation altitude H, zenith angle μ, and wavelength λ, D is the aperture diameter of the optical system, T0(λ) stands for the transmittance of the optical system, and QE(λ) indicates the quantum efficiency of the detector.
For stars with unknown spectral types or those lacking spectral data in the Pickles and INGS stellar spectral catalogs, this study employs the method from Reference [17] to calculate photon counts. The specific procedure consists of the following steps: First, instrument magnitudes (Mins) are determined for stars with known spectral distribution, adopting Vega (A0V spectral type) as the zero-point reference (Mins = 0), as formulated in Equations (27) and (28).
M i n s = 2.5 lg λ 1 λ 2 f ( λ ) h c / λ T 0 ( λ ) Q E ( λ ) λ d λ M r e f
M r e f = 2.5 lg λ 1 λ 2 f r e f ( λ ) h c / λ T 0 ( λ ) Q E ( λ ) λ d λ
where Mref denotes the instrument magnitude of Vega, fref(λ) represents the absolute spectral distribution of Vega.
Subsequently, based on the target star’s J-band magnitude (MJ) and H-band magnitude (MH), combined with the instrument magnitude calculation method proposed in Reference [17], the instrument magnitude is derived using the target star’s regression coefficients (β0 and β1). The specific calculation formula is given below:
M i n s M H = β 0 + β 1 ( M J M H )
Finally, the photon count of the target star on the detector focal plane can be derived from its instrument magnitude and the photon count Sm0 of Vega received by the detector focal plane, as given in Equation (30).
S m = S m 0 2.512 M i n s

2.3.2. Sky Background Radiation Model

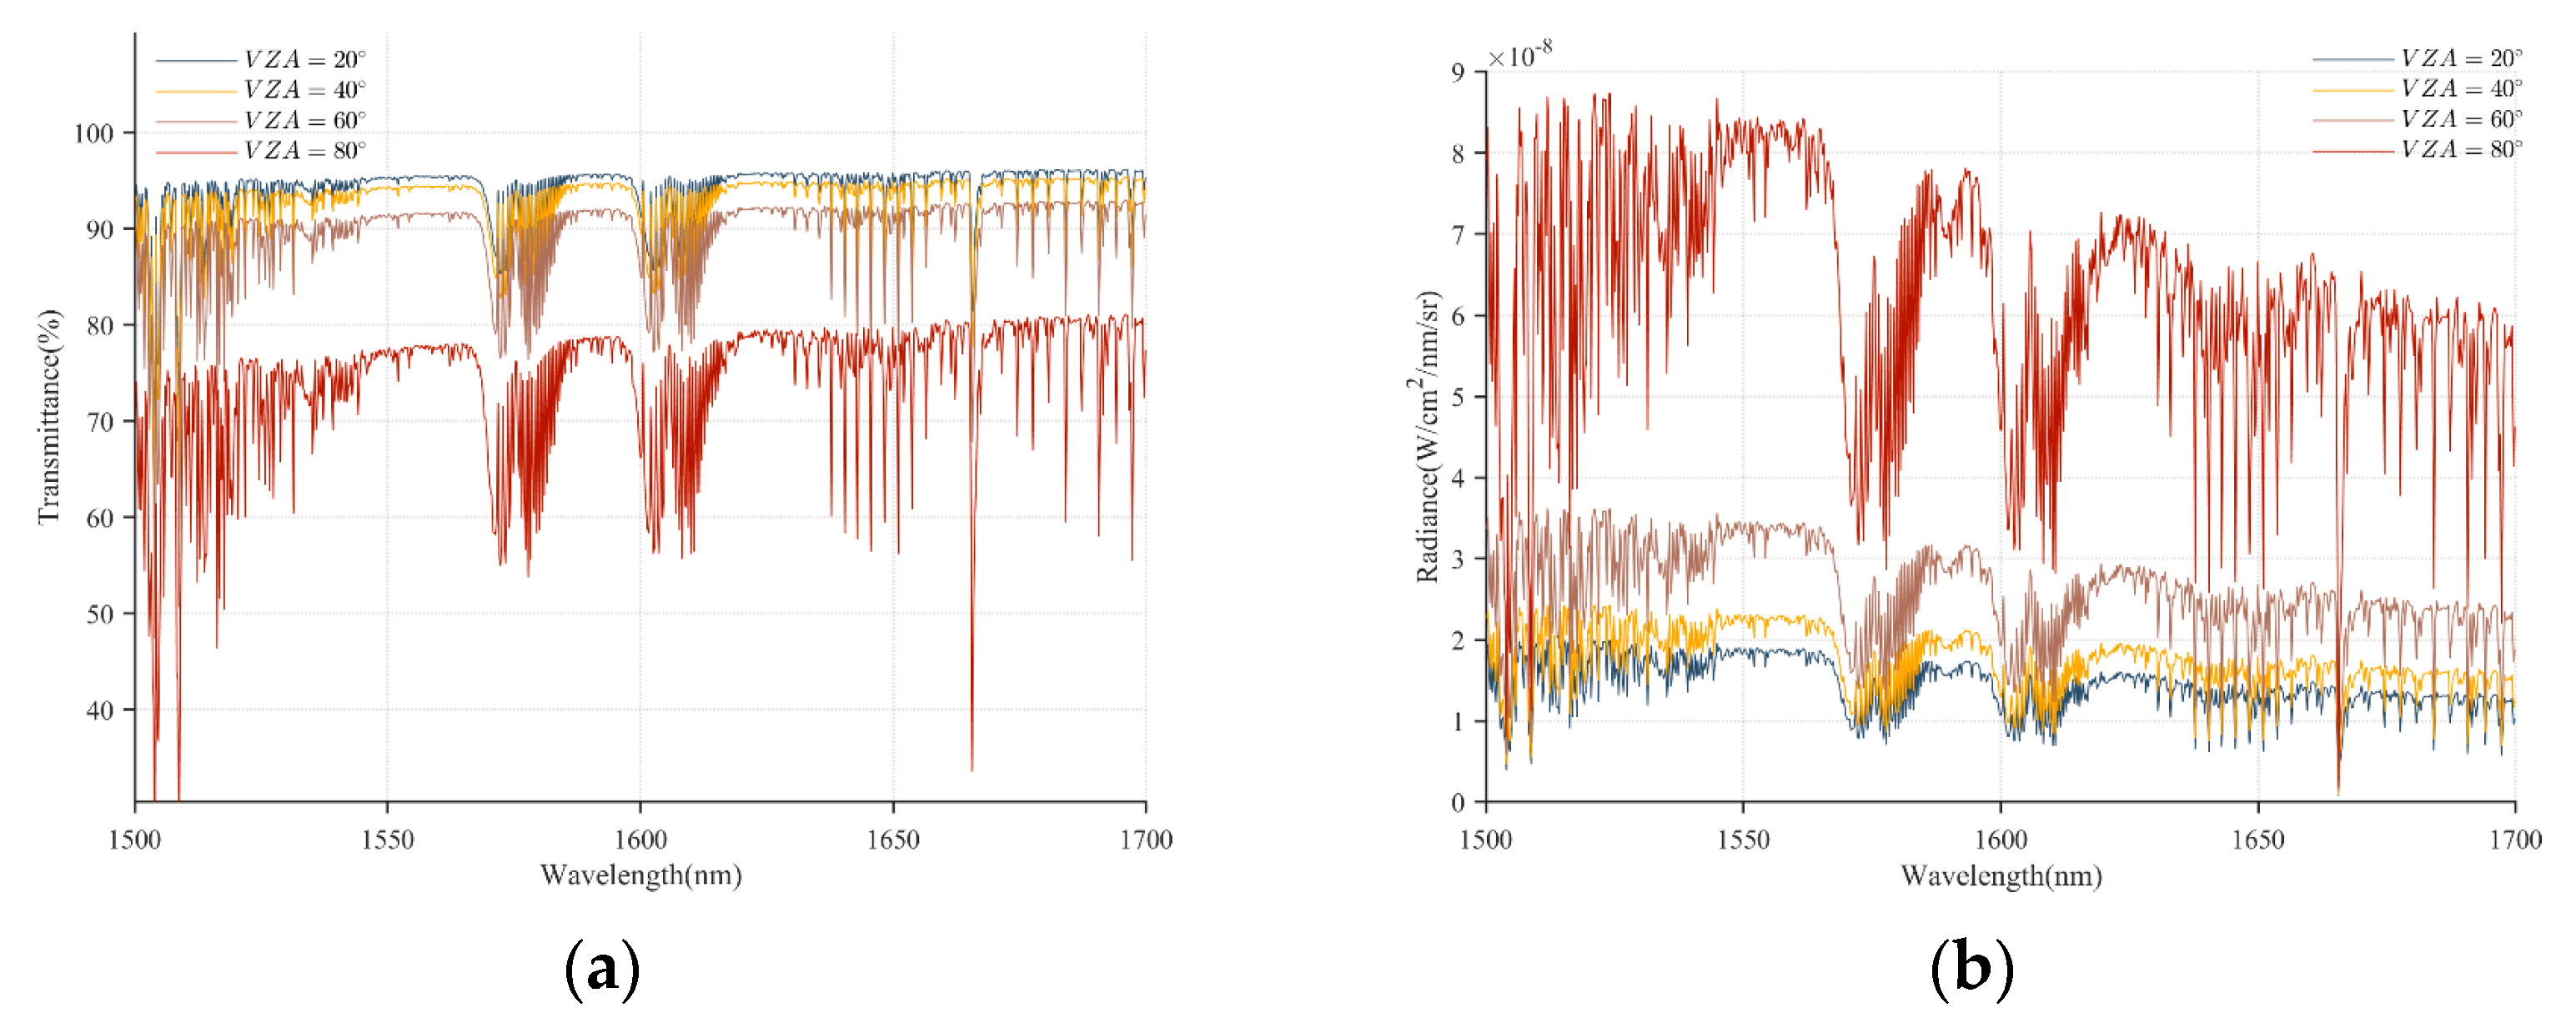
When observing stars during daytime, the all-time three-FOV star sensor is susceptible to interference from sky background radiation. Therefore, to accurately assess the impact of sky background radiation on stellar observations, it is necessary to calculate the sky background radiation and convert it into corresponding photon counts. In this study, MODTRAN software was employed for simulation—a widely used tool for atmospheric radiative transfer modeling. By inputting atmospheric parameters (e.g., aerosol distribution, visibility) and observational conditions (e.g., VZA, SZA, SAA, and observation altitude), MODTRAN generates corresponding atmospheric transmittance and sky background radiance data. The simulation results are presented in Figure 9. It is important to note that at a given location, atmospheric transmittance is highly dependent on the VZA. A smaller VZA results in a shorter atmospheric path length and consequently higher atmospheric transmittance. Conversely, the intensity of the sky background radiance is primarily governed by the angular distance between the optical axis and the direction of the sun. For nighttime stellar observation, the MODTRAN configuration for lunar-induced sky background radiation follows a similar logic to that of solar-induced daytime radiation: by inputting the VZA, lunar zenith angle (LZA), lunar azimuth angle (LAA), and lunar phase angle (LPA), we can determine the intensity of lunar-related sky background radiation.
With the sky background radiation data provided by the MODTRAN, the number of photons received by each detector pixel from the sky background can be calculated as follows:
S b g k = λ 1 λ 2 f b ( λ ) τ 0 ( H , μ , λ ) π D 2 4 T 0 ( λ ) t e λ h c Q E ( λ ) σ f 2 d λ
where fb(λ) represents the spectral distribution of sky background radiance, λ1 and λ2 denote the lower and upper bounds of the detector’s response band respectively, and σ corresponds to the area of an individual pixel.

2.3.3. Detector Noise Model

The star maps acquired by the all-time three-FOV star sensor typically contain multiple noise sources, primarily including stellar photon shot noise, sky background radiation shot noise, dark current shot noise, photo-response non-uniformity (PRNU) noise, dark current non-uniformity (DCNU) noise, and readout noise. Under conditions of weak starlight and sky background radiation, the dominant noise source in the detector is readout noise, which generally remains constant. As the intensity of starlight and sky background radiation increases, the primary noise source transitions to shot noise, whose amplitude is proportional to the square root of the signal intensity. When the signal further intensifies, PRNU and DCNU noise become the predominant noise sources, manifesting as pixel response non-uniformity.
Following the theoretical analysis presented above, a systematic noise model can be established for simulated star maps of the all-time three-FOV star sensor. Let In denote the noise matrix. The influence of readout noise, stellar photon shot noise, sky background radiation shot noise, and dark current shot noise on the star maps is first considered, which can be calculated as follows:
I n = I s + I b + I d t e + σ r e a d 2
where Is denotes the matrix containing only photon counts from stellar radiation, Ib represents the matrix containing only photon counts from sky background radiation, Id corresponds to the dark current in units of electrons per second (e-/s), and σ r e a d 2 denotes the readout noise.
Building upon this foundation, PRNU and DCNU noise are further incorporated. Assuming the pixel response non-uniformity matrix Ur follows a Gaussian distribution with zero mean and standard deviation std, the total star map energy Im can be expressed as:
I m = ( I s + I b + I n ) ( 1 + U r )

2.4. Stellar Energy Distribution

To achieve subpixel-level centroid localization accuracy, a defocused optical design is typically employed to disperse stellar energy across a 3 × 3 pixel region on the detector, ensuring the energy distribution closely approximates a two-dimensional Gaussian profile. Consequently, under static conditions, the stellar energy distribution on the detector focal plane can be mathematically described by the following expression:
I s ( x , y ) = 0.5 + m 0 0.5 + m 0 0.5 + n 0 0.5 + n 0 I 0 2 π σ p s f 2 exp x 2 + y 2 2 σ p s f 2 d x d y
where m0 and n0 denote the distances from pixel (x,y) to the stellar projection center along the x and y axis directions, respectively. I0 represents the total stellar energy accumulated on the detector focal plane during the exposure time te, while σpsf stands for the Gaussian dispersion radius, which characterizes the defocusing level of the optical system. The Gaussian dispersion radius σpsf adopted in this work was calculated from real star maps acquired in the laboratory using a collimator. The extraction method corresponded to the parameter estimation algorithm detailed in Section 3.1 of Reference [31], which computes σpsf by solving equations based on the ratios of grayscale sums within a 3 × 3 pixel window surrounding the stellar image spot [31]. To enhance reliability, the final value of σpsf was determined by averaging the results obtained from multiple star spots.
For dynamic conditions, Equation (34) requires modification to reflect platform motion effects on the stellar energy distribution, as shown in Equation (35):
I s ( x , y ) = 0 t e 0.5 + m 0 L x ( t ) 0.5 + m 0 L x ( t ) 0.5 + n 0 L y ( t ) 0.5 + n 0 L y ( t ) I 0 2 π σ p s f 2 t e exp x 2 + y 2 2 σ p s f 2 d x d y d t
To reduce computational complexity and improve real-time performance, the integral can be approximated in summation form. Through temporal discretization, the stellar energy distribution under dynamic conditions can be approximated as follows:
I s ( x , y ) = i = 0 N 1 0.5 + m 0 L x ( Δ t i ) 0.5 + m 0 L x ( Δ t i ) 0.5 + n 0 L y ( Δ t i ) 0.5 + n 0 L y ( Δ t i ) I 0 2 π σ p s f 2 N exp x 2 + y 2 2 σ p s f 2 d x d y
where N denotes the total number of time steps, and Δt represents the duration of each time step, satisfying Δt = te/N. To ensure the accuracy of temporal discretization, Δt must be maintained well below 1 millisecond, with N = 1000 selected in this study. While this choice of N = 1000 ensures high fidelity in modeling the dynamic trailing effect, it does increase the computational load proportionally. In practice, the simulation runtime for a single dynamic star map is approximately 13 s on a standard workstation (Intel i7-14700HX, 16 GB RAM) using MATLAB 2022b. For real-time applications or large-scale batch simulations, the value of N could be adaptively reduced based on the angular velocity or the required accuracy, trading off some precision for computational efficiency.

3. Star Map Simulation and Validation

3.1. Evaluation Metrics

This study establishes a multi-dimensional star map simulation quality assessment system, which systematically verifies simulation results through four evaluation metrics: the signal-to-noise ratio (SNR) characterizes the relative relationship between stellar signal intensity and background noise intensity, the total grayscale value (Gtotal) reflects the total energy of star points, the grayscale concentration index (GCI) describes the spatial distribution characteristics of energy, and the dynamic star displacement (DSD) quantifies the degree of geometric deformation. This comprehensive evaluation framework assesses the degradation characteristics of star maps under dynamic disturbance conditions from multiple dimensions, providing a scientific quantitative basis for validating the effectiveness and accuracy of simulation methods.
The SNR is defined as the ratio of the difference between the average grayscale value of the star spot (If) within a 3 × 3 pixel region and the average grayscale value of the background region (Ig) to the system noise. A higher SNR value indicates that the stellar signal is more distinguishable from the background noise. The calculation formula is as follows:
SNR = I f I g σ b / 3
where σb represents the standard deviation of the grayscale values in the background region.
The Gtotal is defined as the cumulative grayscale value of all pixels within the star’s core region (3 × 3 pixels) after subtracting the background grayscale value, expressed as follows:
G total = i = x m 1 x m + 1 j = y m 1 y m + 1 ( I i j I g )
where Iij represents the grayscale value of each pixel within the 3 × 3 pixel region, xm and ym denote the stellar centroid coordinates.
The GCI is defined as the ratio of the background-subtracted cumulative grayscale values between the star’s core region (3 × 3 pixels) and a larger surrounding area (7 × 7 pixels), serving to quantitatively characterize the spatial distribution characteristics of stellar energy, expressed mathematically as:
GCI = i = x m 1 x m + 1 j = y m 1 y m + 1 ( I i j I g ) i = x m 3 x m + 3 j = y m 3 y m + 3 ( I i j I g )
The DSD is defined as the major axis length of the star spot along the direction of motion in the image plane, which quantitatively reflects the star trailing effect induced by platform motion. Specifically, the original image undergoes Gaussian filtering for noise reduction, followed by Otsu threshold segmentation to extract the binarized star spot regions. Subsequently, morphological processing is applied to identify connected domains. Finally, the major axis length is determined through region property analysis of the measured image.

3.2. Simulation Results

The parameters of the all-time three-FOV star sensor employed in this study are presented in Table 1 (optical system) and Table 2 (detector), wherein the SWIR detector adopts the Bobcat-640 from Xenics. The simulation observation site was geographically positioned at 100.23°E longitude and 26.86°N latitude (altitude: 2388 m). Considering that the sky background radiation intensity encountered by airborne platforms is significantly lower than ground-based observations, the morning of 30 December 2024 (UTC + 8) was selected as the simulation period, during which the sky background radiation intensity better approximates airborne conditions. The MODTRAN simulation parameters were configured as follows: the 1976 U.S. Standard Atmosphere model was adopted with a CO2 mixing ratio of 419.3 ppmv, rural aerosol model (visibility: 30 km), and no cloud or rain. Extreme weather events are not yet incorporated in the current model; relevant research on their impact will be conducted in subsequent tasks. The pixel response non-uniformity matrix Ur conforms to a normal distribution characterized by zero mean and a variance of 0.00532. The optical axis orientations of the three FOV coordinate systems in GCRS are specified as: FOV1 (169.2313°, −14.3330°), FOV2 (241.7068°, 8.8859°), and FOV3 (165.6247°, 61.1346°).
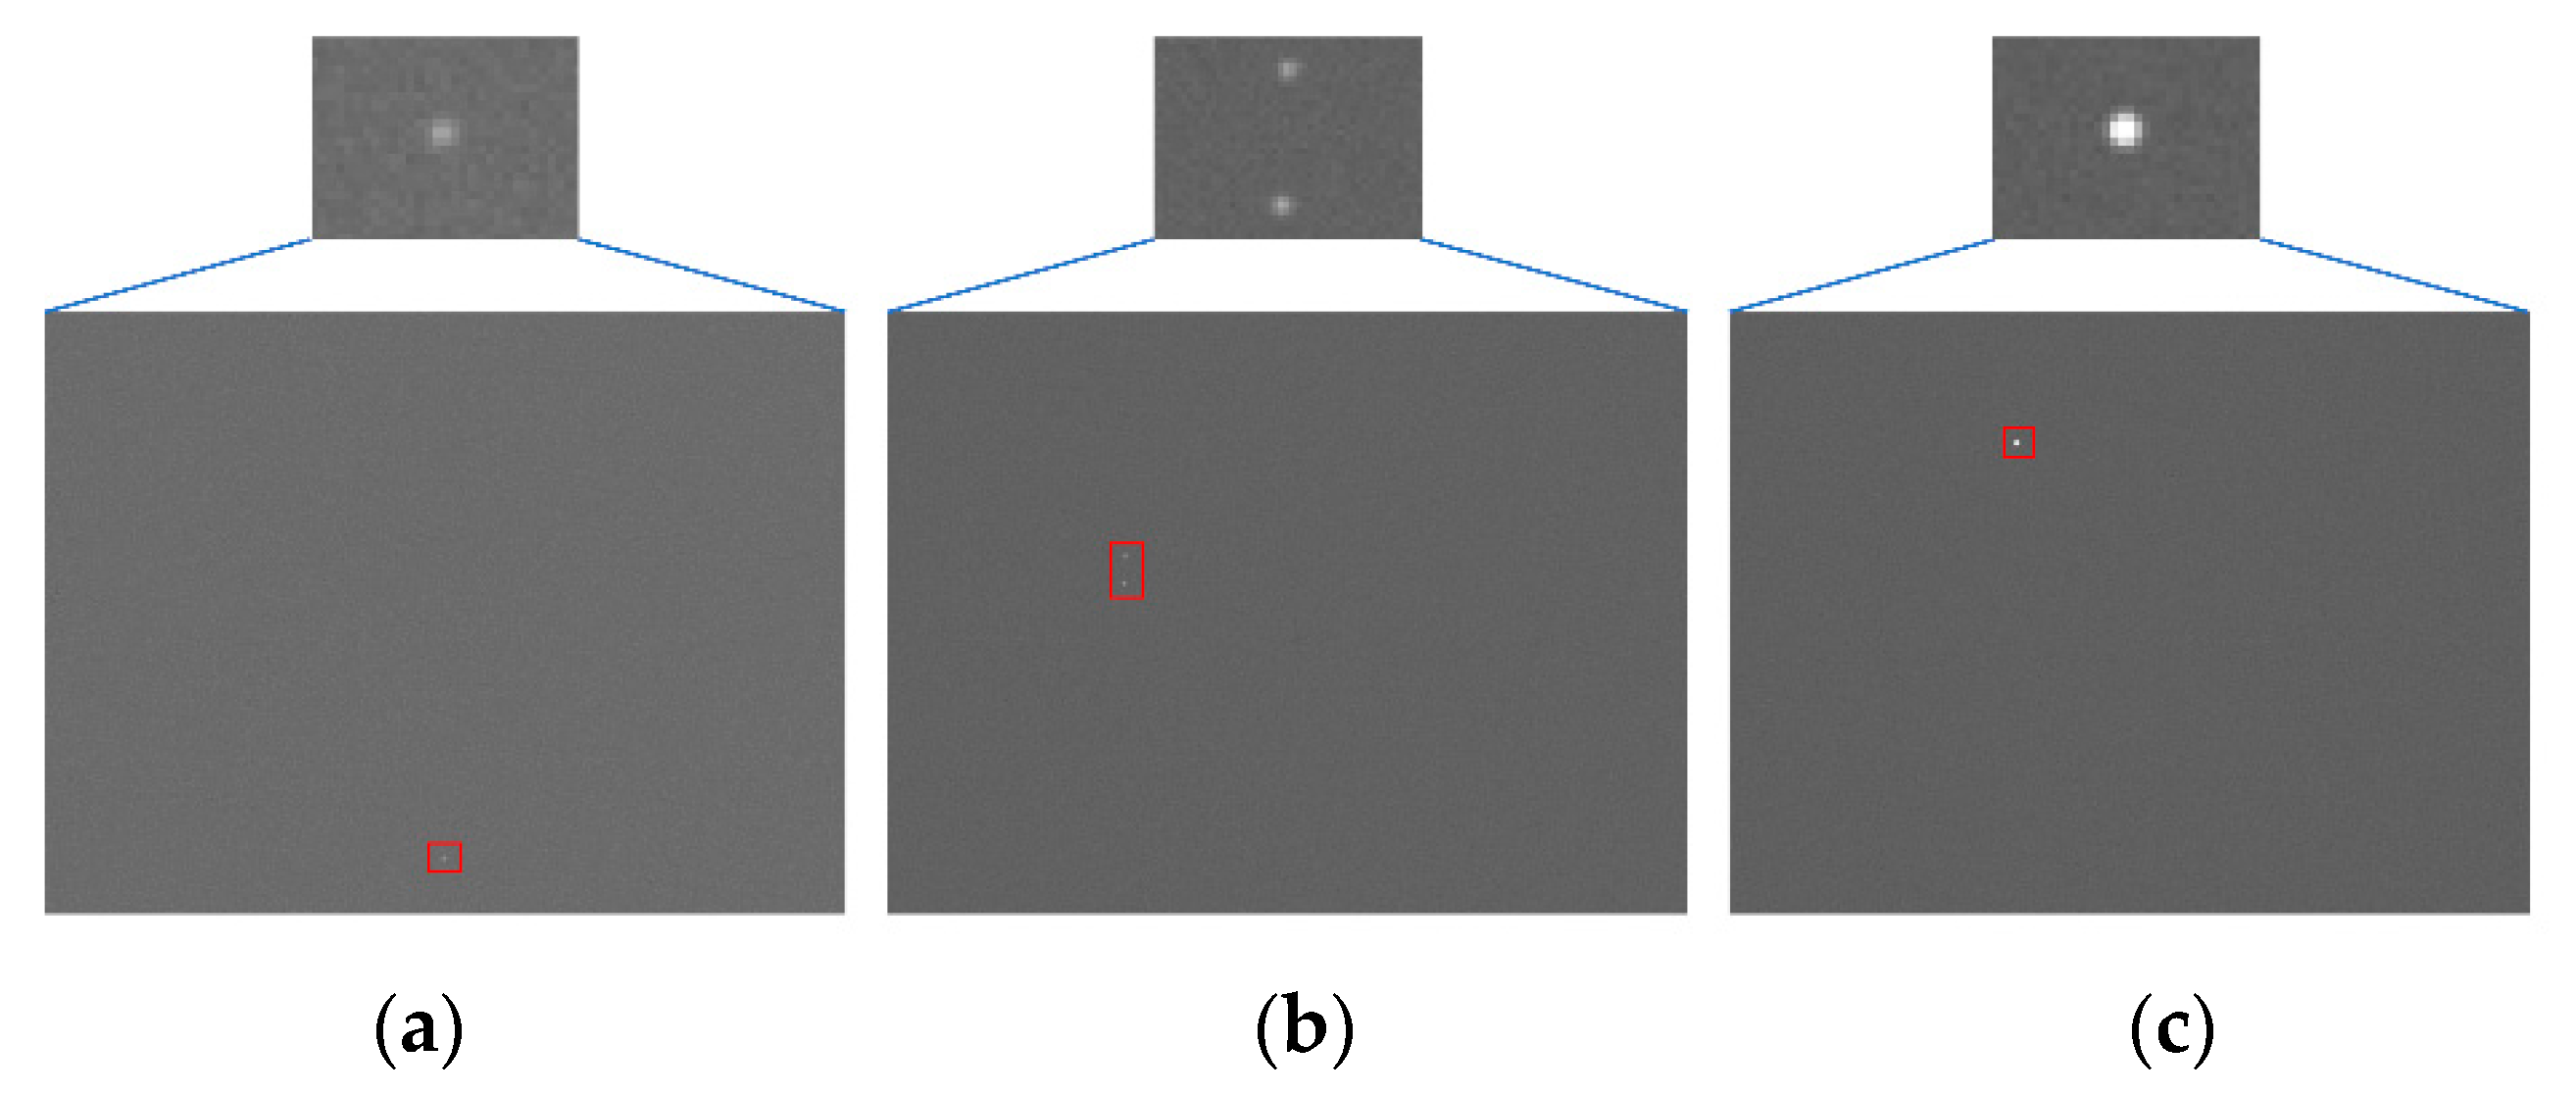
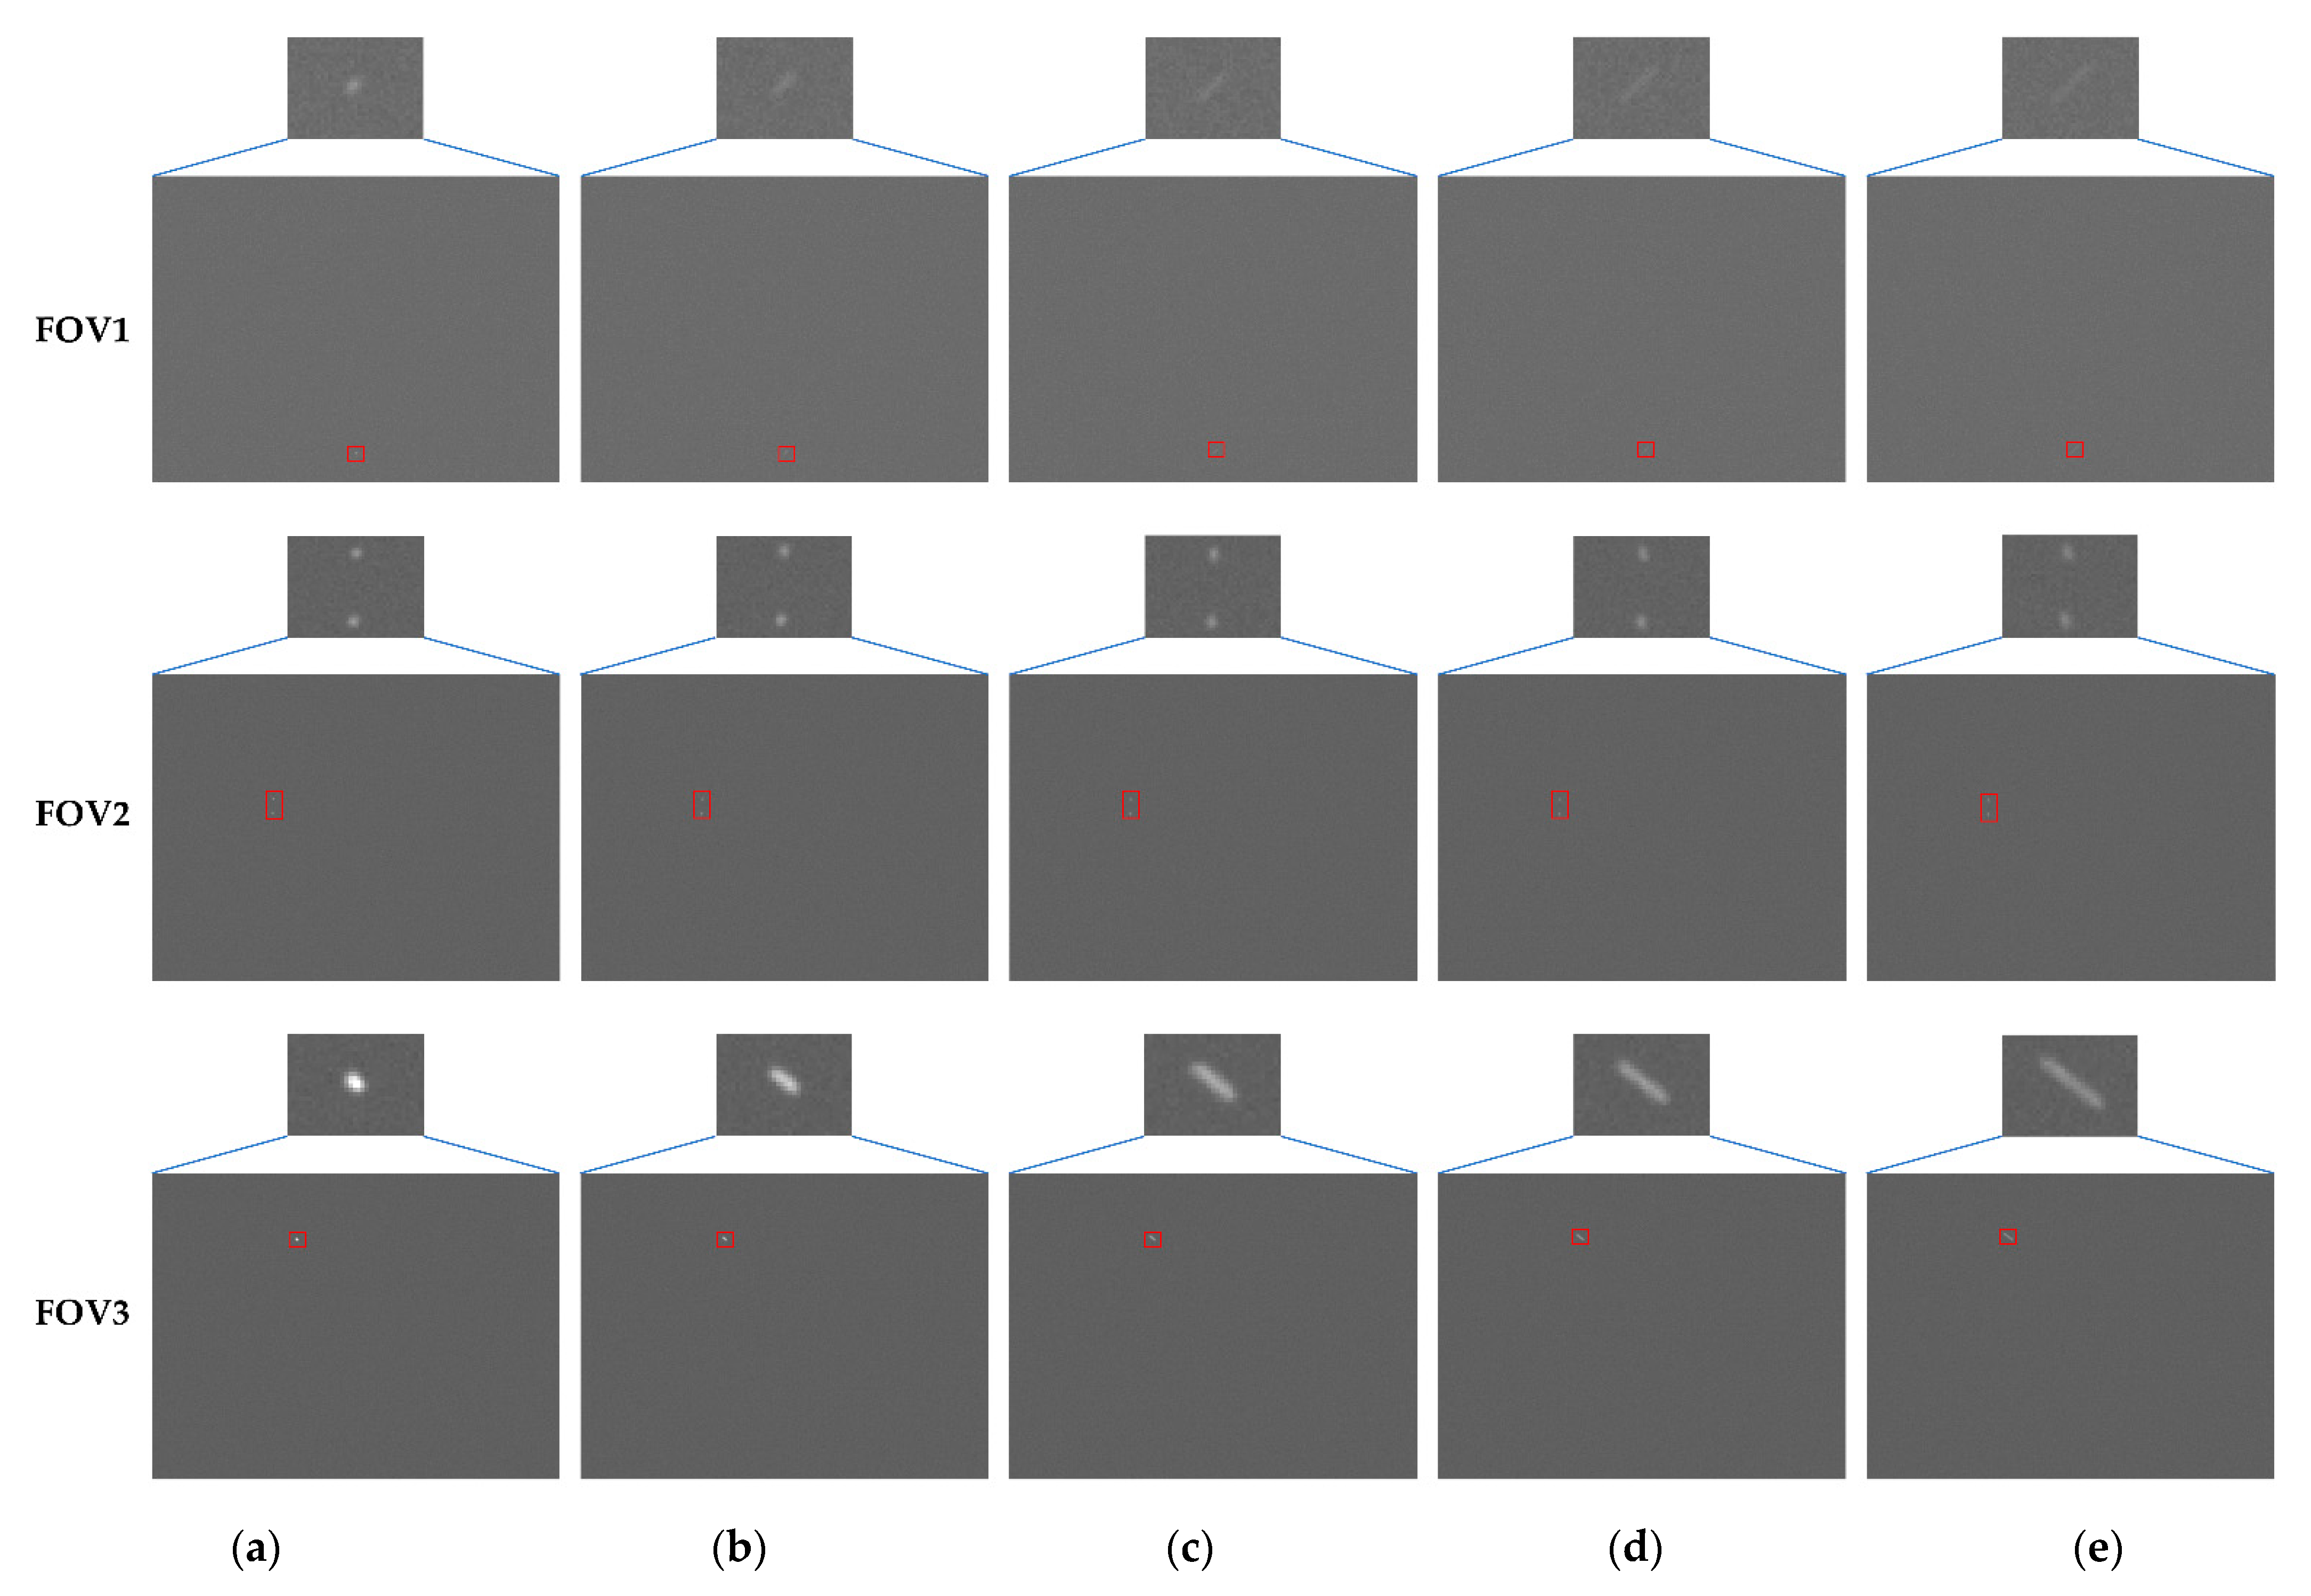
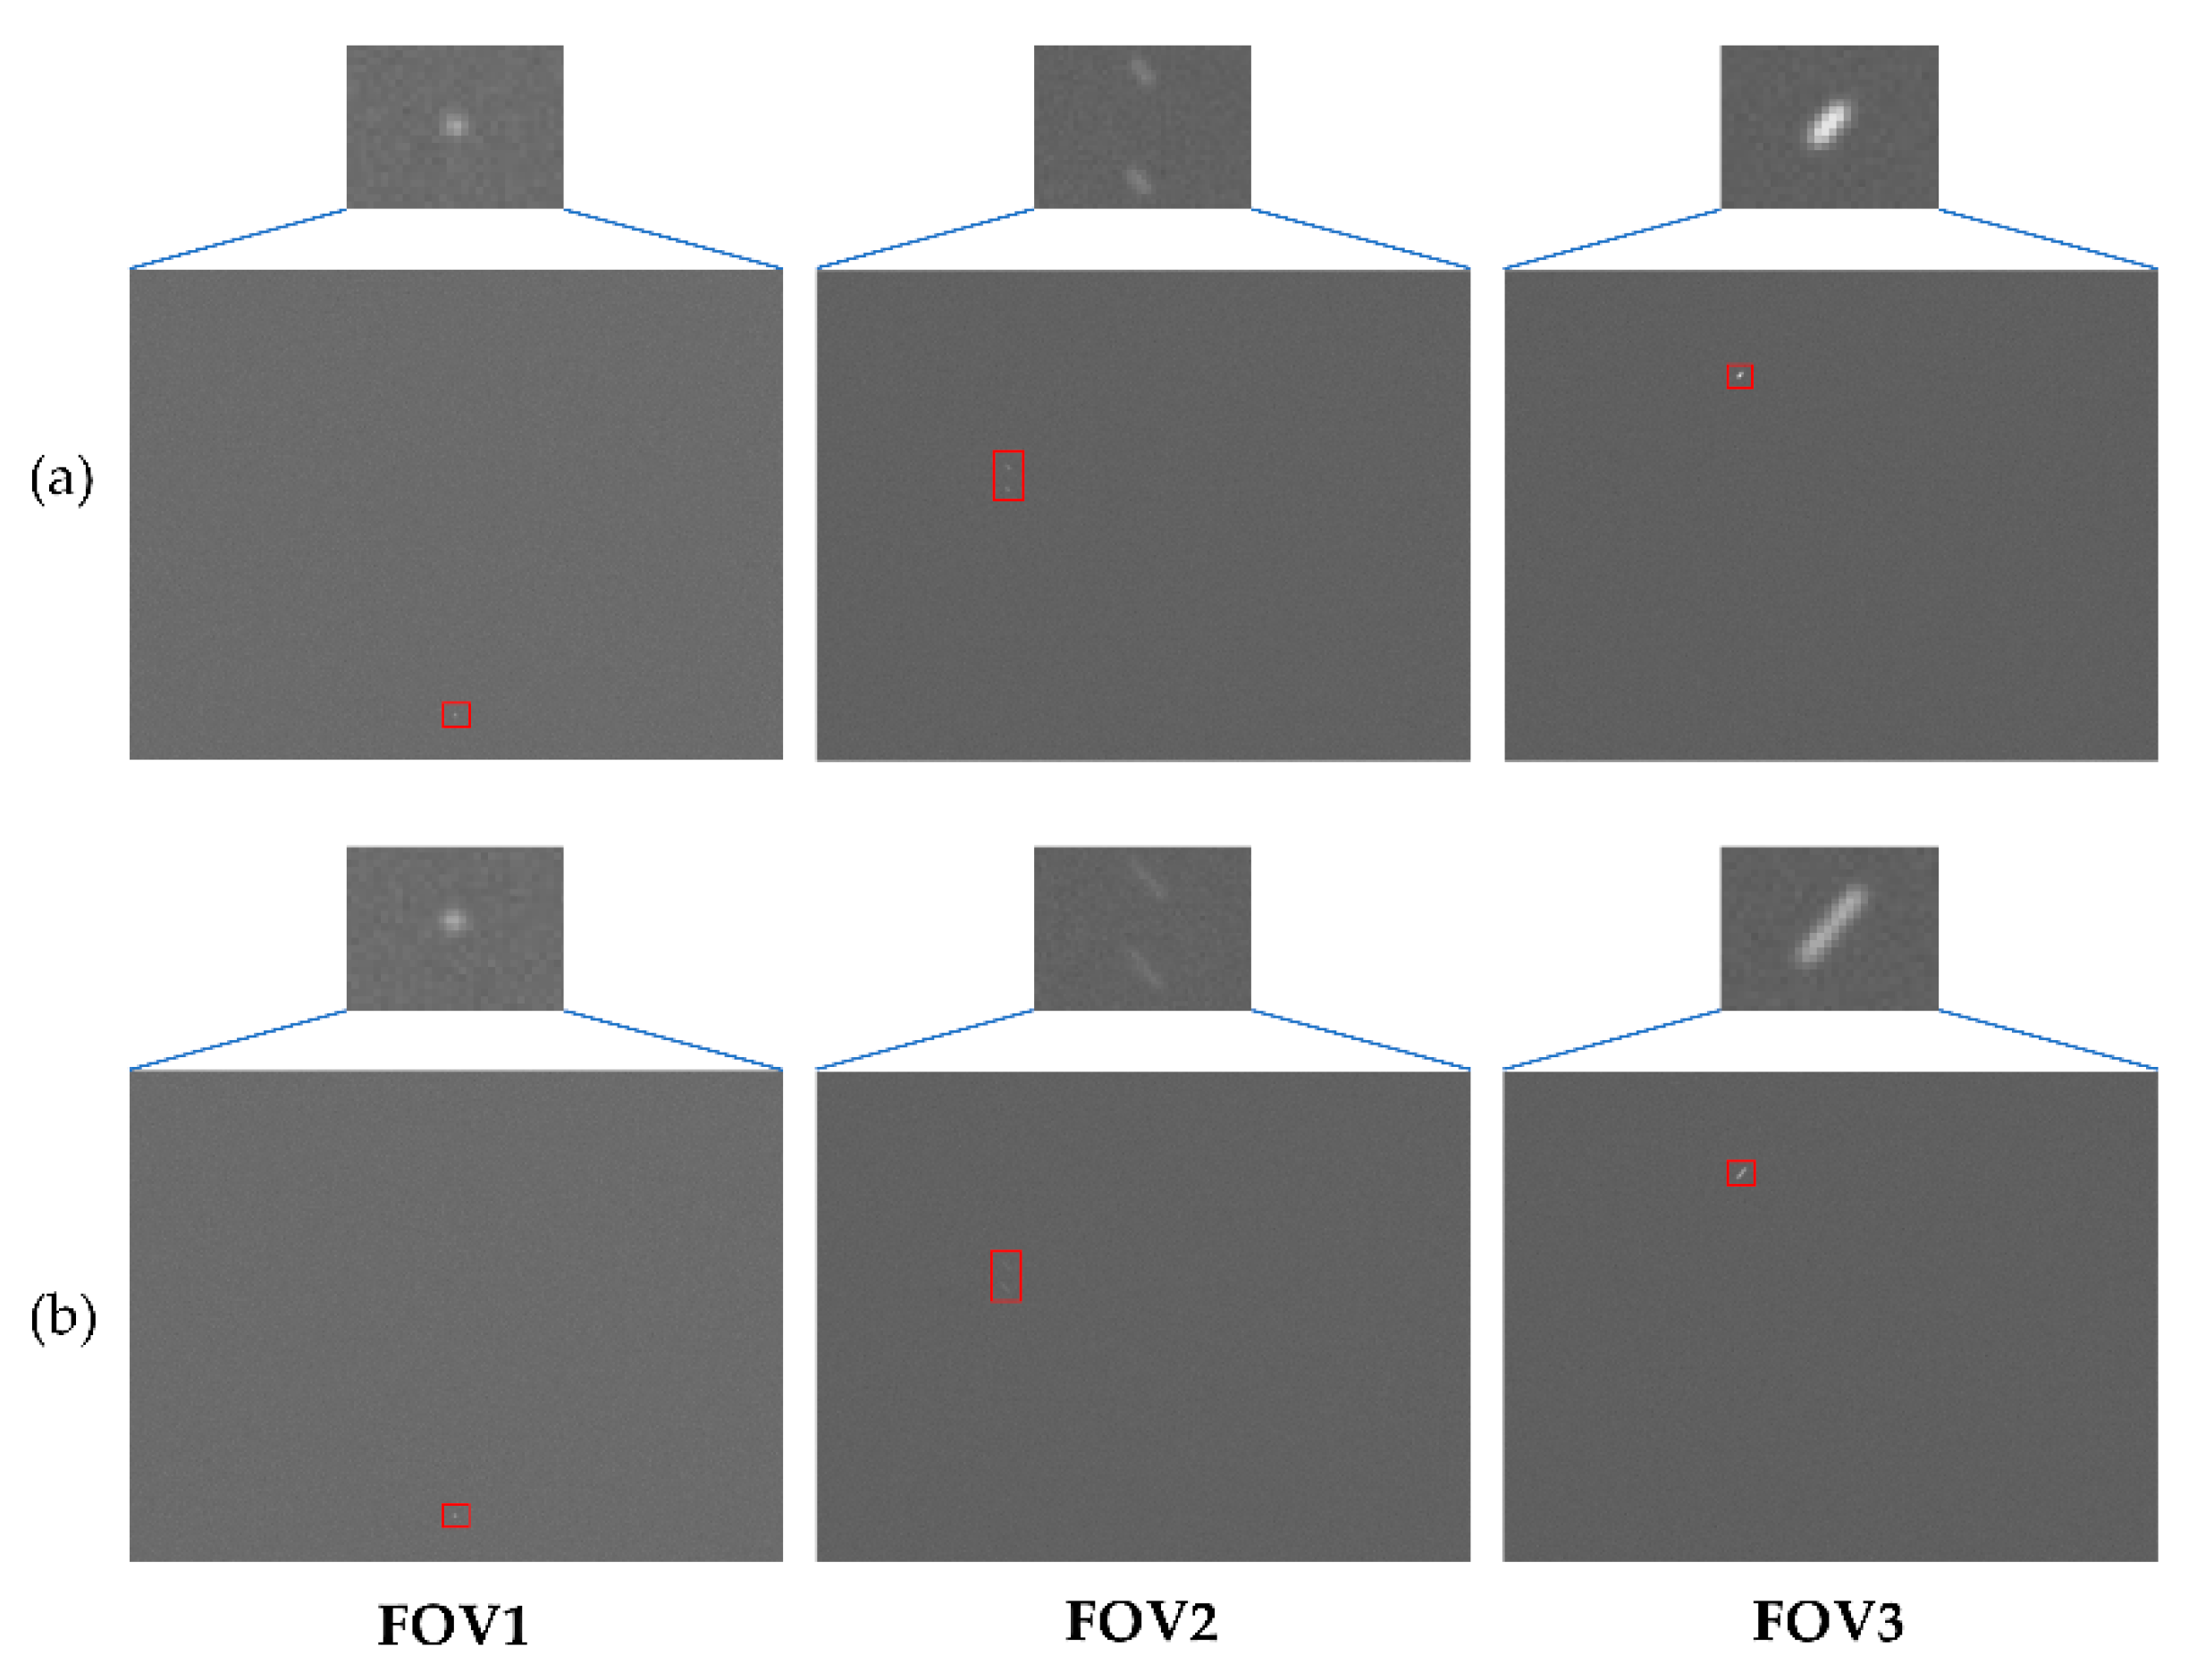
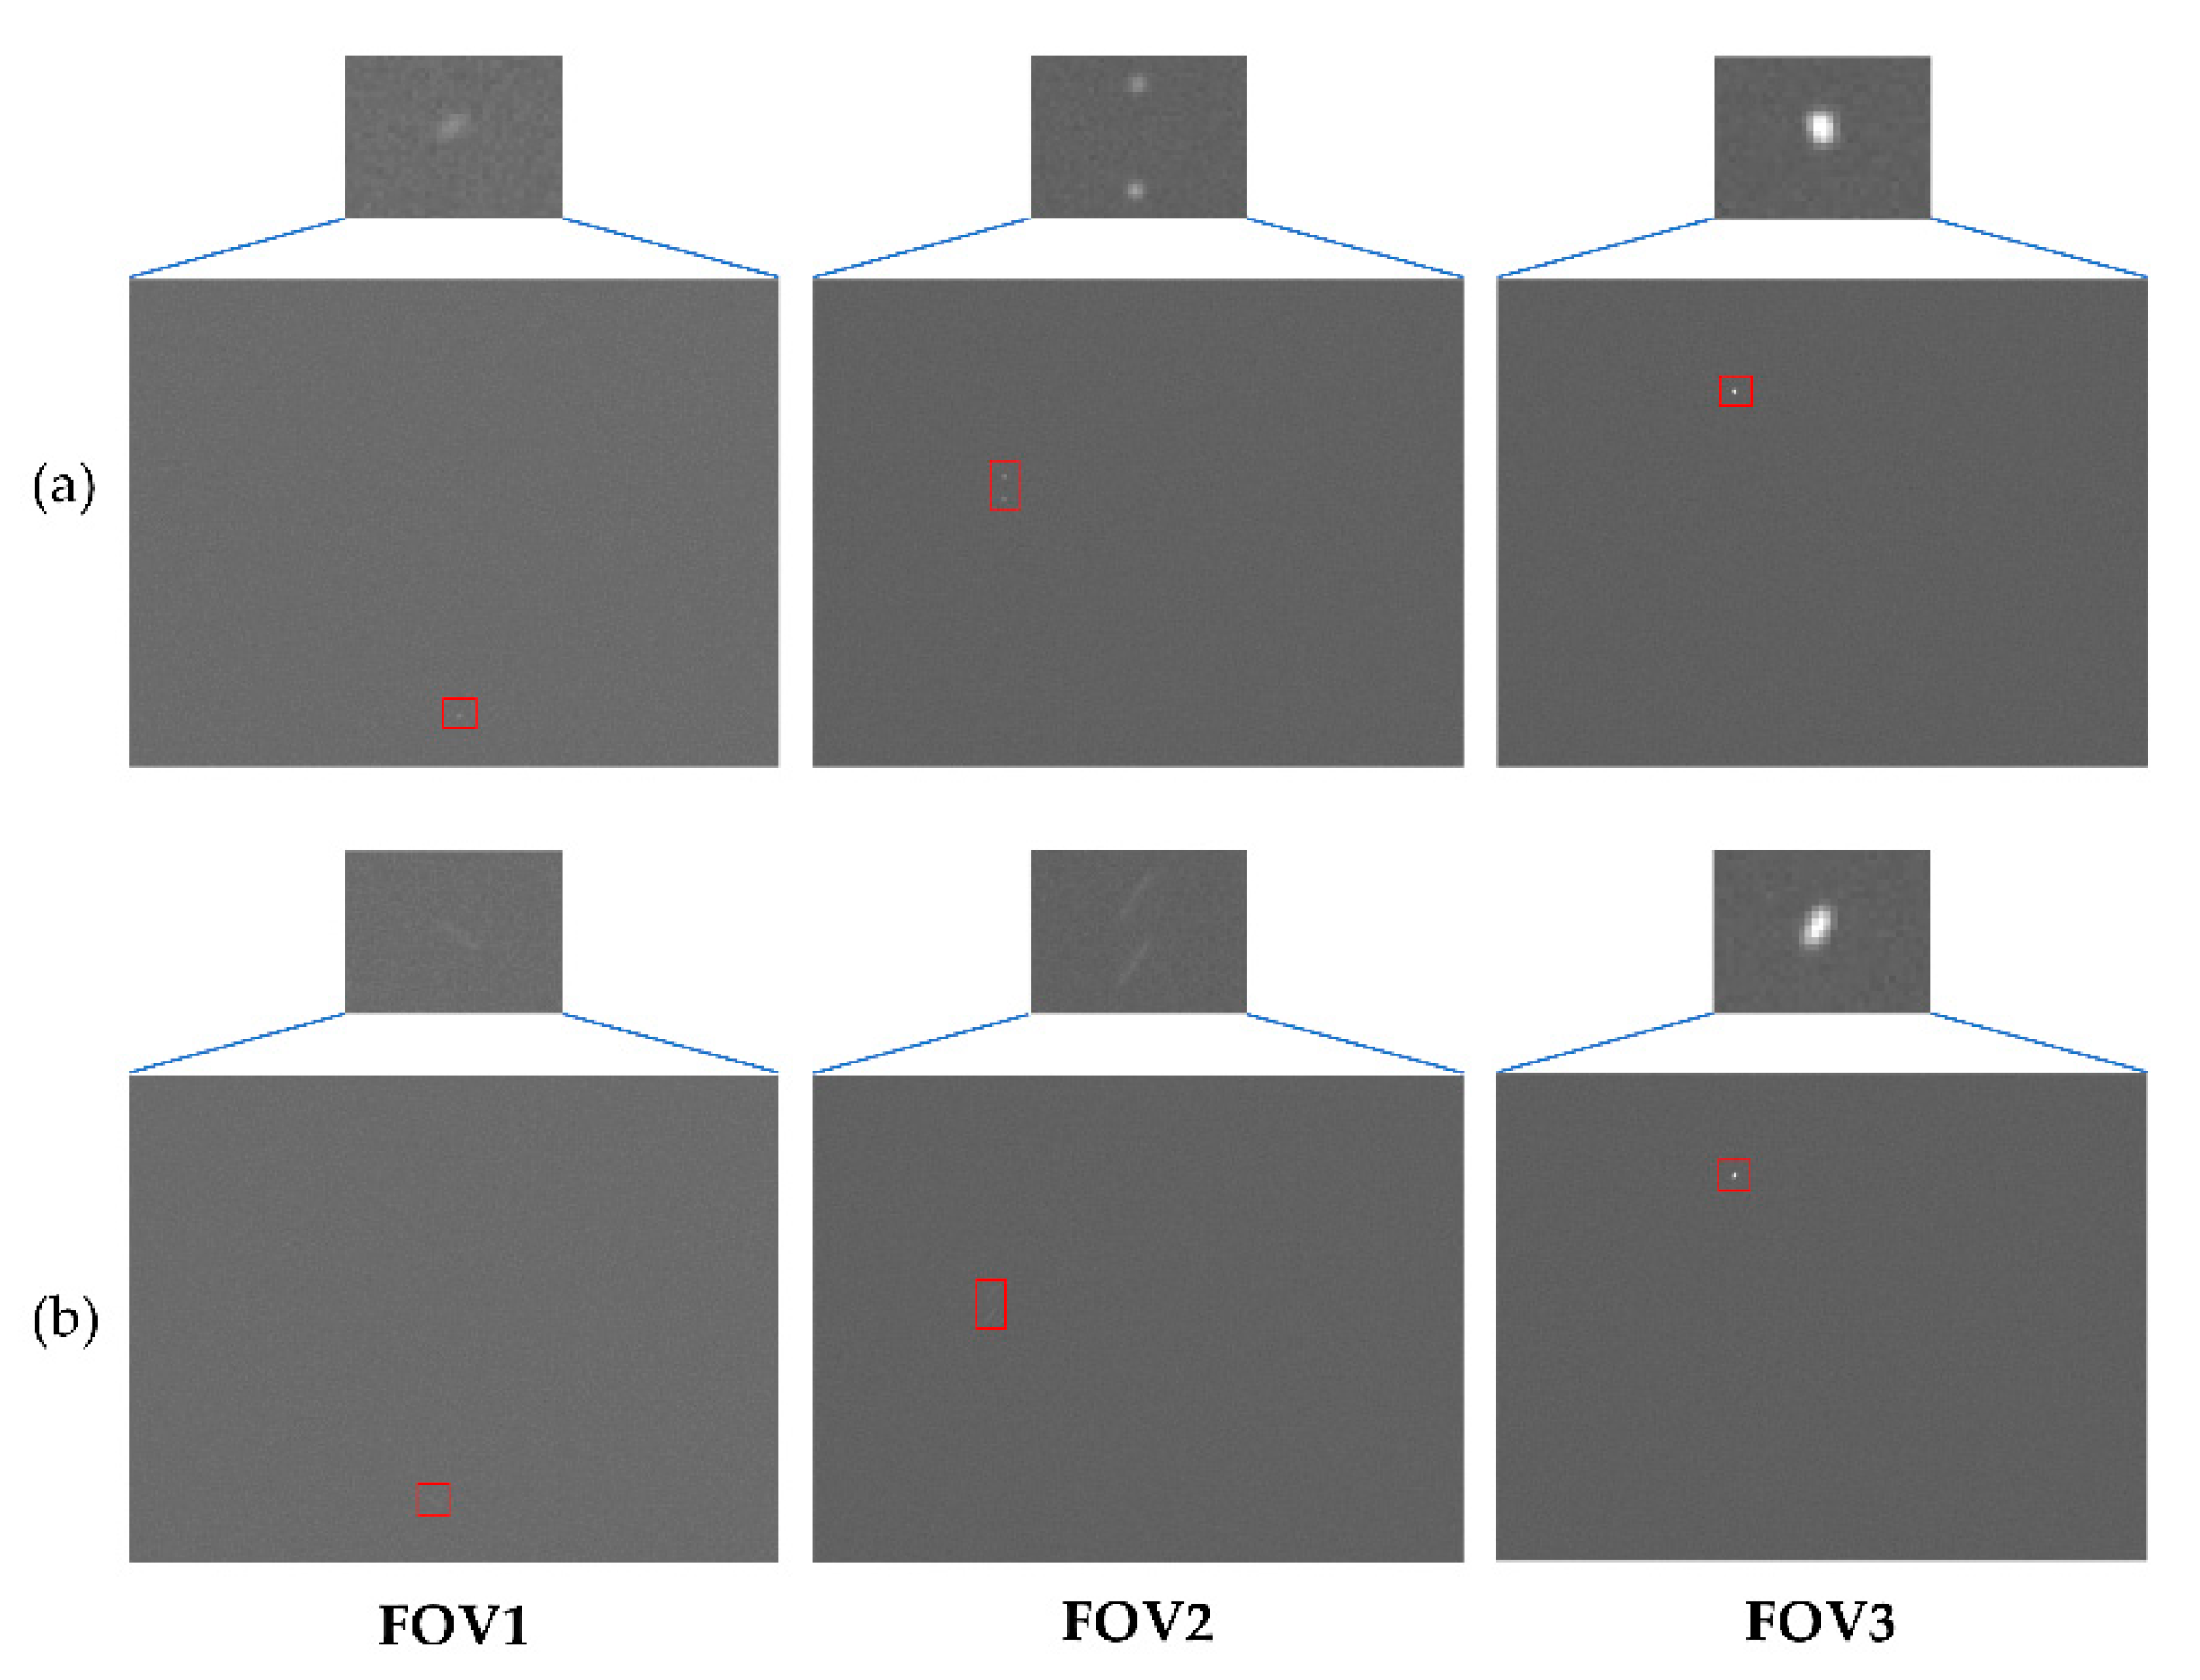
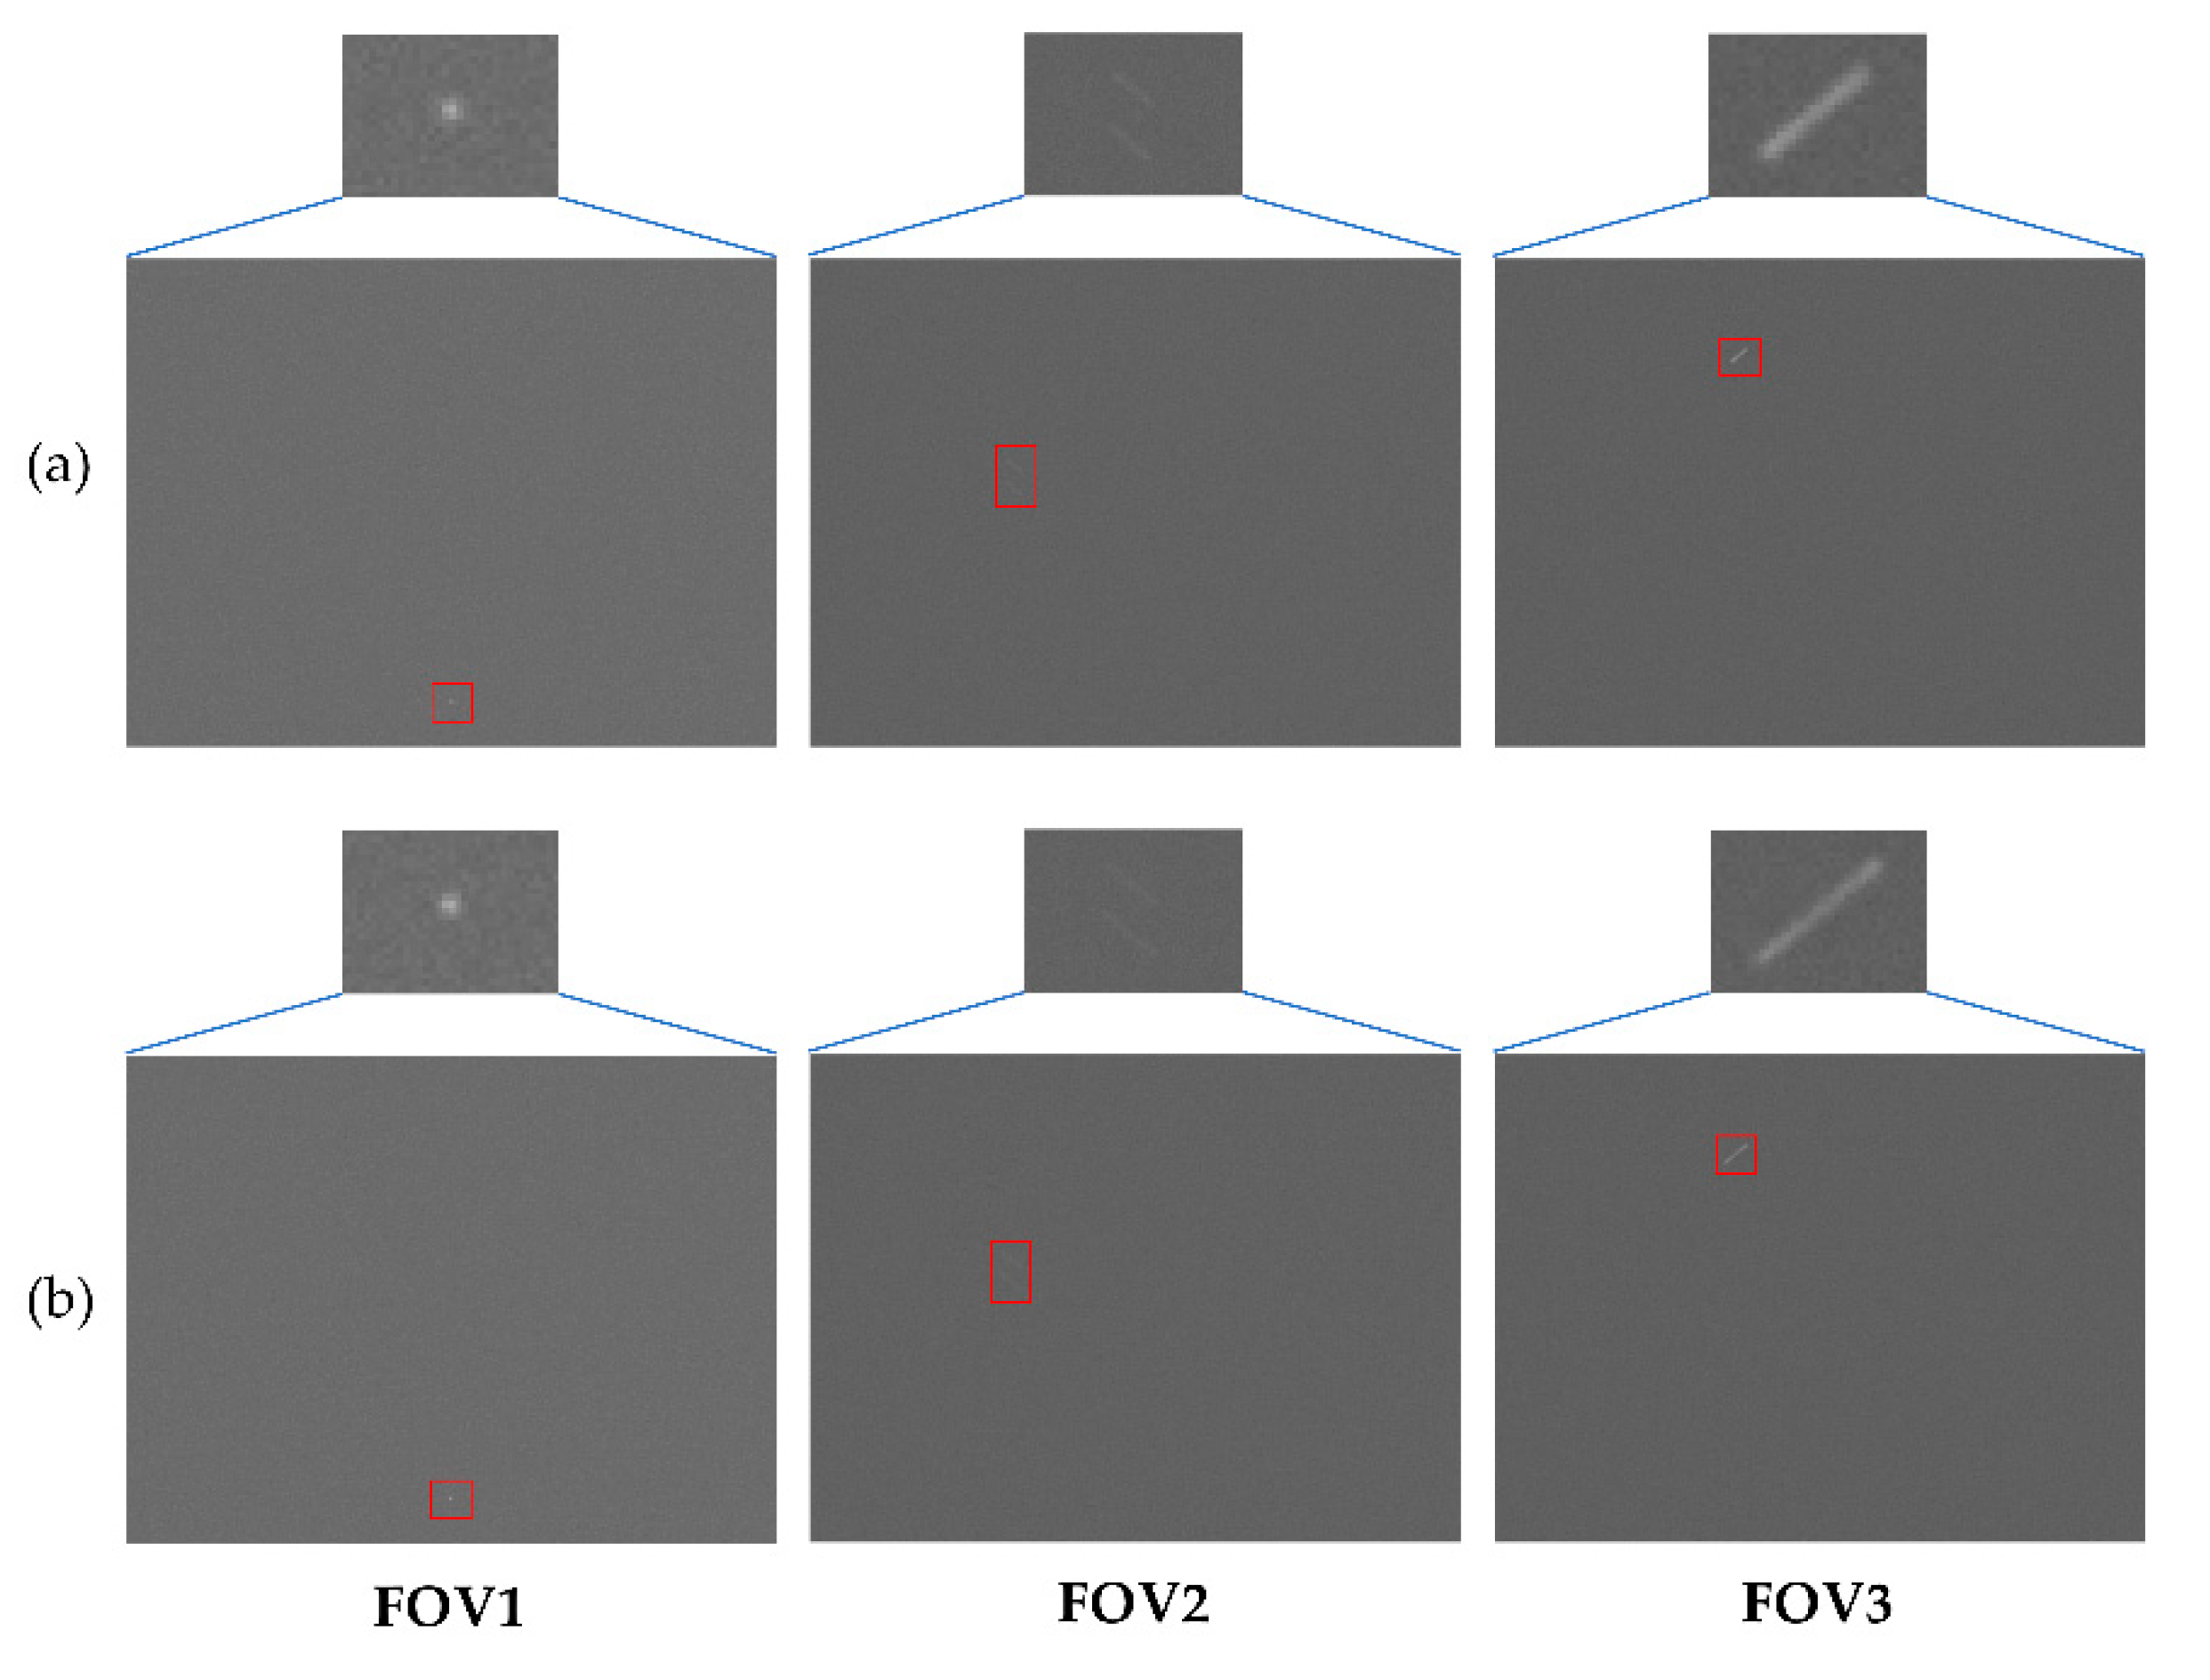
Given the rigid connection of the three FOVs to the same airborne platform, only FOV1 was subjected to motion disturbances in the simulation, while the motion states of the remaining FOVs were derived through coordinate system transformation relationships. All simulations employed a 5 ms exposure time, with results shown in Figure 10, Figure 11, Figure 12, Figure 13, Figure 14: Figure 10, presents the star map simulation results of the three FOVs under static conditions, containing four observable stars; Figure 11 and Figure 12 demonstrate the star map degradation characteristics under angular motion conditions around the non-optical axis (Xf1 axis angular velocity: −2° to −10°/s at 2°/s intervals, Yf1 axis angular velocity: 2–10°/s at 2°/s intervals) and optical axis (Zf1 axis angular velocity: 5°/s and 10°/s) of the FOV1 coordinate system, respectively; Figure 13 and Figure 14 display the imaging results under angular vibration conditions around the non-optical axis (Xf1/Yf1 axis angular vibration amplitude coefficients: 5 × 10⁵ and 106) and optical axis (Zf1 axis angular vibration amplitude coefficients: 5 × 10⁶ and 107), respectively.
Under non-optical axis rotation conditions (Figure 11), when the angular velocity increases from 2°/s to 10°/s, the star spots in FOV1 and FOV3 exhibit significant dynamic degradation characteristics, manifested as increased trailing length and diminished brightness. Quantitative analysis (Table 3) reveals varying degrees of performance degradation across FOV1, FOV2, and FOV3 under this condition: SNR decreases by 78.1%, 35.1%, 41.4%, and 75.3%; Gtotal declines by 78.8%, 35.1%, 41.5%, and 75.2%; GCI attenuates by 59.3%, 28.9%, 37.0%, and 52.0%; while DSD increases by 157.3%, 56.8%, 59.8%, and 239.7%, respectively. Notably, the degradation amplitude of all evaluation metrics in FOV2 is significantly lower than in other FOVs. This phenomenon stems from its unique kinematic decomposition property—non-optical axis rotation primarily translates into a component rotating around its optical axis in FOV2. Theoretical analysis (Equations (16) and (17)) demonstrates that the trailing effect induced by non-optical axis rotation is positively correlated with the focal length, whereas optical axis rotation-induced trailing depends on the pixel distance between the star spot and the principal point. Given that the focal length (298 mm) is substantially larger than the pixel size (20 μm), star spot trailing in FOV2 consequently remains relatively mild.
Under optical axis rotation conditions (Figure 12), as the rotational speed increases from 5°/s to 10°/s, FOV2 and FOV3 exhibit pronounced trailing effects, while FOV1 is relatively less affected. The quantitative data (Table 3) reveal significant performance degradation in FOV2 and FOV3: SNR decreases by 68.7%, 71.6%, and 58.3%; Gtotal declines by 68.8%, 71.7%, and 58.1%; GCI attenuates by 43.8%, 47.5%, and 37.3%; and DSD increases by 124.7%, 125.6%, and 100.0%, respectively. In contrast, all evaluation metrics for FOV1 fluctuate within a 25% variation range. This discrepancy primarily originates from the alignment between the optical axis and rotation axis in FOV1, which significantly mitigates the impact of optical axis rotation on star imaging. Conversely, the angular deviation between optical axes and rotation axes in FOV2 and FOV3 leads to more pronounced dynamic degradation.
For non-optical axis angular vibration (Figure 13), when the angular vibration amplitude coefficient increased to 106, FOV1 and FOV2 exhibited significant degradation (SNR decreased by 78.3%, 75.4%, and 78.8%, Gtotal declined by 78.2%, 75.4%, and 78.3%, GCI attenuates by 47.0%, 44.5%, and 50.6%, and DSD increased by 169.7%, 211.1%, and 203.7%, respectively). In contrast, FOV3 was less affected (average variation of evaluation metrics: 21.0%).
For optical axis angular vibration (Figure 14), when the angular vibration amplitude coefficient reached 107, the imaging quality of FOV2 and FOV3 is primarily affected (SNR decreased by 83.2%, 88.9%, and 81.2%, Gtotal declined by 83.1%, 88.8%, and 81.1%, GCI attenuates by 48.4%, 62.6%, and 42.6%, and DSD increased by 355.6%, 368.3%, and 600.0%, respectively). However, the star characteristics in FOV1 remain relatively stable (average variation of evaluation metrics: 13.4%).
Simulation results indicate that the degree of star trailing is predominantly influenced by two key factors:
  • Motion parameters of the airborne platform, including the angular velocity and angular vibration amplitude coefficient;
  • FOV installation parameters, specifically the pointing deviation between each FOV’s optical axis and the rotation/vibration axis.
By optimizing the relative orientation of each FOV’s optical axis with respect to the platform’s primary motion axes, the degradation of imaging quality under dynamic conditions can be mitigated.

3.3. Experimental Verification

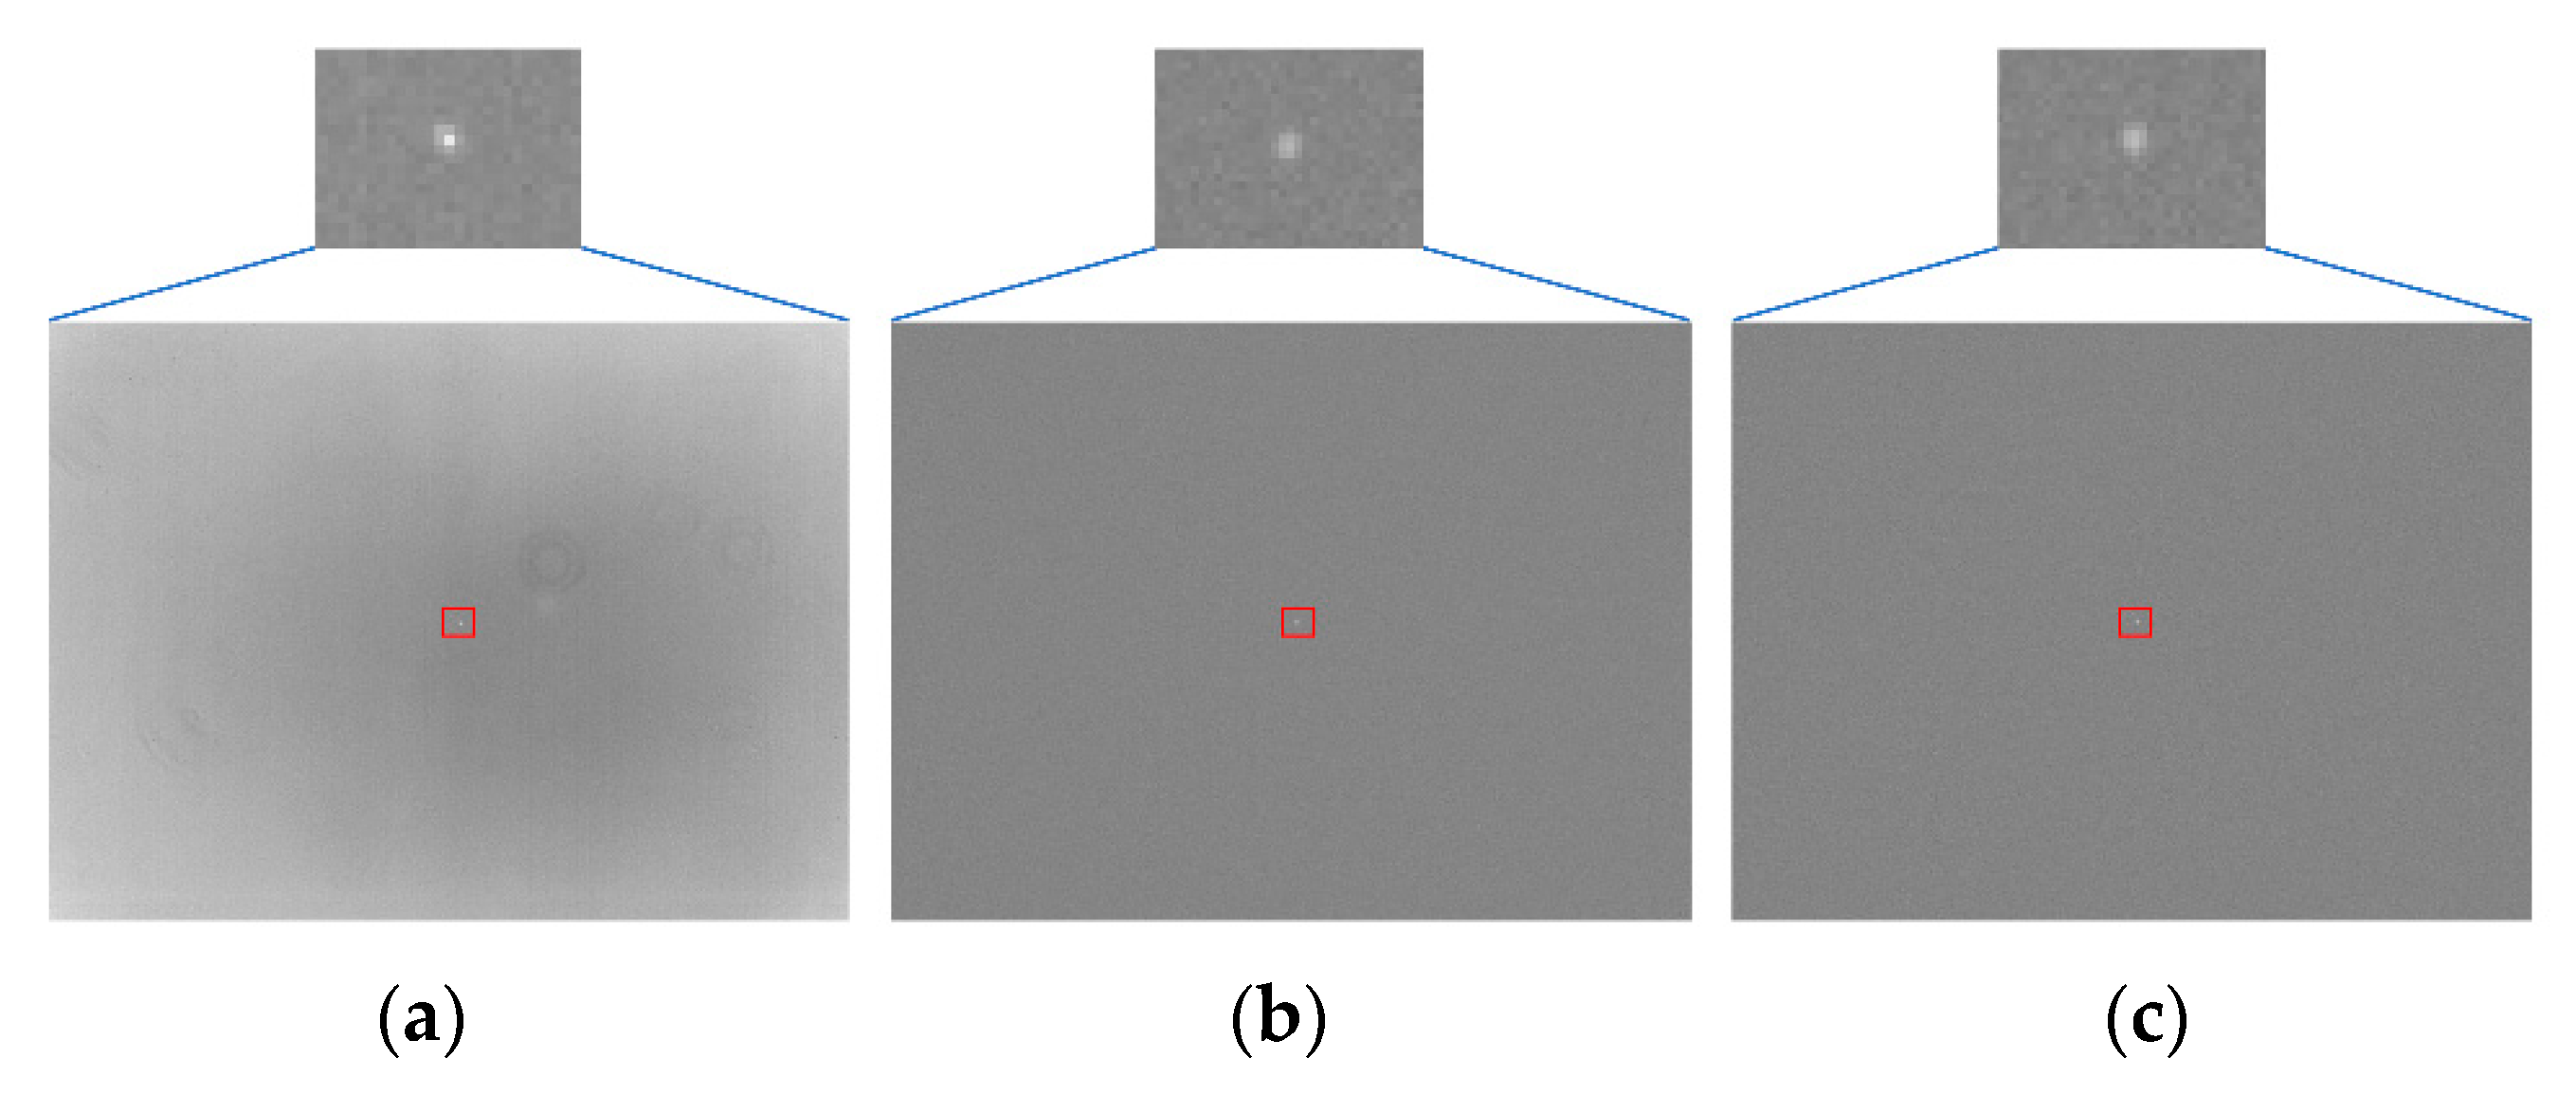
This study rigorously adhered to the experimental parameters (observation time, geographic coordinates, and altitude) established in Section 3.2, conducting systematic field validation experiments using an all-time three-FOV star sensor. Both experiments and simulations employed a 2.5 ms exposure time, with results presented in Figure 15, Figure 16 and Figure 17. The selected experimental site (2388 m altitude, 100.23°E, 26.86°N) was chosen because it presents convenient observation conditions and favorable meteorological conditions with abundant clear days—both factors collectively ensure the acquisition of high-quality stellar observation data. To ensure experimental reliability and avoid random errors, 20 sets of real star map data were collected under each experimental condition (static, non-optical axis rotation, and optical axis rotation). Note that the “real star map” (labeled as “R”) in Table 4 corresponds to the first set of data among the 20 repetitions, and the standard deviation of each metric across 20 repetitions is supplemented to characterize data stability. We conduct a comparative analysis of the proposed method and the method in Reference [23] (hereafter referred to as Method 1): the actual observational data of the Polaris region in FOV1 is presented in Figure 15a, the simulated results for the same celestial area using the method proposed in this study are shown in Figure 15b, and the simulated results of the same celestial area using Method 1 are displayed in Figure 15c. Moreover, the standard deviations of the 20 sets of real star map metrics are SNR = 1.1, Gtotal = 2329, GCI = 2.4%, DSD = 0.32, indicating low random fluctuations in static observation. Quantitative evaluation (Figure 18) reveals that under static conditions, the average relative error of all evaluation metrics for the star maps generated by the method proposed in this study remains below 9%; in contrast, the average relative error of all evaluation metrics for the star maps generated using Method 1 is 14.2%, which is higher than that of the proposed method. This conclusively validates the accuracy of the proposed static simulation model.
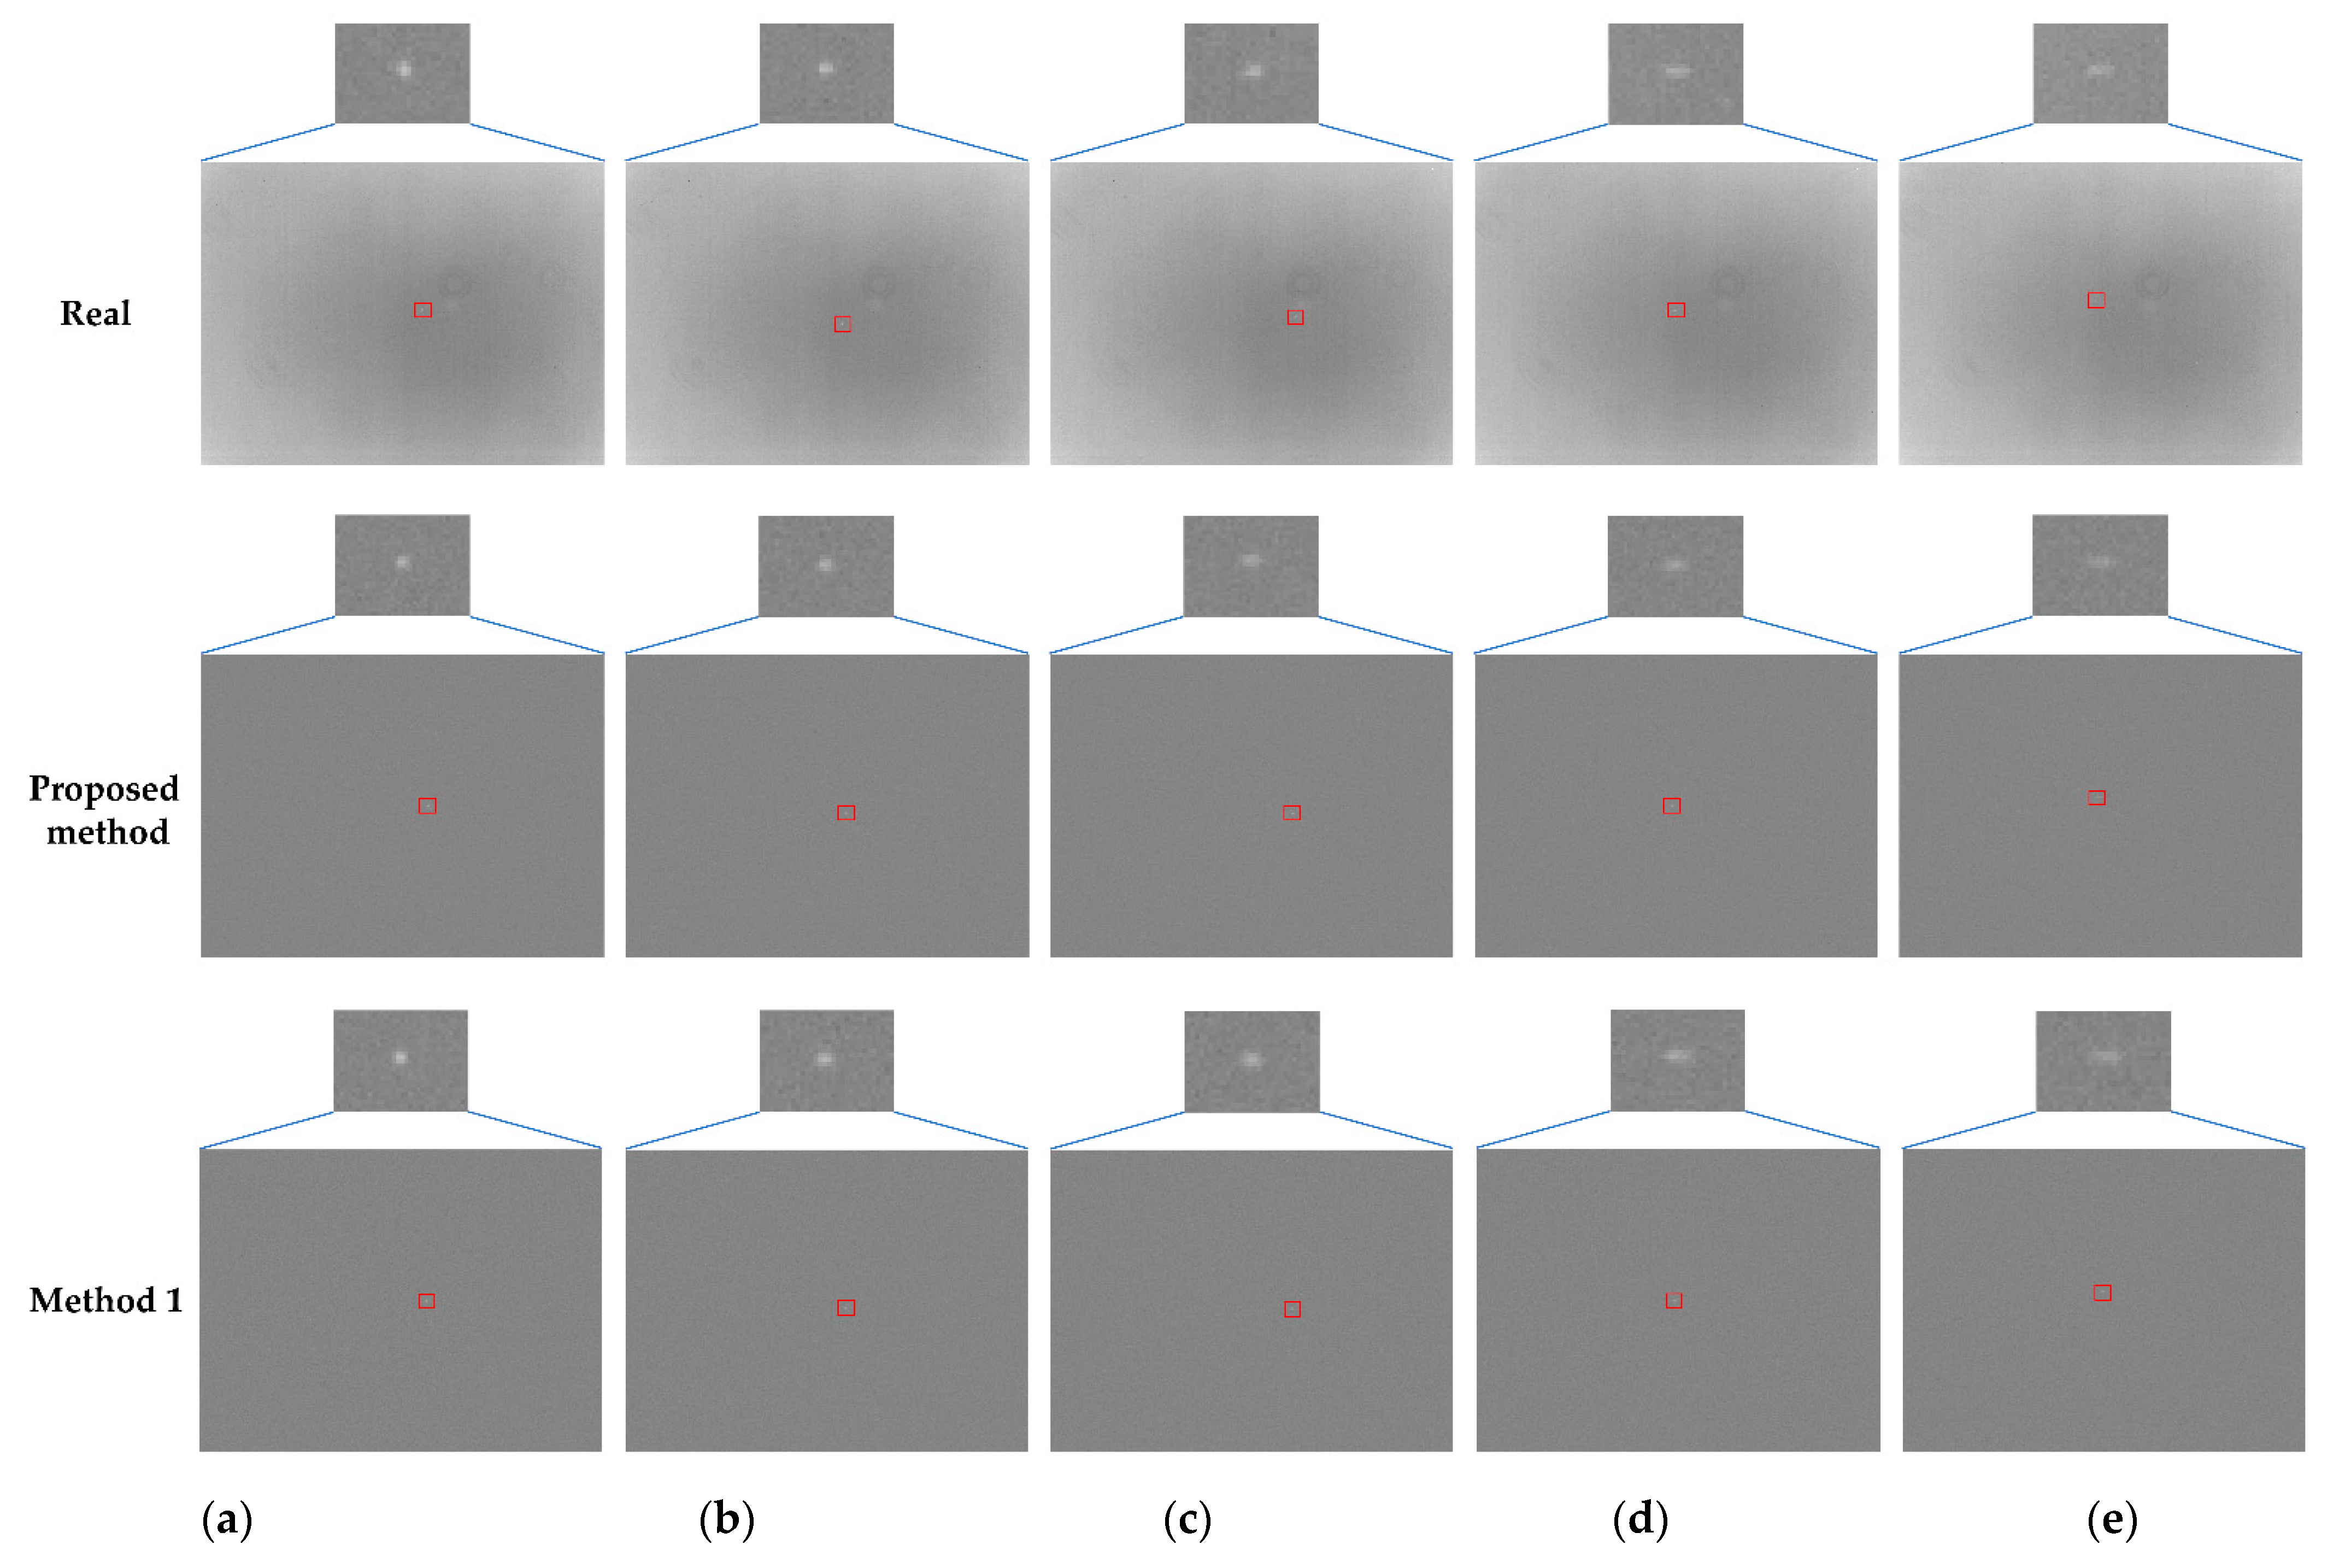
Experimental results from dynamic condition testing under non-optical axis rotation (Yf1: 2–10°/s), with the results presented in Figure 16 and Table 4, demonstrate that with the increase in rotation speed, the SNR, Gtotal, and GCI of real star maps exhibit a gradual decreasing trend, while the DSD shows a gradual increasing trend. For the simulated star maps generated using the proposed method and those generated using Method 1, the variation trends of these four evaluation metrics are consistent with those of the real star maps. Furthermore, the metric fluctuations across 20 repeated experiments under different operating conditions are as follows: at Yf1 = 2°/s, the standard deviations are SNR = 1.4, Gtotal = 2782, GCI = 2.8%, DSD =0.41; at Yf1 = 4°/s, the standard deviations are SNR = 1.7, Gtotal = 3328, GCI = 3.3%, DSD = 0.57; at Yf1 = 6°/s, the standard deviations are SNR = 1.6, Gtotal = 3179, GCI = 3.1%, DSD = 0.49; at Yf1 = 8°/s, the standard deviations are SNR = 1.8, Gtotal = 3572, GCI = 3.8%, DSD = 0.66; and at the maximum angular velocity of Yf1 = 10°/s, the standard deviations are SNR = 1.9, Gtotal = 3896, GCI = 4.3%, DSD = 0.80, demonstrating favorable stability. Error analysis in Figure 18 further reveals that the average relative error of all evaluation metrics for the star maps generated using the proposed method is merely 8.0%; in contrast, the average relative error of all evaluation metrics for the star maps generated using Method 1 is 14.1%. This result confirms the excellent adaptability of the model proposed in this study to non-optical axis rotation conditions.
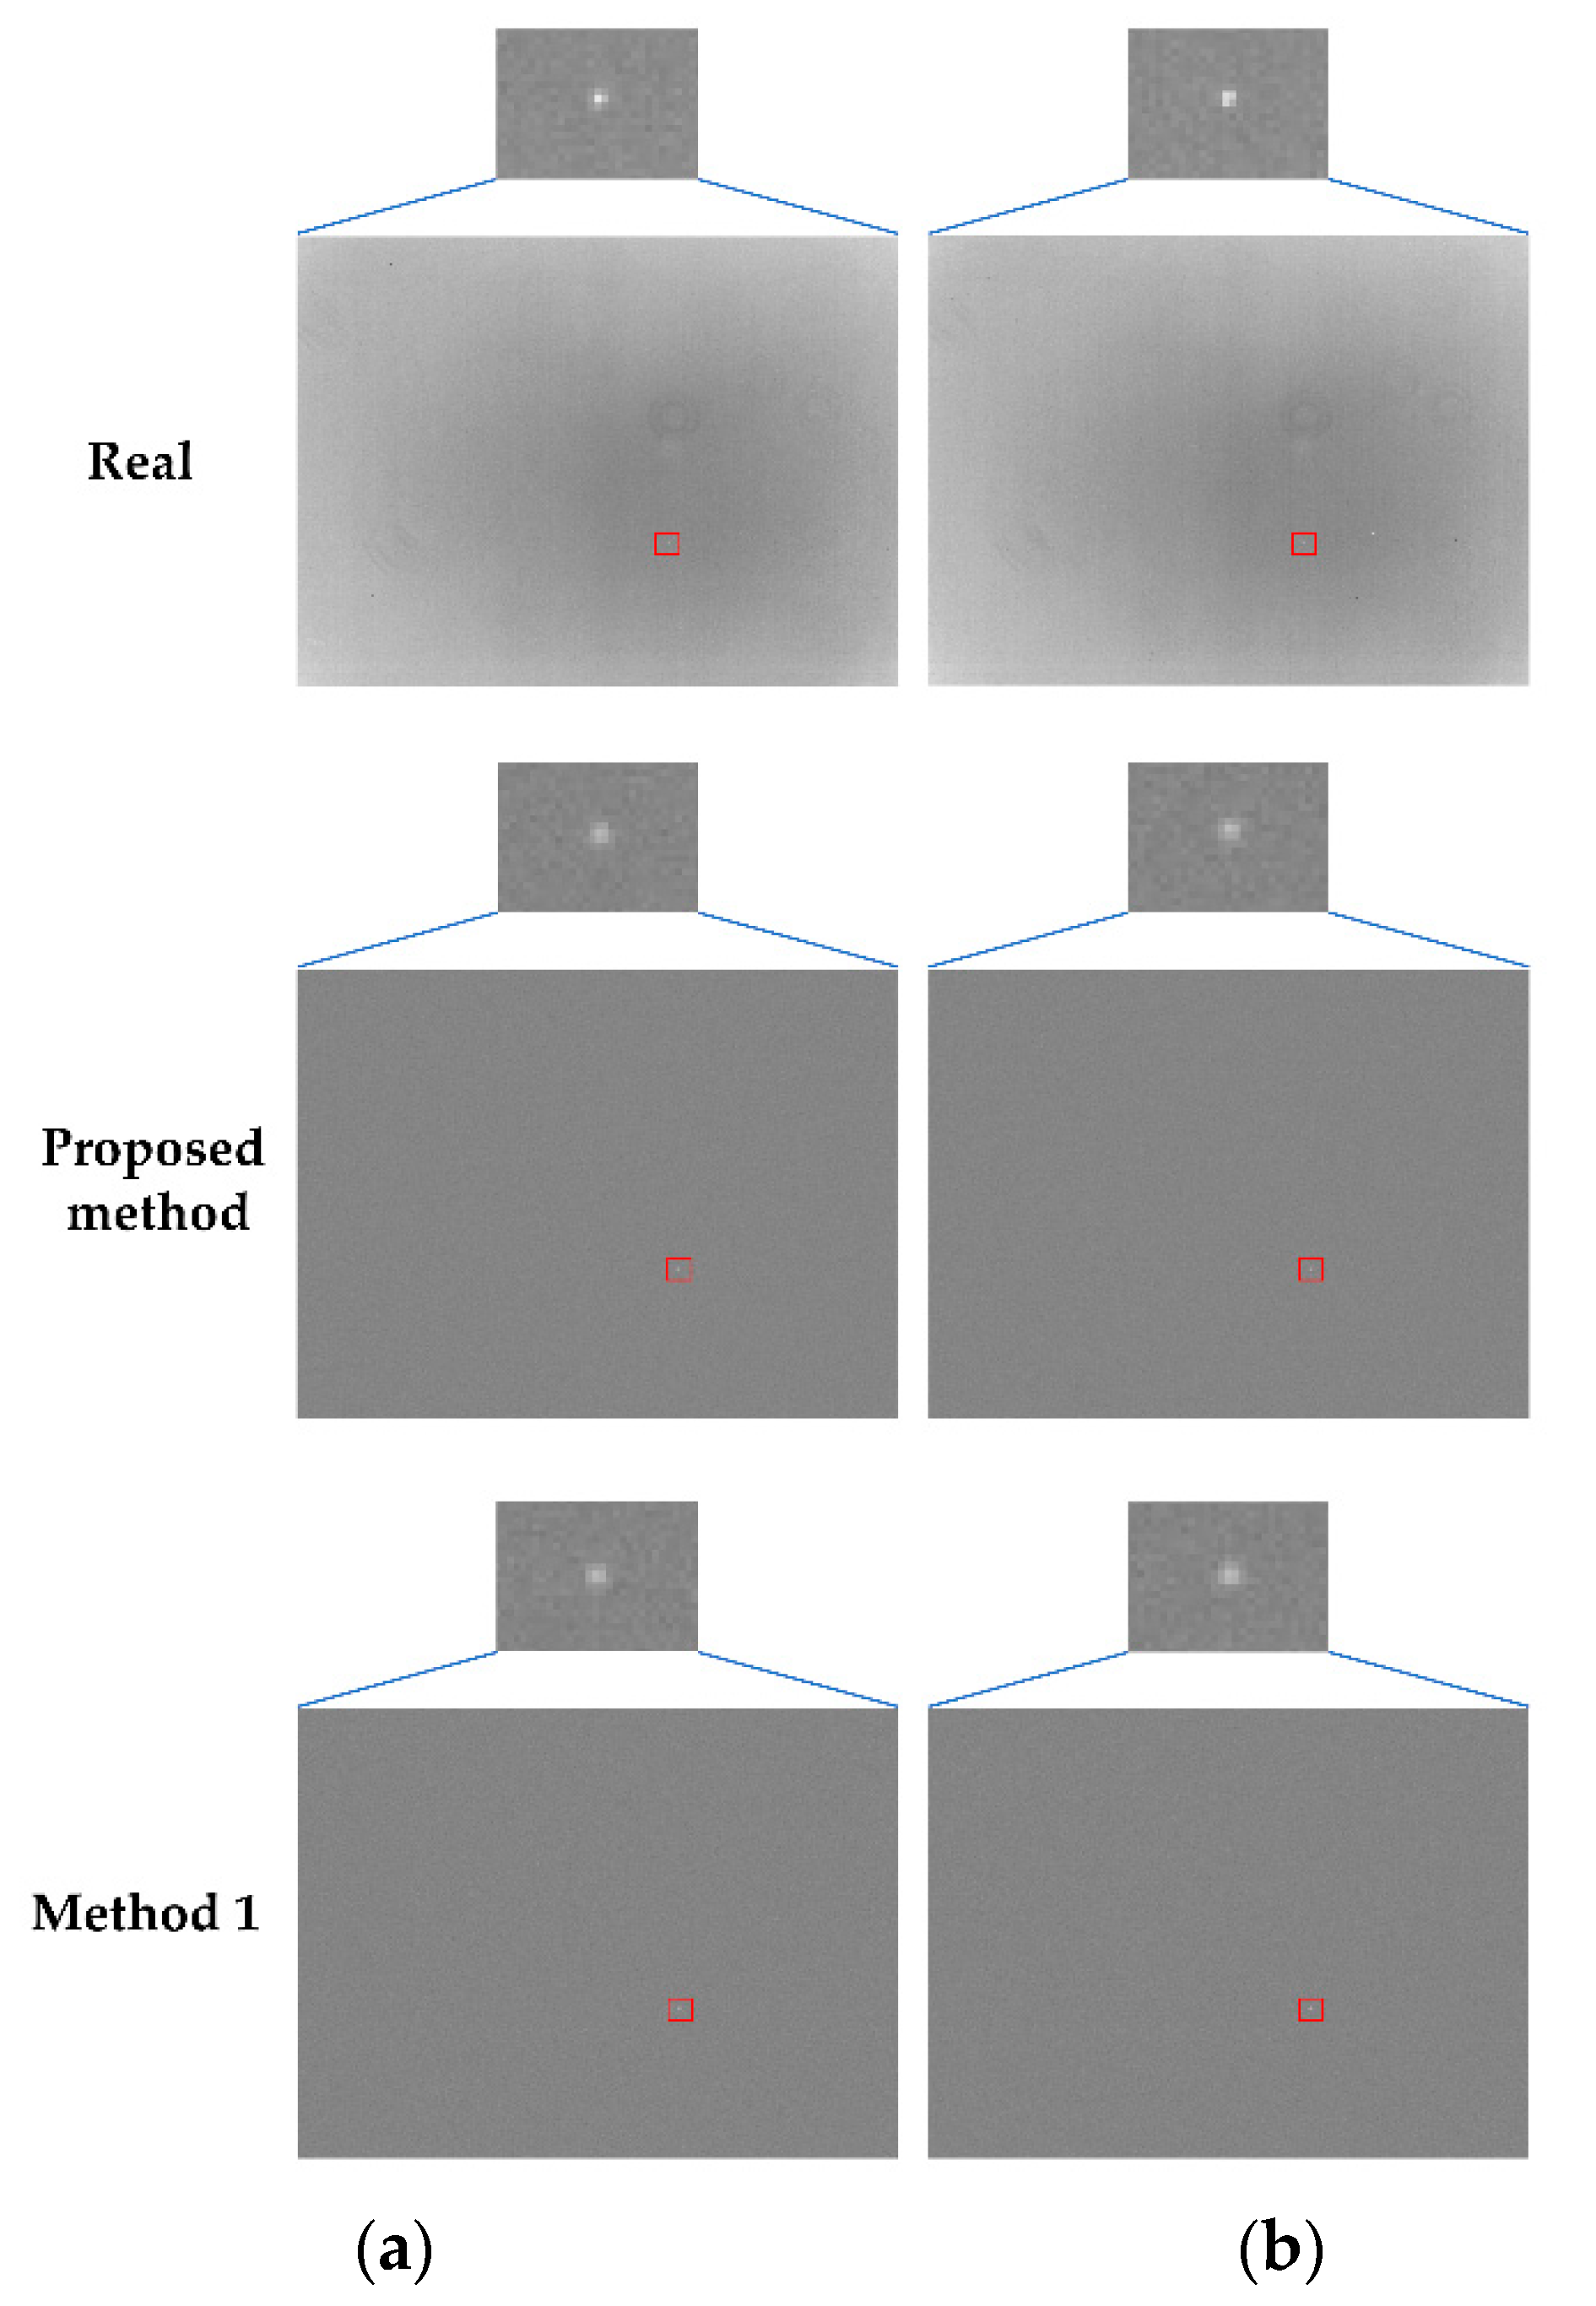
For optical axis rotation conditions (Zf1: 5–10°/s), as illustrated in Figure 17, both simulated and real star maps maintain stable stellar morphology and energy distribution. The data presented in Table 4 demonstrate that the average fluctuation amplitude of the evaluation metrics for the simulation results generated using the proposed method is 4.80%, and that for the simulation results generated using Method 1 is 4.82%. The average fluctuation amplitude of the evaluation metrics for these two sets of simulation results is relatively close to that of the evaluation metrics for the measured data (5.93%). Notably, the metrics of the 20 sets of real star maps exhibit low volatility, similar to the static condition: at Zf1 = 5°/s, the standard deviations are SNR = 1.2, Gtotal = 2526, GCI = 2.6%, and DSD = 0.35; at Zf1 = 10°/s, the standard deviations are SNR = 1.3, Gtotal = 2686, GCI = 2.7%, and DSD = 0.39. In addition, Figure 18 reveals that under these conditions, the average relative error of all evaluation metrics for the simulated star maps generated via the proposed method is 8.3%, while that for the simulated star maps generated using Method 1 is 13.6%. This result further reaffirms the effectiveness of the model proposed in this study.
The experimental results verify that the simulated star maps generated using the method proposed in this study exhibit high consistency with actual measurement results under both static and various dynamic conditions and can accurately reproduce the imaging characteristics of real star sensors in diverse dynamic environments. Furthermore, these results also confirm the superiority of the proposed method over existing methods.

4. Conclusions

This study conducts systematic research on star map simulation under dynamic airborne conditions. A star map simulation model for an all-time three-FOV star sensor is established, which comprehensively integrates key factors including stellar radiation, sky background, detector noise, and platform motion. The model achieves precise modeling of star map generation in complex environments. For model validation, a multi-dimensional quality evaluation framework is developed. Comparative analysis between simulated and real star maps confirms the model’s validity. The proposed method and evaluation system provide significant value for assessing dynamic performance and optimizing algorithms of airborne star sensors. Future work may incorporate aero-optical effects at speeds above 4 Ma and more complex platform motion patterns to enhance the simulation system’s applicability under extreme operating conditions.

Author Contributions

Conceptualization, J.Z. and H.Z.; methodology, J.Z.; software, J.Z. and X.G.; validation, J.Z. and X.G.; formal analysis, J.Z. and H.Z.; investigation, J.Z. and H.Z.; resources, H.Z. and L.F.; data curation, J.Z. and W.S.; writing—original draft preparation, J.Z.; writing—review and editing, J.Z., H.Z., L.F. and X.G.; visualization, K.L. and R.Z.; supervision, L.F. and K.L.; project administration, L.F.; funding acquisition, L.F. and K.L. and W.S. All authors have read and agreed to the published version of the manuscript.

Funding

This research was funded by the West Light of Chinese Academy of Sciences (No. YA23K055); National Key Research and Development Program of China (2019YFA0706001); Sichuan Science and Technology Program (2024NSFSC1443).

Data Availability Statement

The data presented in this study are available on request from the corresponding author.

Conflicts of Interest

The authors declare no conflicts of interest.

References

  1. Zhang, H.; Zhou, X.; Wang, X.; Tian, H. Survey of technology status and development of all-time star sensors in near-earth space. Hangkong Xuebao 2020, 41, 13–25. [Google Scholar]
  2. Lu, X.; Li, C.; Li, X.; Sun, D.; Xia, M. Current Situation and Development Trends of Starlight Navigation Technology. Aerosp. Control Appl. 2017, 43, 1–8. [Google Scholar]
  3. Huang, H.; Chen, C.; Guan, B.; Tan, Z.; Shang, Y.; Li, Z.; Yu, Q. Ridge estimation-based vision and laser ranging fusion localization method for UAVs. Appl. Opt. 2025, 64, 1352–1361. [Google Scholar] [CrossRef]
  4. Liu, Z.; Liang, S.; Guan, B.; Tan, D.; Shang, Y.; Yu, Q. Collimator-assisted high-precision calibration method for event cameras. Opt. Lett. 2025, 50, 4254–4257. [Google Scholar] [CrossRef] [PubMed]
  5. Liebe, C.C. Accuracy performance of star trackers-a tutorial. IEEE Trans. Aerosp. Electron. Syst. 2002, 38, 587–599. [Google Scholar] [CrossRef]
  6. Li, J.; Wang, G.; Wei, X. Generation of guide star catalog for star trackers. IEEE Sens. J. 2018, 18, 4592–4601. [Google Scholar] [CrossRef]
  7. Dai, Y.; Shi, C.; Ben, L.; Zhu, H.; Zhang, R.; Wu, S.; Shan, S.; Xu, Y.; Zhou, W. Star Identification Algorithm Based on Dynamic Distance Ratio Matching. Remote Sens. 2024, 17, 62. [Google Scholar] [CrossRef]
  8. Ma, L.; Zhu, D.; Sun, C.; Dai, D.; Wang, X.; Qin, S. Three-axis attitude accuracy of better than 5 arcseconds obtained for the star sensor in a long-term on-ship dynamic experiment. Appl. Opt. 2018, 57, 9589–9595. [Google Scholar] [CrossRef] [PubMed]
  9. Tang, X.; Cao, Q.; Fu, Z.; Xu, T.; Duan, R.; Yang, X. Multi-Centroid Extraction Method for High-Dynamic Star Sensors Based on Projection Distribution of Star Trail. Remote Sens. 2025, 17, 266. [Google Scholar] [CrossRef]
  10. Feng, J.; Wang, H.C.; Cui, Y.H.; Li, Y.D.; Guo, Q.; Wen, L.; Fu, J. Effects of gamma radiation on the performance of star sensors for star map recognition. Radiat. Phys. Chem. 2023, 203, 110607. [Google Scholar] [CrossRef]
  11. Fang, L.; Liu, E.; Zhang, H.; Wei, X.; Cheng, X.; Liao, Z.; Zhao, R. Optical imaging system for an all-time star sensor based on field of view gated technology. Appl. Opt. 2022, 61, 5859–5868. [Google Scholar] [CrossRef]
  12. Liao, Z.; Dong, Z.; Wang, H.; Mao, X.; Wang, B.; Wu, S.; Zang, Y.; Lu, Y. Analysis of flow field aero-optical effects on the imaging by near-earth space all-time short-wave infrared star sensors. IEEE Sens. J. 2022, 22, 15044–15053. [Google Scholar] [CrossRef]
  13. Rex, M.; Chapin, E.; Devlin, M.J.; Gundersen, J.; Klein, J.; Pascale, E.; Wiebe, D. BLAST autonomous daytime star cameras. In Ground-Based and Airborne Instrumentation for Astronomy; SPIE: Orlando, FL, USA, 2006; pp. 1093–1100. [Google Scholar]
  14. Liu, B.; Zhu, W.; Zhang, T.; Yang, L.; Guo, J. Determination of ship attitude based on dual star sensors. Opt. Precis. Eng. 2014, 22, 569–575. [Google Scholar] [CrossRef]
  15. Lei, H.; Li, B.; Wei, Q.; Yue, Y.; Ding, X.; Liang, K.; Chen, L.; Yang, H.; Zhang, W.; Hu, X. Inertial information based star detection for airborne star sensor. Opt. Laser Technol. 2023, 162, 109325. [Google Scholar] [CrossRef]
  16. Yuan, J.; Wu, J.; Kang, G. High-Precision Centroid Localization Algorithm for Star Sensor Under Strong Straylight Condition. Remote Sens. 2025, 17, 1108. [Google Scholar] [CrossRef]
  17. Zhou, J.; Zhang, H.; Gao, X.; Fang, L.; Lu, K.; Zhao, R. Generation of guide star catalog for the all-time three-FOV star sensor applied on airborne platforms. J. Opt. Soc. Am. A 2025, 42, 151–164. [Google Scholar] [CrossRef] [PubMed]
  18. Wu, L.; Xu, Q.; Wang, H.; Lyu, H.; Li, K. Guide star selection for the three-FOV daytime star sensor. Sensors 2019, 19, 1457. [Google Scholar] [CrossRef] [PubMed]
  19. Wu, L.; Yang, J. Simulation technology of airborne star sensor imaging. Optoelectron. Technol. 2010, 30, 192–198. [Google Scholar]
  20. Zhao, M.; Liu, Y.; Tao, Z.; He, Y. One method on star image simulation of airborne astronomical navigation. Optoelectron. Technol. 2008, 28, 184–188. [Google Scholar]
  21. Li, Z.; Liang, B.; Zhang, T.; Zhu, H. Image simulation for airborne star tracker under strong background radiance. In Proceedings of the 2012 IEEE International Conference on Computer Science and Automation Engineering (CSAE), Zhangjiajie, China, 25–27 May 2012; pp. 644–648. [Google Scholar]
  22. Wang, H.; Wang, B.; Gao, Y.; Wu, S. Near-earth space star map simulation method of short-wave infrared star sensor. Infrared Phys. Technol. 2022, 127, 104436. [Google Scholar] [CrossRef]
  23. Zheng, X.; Shen, J.; Wei, Z.; Wang, H. Star map simulation and platform influence of airborne star sensor based on J-band data of 2MASS catalog. Infrared Phys. Technol. 2020, 111, 103541. [Google Scholar] [CrossRef]
  24. Wei, E.; Chang, L.; Yang, H. Transformation between ICRS and ITRS based on SOFA. J. Geomat. 2012, 37, 31–33. [Google Scholar]
  25. Men, T.; Shi, J.; Xu, R.; Liu, C.; Wen, C. Correction method of atmospheric refraction based on the low elevation infrared measurement. Infrared Laser Eng. 2016, 45, 0117004. [Google Scholar] [CrossRef]
  26. Xiaojuan, W.; Xinlong, W. Multiple blur of star image and the restoration under dynamic conditions. Acta Astronaut. 2011, 68, 1903–1913. [Google Scholar] [CrossRef]
  27. Huang, B.; Ma, J.; Tian, J. Research on simulation of vibration blurred star images. Comput. Digital Eng. 2012, 40, 90–92. [Google Scholar]
  28. Pickles, A. A stellar spectral flux library: 1150–25000 Å. Publ. Astron. Soc. Pac. 1998, 110, 863. [Google Scholar] [CrossRef]
  29. Lu, R.; Wu, Y. Estimation of stellar instrument magnitudes using synthetic photometry. In Proceedings of the 2019 IEEE Aerospace Conference, Big Sky, MT, USA, 2–9 March 2019; pp. 1–7. [Google Scholar]
  30. Wang, W.; Zhang, G.; Wei, X. Modeling analysis and experimental verification for all-time star sensor. Infrared Laser Eng. 2019, 48, 1113001. [Google Scholar] [CrossRef]
  31. Wang, H.; Zhou, W.; Lin, H.; Wang, X. Parameter Estimation of Gaussian Gray Diffusion Model of Static lmage Spot. Acta Opt. Sin. 2012, 32, 323004. [Google Scholar] [CrossRef]
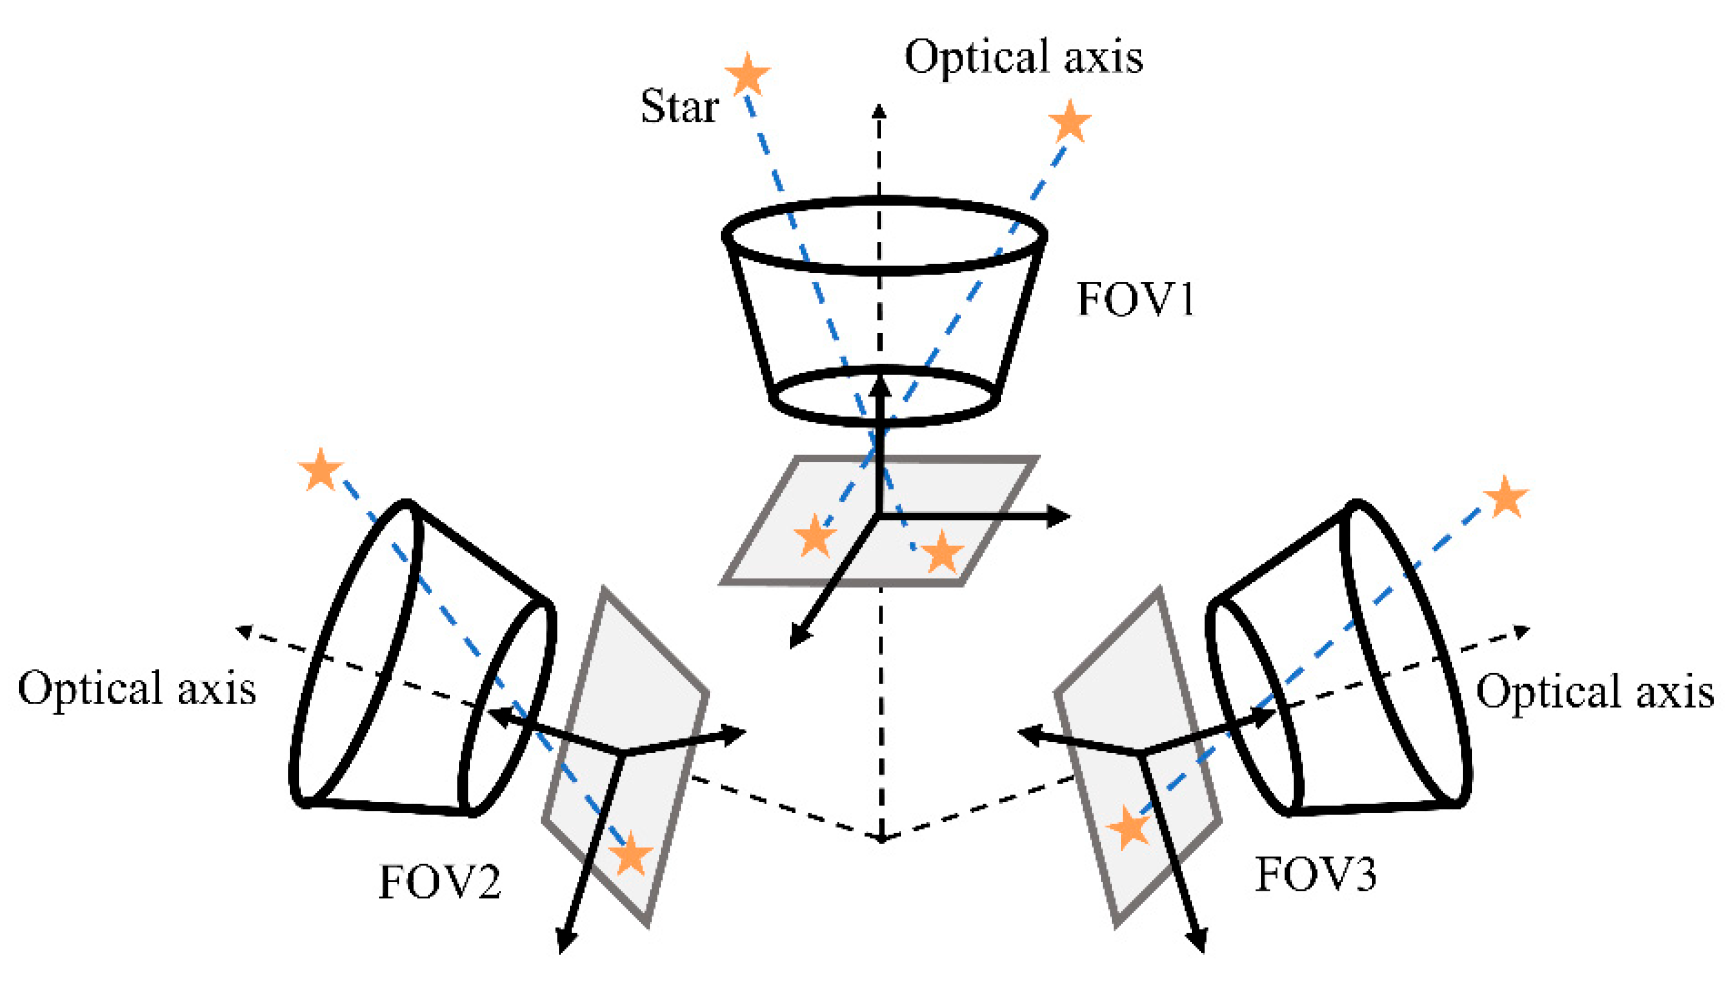
Figure 1. Structural schematic diagram of the all-time three-FOV star sensor.
Remotesensing 17 03853 g001
Figure 2. Implementation flowchart of star map simulation.
Remotesensing 17 03853 g002
Figure 3. Schematic diagram of the mapping relationship between FOV coordinate system and image coordinate system.
Remotesensing 17 03853 g003
Figure 4. Three characteristic patterns of stellar image displacement induced by atmospheric refraction: (a) stellar altitude angle greater than that of the optical axis; (b) stellar altitude angle less than that of the optical axis and θr > R; and (c) stellar altitude angle less than that of the optical axis and θr < R.
Remotesensing 17 03853 g004
Figure 5. Angular motion of airborne platform. (a) Rotation about non-optical axis; (b) Rotation about optical axis.
Remotesensing 17 03853 g005
Figure 6. Angular vibration of airborne platform around optical axis and non-optical axis.
Remotesensing 17 03853 g006
Figure 7. Energy composition analysis of star maps.
Remotesensing 17 03853 g007
Figure 8. Relative spectral distributions of stars with different spectral types. (a) K0IV; (b) B9III.
Remotesensing 17 03853 g008
Figure 9. Atmospheric transmittance and sky background radiance under different VZAs. (a) Atmospheric transmittance; (b) Sky background radiance.
Remotesensing 17 03853 g009
Figure 10. Simulated star maps in three FOVs under static conditions. (a) FOV1; (b) FOV2; (c) FOV3.
Remotesensing 17 03853 g010
Figure 11. Simulated star maps in three FOVs under non-optical axis rotation. (a) Xf1: −2°/s, Yf1: 2°/s; (b) Xf1: −4°/s, Yf1: 4°/s; (c) Xf1: −6°/s, Yf1: 6°/s; (d) Xf1: −8°/s, Yf1: 8°/s; (e) Xf1: −10°/s, Yf1: 10°/s.
Remotesensing 17 03853 g011
Figure 12. Simulated star maps in three FOVs under optical axis rotation. (a) Zf1: 5°/s; (b) Zf1: 10°/s.
Remotesensing 17 03853 g012
Figure 13. Simulated star maps in three FOVs under non-optical axis angular vibration. (a) A: 5 × 10⁵; (b) A: 106.
Remotesensing 17 03853 g013
Figure 14. Simulated star maps in three FOVs under optical axis angular vibration. (a) A: 5 × 10⁶; (b) A: 107.
Remotesensing 17 03853 g014
Figure 15. Comparison of simulated and real star maps under static conditions: (a) real star map; (b) simulated star map generated by the proposed method; and (c) simulated star map generated using Method 1.
Remotesensing 17 03853 g015
Figure 16. Comparison of simulated and real star maps under non-optical axis rotation. (a) Yf1: 2°/s; (b) Yf1: 4°/s; (c) Yf1: 6°/s; (d) Yf1: 8°/s; (e) Yf1: 10°/s.
Remotesensing 17 03853 g016
Figure 17. Comparison of simulated and real star maps under optical axis rotation. (a) Zf1: 5°/s; (b) Zf1: 10°/s.
Remotesensing 17 03853 g017
Figure 18. Relative errors of evaluation metrics under different Conditions. (a) proposed method; (b) Method 1.
Remotesensing 17 03853 g018
Table 1. Parameters of the optical system.
ParameterValue
FOV/°1.96 × 1.96
Focal length/mm298
Optics aperture/mm100
Transmittance90%
g1/mm−22.31 × 10−5
Table 2. Parameters of the Bobcat-640.
ParameterValue
Array format/pixels640 × 512
Pixel pitch/μm20
Wavelength range/μm1.3–1.7
Quantum efficiency80%
Dark current/fA30
Table 3. Star map degradation characteristics of All-Time Three-FOV star sensor under various dynamic conditions.
Condition TypeMotion ParametersFOVSNRGtotalGCIDSD
Static
Baseline
-FOV134.5/
39.9, 47.6/
158.6
75,847/
79,915, 95,281/
310,800
68.1%/
64.0%, 70.6%/
60.4%
8.9/
8.1, 8.2/
5.8
FOV2
FOV3
Non- Optical Axis RotationXf1: −2°/s Yf1: 2°/sFOV127.0/
38.0, 42.0/
144.3
59,439/
75,751, 83,599/
283,100
51.8%/
63.3%, 62.9%/
48.0%
11.0/
9.2, 9.5/
7.0
FOV2
FOV3
Xf1: −4°/s Yf1: 4°/sFOV115.0/
36.6, 39.7/
95.1
33,262/
73,369, 79,498/
187,055
33.7%/
55.3%, 57.1%/
38.3%
13.2/
10.1, 10.3/
9.2
FOV2
FOV3
Xf1: −6°/s Yf1: 6°/sFOV110.3/
34.3, 34.0/
70.0
22,855/
68,539, 68,000/
137,232
32.0%/
53.7%, 52.0%/
32.5%
17.1/
11.0, 11.4/
13.2
FOV2
FOV3
Xf1: −8°/s Yf1: 8°/sFOV19.3/
31.0, 31.2/
53.8
20,460/
62,090, 62,471/
105,696
31.0%/
52.6%, 50.1%/
31.8%
20.3/
11.9, 11.9/
16.4
FOV2
FOV3
Xf1: −10°/s Yf1: 10°/sFOV17.3/
25.9, 27.9/
39.2
16,102/
51,830, 55,710/
77,154
27.7%/
45.5%, 44.5%/
29.0%
22.9/
12.7, 13.1/
19.7
FOV2
FOV3
Optical Axis RotationZf1: 5°/sFOV134.4/
20.7, 24.1/
121.7
75,562/
41,574, 48,273/
239,275
66.0%/
38.7%, 40.0%/
41.1%
10.1/
13.1, 14.9/
8.4
FOV2
FOV3
Zf1: 10°/sFOV133.4/
12.5, 13.5/
66.1
73,678/
24,971, 26,978/
130,187
61.6%/
36.0%, 37.1%/
37.9%
11.0/
18.2, 18.5/
11.6
FOV2
FOV3
Non- Optical Axis Angular VibrationXf1: 5 × 10⁵ Yf1: 5 × 10⁵FOV124.3/
34.0, 44.5/
145.6
53,596/
68,401, 89,398/
285,175
46.2%/
59.1%, 64.9%/
49.4%
12.0/
10.8, 11.1/
7.1
FOV2
FOV3
Xf1: 106 Yf1: 106FOV17.5/
9.8, 10.1/
140.3
16,551/
19,672, 20,638/
275,581
36.1%/
35.5%, 34.9%/
47.6%
24.0/
25.2, 24.9/
8.0
FOV2
FOV3
Optical Axis Angular VibrationZf1: 5 × 10⁶FOV134.4/
10.4, 8.7/
44.5
76,062/
20,827, 17,363/
87,411
64.5%/
41.4%, 34.9%/
35.7%
10.1/
31.1, 32.0/
28.3
FOV2
FOV3
Zf1: 107FOV132.2/
6.7, 5.3/
29.9
70,925/
13,542, 10,658/
58,787
59.0%/
33.0%, 26.4%/
34.7%
11.3/
36.9, 38.4/
40.6
FOV2
FOV3
Table 4. Comparative analysis of multi-dimensional evaluation metrics between real and simulated star maps.
Condition TypeMotion ParametersSNR[R/Sp/S1] 1Gtotal[R/Sp/S1]GCI[R/Sp/S1]DSD[R/Sp/S1]
Static Baseline-24.0/27.8/29.174,680/74,746/82,12378.1%/67.3%/66.1%10.11/9.58/11.15
Non-Optical Axis
Rotation
Yf1: 2°/s24.0/26.6/28.671,623/71,233/80,76468.2%/62.9%/61.3%11.84/10.80/13.06
Yf1: 4°/s21.2/24.7/26.063,629/66,760/73,64569.4%/63.5%/59.7%13.32/12.24/13.92
Yf1: 6°/s18.6/21.0/23.655,726/56,217/66,60454.5%/55.5%/56.7%14.52/13.56/15.80
Yf1: 8°/s15.8/18.4/19.947,994/49,480/56,28844.7%/45.9%/50.8%16.39/15.10/17.84
Yf1: 10°/s13.5/15.7/16.041,564/42,429/45,28042.9%/48.9%/49.2%17.57/16.02/18.42
Optical Axis RotationZf1: 5°/s23.4/27.1/28.671,379/73,385/80,34673.8%/65.4%/62.8%10.85/10.13/11.90
Zf1: 10°/s23.7/26.6/28.171,335/71,583/79,13471.9%/64.3%/63.9%11.53/10.78/12.55
1 R: real star map; Sp: simulated star map generated using the proposed method; S1: simulated star map generated using Method 1.
Disclaimer/Publisher’s Note: The statements, opinions and data contained in all publications are solely those of the individual author(s) and contributor(s) and not of MDPI and/or the editor(s). MDPI and/or the editor(s) disclaim responsibility for any injury to people or property resulting from any ideas, methods, instructions or products referred to in the content.