Article

Correction of Refraction Effects on Unmanned Aerial Vehicle Structure-from-Motion Bathymetric Survey for Coral Reef Roughness Characterisation

1
Geo-Ocean, University of Brest, CNRS, Ifremer, UMR6538, F-29280 Plouzané, France
2
Pôle Image et Instrumentation—IUEM, University of Brest, CNRS, IRD, UAR 3113, F-29280 Plouzané, France
3
Observatoire des Sciences de l’Univers de La Réunion (OSU-Réunion), UAR 3365, University of La Réunion, CNRS, Météo-France, IRD, F-97744 Saint-Denis, France
4
LIENSs, University of La Rochelle, CNRS, UMR 7266, F-17000 La Rochelle, France
*
Author to whom correspondence should be addressed.
Remote Sens. 2025, 17(23), 3846; https://doi.org/10.3390/rs17233846
Submission received: 21 October 2025 / Revised: 20 November 2025 / Accepted: 25 November 2025 / Published: 27 November 2025

Highlights

What are the main findings?
  • Both analytical (Snell’s law) and empirical (regression) methods for correcting refraction at the water/air interface drastically improve the quality of UAV-derived bathymetry.
  • Empirical (regression) methods are more efficient to reduce roughness errors and are fairly robust in terms of the choice of calibration points, as long as they cover a range of depths that is representative of the area.
What are the implications of the main findings?
  • Refraction corrections enable accurate, low-cost and large-scale coral reef mapping by UAV over shallow areas—reducing the need for extensive in-water measurements and supporting better assessments of wave dissipation, habitat complexity and reef health.
  • Even after correction, the 2.5D raster format of UAV DEM tends to smooth the bed 3D complexity, altering the roughness metrics. Three-dimensional mapping formats should be considered.

Abstract

Coral reefs play a crucial role in tropical coastal ecosystems, even though these environments are difficult to monitor due to their diversity and morphological complexity and due to their shallowness in some cases. This study used two approaches for acquiring very-high-resolution bathymetric data: underwater structure-from-motion (SfM) photogrammetry collected from a low-cost platform and unmanned/uncrewed aerial vehicle (UAV)-based SfM photogrammetry. While underwater photogrammetry avoids the distortions caused by refraction at air/water interface, it remains limited in spatial coverage (about 0.04 ha in 1 h of survey). In contrast, UAV photogrammetry allows for covering extensive areas (more than 20 ha/h) but requires applying refraction correction in order to accurately compute bathymetry and roughness values. An analytical approach based on Snell laws and an empirical approach based on linear regression (calibrated using a batch of points whose depths are representative of the depth range of the surveyed areas) are tested to correct the apparent depth on the raw UAV digital elevation model (DEM). Comparison to underwater photogrammetry shows that correcting refraction reduces the root mean square error (RMSE) by more than 50% (up to 62%) on bathymetric models, with RMSE lower than 0.13 m for the analytical approach and down to 0.09 m for the regression method. The linear-regression-based refraction correction proved most effective in restoring accurate seabed roughness, with a mean error on roughness lower than 17% (vs. 30% for analytical refraction correction and 48% for apparent bathymetry).

1. Introduction

Coral reefs play a crucial role in tropical coastal ecosystems and are one of the most important resources for tropical countries, through fishing, tourism and their scenic and cultural value. They also play an important role in coastal protection by mitigating the risks of coastal flooding, erosion and storm surges [1,2,3].
While the establishment and development of coral reefs depend on hydrodynamic conditions (e.g., [4]), in return, hydrodynamics on the reef flat are strongly controlled by the geometry and bathymetry of the reef, which significantly impact sediment production and transport processes, as well as the morphodynamics of reef-backed coastlines (e.g., [3,5,6,7,8,9]). On the reef flat, the main impact on hydrodynamics is the dissipation of wave energy through friction due to the enhanced coral roughness. The roughness of the seabed, resulting from the assembly of coral communities, is in fact much greater than that of sandy seabeds and generates friction values more than 100 times higher [8].
In order to better predict and quantify the dissipative capacity of the reefs, frictional processes must be comprehensively detailed. Wave friction has been shown to be dependent of both the local hydrodynamics (water depth and wave properties) and bed properties through the so-called ‘hydraulic roughness length’, which is a proxy of the bed roughness [3,10]. Roughness is considered here in its broad meaning as the measure of the irregularity or unevenness of the bottom, reflecting the variations in height, slope or texture at different spatial scales. Among the various roughness metrics (e.g., slope-based metrics, vector ruggedness measure, terrain ruggedness index, fractal dimension, etc.), we will use here the standard deviation of seabed elevations, widely used in hydrodynamics, since it correlates with the hydraulic length (e.g., [3,11,12,13,14]). However, seabed elevations’ standard deviation (and thus, roughness) is dependent on the extent of the area considered, as well as the resolution of the topographic data [15,16]. Properly measuring the multiple length scales found in reef environments (from the polyp’s cavities in millimetres up to the spurs and grooves formations that reach several meters) is thus a key challenge to accurately predict the frictional properties of reefs.
Historically, reef roughness has often been calculated as the ratio between the length of the reef surface along a profile and the corresponding linear distance. The measurement was based on the ‘chain-and-tape’ method, which involved draping a chain across the reef surface to measure its length (e.g., [17,18,19]). Simple and inexpensive, this method has the disadvantage of providing information only along a given transect, depending largely on the choice of profiles and the way in which divers place the chain.
Traditional bathymetry methods, such as multi-beam echo sounders (MBES) or aerial bathymetric LiDAR, can be used to produce a digital elevation model (DEM) over large areas. However, their use is not fitted to very shallow waters. Indeed, navigation possibilities are limited by the vessel’s draught, and the MBES swath width is greatly reduced, limiting the possibilities for total coverage. Additionally, obtaining reliable measurements using bathymetric LiDAR in very shallow waters (< 1 m) is far from straightforward and often results in gaps in the data [20,21]. In addition, the spatial resolution of these data is not finer than tens of centimetres, which means that the seabed microtopography can be ignored.
Underwater photogrammetry, widely used in many applications such as archaeology (e.g., [22]), infrastructure monitoring (e.g., [23]) and ecological monitoring (e.g., [24,25,26]), provides spatialised information comprising both a visual image (orthomosaic) and a DEM. Regardless of the type of platform (ROV, diver, surface platform, etc.), in very shallow waters (<1 to 2 m), the short distance between the sensor and the seabed results in very high resolution but implies a limited spatial coverage for each image. Therefore, maintaining sufficient overlap between images requires minimal camera movement between successive captures, leading to a spatially limited survey area [27]. In particular, this study will use the low-cost/low-tech POSEIDON platform [27], combining two underwater GoProTM cameras mounted under a bodyboard and a Global Navigation Satellite System (GNSS) antenna enabling real-time kinematic (RTK) positioning of one of the cameras.
Unmanned aerial vehicles (UAV) appear to be an inexpensive, relatively easy-to-use tool that offers an adequate compromise between spatial resolution and spatial footprint (e.g., [28,29,30,31]). Using UAV images, there are various methods for calculating bathymetry:
  • wave-physics-based methods that exploit the relation between wave celerity and depth (e.g., [32,33,34,35,36,37]
  • methods based on radiometric inversion, generally consisting of a regression on a combination of the R, G, B (+ sometimes NIR) bands (e.g., [38,39,40]);
  • geometric methods based on 3D reconstruction using structure-from-motion (SfM) photogrammetry, which generally involves using underwater ground control points (GCP—e.g., [30]) or correcting refraction effects at the water/air interface (e.g., [39,41,42]).
Currently, the methods based on wave physics can only detect changes in wave dynamics at metric scales and are therefore not suited to capture the complex morphology of reef environments. Furthermore, given the diversity of seabed types (and therefore diversity of reflectance), radiometric inversion methods seem less suited to these environments than SfM photogrammetry methods. The latter, more specifically, require clear water (so that seabed texture can be clearly seen in images) and, as far as possible, a surface without waves. Provided these conditions can be achieved, the effects of refraction can be corrected in various ways:
  • analytically, using Snell’s law to model the refraction of optical rays (e.g., [39,42,43]);
  • using linear regressions between UAV-derived apparent depth and effective depth [44,45];
  • through artificial intelligence (AI) methods, generally used to optimise radiometric regression models [40,43,46] by improving the consideration of non-linearities in radiometric models or to empirically correct refraction [47,48]. Some studies use AI by combining radiometric and geometric (photogrammetry) approaches [31,49].
However, for practical reasons, existing approaches are typically validated only at isolated points (measurement using a pole-mounted RTK GNSS—e.g., [50]) or by comparison with much coarser resolution techniques (as transponder, aerial LiDAR, etc.—e.g., [29]). As a result, the true accuracy of refraction-corrected UAV DEMs remains largely unquantified, and their ability to resolve seabed roughness is still unknown.
This study takes advantage of two very-high-resolution, refraction-free underwater photogrammetric surveys acquired using the POSEIDON platform [27]. This unique dataset enables a rigorous, full-resolution evaluation of two refraction-correction strategies for drone-based bathymetry: an analytical method based on Snell’s law and an empirical regression-based method. We assess these corrections through their capacity to generate high-quality bathymetric DEMs suitable for quantitative characterization of seabed roughness in a coral-reef environment.

2. Study Area

The fringing reef of La Saline is located on the west coast of La Réunion Island in the southwestern Indian Ocean (Figure 1). It stretches for 4.5 km along the shoreline, from the Hermitage Pass in the north to the Trois Bassins Pass in the south, with a width ranging from 100 to 600 m [51]. Geomorphologically, the reef is composed of three typical compartments arranged from the ocean toward the land: the fore-reef, the reef-flat and the back-reef [52]. The fore-reef slopes upward from depths of several tens of metres to the reef crest. Back of the reef crest, the reef-flat has an average depth of 0.5 m and a width of approximately 300 to 400 m. The back-reef is broadly deeper, with an average depth of 1.2 m [51].
The tidal regime is mixed semidiurnal, with a microtidal range marked by spring tides reaching up to 0.90 m and neap tides around 0.10 m [53]. Offshore wave conditions are mainly influenced by the prevailing south-easterly trade winds, which are active year-round, generating moderate waves with significant wave heights (Hs), generally below 2 m. Distant swells generated by low-pressure systems forming in the southern Indian Ocean during the austral winter also impact the site. The generated waves have longer periods (>12 s) and larger significant wave heights (occasional peaks reaching up to 8 m) [51].
Throughout this study, we will use the RGR92 UTM 40S projected coordinate system (Figure 1c). Since GNSS measurements were taken relative to the ellipsoid, vertical coordinates will be expressed in ellipsoidal heights (geodetic height) to avoid conversion bias in orthometric or bathymetric height.

3. Material and Methods for Data Collection

3.1. POSEIDON Survey

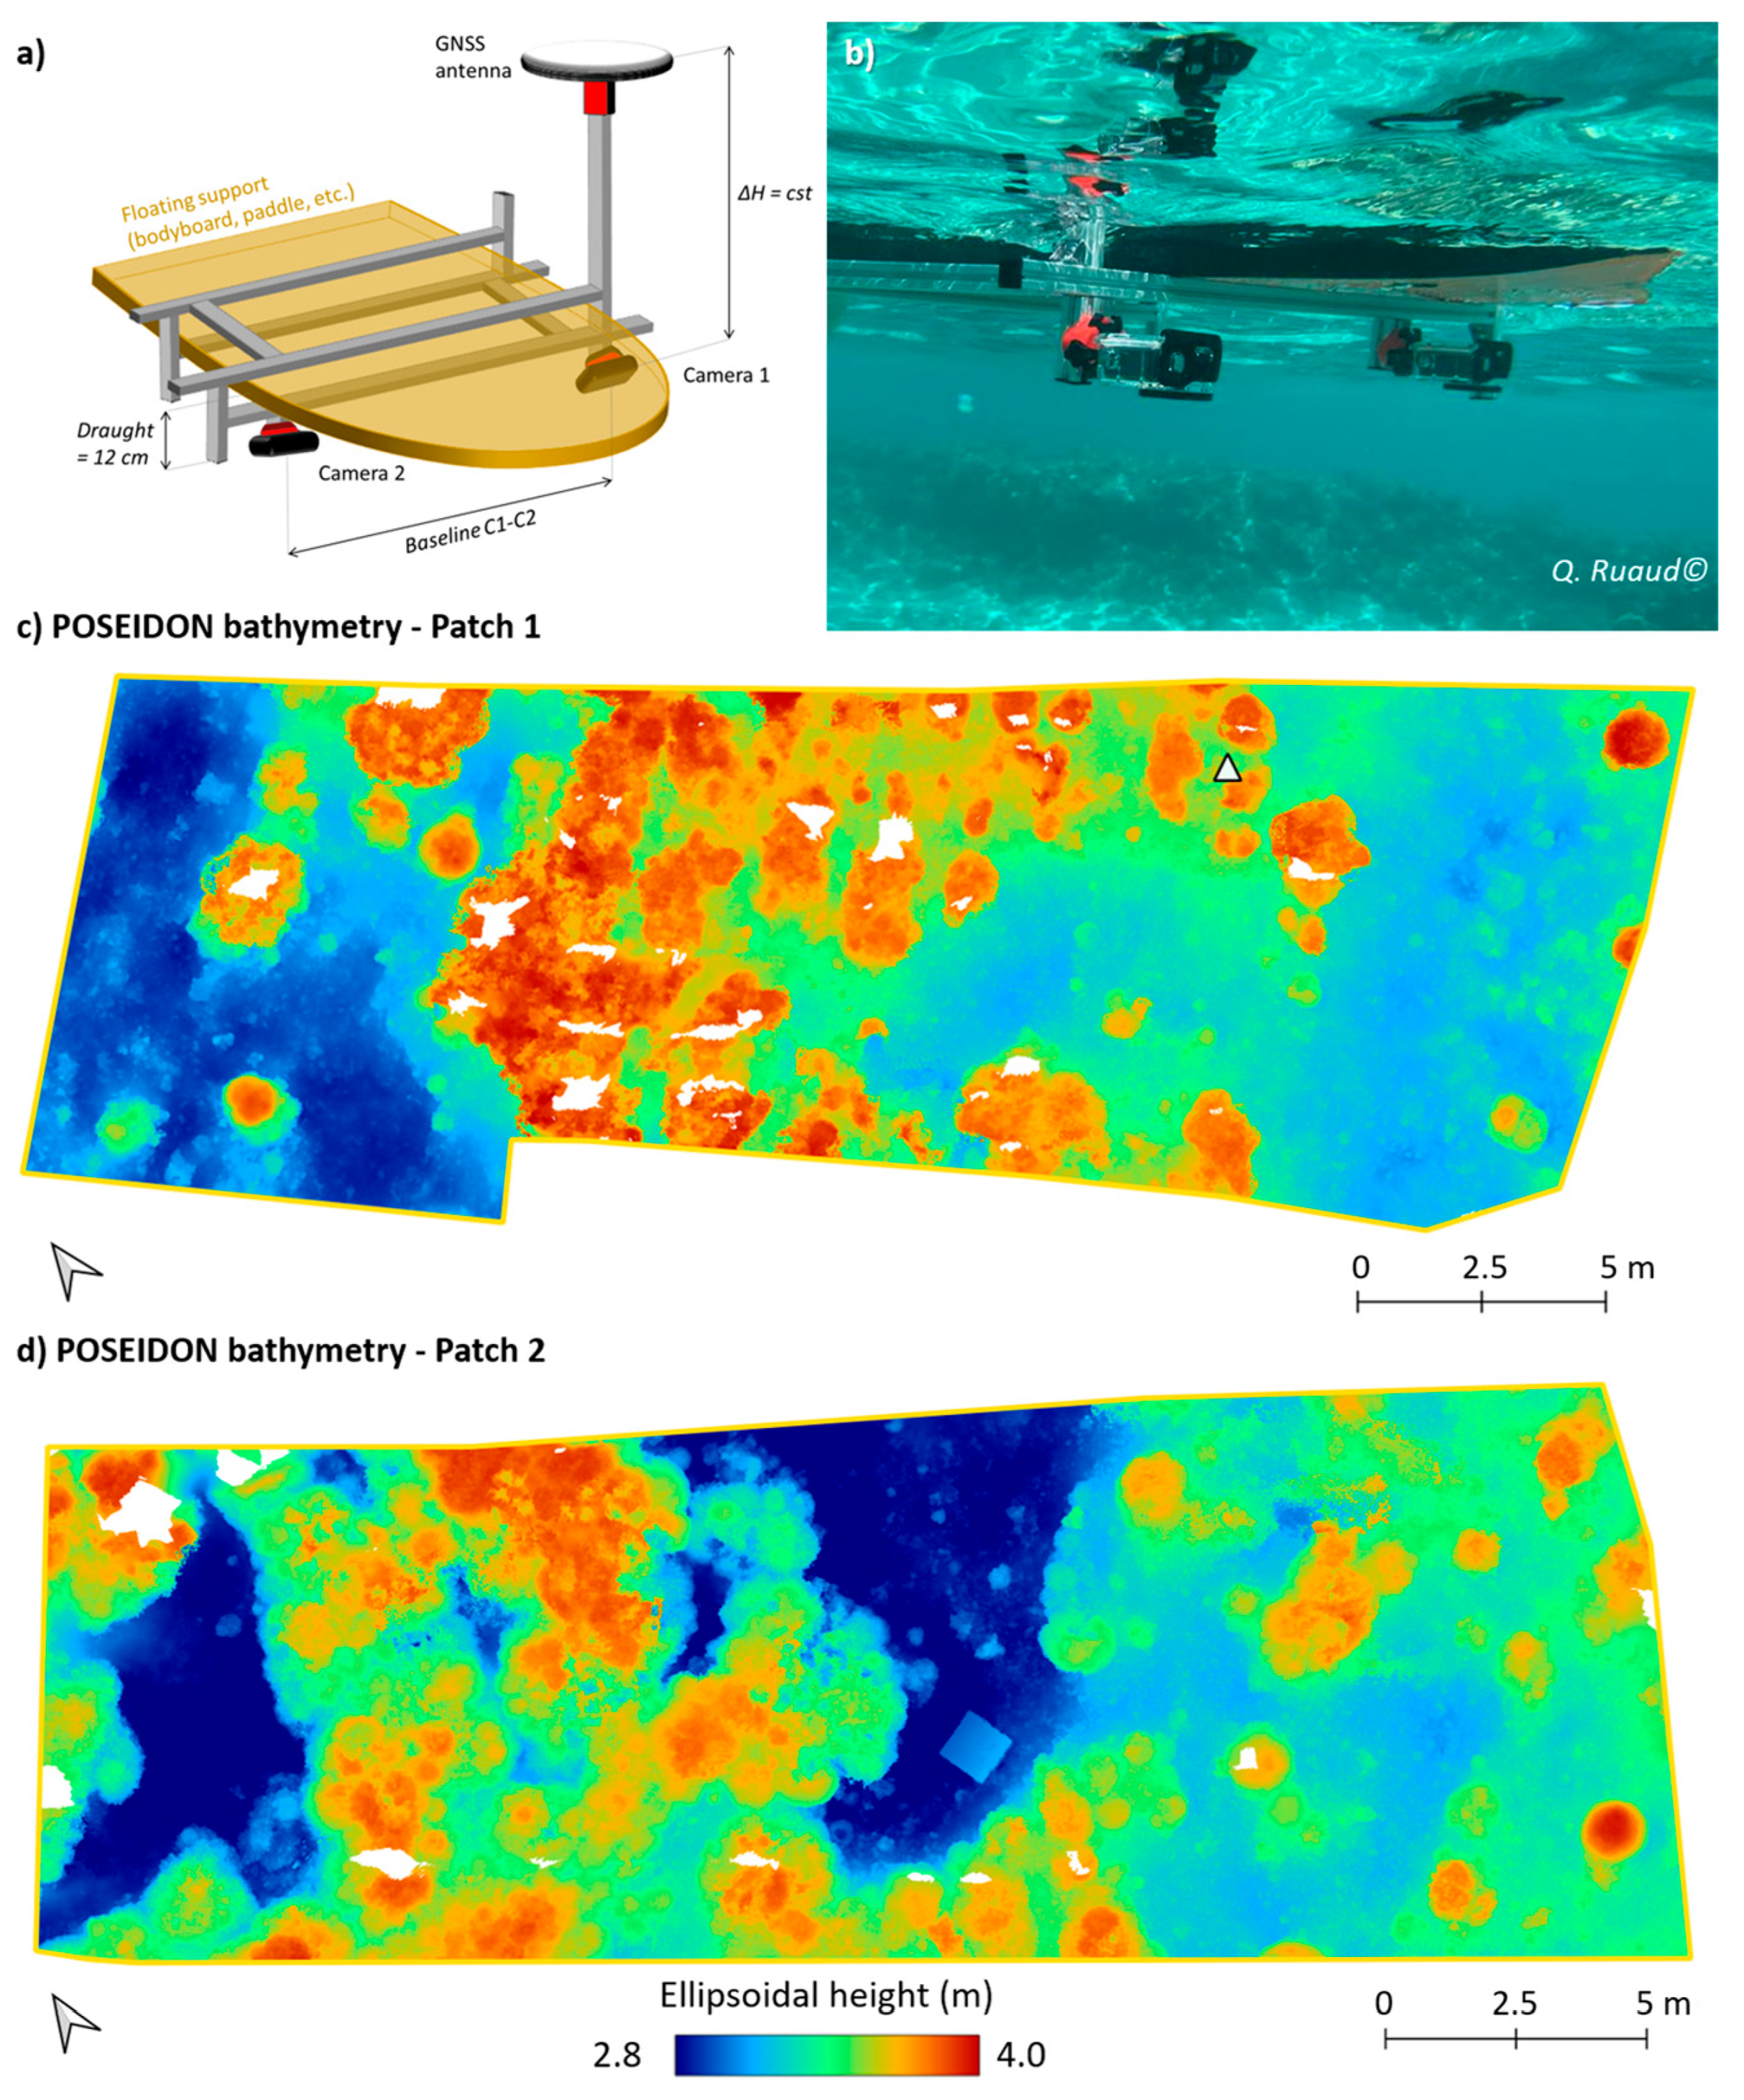
POSEIDON (Platform Operating in Shallow-water Environment for Imaging and 3D reconstructiON) is a low-cost/low-tech system for high-resolution underwater RTK SfM photogrammetry surveys in coastal shallow waters. The system, acquisition and processing methods are fully described in [27]. In short, POSEIDON combines a floating support (typically a bodyboard), two optical sensors (here, GoPro™—San Mateo, CA, USA—Hero7 Black cameras, in 4K wide format video mode, with a framerate of 24 images/s and a resolution of 12 Mpix) and an accurate positioning system using RTK GNSS, allowing us to perform high-resolution seabed mapping (Figure 2a,b). The GoPro cameras have a short focal length (2.92 mm), offering a wide field of view, which is particularly useful in shallow water. To adapt to situations with limited depth, the distance between cameras is set to 39 cm, allowing for approximately 60% overlap between the images from the two cameras for a depth of 50 cm. The GoPro situated directly above the GNSS antenna was nadir oriented, while the second GoPro was tilted forward by approximately 25° off nadir. The GNSS RTK position was recorded at a rate of 1 point/second. During processing, 4 images/second are automatically extracted from the videos, followed by manual selection to reduce the number of images when the platform is not moving (at the end of a radial, for example). Each image is assigned the position corresponding to the time closest to its acquisition time. SfM processing is performed using Agisoft Metashape® (v.2.0.2). According to [27], DEMs generated from POSEIDON data may be subject to average error and standard deviation of around 0.05 m.
For this study, we surveyed two patches measuring approximately 31 m (longshore) × 10 m (cross-shore) at different cross-shore distances on the reef-flat (Figure 1c) and with different coral coverages. To maximise the spatial coverage of the images, surveys were conducted at high tide. Unfortunately, the patches cover areas that are quite similar in terms of depth and coral coverage. However, this choice was made due to a minimum depth requirement (about 30 cm) in order to ensure sufficient overlap between images and also to allow operators access without damaging the reef.
Patch 1 was surveyed on 21 June 2024, from 12:30 to 13:50 (UTC+4), with high tide at 13:19. The average bottom elevation for this patch is 3.38 m. Following this, 20,888 images were selected and used for SfM photogrammetry processing, resulting in the construction of a 3D point cloud of 1.958 × 10⁶ points, a DEM (with a native resolution of 0.706 mm/pix) and an orthoimage (with a native resolution of 0.353 mm/pix). The DEM (Figure 2c) and orthoimage were exported at a resolution of 1 cm.
Patch 2 was surveyed on 19 June 2024, from 11:35 to 12:11 (UTC+4), with high tide at 11:56. On this patch, the average bottom elevation (expressed in ellipsoidal height) is 3.32 m. After the survey, 21,177 images were used for SfM photogrammetry processing, enabling the construction of a 3D point cloud of 447 × 106 points, from which a DEM (with a native resolution of 0.834 mm/pix) and an orthoimage (with a native resolution of 0.417 mm/pix) could be generated. For reasons of data storage and usability, the dense point cloud was interpolated to export a DEM (Figure 2d) and an orthoimage at a resolution of 1 cm.
The images in Patch 2 are slightly blurred (possibly due to an average movement speed that is 20% higher), which could explain the lower number of reconstructed points compared to Patch 1.

3.2. UAV Survey

The UAV flight is carried out as early as possible (as soon as there is sufficient light), when the study area is still in shadow in order to avoid the effects of sunglint. In addition, at this time of day, thermal winds are at their lowest, which limits the generation of chop and short waves on the reef flat (Figure 3a). The flight took place on 25 June 2024, from 7:15 to 8:12 (UTC+4), with sunrise at 6:55 and low tide at 9:49. The survey was therefore carried out during the ebb tide. During the flight, the average wind speed (at 10 m) recorded at the ‘Pointe des Trois Bassins’ station is from the northeast at approximately 1.3 m/s (with a maximum instantaneous speed of 4.3 m/s) (source: Météo-France®—French National Meteorological Service).
We used a DJI Phantom 4 Pro RTK, equipped with a 20-megapixel camera with a 8.8 mm focal length, pointed 30° away from the nadir. The drone followed a criss-cross trajectory (Figure 1c), at about 75 m above sea level, with 80% overlap between images.
Three targets were placed on the beach and measured using RTK-GNSS to serve as ground control points (GCPs). In addition, four characteristic coral heads, such as the centre of large isolated Porites (i.e., rounded and smooth coral), easy to identify in the UAV pictures, were measured using RTK GNSS on the reef flat to add GCPs in the cross-shore direction (Figure 1c and Figure 3b).
The SfM photogrammetry processing was carried out using Agisoft Metashape® software (v.2.0.2). Accordingly, 796 images (out of 877 acquired) were aligned during SfM photogrammetry processing, the images that were not aligned corresponding to the surf zone on the reef crest. The DEM (resolution of 4.4 cm/pixel) and orthomosaic (resolution of 2.2 cm/pixel) cover an area of 380 m (longshore) × 571 m (cross-shore) (including 453 m cross-shore usable for bathymetry calculations) (Figure 1c).

3.3. Pressure Sensor

Although several hydrodynamic sensors (pressure sensors, current profilers, etc.) were deployed along a cross-shore transect, only the pressure sensor located at Patch 1 is used in this study (Figure 1c). This is an OSSI pressure sensor recording at 5 Hz, directly fixed to the seafloor by a grating and whose position was measured using RTK GNSS. It was installed at an ellipsoidal height of Zbed_sensor = 3.48 m.
The average water depth on 21 June 2024, from 12:30 to 13:50 (UTC+4), during the POSEIDON survey (Patch 1), was 0.82 m. This depth is consistent with the RTK GNSS measurement of the free surface elevation ZS by POSEIDON (averaged over the survey time and corrected for the camera’s draught), ZS = 4.31 m (ZS − Zbed_capt = 0.83 m).

4. Methods for Correction of Refraction Effects

4.1. Analytical Approach

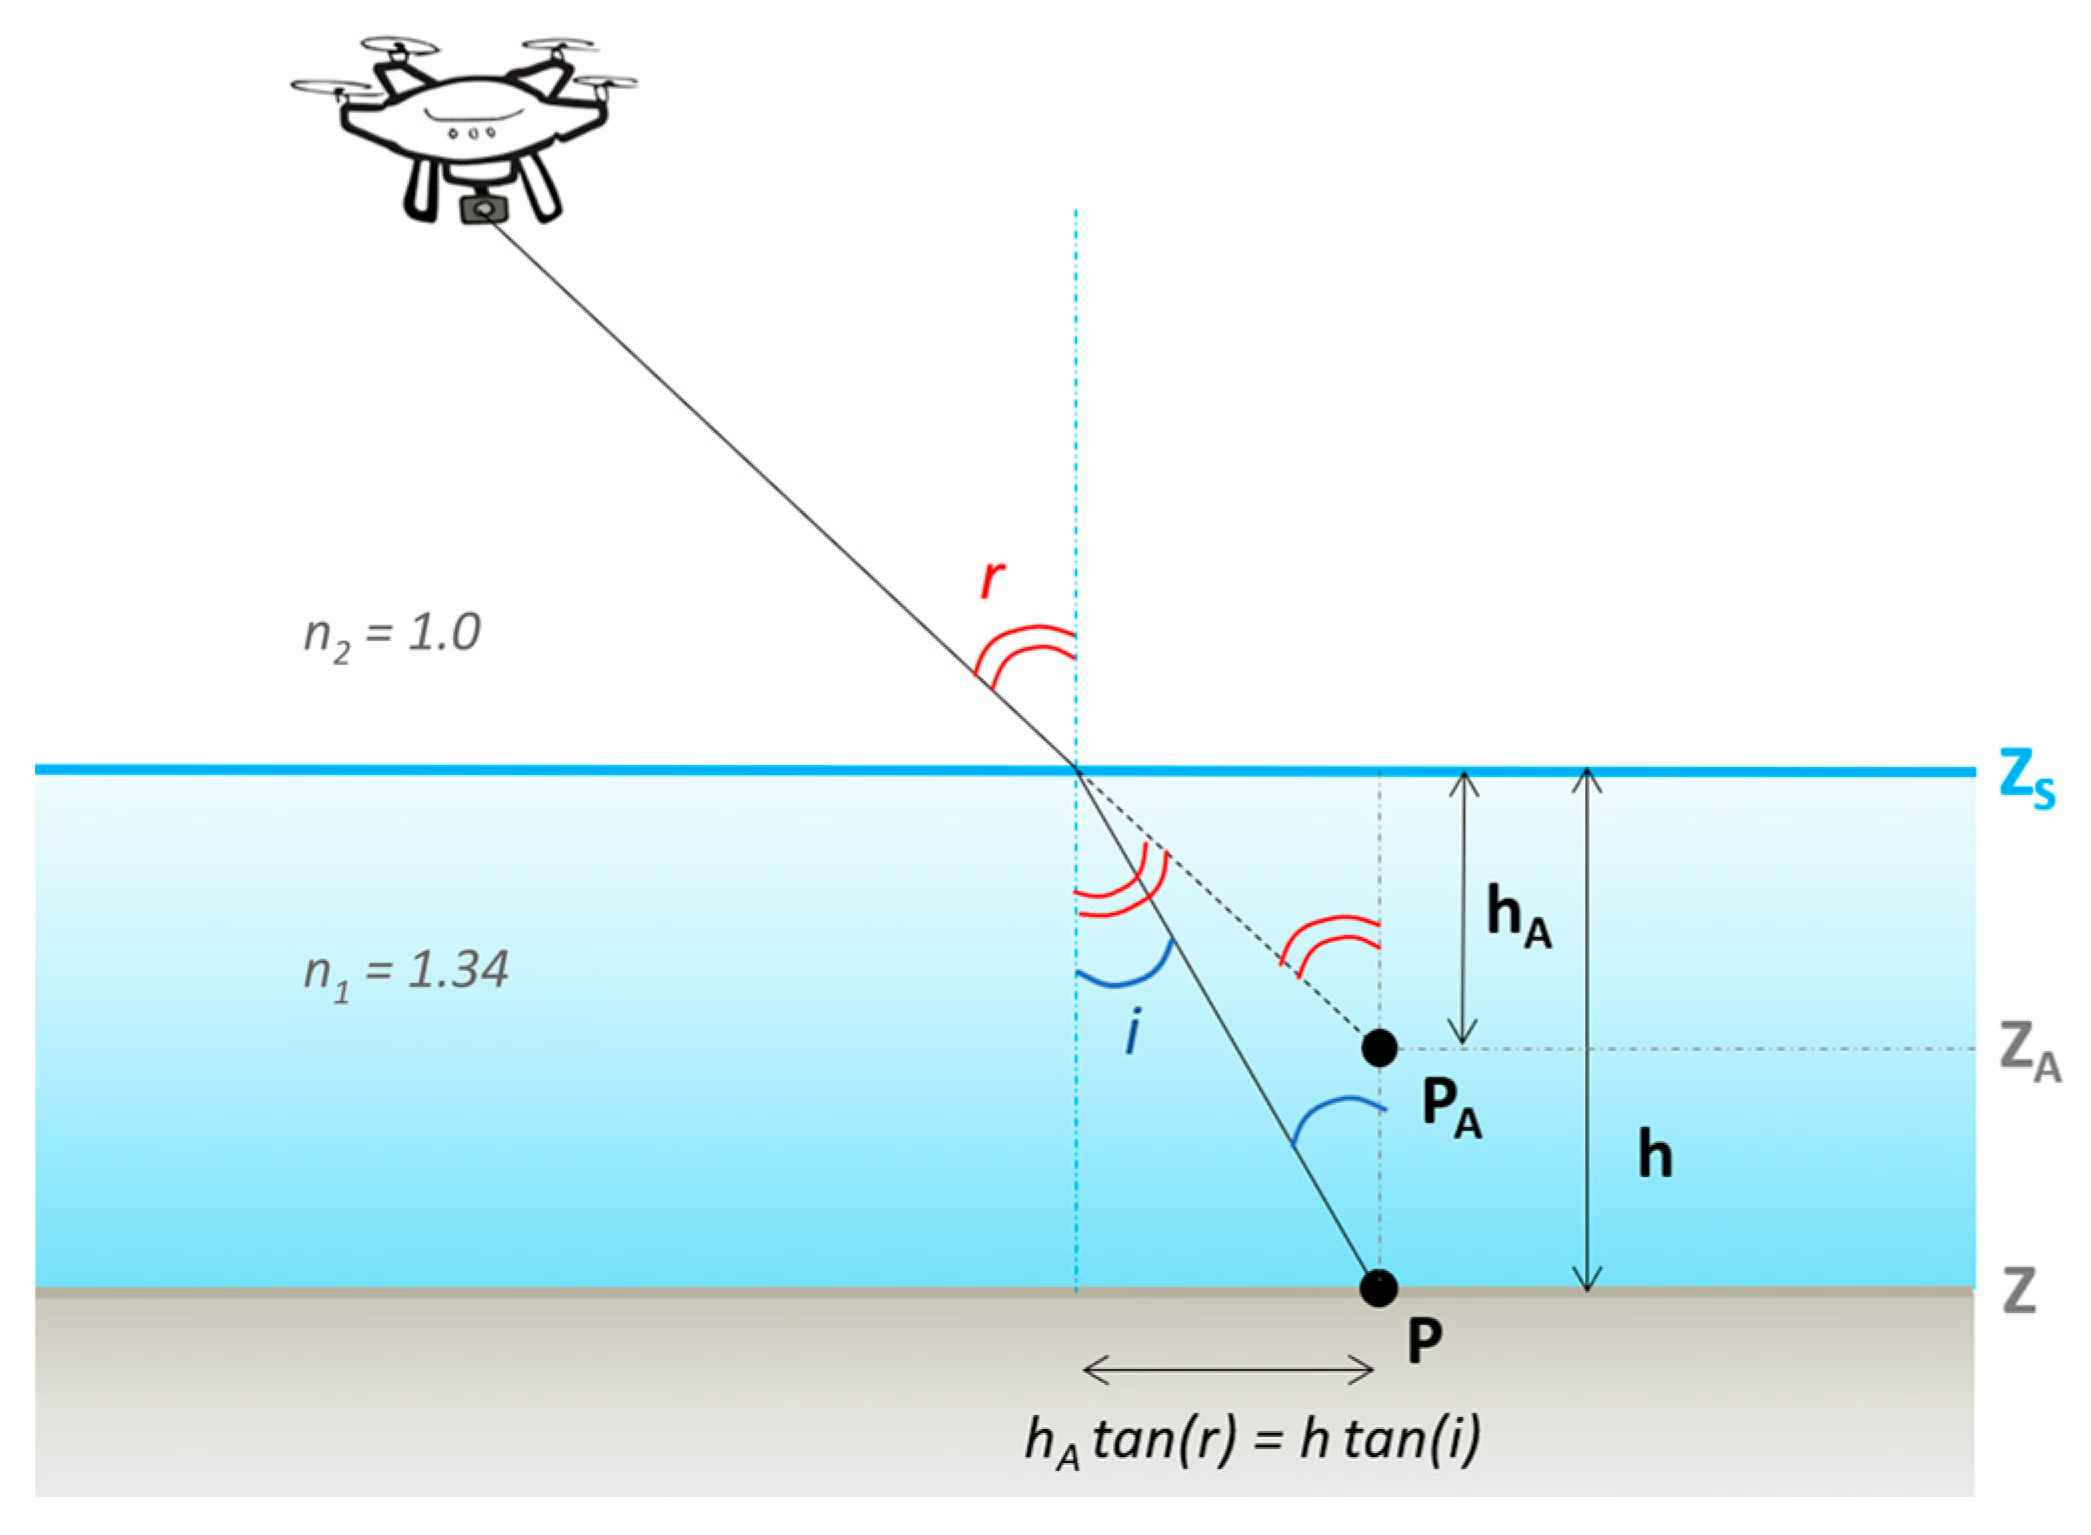
For bathymetric measurements using aerial photogrammetry, the phenomenon of refraction results in a change in the direction of the optical ray as it passes through the water/air interface and is described by Snell’s law (1):
n1 sin(i) = n2 sin(r)
where i and r are, respectively, the angles of incident and refracted light ray, and n1 and n2 are, respectively, the refractive index of water and the refractive index of air (n2 = 1). For clear water, the literature reports that n1 = 1.34 and that this value varies by less than 1% for a range of temperature and salinity conditions [42,54,55,56]. This mainly implies that the points seen through this interface appear shallower than they actually are (Figure 4).
Westaway et al. [57] propose a simplified version of this approach, assuming that the water surface is flat and that angles i and r are sufficiently small such that tan(i) ≈ sin(i) and tan(r) ≈ sin(r). In this case, the true water depth h can be estimated using the simplified Equation (2):
h = n1 × hA
with hA the apparent water depth, which can be estimated following Equation (3):
hA = ZSZA
where ZA is the apparent seabed elevation (according to a vertical reference) from the UAV DEM, and ZS is the water surface elevation at the time of the survey (based on pressure sensor data). In our case, variations in ZS due to waves and tides (−6 cm due to the ebb tide during the flight) are ignored, and ZS is calculated from pressure sensor data averaged over the duration of the flight.
This simplified Equation (2) has been widely used ever since, especially with the boom in UAVs (e.g., [39,42,43]). However, ref. [41] emphasises that SfM photogrammetry involves a wide variety of viewpoints and therefore viewing angles and that it is recommended to acquire off-nadir images (generally 5–30° off vertical) to improve bundle adjustment [58,59,60]. Added to this are the very wide fields of view (FOV) of the cameras generally installed on drones. The recommended nadir view is therefore only checked for the central pixels of the images.
Here, the camera was 30° off-nadir, which implies, for the central ray, a difference of approximately 13% between sin(r) and tan(r). Since the camera’s FOV is 84° (i.e., greater than 30° on either side of the central ray), even if the camera’s tilt increases the angle r for part of the image, it also reduces it for another part. Therefore, we will assume that this does not prevent us from applying Equation (2) for an analytical correction of the refraction.

4.2. Empirical Approach Based on Regression

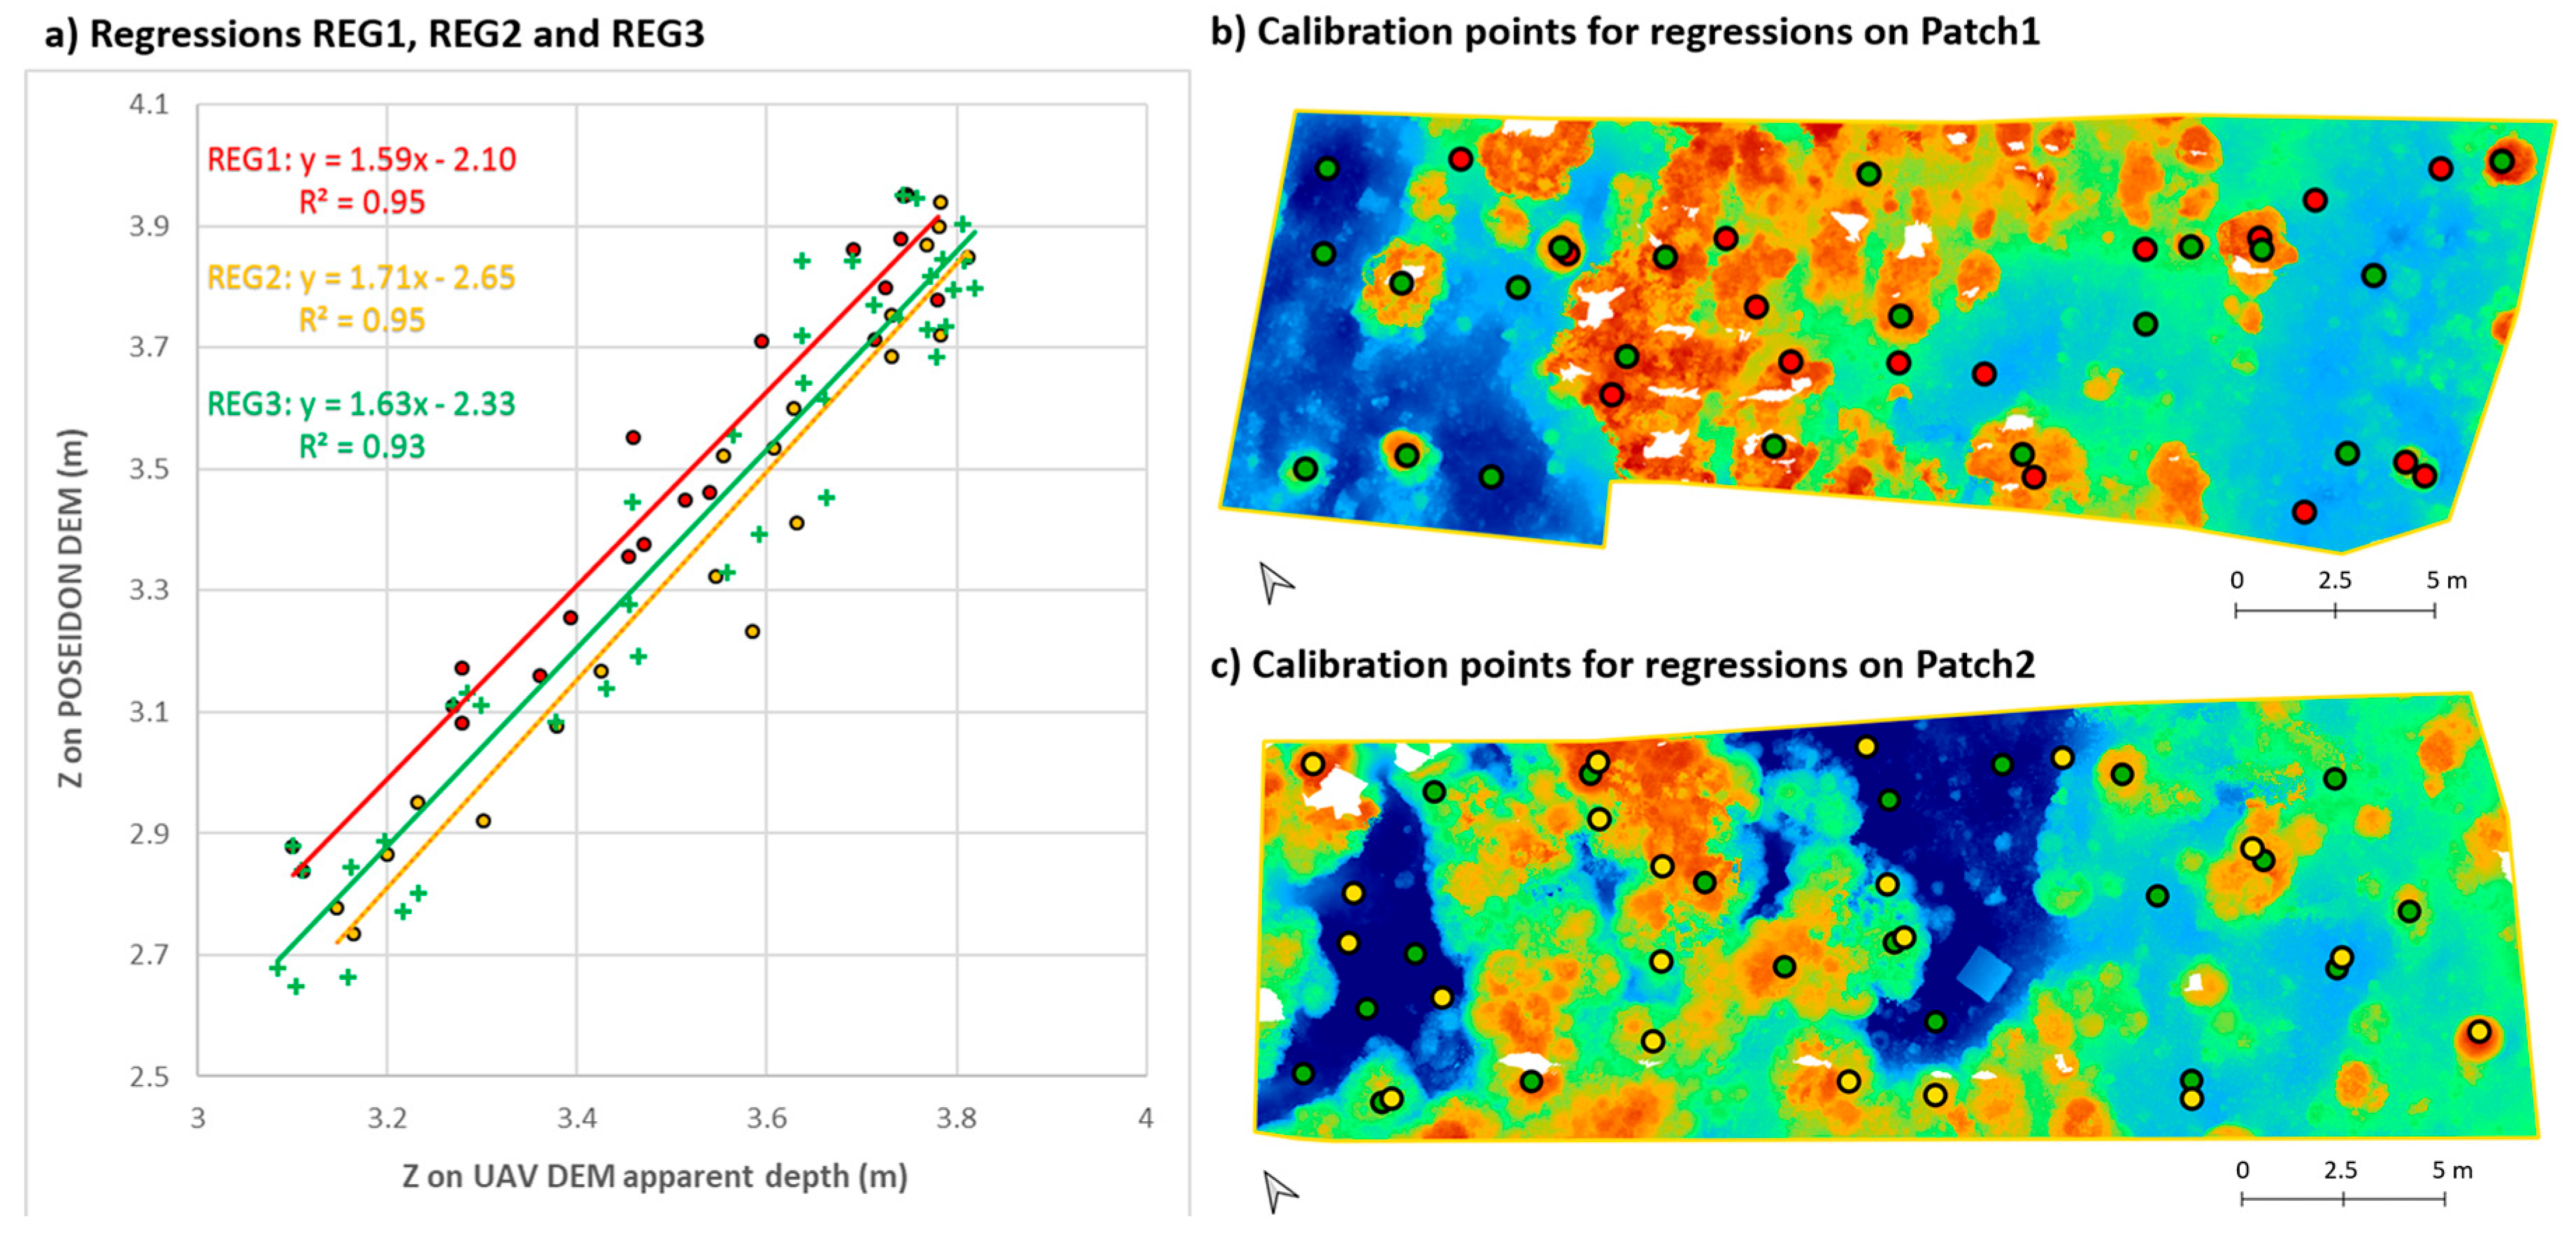
If, as above, non-linear effects are neglected, it is possible to consider a linear regression between the apparent depth ZA (apparent elevation from the uncorrected drone DEM) and the actual depth Z. This regression was performed using a batch of calibration points for which both the apparent depth ZA and the actual depth Z (obtained here from the POSEIDON DEMs) are known. The number of calibration points was chosen to correspond to a realistic number of points that could be measured with RTK GNSS (e.g., installed on a rod) in the absence of a POSEIDON platform. To be representative, calibration points are chosen to cover the widest possible range of depths.
Three regression tests were performed:
  • Regression 1 (REG1): using a batch of 20 calibration points distributed at different depths on Patch 1 (in red colour on Figure 5);
  • Regression 2 (REG2): using a batch of 20 calibration points distributed at different depths on Patch 2 (in yellow colour on Figure 5);
  • Regression 3 (REG3): using a batch of 40 calibration points distributed at different depths on Patches 1 and 2 (in green colour on Figure 5).
The coefficient of determination R2 obtained is R2 = 0.95 for REG1 and REG2 and R2 = 0.93 for REG3.

4.3. Assessment of Refraction Correction

Since POSEIDON DEMs are not affected by refraction phenomena, they are considered here as reference patches on which the effectiveness of the various corrections applied to UAV DEMs is evaluated.
The impact of refraction correction on bathymetry is assessed by DEM of difference (DoD), consisting of a subtraction, performed in QGIS, between the POSEIDON DEMs (on Patches 1 and 2) and each UAV DEM, i.e., (i) apparent bathymetry (raw DEM output from SfM photogrammetry processing), (ii) DEM corrected from refraction using the analytical method and DEM corrected empirically using (iii) REG1 or (iv) REG2 and (v) REG3. For each DoD, the mean error (ME) and the standard deviation (σ) are calculated.
For seabed roughness, the impact of refraction correction is assessed by comparing the standard deviation of elevations obtained for POSEIDON data and for DEMs derived from the UAV survey. To facilitate comparison, the POSEIDON DEMs are downsampled to the same resolution as the UAV DEMs, i.e., 4.4 cm. This comparison is performed at different scales, calculating the standard deviation in Z for different neighbourhood sizes. These spatialised standard deviations are calculated with the Focal Statistics tool [61] from the SAGA suite, implemented in QGIS. The neighbourhood is defined as a square kernel whose sizes are chosen arbitrarily as multiples of the native resolution of the UAV DEM, resulting in kernel sizes of 0.13 m × 0.13 m, 0.48 m × 0.48 m, 1.01 m × 1.01 m, 1.98 m × 1.98 m and 4.97 m × 4.97 m in succession. The standard deviation was also computed for the entire zone, i.e., 30 m × 10 m for Patches 1 and 2 and 450 m × 380 m for the UAV zone. An average value of these standard deviations of elevation is calculated for each DEM and each zone.

5. Results

5.1. Impact of Refraction Corrections on DEM Quality

Four DEMs of difference (DoD) are generated at the scale of each of the two POSEIDON patches. The results of these comparisons (on 160,975 pixels for Patch 1 and on 162,360 pixels for Patch 2) are summarised in Table 1.
As expected, better results are obtained for refraction-corrected DEM than for UAV apparent bathymetry. Thus, correcting refraction helps to reduce the discrepancies with our reference DEMs. The biases between POSEIDON and UAV apparent bathymetry differs between Patch 1 and Patch 2. This could suggest elevation biases on one of the two patches due to measurement errors or methodological biases (calculation of the water surface elevation ZS associated with the different surveys, impact of tide variations during the surveys, etc.), implying then an overestimation or underestimation of refraction. However, these biases may also be due to different depth ranges from one patch to another and therefore to more or less pronounced refraction effects. At this stage, it remains difficult to decide between an analytical approach and an empirical approach using a single regression based on this comparison. However, it should be noted that the REG1 regression method (with calibration points only on Patch 1) gives lower quality results on Patch 2 (with an average error of −0.17 m) and vice versa. Thus, it appears that regression correction assuming linear regressions is sensitive to the representativeness of the depths chosen at the calibration points. Nevertheless, the correlation between the bathymetry corrected using the different regression methods (REG1, REG2 and REG3) shows very similar results (Figure 6). Therefore, to simplify comparisons, we will only use the REG1 (most calibration-site dependent) and REG3 (most homogeneous across sites) regressions.
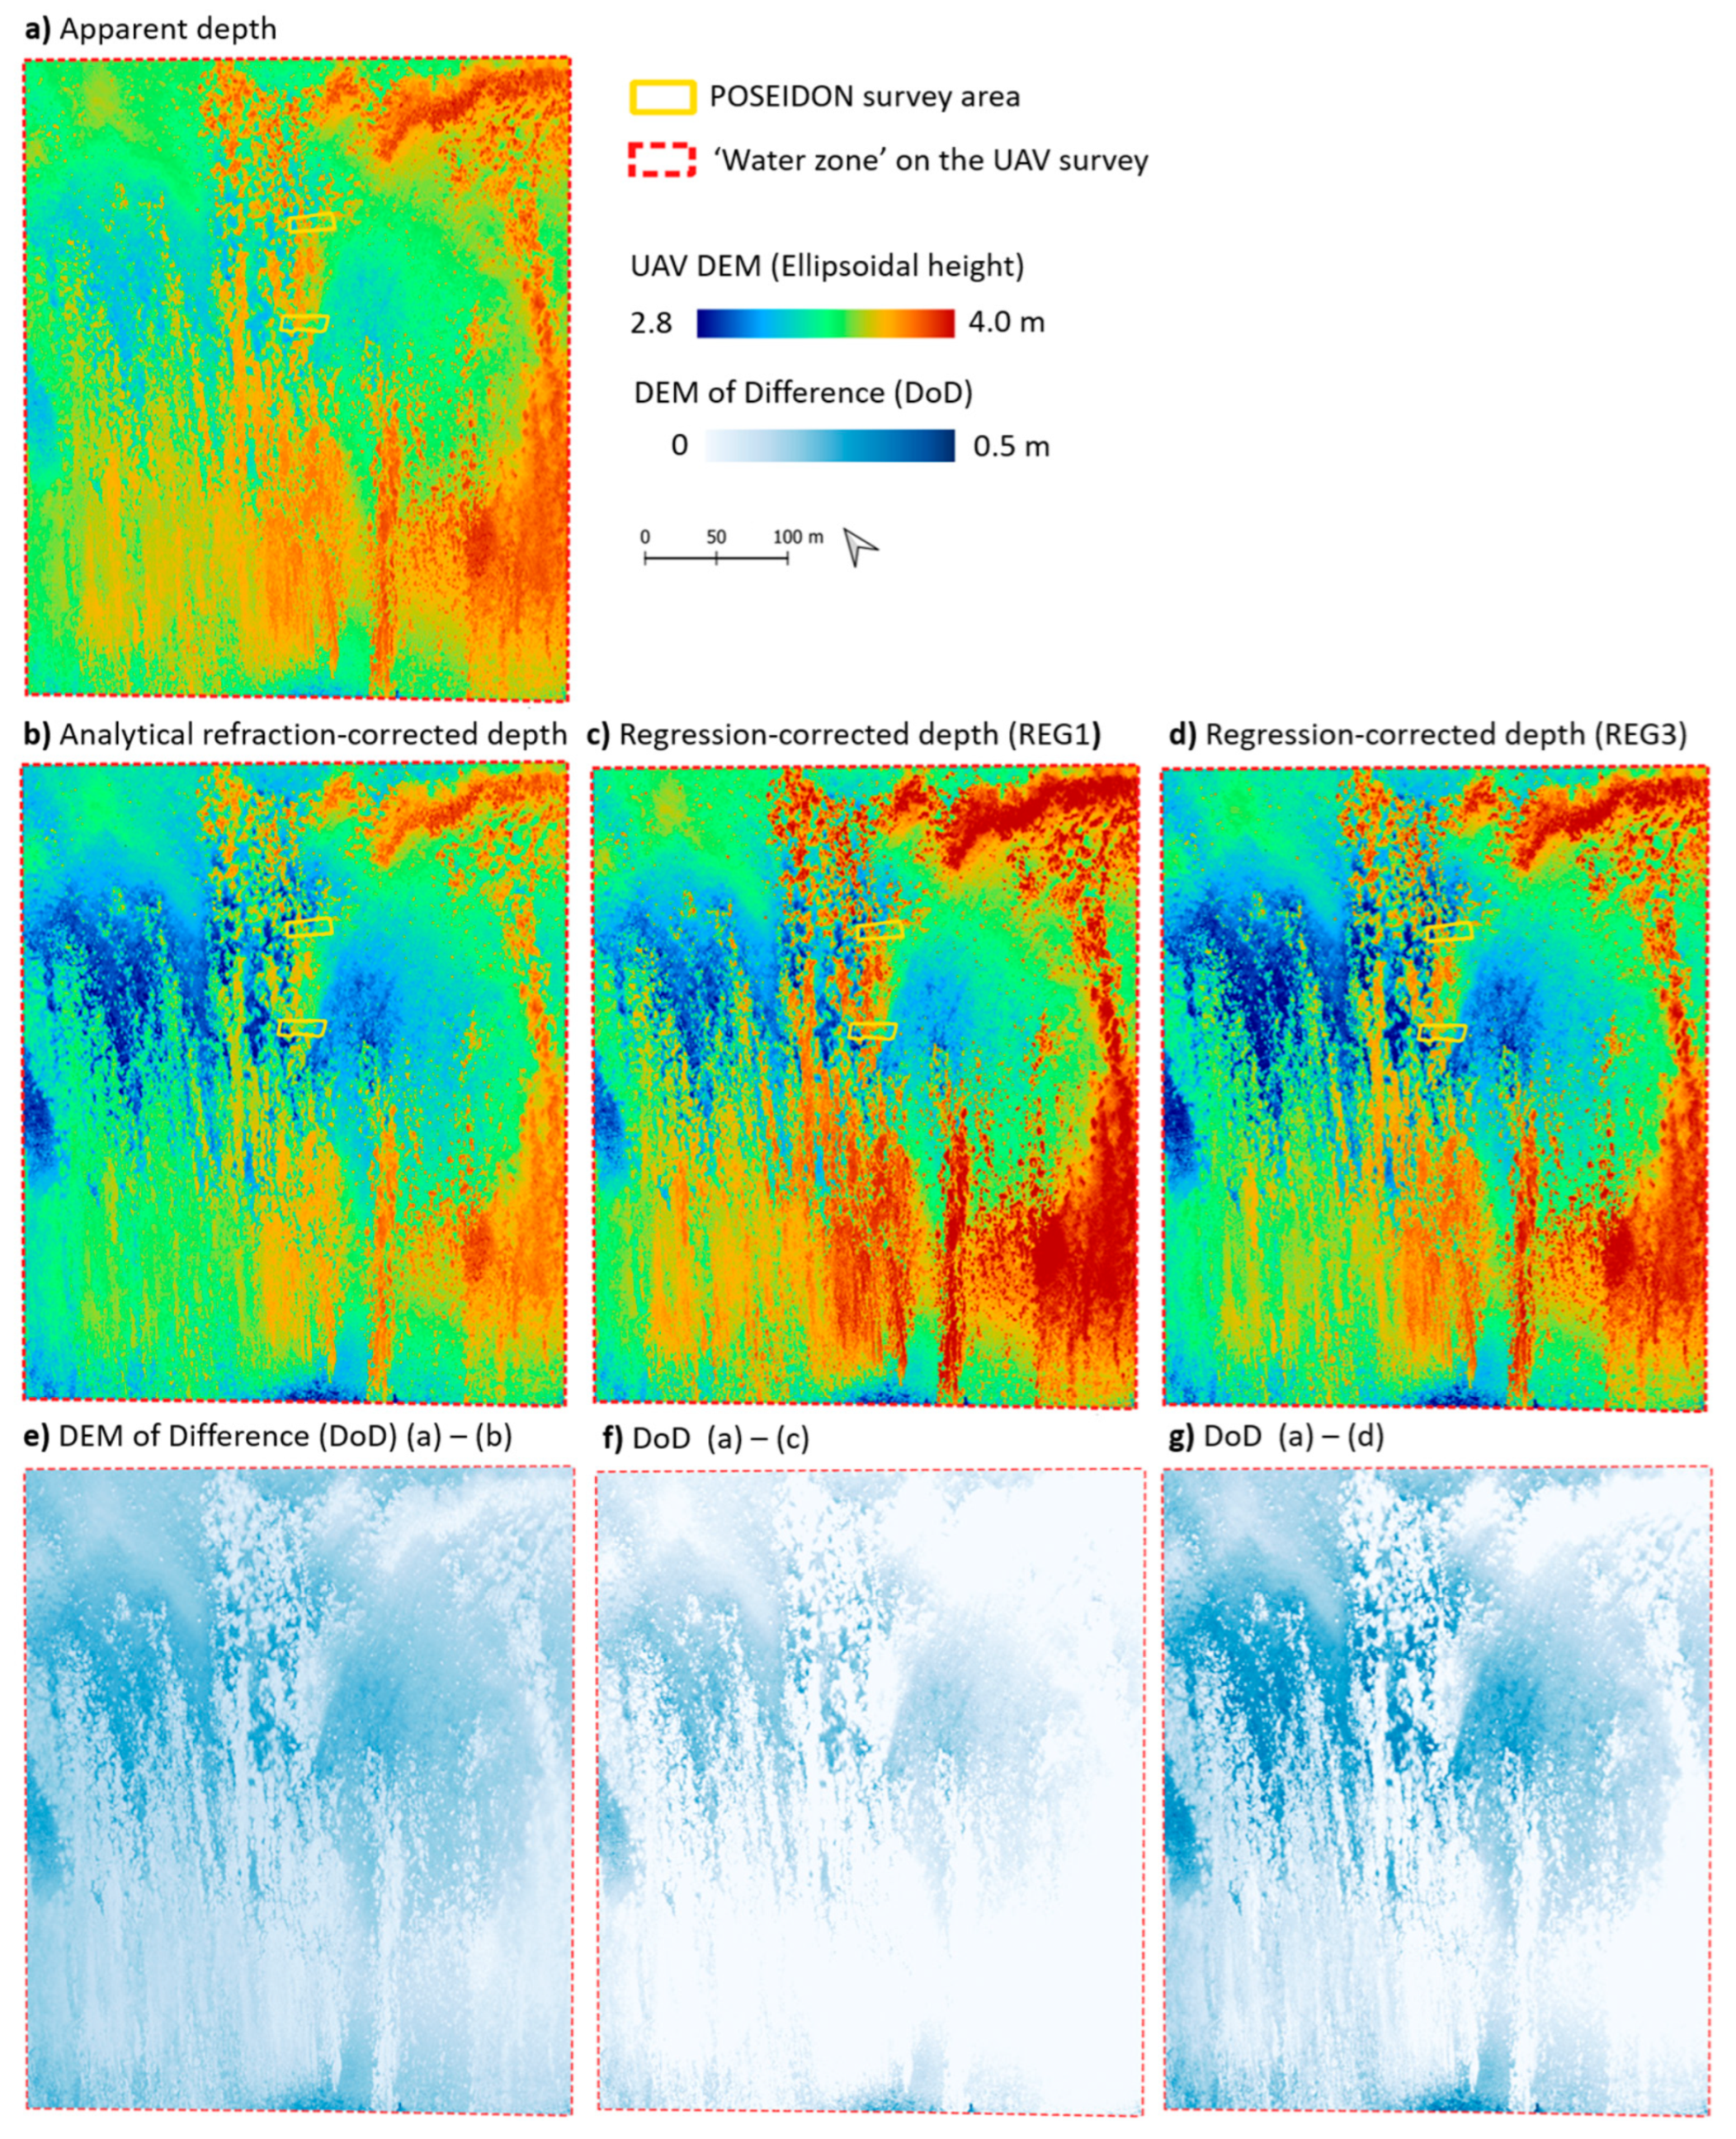
Comparing UAV DEMs before and after refraction correction over the entire area covered by the drone survey (Figure 7) shows that corrected DEMs appear less ‘smoothed’ than the uncorrected DEM. The regression method, and particularly REG3 (Figure 7d,g), tends to amplify bathymetric variations more than the analytical method.

5.2. Impact of Refraction Corrections on Seabed Roughness Calculations

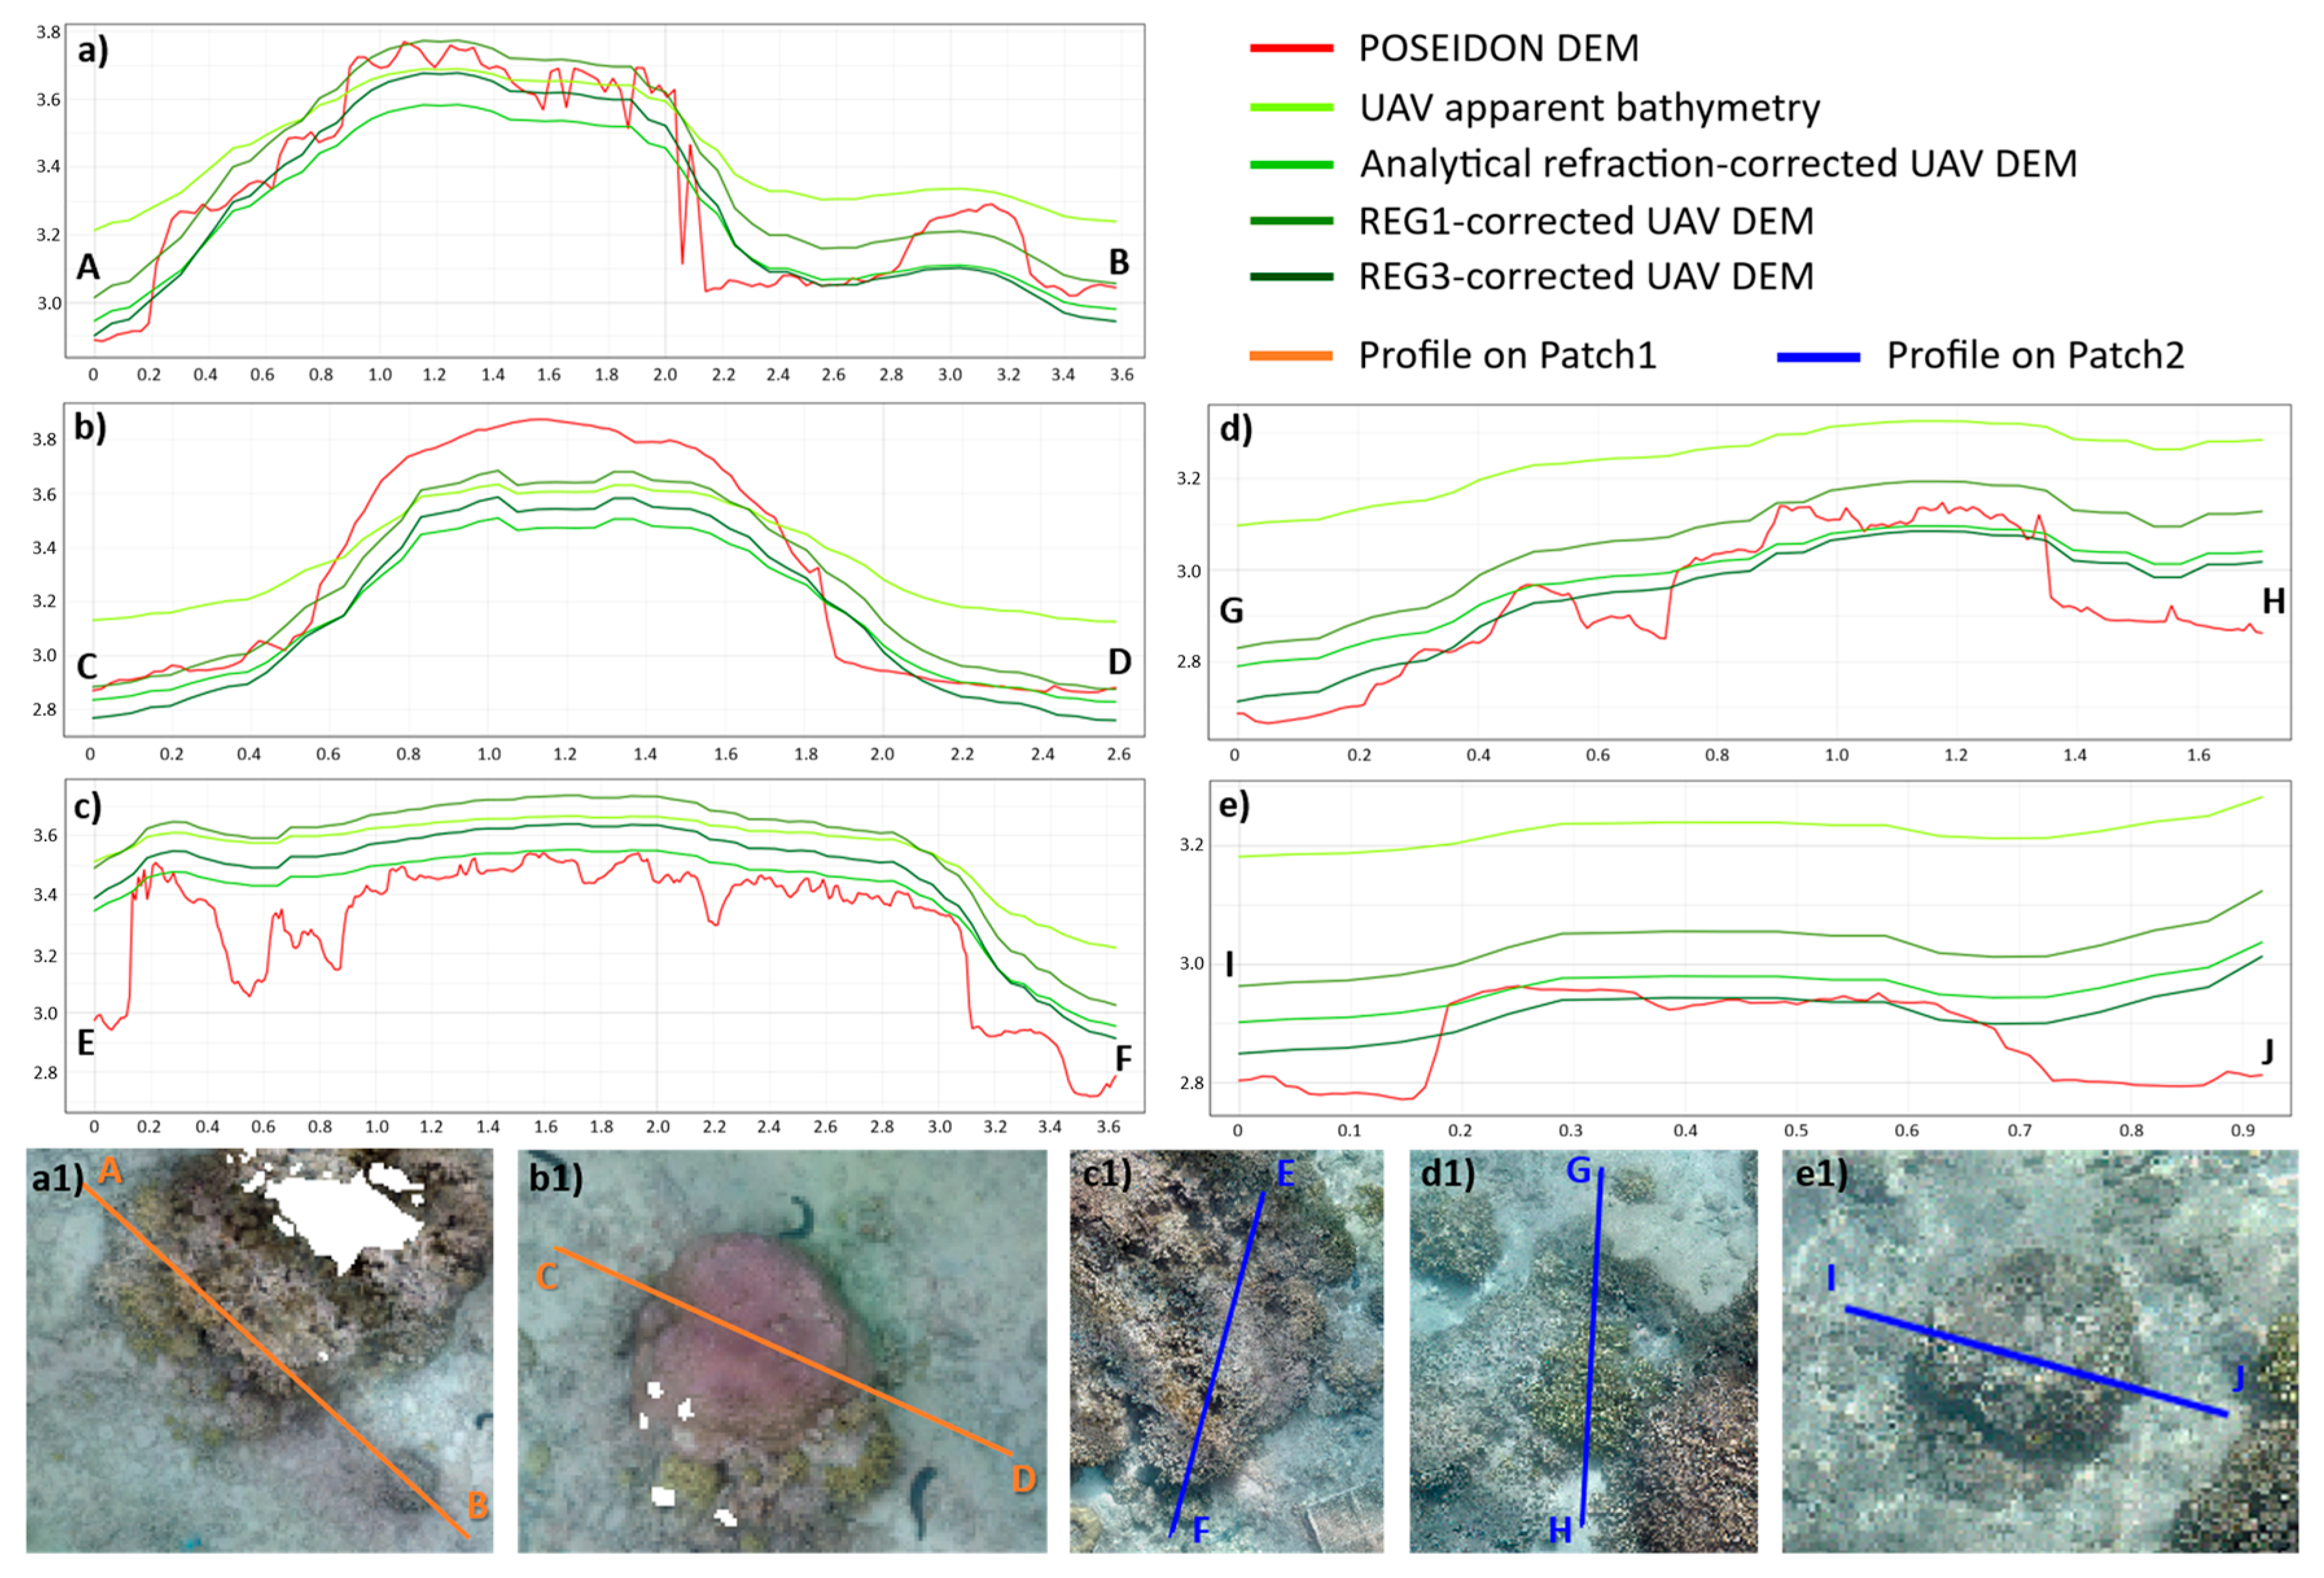
To visually assess seabed roughness, Figure 8 presents a simple visual comparison along several transects on the different DEMs (POSEIDON, UAV corrected or uncorrected). These profiles clearly illustrate what we saw earlier with DEMs, namely, that depth tends to be underestimated on UAV DEMs that have not been corrected for refraction (apparent bathymetry), and this is even more pronounced in deep areas (e.g., Figure 8c). At the scale of a coral head, we also note that sudden changes in bathymetry tend to be smoothed out in apparent bathymetry. This local effect is not completely corrected by refraction correction methods. On a small scale, probably also due to the smoothing mentioned above, small coral irregularities (particularly on branching corals—e.g., Figure 8a,b,d) are absent from the UAV data, regardless of the correction method used.
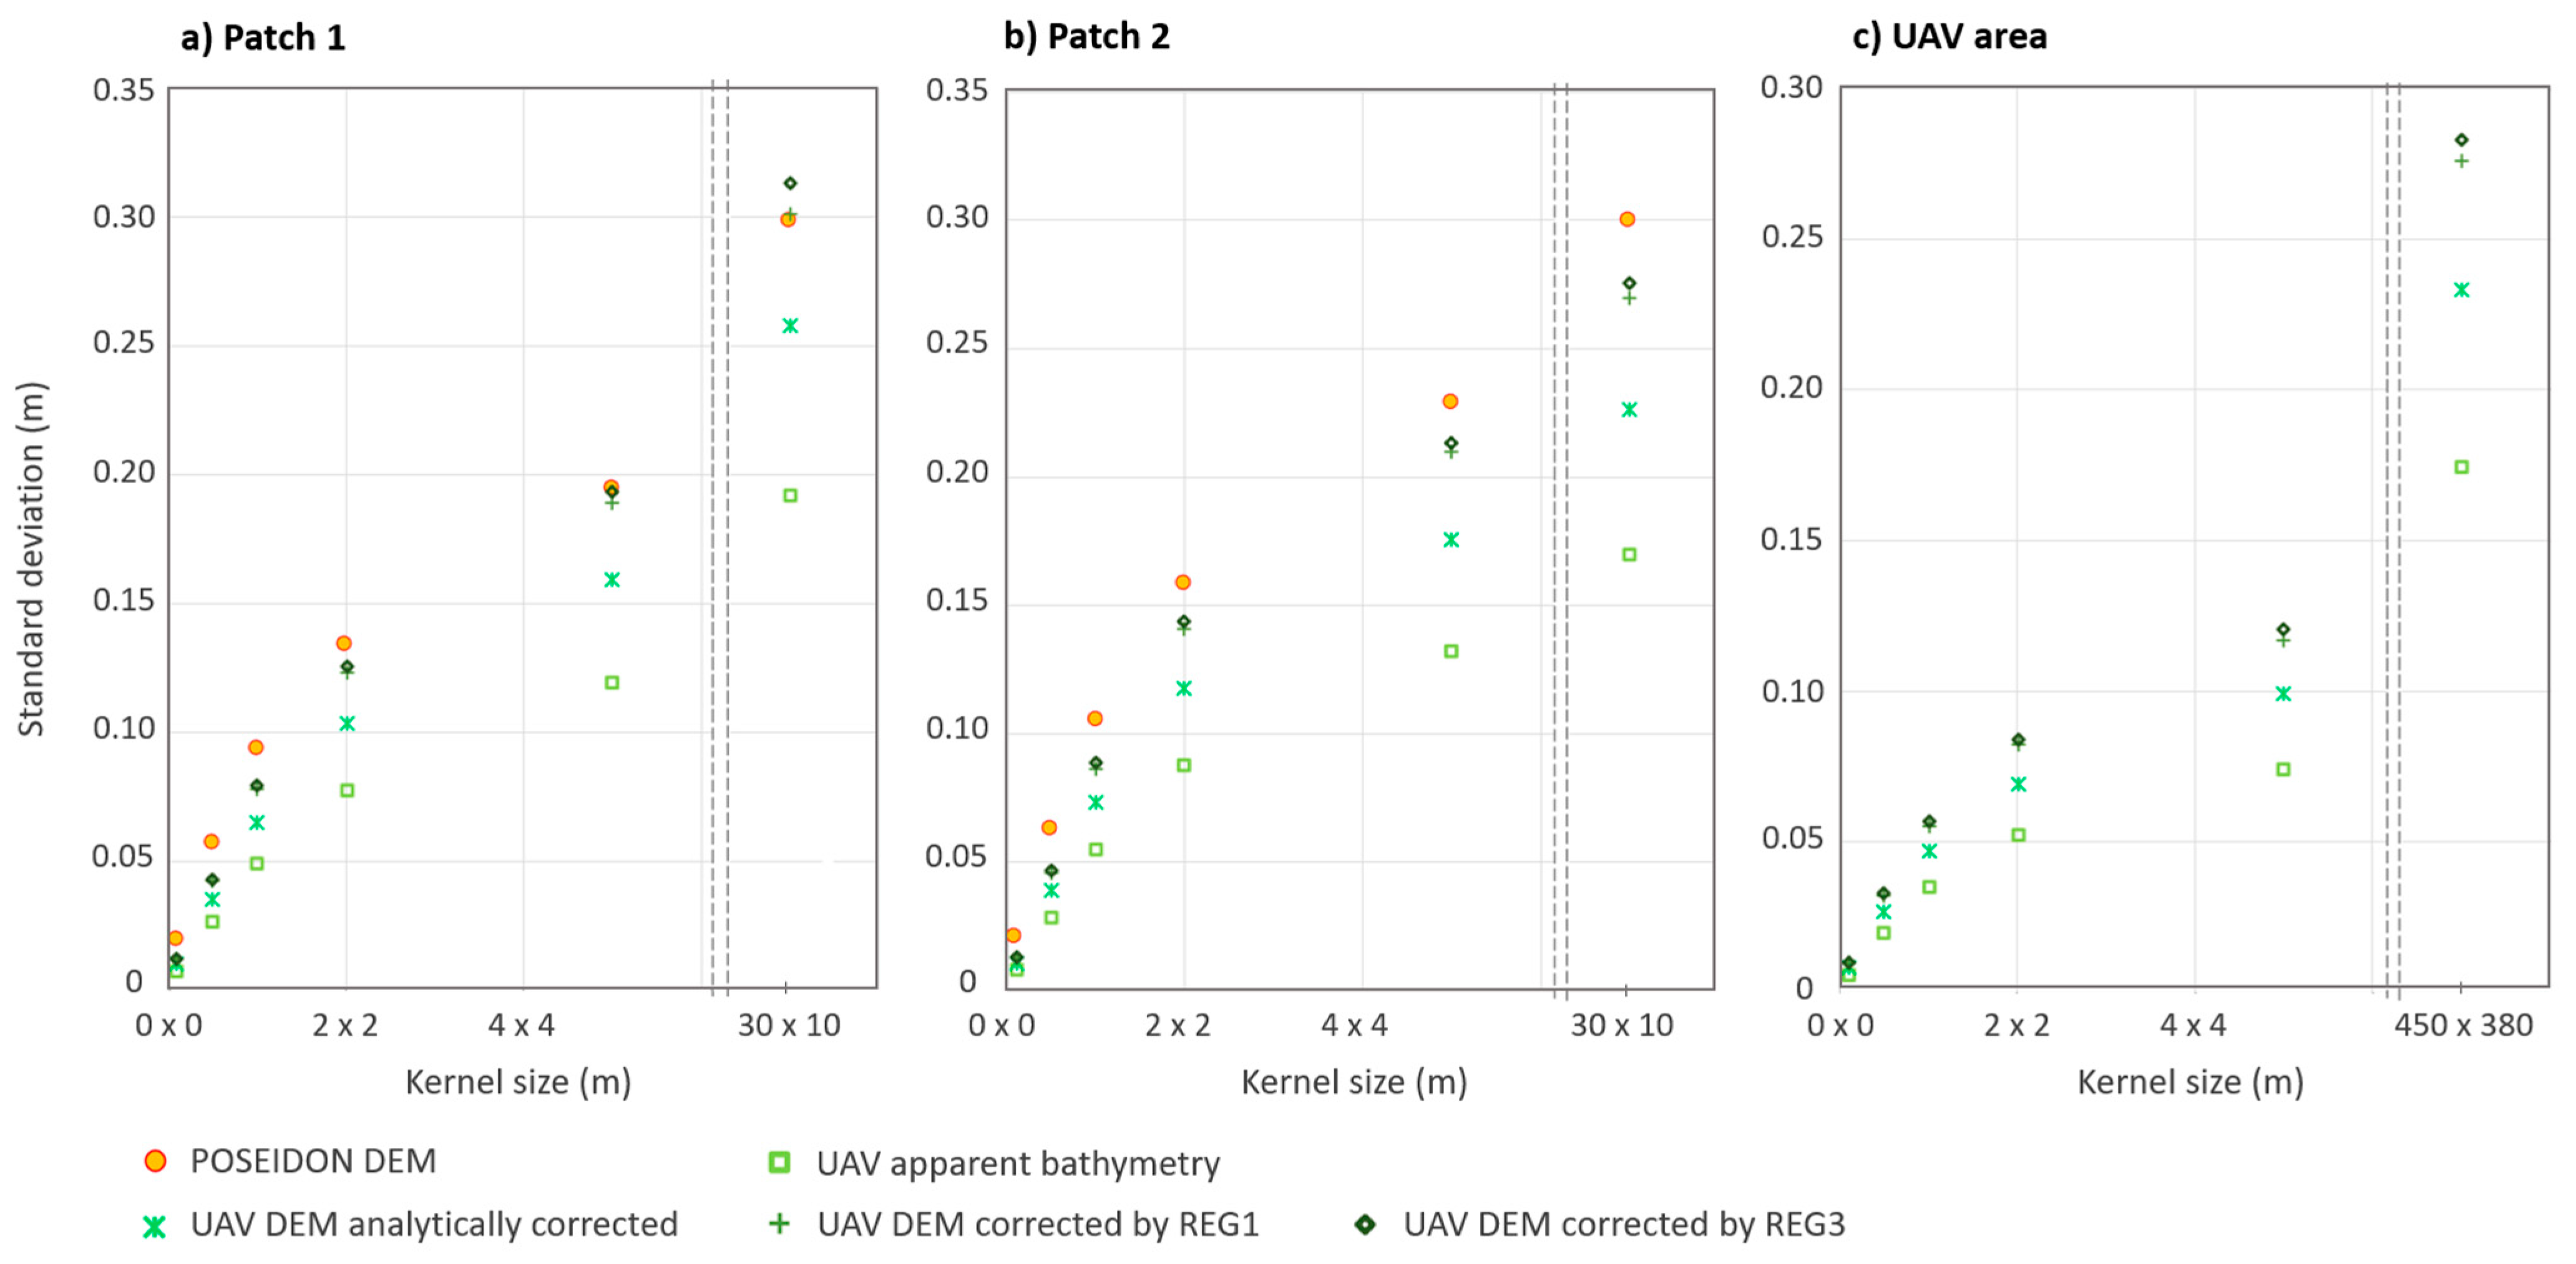
Table 2 and Table 3 and Figure 9 show the results of the quantitative comparisons of seabed roughness for the different methods, considering different sizes of neighbourhood.
For each of the two patches, the standard deviation of elevation increases with the size of the neighbourhood (from 0.019 m for a kernel size of 0.13 m × 0.13 m to 0.298 m for the entire area on Patch 1 and from 0.021 m to 0.3 m for Patch 2—Table 2), as greater radius allows larger wavelength to be accounted for in the standard deviation calculation. The smaller the neighbourhood, the more emphasis is placed on fine-scale structures, while roughness over a larger neighbourhood is more affected by large-scale bathymetry variation. At a given scale, roughness therefore depends on the type of coral cover in the area, as the specie can contribute at different scales (e.g., O(mm) for large colonies of branching coral or O(m) for large isolated Porites).
For a given neighbourhood size, the roughness derived from the POSEIDON DEM is always greater (by a factor of 2 or more) than that of the UAV DEMs (Table 2 and Figure 9), as the UAV DEMs are smoother than the POSEIDON’s. It can also be noted that the differences between POSEIDON-derived roughness and UAV-derived roughness tend to decrease as the size of the neighbourhood used to calculate roughness increases. For example, roughness derived from the REG1-corrected UAV DEM on Patch 2 differs by 38% (0.013 m vs. 0.021 m) from the data derived from POSEIDON for a kernel size of 13 cm and by 10% (0.270 m vs. 0.300 m) for Patch 2 as a whole (Table 2 and Figure 9).
Regardless of the size of the neighbourhood, the results obtained using REG1 and REG3 methods are quite similar and are better than those obtained using the analytical approach, with an average error relative to the roughness obtained by POSEIDON of 16.8% (1.4 × 10⁻² m) and 15.2% (1.1 × 10⁻² m) for REG1 and REG3, respectively, compared to 30.0% for the analytical method and 48% without correction (Table 3). This suggests that the regression approach should be preferred over the analytical one for reliable estimation of seabed roughness.

6. Discussion

6.1. Potential and Limitations of Refraction Correction Methods

As it offers both spatial coverage and high spatial resolution, UAV photogrammetry clearly has great potential for studying coral reef environments. By comparing UAV DEMs with very-high-resolution DEMs (finer than drone data) from POSEIDON underwater photogrammetry surveys, this analysis clearly shows the benefit of refraction corrections in our study area, whether for calculating bathymetry or roughness. However, this study does not assess (nor does it aim to correct) the impacts of refraction on the horizontal component of the DEM or on the orthomosaic.
As mentioned in the study by [30], using only GCPs for bathymetric reconstruction with UAV SfM photogrammetry (without correcting for refraction effects) can only be valid in very shallow waters (water depth < 40–50 cm). The implementation of empirical methods based on AI [47,48] are approaches currently being explored. Support vector regression (SVR) algorithms are applied in [48] to their UAV photogrammetry data above a lake. The algorithm is trained using 19 sounding profiles measured with RTK GNSS. After applying the SVR correction, the root mean square error between the processed observations and the actual values improved to a value of 0.08 m. However, the bathymetry of their area evolves in a fairly linear tendency, so there is no doubt that a very large number of depth measurements would be required to train the algorithm effectively in a coral reef context. To get around this problem of the number of calibration points, a LiDAR survey is used by [47] to train their SVR algorithm. This approach covers a wide range of depths, but the results (whether bathymetry or roughness) will be impacted by the accuracy and diversity of the training data [62]. The mean error between the LiDAR ground truth data and the refraction-corrected dense point clouds they obtained was between 0.20 m and 0.50 m, depending on the depth. Recent work focuses on adapting neural radiance field (NeRF) AI methods for reconstructing 3D scenes to take into account refraction in water areas (NeRFrac framework—[63,64,65]). The question therefore remains as to the benefits of AI-based refraction correction methods, given their complexity of implementation, the duration of network training and dependence on the training dataset compared to analytical or linear regression correction methods.
In addition, any of these methods do not allow us to circumvent the environmental constraints. Weak texture, seaweed and turbidity are challenging conditions for SfM reconstructions [39,66,67]. In highly turbid environments, if the seabed is no longer visible, there is no alternative but to resort to active techniques. Nevertheless, some studies have shown that to a certain extent, in shallow water (up to around 0.5 m), greater turbidity reduces refraction, improving accuracy, whereas at greater depths, this effect no longer compensates for the high turbidity [68,69].
Variations in water height due to the tide are also a source of uncertainty. In our case, due to the tides, the elevation of the water surface varies between the different POSEIDON surveys and the UAV survey, as well as during each of these surveys. For example, during the flight, the tide caused water level variations of approximately 6 cm, which, given the refractive index of water, can cause uncertainties of around 8 cm.
The fact that the water surface is not purely horizontal is also a source of error. Indeed, waves or ripples will locally (and in a spatially and temporally variable manner) complicate the refraction model. In our study area, even though the reef crest limits the entry of ocean swells, the reef flat water surface can be altered by waves. At the time of the UAV flight, approximately 1.2 m of incident wave height was recorded on the reef slope. On the reef flat, the resulting waves were less than 10 cm due to the large dissipation implied by the wave breaking at the reef crest. These spatial and temporal variations in the water surface therefore cause the depth and angle of incidence of optical rays to vary from one pixel to another and from one image to another. Since it is difficult to take these effects into account, refraction correction necessarily involves some approximations. Furthermore, gravity and capillary waves induce spatial and temporal fluctuations in downwelling light at near-surface depths [70,71]. These fluctuations in underwater light can create changing patterns on the seabed that affect the detection of tie points in the SfM reconstruction process.
Recent studies aim to improve the quality of UAV bathymetry by enhancing images beforehand, for example, by correcting the effects of sunglint [62] or caustic textures [67].

6.2. Analytical Approach vs. Regression Method

Regarding the approaches tested here, on one hand, the analytical approach does not require prior seabed elevation measurements, but it does require measurement of the water surface elevation. In the absence of a pressure sensor in the area, it is not straightforward to determine the elevation of the water surface. Some studies rely on RTK GNSS measurements of the water line elevation at the shore (e.g., [45,48]), but this approach becomes less accurate when waves break. Uncertainties in estimating this water surface elevation can therefore be a possible source of bias. Furthermore, our analytical results may have been better with a smaller camera tilt angle.
In the other hand, the empirical regression method tested here also has its limitations. Indeed, using linear regression when the distortions induced by refraction are non-linear necessarily involves approximations. Furthermore, the regression approach requires measuring the elevation of calibration points on the seabed and, to a certain extent, is sensitive to the choice of calibration points. In our study, it was realised with submarine photogrammetry using a dedicated platform (POSEIDON), which allows us to compile our batch of calibration points retrospectively. However, it may be realised as well on site using only a RTK GNSS rod to measure calibration points. However, it is not always easy to take such measurements in a reef environment: by foot, it is difficult to move around and reach certain parts of the reef without being intrusive and risking breaking the corals; by boat, the draught may prevent certain areas from being reached.
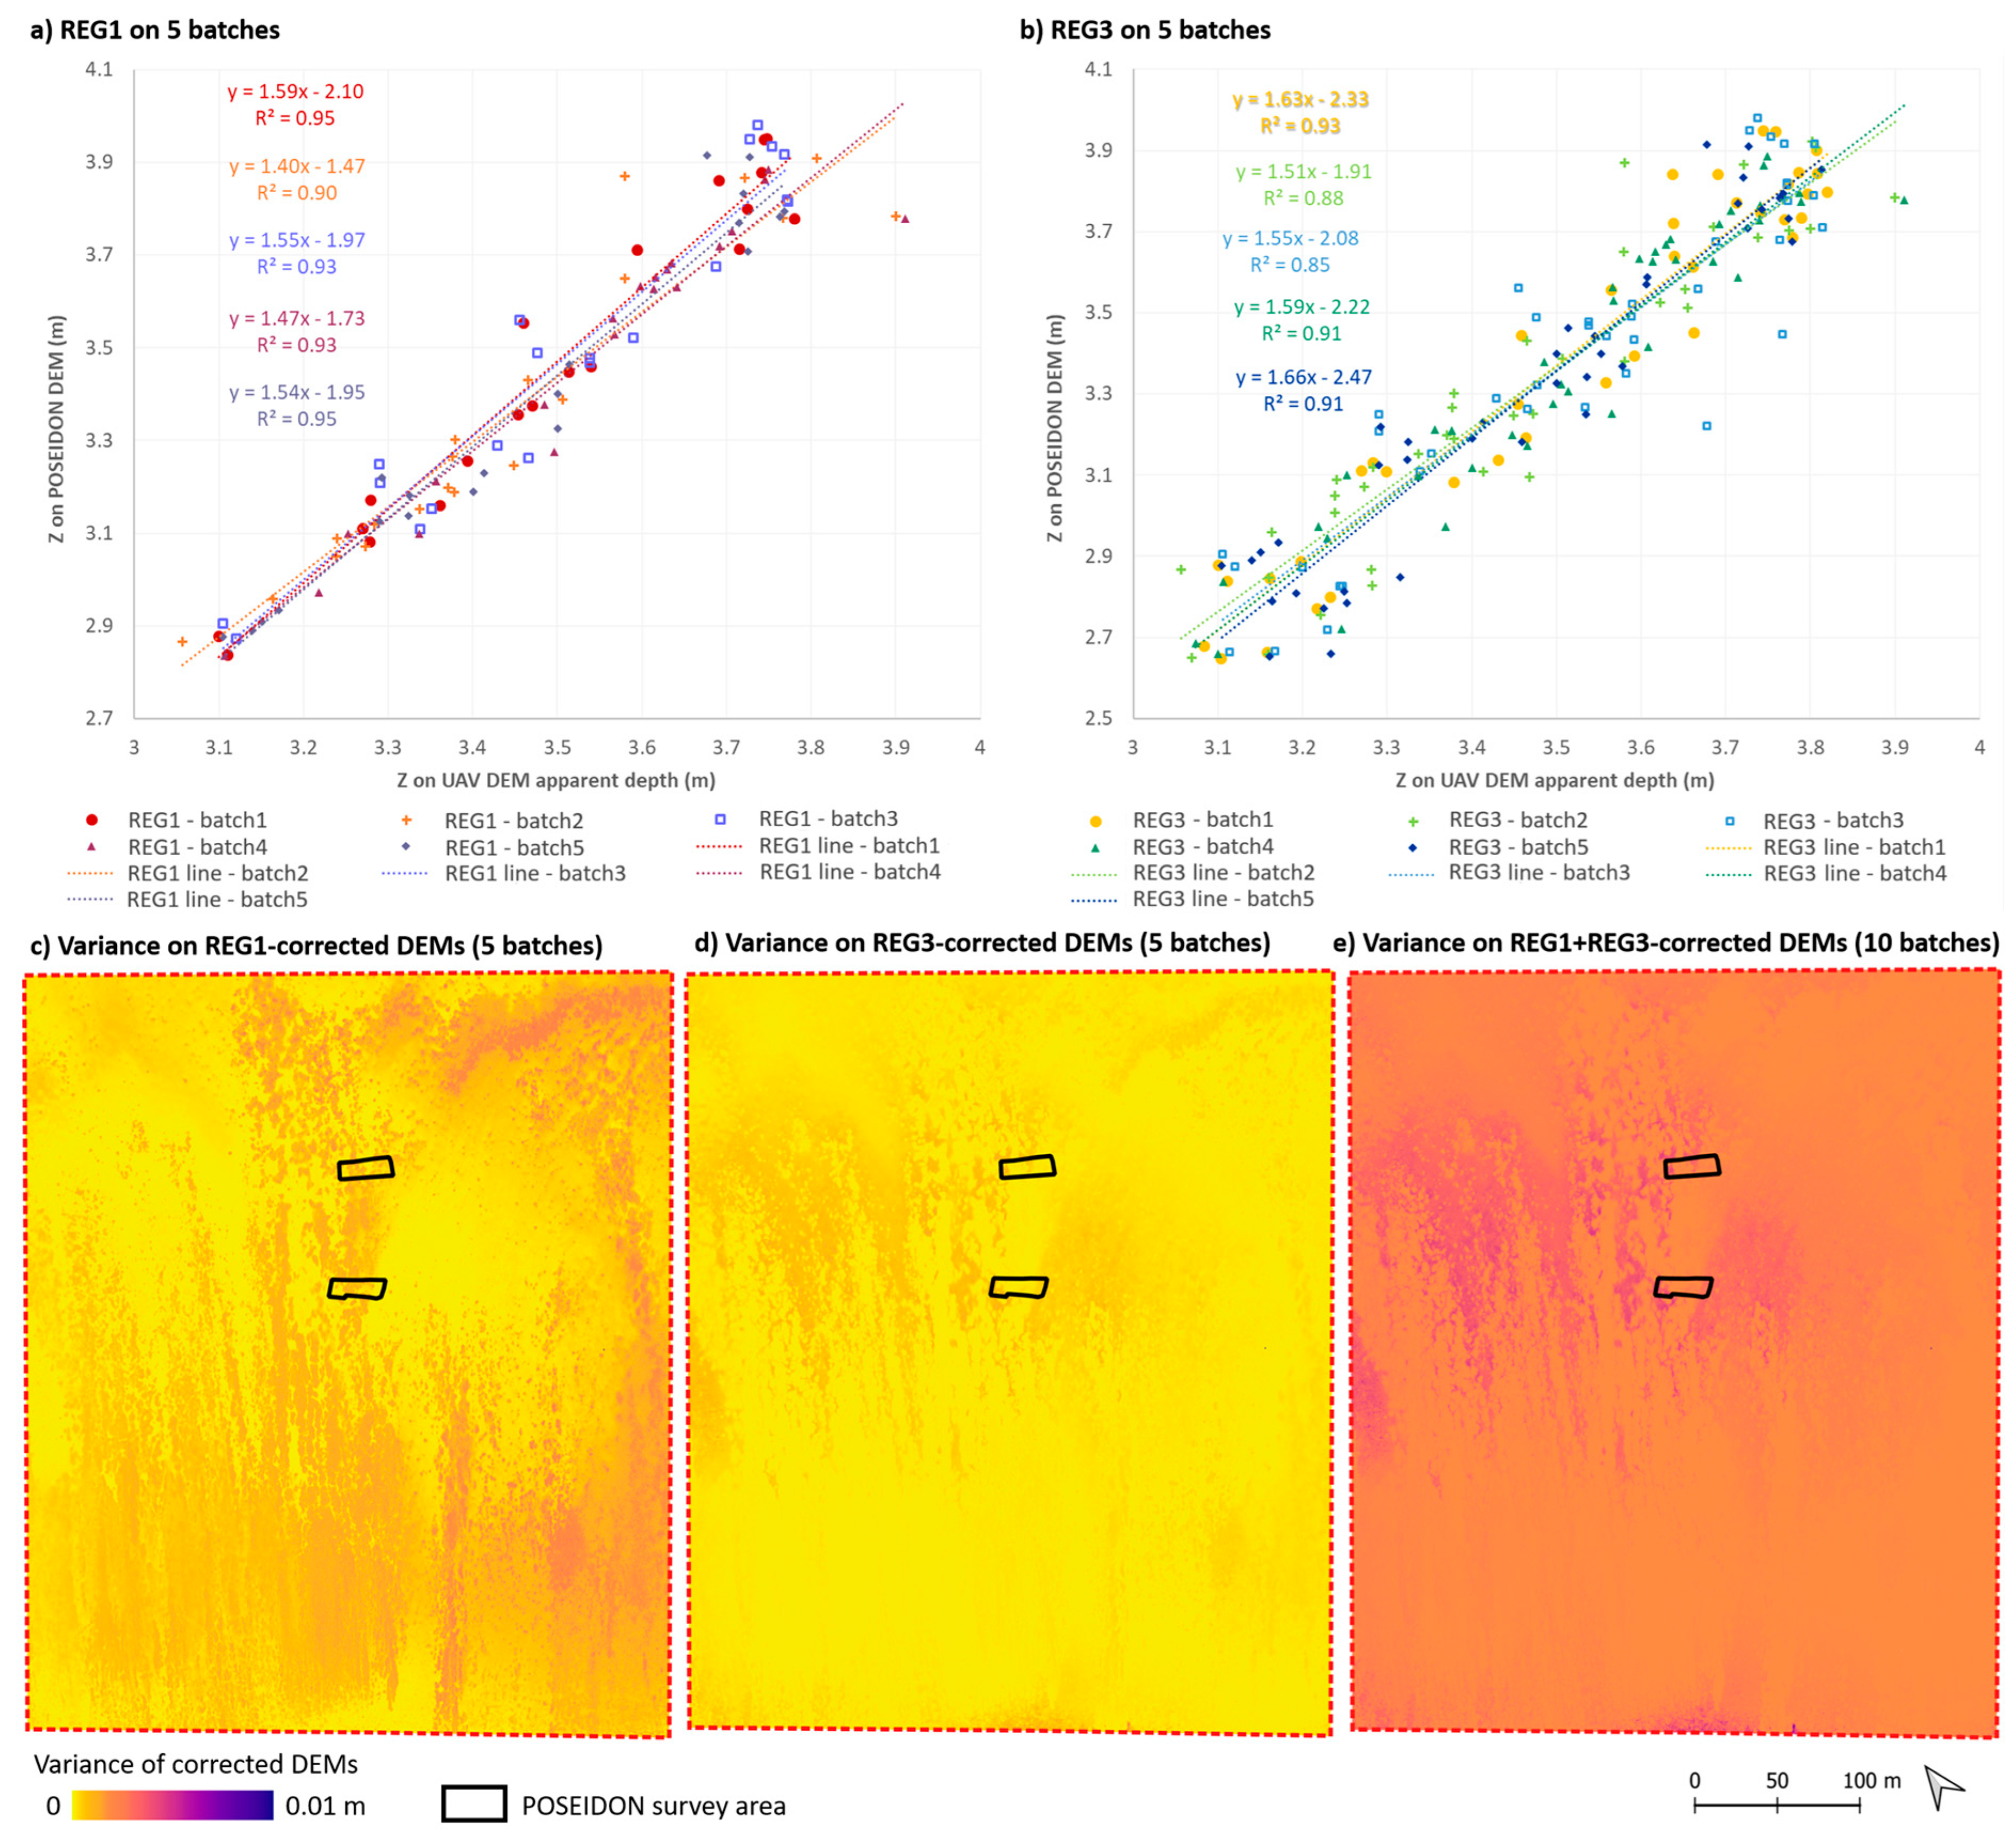
To assess the sensitivity of the method to the choice of calibration points, we selected different batches of points:
  • Five batches of ‘REG1 type’, i.e., with 20 points on Patch1;
  • Five batches of ‘REG3 type’, i.e., with 20 points on Patch1 and 20 points on Patch2.
In each case, these points are chosen to cover as broad a range of depths as possible. No point is common to more than one batch. The different regression lines (and associated equations) are shown in Figure 10a,b. From the DEMs generated by applying the various regression corrections for each batch, a variance map is generated: (i) for the REG1-corrected DEMs for the five ‘REG1 batches’ (Figure 10c), (ii) for the REG3-corrected DEMs for the five ‘REG3 batches’ (Figure 10d) and (iii) for the ten REG1 + REG3 corrected DEMs (Figure 10e). The average variances on REG1-corrected DEMs and REG3-corrected DEMs are lower than 1 mm. The average variance across all DEMs is around 2 mm. The method is therefore relatively robust in terms of the choice of calibration points, as long as they cover a range of depths that is representative of the area.

6.3. Limits of the Raster Format and Standard Deviation for Estimating Seabed Roughness

Depending on the scientific community, there are different approaches to calculating bottom roughness. Ecological studies tend to derive roughness information through the structural complexity (e.g., [72]) or fractal dimension (e.g., [73,74]). In contrast, hydrodynamical models of wave dissipation induced by bottom roughness in coral reef context are based on the hydraulic roughness parameter of the bottom, which is closely related to the standard deviation of the topographical data/bed elevations [11,13,14]. Yet, the definition of the hydraulic roughness is still an open question for rough and complex beds, as standard deviation cannot fully describe the complexity of the bed [75]. Moreover, standard deviation is a function of the DEM resolution and of how the refraction is corrected, as proven in this study.
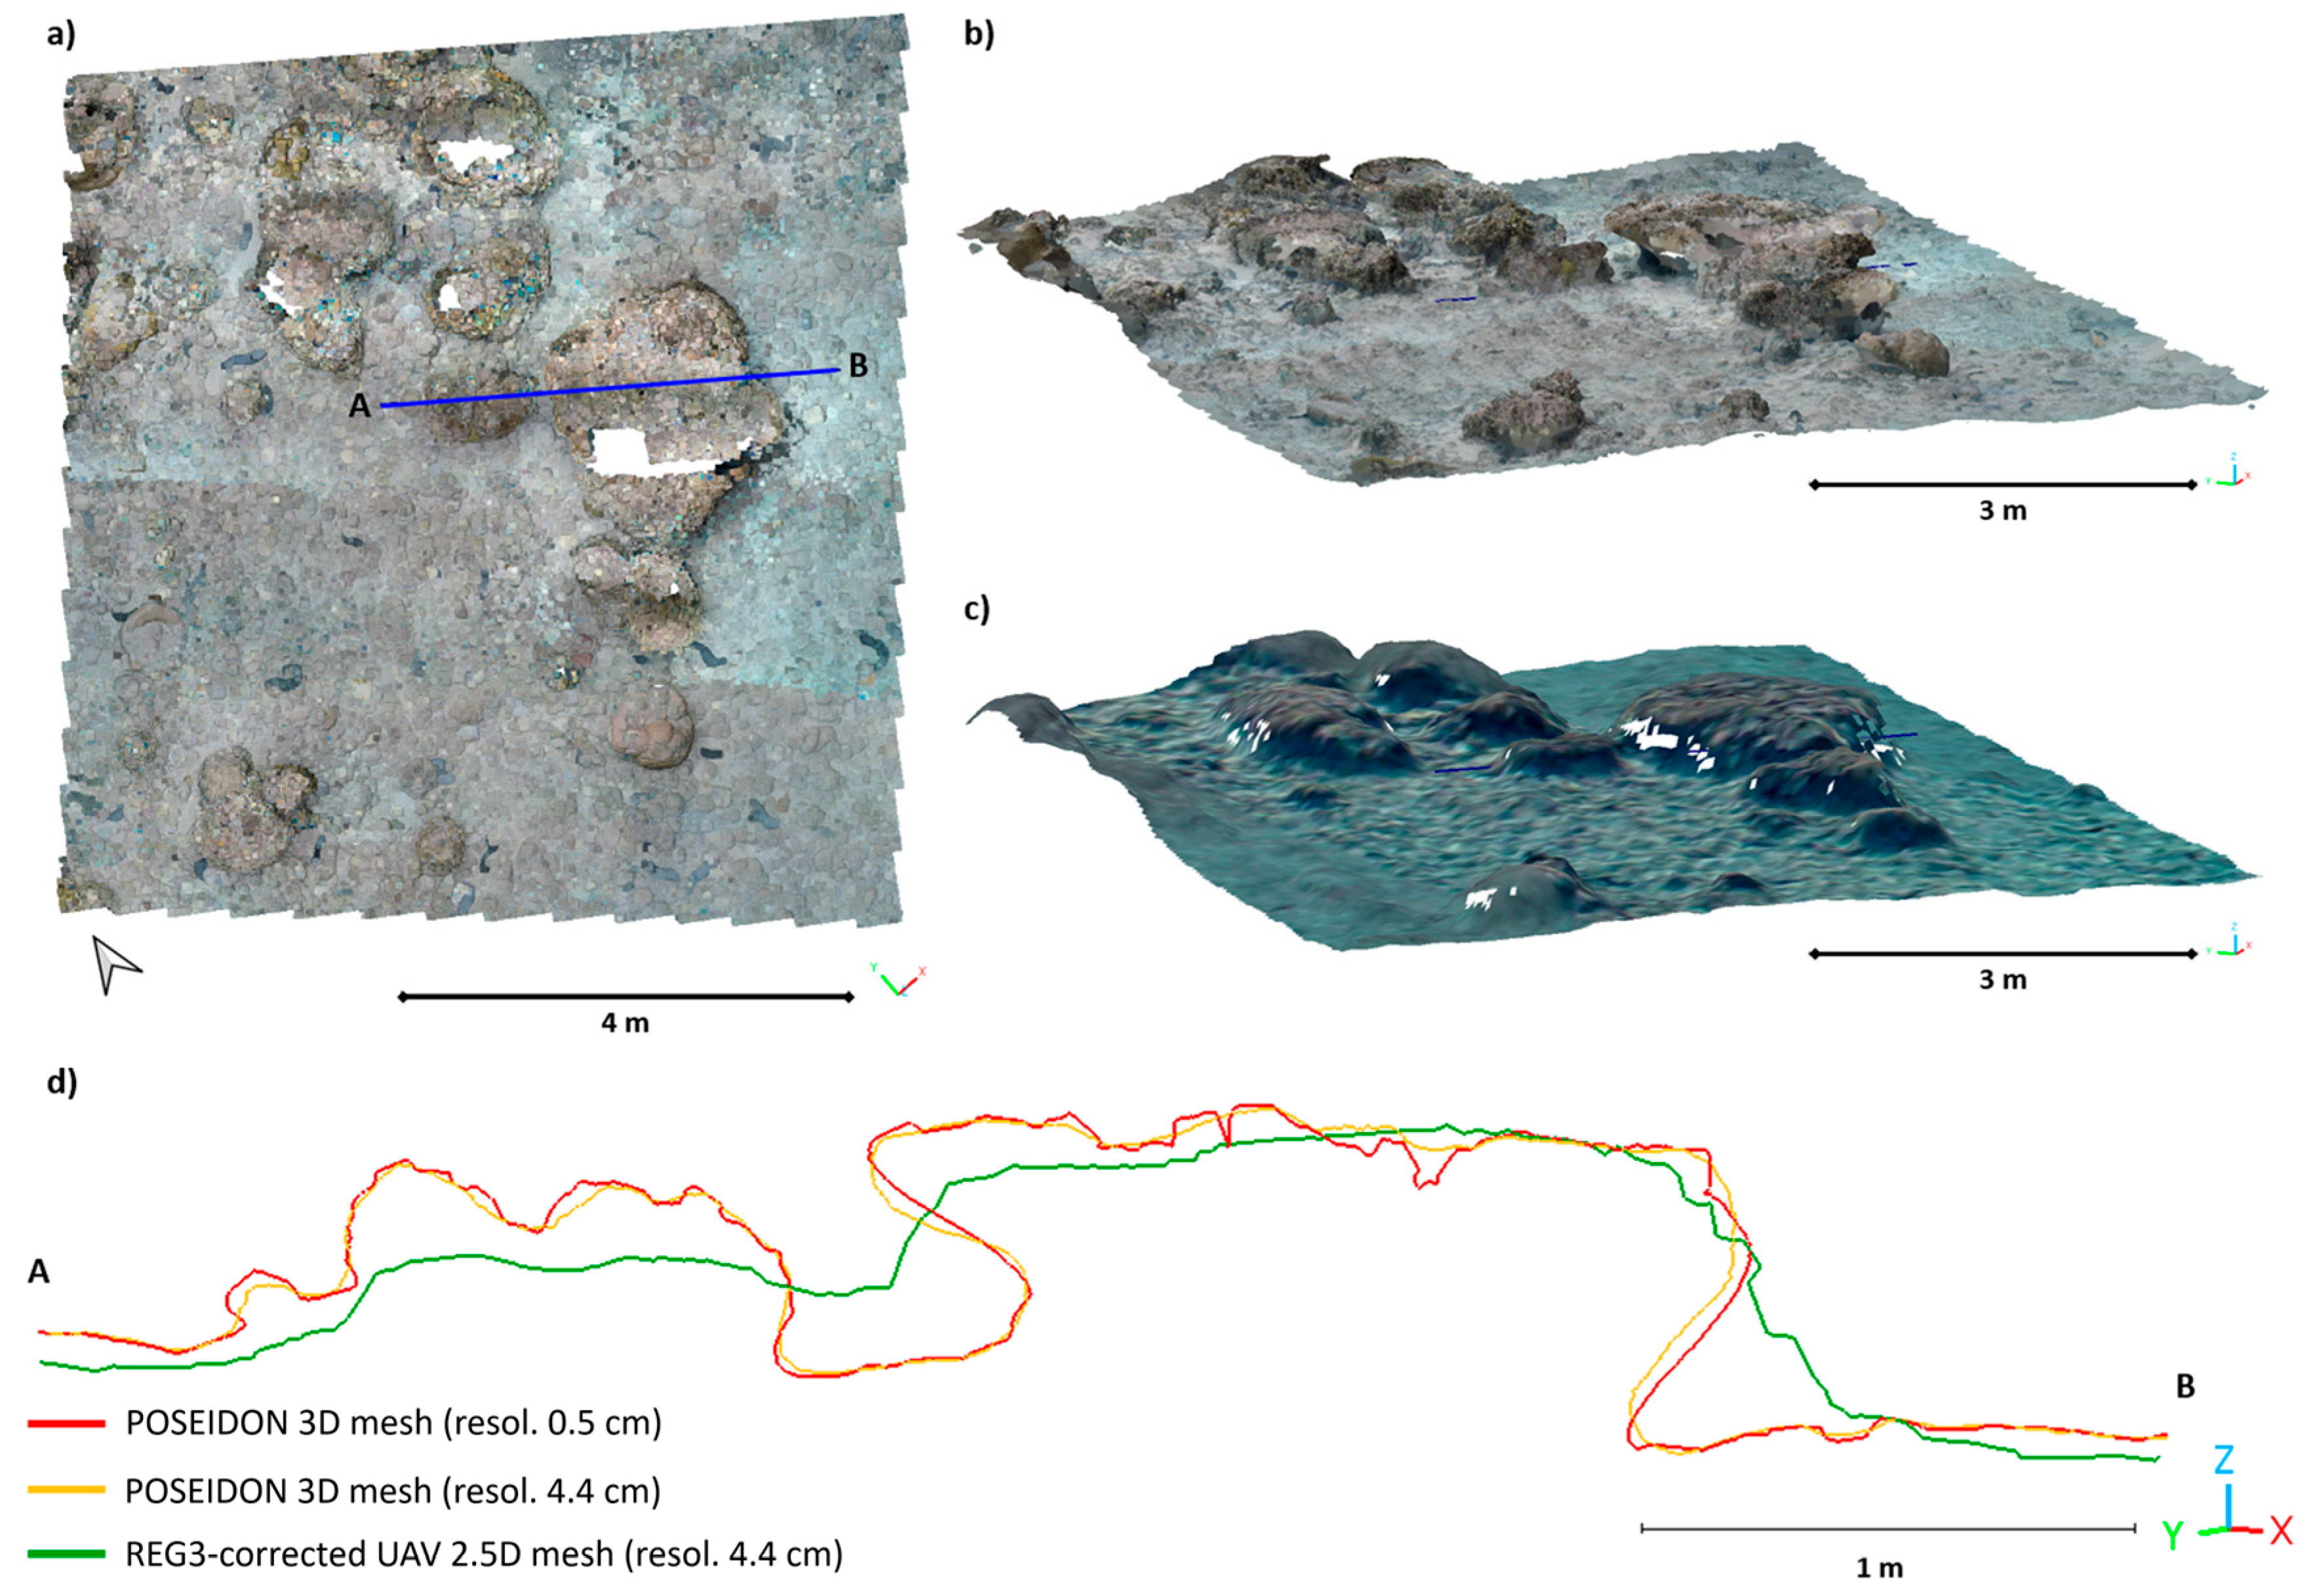
Recent studies have highlighted that the hydraulic length can also be a function of other bed metrics, such as directionality, skewness or frontal area [11,76,77]. Wavenumber spectral analysis can also give effective information about the bed structural disposition, and defining higher wavenumber is a key point to validate its fractal behaviour [78]. As stressed above, due to refraction, even after correction, the UAV DEM tends to smooth the bed 3D complexity, thus altering the roughness metrics. Furthermore, UAV imagery, viewed from above, only offers a 2.5D view. The raster representations associated with DEMs also limit this approach to 2.5D. By working from the 3D point cloud generated by underwater photogrammetry, we have access to true 3D data, which better reflect the structural complexity of the coral. Figure 11 illustrates the differences this can imply in terms of bed complexity. For example, in the extract shown in Figure 11, the 3D surface/2D surface ratio, a proxy for structural complexity largely used in ecological studies, is 1.64 for data from underwater photogrammetry (Figure 11b) compared to 1.06 for data from UAV photogrammetry (Figure 11c). It would therefore be interesting to also assess the extent to which taking this complexity into account is relevant for hydrodynamic models.
Nevertheless, UAV DEM (and derived standard deviation of bed elevations) covers several hundred metres (both long-shore and cross-shore), which is a sufficiently representative area in terms of bottom variability to study wave propagation and attenuation at large scale. Furthermore, the availability of spatialised, very-high-resolution data provides an opportunity to examine the different scales found in the coral reef context. As expected, the finest scales (<4 cm) of topographical variation that are not captured by the resolution of drone images (potentially less sharp when capturing underwater scenes) are not reproduced even after applying refraction corrections. Table 2 and Figure 9 show that applying refraction corrections is all the more effective when considering large-scale variations. This dataset will therefore enable us to study which scales are relevant for hydrodynamic models.

7. Conclusions

This study compared two methods of very-high-resolution imaging bathymetry: underwater photogrammetry and aerial UAV photogrammetry. Underwater photogrammetry has the advantage of not being affected by refraction phenomena at the water surface, but the surveyed areas remain spatially limited despite a very large number of images. UAVs enable data collection in shallow waters, covering large areas (>several hectares) at low cost and with very high spatial resolution (centimetric). Nevertheless, comparison with very-high-resolution spatial data from underwater photogrammetry has demonstrated the importance of refraction correction for bathymetry and roughness derived from these drone data.
For bathymetry, applying refraction correction reduces the RMSE of bathymetric DEMs by more than 50%—up to 62%. This results in RMSE values below 0.13 m with the analytical method and down to 0.09 m with REG2 (on Patch 2) and to 0.11 m with REG 3 (on both patches).
In this study, refraction correction by linear regression REG3 (with calibration points distributed over the two patches) was the method that best restored the roughness of the seabed, yielding a mean roughness error of 15.2%, compared with 30% for the analytical correction and 48% for the uncorrected apparent bathymetry. The impact of refraction correction on roughness is all the more significant when considering large-scale (Om) roughness. Thus, for REG3, on Patch 1, the error in roughness decreases from 37% for a kernel of 0.13 m × 0.13 m to 0.5% for a kernel of 5 m × 5 m. In a multi-scaled seabed environment like coral reefs, the ability to study roughness spatially and at different scales is of interest for defining properly each subscale, which appears to be crucial for hydrodynamical studies, especially for the hydraulic length that controls wave frictional dissipation. This highlights the need to study at which spatial scale the waves are impacted, i.e., at the scale of the colonies or individual coral. This latter needs to be further examined, but it relies on the finer definition of the bed and wave propagation. As roughness is also a proxy for structural complexity (and by extension, coral reef health), such data can also contribute to ecological monitoring and be correlated with biodiversity monitoring. More broadly, intercomparing of the two correction methods allows for better assessment of the relevance of using one or the other depending on the available data (water surface elevation or calibration points), on the environment (lake, sandy/rocky coastal area, reef environment) and the purpose of the survey (bathymetry, roughness, etc.).

Author Contributions

Conceptualization, M.J.; methodology, M.J.; software, M.J.; validation, M.J.; formal analysis, M.J. and E.A.; investigation, M.J., S.B., Y.B., M.G., F.F., E.C., E.A. and K.M.; resources, F.F. and E.C.; data curation, M.G., Y.B. and M.J.; writing—original draft preparation, M.J. and M.G.; writing—review and editing, S.B., K.M., F.F., E.A., Y.B. and E.C.; visualization, M.J.; supervision, F.F. and E.C.; project administration, F.F. and E.C. All authors have read and agreed to the published version of the manuscript.

Funding

This research was funded as part of the PPR FUTURISKS (grant number ANR-22-POCE-0002) programme and of the PEPR BRIDGES-Observation (grant number ANR-22-EXBR-0003) programme, with government funding managed by the French National Research Agency under France 2030. It benefits from the financial support of ISblue project, the Interdisciplinary graduate school for the blue planet (grant number ANR-17-EURE-0015, co-funded by a grant from the French government under the program “Investissements d’Avenir” embedded in France 2030).

Data Availability Statement

The raw data supporting the conclusions of this article will be made available by the authors on request.

Acknowledgments

The authors would like to thank the Réunion National Marine Nature Reserve (RNN164) for enabling this mission.

Conflicts of Interest

The authors declare no conflicts of interest.

References

  1. Cordier, E. Dynamique Hydrosédimentaire du Récif Frangeant de l’Hermitage/La Saline (La Réunion): Processus Physiques et Flux Sédimentaires; Université de la Réunion: Saint-Denis, France, 2007. [Google Scholar]
  2. Frihy, O.E.; El Ganaini, M.A.; El Sayed, W.R.; Iskander, M.M. The Role of Fringing Coral Reef in Beach Protection of Hurghada, Gulf of Suez, Red Sea of Egypt. Ecol. Eng. 2004, 22, 17–25. [Google Scholar] [CrossRef]
  3. Lowe, R.J.; Falter, J.L.; Bandet, M.D.; Pawlak, G.; Atkinson, M.J.; Monismith, S.G.; Koseff, J.R. Spectral Wave Dissipation over a Barrier Reef. J. Geophys. Res. 2005, 110, 2004JC002711. [Google Scholar] [CrossRef]
  4. Viehman, T.; Hench, J.; Griffin, S.; Malhotra, A.; Egan, K.; Halpin, P. Understanding Differential Patterns in Coral Reef Recovery: Chronic Hydrodynamic Disturbance as a Limiting Mechanism for Coral Colonization. Mar. Ecol. Prog. Ser. 2018, 605, 135–150. [Google Scholar] [CrossRef]
  5. Baldock, T.E.; Shabani, B.; Callaghan, D.P.; Hu, Z.; Mumby, P.J. Two-Dimensional Modelling of Wave Dynamics and Wave Forces on Fringing Coral Reefs. Coast. Eng. 2020, 155, 103594. [Google Scholar] [CrossRef]
  6. Bruch, W.; Cordier, E.; Floc’h, F.; Pearson, S.G. Water Level Modulation of Wave Transformation, Setup and Runup over La Saline Fringing Reef. JGR Oceans 2022, 127, e2022JC018570. [Google Scholar] [CrossRef]
  7. Masselink, G.; Tuck, M.; McCall, R.; Van Dongeren, A.; Ford, M.; Kench, P. Physical and Numerical Modeling of Infragravity Wave Generation and Transformation on Coral Reef Platforms. JGR Oceans 2019, 124, 1410–1433. [Google Scholar] [CrossRef]
  8. Nelson, R.C. Hydraulic Roughness of Coral Reef Platforms. Appl. Ocean Res. 1996, 18, 265–274. [Google Scholar] [CrossRef]
  9. Pomeroy, A.W.M.; Lowe, R.J.; Ghisalberti, M.; Storlazzi, C.; Symonds, G.; Roelvink, D. Sediment Transport in the Presence of Large Reef Bottom Roughness. J. Geophys. Res. Oceans 2017, 122, 1347–1368. [Google Scholar] [CrossRef]
  10. Madsen, O.S. Spectral Wave-Current Bottom Boundary Layer Flows. Int. Conf. Coastal. Eng. 1994, 1994, 384–398. [Google Scholar] [CrossRef]
  11. Geindre, M.; Sous, D.; Michaud, H.; Floc’h, F.; Bertin, X.; Aubry, A.; Jeanson, M.; Pezerat, M. Wave Friction Factor and Roughness Definition in 2 Multi-Scale Coral Barrier Reef. JGR Oceans 2025. submitted. [Google Scholar]
  12. Gon, C.J.; MacMahan, J.H.; Thornton, E.B.; Denny, M. Wave Dissipation by Bottom Friction on the Inner Shelf of a Rocky Shore. JGR Oceans 2020, 125, e2019JC015963. [Google Scholar] [CrossRef]
  13. Marques, O.B.; MacMahan, J.H.; Feddersen, F.; Conlin, M.P.; Wilson, G.W.; Malila, M.; Rosman, J.H.; Acevedo-Ramirez, C.; Suanda, S.H. Observations of Wave Dissipation by Bottom Friction on a Rough Rocky Shore. In Proceedings of the American Geophysical Union, Ocean Sciences Meeting, New Orlean, LA, USA, 18–23 February 2024; p. CP23B–01. [Google Scholar]
  14. Sous, D.; Martins, K.; Tissier, M.; Bouchette, F.; Meulé, S. Spectral Wave Dissipation over a Roughness-Varying Barrier Reef. Geophys. Res. Lett. 2023, 50, e2022GL102104. [Google Scholar] [CrossRef]
  15. Bertin, S.; Groom, J.; Friedrich, H. Isolating Roughness Scales of Gravel-bed Patches. Water Resour. Res. 2017, 53, 6841–6856. [Google Scholar] [CrossRef]
  16. Groom, J.; Bertin, S.; Friedrich, H. Evaluation of DEM Size and Grid Spacing for Fluvial Patch-Scale Roughness Parameterisation. Geomorphology 2018, 320, 98–110. [Google Scholar] [CrossRef]
  17. Knudby, A.; LeDrew, E. Measuring Structural Complexity on Coral Reefs. In Proceedings of the American Academy of Underwater Sciences 26th Symposium, Dauphin Island, AL, USA, 19–24 March 2007; Available online: https://www.semanticscholar.org/paper/Measuring-Structural-Complexity-on-Coral-Reefs-Knudby-LeDrew/942441117a2ccc58b4bcb192853da0151630a1f3 (accessed on 20 October 2025).
  18. McCormick, M. Comparison of Field Methods for Measuring Surface Topography and Their Associations with a Tropical Reef Fish Assemblage. Mar. Ecol. Prog. Ser. 1994, 112, 87–96. [Google Scholar] [CrossRef]
  19. Risk, M.J. Fish Diversity on a Coral Reef in the Virgin Islands. Atoll Res. Bull. 1972, 153, 1–6. Available online: https://repository.si.edu/server/api/core/bitstreams/8a70c2cc-4c5d-42b0-9a35-7524ac79534e/content (accessed on 20 October 2025). [CrossRef]
  20. Allouis, T.; Bailly, J.-S.; Pastol, Y.; Le Roux, C. Comparison of LiDAR Waveform Processing Methods for Very Shallow Water Bathymetry Using Raman, near-Infrared and Green Signals. Earth Surf. Process. Landf. 2010, 35, 640–650. [Google Scholar] [CrossRef]
  21. Yang, F.; Qi, C.; Su, D.; Ding, S.; He, Y.; Ma, Y. An Airborne LiDAR Bathymetric Waveform Decomposition Method in Very Shallow Water: A Case Study around Yuanzhi Island in the South China Sea. Int. J. Appl. Earth Obs. Geoinf. 2022, 109, 102788. [Google Scholar] [CrossRef]
  22. Wright, A.E.; Conlin, D.L.; Shope, S.M. Assessing the Accuracy of Underwater Photogrammetry for Archaeology: A Comparison of Structure from Motion Photogrammetry and Real Time Kinematic Survey at the East Key Construction Wreck. JMSE 2020, 8, 849. [Google Scholar] [CrossRef]
  23. Menna, F.; Nocerino, E.; Nawaf, M.M.; Seinturier, J.; Torresani, A.; Drap, P.; Remondino, F.; Chemisky, B. Towards Real-Time Underwater Photogrammetry for Subsea Metrology Applications. In Proceedings of the OCEANS 2019, Marseille, France, 17–20 June 2019; IEEE: Marseille, France, 2019; pp. 1–10. [Google Scholar]
  24. Storlazzi, C.D.; Dartnell, P.; Hatcher, G.A.; Gibbs, A.E. End of the Chain? Rugosity and Fine-Scale Bathymetry from Existing Underwater Digital Imagery Using Structure-from-Motion (SfM) Technology. Coral Reefs 2016, 35, 889–894. [Google Scholar] [CrossRef]
  25. Urbina-Barreto, I.; Garnier, R.; Elise, S.; Pinel, R.; Dumas, P.; Mahamadaly, V.; Facon, M.; Bureau, S.; Peignon, C.; Quod, J.-P.; et al. Which Method for Which Purpose? A Comparison of Line Intercept Transect and Underwater Photogrammetry Methods for Coral Reef Surveys. Front. Mar. Sci. 2021, 8, 636902. [Google Scholar] [CrossRef]
  26. Ventura, D.; Mancini, G.; Casoli, E.; Pace, D.S.; Lasinio, G.J.; Belluscio, A.; Ardizzone, G. Seagrass Restoration Monitoring and Shallow-Water Benthic Habitat Mapping through a Photogrammetry-Based Protocol. J. Environ. Manag. 2022, 304, 114262. [Google Scholar] [CrossRef]
  27. Jaud, M.; Delsol, S.; Urbina-Barreto, I.; Augereau, E.; Cordier, E.; Guilhaumon, F.; Le Dantec, N.; Floc’h, F.; Delacourt, C. Low-Tech and Low-Cost System for High-Resolution Underwater RTK Photogrammetry in Coastal Shallow Waters. Remote Sens. 2023, 16, 20. [Google Scholar] [CrossRef]
  28. Casella, E.; Lewin, P.; Ghilardi, M.; Rovere, A.; Bejarano, S. Assessing the Relative Accuracy of Coral Heights Reconstructed from Drones and Structure from Motion Photogrammetry on Coral Reefs. Coral Reefs 2022, 41, 869–875. [Google Scholar] [CrossRef]
  29. Casella, E.; Collin, A.; Harris, D.; Ferse, S.; Bejarano, S.; Parravicini, V.; Hench, J.L.; Rovere, A. Mapping Coral Reefs Using Consumer-Grade Drones and Structure from Motion Photogrammetry Techniques. Coral Reefs 2017, 36, 269–275. [Google Scholar] [CrossRef]
  30. David, C.G.; Kohl, N.; Casella, E.; Rovere, A.; Ballesteros, P.; Schlurmann, T. Structure-from-Motion on Shallow Reefs and Beaches: Potential and Limitations of Consumer-Grade Drones to Reconstruct Topography and Bathymetry. Coral Reefs 2021, 40, 835–851. [Google Scholar] [CrossRef]
  31. Slocum, R.K.; Parrish, C.E.; Simpson, C.H. Combined Geometric-Radiometric and Neural Network Approach to Shallow Bathymetric Mapping with UAS Imagery. ISPRS J. Photogramm. Remote Sens. 2020, 169, 351–363. [Google Scholar] [CrossRef]
  32. Bergsma, E.W.J.; Almar, R.; Melo De Almeida, L.P.; Sall, M. On the Operational Use of UAVs for Video-Derived Bathymetry. Coast. Eng. 2019, 152, 103527. [Google Scholar] [CrossRef]
  33. Holman, R.; Plant, N.; Holland, T. cBathy: A Robust Algorithm for Estimating Nearshore Bathymetry. JGR Oceans 2013, 118, 2595–2609. [Google Scholar] [CrossRef]
  34. Lange, A.M.Z.; Fiedler, J.W.; Merrifield, M.A.; Guza, R.T. UAV Video-Based Estimates of Nearshore Bathymetry. Coast. Eng. 2023, 185, 104375. [Google Scholar] [CrossRef]
  35. Matsuba, Y.; Sato, S. Nearshore Bathymetry Estimation Using UAV. Coast. Eng. J. 2018, 60, 51–59. [Google Scholar] [CrossRef]
  36. Plant, N.G.; Holland, K.T.; Haller, M.C. Ocean Wavenumber Estimation from Wave-Resolving Time Series Imagery. IEEE Trans. Geosci. Remote Sens. 2008, 46, 2644–2658. [Google Scholar] [CrossRef]
  37. Sun, S.-H.; Chuang, W.-L.; Chang, K.-A.; Young Kim, J.; Kaihatu, J.; Huff, T.; Feagin, R. Imaging-Based Nearshore Bathymetry Measurement Using an Unmanned Aircraft System. J. Waterw. Port Coast. Ocean Eng. 2019, 145, 04019002. [Google Scholar] [CrossRef]
  38. Feurer, D.; Bailly, J.-S.; Puech, C.; Le Coarer, Y.; Viau, A.A. Very-High-Resolution Mapping of River-Immersed Topography by Remote Sensing. Prog. Phys. Geogr. Earth Environ. 2008, 32, 403–419. [Google Scholar] [CrossRef]
  39. He, J.; Lin, J.; Ma, M.; Liao, X. Mapping Topo-Bathymetry of Transparent Tufa Lakes Using UAV-Based Photogrammetry and RGB Imagery. Geomorphology 2021, 389, 107832. [Google Scholar] [CrossRef]
  40. Kim, J.S.; Baek, D.; Seo, I.W.; Shin, J. Retrieving Shallow Stream Bathymetry from UAV-Assisted RGB Imagery Using a Geospatial Regression Method. Geomorphology 2019, 341, 102–114. [Google Scholar] [CrossRef]
  41. Dietrich, J.T. Bathymetric Structure-from-Motion: Extracting Shallow Stream Bathymetry from Multi-View Stereo Photogrammetry. Earth Surf. Process. Landf. 2017, 42, 355–364. [Google Scholar] [CrossRef]
  42. Woodget, A.S.; Carbonneau, P.E.; Visser, F.; Maddock, I.P. Quantifying Submerged Fluvial Topography Using Hyperspatial Resolution UAS Imagery and Structure from Motion Photogrammetry. Earth Surf. Process. Landf. 2015, 40, 47–64. [Google Scholar] [CrossRef]
  43. Tamminga, A.D.; Eaton, B.C.; Hugenholtz, C.H. UAS-Based Remote Sensing of Fluvial Change Following an Extreme Flood Event. Earth Surf. Process. Landf. 2015, 40, 1464–1476. [Google Scholar] [CrossRef]
  44. Bagheri, O.; Ghodsian, M.; Saadatseresht, M. Reach Scale Application Of UAV+SFM Method In Shallow Rivers Hyperspatial Bathymetry. Int. Arch. Photogramm. Remote Sens. Spatial Inf. Sci. 2015, XL-1/W5, 77–81. [Google Scholar] [CrossRef]
  45. Partama, I.G.Y.; Kanno, A.; Ueda, M.; Akamatsu, Y.; Inui, R.; Sekine, M.; Yamamoto, K.; Imai, T.; Higuchi, T. Removal of Water-surface Reflection Effects with a Temporal Minimum Filter for UAV-based Shallow-water Photogrammetry. Earth Surf. Process. Landf. 2018, 43, 2673–2682. [Google Scholar] [CrossRef]
  46. Collin, A.; James, D.; Lamontagne, N.; Hardy, R.; Monpert, C.; Feunteun, E. Ultra-High-Resolution Bathymetry Estimation Using a Visible Airborne Drone, Photogrammetry and Neural Network. In Proceedings of the XVIIIèmes Journées, Anglet, France, 25–27 June 2024; Editions Paralia: Nantes, France, 2024; pp. 477–484. [Google Scholar]
  47. Agrafiotis, P.; Karantzalos, K.; Georgopoulos, A.; Skarlatos, D. Correcting Image Refraction: Towards Accurate Aerial Image-Based Bathymetry Mapping in Shallow Waters. Remote Sens. 2020, 12, 322. [Google Scholar] [CrossRef]
  48. Szostak, B.; Specht, M.; Burdziakowski, P.; Stateczny, A.; Specht, C.; Lewicka, O. Methodology for Performing Bathymetric Measurements of Shallow Waterbodies Using an UAV, and Their Processing Based on the SVR Algorithm. Measurement 2023, 223, 113720. [Google Scholar] [CrossRef]
  49. Alevizos, E.; Nicodemou, V.C.; Makris, A.; Oikonomidis, I.; Roussos, A.; Alexakis, D.D. Integration of Photogrammetric and Spectral Techniques for Advanced Drone-Based Bathymetry Retrieval Using a Deep Learning Approach. Remote Sens. 2022, 14, 4160. [Google Scholar] [CrossRef]
  50. Specht, M.; Szostak, B.; Lewicka, O.; Stateczny, A.; Specht, C. Method for Determining of Shallow Water Depths Based on Data Recorded by UAV/USV Vehicles and Processed Using the SVR Algorithm. Measurement 2023, 221, 113437. [Google Scholar] [CrossRef]
  51. Cordier, E.; Lézé, J.; Join, J.-L. Natural Tidal Processes Modified by the Existence of Fringing Reef on La Reunion Island (Western Indian Ocean): Impact on the Relative Sea Level Variations. Cont. Shelf Res. 2013, 55, 119–128. [Google Scholar] [CrossRef]
  52. Camoin, G.F.; Colonna, M.; Montaggioni, L.F.; Casanova, J.; Faure, G.; Thomassin, B.A. Holocene Sea Level Changes and Reef Development in the Southwestern Indian Ocean. Coral Reefs 1997, 16, 247–259. [Google Scholar] [CrossRef]
  53. Soler, O. Atlas Climatique de La Réunion; Météo France: Toulouse, France, 1997; p. 79. [Google Scholar]
  54. Butler, J.; Lane, S.; Chandler, J.; Porfiri, E. Through-Water Close Range Digital Photogrammetry in Flume and Field Environments. Photogramm. Rec. 2002, 17, 419–439. [Google Scholar] [CrossRef]
  55. Jerlov, N. Preface to the Second Edition. In Marine Optics; Elsevier Oceanography Series; Elsevier: Amsterdam, The Netherlands, 1976; Volume 14, p. vii. ISBN 978-0-444-41490-8. [Google Scholar]
  56. Westaway, R.M.; Lane, S.N.; Hicks, D.M. Remote Sensing of Clear-Water, Shallow, Gravel-Bed Rivers Using Digital Photogrammetry. Photogramm. Eng. Remote Sens. 2001, 67, 1271–1281. [Google Scholar]
  57. Westaway, R.M.; Lane, S.N.; Hicks, D.M. The Development of an Automated Correction Procedure for Digital Photogrammetry for the Study of Wide, Shallow, Gravel-Bed Rivers. Earth Surf. Process. Landf. 2000, 25, 209–226. [Google Scholar] [CrossRef]
  58. Carbonneau, P.E.; Dietrich, J.T. Cost-effective Non-metric Photogrammetry from Consumer-grade sUAS: Implications for Direct Georeferencing of Structure from Motion Photogrammetry. Earth Surf. Process. Landf. 2017, 42, 473–486. [Google Scholar] [CrossRef]
  59. James, M.R.; Robson, S. Mitigating Systematic Error in Topographic Models Derived from UAV and Ground-Based Image Networks. Earth Surf. Process. Landf. 2014, 39, 1413–1420. [Google Scholar] [CrossRef]
  60. Jaud, M.; Passot, S.; Allemand, P.; Le Dantec, N.; Grandjean, P.; Delacourt, C. Suggestions to Limit Geometric Distortions in the Reconstruction of Linear Coastal Landforms by SfM Photogrammetry with PhotoScan® and MicMac® for UAV Surveys with Restricted GCPs Pattern. Drones 2018, 3, 2. [Google Scholar] [CrossRef]
  61. Wilson, J.P.; Gallant, J.C. Terrain Analysis: Principles and Applications; J. Wiley & Sons: New York, NY, USA, 2000; ISBN 978-0-471-32188-0. [Google Scholar]
  62. Kujawa, P.; Wajs, J.; Pleśniak, K. The Approach to UAV Image Acquisition and Processing for Very Shallow Water Mapping. Int. J. Appl. Earth Obs. Geoinf. 2025, 141, 104604. [Google Scholar] [CrossRef]
  63. Zhan, Y.; Nobuhara, S.; Nishino, K.; Zheng, Y. NeRFrac: Neural Radiance Fields through Refractive Surface. In Proceedings of the 2023 IEEE/CVF International Conference on Computer Vision (ICCV), Paris, France, 2–6 October 2023; pp. 18356–18366. [Google Scholar]
  64. Günthner, A.; Brezovsky, M.; Schulte, F.; Winiwarter, L.; Mandlburger, G.; Jutzi, B. Exploring the Potential of Refractive NeRFs for Photogrammetric Bathymetry—First Application to UAV-Based Data from the Pielach River. In Proceedings of the International Archives of the Photogrammetry, Remote Sensing and Spatial Information Sciences, 3D Underwater Mapping from Above and Below—3rd International Workshop, Vienna, Austria, 8–11 July 2025; Volume XLVIII-2/W10-2025, pp. 107–114. [Google Scholar] [CrossRef]
  65. Schulte, F.; Brezovsky, M.; Günthner, A.; Jutzi, B.; Mandlburger, G.; Winiwarter, L. Simulation and Validation of Underwater Scenes for Two-Media Optical 3D Reconstruction. In Proceedings of the International Archives of the Photogrammetry, Remote Sensing and Spatial Information Sciences, 3D Underwater Mapping from Above and Below—3rd International Workshop, Vienna, Austria, 8–11 July 2025; Volume XLVIII-2/W10-2025, pp. 271–278. [Google Scholar] [CrossRef]
  66. Skarlatos, D.; Agrafiotis, P. A Novel Iterative Water Refraction Correction Algorithm for Use in Structure from Motion Photogrammetric Pipeline. JMSE 2018, 6, 77. [Google Scholar] [CrossRef]
  67. Scilla, D.; Lopez, O.A.; Nieuwenhuis, B.O.; Johansen, K.; Elías-Lara, M.; Angulo, V.; Rodríguez, J.L.; Jones, B.H.; McCabe, M.F. Computer Vision Corrections Enhance UAV-Based Retrievals in Shallow Waters. IEEE J. Sel. Top. Appl. Earth Obs. Remote Sens. 2025, 18, 18134–18149. [Google Scholar] [CrossRef]
  68. Murase, T.; Tanaka, M.; Tani, T.; Miyashita, Y.; Ohkawa, N.; Ishiguro, S.; Suzuki, Y.; Kayanne, H.; Yamano, H. A Photogrammetric Correction Procedure for Light Refraction Effects at a Two-Medium Boundary. Photogramm. Eng. Remote Sens. 2008, 74, 1129–1136. [Google Scholar] [CrossRef]
  69. Del Savio, A.A.; Luna Torres, A.; Vergara Olivera, M.A.; Llimpe Rojas, S.R.; Urday Ibarra, G.T.; Neckel, A. Using UAVs and Photogrammetry in Bathymetric Surveys in Shallow Waters. Appl. Sci. 2023, 13, 3420. [Google Scholar] [CrossRef]
  70. You, Y.; Stramski, D.; Darecki, M.; Kattawar, G.W. Modeling of Wave-Induced Irradiance Fluctuations at near-Surface Depths in the Ocean: A Comparison with Measurements. Appl. Opt. 2010, 49, 1041. [Google Scholar] [CrossRef] [PubMed]
  71. Darecki, M.; Stramski, D.; Sokólski, M. Measurements of High-frequency Light Fluctuations Induced by Sea Surface Waves with an Underwater Porcupine Radiometer System. J. Geophys. Res. 2011, 116, 2011JC007338. [Google Scholar] [CrossRef]
  72. Yanovski, R.; Nelson, P.A.; Abelson, A. Structural Complexity in Coral Reefs: Examination of a Novel Evaluation Tool on Different Spatial Scales. Front. Ecol. Evol. 2017, 5, 27. [Google Scholar] [CrossRef]
  73. Fukunaga, A.; Burns, J.H.R.; Craig, B.K.; Kosaki, R.K. Integrating Three-Dimensional Benthic Habitat Characterization Techniques into Ecological Monitoring of Coral Reefs. J. Mar. Sci. Eng. 2019, 7, 27. [Google Scholar] [CrossRef]
  74. Young, G.C.; Dey, S.; Rogers, A.D.; Exton, D. Cost and Time-Effective Method for Multi-Scale Measures of Rugosity, Fractal Dimension, and Vector Dispersion from Coral Reef 3D Models. PLoS ONE 2017, 12, e0175341. [Google Scholar] [CrossRef] [PubMed]
  75. Chung, D.; Hutchins, N.; Schultz, M.P.; Flack, K.A. Predicting the Drag of Rough Surfaces. Annu. Rev. Fluid Mech. 2021, 53, 439–471. [Google Scholar] [CrossRef]
  76. Dealbera, S.; Sous, D.; Morichon, D.; Michaud, H. The Role of Roughness Geometry in Frictional Wave Dissipation. Coast. Eng. 2024, 189, 104478. [Google Scholar] [CrossRef]
  77. Patil, A.; García-Sánchez, C. A Comparative Hydrodynamic Characterization of the Flow Through Regular and Stochastically Generated Synthetic Coral Reefs over Flat Topography. arXiv 2025, arXiv:2501.15237. [Google Scholar] [CrossRef]
  78. Sous, D.; Meulé, S.; Dealbera, S.; Michaud, H.; Gassier, G.; Pezerat, M.; Bouchette, F. Quantifying the Topographical Structure of Rocky and Coral Seabeds. PLoS ONE 2024, 19, e0303422. [Google Scholar] [CrossRef]
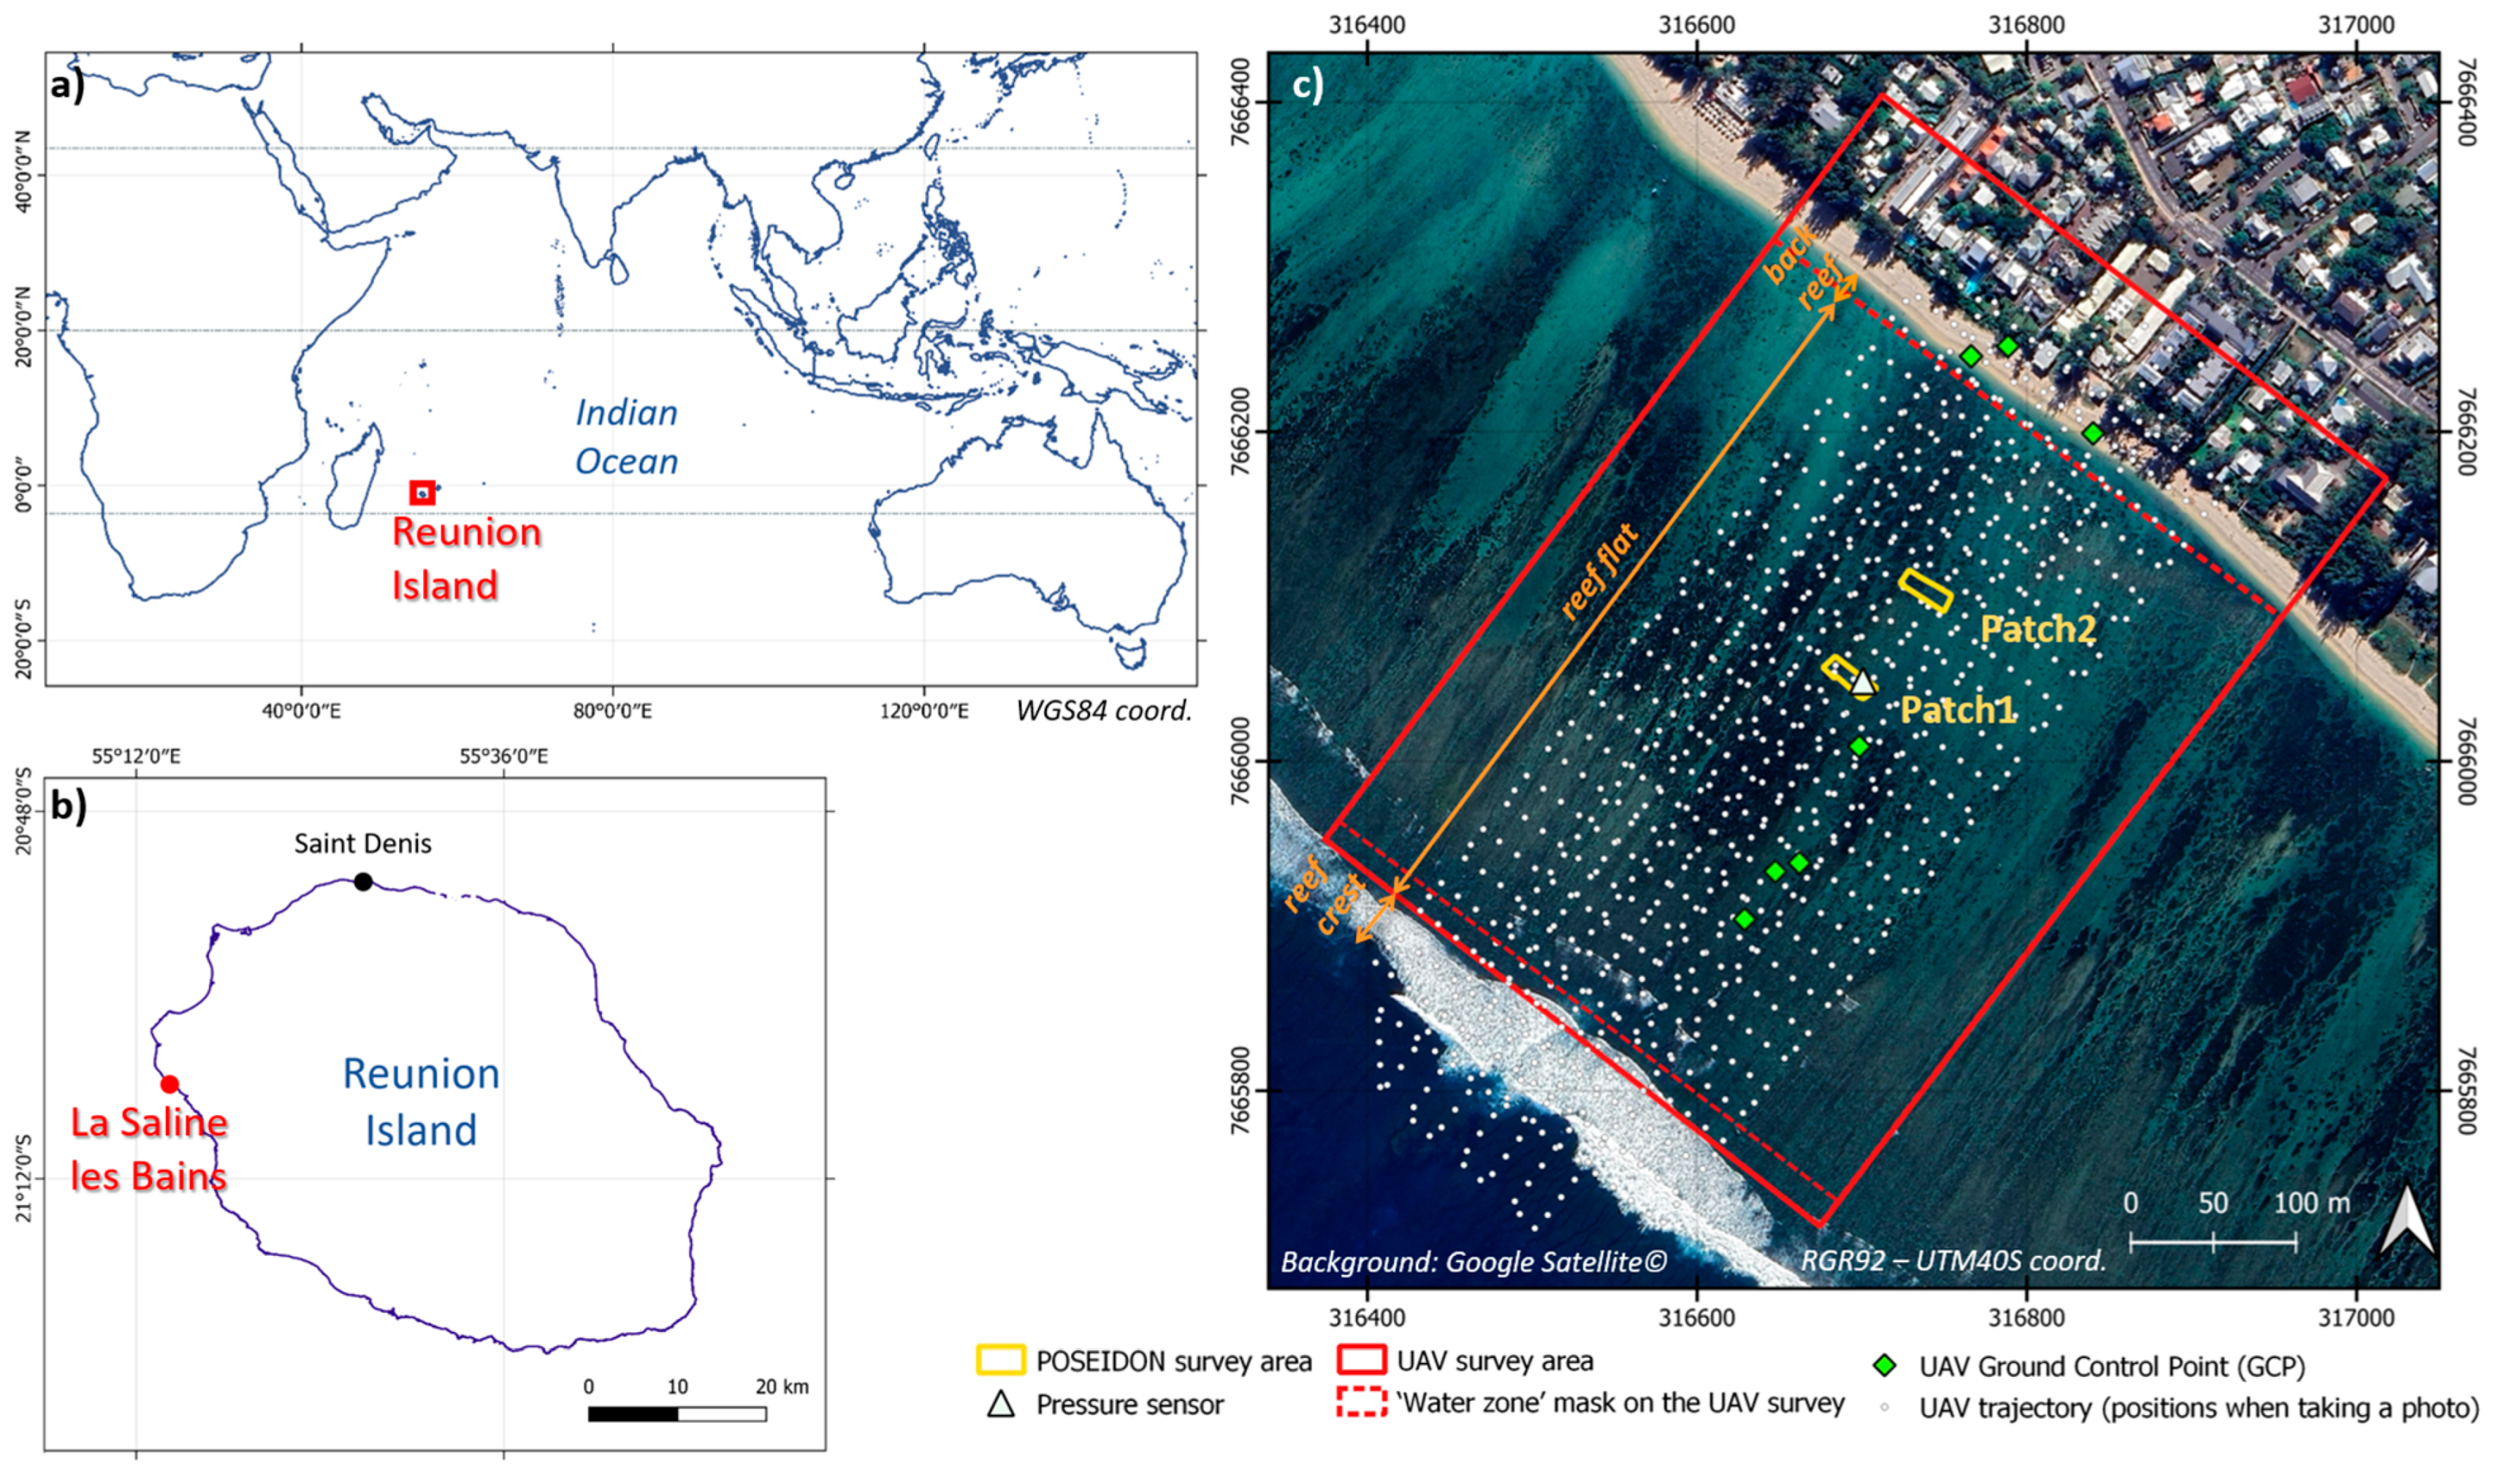
Figure 1. Field site at La Saline Les Bains in Réunion Island (France). (a,b) Map of Indian Ocean and Réunion Island. (c) Survey area over the reef flat.
Remotesensing 17 03846 g001
Figure 2. (a) Conceptual diagram of the POSEIDON system, with a structure adapted to a bodyboard holding two GoPro cameras and an RTK GNSS antenna vertically above one of the two GoPros [27]. (b) Underwater view of the POSEIDON system during acquisition [27]. (c,d) Resulting DEMs obtained from POSEIDON surveys on Patch 1 (c) and Patch 2 (d).
Remotesensing 17 03846 g002
Figure 3. (a) UAV survey at sunrise, when short waves in the lagoon are minimal. (b) 3D view of the photogrammetric reconstruction from UAV images, with the position of the GCPs used during SfM processing.
Remotesensing 17 03846 g003
Figure 4. Light refraction at the water/air interface for a single camera. P refers to a point on the ground and PA refers to the corresponding ‘apparent point’ as seen on the drone image. Z is the bottom elevation, ZA is the apparent bathymetry (according to a vertical reference) from the UAV DEM, and ZS is the water surface elevation at the time of the survey. h refers to the true water depth and hA to the apparent water depth. i and r are, respectively, the angles of incident and refracted light rays; n1 and n2 are, respectively, the refractive index of water and the refractive index of air (n1 = 1.34 and n2 = 1).
Remotesensing 17 03846 g004
Figure 5. Computation of regression lines REG1 (red), REG2 (yellow) and REG3 (green) for, respectively, 20 calibration points on Patch 1 (REG1), 20 calibration points on Patch 2 (REG2) and 40 calibration points distributed between Patches 1 and 2 (REG3).
Remotesensing 17 03846 g005
Figure 6. Correlation between depths obtained from UAV photogrammetric surveys, respectively, corrected by REG1, REG2 and REG3.
Remotesensing 17 03846 g006
Figure 7. (ad) Different UAV DEMs obtained across the entire area covered by the drone survey: (a) apparent bathymetry (raw DEM output from SfM photogrammetry processing), (b) DEM corrected for refraction using the analytical method and DEM corrected empirically using REG1 (c) or REG3 (d). (eg) Differences in elevation induced by these corrections in relation to the apparent depth.
Remotesensing 17 03846 g007
Figure 8. Examples of elevation profiles (ae) in metres, respectively along transects AB, CD, EF, GH and IJ (a1e1), above coral heads on the different DEMs (POSEIDON DEMs, UAV apparent bathymetry and refraction-corrected UAV DEMs).
Remotesensing 17 03846 g008
Figure 9. Representation of the averaged standard deviation of bed elevations (bottom roughness proxy) as a function of neighbourhood size (square kernel) and type of DEM (represented by different symbols). The dotted lines correspond to a gap in the x-axis.
Remotesensing 17 03846 g009
Figure 10. Assessment of the sensitivity of the regression method to the batch of calibration points. (a,b) Regression lines for the 5 batches of ‘REG1 type’ (a) or ‘REG3 type’ (b). (c) Variance map calculated from DEMs generated for the 5 REG1 regressions. (d) Variance map calculated from DEMs generated for the 5 REG3 regressions. (e) Variance maps calculated across all DEMs.
Remotesensing 17 03846 g010
Figure 11. Comparison between 3D data (from POSEIDON underwater photogrammetry point cloud, subsampled at 0.5 cm and 4.4 cm) and 2.5D data (from UAV photogrammetry DEM at 4.4 cm, corrected by REG3). (a) Top-view of an extract of the POSEIDON 3D point cloud (on Patch 1). (b) 3D-view of the extract of the POSEIDON 3D mesh. (c) 3D-view of the same zone extracted from the UAV 2.5D mesh. (d) Comparison of vertical profiles (along AB transect) on POSEIDON 3D meshes and UAV 2.5D mesh along the AB profile (see position in (a)). As the difference between the yellow and red profiles is due only to sub-sampling of the POSEIDON 3D model, these two profiles are almost superimposed.
Remotesensing 17 03846 g011
Table 1. Comparison of UAV DEMs (with various level of correction) to POSEIDON DEMs.
MethodsDEM of Differences (DoD)
Patch 1Patch 2
POSEIDON—UAV apparent bathymetryME = 0.09 m
σ = 0.13 m
RMSE = 0.16 m
ME = 0.19 m
σ =0.15 m
RMSE = 0.24 m
POSEIDON—Analytical refraction-corrected UAV DEMME = 0.08 m
σ = 0.09 m
RMSE = 0.13 m
ME = 0.03 m
σ = 0.11 m
RMSE = 0.11 m
POSEIDON—REG1-corrected UAV DEMME = −0.04 m
σ = 0.09 m
RMSE = 0.10 m
ME = −0.17 m
σ = 0.08 m
RMSE = 0.20 m
POSEIDON—REG2-corrected UAV DEMME = 0.10 m
σ = 0.10 m
RMSE = 0.14 m
ME = −0.04 m
σ = 0.09 m
RMSE = 0.09 m
POSEIDON—REG3-corrected UAV DEMME = 0.06 m
σ = 0.09 m
RMSE = 0.11 m
ME = −0.07 m
σ = 0.08 m
RMSE = 0.11 m
M E = 1 n i = 1 n Z i   P O S E I D O N Z i   U A V = 1 n i = 1 n D o D i : mean error. σ = i = 1 n D o D i M E 2 n   : standard deviation of the DoD. R M S E =   i = 1 n D o D i 2 n   : root mean square error.
Table 2. Calculation of standard deviation of bed elevations (as bottom roughness proxy) at various scales on the different DEMs. Roughness statistics obtained from POSEIDON DEM (in italics) are used as reference values for a given size of neighbourhood.
Kernel Size
(m × m)
Subsamp.
POSEIDON DEM
UAV Apparent BathymetryUAV DEM
Analytically
Corrected
UAV DEM
Corrected by REG1
UAV DEM
Corrected by REG3
Standard deviation of bed elevations (bottom roughness) (m)Patch 10.13 × 0.130.0190.0070.0100.0120.012
0.48 × 0.480.0570.0260.0350.0420.043
1.01 × 1.010.0930.0490.0650.0780.079
1.98 × 1.980.1340.0770.1030.1230.125
4.97 × 4.970.1940.1190.1590.1890.193
30 × 100.2980.1920.2580.3010.313
Patch 20.13 × 0.130.0210.0080.0110.0130.013
0.48 × 0.480.0630.0290.0390.0460.047
1.01 × 1.010.1060.0550.0740.0870.089
1.98 × 1.980.1590.0880.1180.1410.144
4.97 × 4.970.2290.1320.1760.2100.214
30 × 100.3000.1700.2270.2700.276
UAV area0.13 × 0.13 0.0060.0080.0100.010
0.48 × 0.48 0.0200.0270.0320.033
1.01 × 1.01 0.0350.0470.0550.057
1.98 × 1.98 0.0520.0690.0820.084
4.97 × 4.97 0.0740.0990.1170.120
450 × 380 0.1740.2330.2760.283
Table 3. Mean deviation in roughness estimates at different scales obtained from UAV DEMs (corrected or uncorrected) compared to the POSEIDON DEM (used here as a reference).
POSEIDON DEM vs. UAV Apparent BathymetryPOSEIDON DEM vs. Analytically Corr. UAV DEMPOSEIDON DEM vs. REG1-Corrected UAV DEMPOSEIDON DEM vs. REG3-Corrected UAV DEM
Mean error on
roughness
48.0%30.0%16.8%15.2%
Disclaimer/Publisher’s Note: The statements, opinions and data contained in all publications are solely those of the individual author(s) and contributor(s) and not of MDPI and/or the editor(s). MDPI and/or the editor(s) disclaim responsibility for any injury to people or property resulting from any ideas, methods, instructions or products referred to in the content.