Article

Geological Evolution of Rima Bode on the Moon Revealed by Multi-Source Remote Sensing Data

by
Wenqing Chang
1,
Zhiguo Meng
1,2,*,
Roberto Bugiolacchi
2,
Yi Xu
2,
Yongchun Zheng
3,
Qiugang Zong
2,
Xiaoping Zhang
2 and
Yuanzhi Zhang
4,5
1
College of Geoexploration Science and Technology, Jilin University, Changchun 130026, China
2
The State Key Laboratory of Lunar and Planetary Sciences, Macau University of Science and Technology, Macau 999078, China
3
National Astronomical Observatories, Chinese Academy of Sciences, Beijing 100101, China
4
School of Astronomy and Space Science, University of Chinese Academy of Sciences, Beijing 100049, China
5
Key Laboratory of Lunar and Deep Space Exploration, National Astronomical Observatories, Chinese Academy of Sciences, Beijing 100101, China
*
Author to whom correspondence should be addressed.
Remote Sens. 2025, 17(23), 3824; https://doi.org/10.3390/rs17233824
Submission received: 28 October 2025 / Revised: 19 November 2025 / Accepted: 24 November 2025 / Published: 26 November 2025

Highlights

What are the main findings?
  • Based on compositional, topographic, and geomorphological analyses, we identified three distinct basaltic units and one pyroclastic deposit unit in the Rima Bode region, with thicknesses of 4.3–51.9 m for pyroclastic deposits and 2.3–269.2 m for basalts, establishing a quantitative stratigraphic framework. Based on Crater Size–Frequency Distribution (CSFD) Measurements, the model ages of the Rima Bode region range from 3.65 Ga to 3.27 Ga, indicating at least four distinct volcanic eruptions.
  • MRM data reveal abnormal TB behaviors in pyroclastic deposits—exhibiting slower diurnal TB change rates compared to surrounding basalts—indicating significantly higher thermal inertia.
What are the implication of the main finding?
  • This study systematically establishes, for the first time, a comprehensive geological evolution framework for the Rima Bode region, revealing its material composition, stratigraphic thickness characteristics, and potential volcanic source locations. The results provide crucial scientific evidence for a deeper understanding of the complex geological history in this region.
  • The identification of high thermal inertia as a diagnostic signature of lunar pyroclastic deposits through microwave remote sensing provides a novel approach for distinguishing pyroclastic deposits from basaltic materials.

Abstract

Rima Bode is located on the central nearside of the Moon, with its rich volcanic landforms, which is considered an ideal region for studying lunar geological evolution. In this study, we systematically analyzed the geomorphological characteristics, composition, spatial thickness variations in basalts and pyroclastic deposits, thermophysical properties, and chronology of Rima Bode using the Kaguya Multiband (MI) data, Moon Mineralogy Mapper (M3) data, Terrain Camera (TC) data, and the CE-2 Microwave Radiometer (MRM) data. The main results are as follows. (1) The basalts can be categorized into three distinct units (Regions II, III, and IV), and the distribution range of pyroclastic deposits was redefined. Using the crater excavation technique, the deposit thicknesses were constrained to 4.3–51.9 m for pyroclastic deposits and 2.3–269.2 m for basalts, establishing a quantitative stratigraphic framework; (2) this study reveals that pyroclastic deposits exhibit abnormally brightness temperature (TB) behaviors, with slower diurnal TB change rates, indicating their high thermal inertia. (3) Chronological analysis indicated that volcanism lasted for ~0.38 Ga, with at least four distinct episodes of volcanic eruptions, suggesting complex magmatic processes and continued thermal activity within this region. These findings establish a comprehensive geological framework for the Rima Bode region, thereby deepening our understanding of its geological evolution.

1. Introduction

Volcanism is the most important endogenic process on the Moon, profoundly shaping the formation and evolution of lunar surface morphology [1,2]. The diverse volcanic landforms distributed across the lunar surface serve as critical evidence for reconstructing the history of lunar volcanism, the Moon’s internal stratigraphic architecture, and its thermal evolution [3]. Rima Bode, in particular, displays a comprehensive suite of explosive and effusive volcanic landforms—including lunar rilles, depressions, pyroclastic deposits, and mare basalts—that collectively document a complex and prolonged volcanic history [4]. The remarkable diversity and preservation of these volcanic landforms make Rima Bode an ideal location for investigating lunar volcanic processes [5,6].
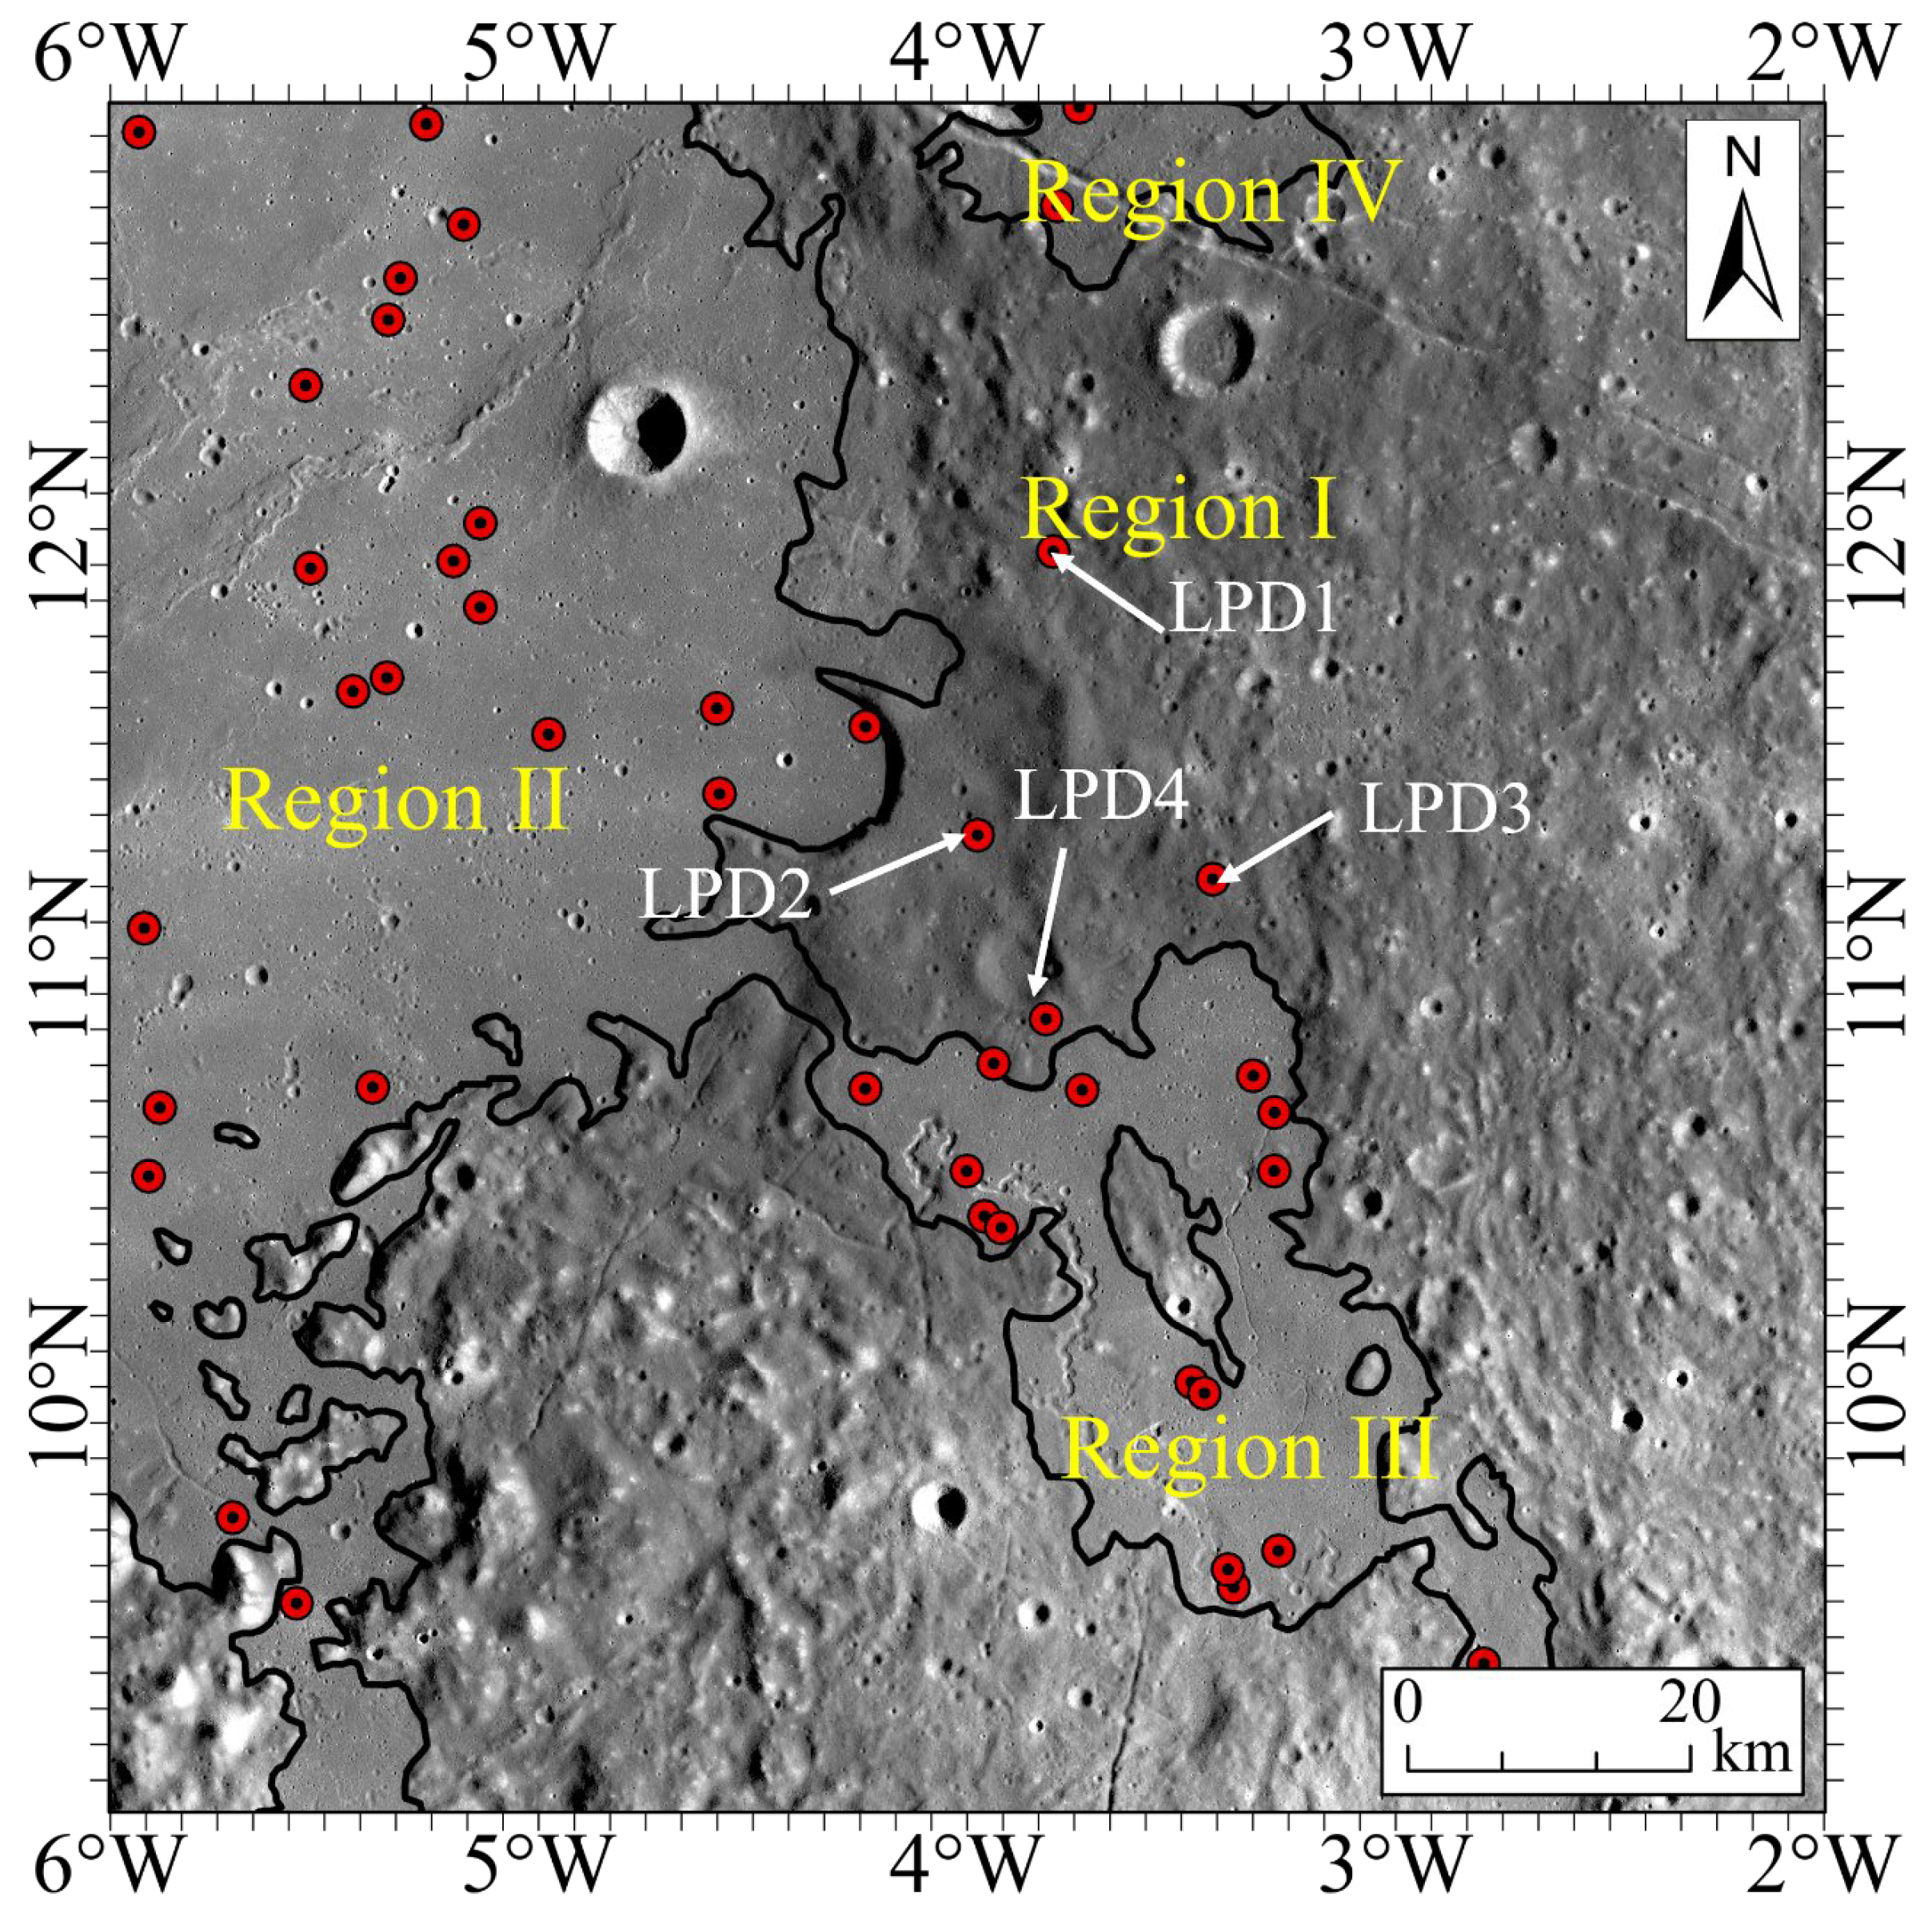
Rima Bode is located on the central nearside of the Moon within the Procellarum KREEP Terrane [7], south of Eratosthenes crater and east of Copernicus crater. The region consists mainly of basaltic units (Regions II, III, and potentially IV) and pyroclastic deposits (Region I) (Figure 1). These represent distinct episodes and types of volcanic activity. This stratigraphic complexity, combined with the region’s location within the PKT—a geochemically unique terrane—provides an exceptional framework for understanding lunar magmatic evolution. Previous studies have investigated the pyroclastic deposits and basaltic units within Rima Bode [5,6,8,9,10].
Based on Clementine UV/VIS data, Weitz et al. [11] and Gaddis et al. [8] proposed this region as one of the six major pyroclastic deposit concentrations on the Moon, covering an area of approximately 7000 km2 with an arcuate distribution and elevated FeO and TiO2 contents. Their interpretation relied mainly on morphological features and albedo values. Using Moon Mineralogy Mapper (M3) data, Pigue et al. [6] further proposed that pyroclastic deposits in this region exhibit strong glass signature with high glass content, based on the mineral variation characteristics. However, the geological classification of the Region IV by Pigue et al. [6] conflicts with previous studies, and this uncertainty may affect our understanding of volcanism in this region. Early mapping interpreted Region IV as basalts [8,11], a classification supported by the 1:2,500,000-scale geological map [9]. In contrast, Pigue et al. [6] reinterpreted Region IV as pyroclastic deposits.
The division of basaltic units remains controversial, further complicating the interpretation of the geological framework. Weitz et al. [11] also identified Region III as a distinct highland basalt unit separate from Region II based on albedo differences and morphological boundaries. This interpretation is confirmed by the 1:5,000,000-Scale geological map [12]. This division implies at least two separate volcanic events with potentially different source regions or eruption conditions. However, based on FeO and TiO2 data, Zhao et al. [10] suggested that Regions II and III likely belong to the same geological unit. Their analysis highlighted the similarity in chemical composition between the two regions, specifically in terms of TiO2 and FeO contents. This fundamental disagreement affects interpretations of volcanic chronology, the number of eruption events, and the temporal evolution of magmatic composition in the Rima Bode.
Figure 1. The WAC image of Rima Bode from the Lunar Reconnaissance Orbiter (LRO) Orbiter Camera. The black line is the Mare boundaries proposed by Nelson et al. [13]; The red point is the position where the spectrum was collected.
Remotesensing 17 03824 g001
Despite these extensive investigations, current research on Rima Bode exhibits significant limitations that hinder a comprehensive understanding of its volcanic evolution. Most investigations have examined isolated characteristics—spectral properties, compositional signatures, or morphological features—without placing them within a comprehensive geological framework that integrates geomorphology, stratigraphy, composition, and chronology. This absence of systematic investigation has resulted in persistent controversies regarding pyroclastic deposit distribution and basaltic unit division.
To address these critical limitations, this study provides a comprehensively analysis of Rima Bode by integrating geomorphological, compositional, thermophysical, and chronological properties to reconstruct its geological evolutionary framework.

2. Data and Methods

2.1. Chang’E-2 (CE-2) Microwave Radiometer (MRM)

The Chang’E-2 (CE-2) Microwave Radiometer (MRM) instrument includes four channels: 3.0 GHz (~25 km/pixel), 7.8 GHz (~17.5 km/pixel), 19.35 GHz (~17.5 km/pixel), and 37 GHz (~17.5 km/pixel) [14]. The used MRM data are at the 2C level, consisting of raw data that have undergone geometric correction and radiometric calibration [14,15].
A total of 3625 MRM data points were extracted based on the extent of the study region. For each data point, the local time was calculated using the methods proposed by Zheng et al. [14] and Meng et al. [16]. Then, based on the method proposed by Meng et al. [16], we constructed a local brightness temperature (TB) time model using the barycentric interpolation method based on Delaunay tetrahedralization. The Delaunay tetrahedralization interpolation method partitions the three-dimensional space into a set of tetrahedra, each defined by four vertices. The TB value at any specific time and location is determined collectively by the contributions from these four vertices (TB1–TB4):
T B = a 1 × T B 1 + a 2 × T B 2 + a 3 × T B 3 + a 4 × T B 4
where a 1 a 4 represent the weights corresponding to the four vertices, which are calculated using the following equation:
a 1 a 2 a 3 a 4 = L o n 1 L o n 2 L o n 3 L o n 4 L a t 1 L a t 2 L a t 3 L a t 4 t 1 t 2 t 3 t 4 1 1 1 1 1 L o n L a t t 1
where L o n i , L a t i , and tᵢ (i = 1–4) represent the longitude, latitude, and local time of the four vertices.
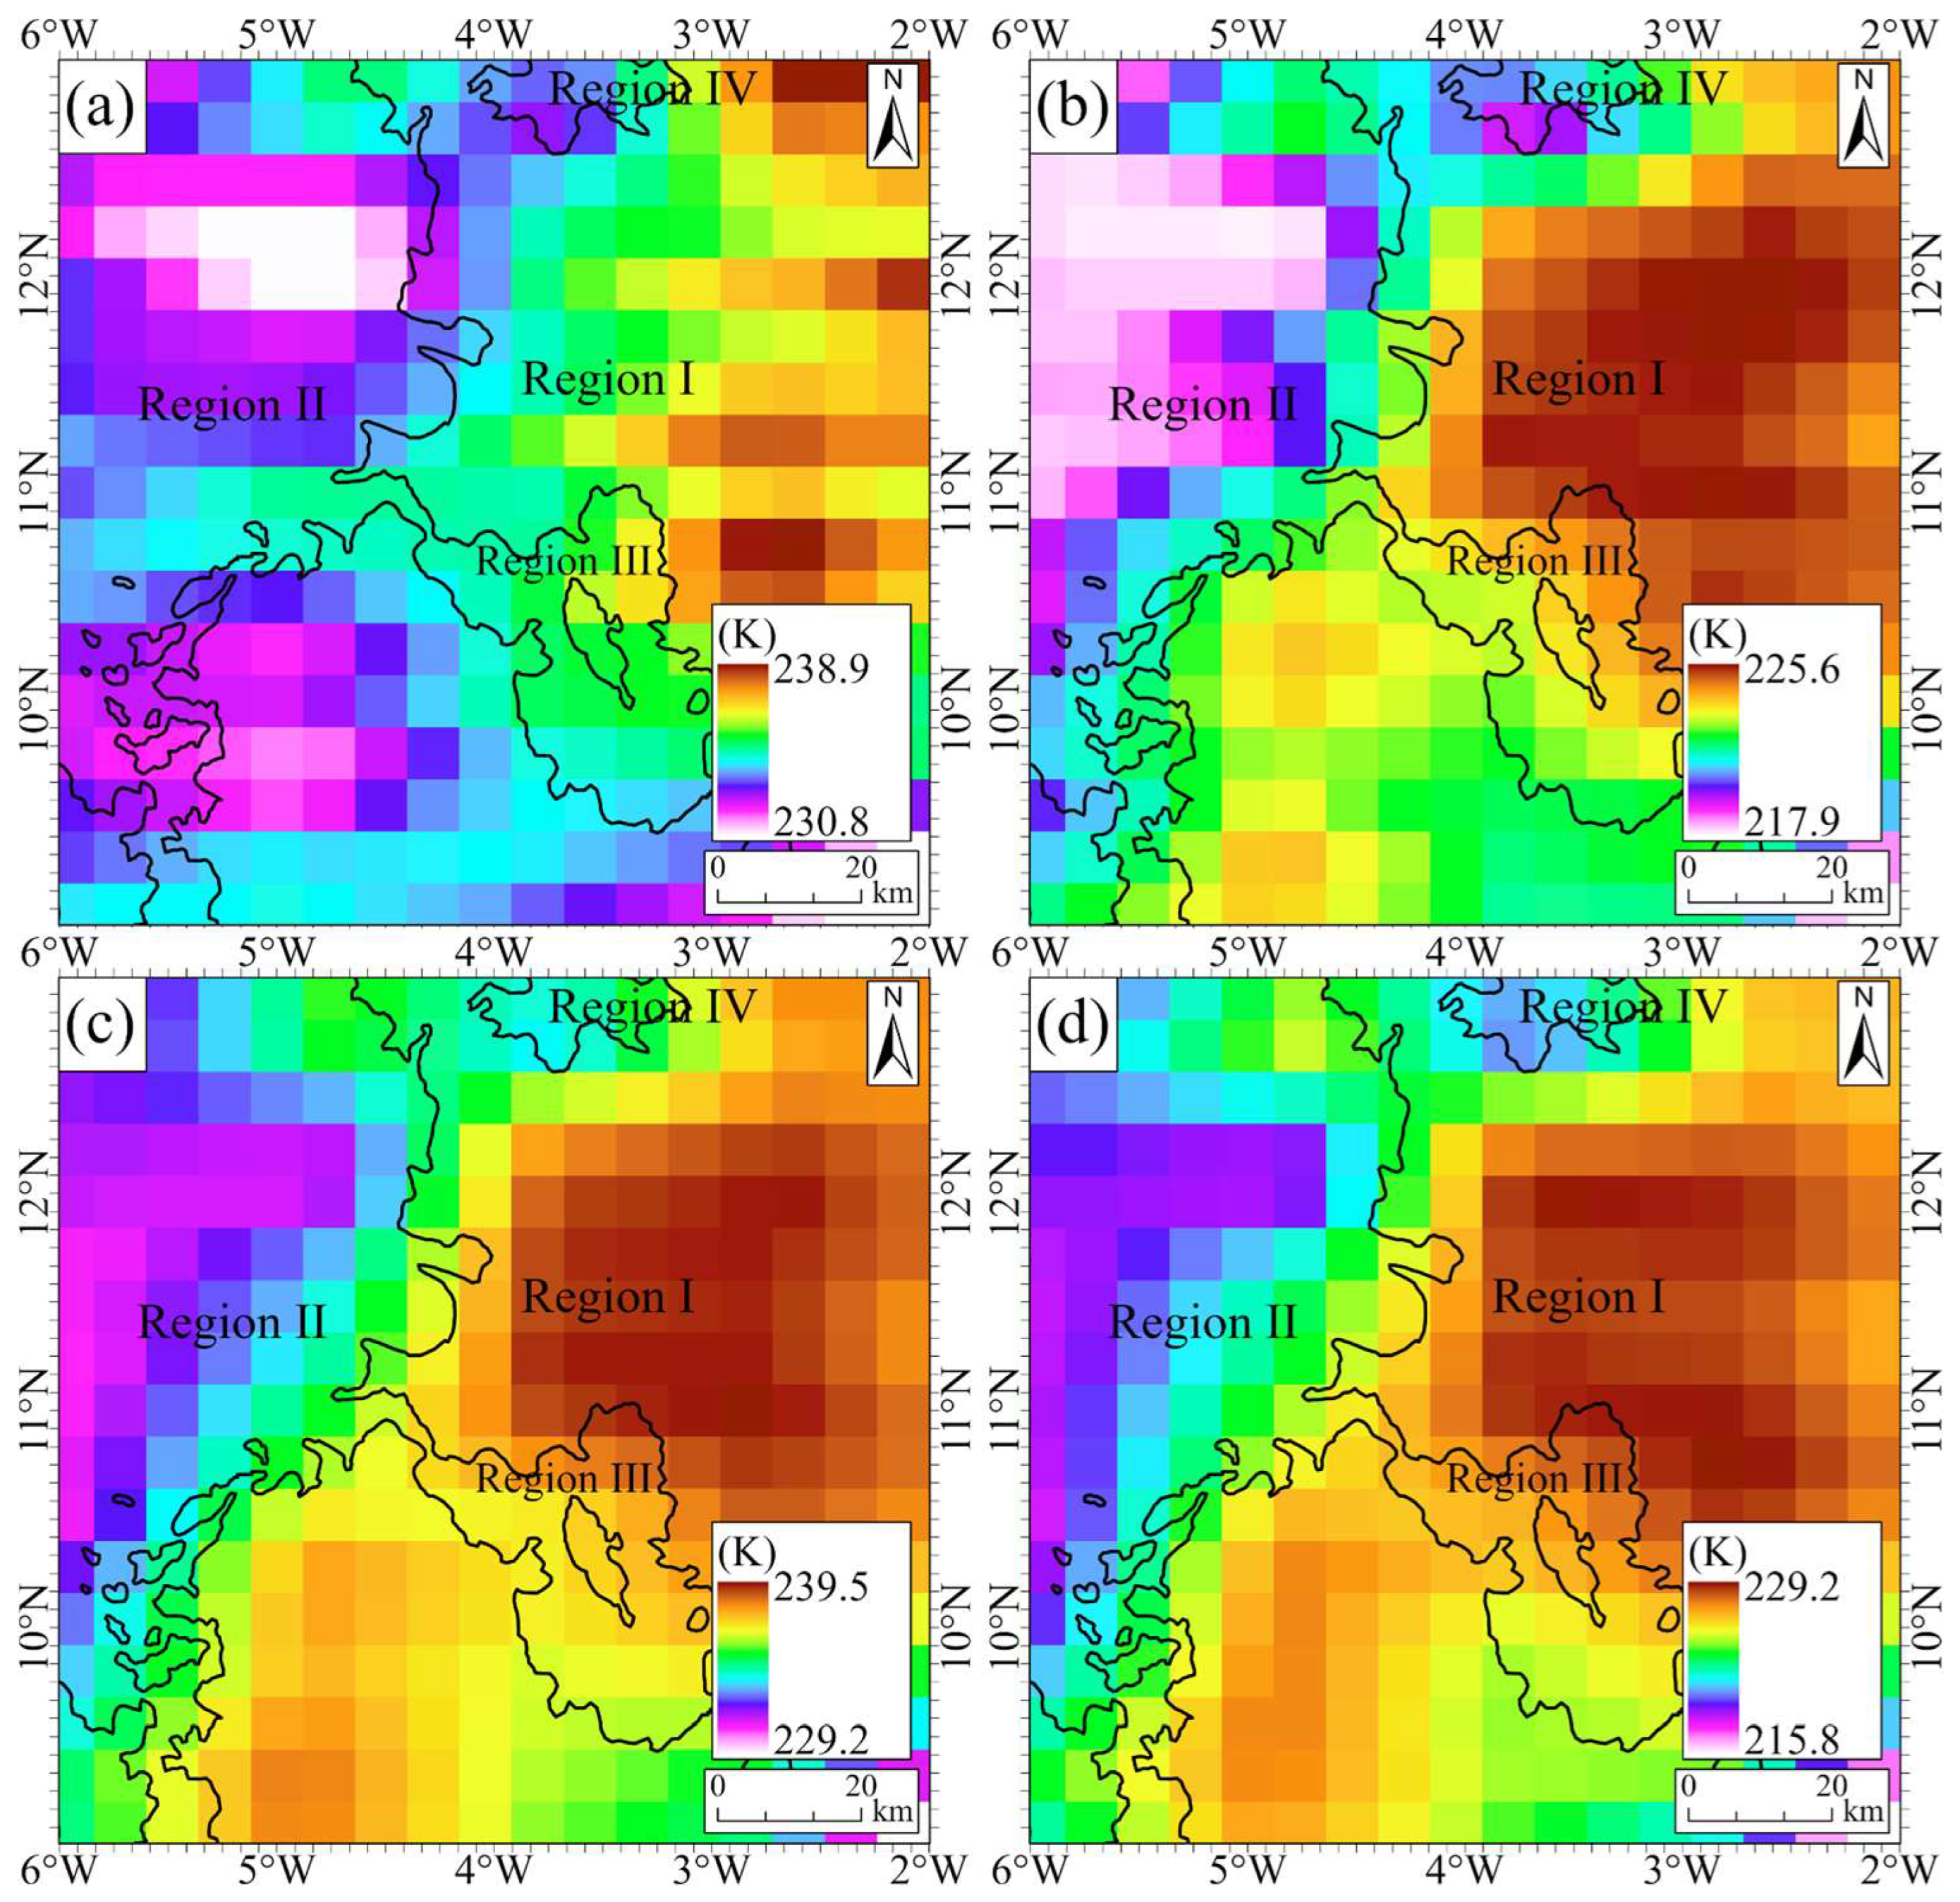
Using the local TB time model, we generated brightness temperature (TB) maps with a spatial resolution of 0.25° × 0.25° for any given time. To characterize the diurnal thermal extremes, TB maps at local times of 12:00 (noontime, Figure 2) and 23:00 (nighttime, Figure 3) were produced, representing the two nearly extreme microwave thermal emission features of the subsurface throughout a lunation [17,18].

2.2. Crater Excavation Technique

The crater excavation technique was widely used to estimate the thickness of basalts and pyroclastic deposits [19,20]. The basic principle is that if the upper and lower bedrock layers have different compositions, the thickness of the upper layer can be constrained by the excavation depth of the impact crater [19,20]. According to whether the underlying bedrock material has been excavated, lunar surface impact craters can be classified into penetrating craters (Type I) and non-penetrating craters (Type II). The thicknesses of the basalts and pyroclastic deposits are constrained within the depth range between the deepest non-penetrating craters and the shallowest penetrating craters. In areas where there were no or few nonpenetrating craters, the depth of excavation ( H e x c ) of penetrating craters was used to provide the maximum thickness and vice versa [19].
Melosh [21] proposed an equation describing the relationship between the diameter and depth of excavation for the simple craters:
H e x c = 0.1 × D t
D t = 0.84 × D
where D t is the transient crater diameter; The diameter ( D ) of the crater was defined as the arithmetic mean of four diameter measurements taken in the NS, EW, NE-SW, and NW-SE directions from the high-resolution TC images.
After obtaining the excavation depths of all selected craters, the inverse distance weighting (IDW) interpolation method [22] was used to generate a minimum thickness map (based on non-penetrating craters) and a maximum thickness map (based on penetrating craters). The average of these two maps was then taken as the final thickness distribution map.

2.3. Crater Size-Frequency Distribution (CSFD) Measurements

The CSFD is widely used to obtain absolute model ages (AMAs) of the basaltic units [20,22]. The basic steps for obtaining AMAs using CSFD measurements in this work are as follows: (1) Based on the 750 nm albedo image, FeO and TiO2 data, regions with relatively flat surfaces and minimal coverage by secondary craters were selected as the target regions for crater counting–based age determination; (2) Crater sizes and locations were measured from Kaguya-TC data using the CraterTools software (v 10.1) [23]; (3) The crater size-frequency distribution data were subsequently analyzed using the CraterStats software (v 2.0) to determine Absolute Model Ages (AMAs).

2.4. Complementary Datasets

Moon Mineralogy Mapper (M3) data, with a spatial resolution of 140 m × 280 m per pixel [24], were used to extract spectral curves of basalts and pyroclastic deposits, with their locations shown in Figure 1. After extraction, these spectral curves were first processed using Savitzky–Golay filtering [25] to reduce noise, and then processed using the convex hull method [26] to remove the spectral continuum. Then, the 1 μm and 2 μm band centers were calculated using a fourth-order polynomial fitting method [27]. Finally, the calculated band centers were systematically compared with reference values for representative lunar minerals—natural and synthetic high-calcium and low-calcium pyroxenes—reported by Adams [28], Cloutis and Gaffey [29], and Klima et al. [30,31,32].
The FeO and TiO2 contents can reveal differences in lunar mantle composition and variations in basaltic evolution, serving as important chemical indicators for reconstructing the Moon’s geological evolutionary history [33,34]. New derived surface chemistry maps (TiO2 and FeO) were produced from the Kaguya Multiband Imager (MI) datasets by incorporating CE-5 samples with deep learning model [34] (Figure 4), which can be downloaded from https://figshare.com/articles/dataset/lunar_surface_chemistry_maps/24081438 (accessed on 1 September 2025).

3. Results

3.1. Geomorphological Characteristics

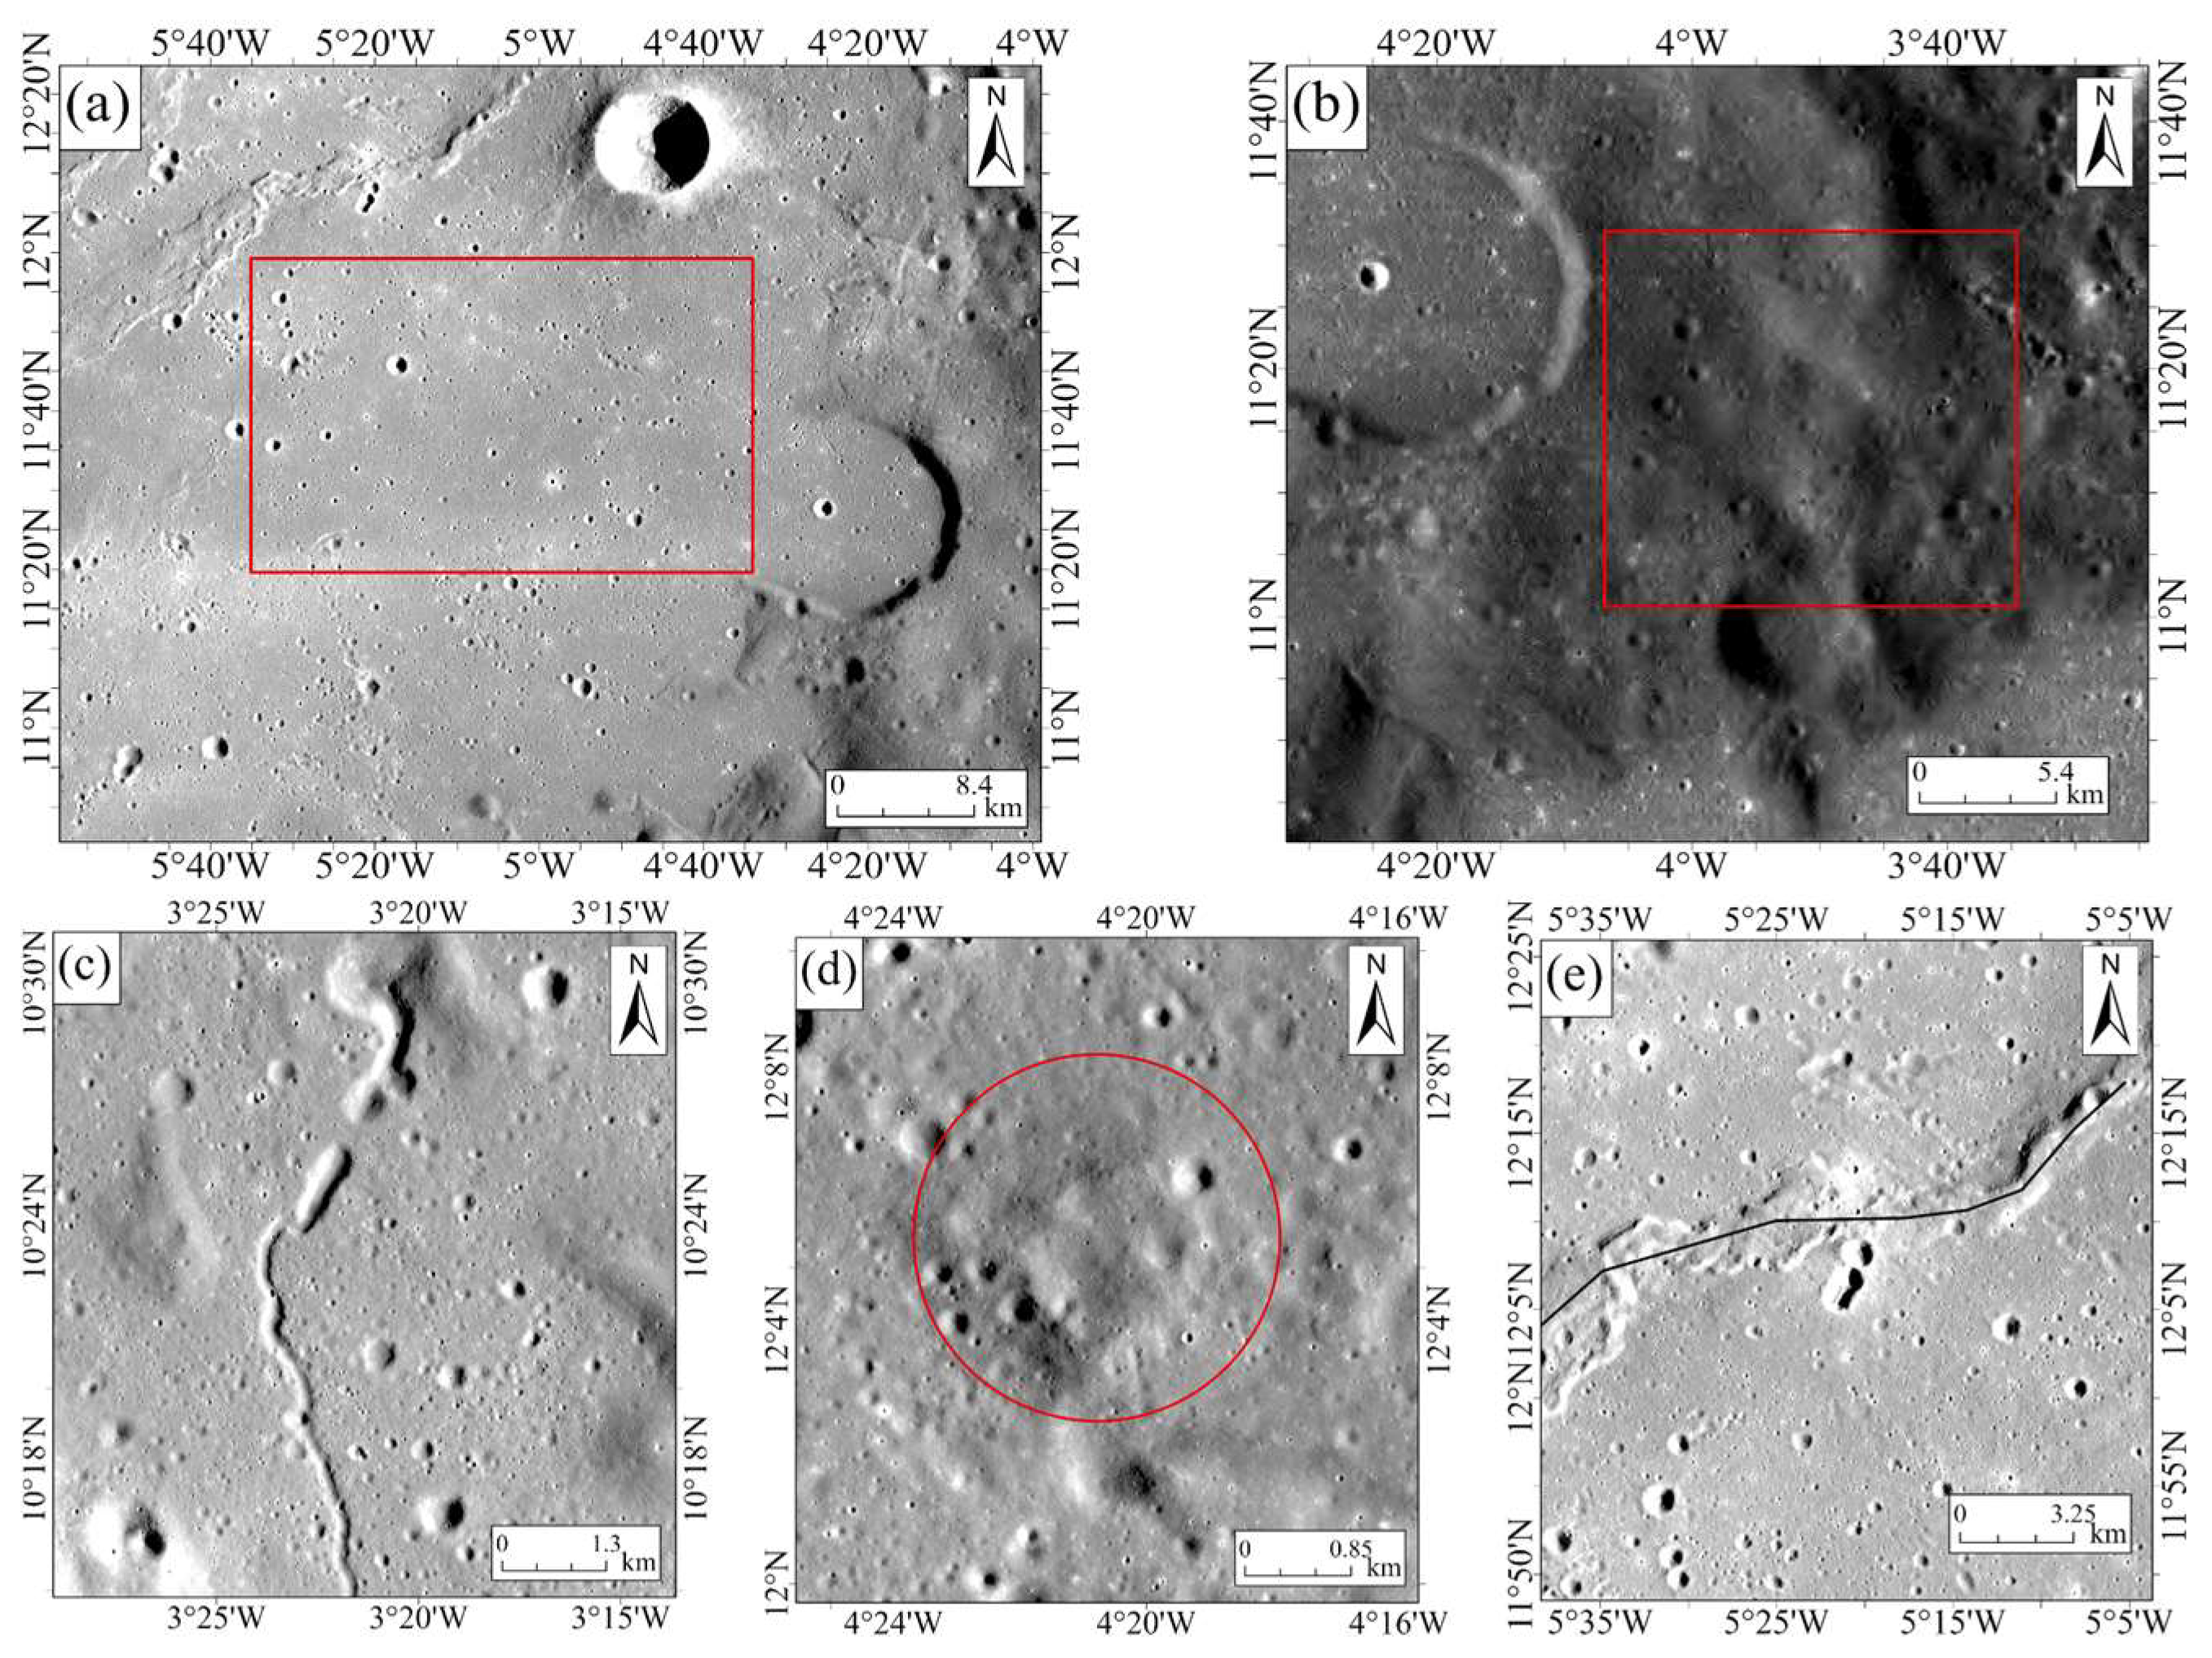
The geological and geomorphological characteristics of the lunar surface serve as a crucial window for understanding the Moon’s geological evolution [18,35]. In this study, we performed a detailed geomorphological analysis of the Rima Bode using Kaguya TC data (Figure 5).
(1) Wrinkle Ridges: Wrinkle ridges are common linear features on the lunar surface [36,37], mainly distributed in maria. Using Kaguya TC and SLDEM 2015 topographic data, four wrinkle ridges were identified within the Rima Bode (Figure 5 and Figure 6). Two of these ridges (indicated in blue) were previously reported by Yue et al. [36] and Thompson et al. [38], whereas the remaining two ridges (indicated in red) are newly identified in the present study (Figure 5).
(2) Sinuous Rilles: Lunar Rilles are the products of effusive volcanism, generally formed as lava flows erode the lunar surface [2,39]. In Rima Bode, four lunar rilles have been identified (Figure 5). Each rille originates from a distinct head depression (Figure 6c), which is interpreted as the potential source vent of effusive lava eruptions [40].
(3) Domes: As an important volcanic landform on the Moon, lunar domes offer key insights into eruptive styles, magma source properties, and emplacement mechanisms of lunar volcanism [41]. By combining Kaguya TC with SLDEM 2015 elevation data, this study newly identified five lunar domes within the Rima Bode (Figure 5 and Figure 6d).
(4) Pyroclastic Deposits: Pyroclastic deposits are interpreted as products of explosive volcanic eruptions [2,10]. In the Rima Bode, these deposits are described as regional pyroclastic deposits [8] that display an arcuate distribution at the junction of the highlands and mare (Figure 5 and Figure 6b).
(5) Basalts: The basalts in the Rima Bode are primarily distributed in Region II and the Region III. Quantitative analysis based on SLDEM 2015 elevation data indicates that the average elevation of Region II is approximately −1057.56 m, while that of Region III is about −901.22 m (Figure 7). To clearly illustrate this topographic separation, Profile A–A′ was chosen because it crosses the boundary between Region II and Region III, where a marked elevation difference occurs (Figure 7). This profile demonstrates that the two regions are topographically separated and represent distinct geomorphological units (Figure 7). Such spatial differentiation suggests that Region II and Region III may have formed as independent basaltic units.

3.2. Composition of the Rima Bode

3.2.1. Spectral Properties

Understanding the composition of the basalts and the pyroclastic deposits in the Rima Bode is one of the primary objectives of this study. To address this, based on Moon Mineralogy Mapper (M3) data, we analyzed the spectral characteristics of the study region (Figure 8, Table 1).
Figure 8 and Table 1 show that the band centers of Region I range from approximately 1079 to 1105 nm at 1000 nm, and from 1917 to 1986 nm at 2000 nm (Figure 8). The average band centers are 1095.47 nm (at 1000 nm) and 1985.14 nm (at 2000 nm), respectively (Table 1). Notably, when compared with basalts, the pyroclastic deposits exhibit longer band centers at 1000 nm and shorter band centers at 2000 nm. This characteristic is consistent with the observations of Horgan et al. [27] in their study of pyroclastic deposits on the Aristarchus Plateau. Furthermore, Horgan et al. [27] suggested that this phenomenon may be attributed to the higher abundance of volcanic glass within the deposits.
Furthermore, analysis of the spectral sampling points locations of the Region I (Figure 1), reveals that the 1-μm absorption band center shifts toward shorter wavelengths, while the 2-μm band center shifts toward longer wavelengths, with increasing distance from the western boundary of Sinus Aestuum. Jawin et al. [42] observed a similar phenomenon in pyroclastic deposits within Oppenheimer crater, interpreting it as reflecting variations in deposit thickness. Specifically, the deposits are thicker near the source region and thinner at the distal edge, resulting in a shift in the band center of the 1-μm toward shorter wavelengths and a shift in the band center of the 2-μm toward longer wavelengths [42].
The absorption centers of Region II at 1000 nm range from ~960–997 nm, and at 2000 nm range from ~2102 nm to 2204 nm (Figure 8), with average absorption centers of 975.58 nm (1000 nm) and 2164.90 nm (2000 nm), respectively (Table 1). The absorption centers of Region III at 1000 nm range from ~958–991 nm, and at 2000 nm range from ~2068 nm to 2164 nm (Figure 8), with average absorption centers of 969.8 nm (1000 nm) and 2124.71 nm (2000 nm), respectively (Table 1). Based on these band center positions (Figure 8), both Region II and Region III are classified as Pigeonite. However, Liu et al. [43] demonstrated that higher Ca content in mafic minerals causes the 2-μm band center to shift toward longer wavelengths. The systematically longer 2-μm band positions in Region II (~2165 nm) compared to Region III (~2125 nm) indicate that Region II contains mafic minerals with higher Ca content, suggesting a more highly evolved composition. These significant spectral and compositional differences demonstrate that Region II and Region III represent two distinct basaltic units rather than a single homogeneous flow.
It should be noted that the band centers of Region IV range from ~1011 to 1049 nm at 1000 nm, and from ~2238 to 2320 nm at 2000 nm (Figure 8), with average values of 1030.79 nm and 2279.78 nm, respectively. These spectral characteristics differ markedly from Region I pyroclastic deposits but match the diagnostic absorption features of mafic minerals in basaltic rocks. Therefore, we conclude that Region IV is compositionally basaltic, not pyroclastic as previously suggested by Pigue et al. [6].

3.2.2. Chemical Composition

The Rima Bode is surrounded by several large craters (Figure 1), indicating that the region may have been affected by impact events. To minimize the effects of ejecta and more accurately characterize FeO and TiO2 content in the study area, different processing methods were applied to different geological units: For basaltic regions, following the method of Xu et al. [44], TiO2 and FeO contents were extracted within 1–1.5 crater radii around small fresh craters (Figure 1 and Figure 4) to determine the average TiO2 and FeO contents of the basalts; For pyroclastic deposit regions, regions with the lowest reflectance were selected based on the R750 nm reflectance imagery to determine their TiO2 and FeO contents (Table 1).
Region I has FeO and TiO2 contents of 21.6 wt.% and 10.7 wt.%, respectively (Table 1), characterizing it as a high-FeO, high-TiO2 pyroclastic deposit. Its compositional resemble that of pyroclastic deposits collected during the Apollo 17 mission (Figure 9). In the basaltic region, Region IV shows the highest FeO (20.72 wt.%) and TiO2 (8.1 wt.%) contents; Region II follows (FeO: 15.88 wt.%, TiO2: 4.06 wt.%); while Region III exhibited the lowest content (FeO: 15.32 wt.%, TiO2: 2.73 wt.%). Comparisons with Apollo, Luna, and CE series lunar samples indicate that the chemical compositions of Regions II, III, and IV most closely resemble those of Luna 16, Apollo 14, and Apollo 11 samples (Figure 9), respectively. Notably, there are significant differences in FeO and TiO2 contents between Region II and Region III, with differences of 2.12 wt.% and 1.83 wt.%, respectively. This difference further indicates that the basaltic volcanic activity history of the two regions is significantly different.

3.3. Thickness Estimation of Basalts and Pyroclastic Deposits

This study employed the method proposed by Qian et al. [45], which utilizes TiO2 content and Kaguya TC data to identify penetrating and non-penetrating craters (Figure 10). Combined with the methodology described in Section 2.2, we provided the first estimates of the thicknesses of both the basalt and pyroclastic deposits in the region.

3.3.1. Estimation of Pyroclastic Deposits Thickness

Before estimating the thickness of the pyroclastic deposits, it is necessary to determine their spatial distribution. Pyroclastic deposits exhibit extremely low reflectance at 750 nm [46] and characteristic spectral features such as a longer wavelength absorption center near 1000 nm and a shorter one near 2000 nm. This study mapped their distribution (Figure 1) using Clementine 750 nm reflectance data (Figure 10a) together with the 1 μm and 2 μm absorption band centers (Figure 10c,d).
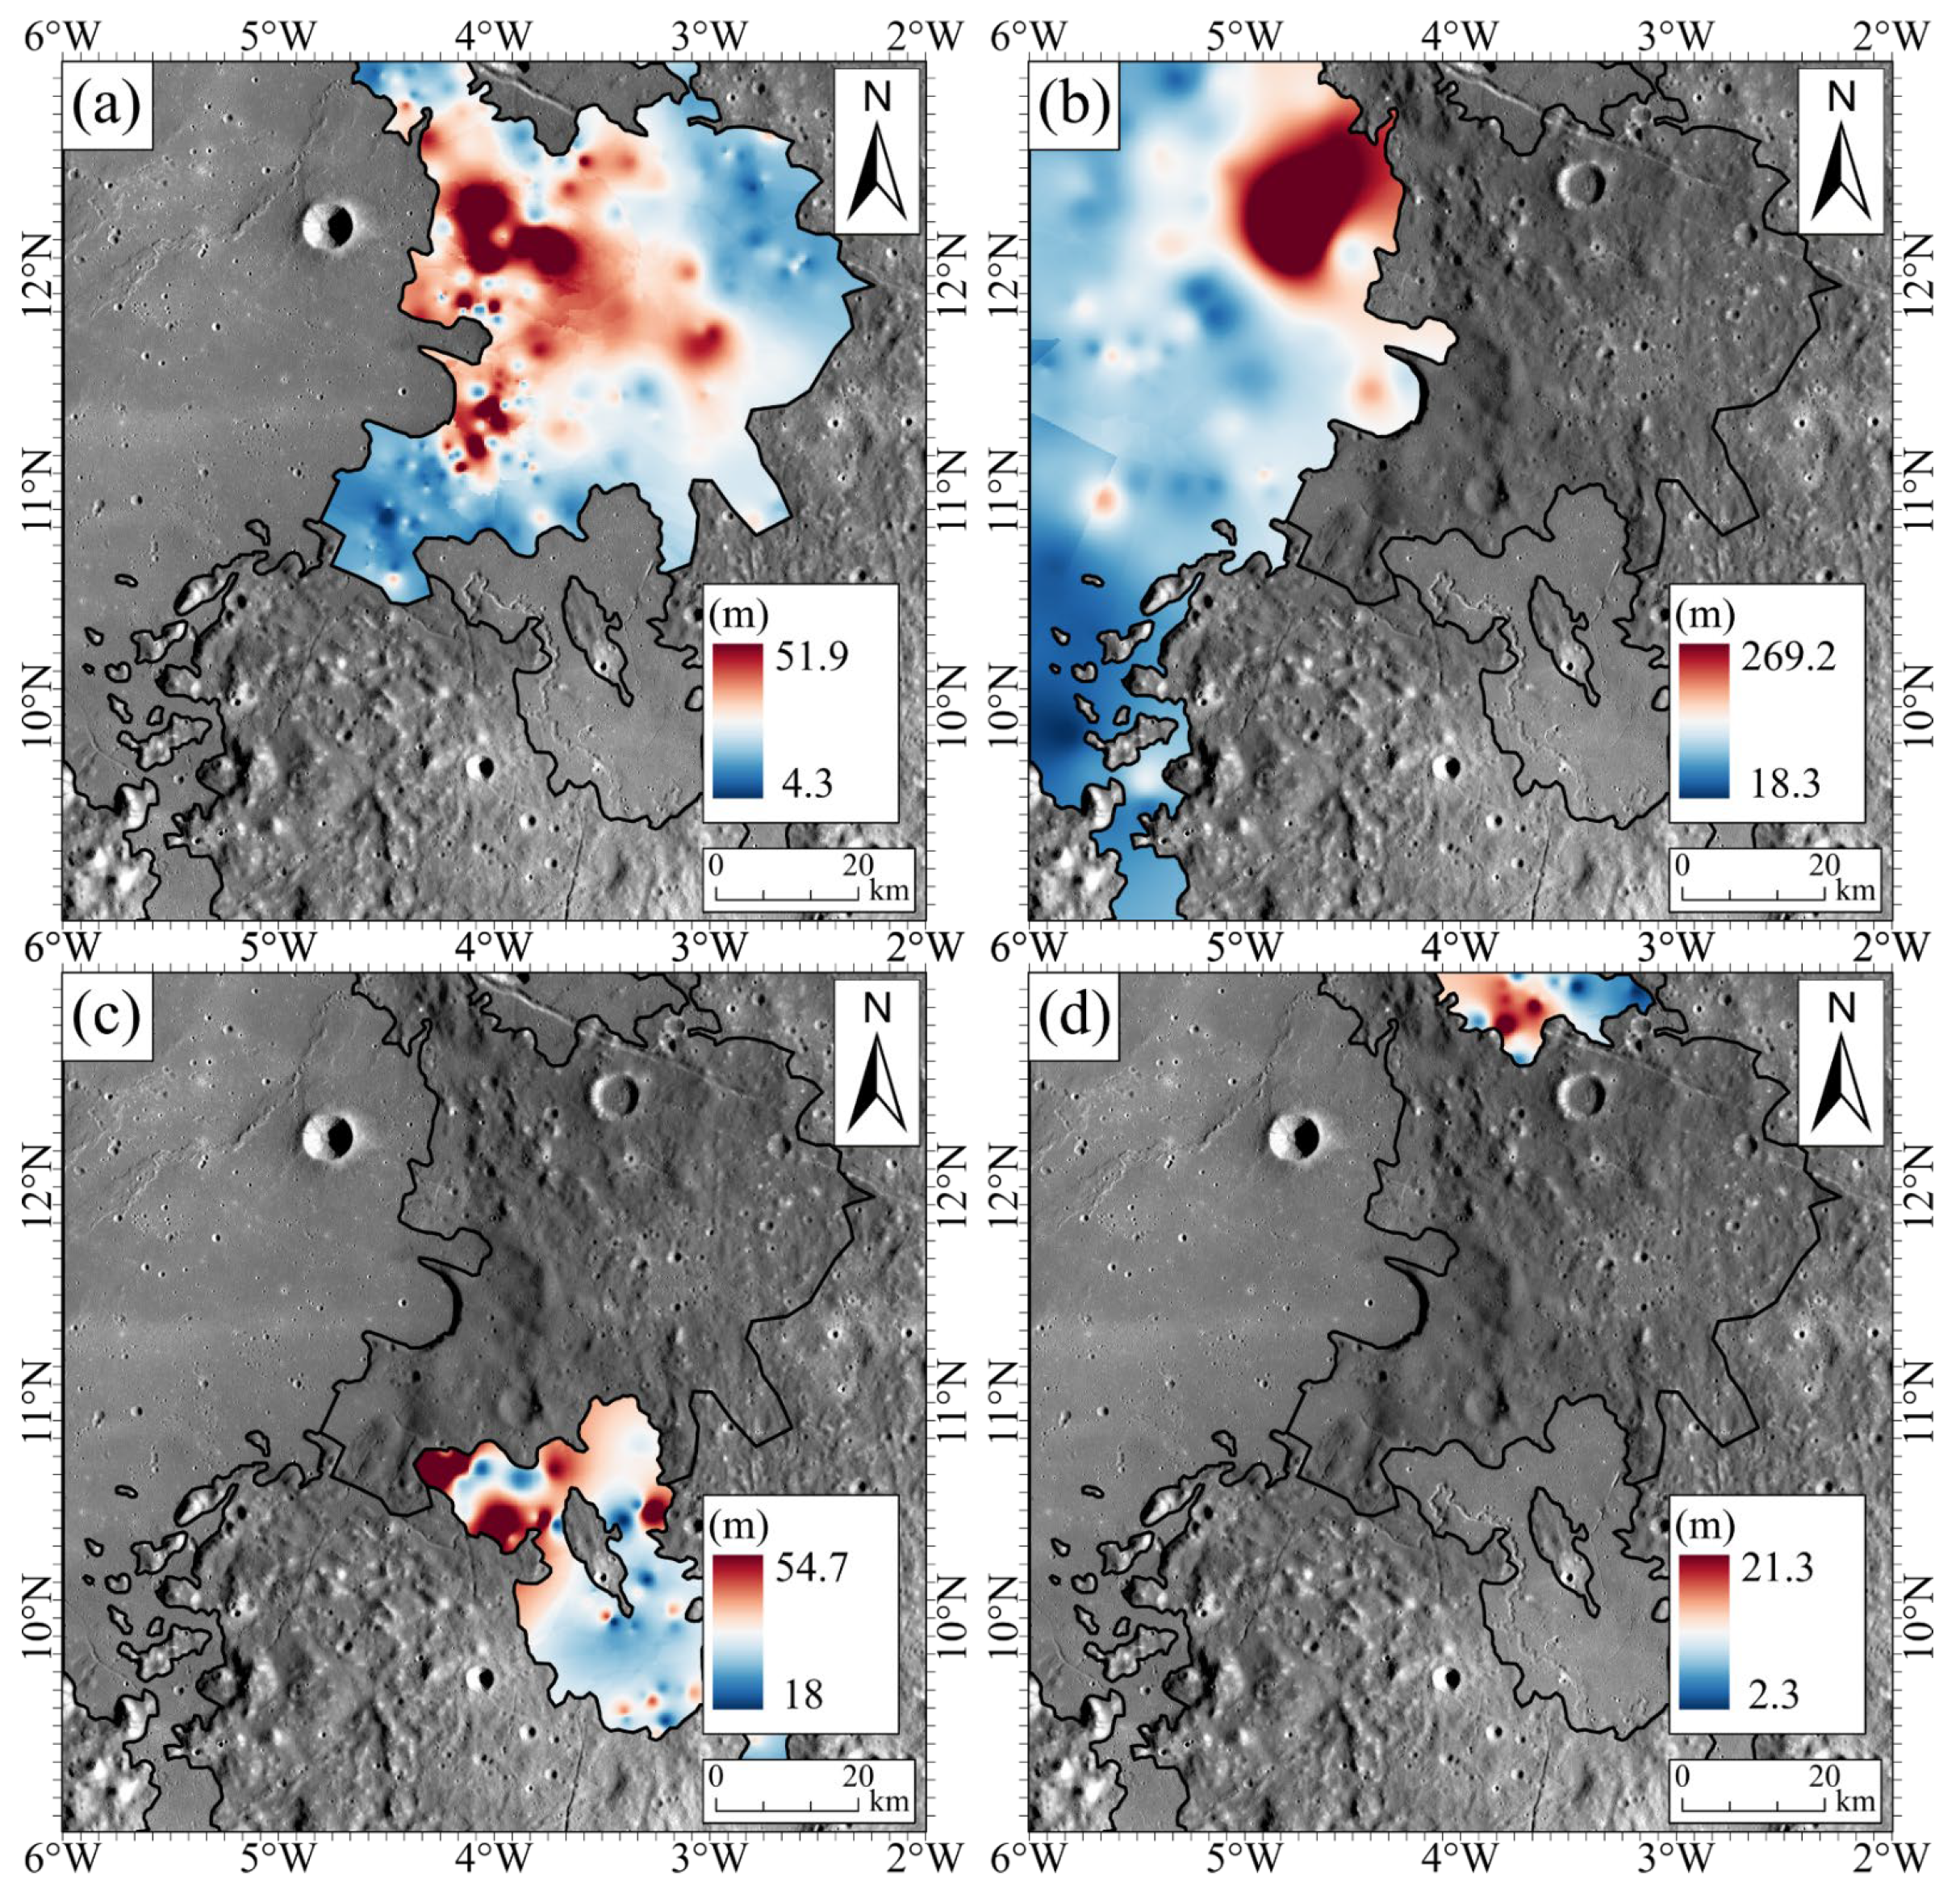
In Region I, 129 penetrating craters and 192 non-penetrating craters were identified (Figure 10b), and the average thickness of the pyroclastic deposits was calculated to be approximately 14.6 m (Figure 11). Figure 11 shows that the maximum thickness of the pyroclastic deposits occurs in the western part of Region I, with thickness decreasing eastward. This trend is consistent with the observations reported by Carter et al. [47] based on ground-based radar data for this region. Head and Wilson [2] suggested that pyroclastic deposits are generally thicker near their source regions and thin with increasing distance from the source. Based on these observations, it is inferred that the source region of the pyroclastic deposits in this area may be located within the Sinus Aestuum basin (Region II), which is now covered by basalt. This interpretation is supported by Gaddis et al. [8], who suggested, based on the spatial distribution characteristics of the pyroclastic deposits, that the source region was likely situated in the western part of the area and was subsequently buried by the basalts of Sinus Aestuum (Region II).

3.3.2. Estimation of Basalt Thickness

Using the same approach, a total of 24 penetrating craters and 142 non-penetrating craters were identified in the basaltic region.
The average thickness of basalt in Region II is approximately 63 m, with maximum thicknesses distributed in areas bordering Region I. The thickness decreases gradually decrease from north to south (Figure 11). Based on the SLDEM 2015 elevation data, the topography in this region also shows a gradual decrease from north to south (Figure 7c). SLDEM 2015 elevation data reveal that the regional topography exhibits the same declining trend, decreasing systematically from north to south. To illustrate this elevation trend, Profile B-B’ was selected to traverse Region II from north to south, clearly demonstrating the systematic topographic decrease (Figure 7). Furthermore, several volcanic landforms—such as Rilles, depressions, and domes—have been identified in northern part of Region II (Figure 5).
The average thickness of the basalt in Region III is approximately 28.2 m, with maximum thicknesses occurring in the northwest, near the head of Rima Bode. Overall, the basalt thickness shows a gradual thinning trend from northwest to southeast (Figure 11c). Elevation data for the region also indicate that the terrain gradually decreases in elevation from northwest to southeast. To represent this northwest-to-southeast elevation variation, Profile C-C′ was selected to traverse Region III, clearly demonstrating the systematic topographic decrease (Figure 7).
The average basalt thickness in Region IV is approximately 9.8 m, with the maximum thickness mainly distributed in the depression and near the rille, and gradually thinning toward the periphery (Figure 11d). The topography in this region also shows a trend of gradual decrease from the central area outward.

3.4. Microwave Thermophysical Properties of the Rima Bode

The CE-2 MRM data possess penetration detection capabilities, enabling the characterization of thermophysical properties within the corresponding depth range. It has been extensively applied in studies of lunar geology and thermophysical properties. However, from the perspective of spatial resolution, CE-2 MRM data have inherent limitations in resolving small-scale geological features due to their relatively low spatial resolution. At such scales, localized variations or small pyroclastic deposits cannot be clearly distinguished. Instead, the data are more suitable for identifying and analyzing regional-scale geological patterns. According to Gaddis et al. [8], the pyroclastic deposits in the Rima Bode are classified as regional pyroclastic deposits rather than localized pyroclastic deposits. Therefore, CE-2 MRM data are appropriate for investigating the spatial distribution of these regional pyroclastic deposits in this area.
Thus, this study utilizes MRM data to further analyze the TB behaviors in the Rima Bode (Figure 2 and Figure 3). Furthermore, statistical analysis of the TB values for Region I, Region II, Region III, and Region IV was performed (Table 2).
Based on a theoretical model, Hu et al. [48] suggested that regions with higher FeO and TiO2 contents exhibit relatively higher TB at noontime and lower TB at nighttime. Table 2 confirms this relationship for the basaltic regions: noontime TB is highest in Region II, followed by Region III, with Region IV lowest; at nighttime, this trend reverses. These results indicate that the TB behaviors of Region II, Region III, and Region IV are consistent with the theoretical simulation results proposed by Hu et al. [48].
However, compared with the above three regions (Region II, Region III and Region IV), Region I shows abnormal TB behaviors. According to theoretical simulations [48], this region should exhibit the highest TB behaviors at noontime, the lowest TB behaviors at nighttime. However, at the noontime, the TB behaviors in Region I is lower than that in Region II, which has lower FeO and TiO2 content, with differences of 1.9 K (3.0 GHz), 2.7 K (7.8 GHz), 6.2 K (19.35 GHz), and 8.0 K (37 GHz). At the nighttime, Region I exhibits higher TB behaviors than Region III, which has the lowest FeO and TiO2 contents, with differences of 2.4 K (3.0 GHz), 2.3 K (7.8 GHz), 3.8 K (19.35 GHz), and 5.3 K (37 GHz).
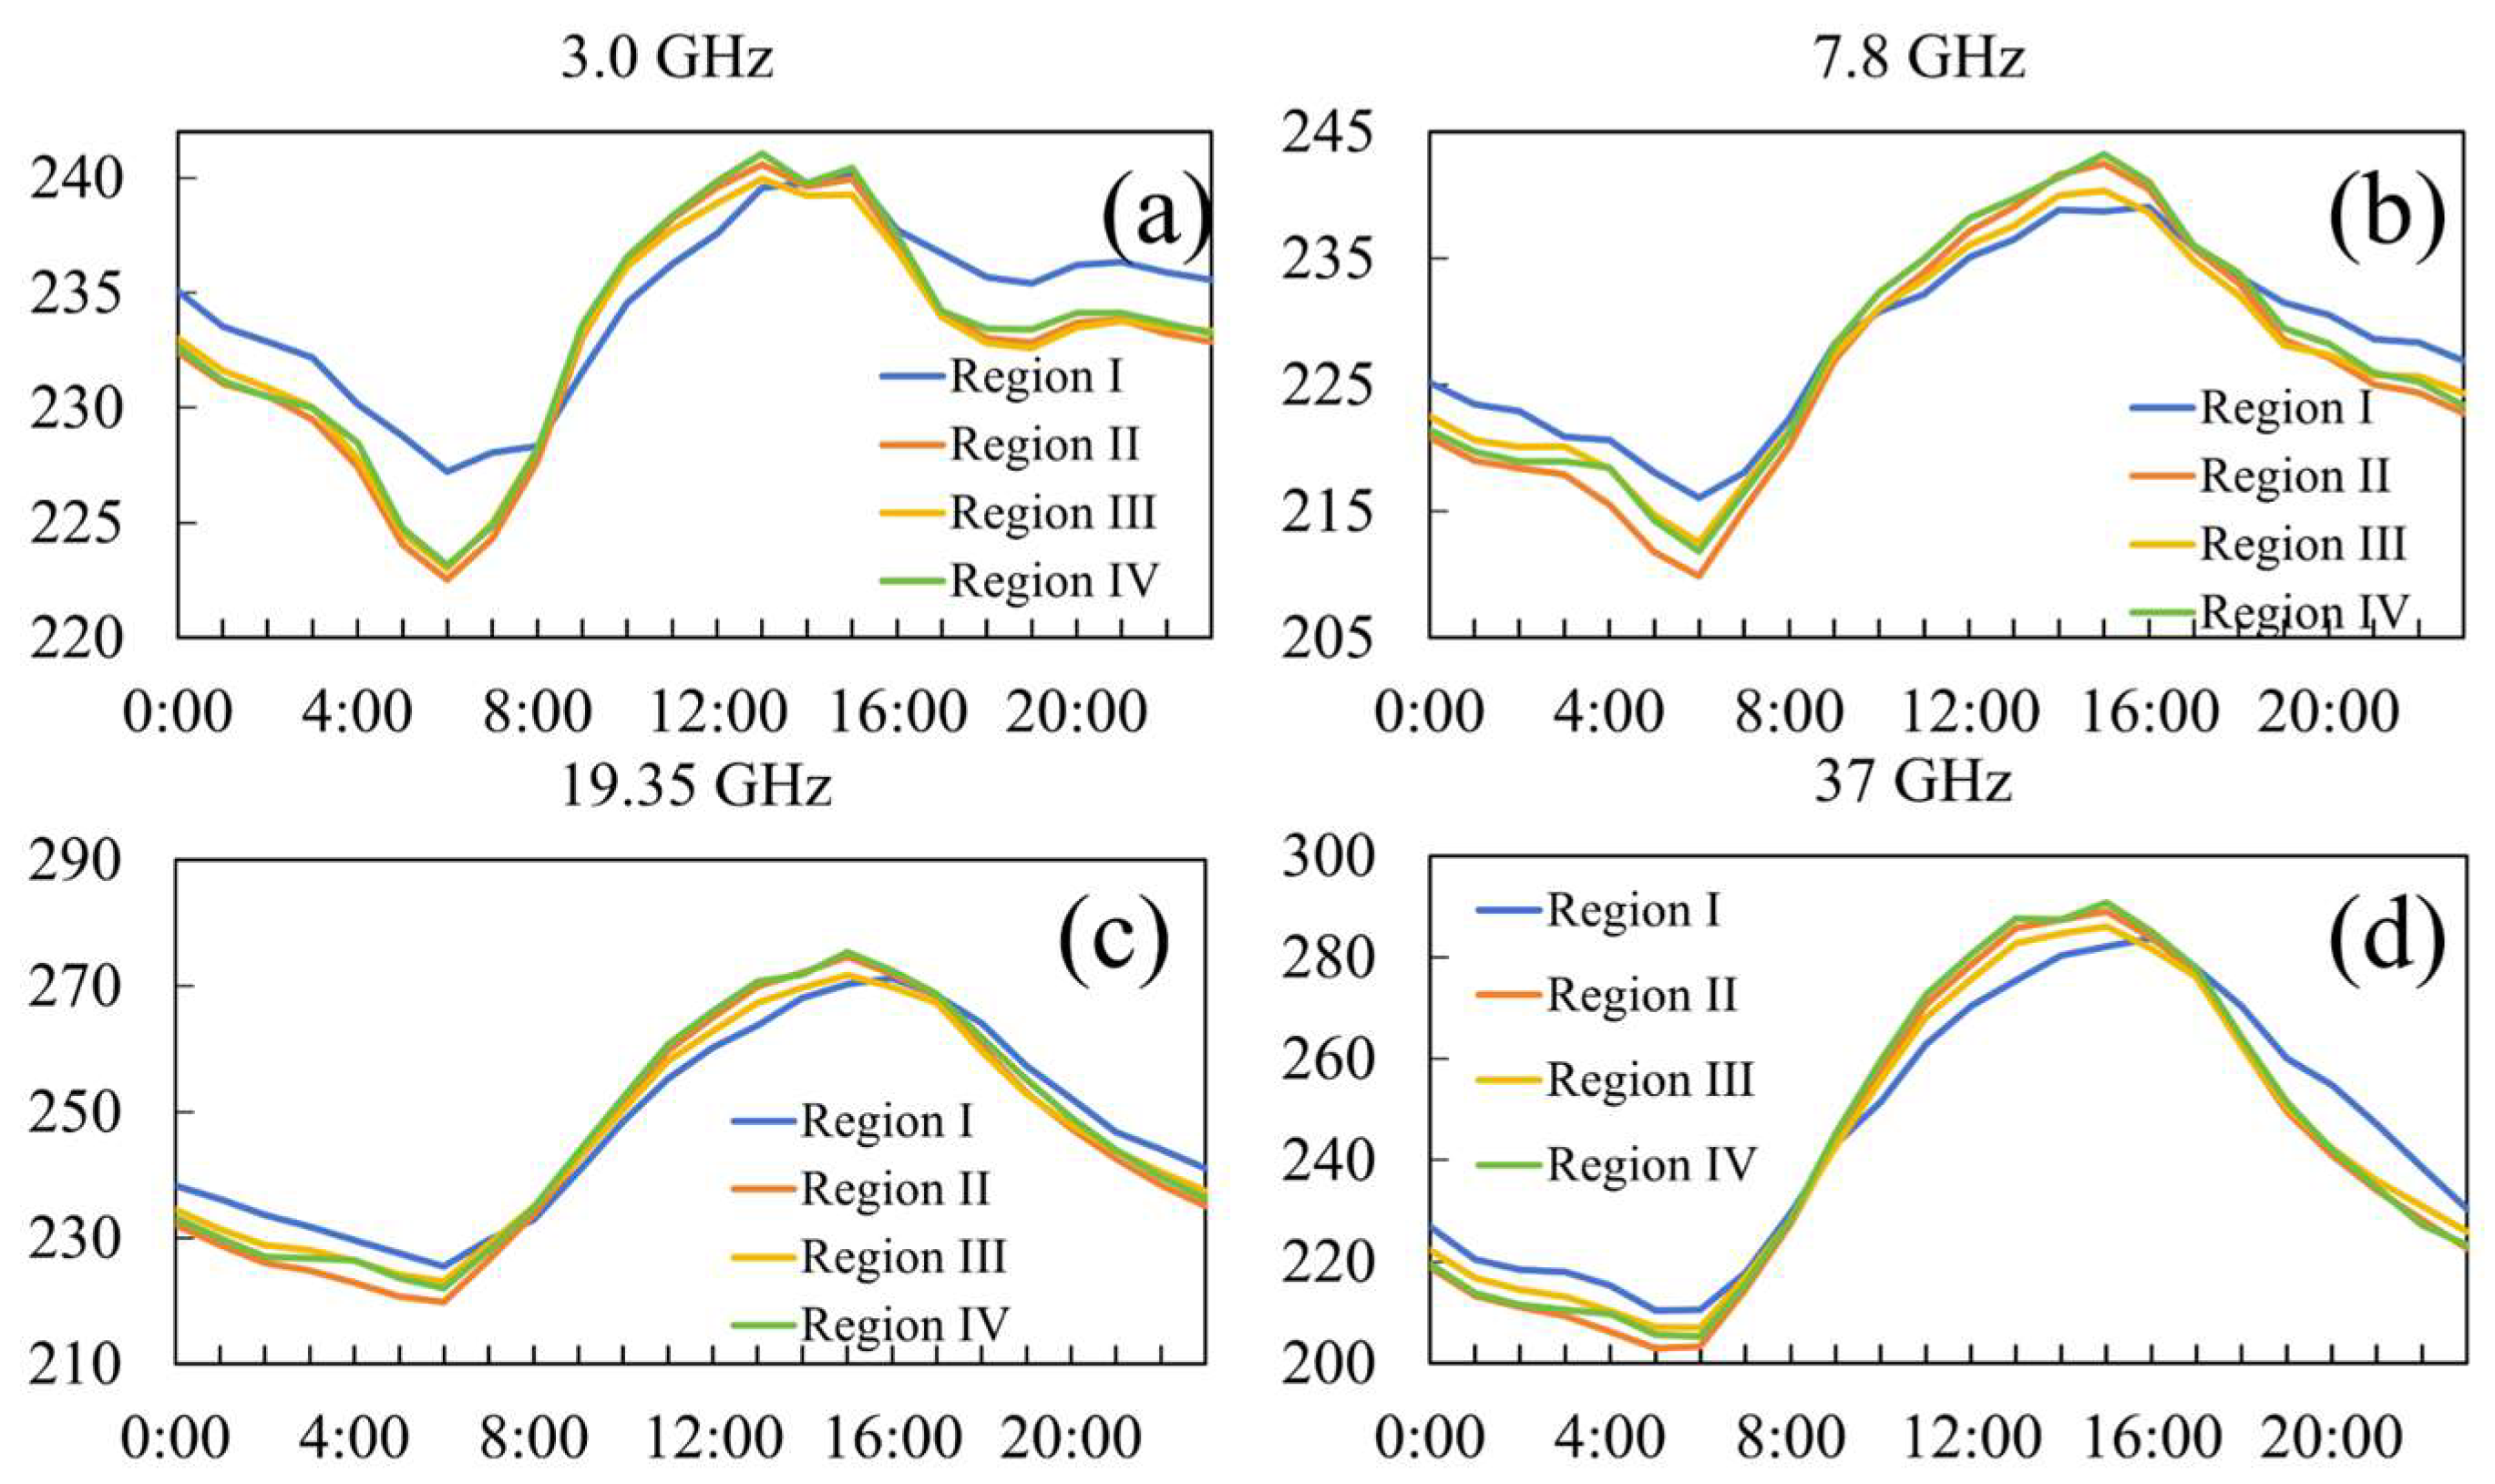
To investigate this anomaly, we examined 24-h TB variation curves (Figure 12). The TB behavior of Region I exhibits fundamental differences from the basaltic region: at noontime, Region I consistently maintains the lower TB than Regions II and IV, with a slow rate of increase; at night, Region I exhibits higher TB than all other regions, with a slow rate of decrease (Figure 12. This thermal pattern—characterized by sluggish diurnal TB response—is diagnostic of materials with high thermal inertia [49]. Since the basaltic units (Regions II, III, and IV) exhibit consistent TB variations that are closely correlated with their FeO and TiO2 contents, the abnormal TB behavior of Region I provides compelling evidence that the pyroclastic deposits possess significantly higher thermal inertia than the basaltic units, which dominates the thermophysical properties and masks the expected FeO and TiO2 effect.

3.5. Age of the Rima Bode

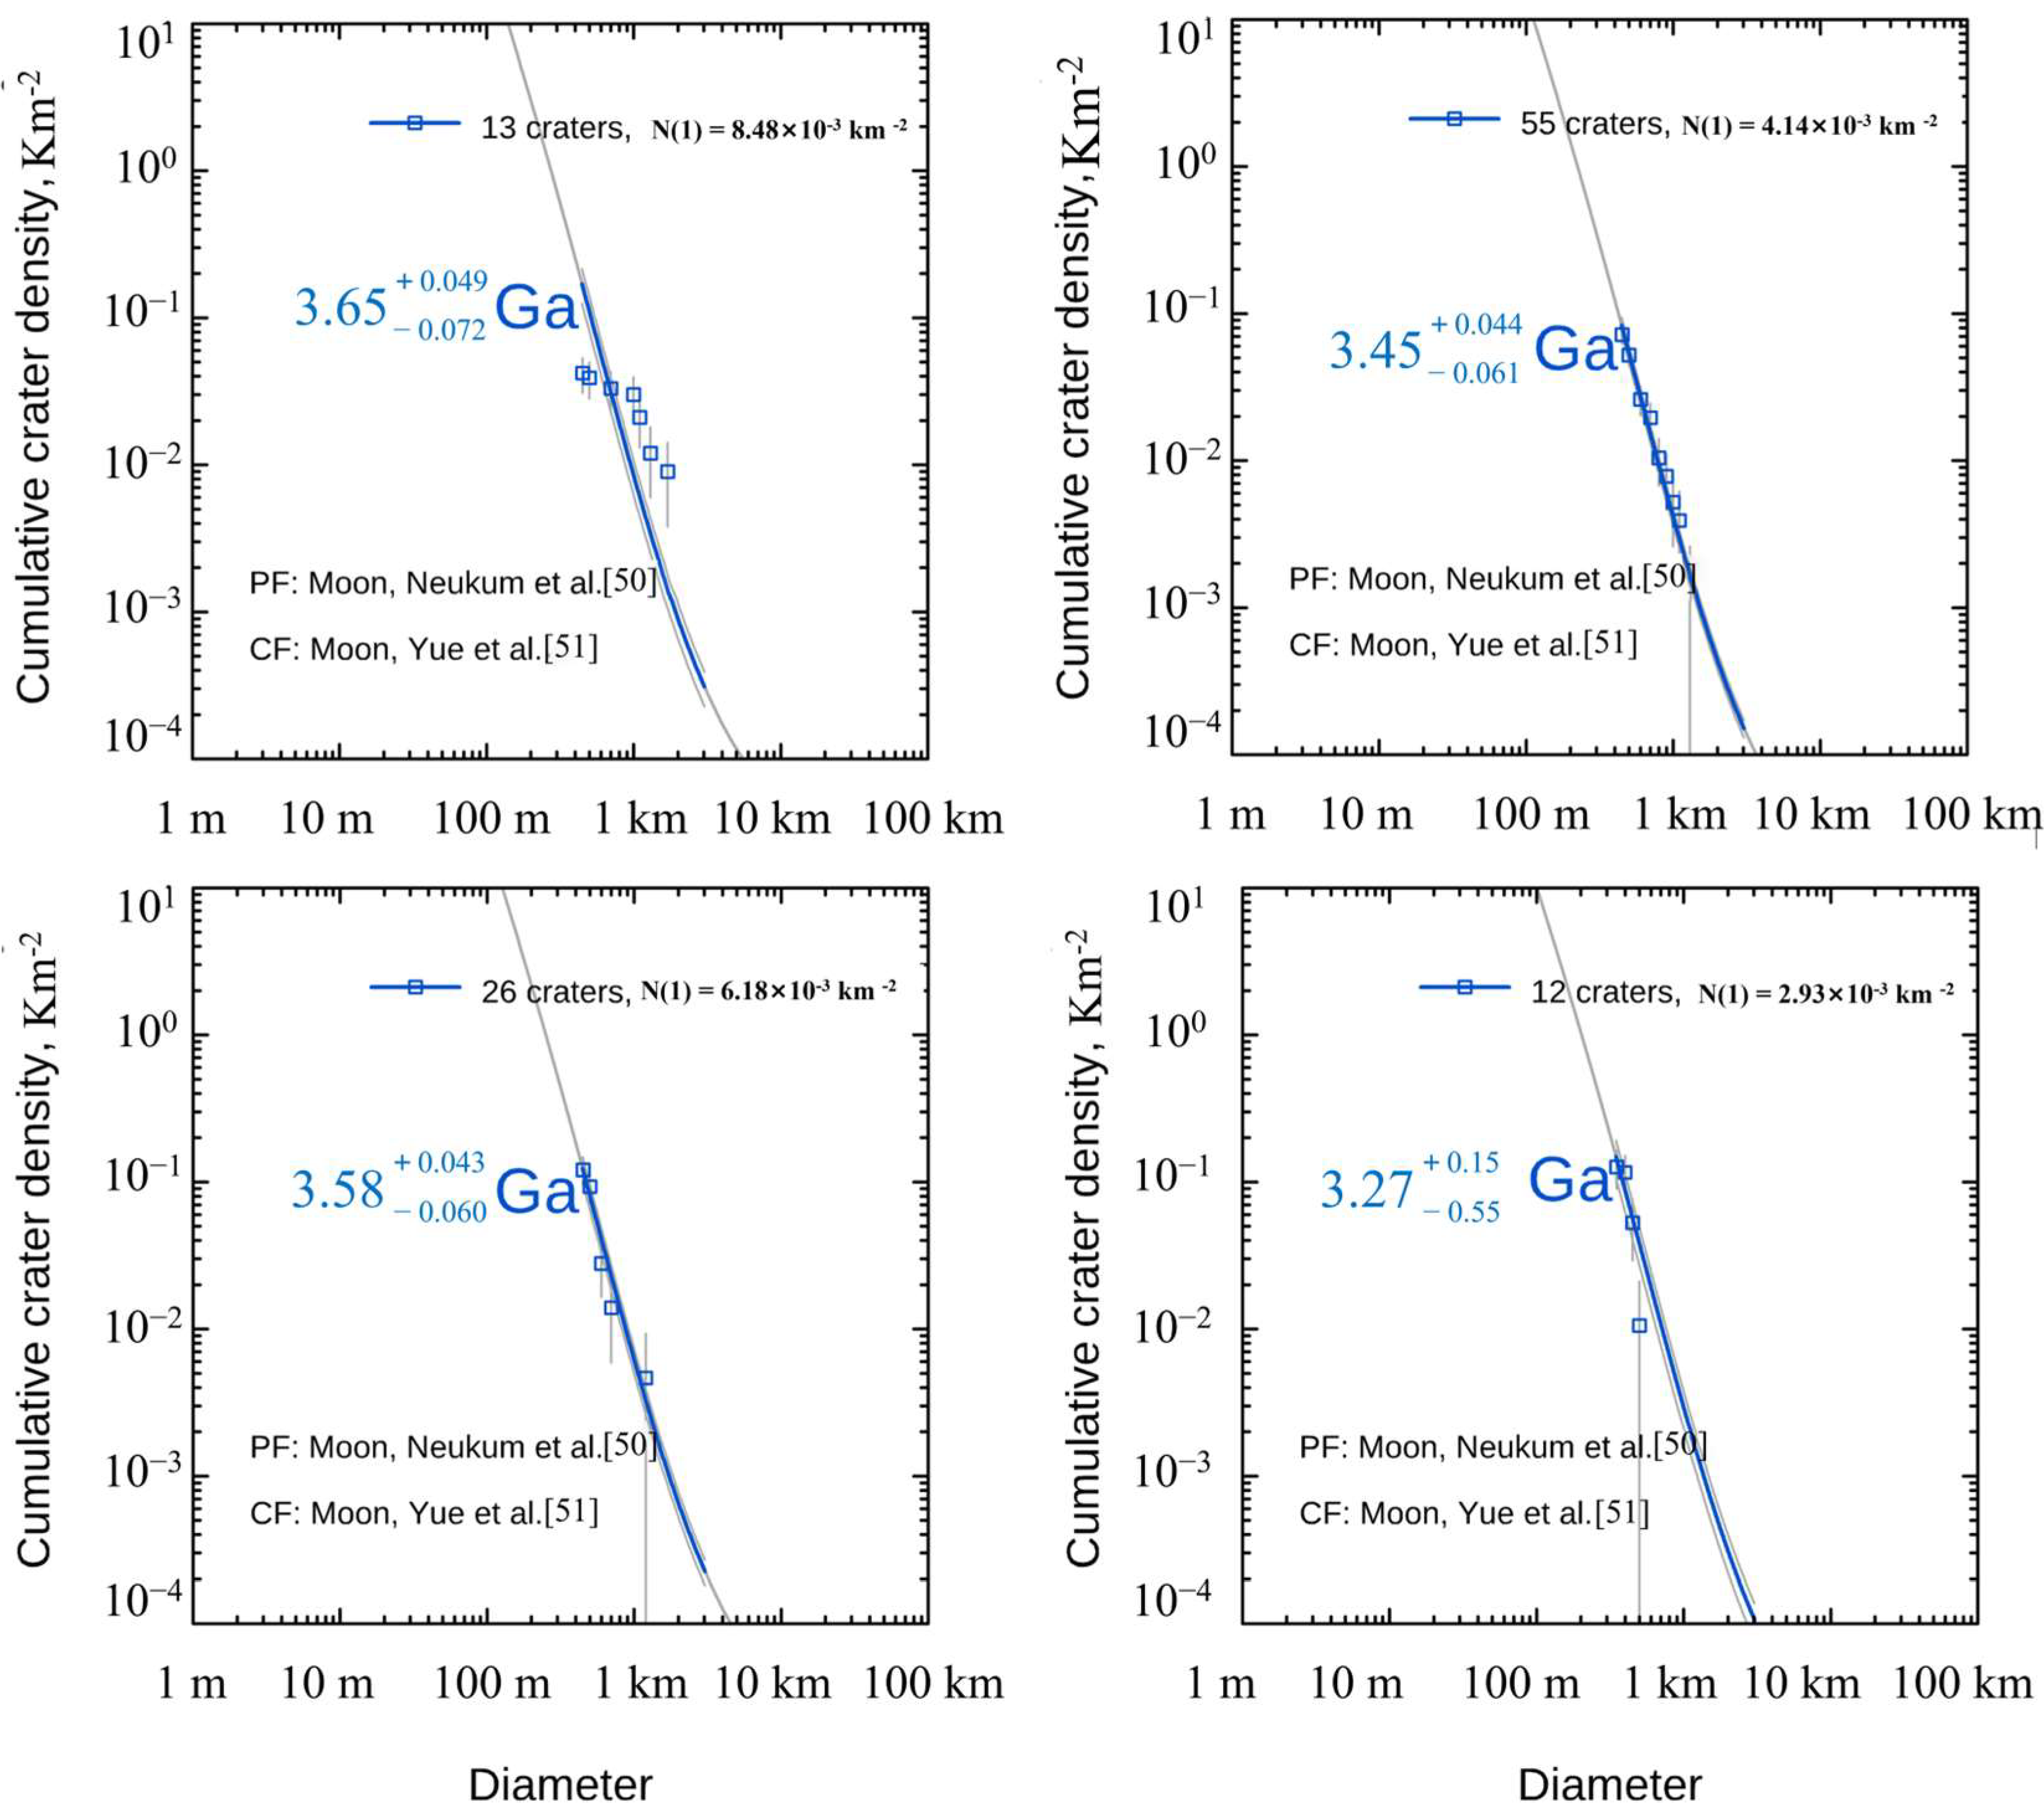
The CSFD method was used to obtain the Absolute Model ages (AMAs) of the Rima Bode (Figure 13). Figure 13 shows that the model ages of the Rima Bode range from 3.65 Ga to 3.27 Ga.
The age of Region I is 3.65 Ga (Figure 13a), which is the oldest region in the Rima Bode, consistent with the age (3.71 Ga) proposed by Hiesinger et al. [5]. The age of Region II is 3.45 Ga (Figure 13b), younger than the adjacent pyroclastic deposits (Region I). Based on stratigraphic superposition sequences, Gaddis et al. [8] and Hiesinger et al. [5] also proposed that the age of this region is younger than the pyroclastic deposits (Region I). The age of Region III is 3.58 Ga (Figure 13c), younger than the adjacent pyroclastic deposits (Region I) but older than Region II. The age of Region IV is 3.27 Ga, making it the youngest region in the Rima Bode.
Importantly, the geochronological data reveal systematic compositional variations among the basaltic units (Regions II, III, IV). Younger units exhibit higher TiO2 and FeO contents: Region IV (youngest) has the highest abundances, followed by Region II, with Region III (oldest basalt) showing the lowest values. This trend is also reflected in spectral characteristics: younger basalts display longer wavelength absorption band centers at both 1 μm and 2 μm. According to Liu et al. [43], longer 2-μm band positions indicate higher Ca content in pyroxene, while longer 1-μm positions reflect higher Fe content, indicating that the content of Ca and Fe in basalts is gradually decreasing with the increase in age.

4. Discussion

The primary geological processes in the Rima Bode include volcanism and exogenic impact processes.
Based on previous research, at ~3.85 Ga, the ejecta from the Mare Imbrium impact event formed the original Fra Mauro Formation in the Rima Bode [26]. The impact event that formed the Imbrian Basin significantly thinned and altered the original lunar crust, potentially acting as a booster to release underlying magma [2,10]. Subsequently, volcanism dominated the geological evolution of the Rima Bode.
The first episode occurred at 3.65 Ga (Figure 13a). As the dike ascended to the lunar surface, a large amount of volatiles accumulated on its top, and the lunar vacuum environment and pressure release caused explosive volcanism [2]. This produced the pyroclastic deposits in the Rima Bode, with the volcanic source probably located within the Sinus Aestuum Basin. This pyroclastic deposit, with an average thickness of ~14.6 m, exhibits high FeO (21.6 wt.%) and TiO2 (10.7 wt.%) contents, is rich in volcanic glass. Notably, microwave thermal analysis reveals these deposits possess significantly higher thermal inertia than the surrounding basalts. The pyroclastic unit overlies the Fra Mauro Formation, forming a low-albedo pyroclastic deposit unit within the study region.
As the remaining magma contained lower levels of volatile components, explosive volcanism transitioned to effusive volcanism [2]. Lava flows filled the impact basin and topographic depressions to form basalt plains.
The second episode (~3.58 Ga, Figure 13c) occurred in Region III, forming the primary basaltic unit in this region. The source for this phase of basaltic volcanism was located in the northern part of Region III, as evidenced by the northwest-to-southeast thinning trend in both basalt thickness and topography (Figure 7d and Figure 11c), indicating magma flowing from northwest to southeast. This episode emplaced low-titanium basalt of Imbrian period, averaging ~28.2 m in thickness, with FeO and TiO2 contents of 15.32 wt.% and 2.73 wt.%, respectively. The dominant mafic mineral is pigeonite with intermediate Ca content.
The third episode occurred at ~3.45 Ga (Figure 13b), forming Region II. The volcanic source for this episode of basaltic volcanism is located in the northern part of Region II, with the north-to-south decrease in basalt thickness and elevation (Figure 7 and Figure 11) supporting a magma flow direction from north to south,, ultimately forming the low-titanium basalt of the Imbrian period with an average thickness of approximately 63 m. The primary mafic mineral in the basalts of this episode remains pigeonite, but compared to the second volcanic activity, the Ca content in the pigeonite has increased.
At ~3.27 Ga, the last basaltic volcanism occurred in Rima Bode, forming Region IV. The magma in this phase flowed along both sides of the rille. The distribution of maximum basalt thickness in the center (along the rille and depressions) that thins outward (Figure 11d) suggests that the lava flowed from these central areas toward the periphery. Where lava encountered topographic depressions, such as impact craters or tectonic basins, it ponded to form “lava pools” [2], creating the distinctive morphology of Region IV. thereby shaping the geomorphic features of Region IV. The basalts in this region belong to high-titanium basalts of the Imbrian period, with a thickness of ~9.8 m. The mafic minerals in this period of basalt are Fe-rich and high-Ca pyroxene, which has the highest Ca content.

5. Conclusions

This study utilized multiple remote sensing datasets to systematically analyze the geomorphological characteristics, composition, thickness distribution, thermophysical properties, and chronology of the Rima Bode region, thereby reconstructing its geological evolution history. The main conclusions are as follows:
(1) Based on compositional characteristics, this study re-understands the distribution of basalts and pyroclastic deposits in the Rima Bode region, dividing the basaltic region into three distinct units: Regions II, III, and IV. On that basis, we further analyzed the model ages of the Rima Bode region, revealing that volcanism lasted for about 0.38 Ga, with at least four distinct episodes of volcanism.
(2) Based on high-resolution images and previous studies, this research has identified typical volcanic landforms such as wrinkle ridges, sinuous rilles, domes, basalts, and pyroclastic deposits. Meanwhile, by combining elevation data, this study further inferred the locations of magmatic sources and magma flow directions, providing a systematic and comprehensive framework for understanding the evolutionary history of volcanism in this region.
(3) Based on MRM data, we identified abnormal TB behaviors in the pyroclastic deposit region (Region I): relatively low TB behaviors during noontime and higher TB behaviors at nighttime. Further investigation revealed that the cause of this anomaly is the high thermal inertia of the pyroclastic deposits.
These results significantly enhance the understanding of the geological evolution of Rima Bode, providing a more detailed geological context for this region.

Author Contributions

Conceptualization, Z.M.; methodology, W.C. and Z.M.; software, Z.M. and R.B.; validation, Q.Z., X.Z. and Y.X.; formal analysis, Z.M. and R.B.; data curation, W.C. and Z.M.; writing—original draft preparation, W.C. and Z.M.; writing—review and editing, Z.M., R.B., Y.Z. (Yuanzhi Zhang) and Y.Z. (Yongchun Zheng); visualization, Y.Z. (Yuanzhi Zhang); supervision, Q.Z. and Y.Z. (Yongchun Zheng); project administration, Z.M.; funding acquisition, Z.M. All authors have read and agreed to the published version of the manuscript.

Funding

This work was supported in part by the National Key R&D project of China under Grant 2021YFA0715104, in part by the National Natural Science Foundation of China under Grant 42071309,in part by the Science and Technology Development Fund of Macau under Grant 0034/2024/AMJ, and in part by the open project fund of State Key Laboratory of Lunar and Planetary Sciences (Macau University of Science and Technology) (the Science and Technology Development Fund (FDCT) of Macau (No. 002/2024/SKL)).

Data Availability Statement

The LROC WAC images are from https://wms.lroc.asu.edu/lroc/search (accessed on 10 September 2025); the SLDEM 2015 elevation data comes from http://imbrium.mit.edu/DATA/SLDEM2015/GLOBAL/JP2/ (accessed on 2 September 2025); the Moon Mineralogy Mapper data were downloaded from https://ode.rsl.wustl.edu/moon/mapsearch (accessed on 10 October 2025); the MRM data were downloaded from http://124.17.81.212:8081/moondata/web/datainfo/main.action# (accessed on 16 September 2025); the chemical elements data were downloaded from https://figshare.com/articles/dataset/lunar_surface_chemistry_maps/24081438 (accessed on 1 September 2025), and the Kaguya MI and TC data were downloaded from https://ode.rsl.wustl.edu/moon/mapsearch (accessed on 16 August 2025).

Acknowledgments

The authors would like to express their gratitude to all those who helped with this work.

Conflicts of Interest

The authors declare no conflicts of interest.

References

  1. Neal, C.R.; Taylor, L.A. Petrogenesis of Mare Basalts: A Record of Lunar Volcanism. Geochim. Cosmochim. Acta 1992, 56, 2177–2211. [Google Scholar] [CrossRef]
  2. Head, J.W.; Wilson, L. Generation, Ascent and Eruption of Magma on the Moon: New Insights into Source Depths, Magma Supply, Intrusions and Effusive/Explosive Eruptions (Part 2: Predicted Emplacement Processes and Observations). Icarus 2017, 283, 176–223. [Google Scholar] [CrossRef]
  3. Shearer, C.K.; Hess, P.C.; Wieczorek, M.A.; Pritchard, M.E.; Parmentier, E.M.; Borg, L.E.; Longhi, J.; Elkins-Tanton, L.T.; Neal, C.R.; Antonenko, I. Thermal and Magmatic Evolution of the Moon. Rev. Mineral. Geochem. 2006, 60, 365–518. [Google Scholar] [CrossRef]
  4. Wilhelms, D.E.; McCauley, J.F. Geologic Map of the Near Side of the Moon; US Geological Survey: Reston, VA, USA, 1971.
  5. Hiesinger, H.; van Der Bogert, C.H.; Wedler, A.; Jaumann, R.; Mall, U.; Head, J.W.; Anand, M.; Jolliff, B.; Pinet, P.; Xiao, L. The Rima Bode Region-Absolute Model Ages of a Candidate Future Lunar Landing Site. In Proceedings of the 53rd Lunar and Planetary Science Conference, Woodlands, TX, USA, 7–11 March 2022; p. 2169. [Google Scholar]
  6. Pigue, L.M.; Bennett, K.A.; Horgan, B.H.; Gaddis, L.R. Relationship between Explosive and Effusive Volcanism in the Montes Apenninus Region of the Moon. J. Geophys. Res. Planets 2023, 128, e2023JE007861. [Google Scholar] [CrossRef]
  7. Jolliff, B.L.; Gillis, J.J.; Haskin, L.A.; Korotev, R.L.; Wieczorek, M.A. Major Lunar Crustal Terranes: Surface Expressions and Crust-mantle Origins. J. Geophys. Res. Planets 2000, 105, 4197–4216. [Google Scholar] [CrossRef]
  8. Gaddis, L.R.; Staid, M.I.; Tyburczy, J.A.; Hawke, B.R.; Petro, N.E. Compositional Analyses of Lunar Pyroclastic Deposits. Icarus 2003, 161, 262–280. [Google Scholar] [CrossRef]
  9. Ji, J.; Guo, D.; Liu, J.; Chen, S.; Ling, Z.; Ding, X.; Han, K.; Chen, J.; Cheng, W.; Zhu, K. The 1:2,500,000-Scale Geologic Map of the Global Moon. Sci. Bull. 2022, 67, 1544–1548. [Google Scholar] [CrossRef]
  10. Zhao, Z.; Chen, J.; Ling, Z.; Lu, X.; Li, Z. Chronology, Composition, and Mineralogy of Mare Basalts in the Junction of Oceanus Procellarum, Mare Imbrium, Mare Insularum, and Mare Vaporum. Icarus 2023, 397, 115531. [Google Scholar] [CrossRef]
  11. Weitz, C.M.; Head, J.W., III.; Pieters, C.M. Lunar Regional Dark Mantle Deposits: Geologic, Multispectral, and Modeling Studies. J. Geophys. Res. Planets 1998, 103, 22725–22759. [Google Scholar] [CrossRef]
  12. Fortezzo, C.M.; Spudis, P.D.; Harrel, S.L. Release of the Digital Unified Global Geologic Map of the Moon at 1:5,000,000-Scale. In Proceedings of the 51st Annual Lunar and Planetary Science Conference, Woodlands, TX, USA, 16–20 March 2020; p. 2760. [Google Scholar]
  13. Nelson, D.M.; Koeber, S.D.; Daud, K.; Robinson, M.S.; Watters, T.R.; Banks, M.E.; Williams, N.R. Mapping Lunar Maria Extents and Lobate Scarps Using LROC Image Products. In Proceedings of the 45th Annual Lunar and Planetary Science Conference, Woodlands, TX, USA, 17–21 March 2014; p. 2861. [Google Scholar]
  14. Zheng, Y.-C.; Chan, K.L.; Tsang, K.T.; Zhu, Y.-C.; Hu, G.P.; Blewett, D.T.; Neish, C. Analysis of Chang’E-2 Brightness Temperature Data and Production of High Spatial Resolution Microwave Maps of the Moon. Icarus 2019, 319, 627–644. [Google Scholar] [CrossRef]
  15. Siegler, M.A.; Feng, J.; Lehman-Franco, K.; Andrews-Hanna, J.C.; Economos, R.C.; Clair, M.S.; Million, C.; Head, J.W.; Glotch, T.D.; White, M.N. Remote Detection of a Lunar Granitic Batholith at Compton–Belkovich. Nature 2023, 620, 116–121. [Google Scholar] [CrossRef] [PubMed]
  16. Meng, Z.; Dong, X.; Lei, J.; Ping, J.; Cai, Z.; Zhang, X.; Huang, S.; Zhang, Y. Constructing a Complete Brightness Temperature Dataset of the Moon With Chang’e-2 Microwave Radiometer Data. IEEE Trans. Geosci. Remote Sens. 2023, 61, 1–14. [Google Scholar] [CrossRef]
  17. Lei, J.; Meng, Z.; Wang, Y.; Huang, S.; Ping, J.; Cai, Z.; Zhang, Y. Potential Applications of CE-2 Microwave Radiometer Data in Understanding Basaltic Volcanism in Heavily Ejecta-Contaminated Mare Frigoris. Remote Sens. 2022, 14, 2725. [Google Scholar] [CrossRef]
  18. Chang, W.; Meng, Z.; Xu, Y.; Zhang, X.; Bugiolacchi, R.; Xiao, L.; Ping, J.; Zhang, H.; Zhang, Y. Microwave Thermophysical Properties of Surface Deposits in CE-6 Landing Region and Its Potential Implications for Analyzing the Returned Samples. Earth Planet. Sci. Lett. 2025, 658, 119326. [Google Scholar] [CrossRef]
  19. Chen, Y.; Li, C.; Ren, X.; Liu, J.; Wu, Y.; Lu, Y.; Cai, W.; Zhang, X. The Thickness and Volume of Young Basalts Within Mare Imbrium. J. Geophys. Res. Planets 2018, 123, 630–645. [Google Scholar] [CrossRef]
  20. Qian, Y.; She, Z.; He, Q.; Xiao, L.; Wang, Z.; Head, J.W.; Sun, L.; Wang, Y.; Wu, B.; Wu, X.; et al. Mineralogy and Chronology of the Young Mare Volcanism in the Procellarum-KREEP-Terrane. Nat. Astron. 2023, 7, 287–297. [Google Scholar] [CrossRef]
  21. Melosh, H.J. Cratering Mechanics-Observational, Experimental, and Theoretical. Ann. Rev. Earth Planet. Sci. 1980, 8, 65–93. [Google Scholar] [CrossRef]
  22. Hiesinger, H.; Jaumann, R.; Neukum, G.; Head, J.W., III. Ages of Mare Basalts on the Lunar Nearside. J. Geophys. Res. Planets 2000, 105, 29239–29275. [Google Scholar] [CrossRef]
  23. Kneissl, T.; van Gasselt, S.; Neukum, G. Map-Projection-Independent Crater Size-Frequency Determination in GIS Environments—New Software Tool for ArcGIS. Planet. Space Sci. 2011, 59, 1243–1254. [Google Scholar] [CrossRef]
  24. Moriarty, D.P., III.; Pieters, C.M. Complexities in Pyroxene Compositions Derived from Absorption Band Centers: Examples from Apollo Samples, HED Meteorites, Synthetic Pure Pyroxenes, and Remote Sensing Data. Meteorit. Planet. Sci. 2016, 51, 207–234. [Google Scholar] [CrossRef]
  25. Savitzky, A.; Golay, M.J.E. Smoothing and Differentiation of Data by Simplified Least Squares Procedures. Anal. Chem. 1964, 36, 1627–1639. [Google Scholar] [CrossRef]
  26. Wu, Y.; Li, L.; Luo, X.; Lu, Y.; Chen, Y.; Pieters, C.M.; Basilevsky, A.T.; Head, J.W. Geology, Tectonism and Composition of the Northwest Imbrium Region. Icarus 2018, 303, 67–90. [Google Scholar] [CrossRef]
  27. Horgan, B.H.N.; Cloutis, E.A.; Mann, P.; Bell, J.F. Near-Infrared Spectra of Ferrous Mineral Mixtures and Methods for Their Identification in Planetary Surface Spectra. Icarus 2014, 234, 132–154. [Google Scholar] [CrossRef]
  28. Adams, J.B. Visible and Near-infrared Diffuse Reflectance Spectra of Pyroxenes as Applied to Remote Sensing of Solid Objects in the Solar System. J. Geophys. Res. 1974, 79, 4829–4836. [Google Scholar] [CrossRef]
  29. Cloutis, E.A.; Gaffey, M.J. Spectral-Compositional Variations in the Constituent Minerals of Mafic and Ultramafic Assemblages and Remote Sensing Implications. Earth Moon Planets 1991, 53, 11–53. [Google Scholar] [CrossRef]
  30. Klima, R.L.; Dyar, M.D.; Pieters, C.M. Near-Infrared Spectra of Clinopyroxenes: Effects of Calcium Content and Crystal Structure. Meteorit. Planet. Sci. 2011, 46, 379–395. [Google Scholar] [CrossRef]
  31. Klima, R.L.; Pieters, C.M.; Dyar, M.D. Spectroscopy of Synthetic Mg-Fe Pyroxenes I: Spin-Allowed and Spin-Forbidden Crystal Field Bands in the Visible and near-Infrared. Meteorit. Planet. Sci. 2007, 42, 235–253. [Google Scholar] [CrossRef]
  32. Zhu, C.; Deng, S.; Song, X.; Li, Y.; Wang, Q. Mamba Collaborative Implicit Neural Representation for Hyperspectral and Multispectral Remote Sensing Image Fusion. IEEE Trans. Geosci. Remote Sens. 2025, 63, 1–15. [Google Scholar] [CrossRef]
  33. Lucey, P.; Blewett, D.; Jolliff, B. Lunar Iron and Titanium Abundance Algorithms Based on Final Processing of Clementine Ultraviolet-Visible Images. J. Geophys. Res. Planets 2000, 105, 20297–20305. [Google Scholar] [CrossRef]
  34. Yang, C.; Zhang, X.; Bruzzone, L.; Liu, B.; Liu, D.; Ren, X.; Benediktsson, J.A.; Liang, Y.; Yang, B.; Yin, M.; et al. Comprehensive Mapping of Lunar Surface Chemistry by Adding Chang’e-5 Samples with Deep Learning. Nat. Commun. 2023, 14, 7554. [Google Scholar] [CrossRef]
  35. Qiao, L.; Xu, L.; Head, J.W.; Chen, J.; Zhang, Y.; Li, B.; Ling, Z. Geological Evidence for Extensive Basin Ejecta as Plains Terrains in the Moon’s South Polar Region. Nat. Commun. 2024, 15, 5783. [Google Scholar] [CrossRef]
  36. Yue, Z.; Li, W.; Di, K.; Liu, Z.; Liu, J. Global Mapping and Analysis of Lunar Wrinkle Ridges. J. Geophys. Res. Planets 2015, 120, 978–994. [Google Scholar] [CrossRef]
  37. Yue, Z.; Michael, G.G.; Di, K.; Liu, J. Global Survey of Lunar Wrinkle Ridge Formation Times. Earth Planet. Sci. Lett. 2017, 477, 14–20. [Google Scholar] [CrossRef]
  38. Thompson, T.J.; Robinson, M.S.; Watters, T.R.; Johnson, M.B. Global Lunar Wrinkle Ridge Identification and Analysis. In Proceedings of the 48th Annual Lunar and Planetary Science Conference, Woodlands, TX, USA, 20–24 March 2017; p. 2665. [Google Scholar]
  39. Hurwitz, D.M.; Head, J.W.; Hiesinger, H. Lunar Sinuous Rilles: Distribution, Characteristics, and Implications for Their Origin. Planet. Space Sci. 2013, 79, 1–38. [Google Scholar] [CrossRef]
  40. Zhang, F.; Zhu, M.-H.; Zou, Y.L. Late Stage Imbrium Volcanism on the Moon: Evidence for Two Source Regions and Implications for the Thermal History of Mare Imbrium. Earth Planet. Sci. Lett. 2016, 445, 13–27. [Google Scholar] [CrossRef]
  41. Zhang, F.; Head, J.W.; Wilson, L.; Meng, Y.; Wӧhler, C.; Guo, D.; Niu, S.; Bugiolacchi, R.; Qiao, L.; Dang, Y. Insights into Lunar Basaltic Volcanism from Mare Domes Superposed by Ring-moat Dome Structures (RMDSs) in Mare Tranquillitatis. J. Geophys. Res. Planets 2024, 129, e2023JE007969. [Google Scholar] [CrossRef]
  42. Jawin, E.R.; Besse, S.; Gaddis, L.R.; Sunshine, J.M.; Head, J.W.; Mazrouei, S. Examining Spectral Variations in Localized Lunar Dark Mantle Deposits. J. Geophys. Res. Planets. 2015, 120, 1310–1331. [Google Scholar] [CrossRef]
  43. Liu, D.; Wang, X.; Liu, J.; Liu, B.; Ren, X.; Chen, Y.; Chen, Z.; Zhang, H.; Zhang, G.; Zhou, Q. Spectral Interpretation of Late-Stage Mare Basalt Mineralogy Unveiled by Chang’E-5 Samples. Nat. Commun. 2022, 13, 5965. [Google Scholar] [CrossRef]
  44. Xu, Z.; Guo, D.; Liu, J. Maria Basalts Chronology of the Chang’E-5 Sampling Site. Remote Sens. 2021, 13, 1515. [Google Scholar] [CrossRef]
  45. Qian, Y.; Head, J.; Michalski, J.; Wang, X.; Van der Bogert, C.H.; Hiesinger, H.; Sun, L.; Yang, W.; Xiao, L.; Li, X. Long-Lasting Farside Volcanism in the Apollo Basin: Chang’e-6 Landing Site. Earth Planet. Sci. Lett. 2024, 637, 118737. [Google Scholar] [CrossRef]
  46. Trang, D.; Tonkham, T.; Filiberto, J.; Li, S.; Lemelin, M.; Elder, C.M. Eruption Characteristics of Lunar Localized Pyroclastic Deposits as Evidenced by Remotely Sensed Water, Mineralogy, and Regolith. Icarus 2022, 375, 114837. [Google Scholar] [CrossRef]
  47. Carter, L.M.; Campbell, B.A.; Hawke, B.R.; Campbell, D.B.; Nolan, M.C. Radar Remote Sensing of Pyroclastic Deposits in the Southern Mare Serenitatis and Mare Vaporum Regions of the Moon. J. Geophys. Res. Planets 2009, 114, E11. [Google Scholar] [CrossRef]
  48. Hu, G.-P.; Chan, K.L.; Zheng, Y.-C.; Xu, A.-A. A Rock Model for the Cold and Hot Spots in the Chang’E Microwave Brightness Temperature Map. IEEE Trans. Geosci. Remote Sens. 2018, 56, 5471–5480. [Google Scholar] [CrossRef]
  49. Mellon, M.T.; Jakosky, B.M.; Kieffer, H.H.; Christensen, P.R. High-Resolution Thermal Inertia Mapping from the Mars Global Surveyor Thermal Emission Spectrometer. Icarus 2000, 148, 437–455. [Google Scholar] [CrossRef]
  50. Neukum, G.; Ivanov, B.A.; Hartmann, W.K. Cratering Records in the Inner Solar System in Relation to the Lunar Reference System. Space Sci. Rev. 2001, 96, 55–86. [Google Scholar] [CrossRef]
  51. Yue, Z.; Di, K.; Wan, W.; Liu, Z.; Gou, S.; Liu, B.; Peng, M.; Wang, Y.; Jia, M.; Liu, J. Updated Lunar Cratering Chronology Model with the Radiometric Age of Chang’e-5 Samples. Nat. Astron 2022, 6, 541–545. [Google Scholar] [CrossRef]
Figure 2. TB maps in the Rima Bode at noontime: (a) 3.0 GHz, (b) 7.8 GHz, (c) 19.35 GHz, and (d) 37 GHz. The black line is the Mare boundaries proposed by Nelson et al. [13].
Remotesensing 17 03824 g002
Figure 3. TB maps in the Rima Bode at nighttime: (a) 3.0 GHz, (b) 7.8 GHz, (c) 19.35 GHz, and (d) 37 GHz. The black line is the Mare boundaries proposed by Nelson et al. [13].
Remotesensing 17 03824 g003
Figure 4. Chemical composition of the Rima Bode. (a) FeO map; (b) TiO2 map. The black line is the Mare boundaries proposed by Nelson et al. [13].
Remotesensing 17 03824 g004
Figure 5. Geomorphologic characteristics in the Rima Bode, shown with a TC image.
Remotesensing 17 03824 g005
Figure 6. Five representative landforms in the Rima Bode: (a) Basalts, (b) Pyroclastic Deposits, (c) Sinuous Rilles, (d) Domes, and (e) Wrinkle Ridges.
Remotesensing 17 03824 g006
Figure 7. Topographic map and topographic profile of the Rima Bode. (a) Elevation map of the Rima Bode. Letters A-A′, B-B′, and C-C′ indicate the locations of the elevation profile transects shown in panels (b), (c), and (d), respectively. (bd) Topographic profiles along transects A-A′, B-B′, and C-C′, respectively.
Remotesensing 17 03824 g007
Figure 8. Comparison of the 1 μm and 2 μm absorption band centers of the Rima Bode against those of natural and synthetic pyroxenes. natural pyroxenes are from Adams [28] and Cloutis and Gaffey [29], and synthetic pyroxenes are from Klima et al. [30,31].
Remotesensing 17 03824 g008
Figure 9. Comparison of chemical compositions between the Rima Bode and returned samples. Data points of Apollo, Luna, and CE-5 are modified from Zhao et al. [10].
Remotesensing 17 03824 g009
Figure 10. Spectral parameters and crater type distributions of the study region: (a) Clementine 750 nm reflectance; (b) crater type; (c) 1 μm absorption band center; (d) 2 μm absorption band center.
Remotesensing 17 03824 g010
Figure 11. Thickness distribution map of the Rima Bode: (a) thickness distribution of pyroclastic deposits in Region I, (b) thickness Distribution Map of Basalt in Region II, (c) thickness Distribution Map of Basalt in Region III, and (d) thickness distribution map of basalt in Region IV.
Remotesensing 17 03824 g011
Figure 12. 24-h TB curves at (a) 3.0 GHz, (b) 7.8 GHz, (c) 19.35 GHz, and (d) 37 GHz.
Remotesensing 17 03824 g012
Figure 13. The AMAs of the Rima Bode: (a) Region I, (b) Region II, (c) Region III, and (d) Region IV. PF and CF represent the Production Function [50] and Chronology Function [51], respectively.
Remotesensing 17 03824 g013
Table 1. Chemical Composition and Band Centers of Different Regions.
Region IRegion IIRegion IIIRegion IV
FeO (wt.%)21.615.8815.3220.72
TiO2 (wt.%)10.74.062.738.1
1000 nm Center1095.47975.58969.81030.79
2000 nm Center1958.142164.902124.712279.78
Table 2. The mean TB of Region I, Region II, Region III, and Region IV at four channels.
ChannelsRegion IRegion IIRegion IIIRegion IV
noontime3.0 GHz237.6239.5236.4242.8
7.8 GHz235.1237.8234.3240.6
19.35 GHz263.7269.9267.3271.6
37 GHz270.5278.5274.7282.6
nighttime3.0 GHz237.6233.4235.2231.7
7.8 GHz227.2220.8224.9218.4
19.35 GHz238.3232.1234.5230.2
37 GHz228.9220.5223.6218.2
Disclaimer/Publisher’s Note: The statements, opinions and data contained in all publications are solely those of the individual author(s) and contributor(s) and not of MDPI and/or the editor(s). MDPI and/or the editor(s) disclaim responsibility for any injury to people or property resulting from any ideas, methods, instructions or products referred to in the content.