1. Introduction
Forests, as a core component of the global carbon cycle, fix carbon dioxide through photosynthesis and maintain the terrestrial carbon balance, making them key natural carbon sinks for mitigating global climate change [
1,
2]. Meanwhile, canopy height, as a fundamental parameter describing vertical structure, directly determines ecosystem energy exchange, water cycling, and biodiversity maintenance capacity [
3,
4]. Therefore, accurate inversion of forest canopy height is essential for ecological protection and sustainable development [
5].
Traditional ground-based forest height measurements, although highly accurate, are costly, labor-intensive, and inefficient, limiting their applicability for large-scale dynamic monitoring [
6]. The emergence of remote sensing has provided new solutions for canopy height estimation [
7]. Early studies relied primarily on optical remote sensing data, such as Landsat-8 and Sentinel-2, which offer extensive spatial coverage and cost efficiency but suffer from cloud contamination and signal saturation in dense canopies, making it difficult to capture vertical structural information directly [
8,
9,
10].
Spaceborne LiDAR missions such as GEDI and ICESat-2 provide precise vertical structural information; however, GEDI’s spatial coverage is limited to between 51.6°N and 51.6°S, sampling only about 4% of global land area during its mission [
11]. ICESat-2, originally designed for polar ice sheet monitoring [
12,
13], is less optimized for forest applications [
14]. The inherent sparsity of both datasets necessitates spatial interpolation or fusion with other remote sensing data to produce continuous canopy height maps [
15,
16], often introducing significant errors in complex forest environments [
17,
18,
19,
20,
21,
22,
23].
Compared with spaceborne LiDAR, airborne LiDAR can capture denser, higher-resolution canopy height data [
24,
25], but its coverage is constrained by flight cost and logistics. In addition, topography [
26] and the inability to penetrate ultra-dense canopies [
27] can lead to “pits” or discontinuous patches comprising 15–20% of the mapped area [
28]. As a result, interpolation and multi-source fusion are often required [
29], which further increase uncertainty. For example, Potapov et al. [
20] generated a global canopy height map using GEDI and Landsat data but found systematic underestimation of tall canopies and regional biases in tropical forests such as those in Gabon (RMSE = 10.419 m). Similarly, Lang et al. [
21,
22] produced a global canopy height product from GEDI and Sentinel-2 but reported reduced accuracy in complex tropical forests (RMSE = 11.057 m) and fragmented agroforestry landscapes. Liu et al. [
29] also observed that spatial heterogeneity in LiDAR-derived labels introduced over 30% higher model errors in tropical than in temperate forests. These findings highlight the intrinsic limitations of sparse, discontinuous labels for canopy height prediction in heterogeneous tropical forests.
In contrast, microwave remote sensing [
30], particularly Polarimetric Interferometric Synthetic Aperture Radar (PolInSAR) [
31,
32], combines the vertical sensitivity of InSAR with the scattering characterization of PolSAR, offering unique advantages for forest height retrieval [
33,
34,
35]. Spaceborne PolInSAR processing techniques have matured considerably since their introduction [
32,
33,
36,
37,
38,
39,
40], whereas airborne PolInSAR systems—less affected by temporal and spatial decorrelation [
41,
42]—offer higher resolution and improved accuracy in complex local forest environments [
43]. Luo et al. [
44], for instance, achieved high-precision canopy height inversion (RMSE = 5.38 m) in Gabonese mangrove forests using airborne multi-baseline PolInSAR data. Importantly, PolInSAR retrievals inherently produce continuous, high-resolution canopy height maps, eliminating the sparsity, interpolation bias, and label heterogeneity associated with LiDAR data.
However, two critical gaps remain in current PolInSAR-based studies. First, a single baseline selection strategy cannot adapt effectively to the full height gradient of tropical forests. Zhang et al. [
45] found that the PROD method performs better in low (<10 m) and tall (>30 m) forests, whereas the ECC method is more suitable for intermediate heights (10–30 m) but less accurate in other ranges. Second, most existing studies focus on improving PolInSAR inversion algorithms themselves, without fully exploiting their potential as high-quality training labels for machine and deep learning models. Moreover, tropical forests—key global carbon sinks—exhibit high structural heterogeneity [
44], frequent cloud cover, and strong spatial variability, where interpolation errors from sparse LiDAR labels can lead to biomass estimation biases of 20–30% [
18]. Although PolInSAR enables continuous, all-weather observation, its extrapolation capability across larger regions (e.g., provincial scales) remains underdeveloped. Thus, integrating PolInSAR-derived continuous labels with multi-source remote sensing data to construct predictive models tailored to complex tropical forest environments is a pressing challenge.
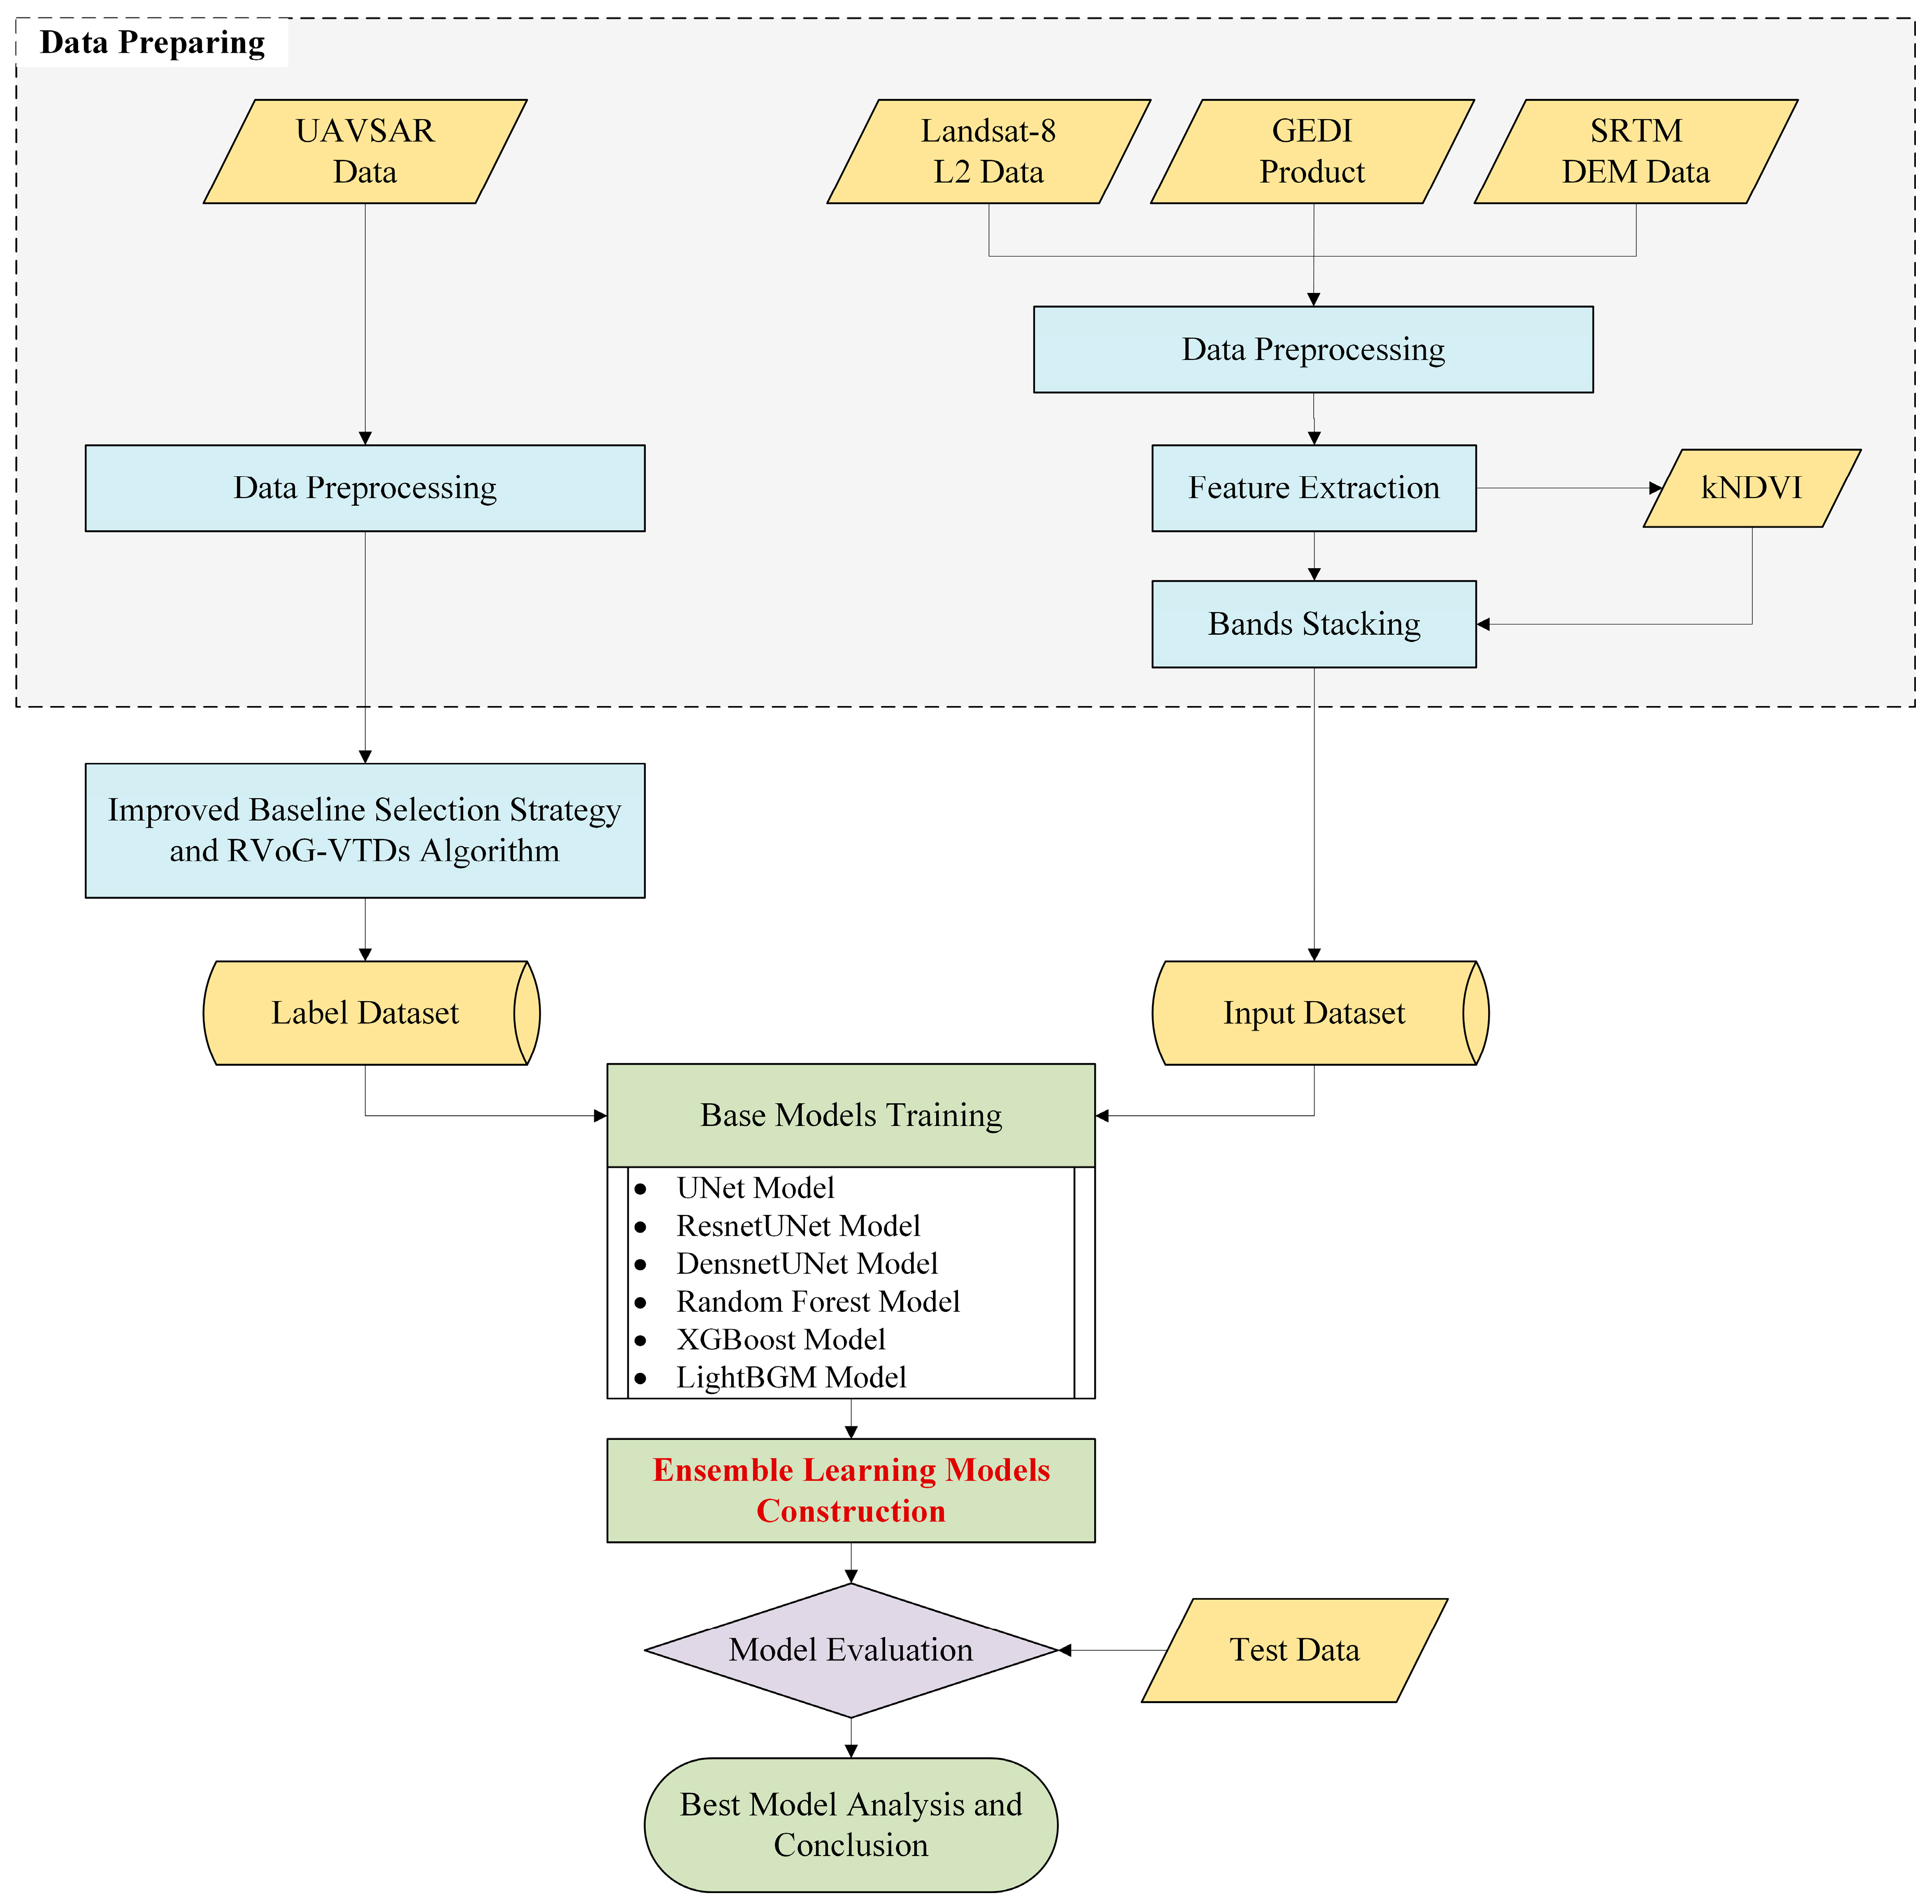
To address these issues, this study proposes and validates a multi-source ensemble learning framework for canopy height estimation, replacing traditional sparse LiDAR samples with continuous canopy height maps derived from airborne PolInSAR. The main objectives and innovations are as follows:
- (1)
Develop a high-quality PolInSAR labeling method by integrating a hybrid baseline selection strategy (PROD+ECC) within the advanced RVoG-VTDs model, improving inversion accuracy and stability in complex tropical forests;
- (2)
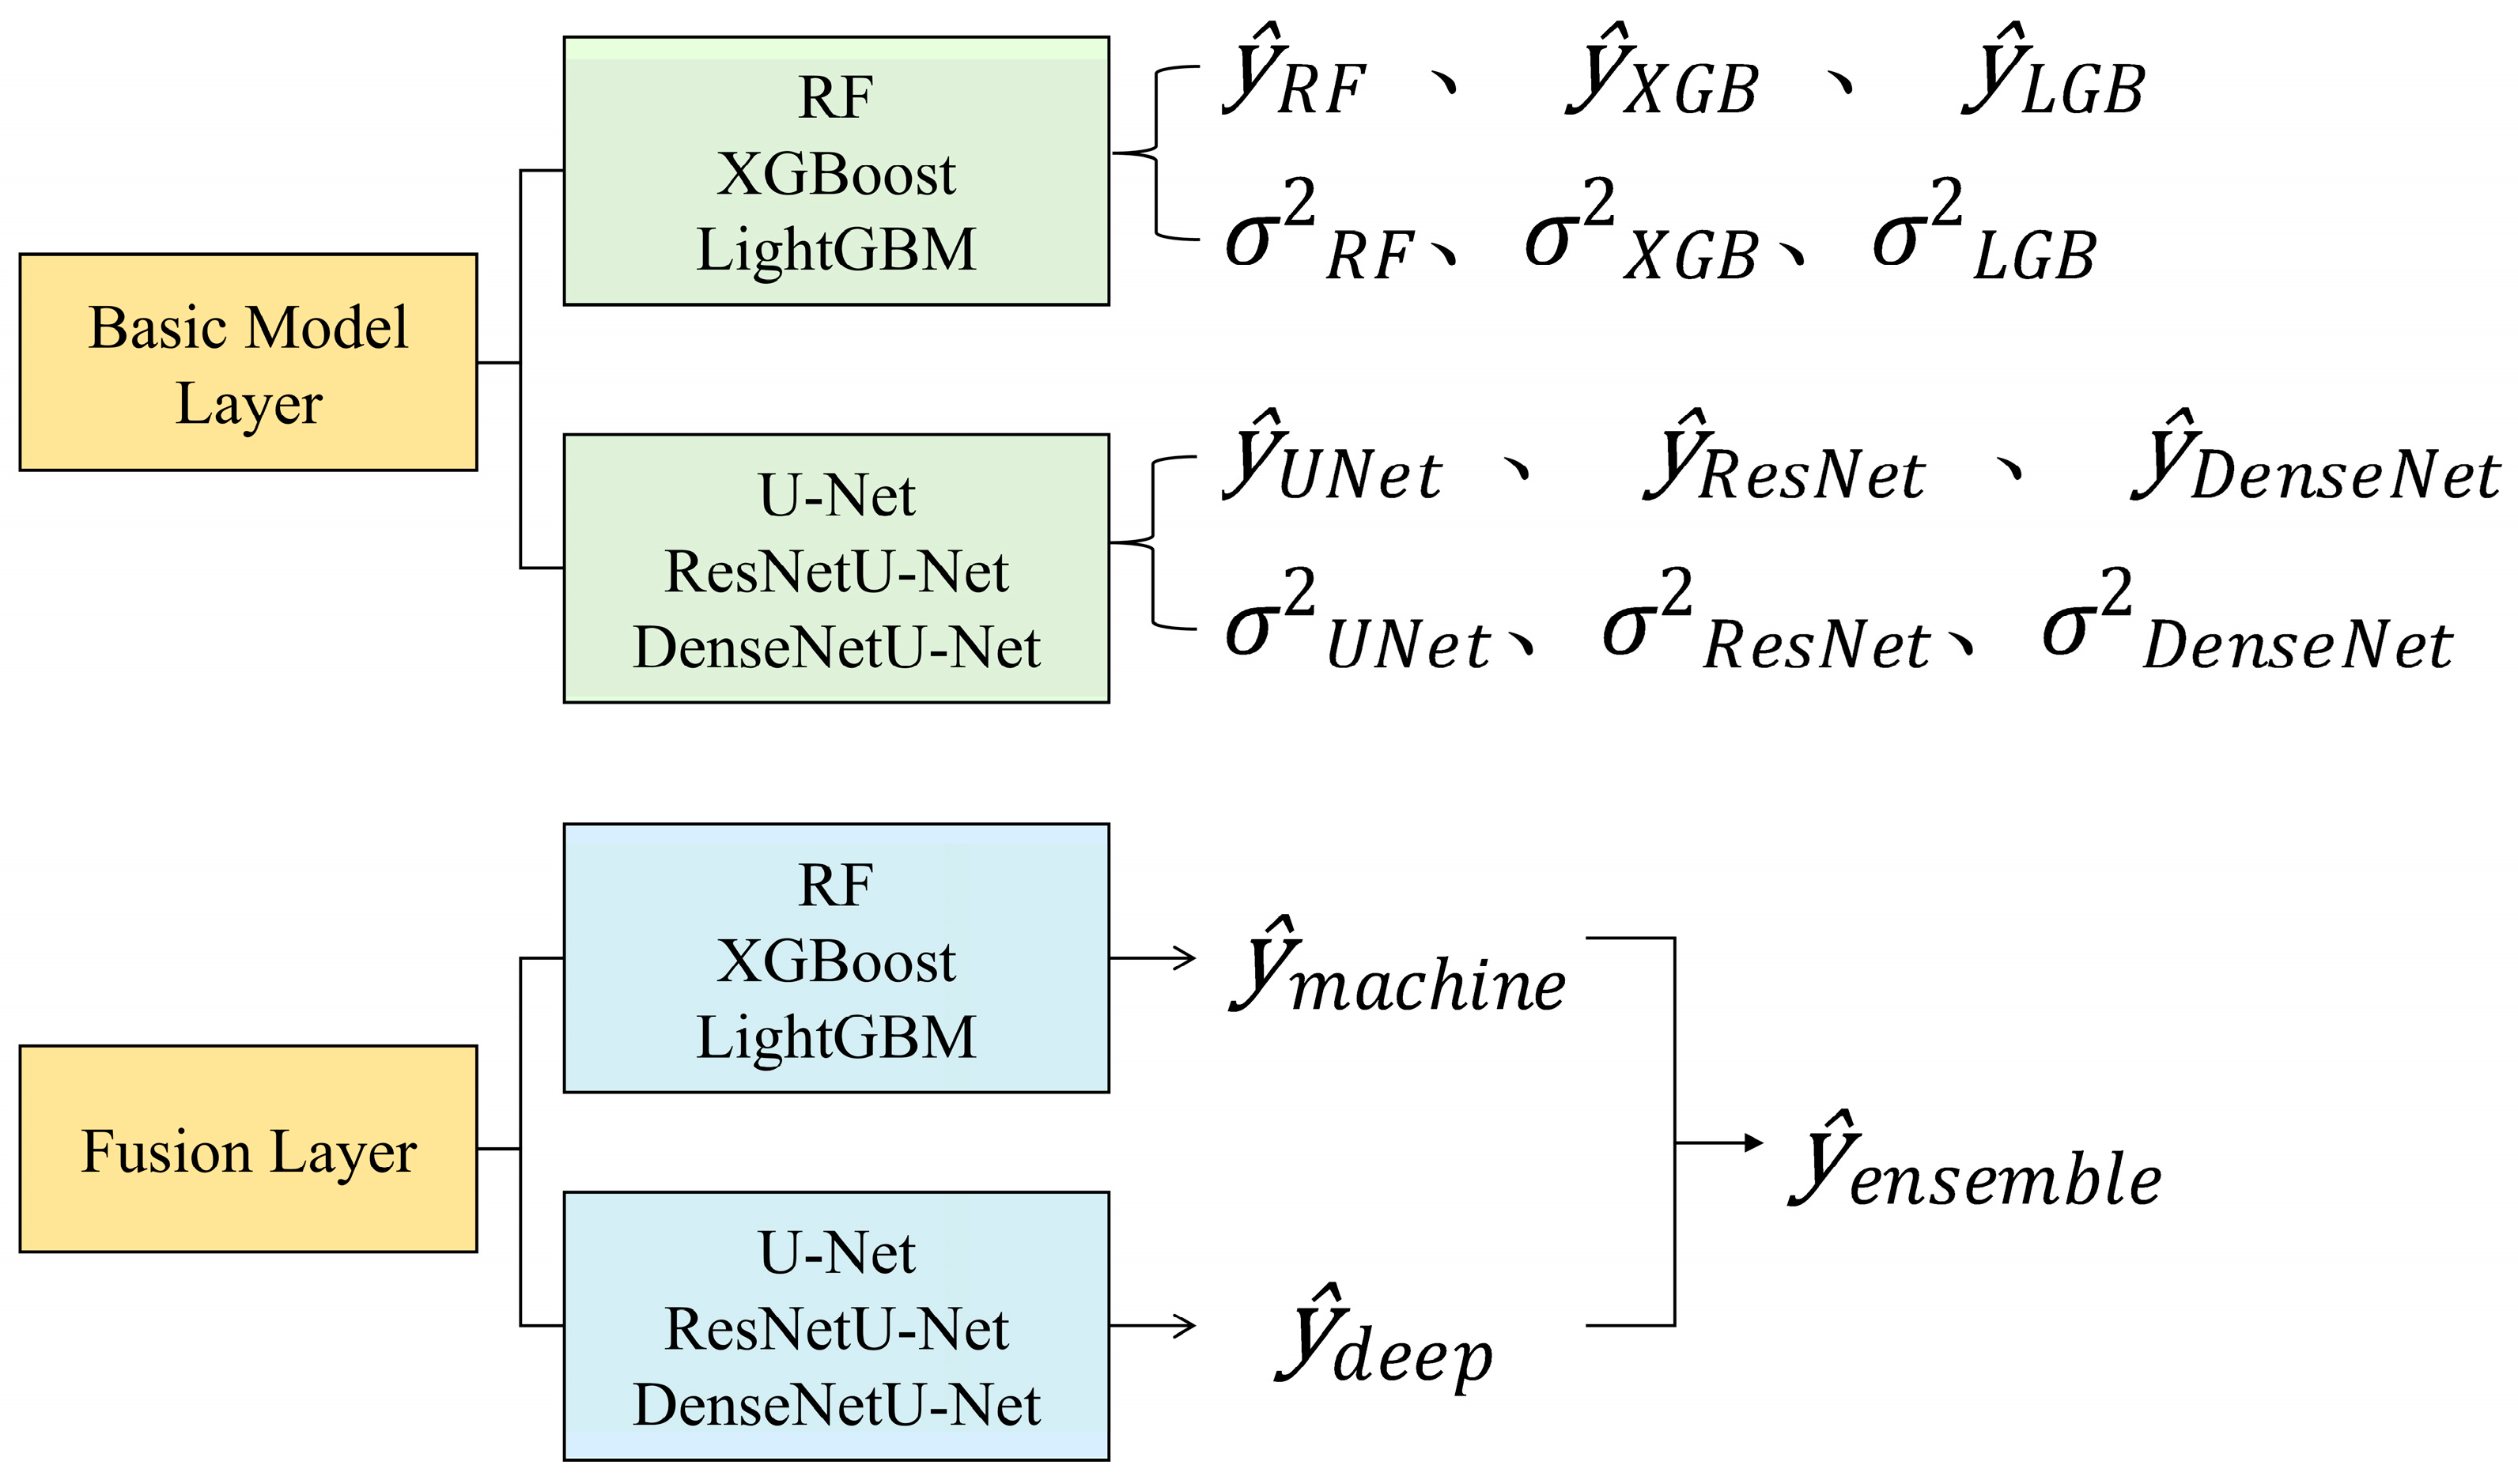
Construct a dual-layer ensemble learning framework integrating machine learning and deep learning models, with an uncertainty-based dynamic weighting mechanism to exploit their complementary strengths in capturing heterogeneous and spatial contextual features;
- (3)
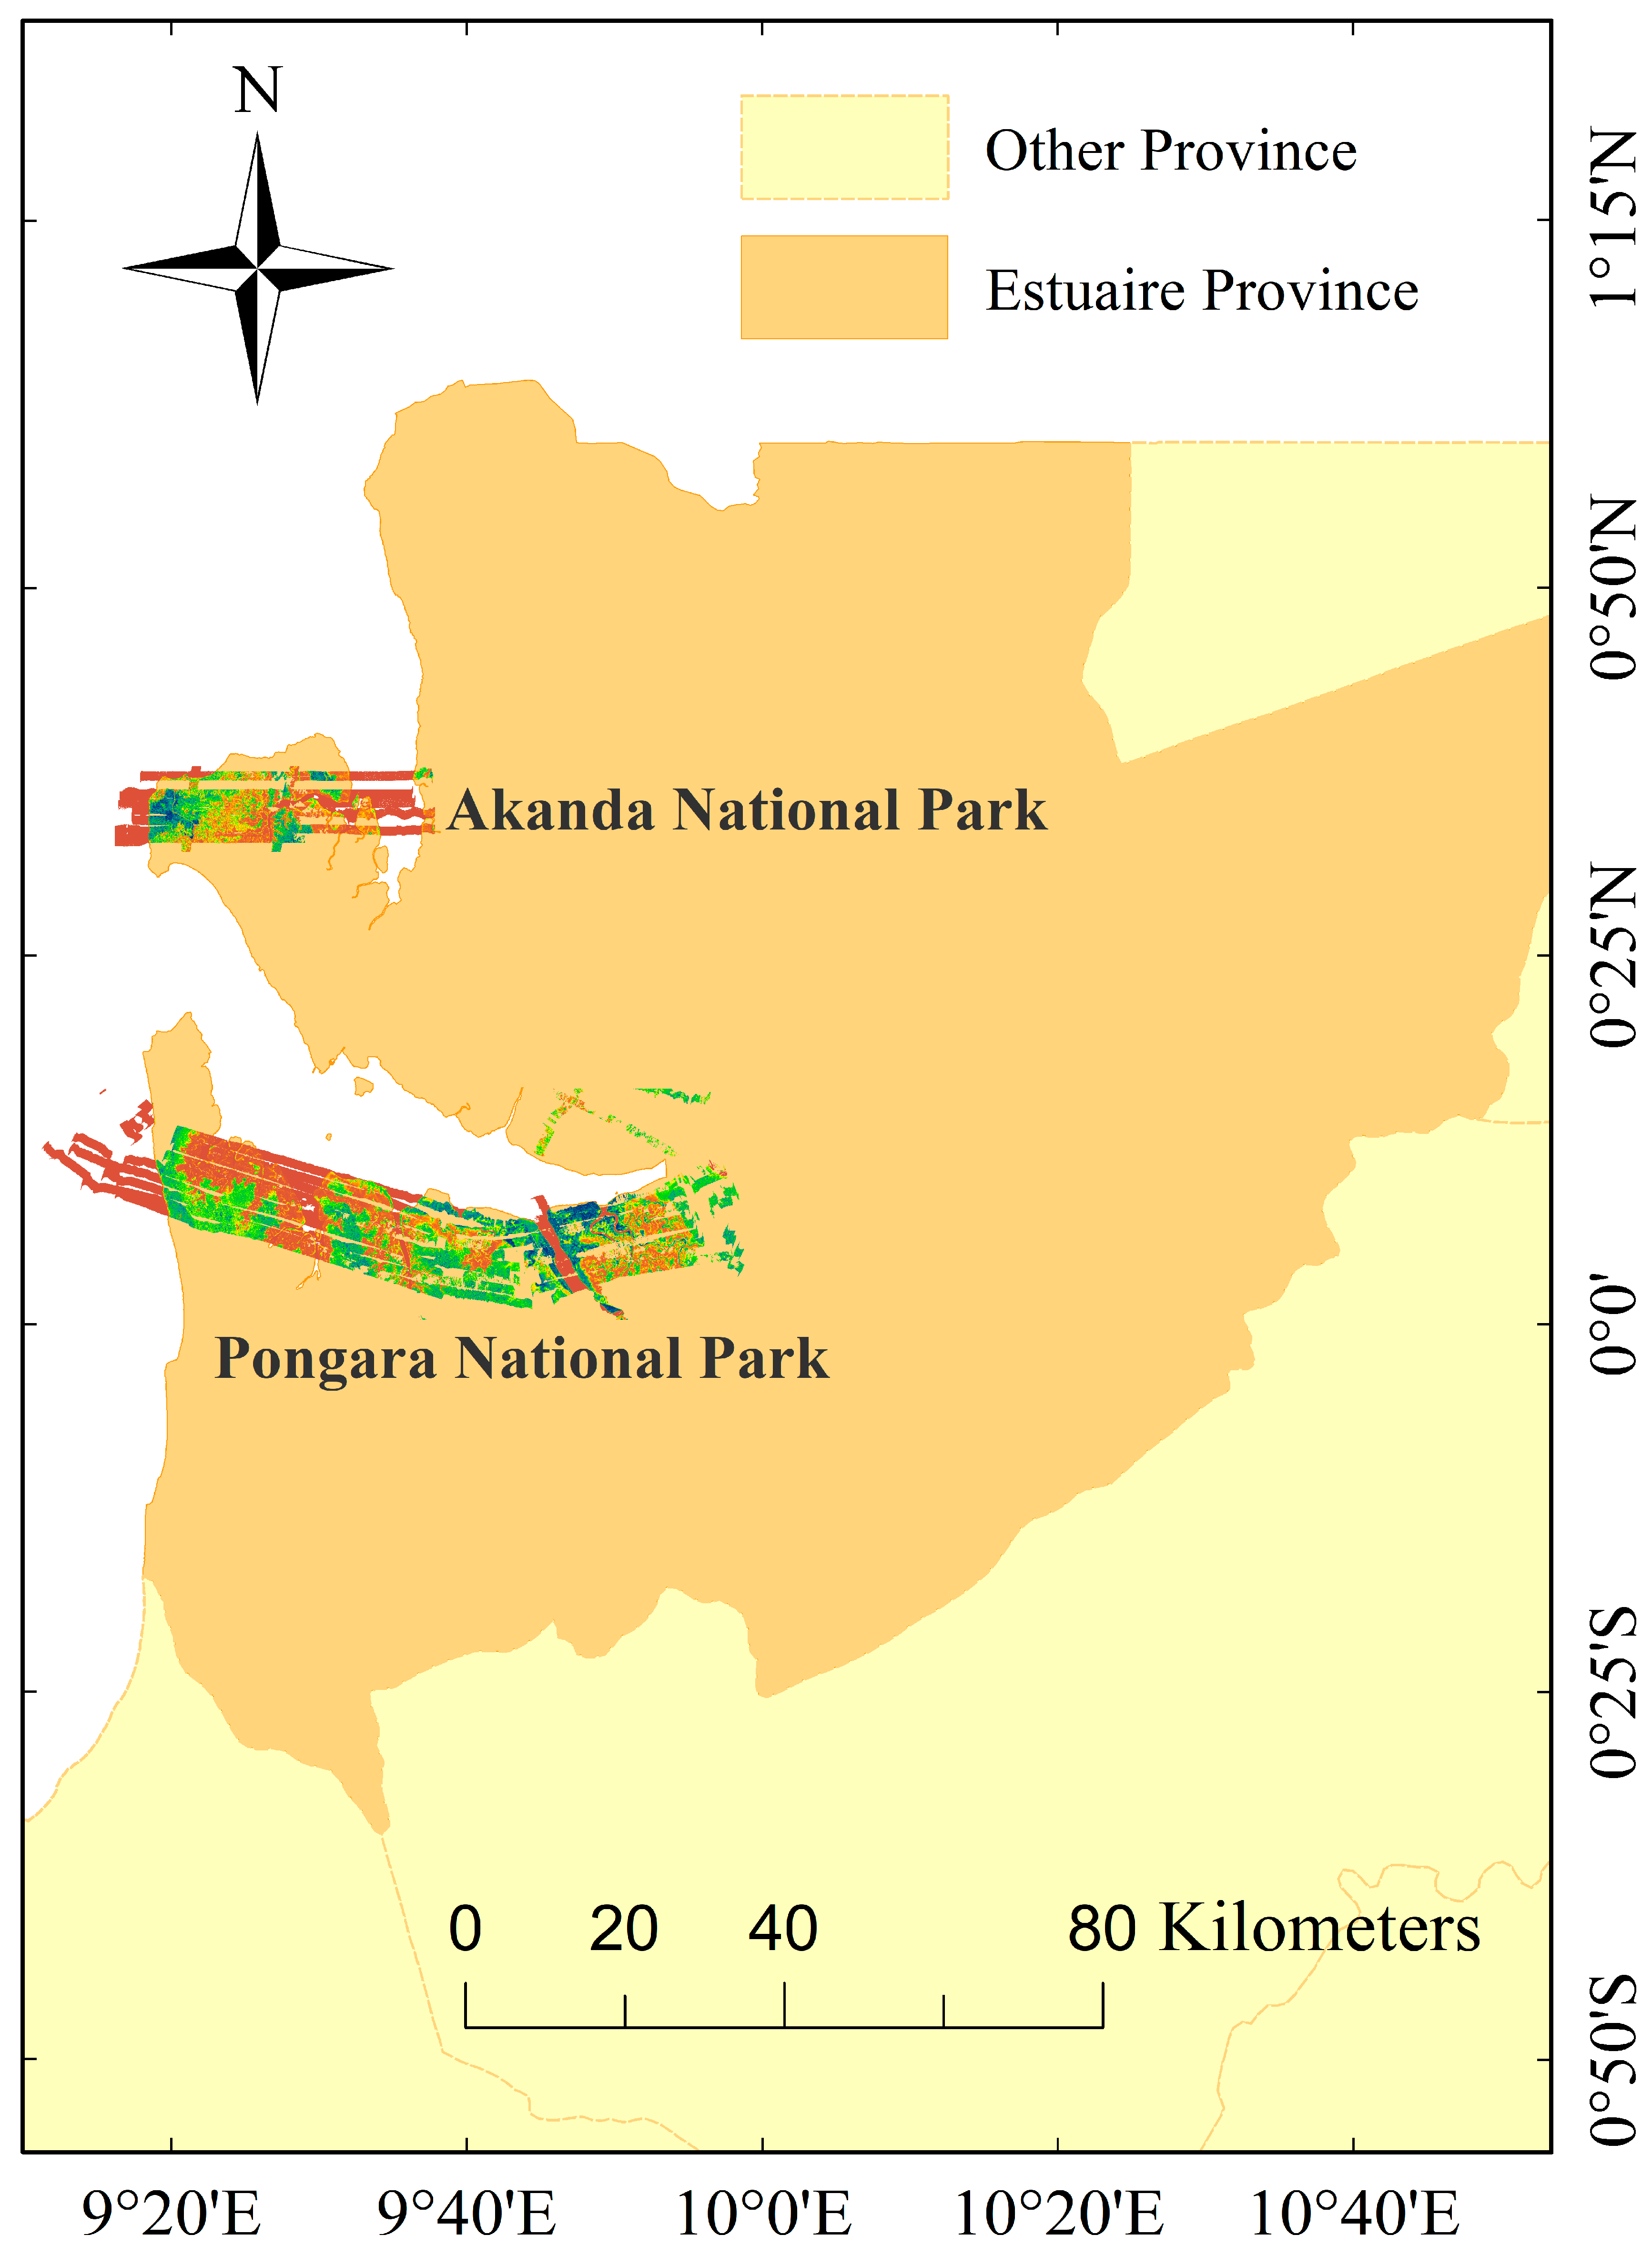
Achieve robust upscaling from local inversion to regional prediction by training the model in Gabon’s Pongara National Park and validating it in the independent Akanda National Park, demonstrating the framework’s capacity to reduce extrapolation bias and enhance canopy height estimation accuracy.
In this study, we provide a novel paradigm for canopy height prediction in complex tropical forests by integrating PolInSAR-derived continuous labels with multi-source data and ensemble learning. The proposed framework expands the application potential of PolInSAR and offers a transferable pathway for regional forest mapping and carbon stock assessment.
3. Results
3.1. Analysis and Comparison of Label Set Inversion Results
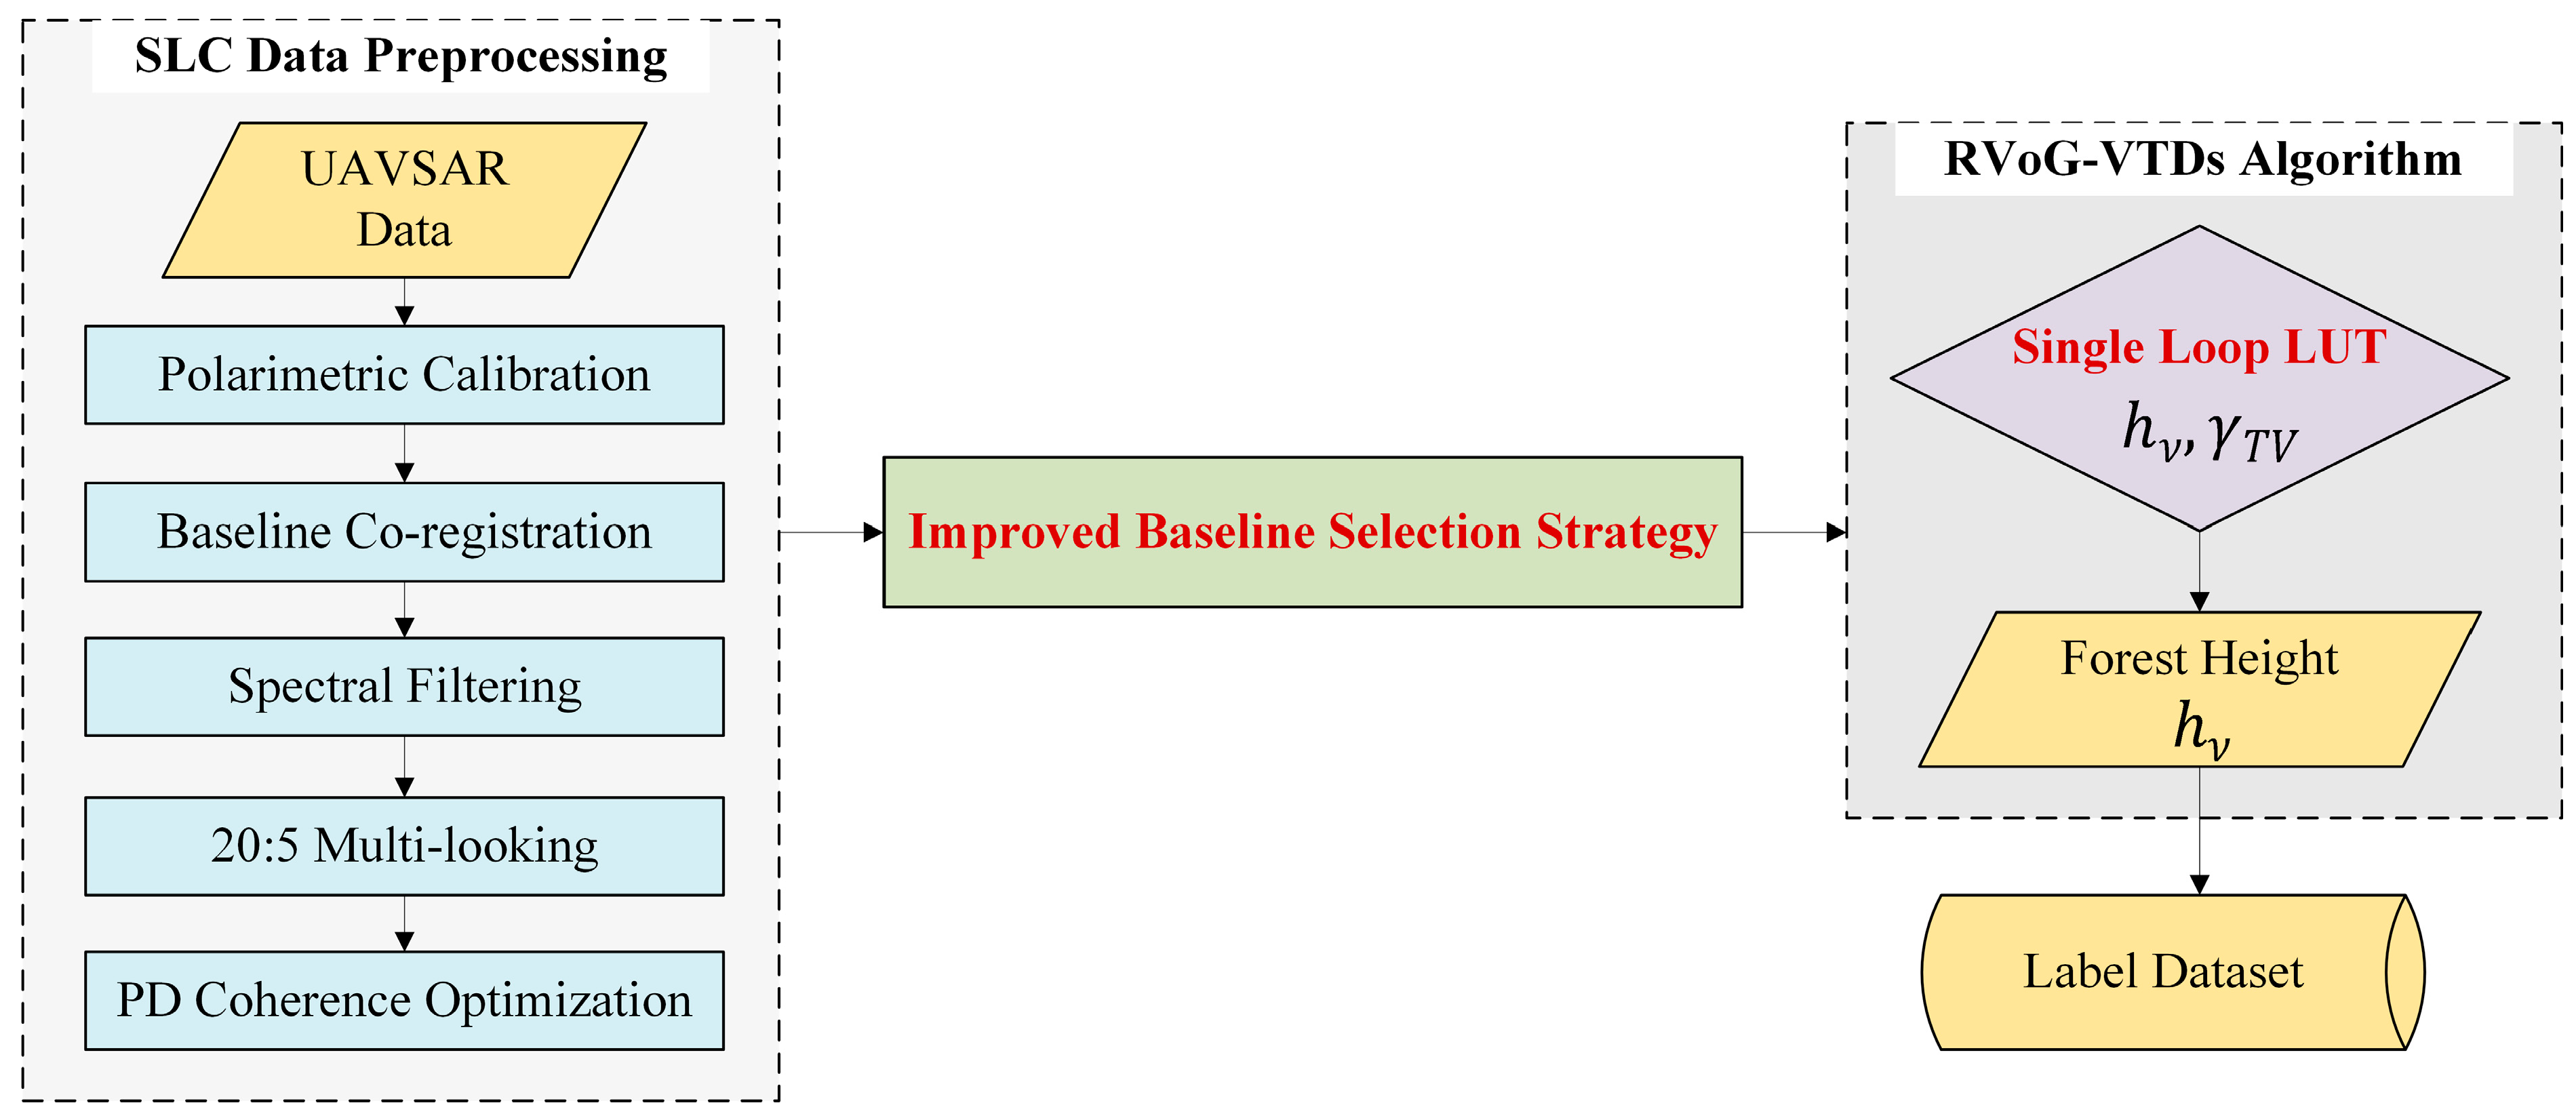
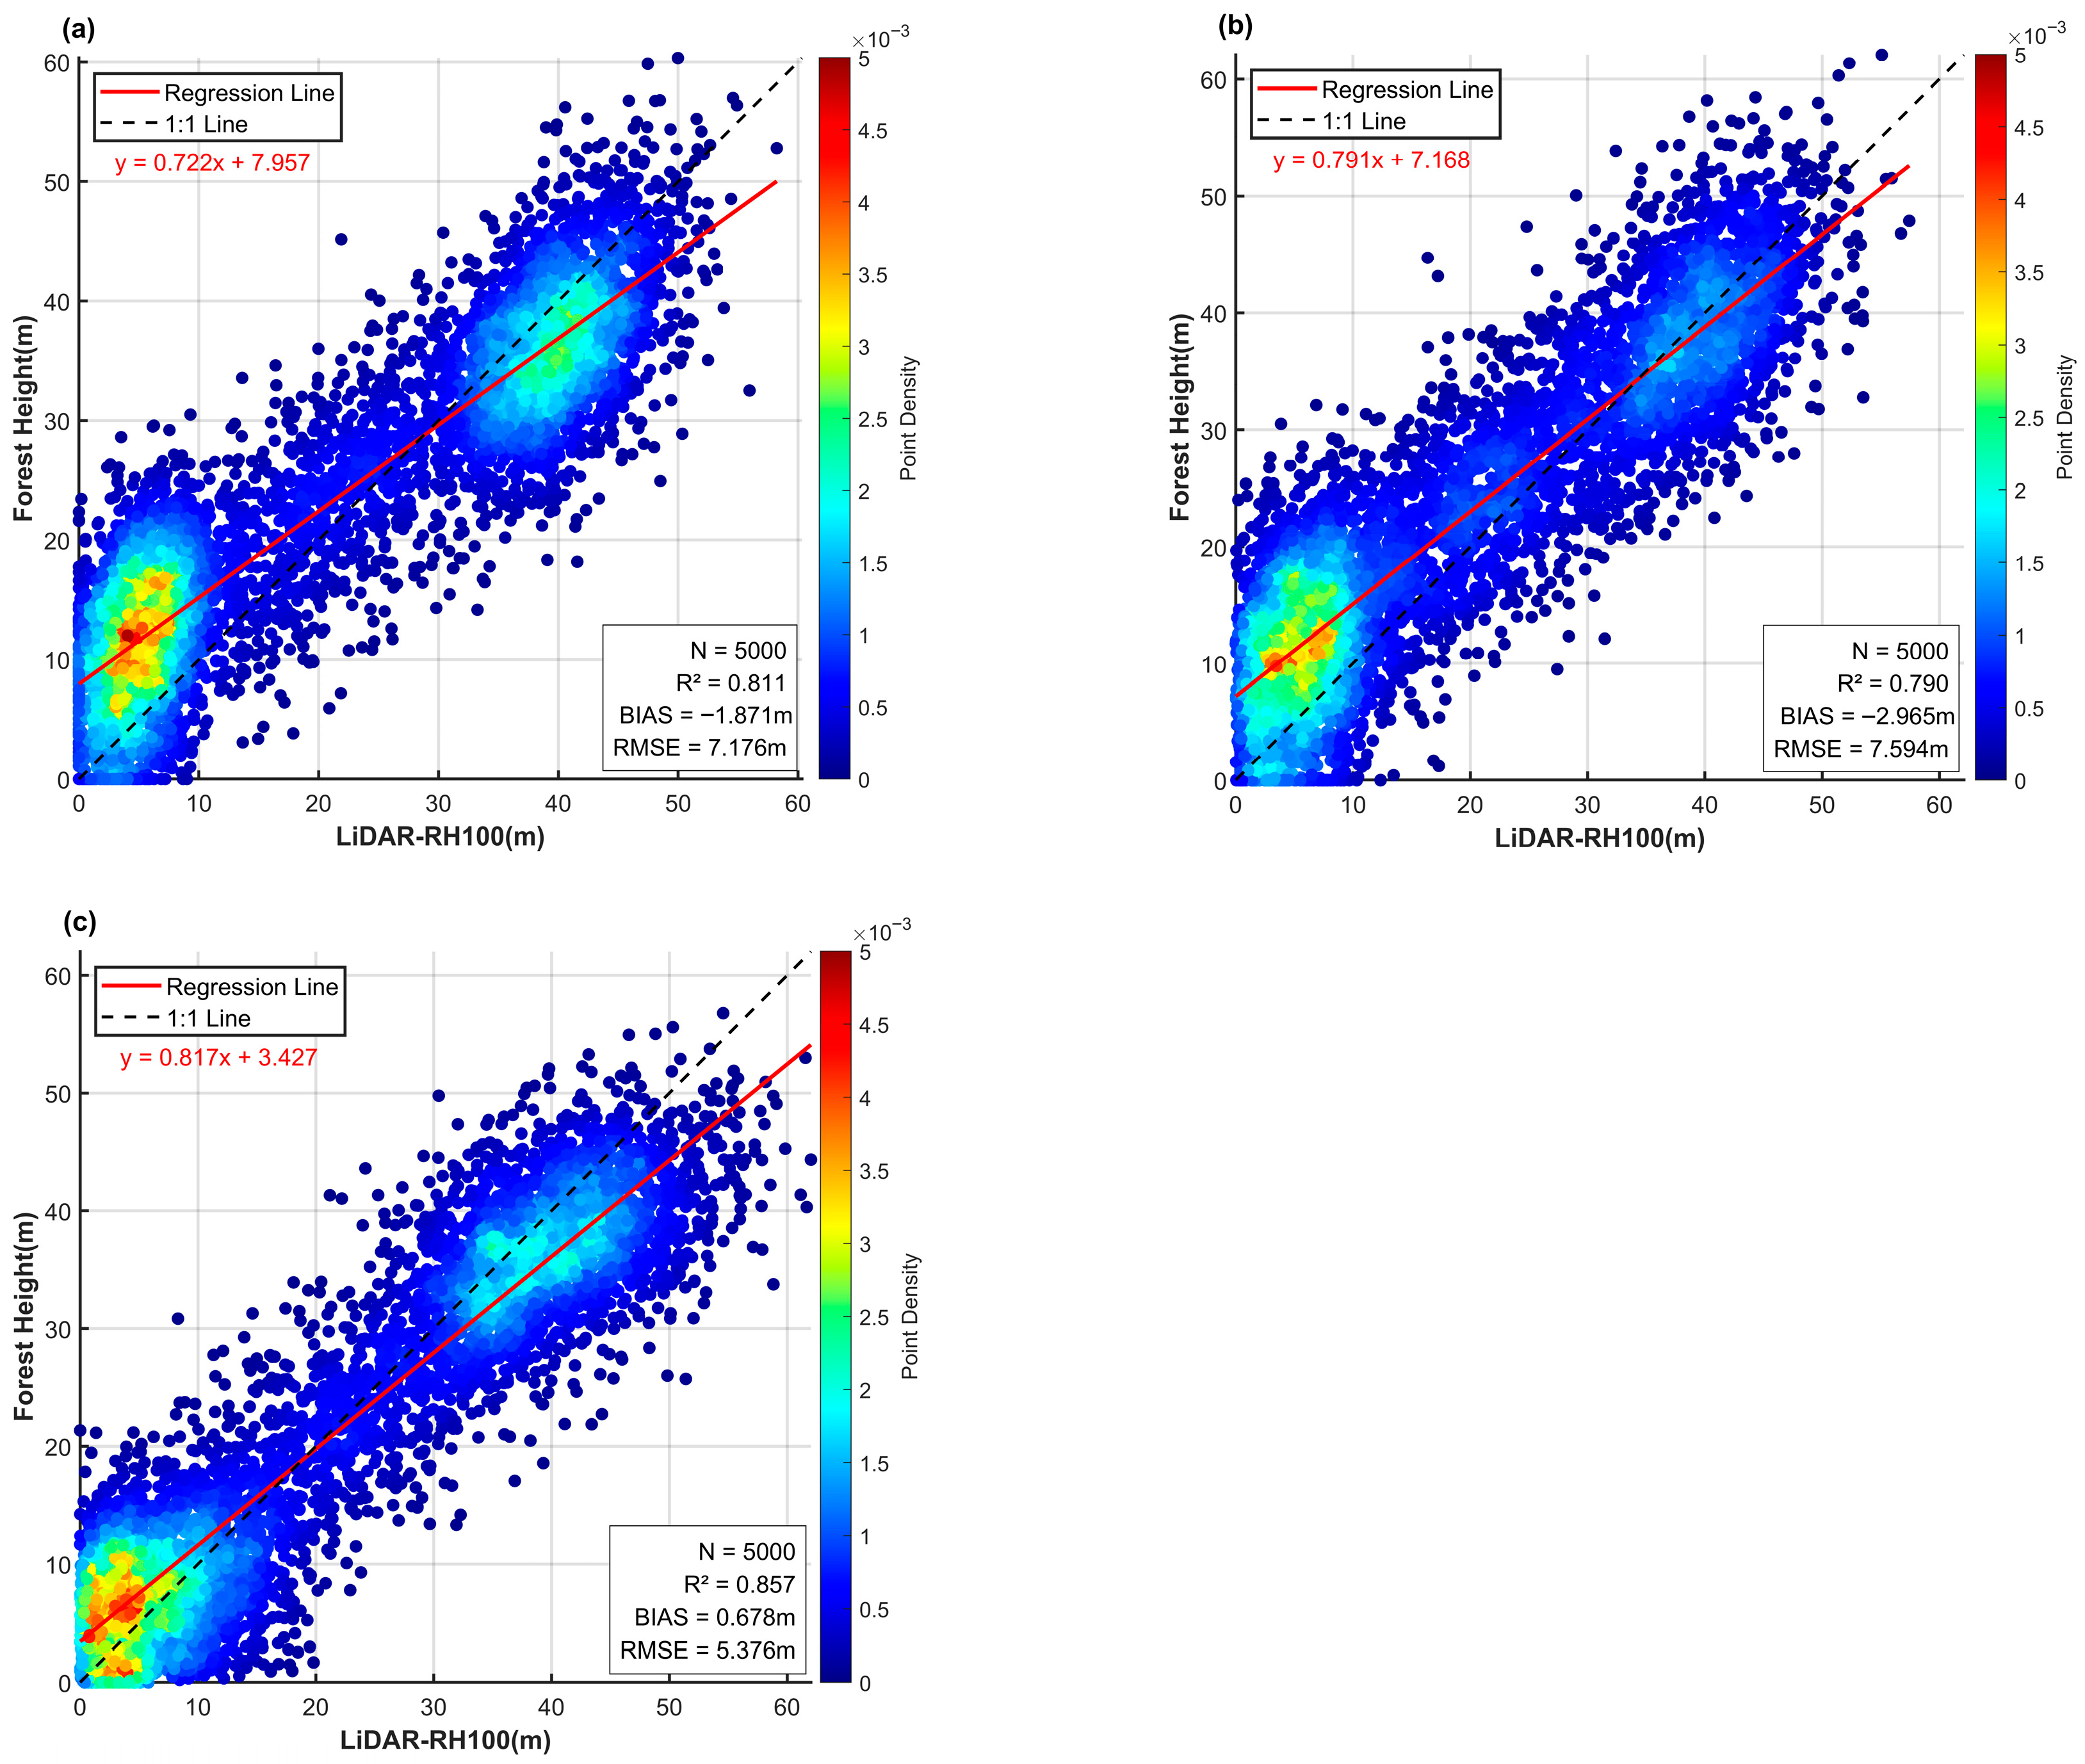
This study employed the RVoG-VTDs method, with an improved baseline selection strategy and subsequent result mosaicking, to perform forest height inversion on the PolInSAR dataset from Pongara National Park. The LVIS RH100 data, after co-registration, were used as reference measurements for accuracy assessment. A total of 5000 sample points were collected, yielding the results presented in
Table 4 and
Figure 6 and
Figure 7.
Comparison of the three baseline selection methods combined with RVoG-VTDs shows that the PROD-only method achieved an R2 of 0.811, a BIAS of −1.871 m, and an RMSE of 7.176 m. The ECC-only method yielded an R2 of 0.790, a BIAS of −2.965 m, and an RMSE of 7.594 m. These results indicate that in this study area, where low and tall forest stands dominate, the PROD method performed relatively better, indirectly confirming the structural complexity of the forest scene.
In contrast, the proposed hybrid baseline method achieved an R
2 of 0.857, a BIAS of 0.678 m, and reduced the RMSE to 5.376 m. Our strategy reduced RMSE by 25%, and this demonstrates a significant improvement in accuracy compared with the single-method approaches. Moreover,
Figure 6 shows that the residual distribution under the adaptive method was more uniform, with the fitted regression line closer to the 1:1 line, indicating enhanced stability.
Figure 7 further illustrates that the mean and standard deviation of errors were smaller, and the probability of low-error samples was higher.
Overall, these findings confirm that the adaptive baseline method proposed in this study produced more accurate and stable inversion results compared with single baseline selection strategies. Therefore, it is more suitable to serve as the label dataset for subsequent model training.
3.2. Analysis and Comparison of Model Prediction Results
To validate the feasibility of using PolInSAR-derived forest canopy height results as label sets for training and constructing large-scale forest height prediction models, this study employed six base models and one ensemble model. Model training and tuning were conducted in the training area (Pongara National Park), while predictions and accuracy assessments were performed in the testing area (Akanda National Park).
3.2.1. Visualization of Model Prediction Results
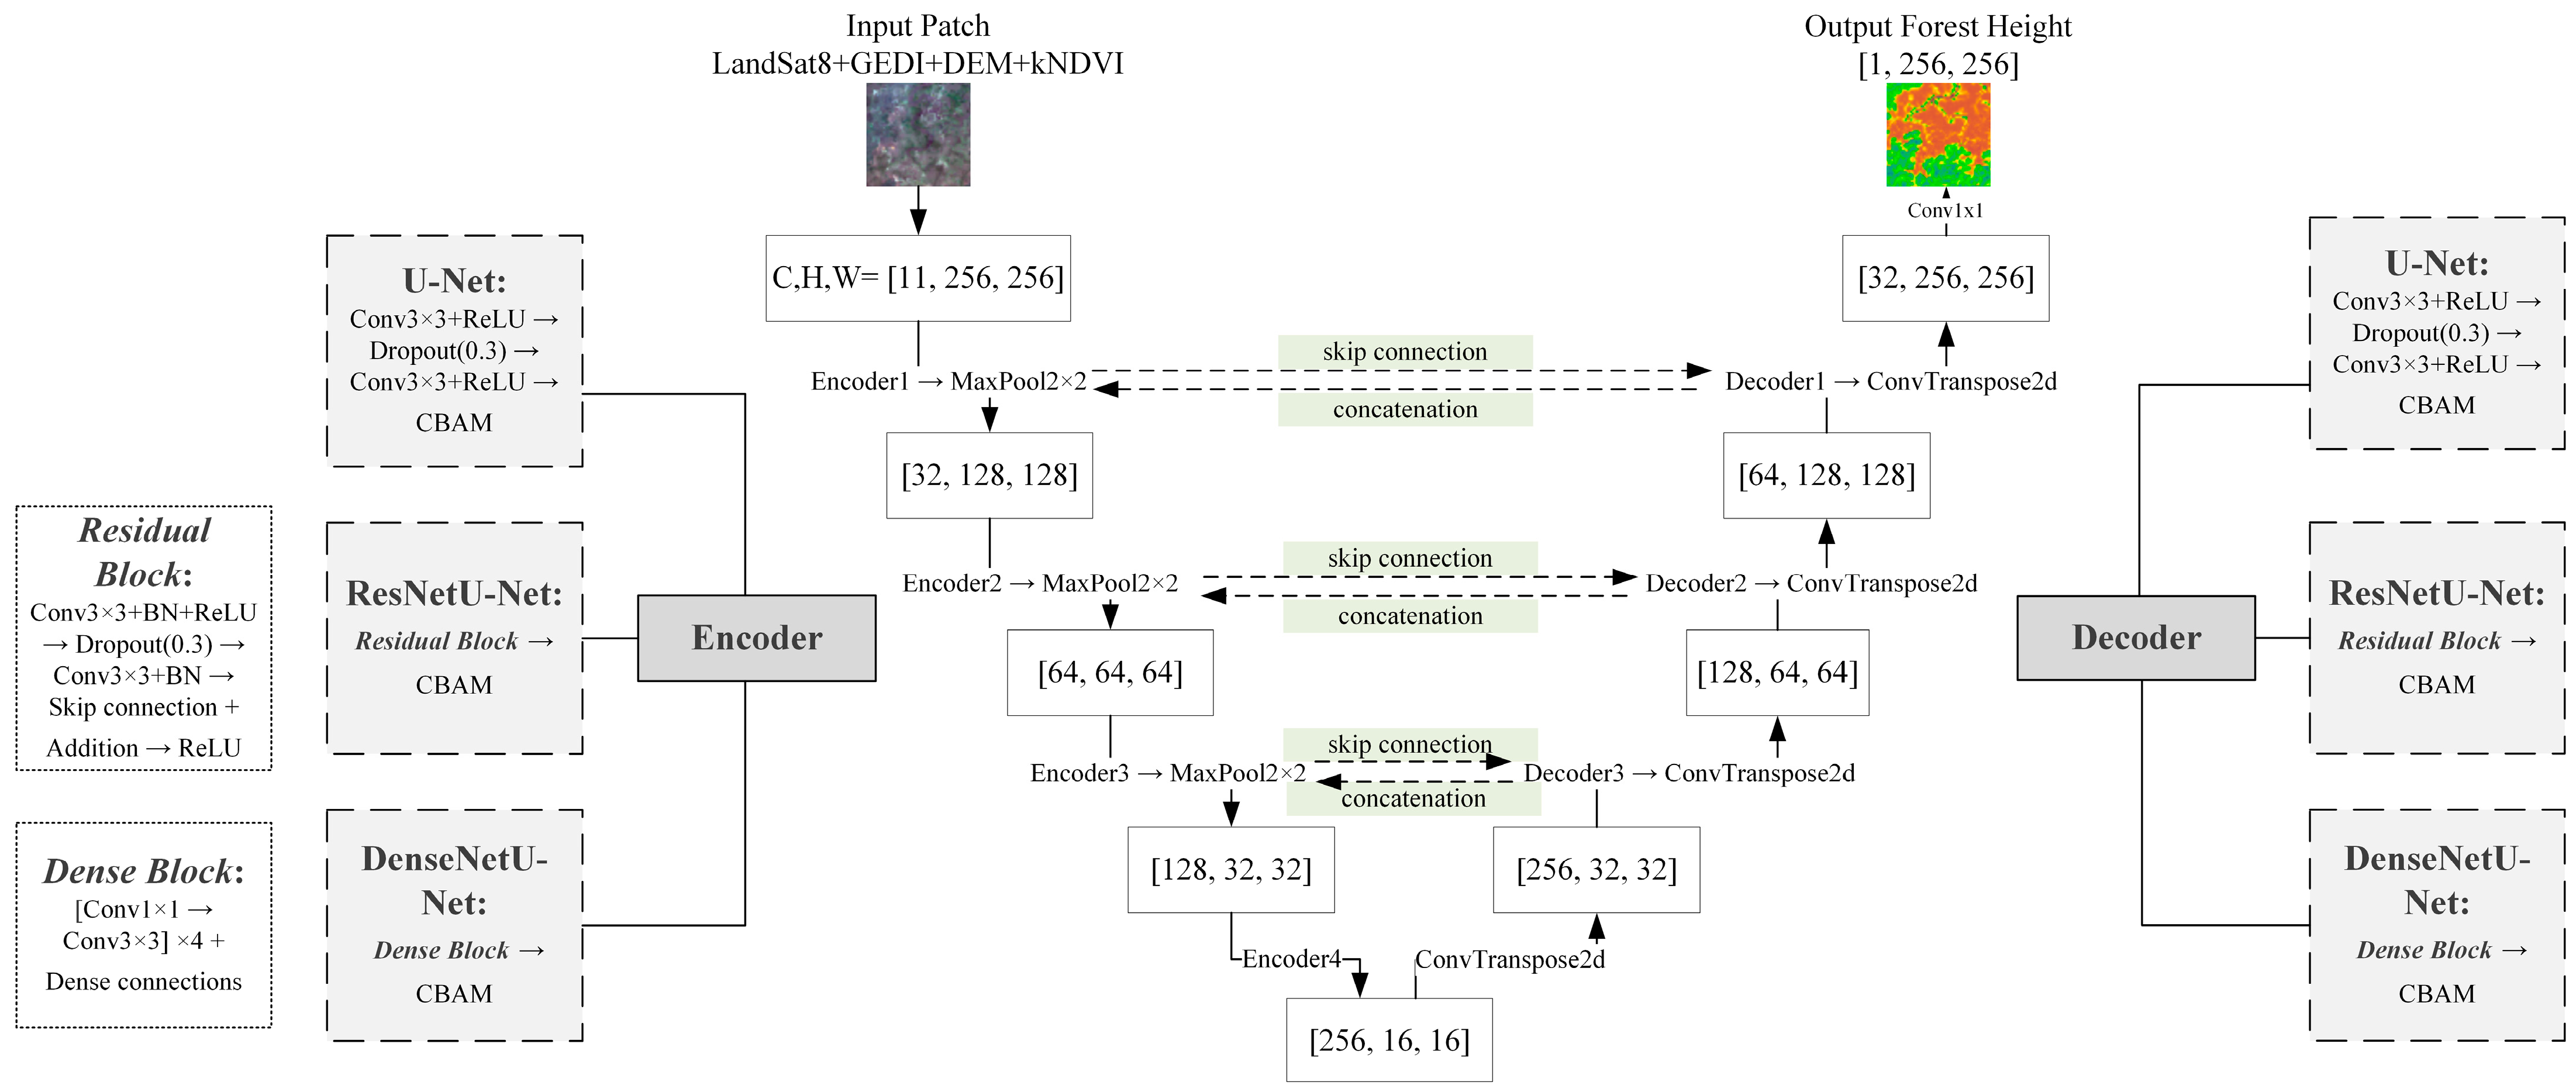
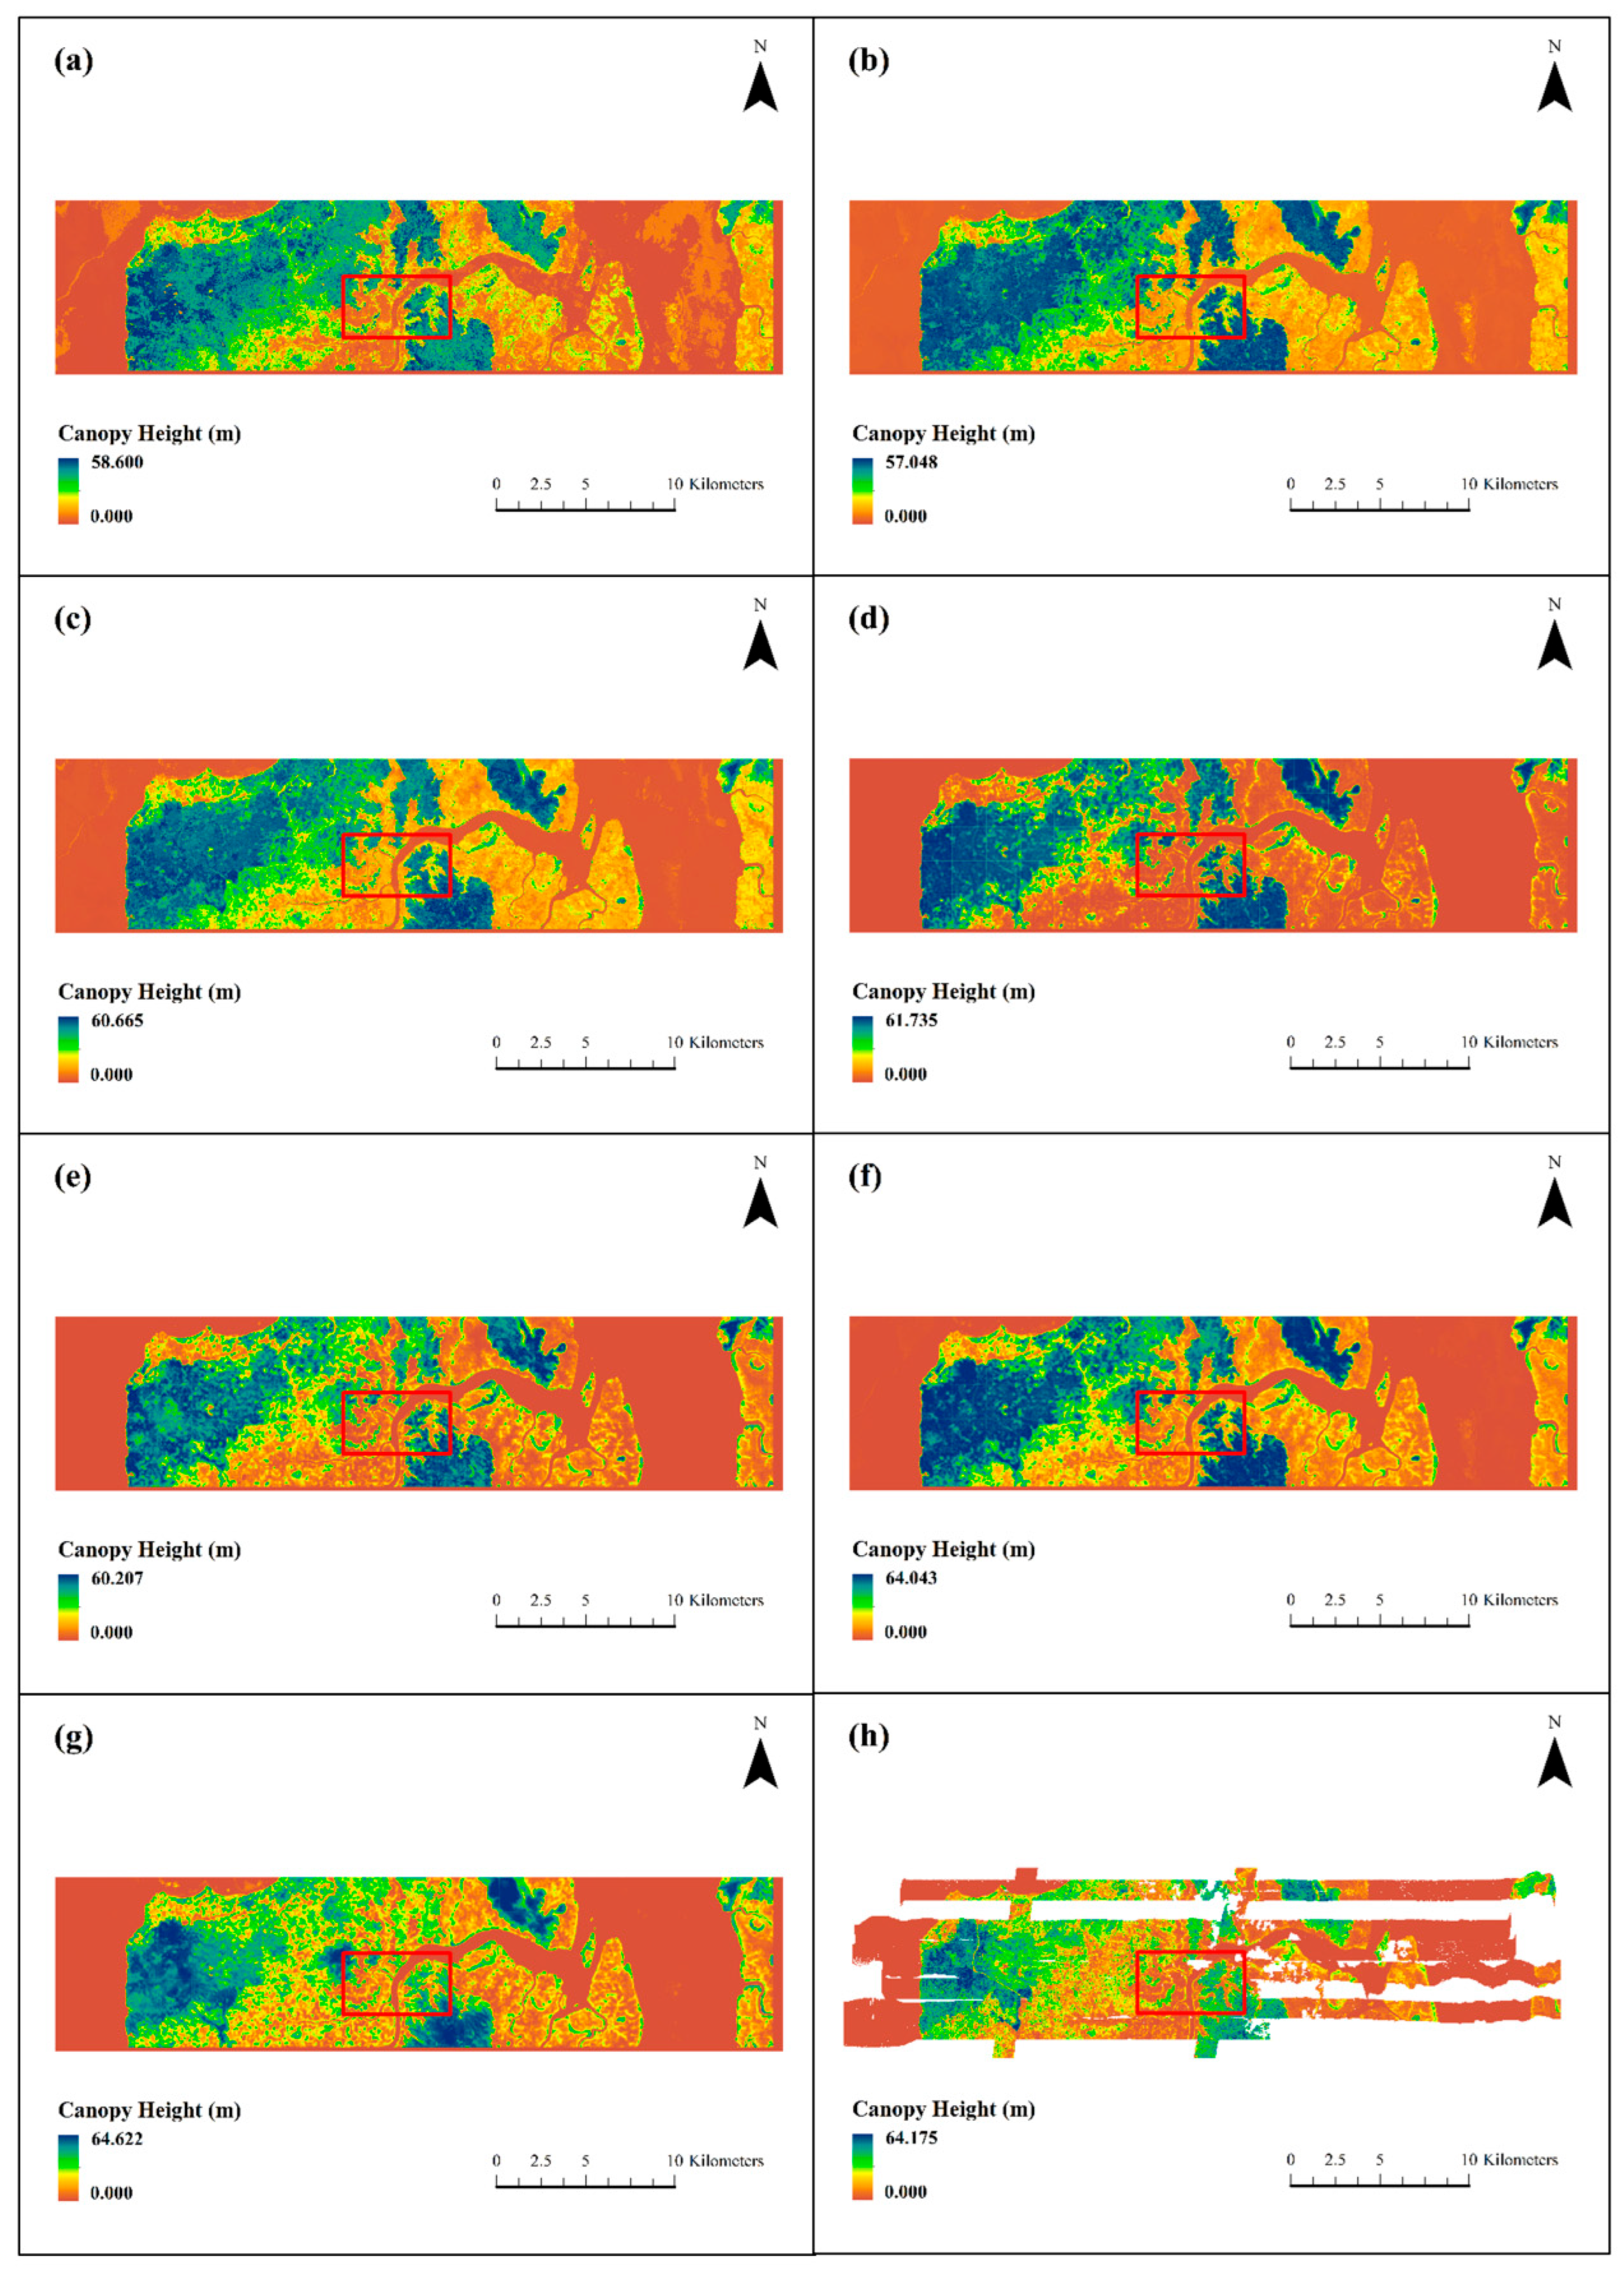
Figure 8 shows the overall prediction results of the six base models and the ensemble learning model in the testing area. Compared with the LVIS RH100 LiDAR data, the RF and XGBoost models significantly underestimated extremely high values, while the DenseNetU-Net model’s predictions for extreme values were closer to the observed data. In addition, machine learning models tended to produce prediction noise in large non-forest areas, with noise severity decreasing from RF to XGBoost to LightGBM. In contrast, among the deep learning models, only DenseNetU-Net exhibited a certain degree of noise in similar areas. However, because the deep learning models were trained on small patch samples rather than single-pixel feature vectors, they showed varying degrees of detail loss and slight stitching artifacts. The U-Net model was most affected, with substantial detail loss, whereas ResNetU-Net and DenseNetU-Net were less impacted. Meanwhile, the ensemble learning model, by integrating all base models, not only achieved predictions of extreme values closer to the observations but also largely eliminated noise interference and detail loss.
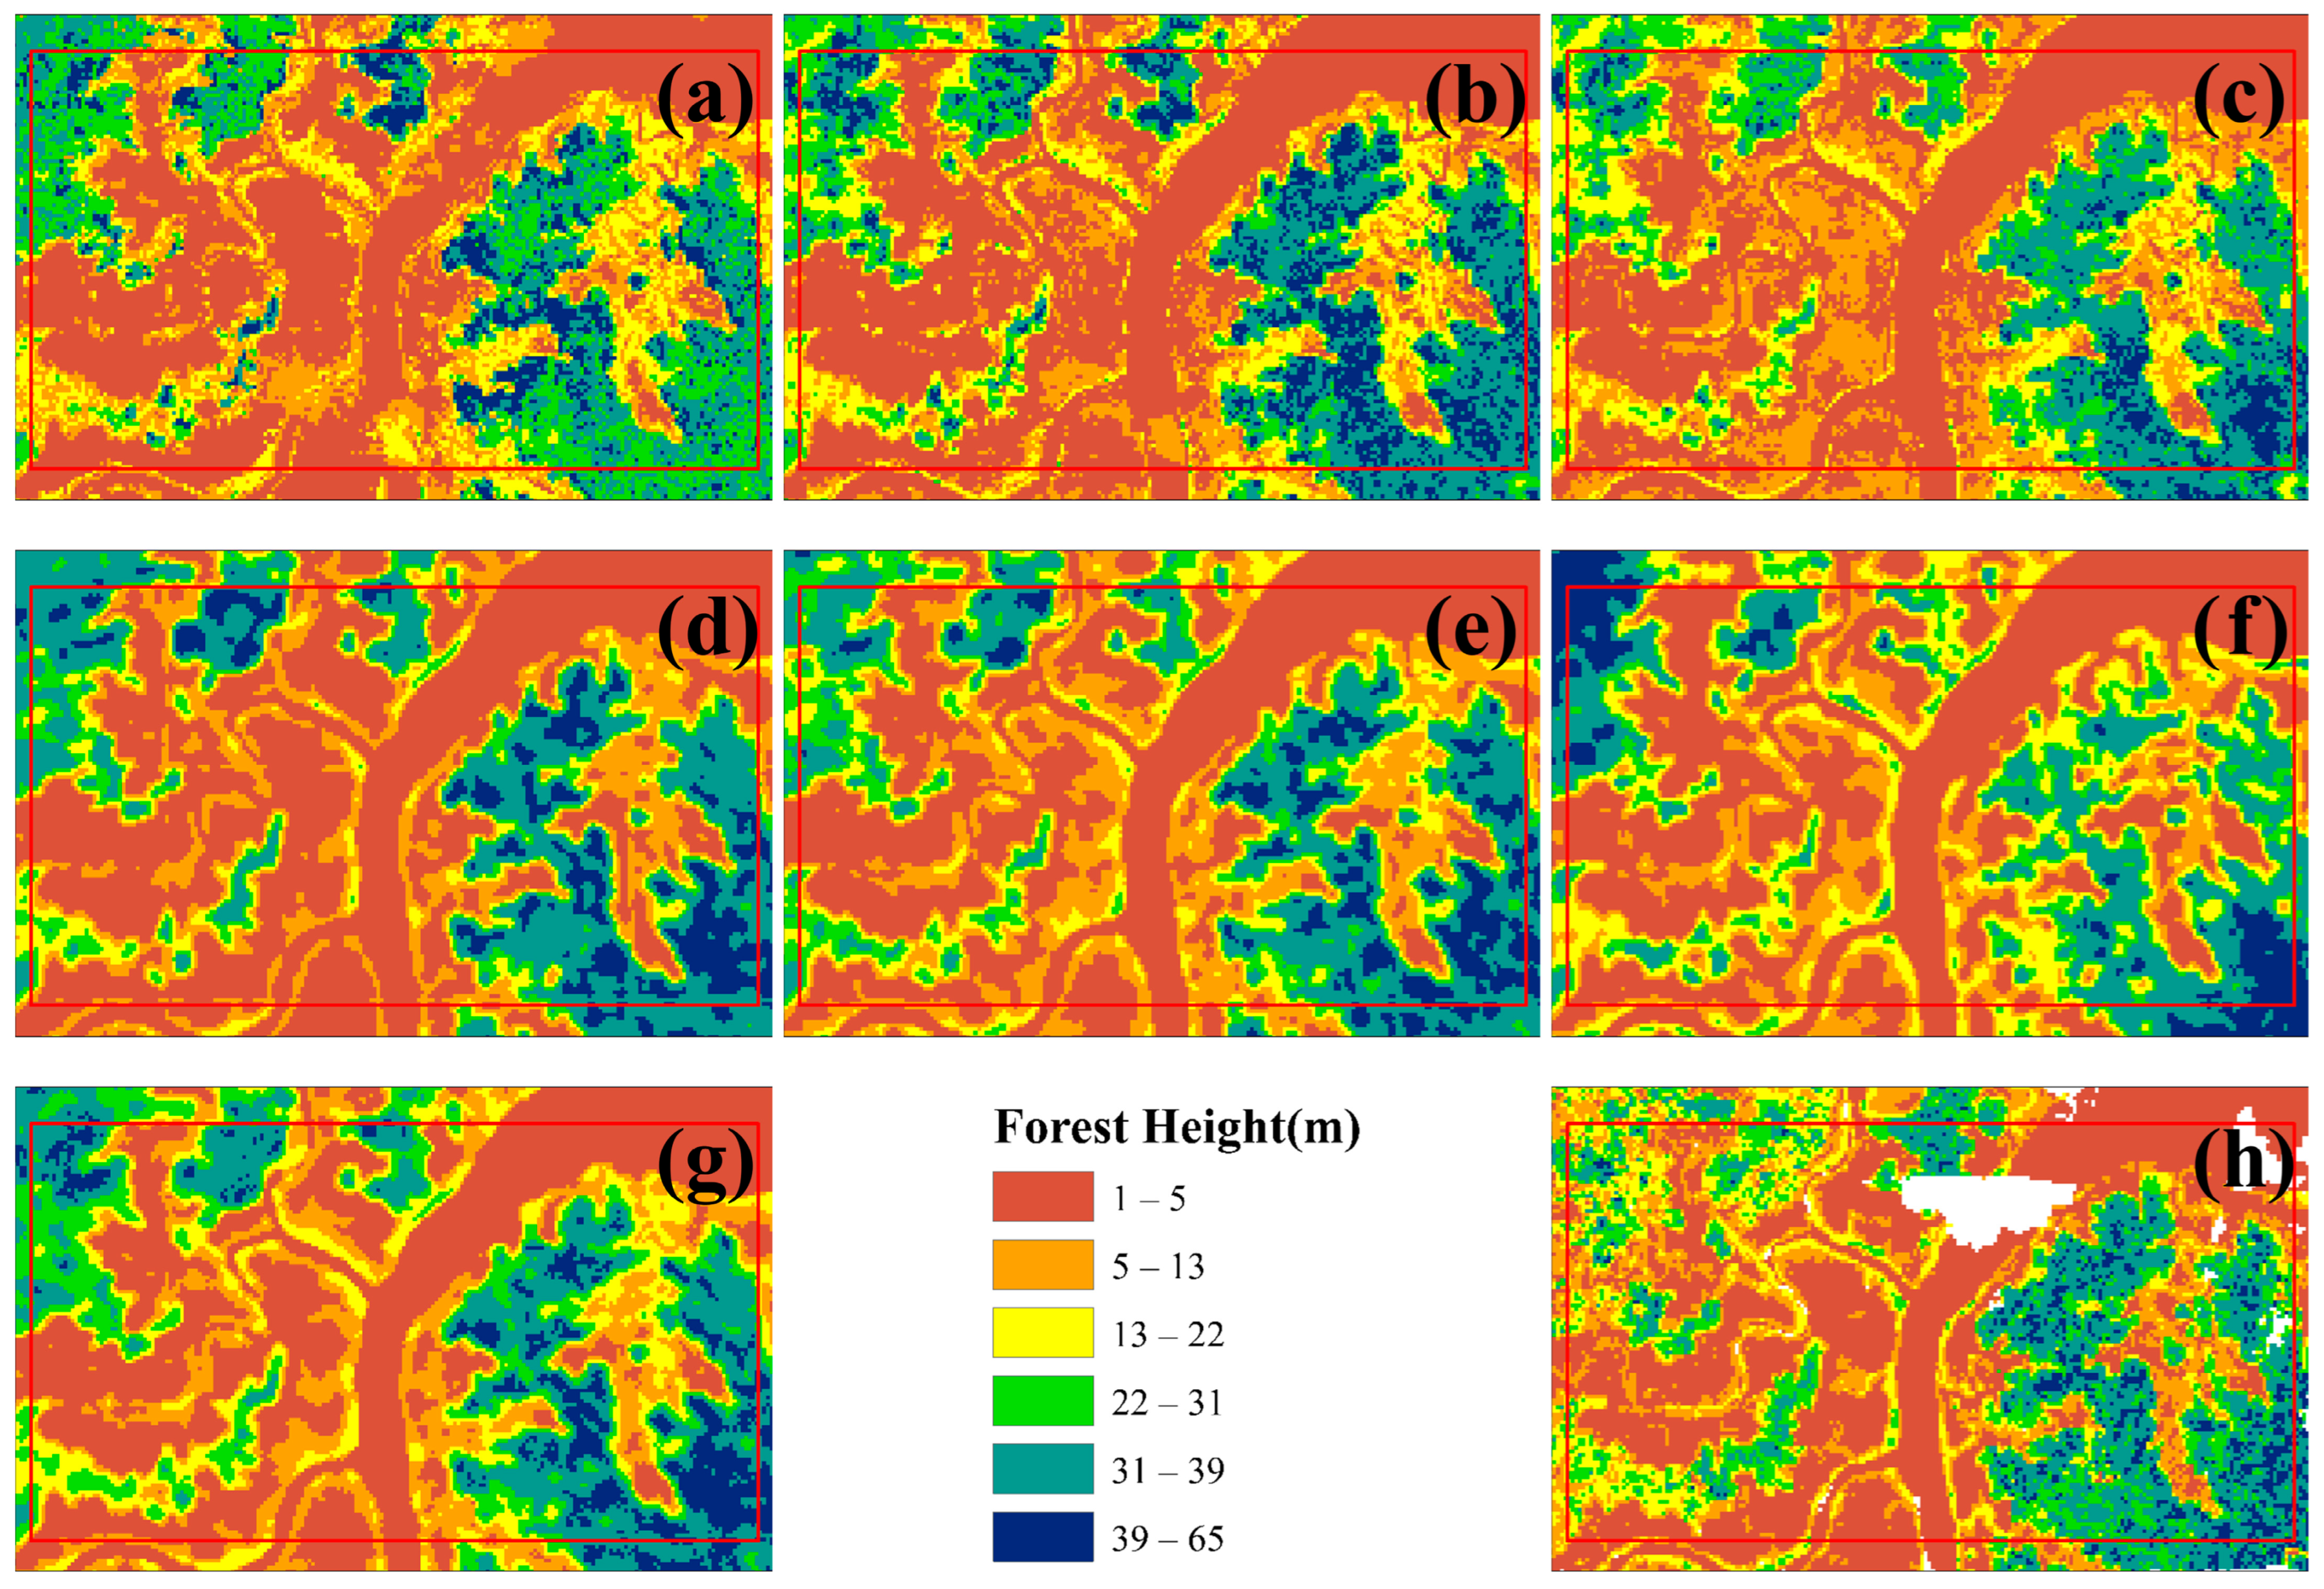
Figure 8 and
Figure 9 further illustrates local details after unifying the color scale. Compared with observed data, the machine learning models, which relied on single-pixel feature vectors for training and prediction, were more prone to noise in local predictions, with RF showing the most significant noise. By contrast, deep learning models produced smoother predictions with fewer details lost. Notably, ResNetU-Net, which captured details through residual connections, and DenseNetU-Net, which captured deeper terrain information through dense connections, showed prediction shapes and average distributions closer to the observed data. A comparative analysis revealed that machine learning models aligned better with observations in the mid-height range (13–31 m, corresponding to yellow and green in the legend), whereas deep learning models were more accurate in low and tall canopy regions. Finally, the ensemble learning model preserved local details, avoided noise, and achieved the closest prediction to the observed forest canopy height distribution, effectively combining the strengths of both machine learning and deep learning models.
3.2.2. Comparison and Analysis of Prediction Accuracy
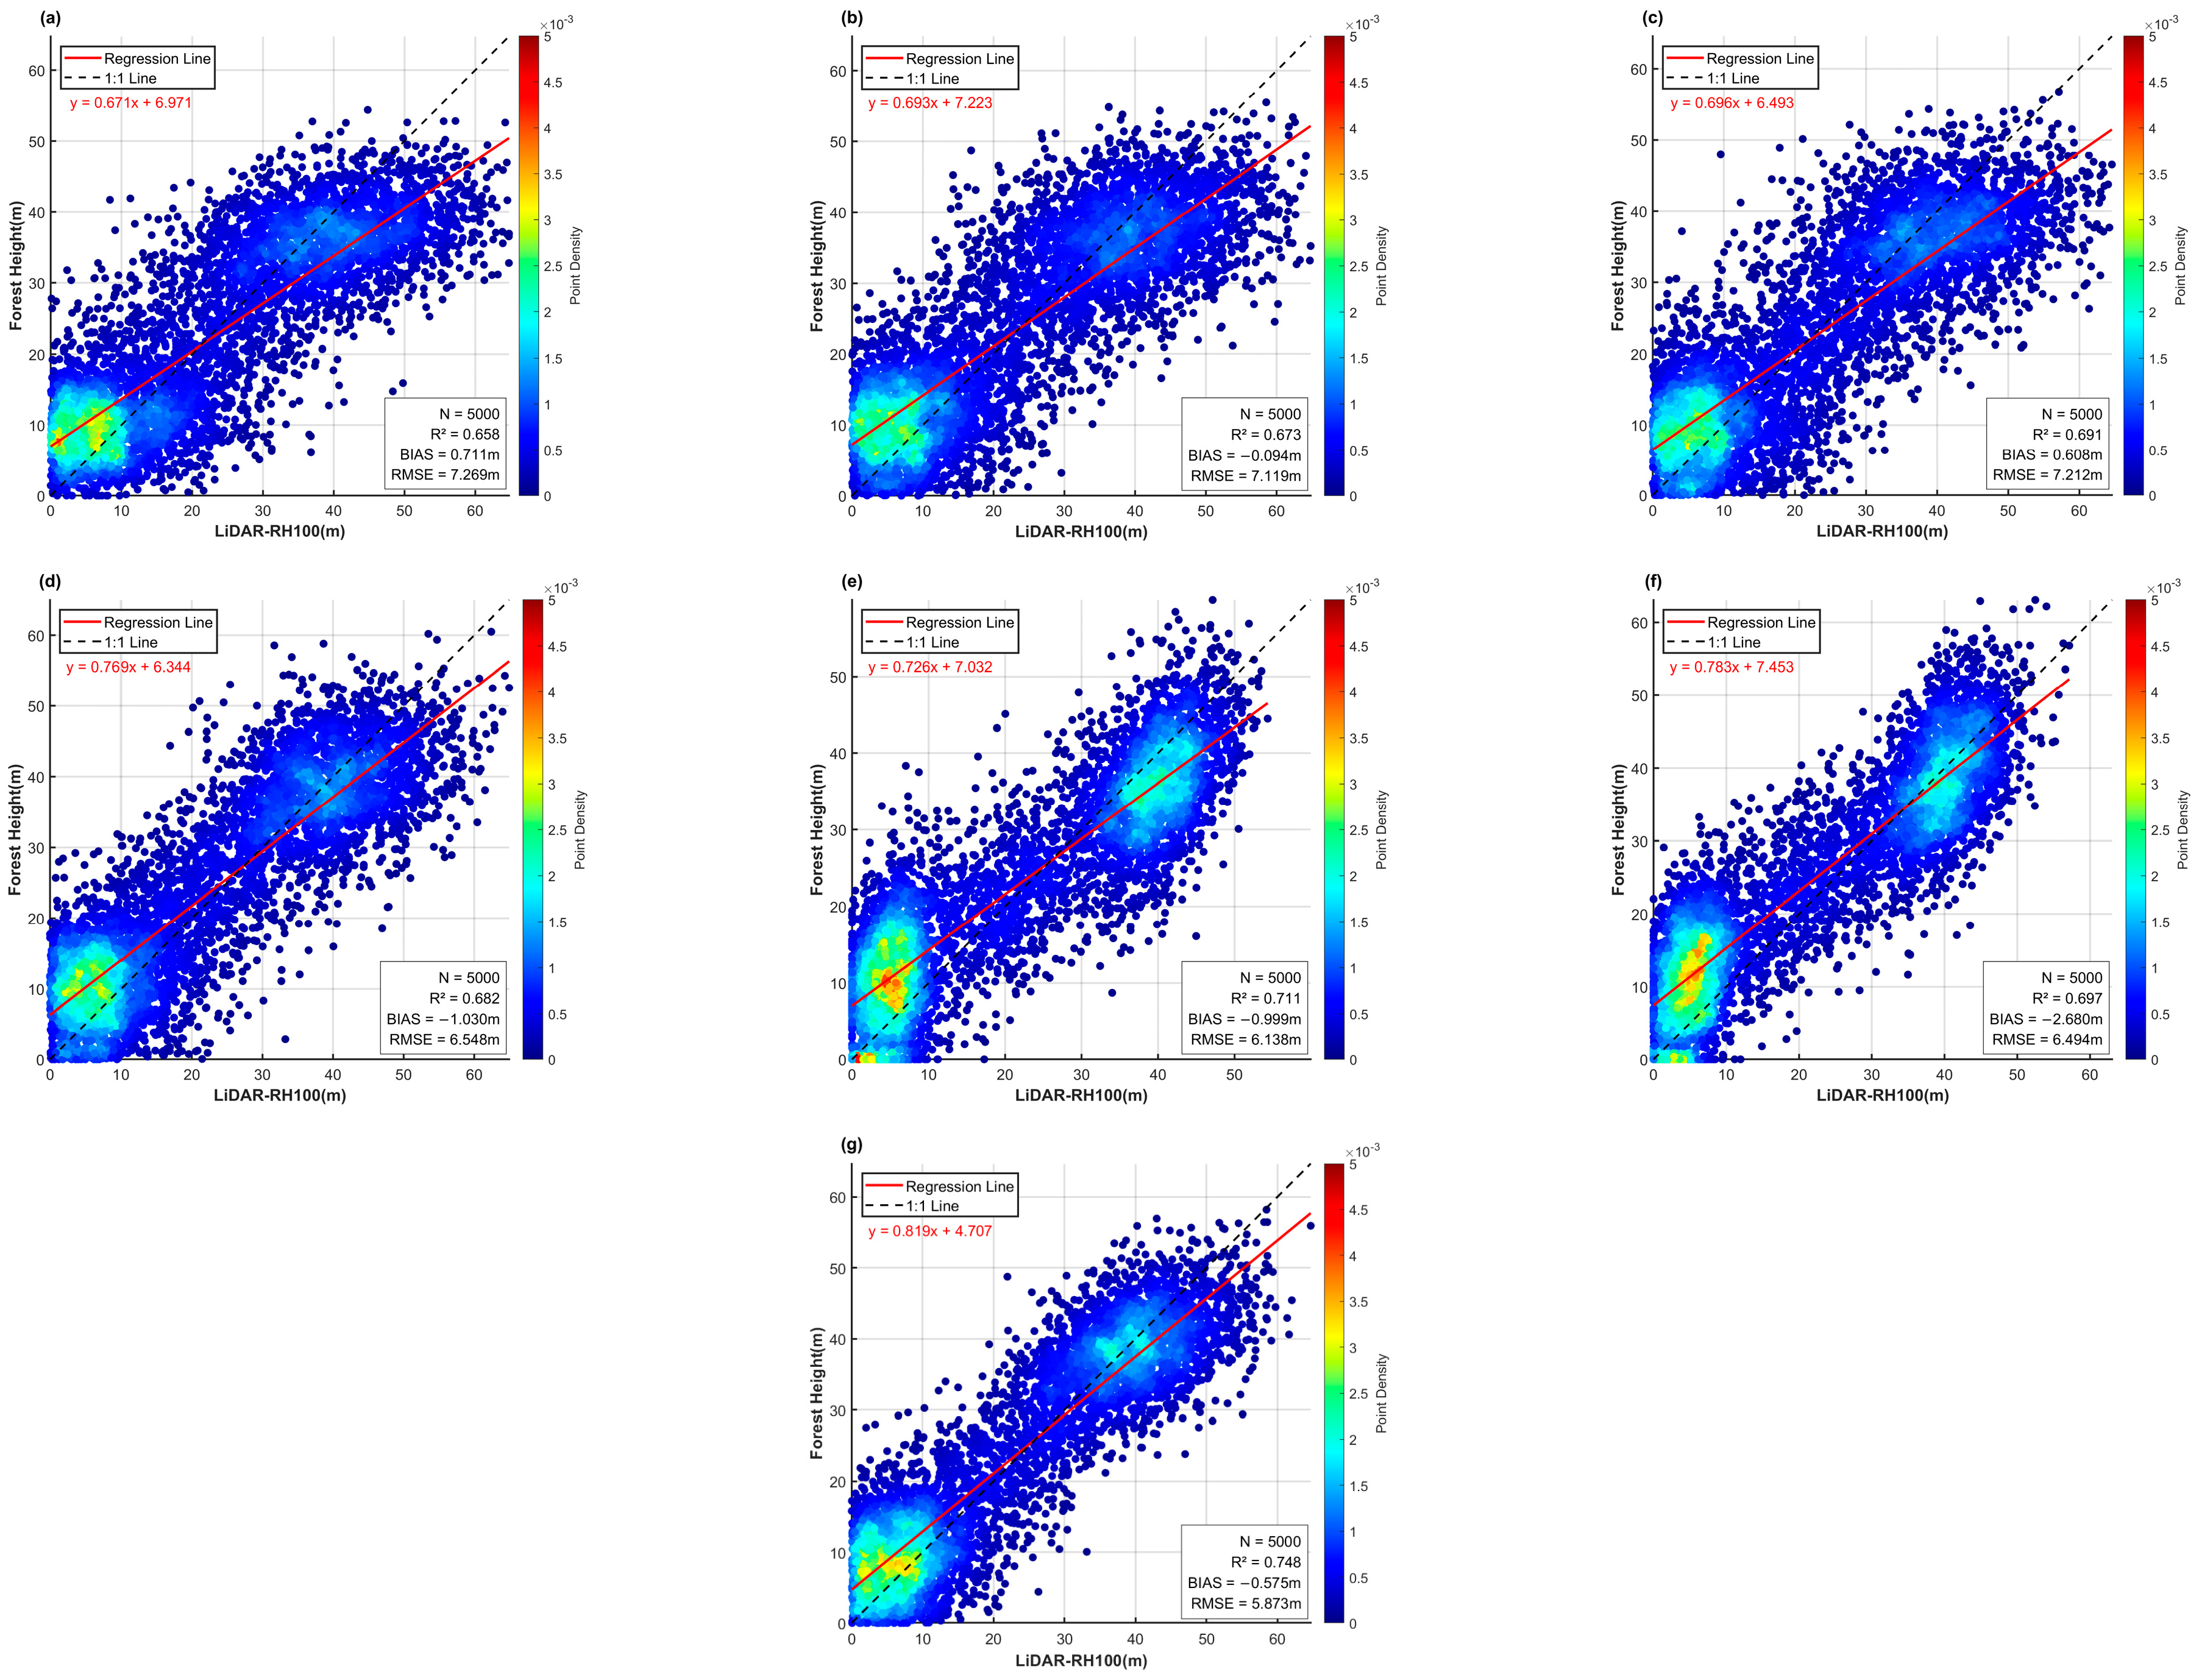
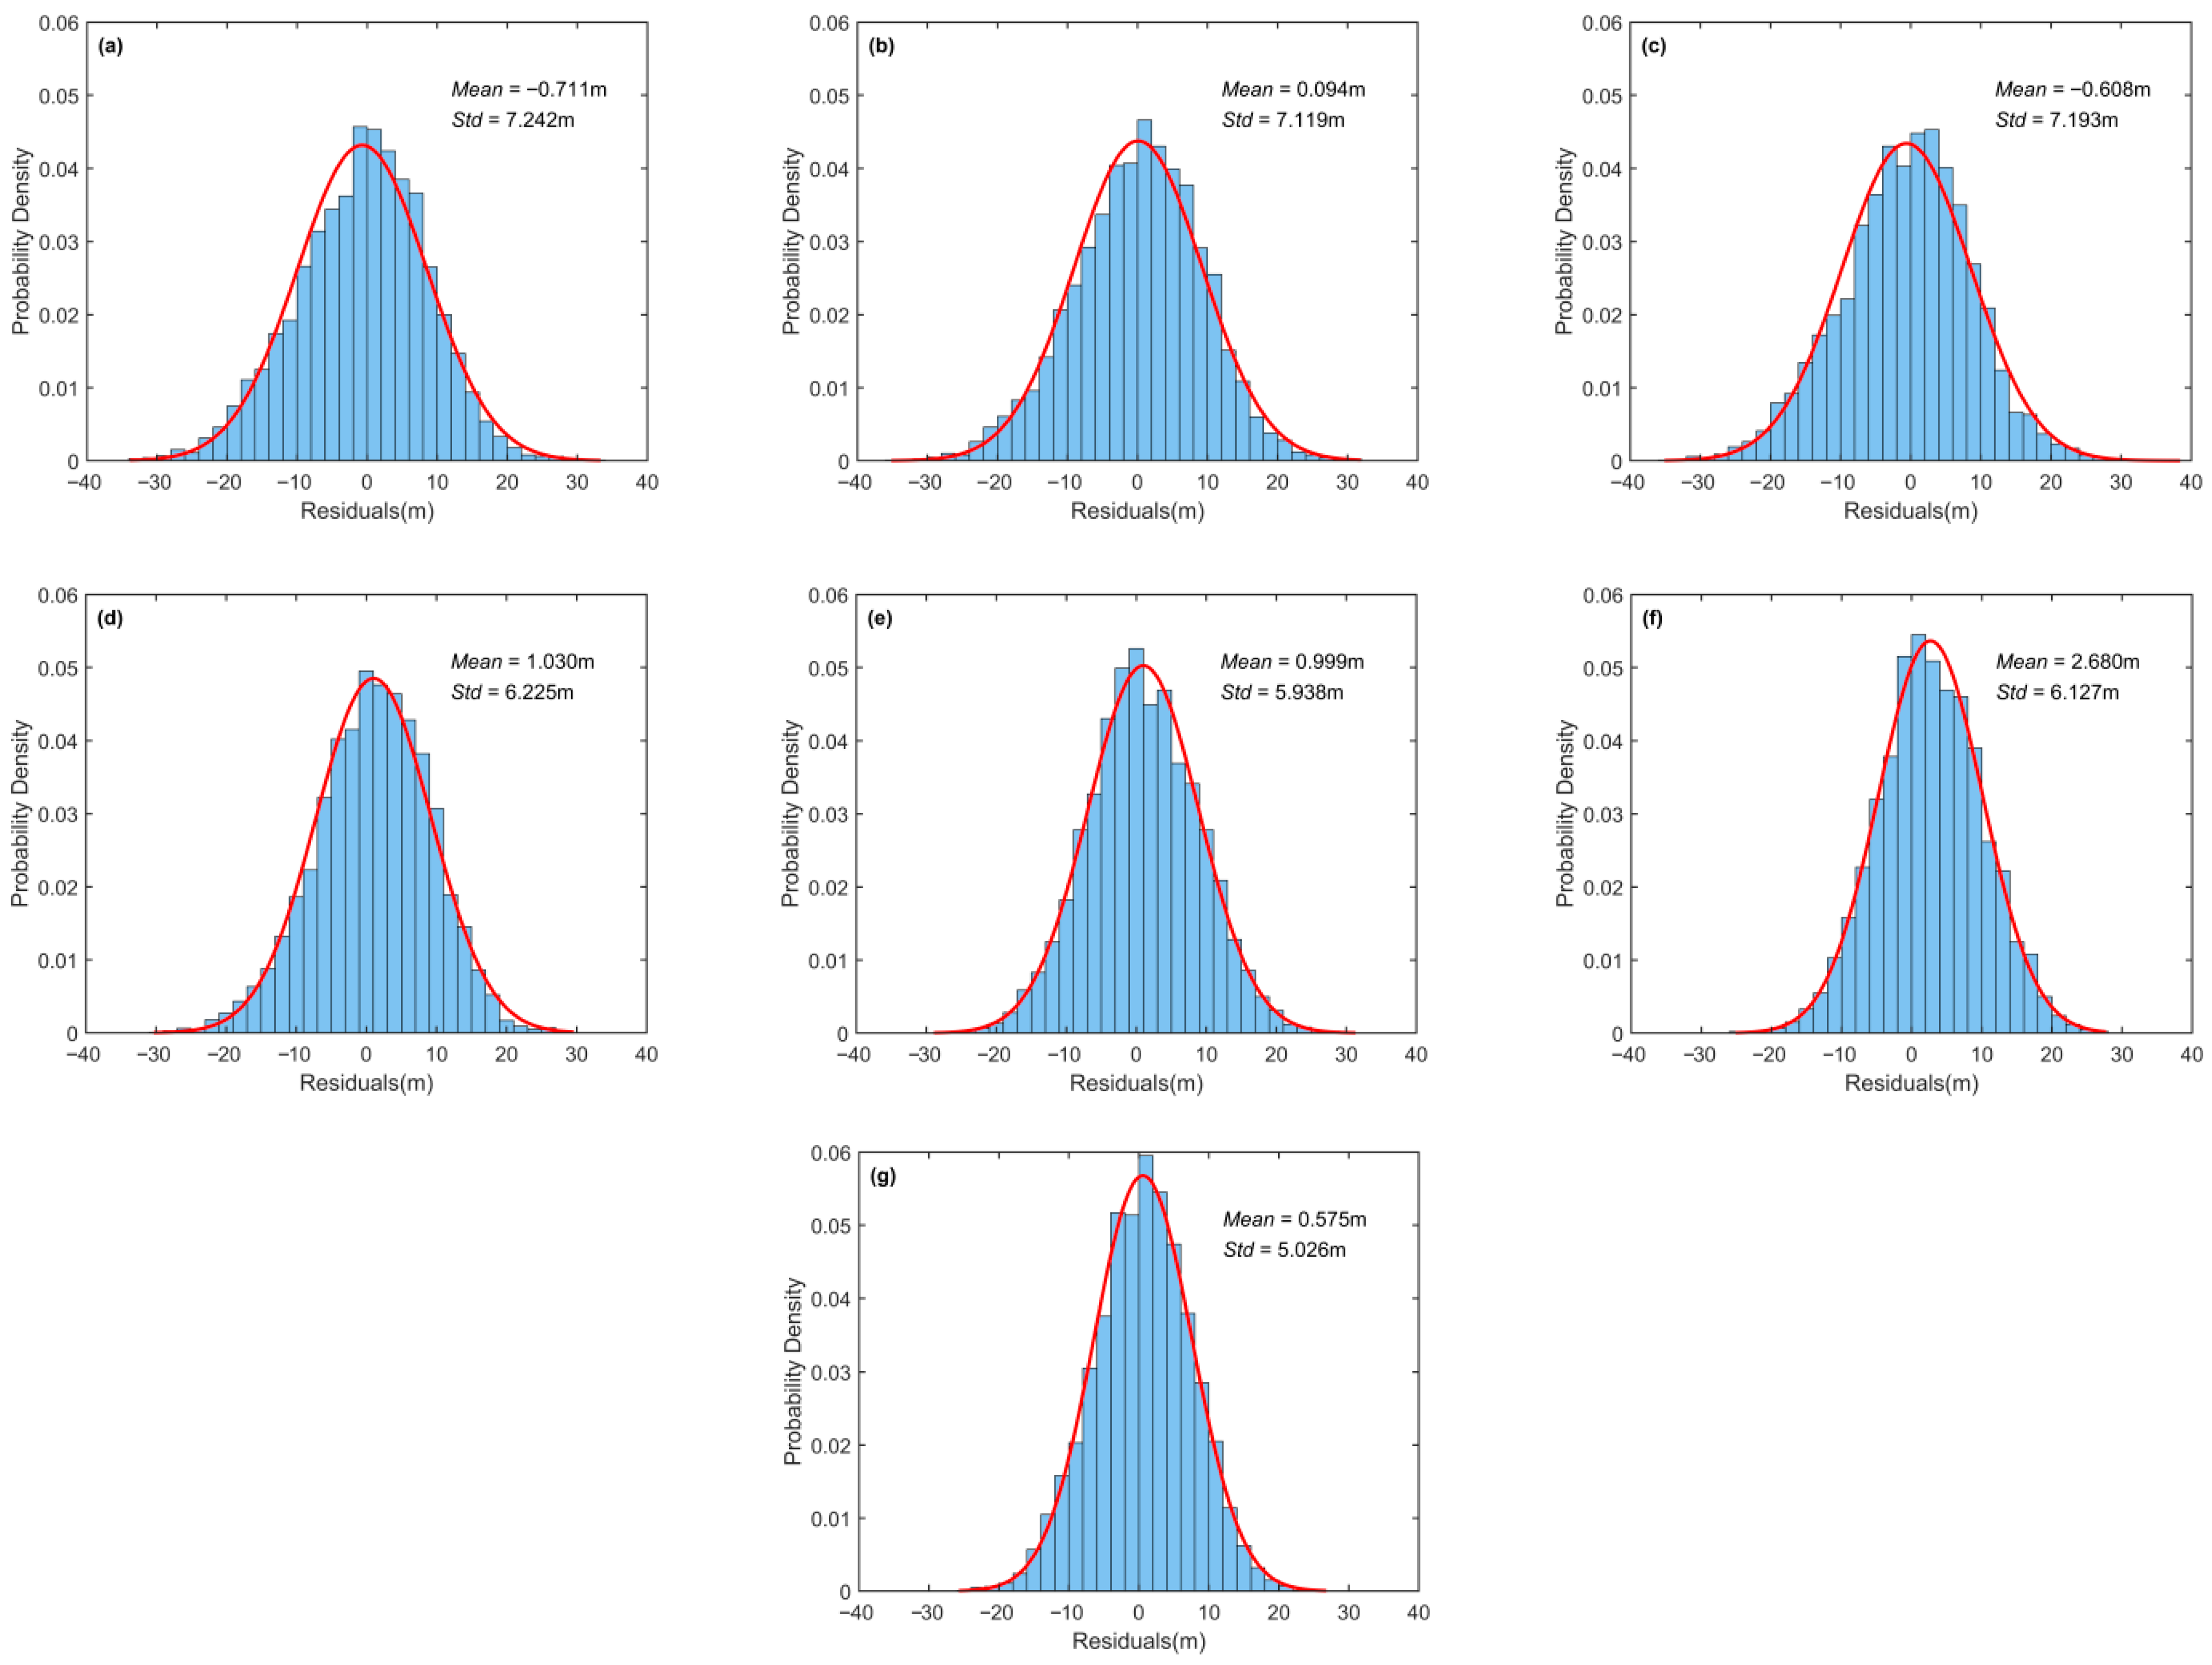
Figure 10 and
Figure 11 present the accuracy evaluation of the six base models and the ensemble learning model in the testing area. The results show that deep learning models generally had smaller prediction errors and better stability than machine learning models, consistent with the conclusions from
Section 3.2.1. Among the base models, ResNetU-Net performed best, reducing RMSE to 6.138 m, lowering the error standard deviation to 5.938 m, and achieving an R
2 of 0.711. These findings also aligned with its superior visualization performance in
Section 3.2.1. Moreover, the ensemble model consistently reduced errors and improved stability compared with each base model. Specifically, it achieved an RMSE of 5.873 m and an R
2 of 0.748, both superior to all base models. The error standard deviation of the ensemble model was as low as 5.026 m, and its residual histogram indicated a higher probability of small-error samples. These results confirm that the proposed ensemble model achieved the best overall performance.
3.2.3. Comparison with Existing Global Models
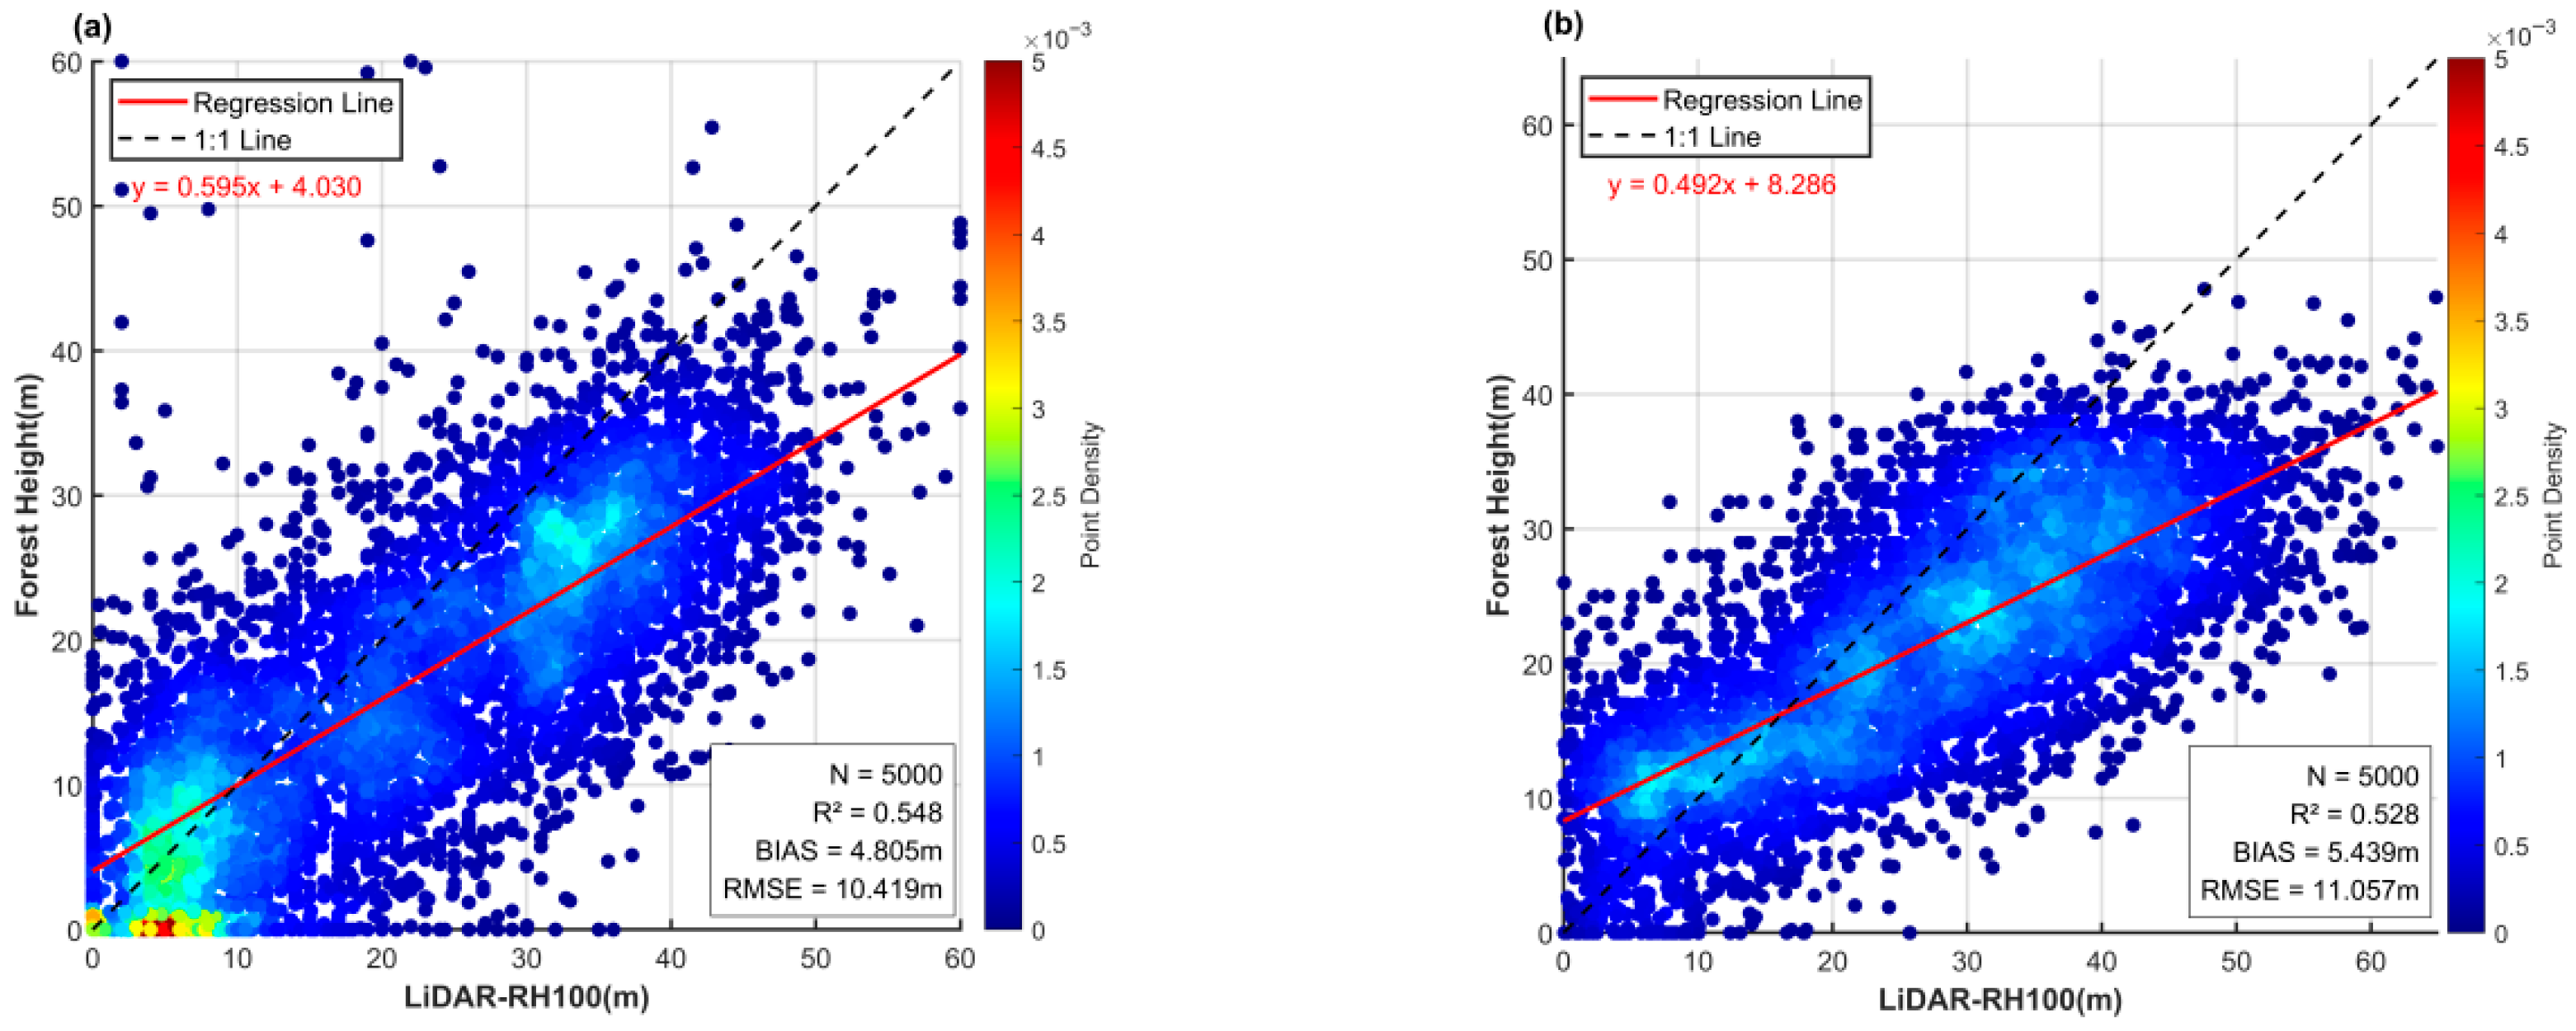
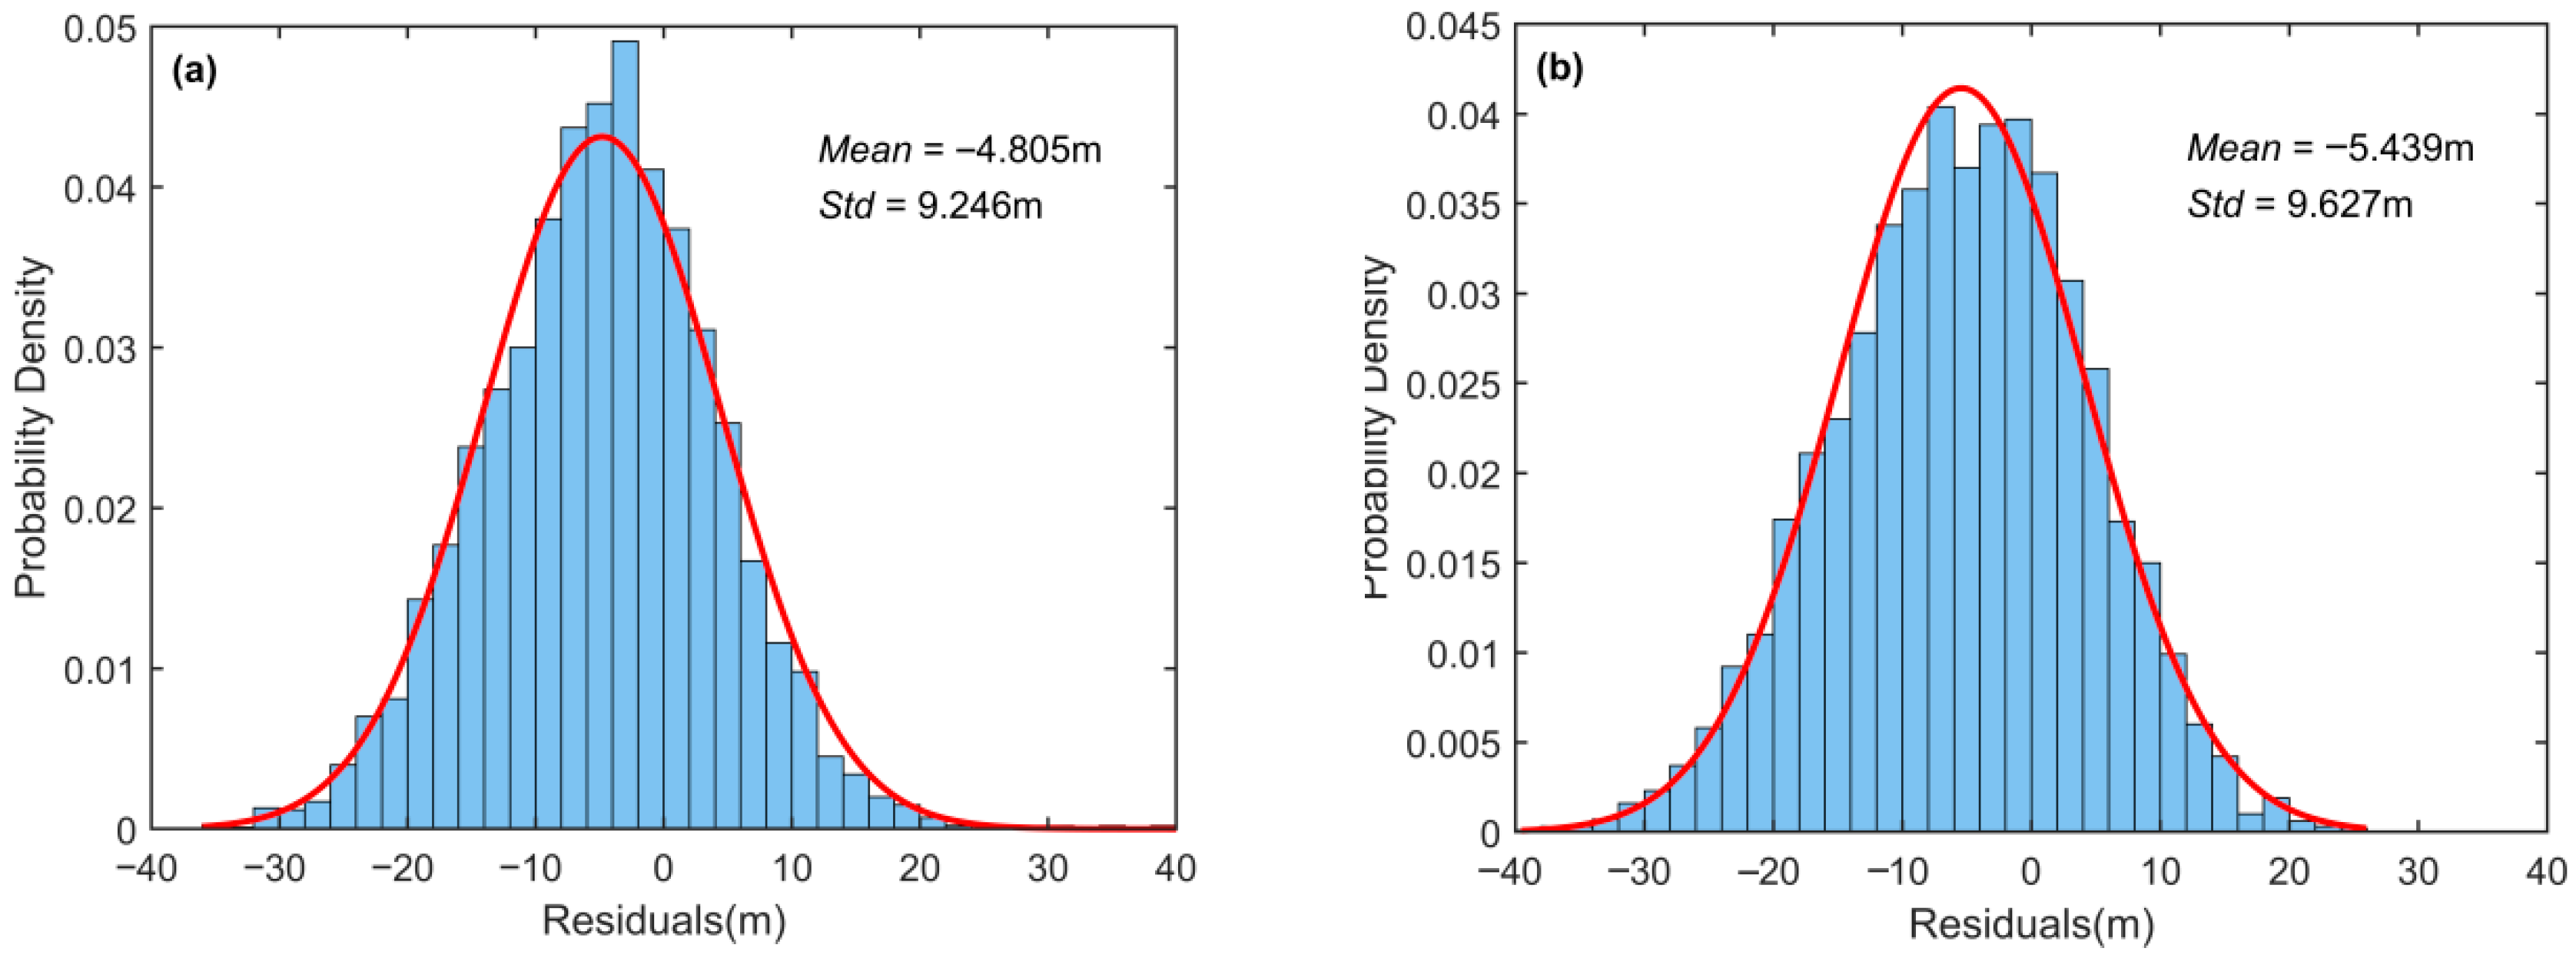
Due to the limited availability of GEDI LiDAR footprint samples in the study area, training the proposed model using GEDI data alone as the label set failed to achieve convergence. This indirectly demonstrates the unique advantage of the label set employed in this study for small-scale forest canopy height estimation. Therefore, in
Table 5,
Figure 12 and
Figure 13, we directly compared the prediction accuracy of two publicly available global canopy height datasets, both of which used GEDI LiDAR data as labels with large sample sizes. Potapov et al. [
20] employed Landsat-8, NDVI, and DEM as inputs to train machine learning models, while Lang et al. [
21] used Sentinel-2 data as inputs for deep learning models. Although both models achieved good accuracy at the global scale (
Table 6)—Potapov et al. [
20] reported RMSE = 9.07 m, MAE = 6.36 m, R
2 = 0.61, and Lang et al. [
21] reported RMSE = 6.0 m, MAE = 4.0 m—their performance weakened in local areas such as our study site. Both models exhibited significant underestimation in our testing region. This indicates that when the research objective is to obtain more accurate canopy height mapping and prediction at local scales, the ensemble learning approach proposed in this study is more suitable.
3.3. Analysis of Model Channel Sensitivity Results
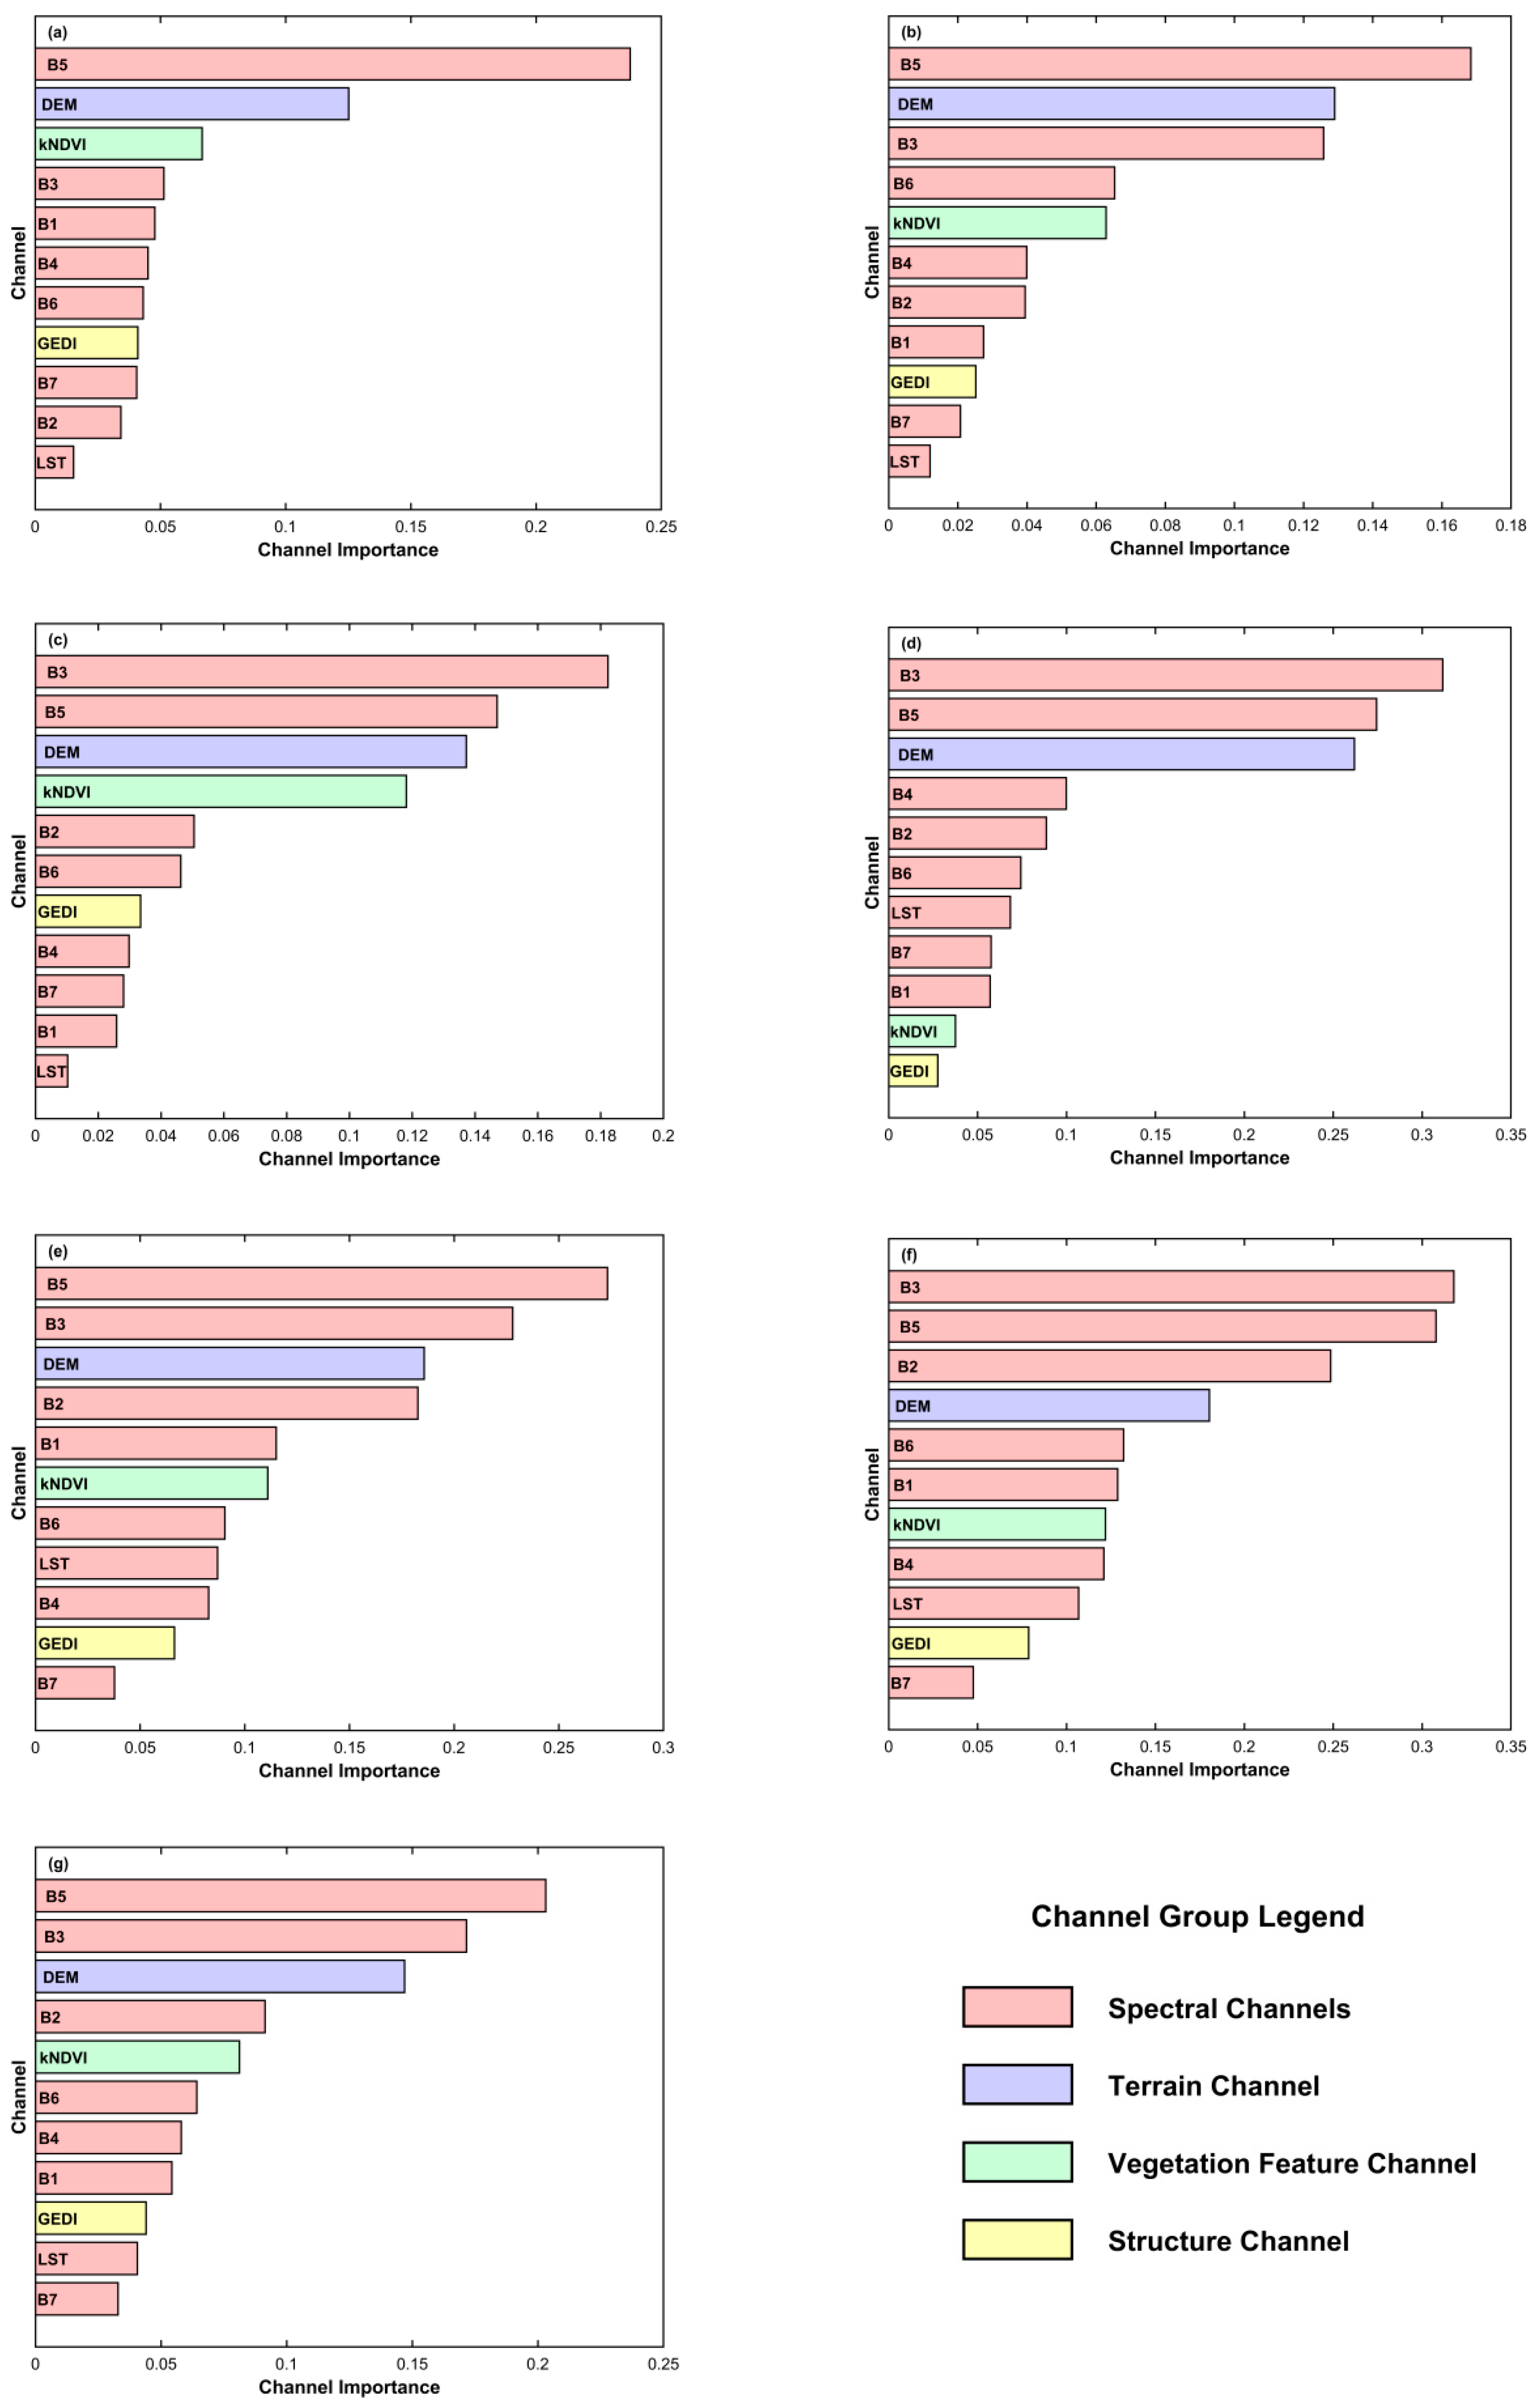
Figure 14 presents the contributions of different channels to the importance ranking during training for the six base models and the ensemble learning model in this study. For Landsat 8 data, bands B1 to B7 correspond to Coastal aerosol, Blue, Green, Red, NIR, SWIR 1, and SWIR 2 channels, respectively (
Table 2).
Specifically, for machine learning models, the common key channels are vegetation related spectral bands (Green, NIR), the vegetation feature channel (kNDVI), and the topographic feature channel (DEM). In contrast, for deep learning models, the most important channels are primarily Green, NIR, and DEM, while the relative importance of the vegetation feature channel (kNDVI) decreases. Notably, for both categories of base models, the GEDI channel containing canopy height information ranks lower in importance; however, in machine learning models, GEDI ranks slightly higher than in deep learning models.
The reason for the relatively lower importance of kNDVI and GEDI in deep learning models may lie in their different mechanisms of feature extraction. Machine learning models analyze the numerical correlation between pixel feature vectors and target values, with more complex models better able to capture mathematical relationships. By contrast, deep learning models rely on a dual loss function combining numerical error (MSE) and structural similarity error (SSIM) to capture spatial similarity across patches. Combined with the visualization results in
Section 3.2.1, it is evident that deep learning models tend to capture structural and mean-value trends, which likely contributes to the reduced importance of kNDVI and GEDI channels. Meanwhile, since the GEDI channel in this study is derived from the global GEDI dataset released by Potapov et al. [
22], together with the accuracy validation results for this dataset in our study area (
Section 3.2.2), it is reasonable to infer that the lower contribution of GEDI channels across models may be partly due to the inherent accuracy limitations of the dataset itself.
Overall, in the ensemble learning model that integrates all base models, the pattern of channel importance remains consistent with that of the individual models. The commonly shared key channels include vegetation-related spectral bands (Green and NIR), the topographic channel (DEM), and the vegetation feature channel (kNDVI), while the least contributing channels are the land surface temperature (LST) and the longer-wavelength shortwave infrared bands.
4. Discussion
This study proposed an ensemble learning framework that integrates airborne PolInSAR-derived canopy height labels with multi-source remote sensing data to address the uncertainty of sparse LiDAR-based models in heterogeneous tropical forests. Compared with conventional interpolation-dependent methods, this framework generates continuous high-quality labels and adaptively fuses complementary features across spectral, structural, and topographic dimensions.
The key advantage of PolInSAR over traditional remote sensing techniques lies in its ability to accurately characterize vertical canopy structure. By jointly exploiting polarization and interferometric information, PolInSAR can effectively separate surface and vegetation scattering components and capture vertical height differences through interferometric phase analysis, providing unique advantages in structurally complex tropical mangrove environments such as those in Gabon. The airborne L-band radar used in this study provides strong canopy penetration capability, forming a continuous scattering profile from the canopy top to the ground. While the RVoG-VTDs model introduces a temporal decorrelation term (
) to quantify coherence loss caused by random leaf and branch motion, and this enables more accurate separation of canopy and ground phases, reducing the bias of conventional RVoG models that often misinterpret temporal decorrelation as canopy thickness [
44].
Furthermore, the proposed hybrid baseline strategy (PROD+ECC) optimizes baseline selection across different canopy height ranges. The PROD method enhances inversion stability in tall forests (>30 m) with large coherence separation between canopy- and ground-dominated components (
) and in short forests (<10 m) with low separation, while the ECC method improves performance in mid-height forests (10–30 m) by selecting baselines with higher linearity [
45]. Experiments demonstrated that this strategy increased inversion accuracy by about 25%, confirming that a multi-baseline approach based on canopy height stratification can effectively mitigate errors caused by signal saturation or coherence ambiguity.
This study also integrates optical, LiDAR, topographic, and vegetation index features (
Table 2) to jointly capture canopy height variation from spectral, structural, and terrain perspectives. Channel importance analysis showed that vegetation-related spectral bands (Green, NIR), terrain elevation (DEM), and the enhanced vegetation index (kNDVI) contributed most across models. Physically, the Green band (B3) relates to chlorophyll content and canopy vigor, aiding the distinction between young and mature stands [
8]; the NIR band (B5), controlled by leaf cellular structure, correlates with leaf area index and indirectly indicates canopy thickness [
8]; DEM represents terrain variation, correcting reflectance distortions and reflecting growth constraints such as reduced canopy height on steep slopes [
52]; and kNDVI, less affected by soil background and saturation at high biomass, effectively differentiates canopy developmental stages [
53].
Notably, the GEDI-derived vertical structure data contributed less to local model performance, likely due to systematic biases of global products at finer spatial scales (RMSE > 10 m). Deep learning models showed lower dependence on GEDI and kNDVI than machine learning models, probably because they autonomously extract spatial and contextual structure from raw spectral and terrain inputs rather than relying on predefined indices or secondary products.
Compared with the global canopy height products by Potapov et al. [
20] and Lang et al. [
21], the proposed method achieved lower RMSE (5.87 m) and higher R
2 (0.748) in the local test region. This improvement arises from three key factors: (1) Label enhancement—PolInSAR-derived continuous labels reached RMSE = 5.38 m and R
2 = 0.857 in the Pongara area, reducing error propagation from heterogeneous and interpolated GEDI/ICESat-2 footprints; (2) Model architecture optimization—the dual-layer ensemble dynamically balances the spectral sensitivity of machine learning and the structural perception of deep learning, achieving bias < 1 m compared with >4 m in Potapov et al. [
20] and Lang et al. [
21]; and (3) Feature refinement—in contrast to Potapov et al. [
20] and Lang et al. [
21], this study incorporated more physically grounded inputs such as DEM, GEDI, and kNDVI, which jointly enhanced model accuracy.
Nevertheless, our study has certain limitations. First, the experimental area was restricted to the PolInSAR coverage in Gabon; broader validation is needed to test generalizability across other forest types. Second, the diversity of multisource inputs was limited; incorporating additional features such as climate variables and SAR polarimetric indices may further enhance interpretability and robustness. Third, while PolInSAR inversion labels avoid the drawbacks of interpolation and sparse supervision, error propagation remains an issue; thus, exploring alternative or improved label sources is essential. Notably, the recent launch of ESA’s BIOMASS P-band SAR satellite offers new opportunities [
62], as it will provide more penetrating and accurate forest parameters, including canopy height and biomass. Such datasets are expected to help overcome current limitations in data coverage, type, and accuracy, enabling more robust forest monitoring.
In conclusion, our study represents an attempt to construct novel labels based on airborne PolInSAR canopy height inversion, combined with multi-source remote sensing data to build and integrate multiple training models. The objective is to develop a canopy height prediction framework that does not rely on discontinuous LiDAR labels, thereby enabling applications in locally complex forest environments. The proposed ensemble learning model demonstrates optimal performance under the current study area and data availability. With the continuous accumulation of PolInSAR data and the incorporation of emerging satellite observations in the future, the model will be further refined and updated. We will continue to optimize the framework to achieve higher stability, improved accuracy, and stronger generalization capability in forest canopy height prediction.
