Article

Understanding the Anomalies in Exotic Annual Grass Cover in Precipitation Scenario Maps of Rangelands in the Western United States

1
KBR, Inc., Contractor to the U.S. Geological Survey (USGS) Earth Resources Observation and Science (EROS) Center, Sioux Falls, SD 57198, USA
2
U.S. Geological Survey (USGS) Earth Resources Observation and Science (EROS) Center, Sioux Falls, SD 57198, USA
*
Author to whom correspondence should be addressed.
Remote Sens. 2025, 17(23), 3821; https://doi.org/10.3390/rs17233821
Submission received: 22 September 2025 / Revised: 19 November 2025 / Accepted: 23 November 2025 / Published: 26 November 2025

Highlights

What are the main findings?
  • We found locations where Exotic Annual Grass (EAG) cover does not follow typical patterns in precipitation scenarios modelling.
  • Locations with high elevation, silt, sand, solar radiation, and/or high perennial grass cover were found to have a higher density of lower-than-expected EAG cover in wet precipitation scenarios while areas with low clay content, low perennial grass cover, and/or high elevation had a higher density of higher-than-expected cover in dry precipitation scenarios.
What are the implications of the main findings?
  • Regional to local scale drivers like edaphic conditions, microclimate, disturbance history, or land use may influence EAG responses to precipitation.
  • Our findings can support land managers in understanding the landscape dynamics of EAG in response to precipitation-understanding where forage shortages may exist, avoiding treatments in unnecessary areas, and better understand fire risk.

Abstract

In rangeland ecosystems of the western United States, invasion by exotic annual grass (EAG) poses a substantial threat to native biodiversity. Studies have shown that weather, especially precipitation, can greatly influence the rate of invasion and EAG cover in arid and semi-arid rangeland ecosystems. In a previous effort to help inform timely decisions of local and regional land managers, the U.S. Geological Survey released multiple EAG cover maps that were driven by varying precipitation scenarios for rangeland ecosystems of the western United States. In those modelled maps, we found a positive correlation of EAG cover to precipitation in most areas as expected. However, in certain anomalous areas (less than 10% of the landscape) precipitation had no or negative correlation with EAG cover. In this study, we set out to understand what causes these anomalies. We identified variables, such as edaphic, topographic, and coexisting vegetation that may influence EAG cover in different precipitation scenarios. We implemented a thresholding approach to assess the influence of these variables on EAG cover. We found that soils with low clay content have a higher likelihood of positive EAG anomalies (higher EAG cover with less precipitation) and that increasing perennial herbaceous and decreasing shrub vegetation cover results in a higher likelihood of negative EAG anomalies (lower EAG cover with more precipitation). We also found a higher likelihood of negative EAG anomalies in higher solar radiation areas, and high frequency of positive EAG anomalies in mid and low solar radiation areas. Multiple factors play significant roles in EAG cover in the arid and semi-arid rangelands of the United States. Understanding these factors can help to better forecast EAG cover and therefore better plan for fire risk and management strategies.

1. Introduction

Ecological processes are being altered globally due to changing biotic and abiotic factors in ecosystems. Human-introduced and/or natural expansions of exotic species are major forces driving these transformations [1,2,3,4]. In the rangelands of the western United States, the invasion of exotic annual grasses (EAGs)—such as cheatgrass (Bromus tectorum), red brome (Bromus rubens), and medusahead (Taeniatherum caput-medusae)—has significantly impacted ecosystems by altering vegetation composition, reducing biodiversity, and compromising ecological services [1,4,5,6].
Historically, these rangelands were diverse and relatively stable, dominated by native shrubs (e.g., sagebrush: Artemisia spp., shadscale: Atriplex spp.) and perennial grasses (e.g., Sandberg bluegrass: Poa secunda and bluebunch wheatgrass: Agropyron spicatum) [7,8]. The invasion of EAGs has disrupted this balance, often reducing native plant diversity and contributing to wildlife habitat loss by altering environmental niches and increasing wildfire frequency, spread, and intensity [4,9,10].
Cheatgrass, the dominant EAG in many areas, has a shallow root system [11] and rapidly extracts moisture from the soil. Although native species such as Artemisia tridentata ssp. vaseyana, Poa secunda, and Elymus multisetus are resilient competitors [12], EAGs often outcompete them due to faster growth rates and more efficient resource use under favorable environmental conditions [4,13,14,15,16,17]. These traits allow EAGs to dominate degraded rangelands and further the degradation cycle [7,18,19].EAG establishment is strongly influenced by environmental conditions. Warm, dry climates with well-drained sandy or loamy soils tend to favor cheatgrass, while low-elevation salt desert climates, high-elevation zones with cooler soils, and off-season grazing can suppress EAG density and promote native perennial grasses [20,21,22,23].
Precipitation and its interannual variation are key drivers of EAG distribution and cover in western U.S. rangelands [8,19,24,25]. Adequate fall, winter, or spring precipitation promotes EAG germination and growth when temperatures are favorable [19,26]. The timing of precipitation is especially critical—early fall moisture enhances soil water availability and allows species like cheatgrass (Bromus tectorum) to germinate and establish ahead of native perennials, giving them a competitive advantage [27]. Higher-than-normal precipitation generally leads to increased EAG cover and biomass [19,23]. However, drought may prolong seed bank viability, allowing cheatgrass seeds to remain dormant until favorable conditions return, often resulting in delayed but intense outbreaks [28,29].
In addition to precipitation, other environmental variables such as soil type, topography, and vegetation competition also influence EAG dynamics [30,31,32,33,34]. For example, elevation [34,35] and soil nitrogen [36] are negatively correlated with cheatgrass occurrence, and soil chemical properties may be as influential as physical texture in determining plant growth [30]. EAG invasion also leads to nitrogen and carbon loss from soils, particularly during wet years [37]. Topographic and climatic variables such as elevation and solar radiation also play a key role in shaping EAG dynamics. These factors influence soil temperature, moisture availability, and plant competition, and may amplify or buffer vegetation responses to precipitation extremes [38]. Variables often do not act independently, for example, the negative association of EAG to soil nitrogen is a result of N rich soils tending to be finer textured and having a higher water holding capacity [36]. Understanding how EAGs respond to both exogenous (e.g., precipitation, temperature) and endogenous (e.g., soil, vegetation) drivers is essential for land management. Strategies such as off-season grazing to reduce fine fuels [39] or post-fire herbicide and seeding treatments [40] are commonly used to mitigate EAG spread.
Dahal et al. [25] developed a comprehensive model to predict and map EAG cover across western rangelands using annual EAG data [41], topography, topographic heat load, soil variables, and multiple precipitation scenarios. While the model performed well, it produced anomalies—areas where EAG cover did not align with expected precipitation responses. These anomalies were more frequent under wetter-than-normal conditions but also occurred during dry years. Identifying and understanding these anomalies is critical for improving predictive accuracy and informing adaptive management strategies, particularly in ecosystems with high environmental variability [19].
As Wylie et al. [42] noted, spatial modeling can produce anomalies due to complex interactions among input variables. However, the anomalies observed by Dahal et al. [25] were spatially localized and contiguous (i.e., non-random), suggesting that factors beyond precipitation may be responsible. Understanding the drivers and spatial patterns of these anomalies is critical, as they may indicate areas of elevated fire risk, missed forage opportunities, or unnecessary treatment costs [17,43,44].
This study builds on Dahal et al. [25] by investigating the environmental conditions associated with EAG anomalies. Using satellite-based EAG maps [25], we analyzed how soil, topography, and vegetation interact with precipitation to influence EAG cover. These maps provide continuous spatial data capable of revealing fine-scale ecosystem dynamics [45].
While cheatgrass is the most widespread EAG in the western U.S., other species such as red brome, medusahead, and field brome exhibit distinct ecological preferences and phenological traits [14,30,46,47]. These species-specific differences may contribute to spatial variability in EAG responses to precipitation, potentially influencing the occurrence and distribution of anomalies in modeled cover.
The study objectives were to (1) identify potential drivers of EAG anomalies including various soils, topographic, and vegetation cover attributes, (2) examine how EAG anomalies response to these drivers varies across dry to wet precipitation scenarios, and (3) quantify the intensity and direction of EAG anomaly response to drivers across different environmental strata.

2. Materials and Methods

2.1. Study Area

The study area encompasses arid and semi-arid rangelands in the western United States. Rangeland is identified by integrating the grassland/herbaceous or shrub pixels from the National Land Cover Database (NLCD) [48]. The study area covers all or parts of 17 states and 28 Level III ecoregions (Figure 1) [49]. A total of fifteen grass species—fourteen in the Bromus genus and one in Taeniatherum—were aggregated as EAG for this study (Supplemental Table S1). Among them, cheatgrass is the most dominant. Cheatgrass, an exotic winter annual grass, was introduced into western rangelands about a century ago. It has since established a foothold across much of the study area [50]. Other significant EAGs like red brome and medusahead are relatively recent invaders but are expanding rapidly, specifically to the southern and northwestern part of the study area [7]. Similarly, field brome (Bromus arvensis) and Japanese brome (Bromus japonicus) have established a foothold in the Great Plains [46,47].
While the study area’s elevation ranges from −86 m to 4421 m referenced to North American Vertical Datum 1988 [51], areas above 2350 m were excluded because of a paucity of model training points above that elevation and because areas at higher elevations are currently more resistant to EAG invasion and more resilient to disturbances than areas at lower elevations [7,22].

2.2. EAG Scenario Development

Input data for this study were derived from Dahal et al. [25] as the goal is to understand ecosystem characteristics that may have contributed to the anomalies observed in that work. The primary inputs are five modeled EAG cover maps with 30 m spatial resolution. These maps represent different precipitation scenarios: normal precipitation (a 9-year average from 2012–2020, labeled PPT_1.0), and deviations from normal at 50% (PPT_0.5), 75% (PPT_0.75), 150% (PPT_1.5), and 200% (PPT_2.0) [25]. Normal precipitation data were calculated as the average of annual water year precipitation (October–September). The native precipitation data had a resolution of 800 m, which is coarser than the EAG data. In the previous study [25], we retained the spatial detail of the EAG model and its covariates rather than averaging the 30 m data to 800 m. However, to preserve spatial detail and minimize hard lines in the output, we used a multistep resampling approach [52,53]. This involved resampling the 800 m precipitation data to 375 m, then to 30 m using the cubic convolution method [25].
The five EAG scenario maps were developed for the year 2022. However, the modeling approach is not year-specific and can be applied to other timeframes. The EAG scenario maps were generated using a gradient-boosting regression-tree model trained with data extracted from various static (elevation and edaphic) and non-static (weather and previous year’s EAG cover) spatial variables and Bureau of Land Management (BLM) Assessment, Inventory, and Monitoring (AIM) field survey plots. We extracted percent cover values for listed individual species (Supplemental Table S1) from species indicator tables of BLM AIM database and used as dependent variable. The gradient-boosting regression-tree model was built using python scikit-learn (1.4.1.post1) and lightGBM (4.3.0) software libraries [54,55]. The correlation coefficient (r) and median absolute error (MdAE) for the training samples (n = 18,630) were 0.95 (p-value < 0.001) and 2.36% cover, respectively. The accuracy results for independent test samples (n = 4657) were r of 0.79 (p-value < 0.001) and MdAE of 4.54% cover.

2.3. Inputs to Analysis of EAG Anomalies

In addition to the five EAG maps, we used several environmental variables for analysis. These included edaphic variables such as silt, clay, and sand content within the top 30 cm of soil from the POLARIS dataset [56]; topographic variables such as a digital elevation model (DEM) [51] and Potential Annual Incident Direct Radiation (PADR) [57]; and vegetation variables including perennial herbaceous cover and shrub cover for 2021 [58].
Temperature is another important factor influencing EAG cover [24,59]. However, due to its high intra- and interannual variability, we did not include temperature directly in the model. Including it would have increased complexity and processing time. Instead, we used DEM and PADR as indirect proxies for temperature, given their strong correlation with elevation and solar radiation [59,60]. Joly et al. [61] found that elevation is a strong predictor of temperature. Their study showed that resolutions similar to ours yielded optimal results for monthly and daily minimum temperatures (R2 = 0.53–0.78) and maximum temperatures (R2 = 0.24–0.39). Similarly, Liu et al. [62] and Meza and Varas [63] evaluated solar radiation models and found strong relationships with temperature. While elevation and solar radiation serve as useful proxies for general temperature patterns, localized temperature effects may be missed by not including temperature variables directly.

2.4. Data Processing Methods

The five precipitation scenario-based EAG cover maps with 30 m spatial resolution [25] served as the primary inputs for this study. To ensure a meaningful presence of EAG, we included only those pixels with ≥10% EAG cover under the normal precipitation scenario (PPT_1.0), following the approach of Boyte et al. [7].
We identified anomalous EAG responses to precipitation using two criteria:
  • −EAG anomalies: EAG cover in the PPT_1.5 or PPT_2.0 scenarios was less than or equal to that in PPT_1.0.
  • +EAG anomalies: EAG cover in the PPT_0.75 or PPT_0.5 scenarios was greater than or equal to that in PPT_1.0.
To understand the drivers behind these anomalies, we analyzed several environmental variables. Some of these—such as sand, silt, clay content, DEM, and PADR—were already used in the EAG prediction model [25], We additionally explore 2021 percent cover of shrubs and perennial herbaceous vegetation from the Rangeland Condition Monitoring Assessment and Projection (RCMAP) dataset [58] as drivers, a dataset not included in the development of the EAG predictions. Chambers et al. [24] reported that areas with high perennial vegetation productivity tend to resist annual grass invasion due to more efficient resource use and competition. Similarly, studies by, Compagnoni and Adler [31] and DeFalco et al. [64] found that competition between native and EAGs influences their density, cover, and population growth. Some of the variables we evaluated are themselves expected to vary with precipitation. For instance, perennial herbaceous cover is likely to increase with precipitation, and shrub cover may also increase, though to a lesser extent. While we did not explicitly model this co-variation, we assumed that perennial herbaceous response to precipitation is reflected in its cover under the PPT_1.0 scenario.
Following Pastick et al. [32] and Doherty et al. [65], we categorized all variables into strata. For shrub and perennial herbaceous cover, we used three categories: ≤8%, >8% and ≤20%, and >20%. Elevation was classified into ≤1350 m, >1350 m and ≤2200 m, and >2200 m. Soil texture variables (sand, silt, clay) were grouped into ≤10% and >10%. PADR was categorized into ≤0.78, >0.78 and ≤0.9, and >0.9. PADR, measured in megajoules per square centimeter per year (MJ/cm2/yr), was calculated using latitude, slope, and aspect [57]. The elevation, PADR, and shrub cover thresholds we used follow Pastick et al. [32], while the remaining thresholds were determined based on natural breaks in each dataset.

2.5. Data Analysis

To assess the spatial extent of each stratum, we calculated the percentage area it covered within the highly invaded zones (defined as areas with ≥10% EAG cover under PPT_1.0). For example, 75.7% of the highly invaded areas had >10% silt, while the remaining 24.3% had ≤10% silt. We then determined what portion of each group exhibited EAG anomalies. In this example, 11.8% and 16.7% of the >10% silt area showed positive anomalies under PPT_0.5 and PPT_0.75, respectively. In contrast, only 2.7% and 4.7% of the ≤10% silt area showed positive anomalies under the same scenarios (see Table 1).
Mean and median values provide summary statistics for each stratum. While the mean is sensitive to outliers, the median represents the midpoint and is more robust. Comparing these statistics across scenarios helps quantify the extent of anomalies. Similarly, calculating the percentage area of each stratum helps identify where anomalies are concentrated. To assess the intensity of anomalies relative to their spatial extent, we calculated Location Quotients (LQs) for each stratum using Equation (1) [66]. LQ values indicate the relative density of anomalies in each stratum. When plotted on a log scale, values greater than zero suggest a higher-than-expected occurrence of anomalies, while values less than zero indicate lower-than-expected occurrence.
L Q = area   of   stratum   x   with   anomaly / total   area   with   anomaly total   area   of   stratum   x / total   area
We hypothesized that the selected variables significantly influence EAG cover anomalies. To test this, we used the two-sample Kolmogorov–Smirnov (KS) test to compare EAG cover distributions between the baseline (PPT_1.0) and other scenarios within each stratum. The KS test was selected because it is nonparametric and does not assume normality, making it suitable for comparing ecological data with potentially skewed distributions.
All statistical analyses and visualizations were conducted using Python libraries including matplotlib (3.8.3), scikit-learn (1.4.1.post1), and SciPy (1.10.0).

3. Results

3.1. Extent of EAG Cover Anomalies in Relation to Precipitation Level

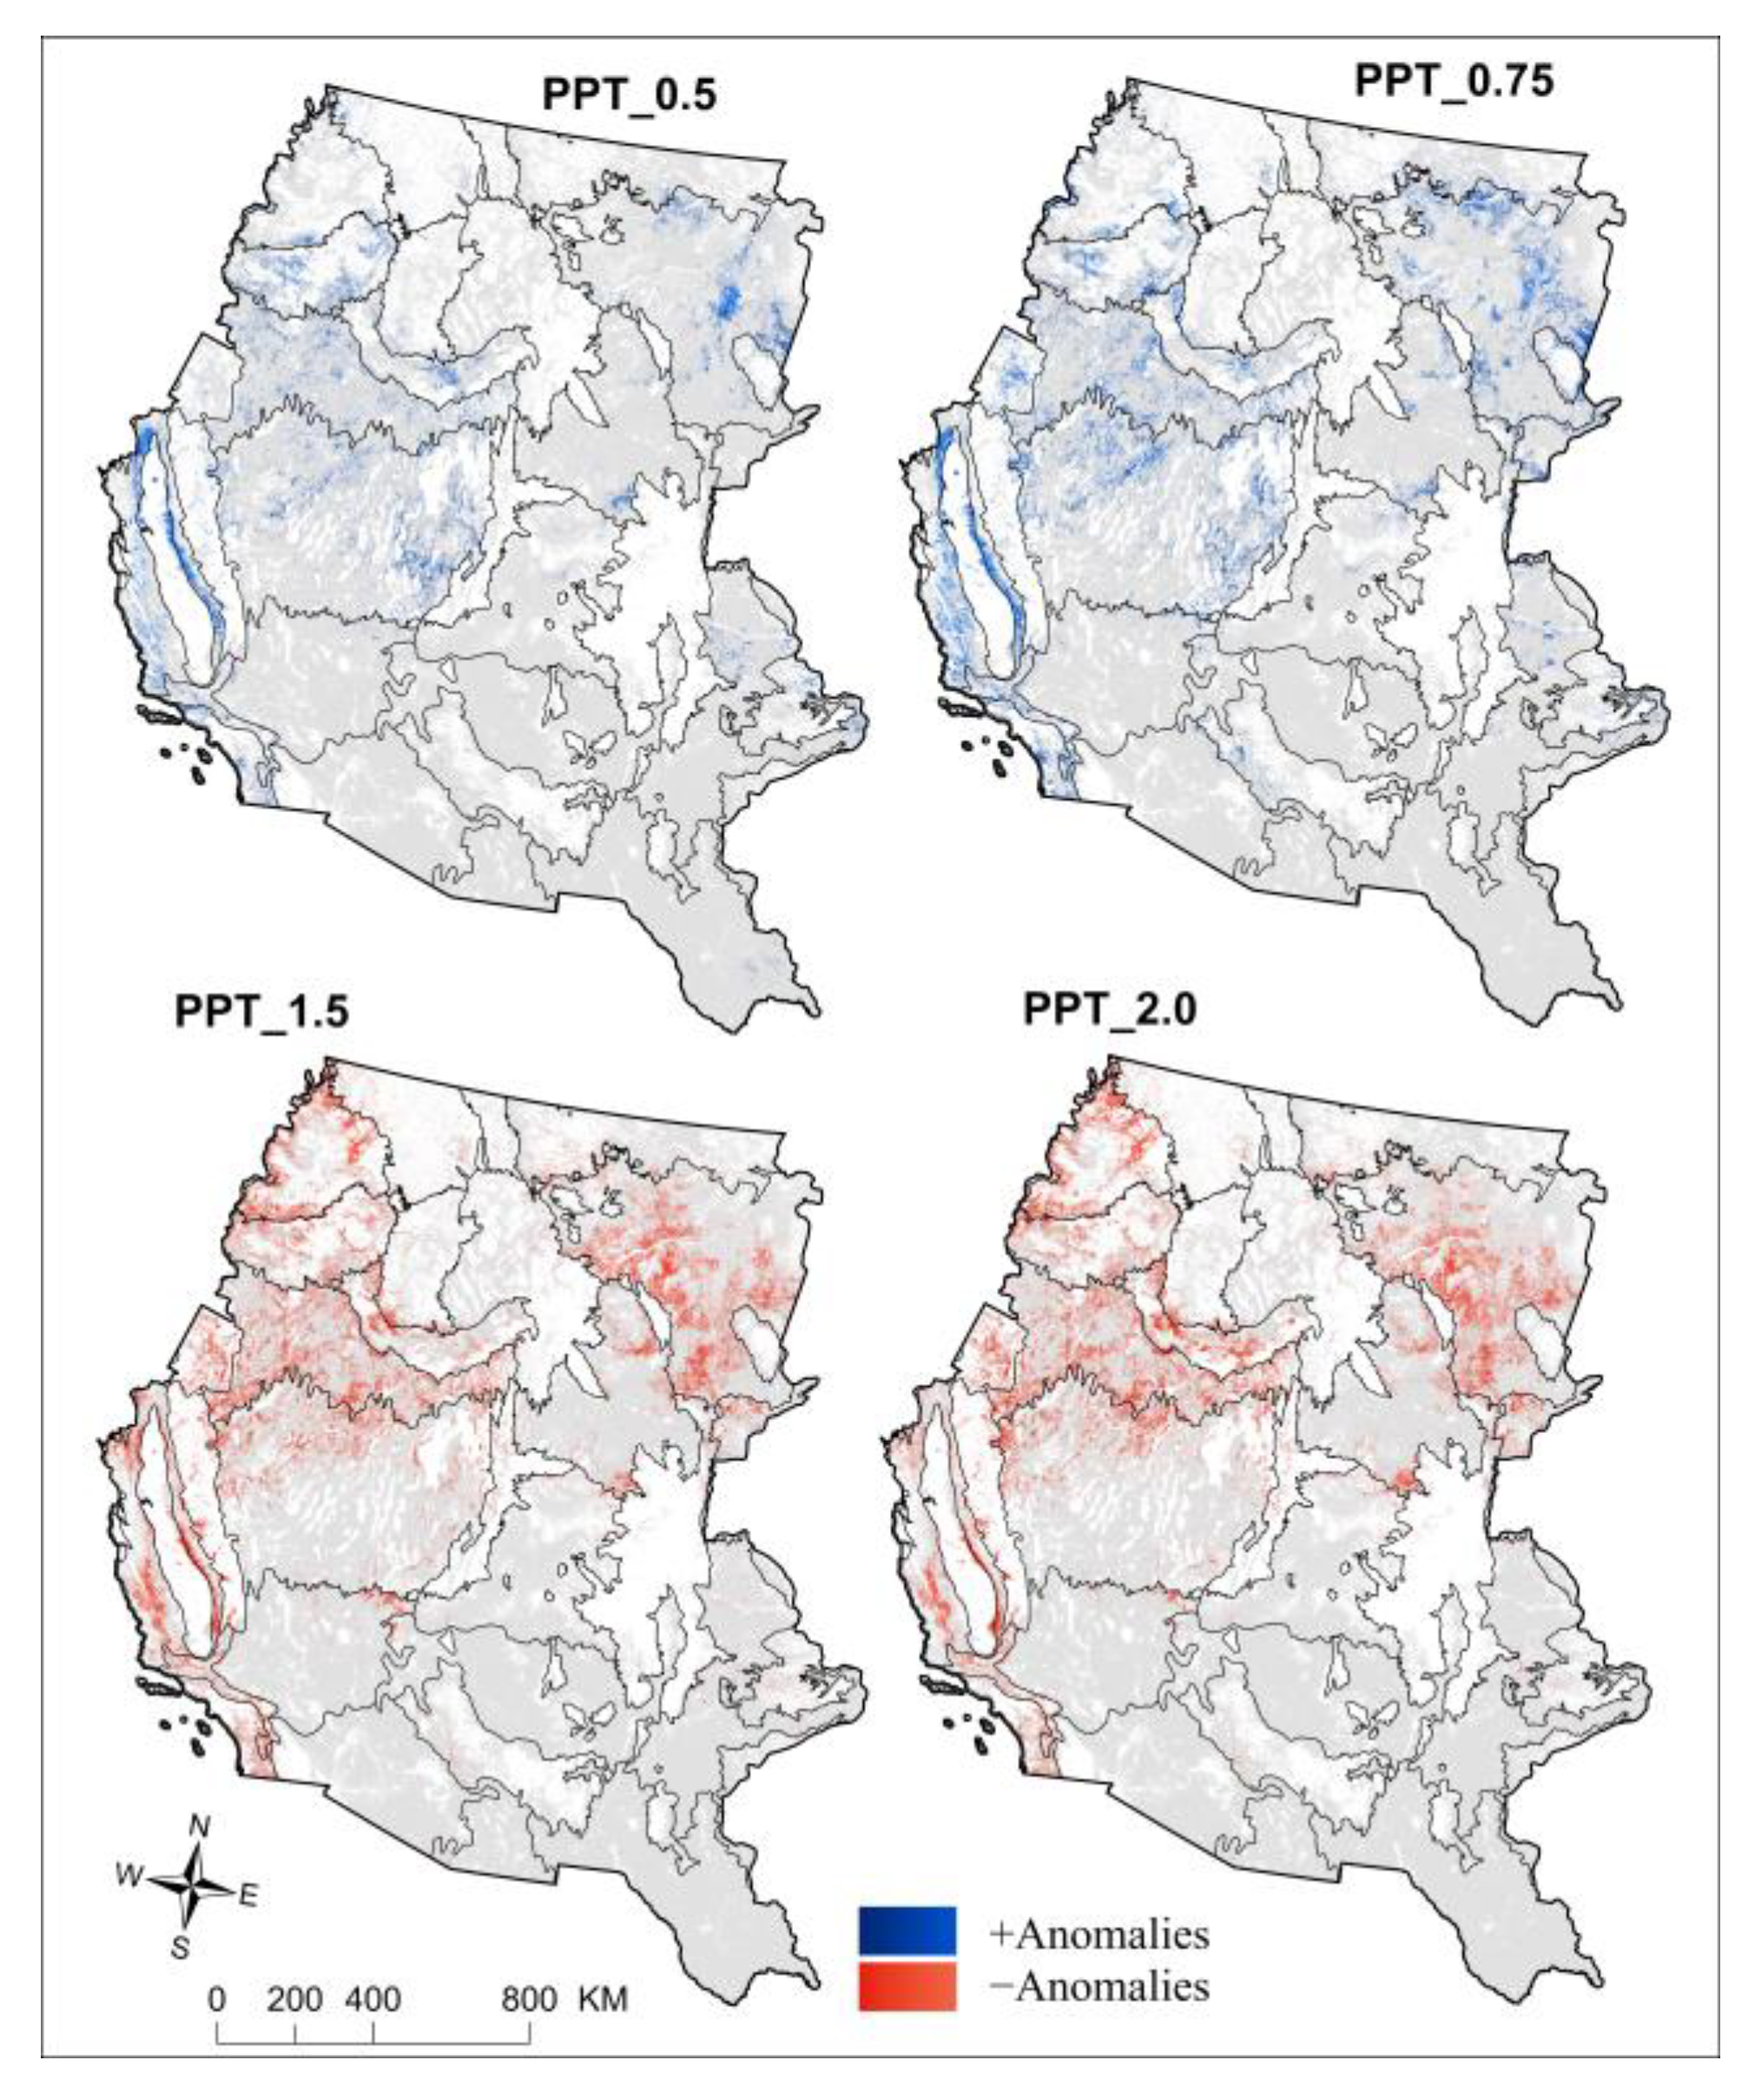
The extent of EAG anomalies varied across precipitation scenarios. 14.5% and 21.4% of the highly invaded areas (defined as areas with ≥10% EAG cover under PPT_1.0) showed positive anomalies in the PPT_0.5 and PPT_0.75 scenarios, respectively. In contrast, 29.2% and 28.7% of the highly invaded areas exhibited negative anomalies under the PPT_1.5 and PPT_2.0 scenarios, respectively (Table 1).
Although some overlap exists between areas with positive and negative anomalies, they are generally located in different regions. For instance, positive anomalies are concentrated in the northeastern portion of the Northwestern Great Plains ecoregion. Negative anomalies, on the other hand, are more common in the southwestern part of the same ecoregion. Similarly, in the Central Basin and Range ecoregion, positive anomalies are visible in the eastern portion, while negative anomalies are less prominent (Figure 2).

3.2. Effect of Edaphic Variables on EAG Cover in Relation to Precipitation Level

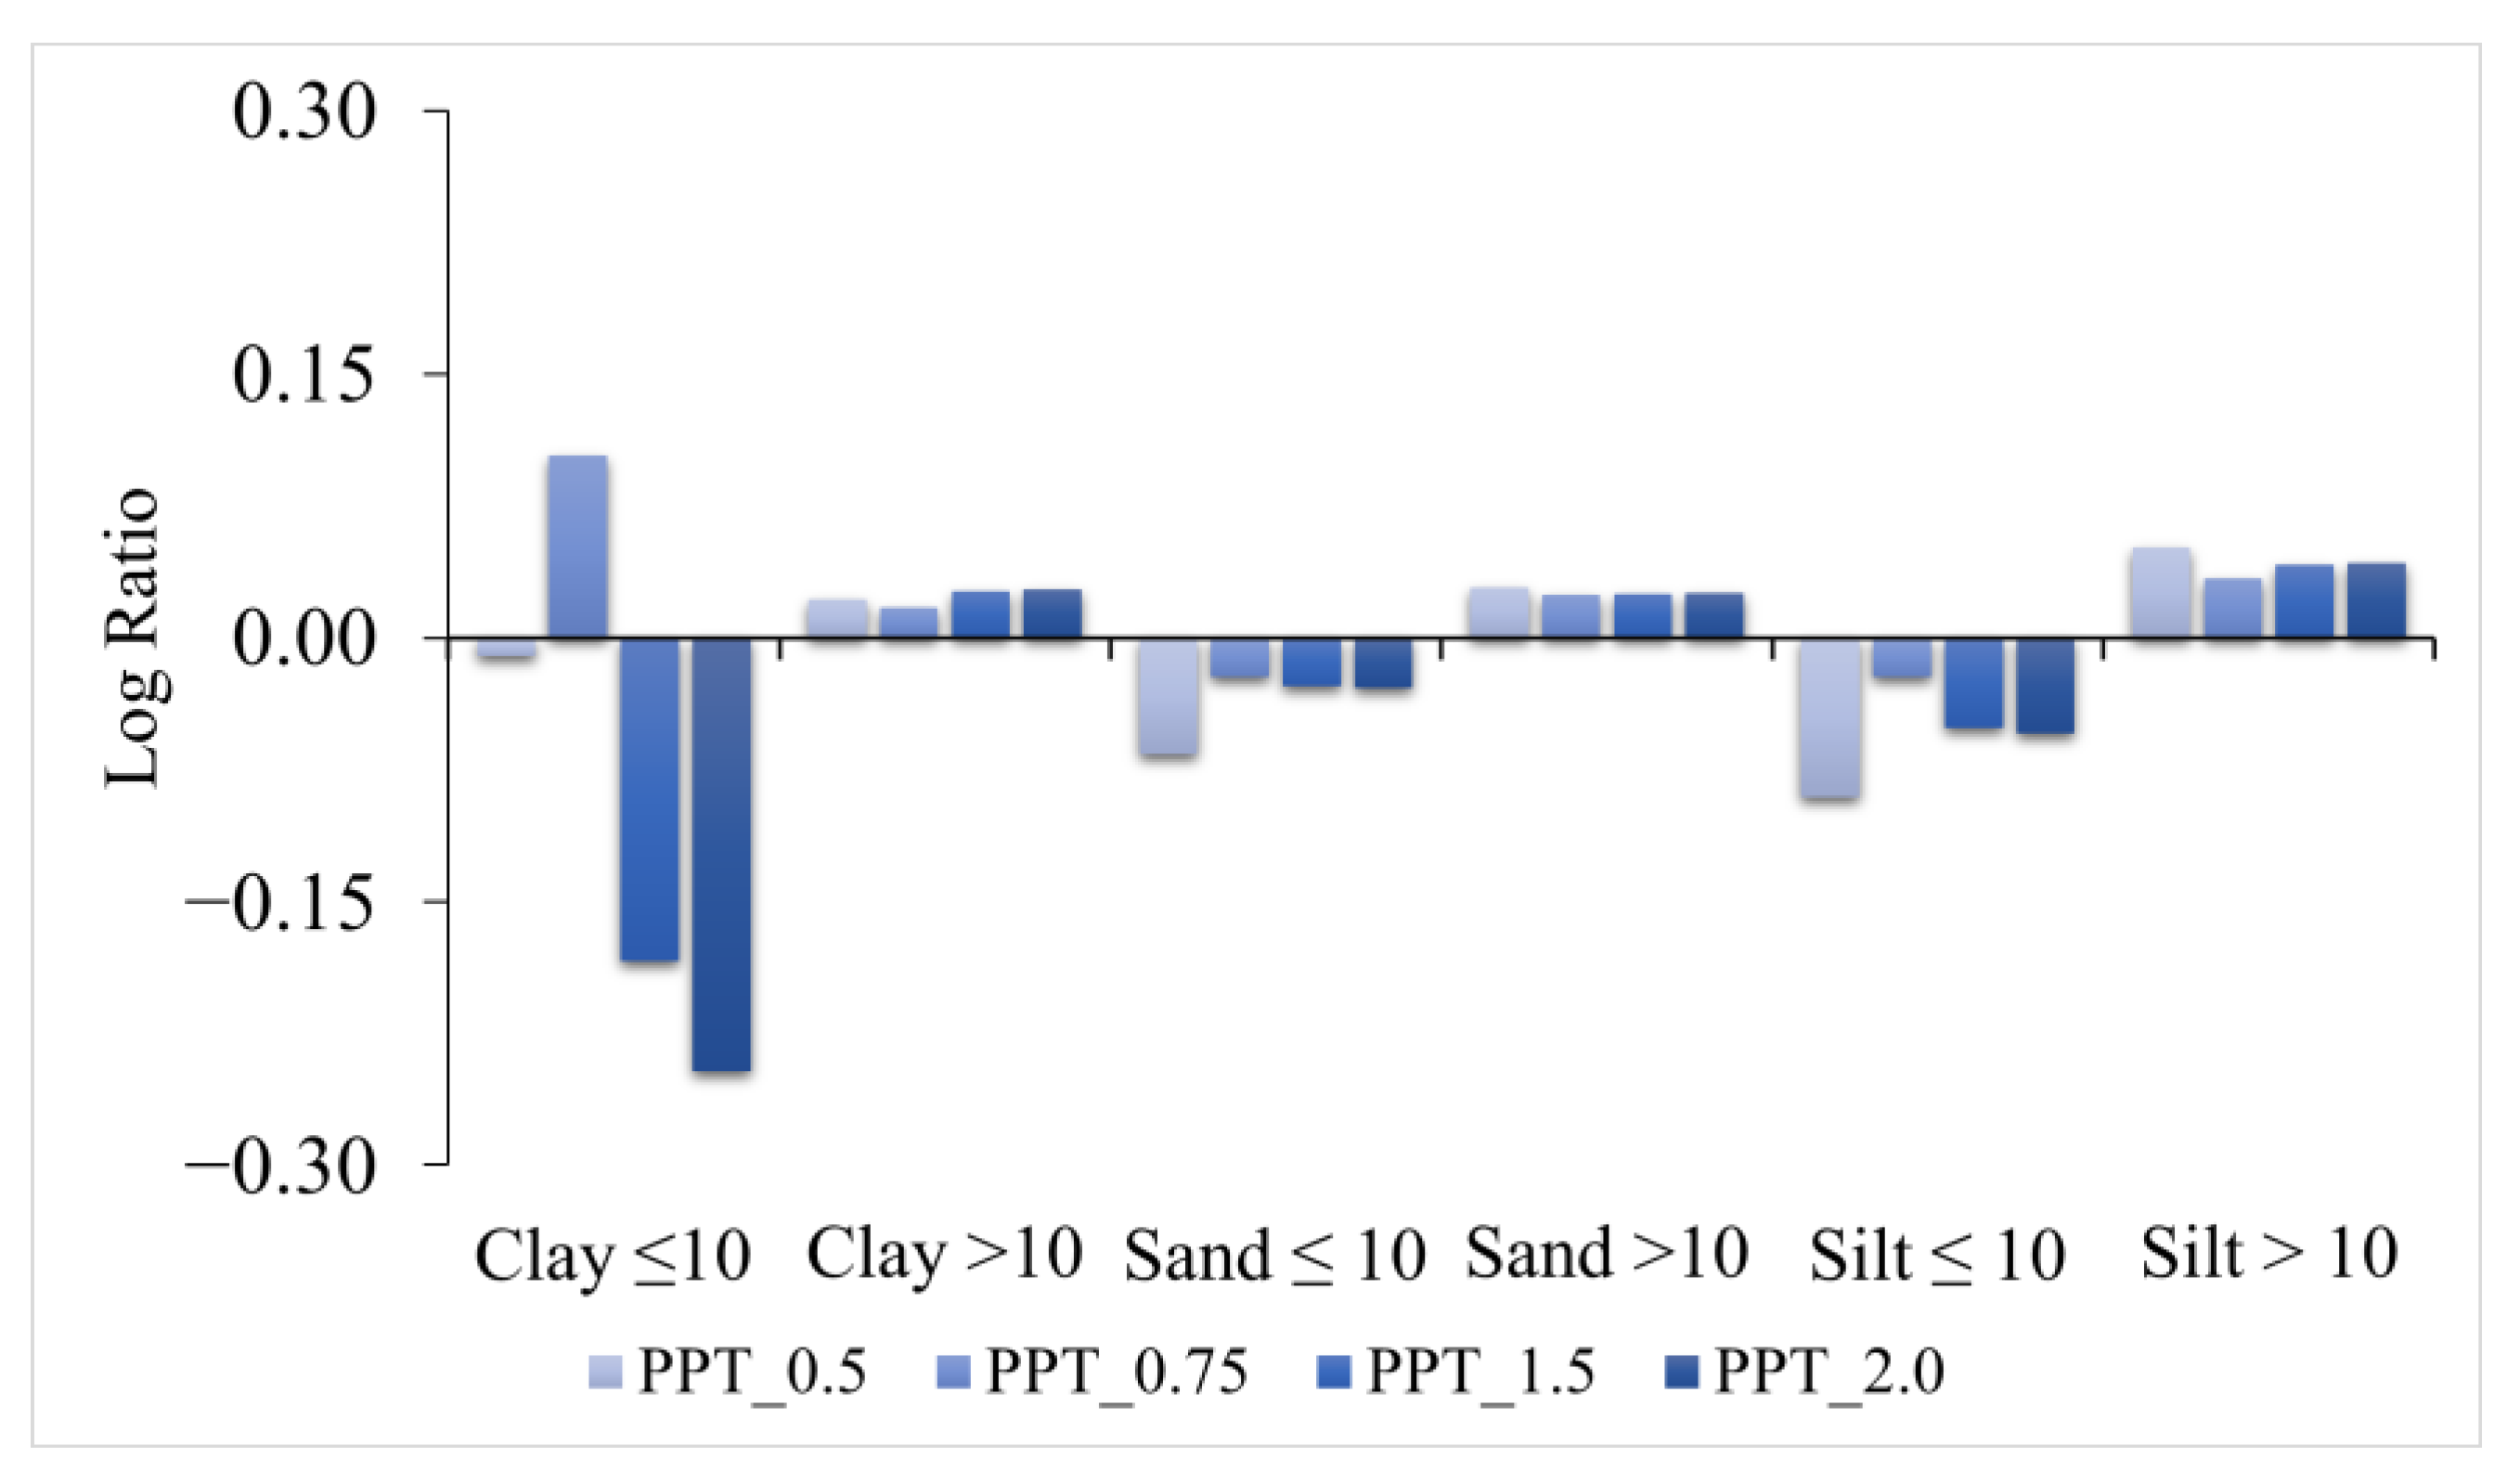
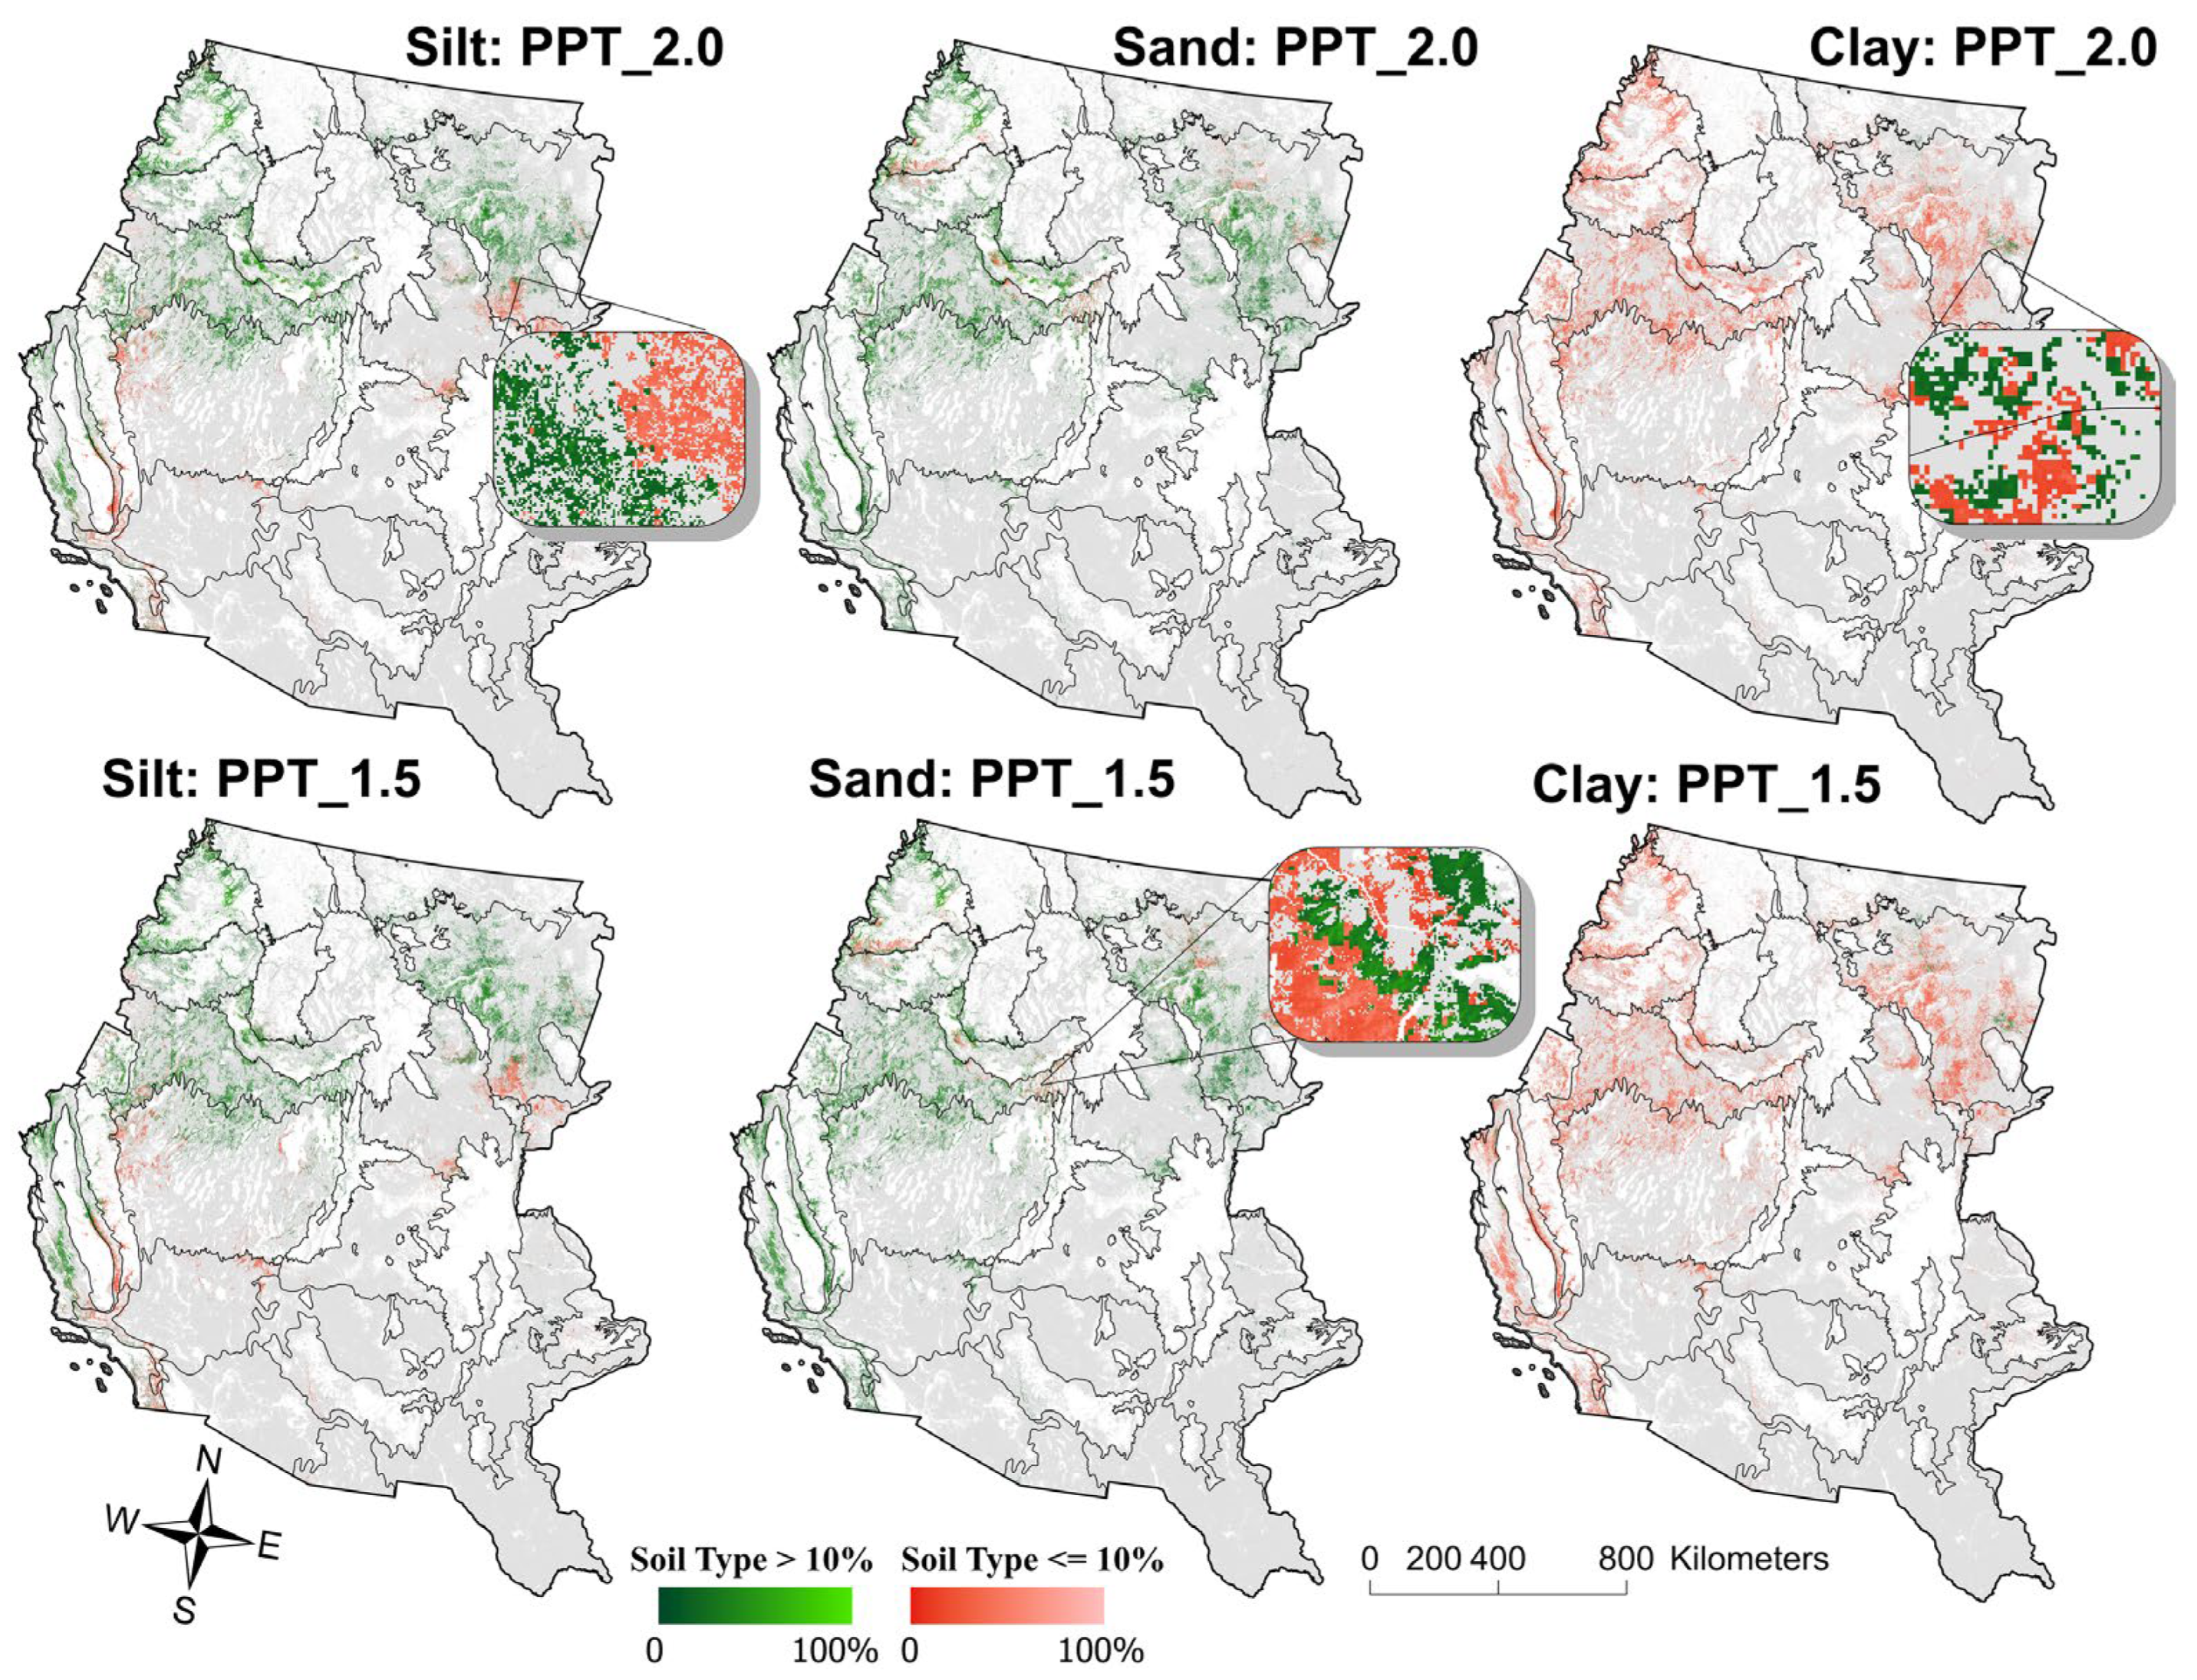
Under the wetter precipitation scenarios (PPT_1.5 and PPT_2.0), approximately 29% of the affected regions—representing about 9% of the total study area—showed −EAG anomalies. (Table 1). Across all soil types, the abundance of −EAG anomalies was similar between the PPT_1.5 and PPT_2.0 scenarios. Under the normal precipitation scenario, 91.0% and 75.7% of the highly invaded areas had sand and silt content greater than 10%, respectively. In contrast, only 3.4% had clay content above 10%. Regardless of the scenario, negative anomalies were more common in areas where sand, silt, or clay content exceeded 10% (Figure 3), particularly in northern tier of the study area (Figure 4). LQ results show that clay < 10%, PADR > 0.9, and <8% perennial herbaceous cover are related to lower than average −EAG anomaly density while DEM > 2200 m and >20% perennial herbaceous cover are related to higher-than-average density (Figure 3).
Cover values in negative EAG anomalies can be significantly lower than normal precipitation scenario. For example, in the PPT_2.0 scenario, the mean and median EAG cover within areas with ≤10% clay were 21.9% and 20%, respectively. These values are notably lower than the mean (27.1%) and median (25%) under normal precipitation in the same areas. Indeed, results from the KS test showed that EAG cover in negative anomaly areas under PPT_1.5 and PPT_2.0 was significantly different (p < 0.001) from the normal precipitation scenario within each soil type stratum (Table 1).
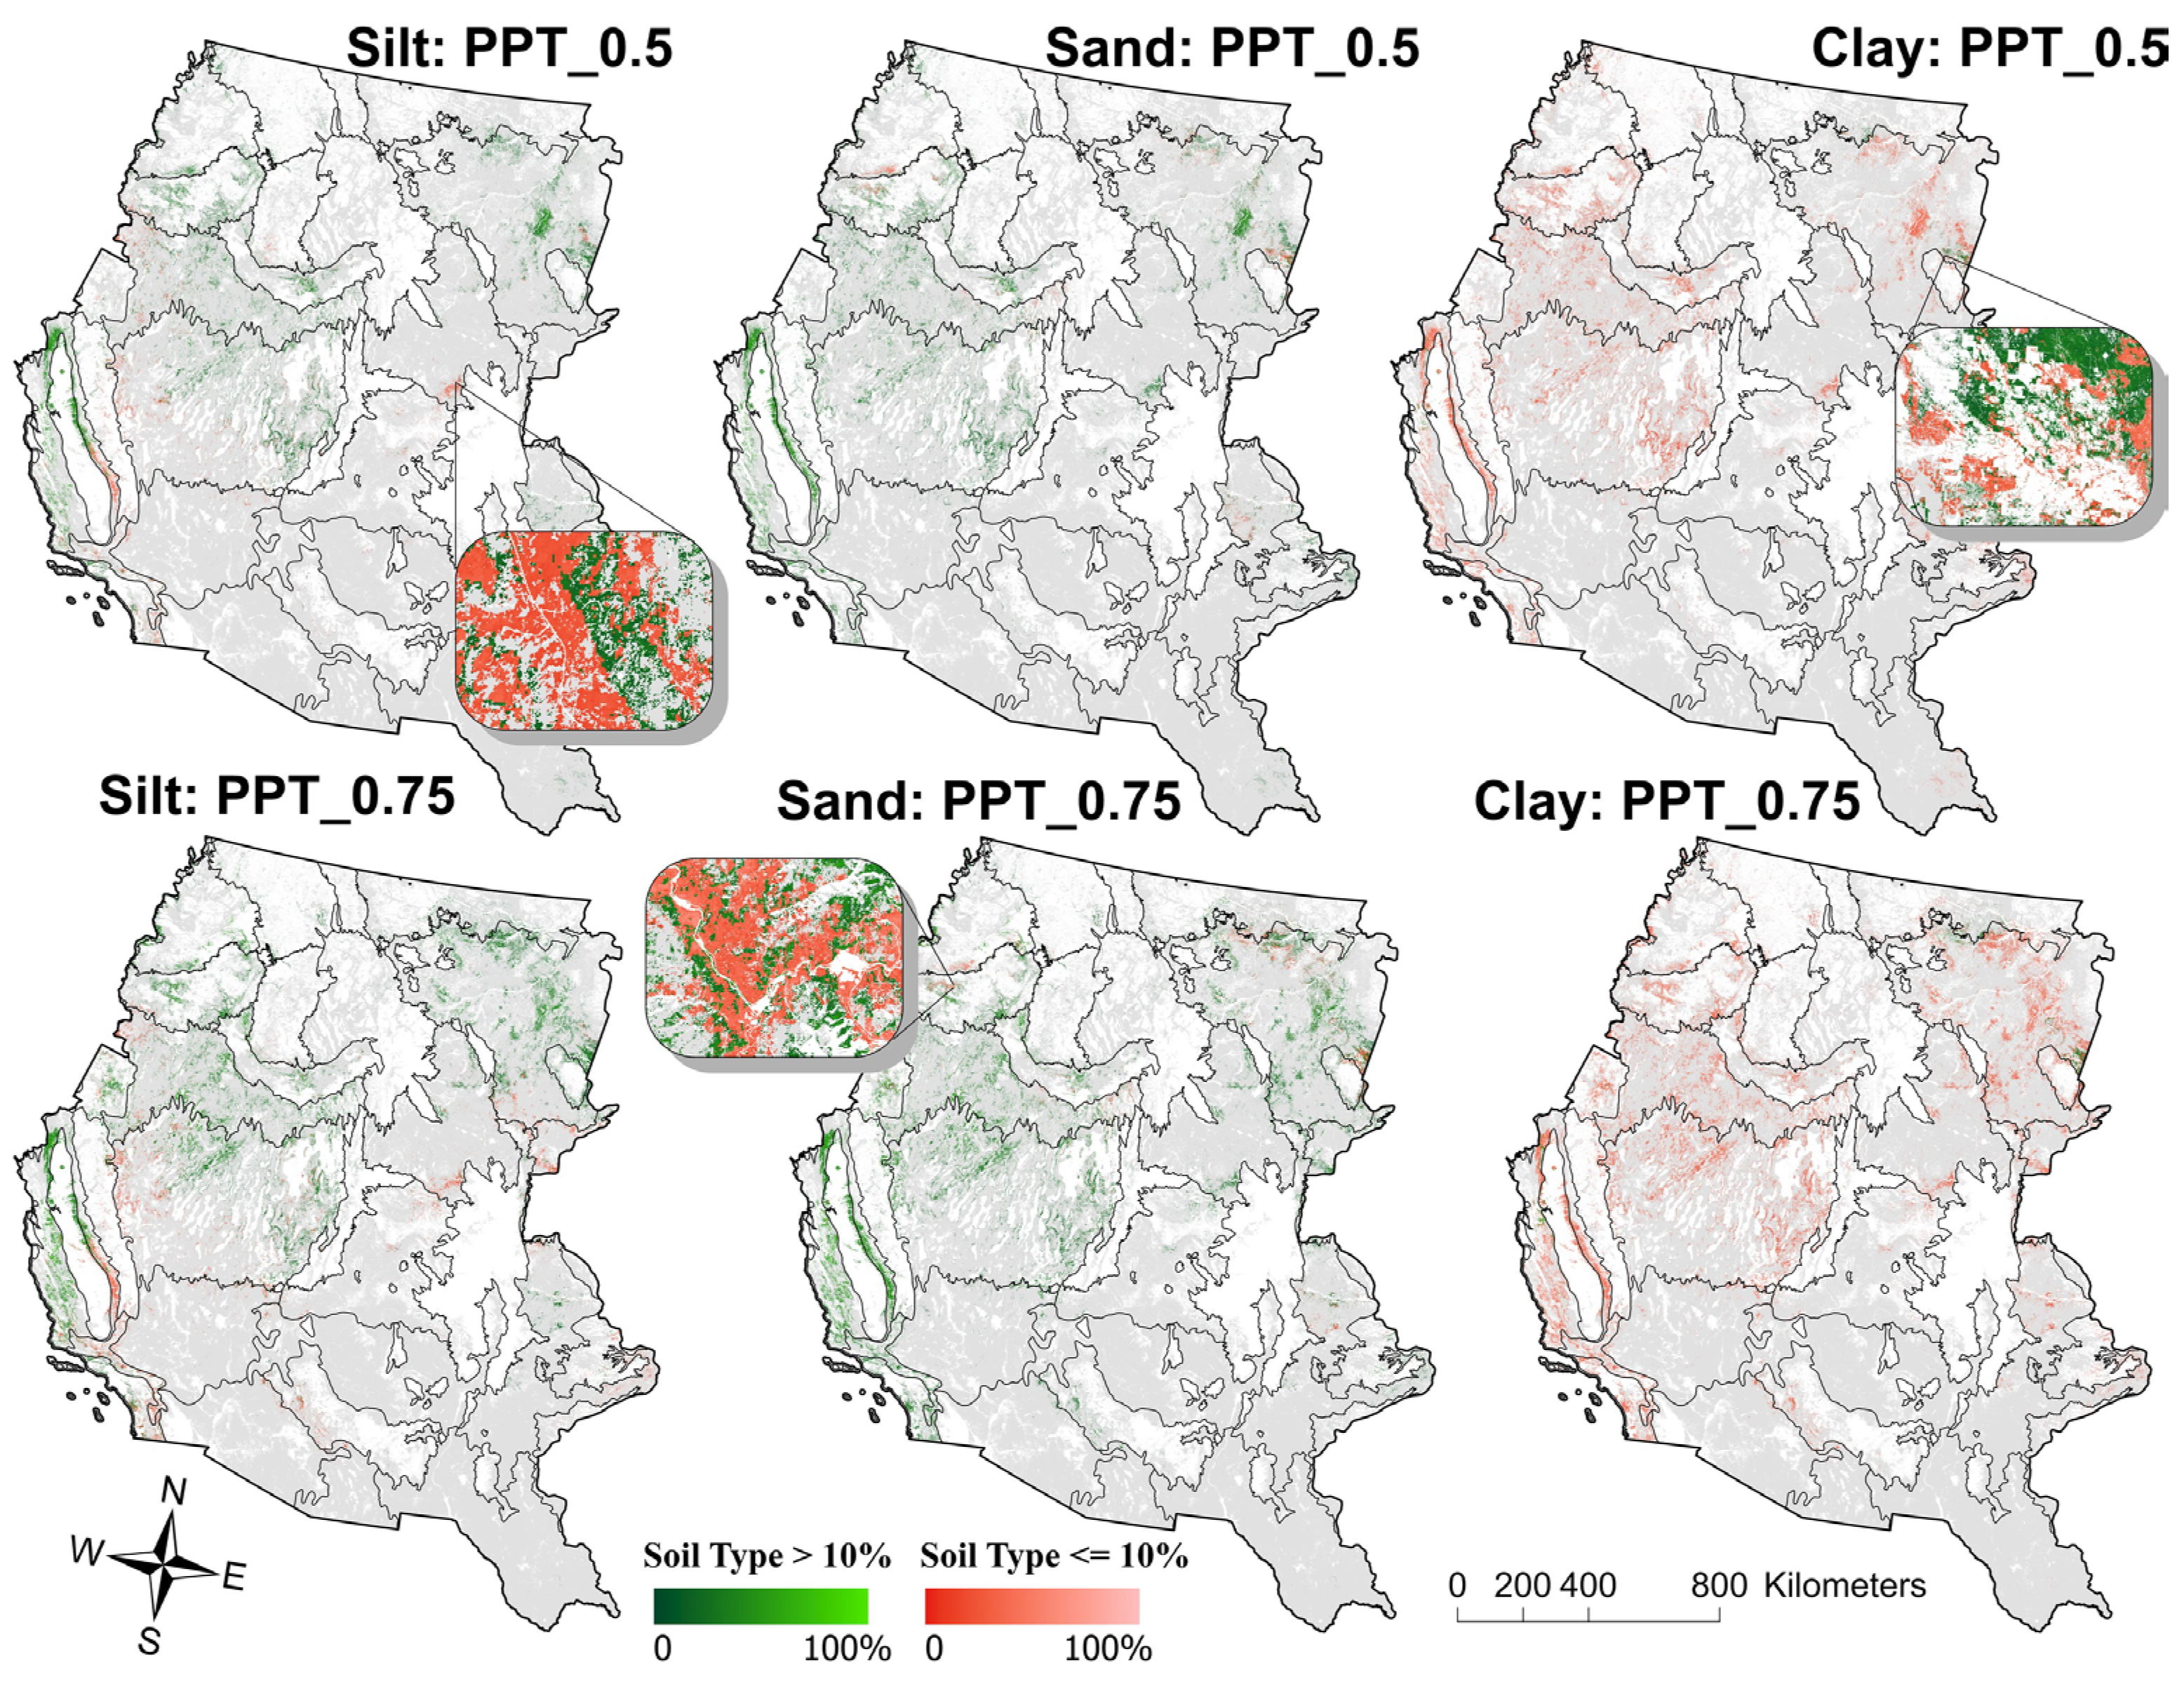
In the drier precipitation scenarios (PPT_0.5 and PPT_0.75), approximately 14.5% and 21% of the highly EAG-invaded areas showed positive anomalies (Figure 2). These represent about 4.5% and 6.7% of the entire study area, respectively (Table 1). The +EAG anomalies were scattered across the study area but were most concentrated in specific regions. Notably, they were common in the northern and eastern parts of the California Coastal Sage, Chaparral, and Oak Woodlands ecoregion, as well as the central portion of the Northwestern Great Plains ecoregion (Figure 5). These areas typically had soil with >10% silt or sand content. Additionally, +EAG anomalies were observed in parts of the California Coastal Sage, Chaparral, and Oak Woodlands and the Southern and Baja California Pine–Oak Mountains ecoregions, even where silt content was ≤10% (Figure 5). In areas with ≤10% clay content, 14% and 20.5% of highly invaded areas showed +EAG anomalies under the PPT_0.5 and PPT_0.75 scenarios, respectively. LQ results show that +EAG anomaly density is greater with ≤10% clay cover, DEM >2200 m, moderate and high PADR, and ≤8% perennial herbaceous. +EAG anomaly density is lower with ≤10% sand, ≤10% silt, and 8–20% perennial herbaceous. Mean and median EAG cover in these +EAG anomalies was 3% to 5% higher than in the same areas under the normal precipitation scenario (Table 1).

3.3. Effect of Topography on EAG Cover in Relation to Precipitation Level

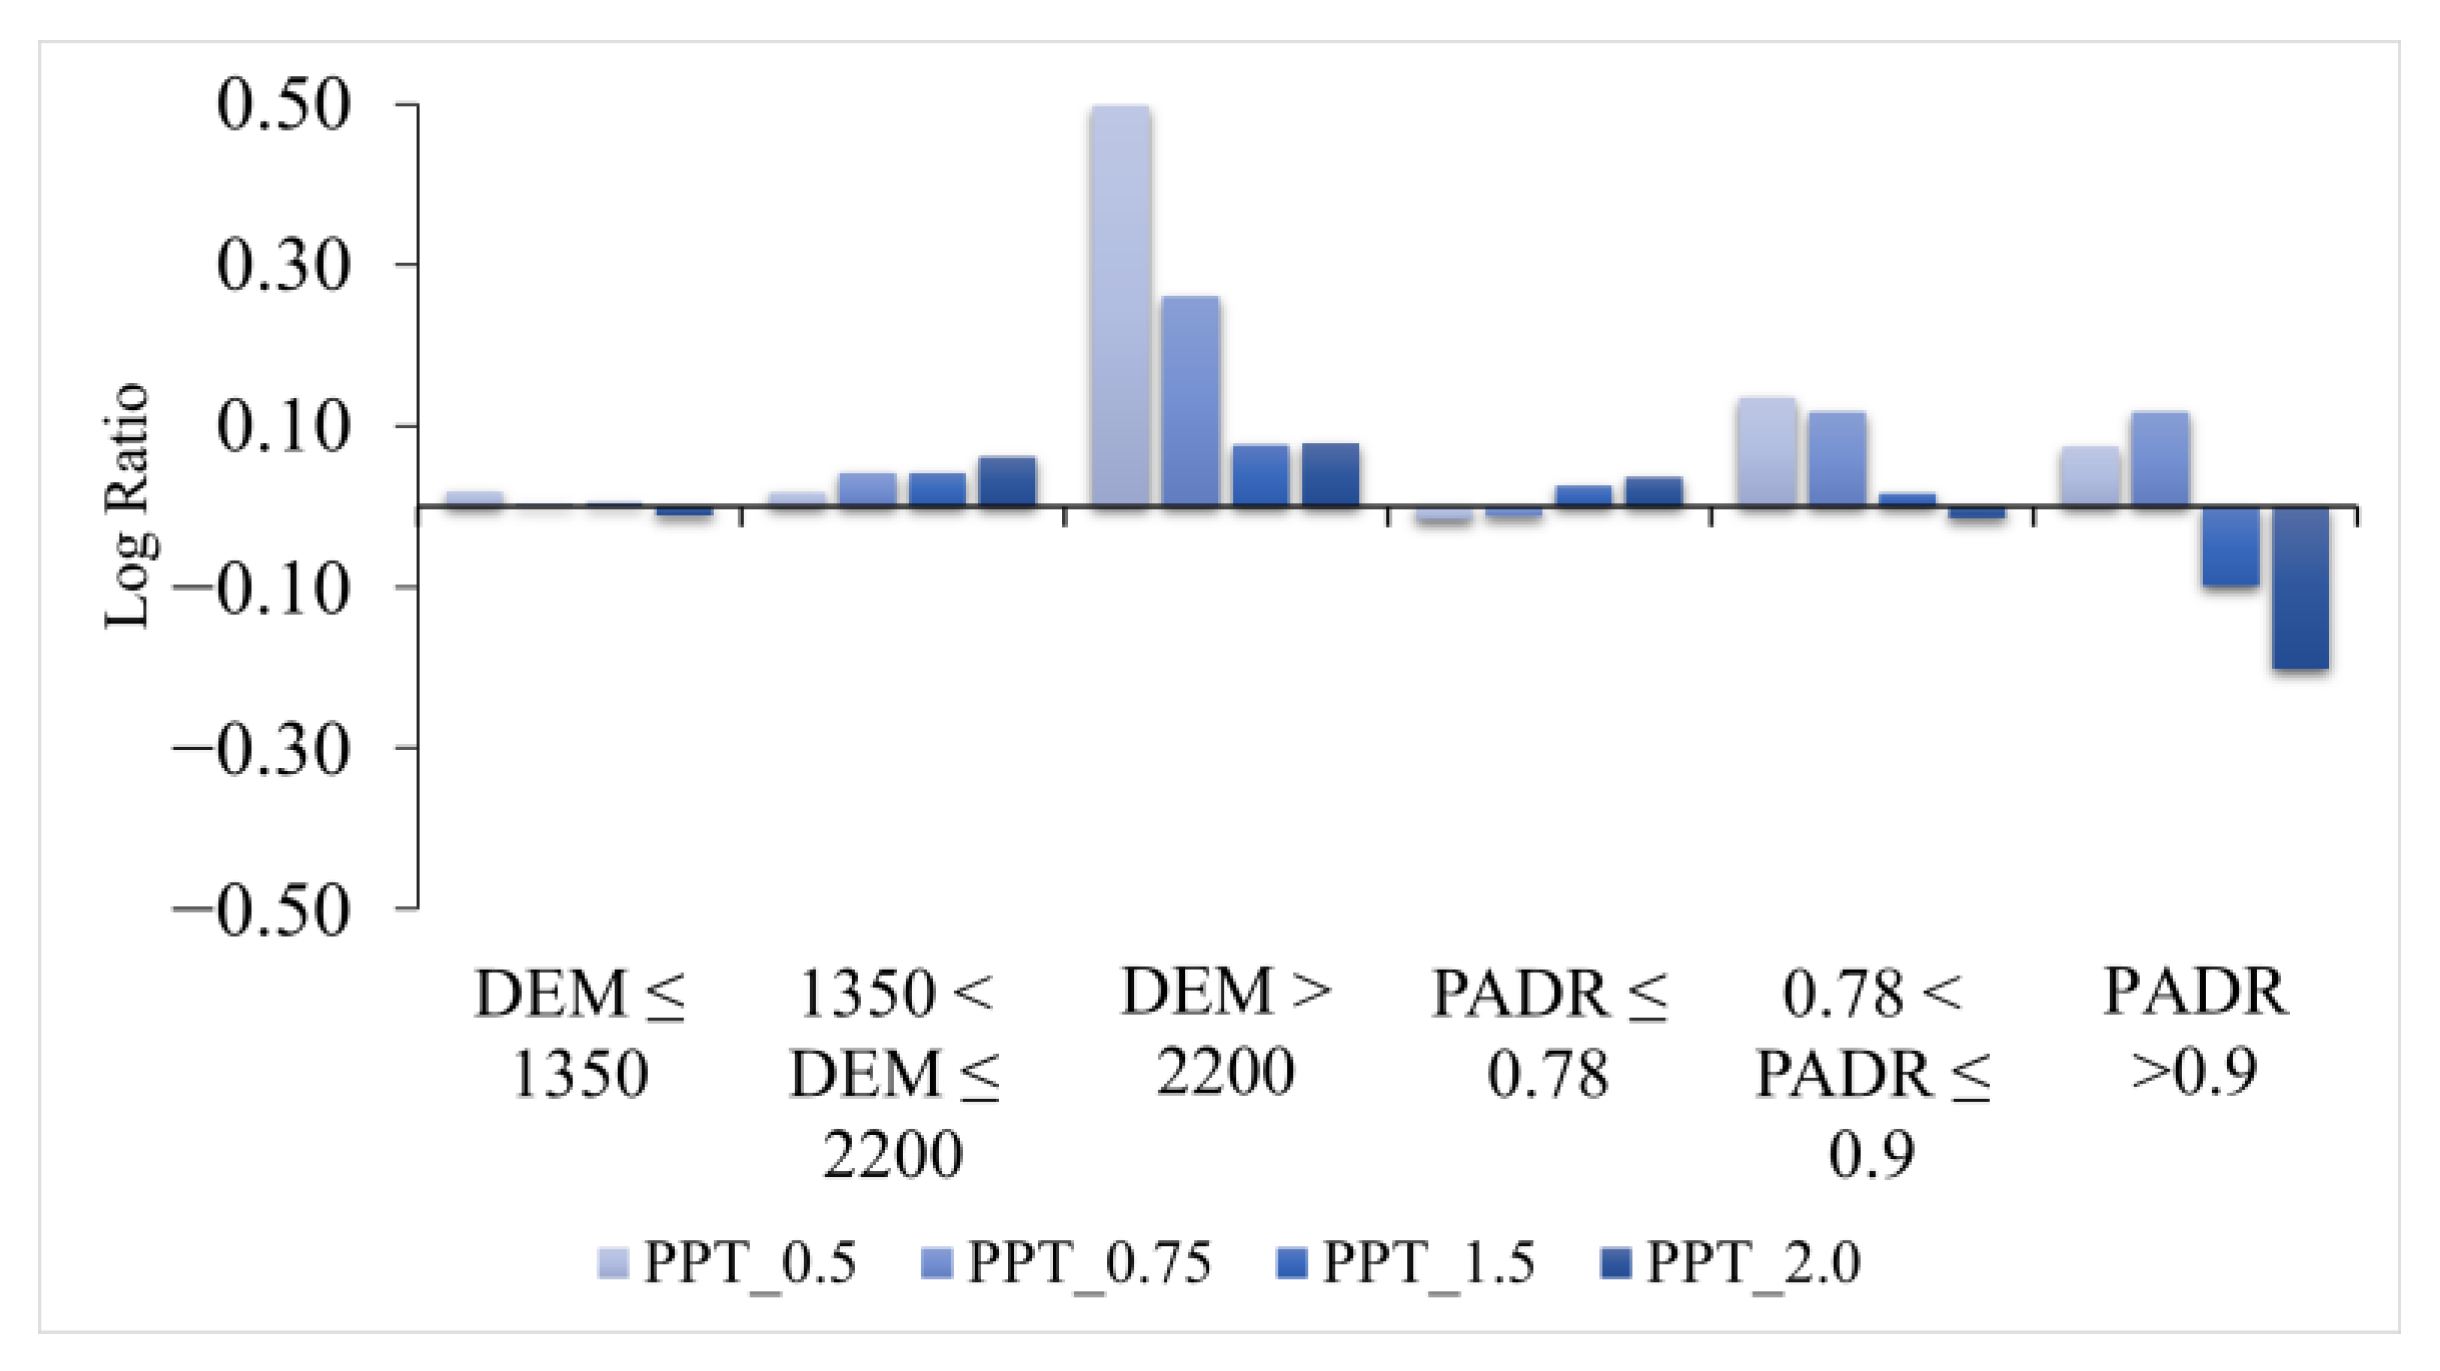
Among all highly invaded areas, approximately 58% were located at elevations ≤ 1350 m, 42% between 1350 and 2200 m, and only 0.4% above 2200 m. Within these elevation strata, 15.5%, 13.2%, and 0.1% of the areas showed negative anomalies under the PPT_2.0 scenario. Similarly, 16.3%, 12.8%, and 0.1% showed negative anomalies under PPT_1.5 (Table 2). For the same elevation categories, 6.3%, 7.0%, and 0.2% of the areas had positive anomalies under PPT_0.5. Under PPT_0.75, the values were 10.9%, 11.4%, and 0.1%, respectively (Table 2). These patterns reflect higher concentration (i.e., positive LQ) of EAG anomalies was associated with mid (1350–2200 m) and high elevations (>2200 m) (Figure 6). Positive anomalies were especially common in the drier scenarios (PPT_0.5 and PPT_0.75) at elevations above 2200 m. However, highly invaded areas at this elevation range made up only about 0.4% of the total (Table 2). While highly invaded areas tend to be lower elevation (Figure 7), the LQ of EAG anomalies is near average for mid and low elevation classes (Figure 6). Regions at low to mid elevations in the northern portion of the study area consistently exhibited high anomaly concentrations, especially under wetter precipitation scenarios (Figure 7).
In summary, while the total area of both positive and negative anomalies decreases with elevation, the density of anomalies increases (Table 2, Figure 6). The lower EAG invasion at elevations above 2200 m is likely due to environmental constraints [23,24]. However, with climate change, EAG cover is projected to expand into higher elevations [31,67,68].
Areas with low solar radiation (PADR ≤ 0.78) had near average density (LQ) of anomalies in all scenarios (Figure 6). In the middle ranges of PADR (0.78–0.9) positive EAG anomalies were more dense than highly invaded areas overall. EAG anomalies diverged in high PADR (>0.9) areas, where positive anomaly density was greater in dry scenarios and negative anomalies denser in wet scenarios (Figure 6). Together, the EAG anomaly density with respect to both elevation and PADR suggest that EAG cover responds more strongly to precipitation extremes in areas with low solar radiation and vice versa, especially in the northern portion of the study area (Figure 7). Results from the KS test confirmed that EAG cover in anomalous areas was significantly different (p < 0.001) from the baseline (PPT_1.0) across all scenarios and within each solar radiation and elevation categories (Table 2).

3.4. Effect of Perennial Vegetation on EAG Cover in Relation to Precipitation Level

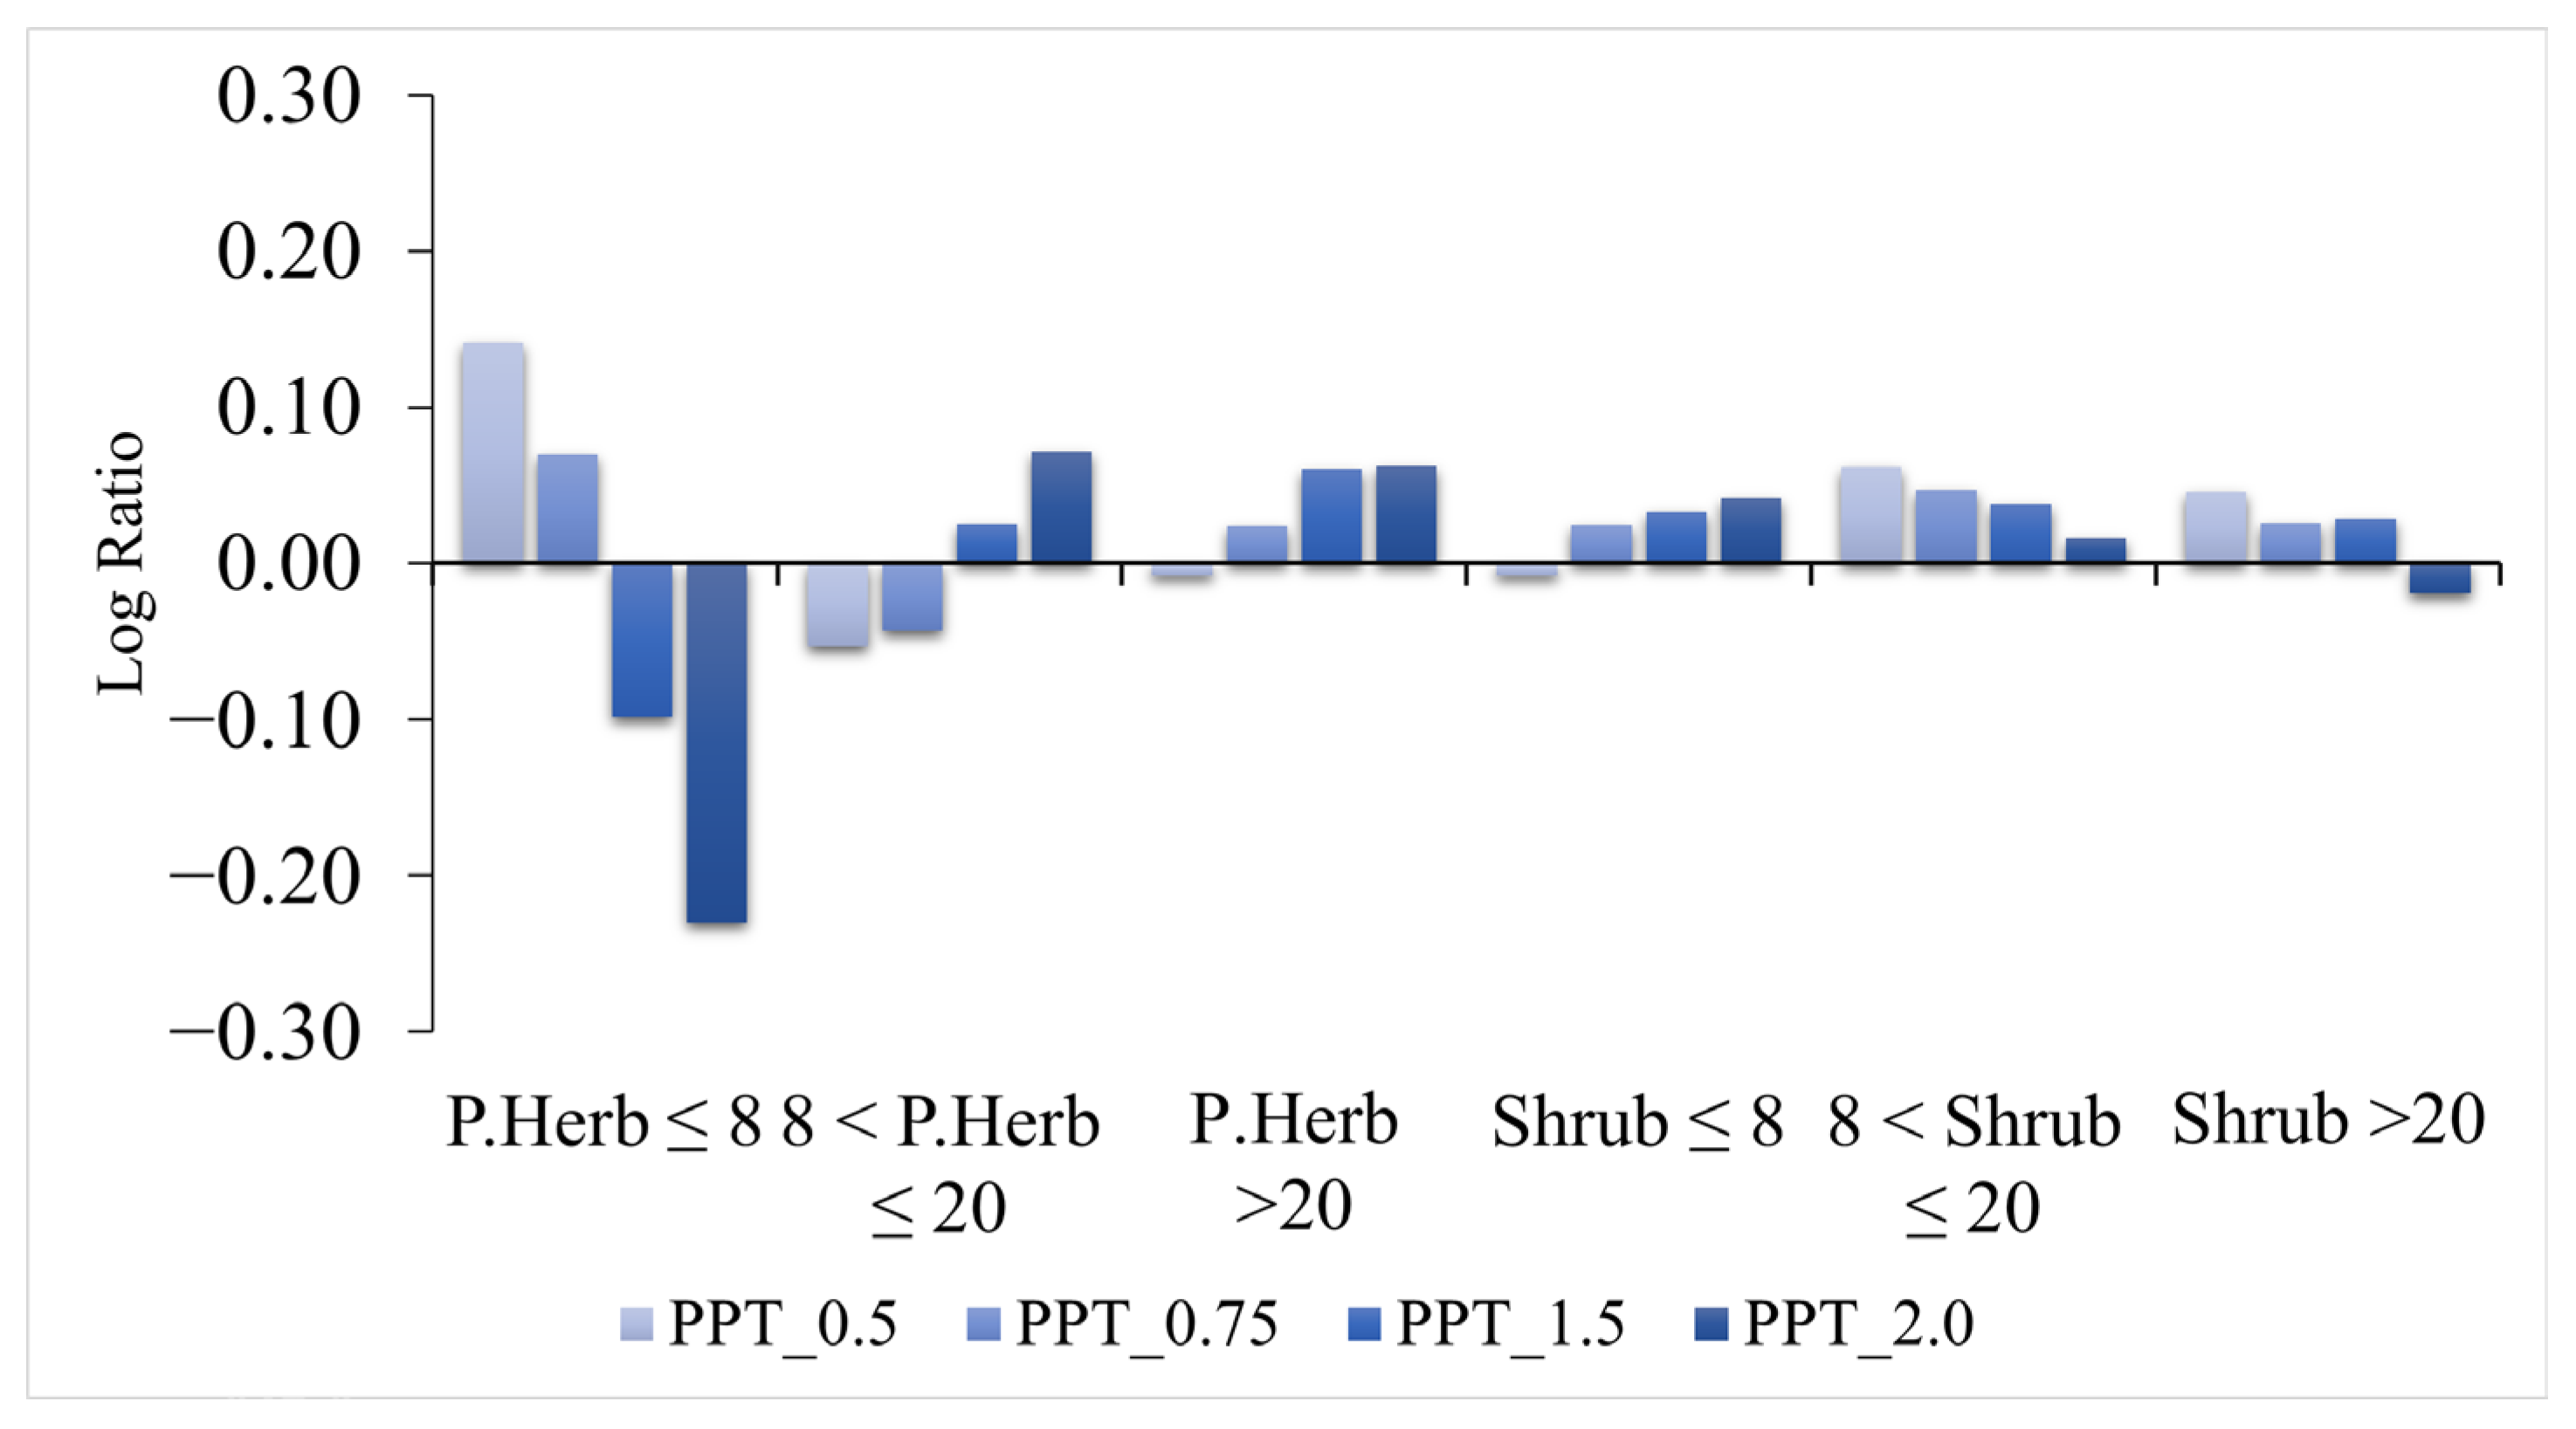
Under wetter conditions, negative EAG anomalies were more common in areas with higher perennial herbaceous vegetation cover. This pattern was reversed in drier conditions, where negative anomalies were more frequent in areas with lower perennial herbaceous cover (Figure 8). For example, in the PPT_1.5 and PPT_2.0 scenarios, approximately 14% of areas with ≥10% EAG cover and >20% perennial herbaceous cover exhibited negative anomalies. In comparison, only 7.6% and 8.3% of areas with 8–20% perennial herbaceous cover showed negative anomalies under PPT_1.5 and PPT_2.0, respectively. Even lower rates—7.5% and 6.5%—were observed in areas with ≤8% perennial herbaceous cover (Table 3).
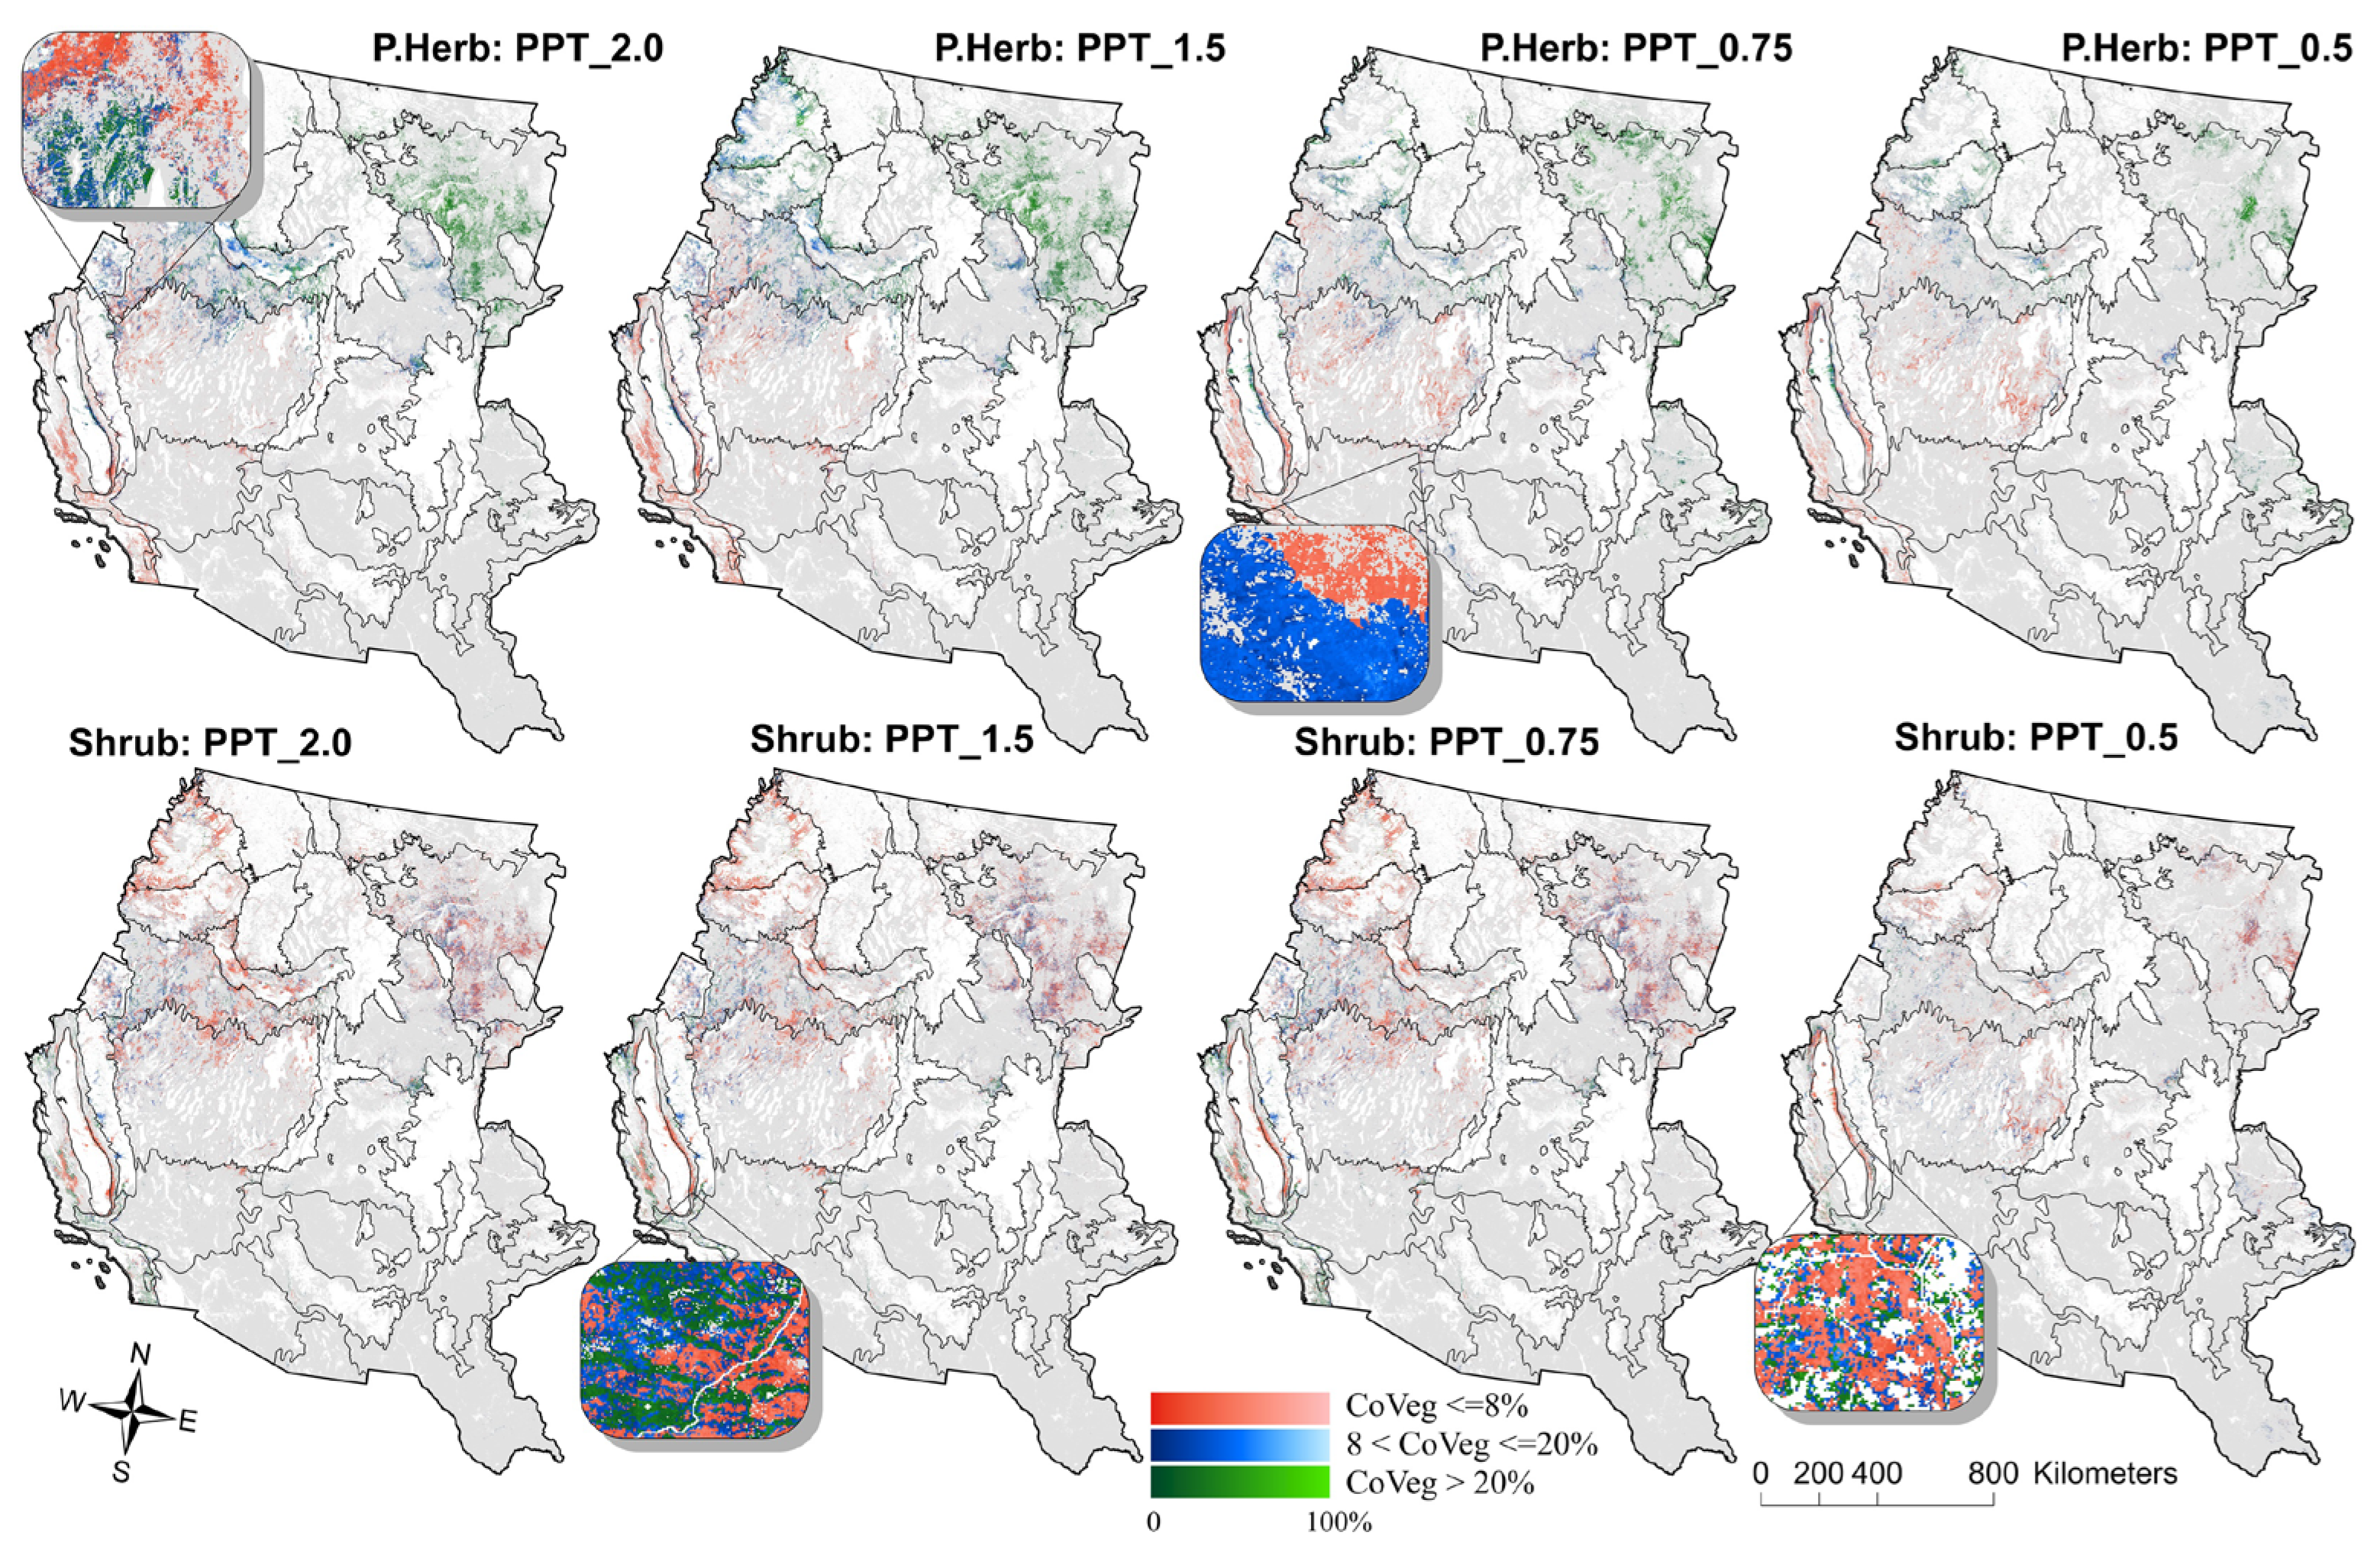
Shrub cover also modulated EAG anomaly density, but to a lesser extent than perennial herbaceous. In the PPT_1.5 and PPT_2.0 scenarios, about 5% of areas with ≥10% EAG cover and >20% shrub cover exhibited negative anomalies. Areas of low shrub cover showed increasing concentration of anomalies as precipitation increased in the scenarios. Conversely, areas of moderate-to-high shrub cover had higher densities of anomalies in dry scenarios (i.e., positive anomalies (Figure 8 and Figure 9). Interestingly, across both dry and wet scenarios, the average EAG cover in anomalous areas with >20% shrub cover was substantially lower—around 19%—compared to areas with ≤8% shrub cover, which averaged about 23% EAG cover (Table 3). This suggests that in all scenarios, areas with higher shrub cover tend to support lower EAG cover and vice versa. Statistical results from the KS test showed no significant differences in EAG cover between shrub cover strata. However, within each shrub stratum, EAG cover in anomalous areas was significantly different (p < 0.001) from the baseline (PPT_1.0) across all precipitation scenarios (Table 3).

4. Discussion

Historically, below-average precipitation has been more common in the study area than above-average conditions, which has important implications for EAG dynamics. Approximately 75% of location–year combinations fall within 30% of the long-term average, and 96% fall within 50%. The probability of doubling the average precipitation in a given year and location is less than 0.5% on average across the study area, while the chance of halving it is around 2%. Thus, our scenarios represent precipitation extremes.
In general, above-average precipitation leads to increased EAG cover [19]. Cheatgrass’ prodigious capacity to generate dense seed banks and ability to preferentially access shallow moisture [19,69,70] allow it to capitalize on wet years (PPT_1.5 and 2 scenarios). This is particularly the case when one of the three previous years also had high precipitation [19]. However, Bansal et al. [30] emphasized that the interaction between precipitation and soil properties plays a critical role in shaping plant growth, particularly in arid and semi-arid environments. Soil texture, in particular, influences moisture retention and availability. Finer-textured soil (i.e., high clay content) retain moisture near the surface, favoring shallow-rooted species like EAGs. In contrast, sandy soils drain quickly, which may benefit deeper-rooted species under wetter conditions by reducing surface evaporation losses [71,72].
Our results support this complexity. Soils with low clay content had high raw EAG cover but showed low concentrations of anomalies, especially under PPT_1.5 and PPT_2.0 scenarios. Soils with low silt and sand content had lower EAG cover overall and slightly below-proportional anomaly concentrations across all precipitation scenarios (Figure 3). Interestingly, EAG anomalies did not increase between PPT_1.5 and PPT_2.0 in any soil type, suggesting a threshold effect or saturation point in EAG response to precipitation (Table 1 and Figure 4). This aligns with findings from other studies that highlight the nonlinear relationships between soil properties, water availability, and plant performance [33,73,74,75]. Species respond differently to variations in soil chemistry and structure, and these responses can shift depending on precipitation, temperature, and biotic interactions [72,75,76,77].
Our maps are dominated by cheatgrass but also include 15 other EAG species. Among them, medusahead, red brome, field brome, and Japanese brome have similar—but not identical—growth patterns. For example, medusahead shares cheatgrass’s winter annual life cycle but matures 2–4 weeks later [14,30,46,47,78,79]. Red brome prefers warmer climates and may expand into areas previously dominated by cheatgrass as temperatures rise. Field brome, by contrast, is more common in wetter and cooler environments [47,80,81]. These species-specific differences may explain some of the spatial and directional variability in EAG anomalies, particularly in regions where multiple EAG species co-occur.
Perennial herbaceous vegetation plays a key role in limiting EAG expansion. Numerous studies have shown that competition from native perennials is one of the most effective natural controls on EAG cover [23,24,64,82]. Pastick et al. [32] found that EAG invasion tends to plateau or decline when perennial herbaceous cover is high, due to competition for water and nutrients. Our findings support this: in wetter scenarios, areas with higher perennial herbaceous cover had more negative EAG anomalies (Figure 8 and Figure 9), suggesting competitive suppression. This aligns with Franzese et al. [15], who reported that EAGs have less impact on perennial grasses in wetter environments. This competitive suppression is likely due to resource partitioning. Perennial herbaceous species often have deeper root systems and longer growing seasons, allowing them to access water and nutrients unavailable to shallow-rooted EAGs. They also reduce light availability at the soil surface, further limiting EAG establishment [32,83].
Conversely, shrub cover had a weaker and more variable influence (i.e., suppressive effect). While low shrub cover was associated with slightly higher EAG anomalies under wetter conditions (Figure 8 and Figure 9), this may be due to the presence of coexisting perennial herbaceous vegetation rather than a direct shrub–EAG interaction [23]. Shrubs and EAGs often occupy different rooting zones, reducing direct competition. However, in the absence of perennial grasses, EAGs can colonize the open spaces between shrubs [18,84]. In such cases, increased precipitation may benefit shrub growth, which could indirectly suppress EAG expansion by reducing available space and resources [7,23,84,85]. Additionally, shrubs may act as microclimatic buffers in arid environments, moderating temperature and moisture extremes. This facilitative role can influence vegetation dynamics, especially under stress conditions like drought [86].
Elevation and solar radiation also influenced EAG anomalies. These factors affect soil temperature and moisture availability, which in turn shape plant growth patterns [31,32]. Compagnoni and Adler [31] found that cheatgrass cover increased at lower elevations with more precipitation but declined at mid to high elevations. Our results are consistent with this: while low elevations had a large raw area of EAG anomalies (Table 2), their concentration (LQ) was average (Figure 6). In contrast, high elevations, especially under drier conditions, had a higher density of anomalies (Table 2). This supports findings by Case et al. [35], who observed a 28% decrease in annual grass cover for every 143 m increase in elevation between 900 and 2200 m. These findings suggest that higher elevation ecosystems may be more sensitive to precipitation variability, possibly due to narrower ecological tolerances or sharper transitions in vegetation types [31]. This has implications for climate change vulnerability assessments in montane rangelands.
Although temperature was not directly included in our model due to its high intra- and interannual variability and the associated computational complexity, its role in shaping EAG dynamics—particularly at higher elevations—remains critical. Temperature influences germination timing, growing season length, and competitive interactions among species [24,59]. For example, cooler temperatures and shorter growing seasons at higher elevations may limit EAG establishment and growth, even under favorable precipitation conditions. Therefore, the exclusion of temperature may partially explain some of the observed anomalies in high-elevation zones where microclimatic conditions could decouple precipitation from vegetation response.
Solar radiation further modulated EAG anomaly density. We found that EAG anomalies were more concentrated in areas with low solar radiation, particularly under drier conditions (Table 2). This may be due to the increased sensitivity of vegetation productivity in light-limited environments. As Li et al. [87] noted, plant growth in low-radiation areas is more responsive to small changes in moisture and temperature due to the light saturation threshold, which limits photosynthetic gains under high radiation. In contrast, high solar radiation areas had a lower density of anomalies under wetter conditions (Table 2, Figure 6), suggesting a stabilizing effect.
The spatial separation of positive and negative anomalies across ecoregions—such as northeastern vs. southwestern Northwestern Great Plains (Figure 2)—also suggests that regional-scale drivers like microclimate, disturbance history, or land use may influence EAG responses to precipitation [35]. This spatial heterogeneity highlights the need for localized management strategies. Furthermore, the presence of positive anomalies under dry conditions may indicate resilient or opportunistic EAG populations. These areas could serve as early indicators of future invasion hotspots [86].
Despite these insights, several limitations remain. This study did not account for multivariable interactions, such as how elevation might modify the effect of soil texture on EAG anomalies. We also did not explore the impact of using different threshold values or include temperature as a direct variable. While elevation and solar radiation serve as proxies for temperature, they cannot capture its intra- and interannual variability, which may influence EAG dynamics in ways not reflected in long-term averages. Moreover, our precipitation scenarios assume even distribution of increases or decreases from average across the year. Years with above average precipitation often result from a small number of large precipitation events, which may disproportionally benefit EAGs [69,70]. Finally, misclassification of non-EAG vegetation as such may also result in anomalies. Specifically, cheatgrass biomass production can have a tenfold interannual variation [88], both negative and positive EAG anomalies suggest lower than expected variability that may be due to misclassification.
Future research could explore these interactions more explicitly. For example, clay content at an elevation of 2000 m may influence EAG differently than at 100 m. Similarly, differences between 10% and 30% clay content may be more impactful than our binary classification captures. Incorporating temperature variability, disturbance history, and species-specific responses could improve our understanding of EAG anomaly patterns under changing climate conditions. We expect some transferability of our results to different regions, but responses are likely to vary by species, region, and the native/invasive status of EAGs by region [89,90]. Our results demonstrate the general patterns in how EAG anomalies relate to various edaphic and vegetation attributes. It is possible that abrupt thresholds exist in EAG anomaly response to these attributes, which need to be investigated in future study.
Knowledge of where EAG anomalies are most likely to occur, and the direction of that anomaly is useful. For example, because fires are more common in the year following normal or greater precipitation [91], knowledge of where EAG cover may show a greater or lesser cover increase than expected in wet years (i.e., −EAG anomalies) can modulate the anticipated fire response. Negative anomalies may relate to forage shortages and higher management cost due to treatment in unnecessary areas. Positive anomalies can translate to future fire risk, lost foraging opportunities, and a lack of identification of areas that could benefit from EAG treatments. Our findings can add spatial nuance to forecasts of EAG cover based on soil texture, existing non-EAG vegetation, and short-medium term (i.e., 1–6 month) weather outlooks. Such improved forecasts can assist fire managers in planning fuel breaks and strategizing for suppression.

5. Conclusions

EAGs greatly impact arid and semi-arid rangeland ecosystems of the western United States. The extent and cover of EAG varies from year to year, and precipitation plays a substantial role in that variability. Understanding how precipitation interacts with other factors to influence EAG cover variability could help inform its management and treatment. Precipitation increases not translating to increased EAG cover (i.e., −EAG anomalies) are related to conditions such as higher presence of perennial herbaceous, lower shrub presence, high elevation, high silt and sand content. Precipitation decreases not driving decreased EAG cover (i.e., +EAG anomalies) are associated with increasing solar radiation, increasing elevation, low clay content, and decreasing cover of perennial herbaceous. This knowledge could help land managers better understand the landscape dynamics of western rangelands where EAG invasion is prevalent and could be combined with other information, such as vegetation type, topography, and soil characteristics to help inform land management decisions.

Supplementary Materials

The following supporting information can be downloaded at: https://www.mdpi.com/article/10.3390/rs17233821/s1, Table S1: List of exotic annual grass species included in this study. Code as defined by United States Department of Agriculture plants database (https://plants.sc.egov.usda.gov, last accessed on 21 August 2025) and adopted by the AIM program [34].

Author Contributions

D.D. and M.R. contributed to the study conception. D.D. led the design, data preparation, and analysis. D.D. and M.R. contributed equally to drafting the manuscript, writing, editing, and gave final approval for publication. All authors have read and agreed to the published version of the manuscript.

Funding

This research was funded by the U.S. Geological Survey’s National Land Imaging and Land Change Science Programs, the EAG products were additionally supported by the Bureau of Land Management (grant L20PG00103). Work by Devendra Dahal was under USGS contract 140G0121D0001.

Data Availability Statement

Data are publicly available at https://doi.org/10.5066/P9X84TAN.

Acknowledgments

We thank Stephen Boyte (retired), Joel Connot, and Thomas Adamson from the U.S. Geological Survey and the anonymous reviewers for their valuable comments which have improved this manuscript. Any use of trade, firm, or product names is for descriptive purposes only and does not imply endorsement by the U.S. Government.

Conflicts of Interest

Author Devendra Dahal was employed by the company KBR, Inc. The remaining author declares that the research was conducted in the absence of any commercial or financial relationships that could be construed as a potential conflict of interest.

References

  1. Aslan, C.E.; Dickson, B.G. Non-native plants exert strong but under-studied influence on fire dynamics. NeoBiota 2020, 61, 47–64. [Google Scholar] [CrossRef]
  2. Barnosky, A.D.; Matzke, N.; Tomiya, S.; Wogan, G.O.; Swartz, B.; Quental, T.B.; Marshall, C.; McGuire, J.L.; Lindsey, E.L.; Maguire, K.C.; et al. Has the Earth’s sixth mass extinction already arrived? Nature 2011, 471, 51–57. [Google Scholar] [CrossRef]
  3. Davies, K.W.; Nafus, A.M. Exotic annual grass invasion alters fuel amounts, continuity and moisture content. Int. J. Wildland Fire 2013, 22, 353–358. [Google Scholar] [CrossRef]
  4. Pyšek, P.; Jarošík, V.; Hulme, P.E.; Pergl, J.; Hejda, M.; Schaffner, U.; Vilà, M. A global assessment of invasive plant impacts on resident species, communities and ecosystems: The interaction of impact measures, invading species’ traits and environment. Glob. Change Biol. 2012, 18, 1725–1737. [Google Scholar] [CrossRef]
  5. Bradley, B.A.; Curtis, C.A.; Fusco, E.J.; Abatzoglou, J.T.; Balch, J.K.; Dadashi, S.; Tuanmu, M.-N. Cheatgrass (Bromus tectorum) distribution in the intermountain Western United States and its relationship to fire frequency, seasonality, and ignitions. Biol. Invasions 2017, 20, 1493–1506. [Google Scholar] [CrossRef]
  6. Tomat-Kelly, G.; Flory, S.L. Research gaps limit understanding of invasion-fire cycles. Biol. Invasions 2022, 25, 693–711. [Google Scholar] [CrossRef]
  7. Boyte, S.P.; Wylie, B.K.; Gu, Y.; Major, D.J. Estimating Abiotic Thresholds for Sagebrush Condition Class in the Western United States. Rangel. Ecol. Manag. 2020, 73, 297–308. [Google Scholar] [CrossRef]
  8. Bradley, B.A.; Mustard, J.F. Identifying land cover variability distinct from land cover change: Cheatgrass in the Great Basin. Remote Sens. Environ. 2005, 94, 204–213. [Google Scholar] [CrossRef]
  9. Chambers, J.C.; Strand, E.K.; Ellsworth, L.M.; Tortorelli, C.M.; Urza, A.K.; Crist, M.R.; Miller, R.F.; Reeves, M.C.; Short, K.C.; Williams, C.L. Review of fuel treatment effects on fuels, fire behavior and ecological resilience in sagebrush (Artemisia spp.) ecosystems in the Western U.S. Fire Ecol. 2024, 20, 32. [Google Scholar] [CrossRef]
  10. Wood, D.J.A.; Seipel, T.; Irvine, K.M.; Rew, L.J.; Stoy, P.C. Fire and development influences on sagebrush community plant groups across a climate gradient in northern Nevada. Ecosphere 2019, 10, 02990. [Google Scholar] [CrossRef]
  11. Balch, J.K.; Bradley, B.A.; D’Antonio, C.M.; Gomez-Dans, J. Introduced annual grass increases regional fire activity across the arid western USA (1980–2009). Glob. Chang. Biol. 2013, 19, 173–183. [Google Scholar] [CrossRef]
  12. Goergen, E.M.; Leger, E.A.; Espeland, E.K. Native perennial grasses show evolutionary response to Bromus tectorum (cheatgrass) invasion. PLoS ONE 2011, 6, e18145. [Google Scholar] [CrossRef] [PubMed]
  13. Brownsey, P.; James, J.J.; Barry, S.J.; Becchetti, T.A.; Davy, J.S.; Doran, M.P.; Forero, L.C.; Harper, J.M.; Larsen, R.E.; Larson-Praplan, S.R.; et al. Using Phenology to Optimize Timing of Mowing and Grazing Treatments for Medusahead (Taeniatherum caput-medusae). Rangel. Ecol. Manag. 2017, 70, 210–218. [Google Scholar] [CrossRef]
  14. Davies, K.W.; Boyd, C.S.; Beck, J.L.; Bates, J.D.; Svejcar, T.J.; Gregg, M.A. Saving the sagebrush sea: An ecosystem conservation plan for big sagebrush plant communities. Biol. Conserv. 2011, 144, 2573–2584. [Google Scholar] [CrossRef]
  15. Franzese, J.; di Virgilio, A.; Pirk, G.; Lescano, M.N.; Speziale, K.L. Low biotic resistance to cheatgrass invasion in Patagonia: Evidence from competition experiments. Biol. Invasions 2021, 24, 235–246. [Google Scholar] [CrossRef]
  16. Ni, M.; Liu, Y.; Chu, C.; Xu, H.; Fang, S. Fast seedling root growth leads to competitive superiority of invasive plants. Biol. Invasions 2018, 20, 1821–1832. [Google Scholar] [CrossRef]
  17. Tarbox, B.C.; Van Schmidt, N.D.; Shyvers, J.E.; Saher, D.J.; Heinrichs, J.A.; Aldridge, C.L. Bridging the gap between spatial modeling and management of invasive annual grasses in the imperiled sagebrush biome. Rangel. Ecol. Manag. 2022, 82, 104–115. [Google Scholar] [CrossRef]
  18. Applestein, C.; Germino, M.J. Patterns of post-fire invasion of semiarid shrub-steppe reveals a diversity of invasion niches within an exotic annual grass community. Biol. Invasions 2022, 24, 741–759. [Google Scholar] [CrossRef]
  19. Pilliod, D.S.; Welty, J.L.; Arkle, R.S. Refining the cheatgrass–fire cycle in the Great Basin: Precipitation timing and fine fuel composition predict wildfire trends. Ecol. Evol. 2017, 7, 8126–8151. [Google Scholar] [CrossRef]
  20. Davies, K.W.; Boyd, C.S.; Copeland, S.M.; Bates, J.D. Moderate Grazing During the Off-Season (Fall-Winter) Reduces Exotic Annual Grasses in Sagebrush-Bunchgrass Steppe. Rangel. Ecol. Manag. 2022, 82, 51–57. [Google Scholar] [CrossRef]
  21. Davies, K.W.; Bates, J.D.; Perryman, B.; Arispe, S. Fall-Winter Grazing After Fire in Annual Grass-Invaded Sagebrush Steppe Reduced Annuals and Increased a Native Bunchgrass. Rangel. Ecol. Manag. 2021, 77, 1–8. [Google Scholar] [CrossRef]
  22. Chambers, J.C.; Miller, R.F.; Board, D.I.; Pyke, D.A.; Roundy, B.A.; Grace, J.B.; Schupp, E.W.; Tausch, R.J. Resilience and Resistance of Sagebrush Ecosystems: Implications for State and Transition Models and Management Treatments. Rangel. Ecol. Manag. 2014, 67, 440–454. [Google Scholar] [CrossRef]
  23. Chambers, J.C.; Roundy, B.A.; Blank, R.R.; Meyer, S.E.; Whittaker, A. What Makes Great Basin Sagebrush Ecosystems Invasible Bybromus Tectorum? Ecol. Monogr. 2007, 77, 117–145. [Google Scholar] [CrossRef]
  24. Chambers, J.C.; Bradley, B.A.; Brown, C.S.; D’Antonio, C.; Germino, M.J.; Grace, J.B.; Hardegree, S.P.; Miller, R.F.; Pyke, D.A. Resilience to stress and disturbance, and resistance to Bromus tectorum L. invasion in cold desert shrublands of western North America. Ecosystems 2013, 17, 360–375. [Google Scholar] [CrossRef]
  25. Dahal, D.; Boyte, S.P.; Oimoen, M.J. Predicting Exotic Annual Grass Abundance in Rangelands of the Western United States Using Various Precipitation Scenarios. Rangel. Ecol. Manag. 2023, 90, 221–230. [Google Scholar] [CrossRef]
  26. Bradley, B.A.; Curtis, C.A.; Chambers, J.C. Bromus response to climate and projected changes with climate change. In Exotic Brome Grasses in Arid and Semiarid Ecosystems of the Western US: Causes, Consequences, and Management Implications; Germino, M.J., Chambers, J.C., Brown, C.S., Eds.; Springer International Publishing: Berlin/Heidelberg, Germany, 2016; pp. 257–274. [Google Scholar]
  27. Terry, T.J.; Hardegree, S.P.; Adler, P.B. Modeling cheatgrass distribution, abundance, and response to climate change as a function of soil microclimate. Ecol. Appl. 2024, 34, e3028. [Google Scholar] [CrossRef]
  28. Nunes, A.M.; Byrne, K.M. Drought and shrub cover differentially affect seed bank composition within two sagebrush steppe communities. J. Arid Environ. 2022, 202, 104752. [Google Scholar] [CrossRef]
  29. Maxwell, T.M.; Germino, M.J. The effects of cheatgrass invasion on US Great Basin carbon storage depend on interactions between plant community composition, precipitation seasonality, and soil climate regime. J. Appl. Ecol. 2022, 59, 2863–2873. [Google Scholar] [CrossRef]
  30. Bansal, S.; James, J.J.; Sheley, R.L. The effects of precipitation and soil type on three invasive annual grasses in the western United States. J. Arid Environ. 2014, 104, 38–42. [Google Scholar] [CrossRef]
  31. Compagnoni, A.; Adler, P.B. Warming, competition, and Bromus tectorum population growth across an elevation gradient. Ecosphere 2014, 5, 1–34. [Google Scholar] [CrossRef]
  32. Pastick, N.J.; Wylie, B.K.; Rigge, M.B.; Dahal, D.; Boyte, S.P.; Jones, M.O.; Allred, B.W.; Parajuli, S.; Wu, Z. Rapid monitoring of the abundance and spread of exotic annual grasses in the western United States using remote sensing and machine learning. AGU Adv. 2021, 2, e2020AV000298. [Google Scholar] [CrossRef]
  33. Ryel, R.J.; Leffler, A.J.; Ivans, C.; Peek, M.S.; Caldwell, M.M. Functional differences in water-use patterns of contrasting life forms in Great Basin steppelands. Vadose Zone J. 2010, 9, 548–560. [Google Scholar] [CrossRef]
  34. Williamson, M.A.; Fleishman, E.; Mac Nally, R.C.; Chambers, J.C.; Bradley, B.A.; Dobkin, D.S.; Board, D.I.; Fogarty, F.A.; Horning, N.; Leu, M.; et al. Fire, livestock grazing, topography, and precipitation affect occurrence and prevalence of cheatgrass (Bromus tectorum) in the central Great Basin, USA. Biol. Invasions 2020, 22, 663–680. [Google Scholar] [CrossRef]
  35. Case, M.F.; Davies, K.W.; Boyd, C.S.; Aoyama, L.; Merson, J.; Penkauskas, C.; Hallett, L.M. Cross-scale analysis reveals interacting predictors of annual and perennial cover in Northern Great Basin rangelands. Ecol. Appl. 2024, 34, e2953. [Google Scholar] [CrossRef]
  36. Rau, B.M.; Chambers, J.C.; Pyke, D.A.; Roundy, B.A.; Schupp, E.W.; Doescher, P.; Caldwell, T.G. Soil Resources Influence Vegetation and Response to Fire and Fire-Surrogate Treatments in Sagebrush-Steppe Ecosystems. Rangel. Ecol. Manag. 2014, 67, 506–521. [Google Scholar] [CrossRef]
  37. Mahood, A.L.; Jones, R.O.; Board, D.I.; Balch, J.K.; Chambers, J.C. Interannual climate variability mediates changes in carbon and nitrogen pools caused by annual grass invasion in a semiarid shrubland. Global Change Biol. 2022, 28, 267–284. [Google Scholar] [CrossRef]
  38. Feldman, A.F.; Feng, X.; Felton, A.J.; Konings, A.G.; Knapp, A.K.; Biederman, J.A.; Poulter, B. Plant responses to changing rainfall frequency and intensity. Nat. Rev. Earth Environ. 2024, 5, 276–294. [Google Scholar] [CrossRef]
  39. Davies, K.W.; Wollstein, K.; Dragt, B.; O’Connor, C. Grazing management to reduce wildfire risk in invasive annual grass prone sagebrush communities. Rangelands 2022, 44, 194–199. [Google Scholar] [CrossRef]
  40. Schroeder, V.M.; Johnson, D.D.; O’Connor, R.C.; Crouch, C.G.; Dragt, W.J.; Quicke, H.E.; Silva, L.F.; Wood, D.J. Managing invasive annual grasses, annually: A case for more case studies. Rangelands 2022, 44, 210–217. [Google Scholar] [CrossRef]
  41. Dahal, D.; Pastick, N.J.; Boyte, S.P.; Parajuli, S.; Oimoen, M.J.; Megard, L.J. Fractional Estimates of Multiple Exotic Annual Grass (EAG) Species in the Sagebrush Biome, USA, 2016–2023 (ver. 4.0, July 2024). 2021. [Google Scholar] [CrossRef]
  42. Wylie, B.K.; Pastick, N.J.; Picotte, J.J.; Deering, C.A. Geospatial data mining for digital raster mapping. Gisci. Remote Sens. 2019, 56, 406–429. [Google Scholar] [CrossRef]
  43. Kearney, S.P.; Porensky, L.M.; Augustine, D.J.; Gaffney, R.; Derner, J.D. Monitoring standing herbaceous biomass and thresholds in semiarid rangelands from harmonized Landsat 8 and Sentinel-2 imagery to support within-season adaptive management. Remote Sens. Environ. 2022, 271, 112907. [Google Scholar] [CrossRef]
  44. Jansen, V.S.; Kolden, C.A.; Schmalz, H.J.; Karl, J.W.; Taylor, R.V. Using Satellite-Based Vegetation Data for Short-Term Grazing Monitoring to Inform Adaptive Management. Rangel. Ecol. Manag. 2021, 76, 30–42. [Google Scholar] [CrossRef]
  45. Allred, B.W.; Creutzburg, M.K.; Carlson, J.C.; Cole, C.J.; Dovichin, C.M.; Duniway, M.C.; Jones, M.O.; Maestas, J.D.; Naugle, D.E.; Nauman, T.W.; et al. Guiding principles for using satellite-derived maps in rangeland management. Rangelands 2022, 44, 78–86. [Google Scholar] [CrossRef]
  46. Oja, T.; Jaaska, V.; Vislap, V. Breeding system, evolution and taxonomy of Bromus arvensis, B. japonicus and B. squarrosus (Poaceae). Plant Syst. Evol. 2003, 242, 101–117. [Google Scholar] [CrossRef]
  47. Porensky, L.M.; Blumenthal, D.M. Historical wildfires do not promote cheatgrass invasion in a western Great Plains steppe. Biol. Invasions 2016, 18, 3333–3349. [Google Scholar] [CrossRef]
  48. Dewitz, J.; U.S. Geological Survey. National Land Cover Database (NLCD) 2019 Products (ver. 2.0, June 2021). 2021. [Google Scholar] [CrossRef]
  49. Omernik, J.M.; Griffith, G.E. Ecoregions of the conterminous United States: Evolution of a hierarchical spatial framework. Environ. Manag. 2014, 54, 1249–1266. [Google Scholar] [CrossRef]
  50. Boyte, S.P.; Wylie, B.K. Near-real-time cheatgrass percent cover in the Northern Great Basin, USA, 2015. Rangelands 2016, 38, 278–284. [Google Scholar] [CrossRef]
  51. Gesch, D.B.; Evans, G.A.; Oimoen, M.J.; Arundel, S. The National Elevation Dataset. In Digital Elevation Model Technologies and Applications: The DEM Users Manual, 3rd ed.; Maune, D.F., Nayegandh, A., Eds.; American Society for Photogrammetry and Remote Sensing: Baton Rouge, LA, USA, 2018; pp. 83–110. [Google Scholar]
  52. Cracknell, A.P. Review article Synergy in remote sensing-what’s in a pixel? Int. J. Remote Sens. 2010, 19, 2025–2047. [Google Scholar] [CrossRef]
  53. Gomez-Chova, L.; Zurita-Milla, R.; Alonso, L.; Amoros-Lopez, J.; Guanter, L.; Camps-Valls, G. Gridding artifacts on medium-resolution satellite image time series: MERIS case study. IEEE Trans. Geosci. Remote Sens. 2011, 49, 2601–2611. [Google Scholar] [CrossRef]
  54. Ke, G.; Meng, Q.; Finley, T.; Wang, T.; Chen, W.; Ma, W.; Ye, Q.; Liu, T.-Y. LightGBM: A highly efficient gradient boosting decision tree. In Advances in Neural Information Processing Systems; Guyon, I., Luxburg, U.V., Bengio, S., Wallach, H., Fergus, R., Vishwanathan, S., Garnett, R., Eds.; Curran Associates, Inc.: Red Hook, NY, USA, 2017; Volume 30. [Google Scholar]
  55. Pedregosa, F.; Varoquaux, G.; Gramfort, A.; Michel, V.; Thirion, B.; Grisel, O.; Blondel, M.; Prettenhofer, P.; Weiss, R.; Dubourg, V.; et al. Scikit-learn: Machine Learning in Python. J. Mach. Learn. Res. 2011, 12, 2825–2830. [Google Scholar]
  56. Chaney, N.W.; Wood, E.F.; McBratney, A.B.; Hempel, J.W.; Nauman, T.W.; Brungard, C.W.; Odgers, N.P. POLARIS: A 30-m probabilistic soil series map of the contiguous United States. Geoderma 2016, 274, 54–67. [Google Scholar] [CrossRef]
  57. McCune, B.; Keon, D. Equations for potential annual direct incident radiation and heat load. J. Veg. Sci. 2002, 13, 603–606. [Google Scholar] [CrossRef]
  58. Rigge, M.B.; Bunde, B.; Postma, K.; Shi, H. Rangeland Condition Monitoring Assessment and Projection (RCMAP) Fractional Component Time-Series Across the Western U.S. 1985–2021; USGS: Reston, VA, USA, 2022. [CrossRef]
  59. Howell, A.; Winkler, D.E.; Phillips, M.L.; McNellis, B.; Reed, S.C. Experimental Warming Changes Phenology and Shortens Growing Season of the Dominant Invasive Plant Bromus tectorum (Cheatgrass). Front Plant Sci 2020, 11, 570001. [Google Scholar] [CrossRef] [PubMed]
  60. Sospedra-Alfonso, R.; Melton, J.R.; Merryfield, W.J. Effects of temperature and precipitation on snowpack variability in the Central Rocky Mountains as a function of elevation. Geophys. Res. Lett. 2015, 42, 4429–4438. [Google Scholar] [CrossRef]
  61. Joly, D.; Castel, T.; Pohl, B.; Richard, Y. Influence of spatial information resolution on the relation between elevation and temperature. Int. J. Climatol. 2018, 38, 5677–5688. [Google Scholar] [CrossRef]
  62. Liu, X.; Mei, X.; Li, Y.; Wang, Q.; Jensen, J.R.; Zhang, Y.; Porter, J.R. Evaluation of temperature-based global solar radiation models in China. Agric. For. Meteorol. 2009, 149, 1433–1446. [Google Scholar] [CrossRef]
  63. Meza, F.; Varas, E. Estimation of mean monthly solar global radiation as a function of temperature. Agric. For. Meteorol. 2000, 100, 231–241. [Google Scholar] [CrossRef]
  64. DeFalco, L.A.; Fernandez, G.C.J.; Nowak, R.S. Variation in the establishment of a non-native annual grass influences competitive interactions with Mojave Desert perennials. Biol. Invasions 2006, 9, 293–307. [Google Scholar] [CrossRef]
  65. Doherty, K.; Theobald, D.M.; Bradford, J.B.; Wiechman, L.A.; Bedrosian, G.; Boyd, C.S.; Cahill, M.; Coates, P.S.; Creutzburg, M.K.; Crist, M.R.; et al. A Sagebrush Conservation Design to Proactively Restore America’s Sagebrush Biome; U.S. Department of the Interior, U.S. Geological Survey: Reston, VA, USA, 2022; 38p.
  66. Chiang, S.-H. Location quotient and trade. Ann. Reg. Sci. 2009, 43, 399–414. [Google Scholar] [CrossRef]
  67. Boyte, S.P.; Wylie, B.K.; Major, D.J. Cheatgrass Percent Cover Change: Comparing Recent Estimates to Climate Change–Driven Predictions in the Northern Great Basin. Rangel. Ecol. Manag. 2016, 69, 265–279. [Google Scholar] [CrossRef]
  68. Smith, J.T.; Allred, B.W.; Boyd, C.S.; Davies, K.W.; Jones, M.O.; Kleinhesselink, A.R.; Maestas, J.D.; Morford, S.L.; Naugle, D.E. The elevational ascent and spread of exotic annual grass dominance in the Great Basin, USA. Divers. Distrib. 2021, 28, 83–96. [Google Scholar] [CrossRef]
  69. Humphrey, L.D.; Schupp, E.W. Seed banks of Bromus tectorum-dominated communities in the Great Basin. West. N. Am. Nat. 2001, 61, 85–92. [Google Scholar]
  70. Meyer, S.E.; Quinney, D.; Nelson, D.L.; Weaver, J. Impact of the pathogen Pyrenophora semeniperda on Bromus tectorum seedbank dynamics in North American cold deserts. Weed Res. 2007, 47, 54–62. [Google Scholar] [CrossRef]
  71. Fernandez-Illescas, C.P.; Porporato, A.; Laio, F.; Rodriguez-Iturbe, I. The ecohydrological role of soil texture in a water-limited ecosystem. Water Resour. Res. 2001, 37, 2863–2872. [Google Scholar] [CrossRef]
  72. Leffler, A.J.; Ryel, R.J. Resource Pool Dynamics: Conditions That Regulate Species Interactions and Dominance. In Invasive Plant Ecology and Management: Linking Processes to Practice; Monaco, T.A., Sheley, R.L., Eds.; CAB International: Wallingford, UK, 2012; pp. 57–78. [Google Scholar]
  73. Fravolini, A.; Hultine, K.R.; Brugnoli, E.; Gazal, R.; English, N.B.; Williams, D.G. Precipitation pulse use by an invasive woody legume: The role of soil texture and pulse size. Oecologia 2005, 144, 618–627. [Google Scholar] [CrossRef]
  74. McAuliffe, J.R. Landscape Evolution, Soil Formation, and Ecological Patterns and Processes in Sonoran Desert Bajadas. Ecol. Monogr. 1994, 64, 111–148. [Google Scholar] [CrossRef]
  75. Leffler, A.J.; James, J.J.; Monaco, T.A. Temperature and functional traits influence differences in nitrogen uptake capacity between native and invasive grasses. Oecologia 2013, 171, 51–60. [Google Scholar] [CrossRef]
  76. Fernandez-Going, B.M.; Anacker, B.L.; Harrison, S.P. Temporal variability in California grasslands: Soil type and species functional traits mediate response to precipitation. Ecology 2012, 93, 2104–2114. [Google Scholar] [CrossRef]
  77. McMahon, D.E.; Urza, A.K.; Brown, J.L.; Phelan, C.; Chambers, J.C.; Ibáñez, I. Modelling species distributions and environmental suitability highlights risk of plant invasions in western United States. Divers. Distrib. 2021, 27, 710–728. [Google Scholar] [CrossRef]
  78. Salo, L.F. Population dynamics of red brome (Bromus madritensis subsp. rubens): Times for concern, opportunities for management. J. Arid Environ. 2004, 57, 291–296. [Google Scholar] [CrossRef]
  79. Weisberg, P.J.; Dilts, T.E.; Greenberg, J.A.; Johnson, K.N.; Pai, H.; Sladek, C.; Kratt, C.; Tyler, S.W.; Ready, A. Phenology-based classification of invasive annual grasses to the species level. Remote Sens. Environ. 2021, 263, 112568. [Google Scholar] [CrossRef]
  80. Horn, K.J.; Nettles, R.; Clair, S.B.S. Germination response to temperature and moisture to predict distributions of the invasive grass red brome and wildfire. Biol. Invasions 2015, 17, 1849–1857. [Google Scholar] [CrossRef]
  81. Reinhart, K.O.; Rinella, M.J. Molecular evidence for impoverished mycorrhizal communities of Agropyron cristatum compared with nine other plant species in the Northern Great Plains. Rangel. Ecol. Manag. 2021, 74, 147–150. [Google Scholar] [CrossRef]
  82. Beckstead, J.; Augspurger, C.K. An experimental test of resistance to cheatgrass invasion: Limiting resources at different life stages. Biol. Invasions 2004, 6, 417–432. [Google Scholar] [CrossRef]
  83. Mangla, S.; Sheley, R.L.; James, J.J.; Radosevich, S.R. Intra and interspecific competition among invasive and native species during early stages of plant growth. Plant Ecol. 2011, 212, 531–542. [Google Scholar] [CrossRef]
  84. Davies, K.W.; Leger, E.A.; Boyd, C.S.; Hallett, L.M. Living with exotic annual grasses in the sagebrush ecosystem. J. Environ. Manag. 2021, 288, 112417. [Google Scholar] [CrossRef]
  85. Davies, K.W.; Johnson, D.D. Established Perennial Vegetation Provides High Resistance to Reinvasion by Exotic Annual Grasses. Rangel. Ecol. Manag. 2017, 70, 748–754. [Google Scholar] [CrossRef]
  86. He, L.; Wang, J.; Peltier, D.M.P.; Ritter, F.; Ciais, P.; Peñuelas, J.; Xiao, J.; Crowther, T.W.; Li, X.; Ye, J.-S.; et al. Lagged precipitation effects on plant production across terrestrial biomes. Nat. Ecol. Evol. 2025, 9, 1800–1811. [Google Scholar] [CrossRef]
  87. Li, J.; Kug, J.-S.; Park, S.-w.; Zhai, P.; Huang, M.; Kim, J.-S. Distinct magnitude asymmetries of daily extreme anomalies in gross primary productivity between forests and non-forests. Clim. Dyn. 2022, 59, 767–784. [Google Scholar] [CrossRef]
  88. Mata-González, R.; Hunter, R.G.; Coldren, C.L.; McLendon, T.; Paschke, M.W. Modelling plant growth dynamics in sagebrush steppe communities affected by fire. J. Arid Environ. 2007, 69, 144–157. [Google Scholar] [CrossRef]
  89. Liu, C.; Wolter, C.; Courchamp, F.; Roura-Pascual, N.; Jeschke, J.M. Biological invasions reveal how niche change affects the transferability of species distribution models. Ecology 2022, 103, e3719. [Google Scholar] [CrossRef] [PubMed]
  90. Fernández, M.; Hamilton, H. Ecological Niche Transferability Using Invasive Species as a Case Study. PLoS ONE 2015, 10, e0119891. [Google Scholar] [CrossRef] [PubMed]
  91. Knapp, P.A. Spatio-Temporal Patterns of Large Grassland Fires in the Intermountain West, USA. Global Ecol. Biogeogr. Lett. 1998, 7, 259–272. [Google Scholar] [CrossRef]
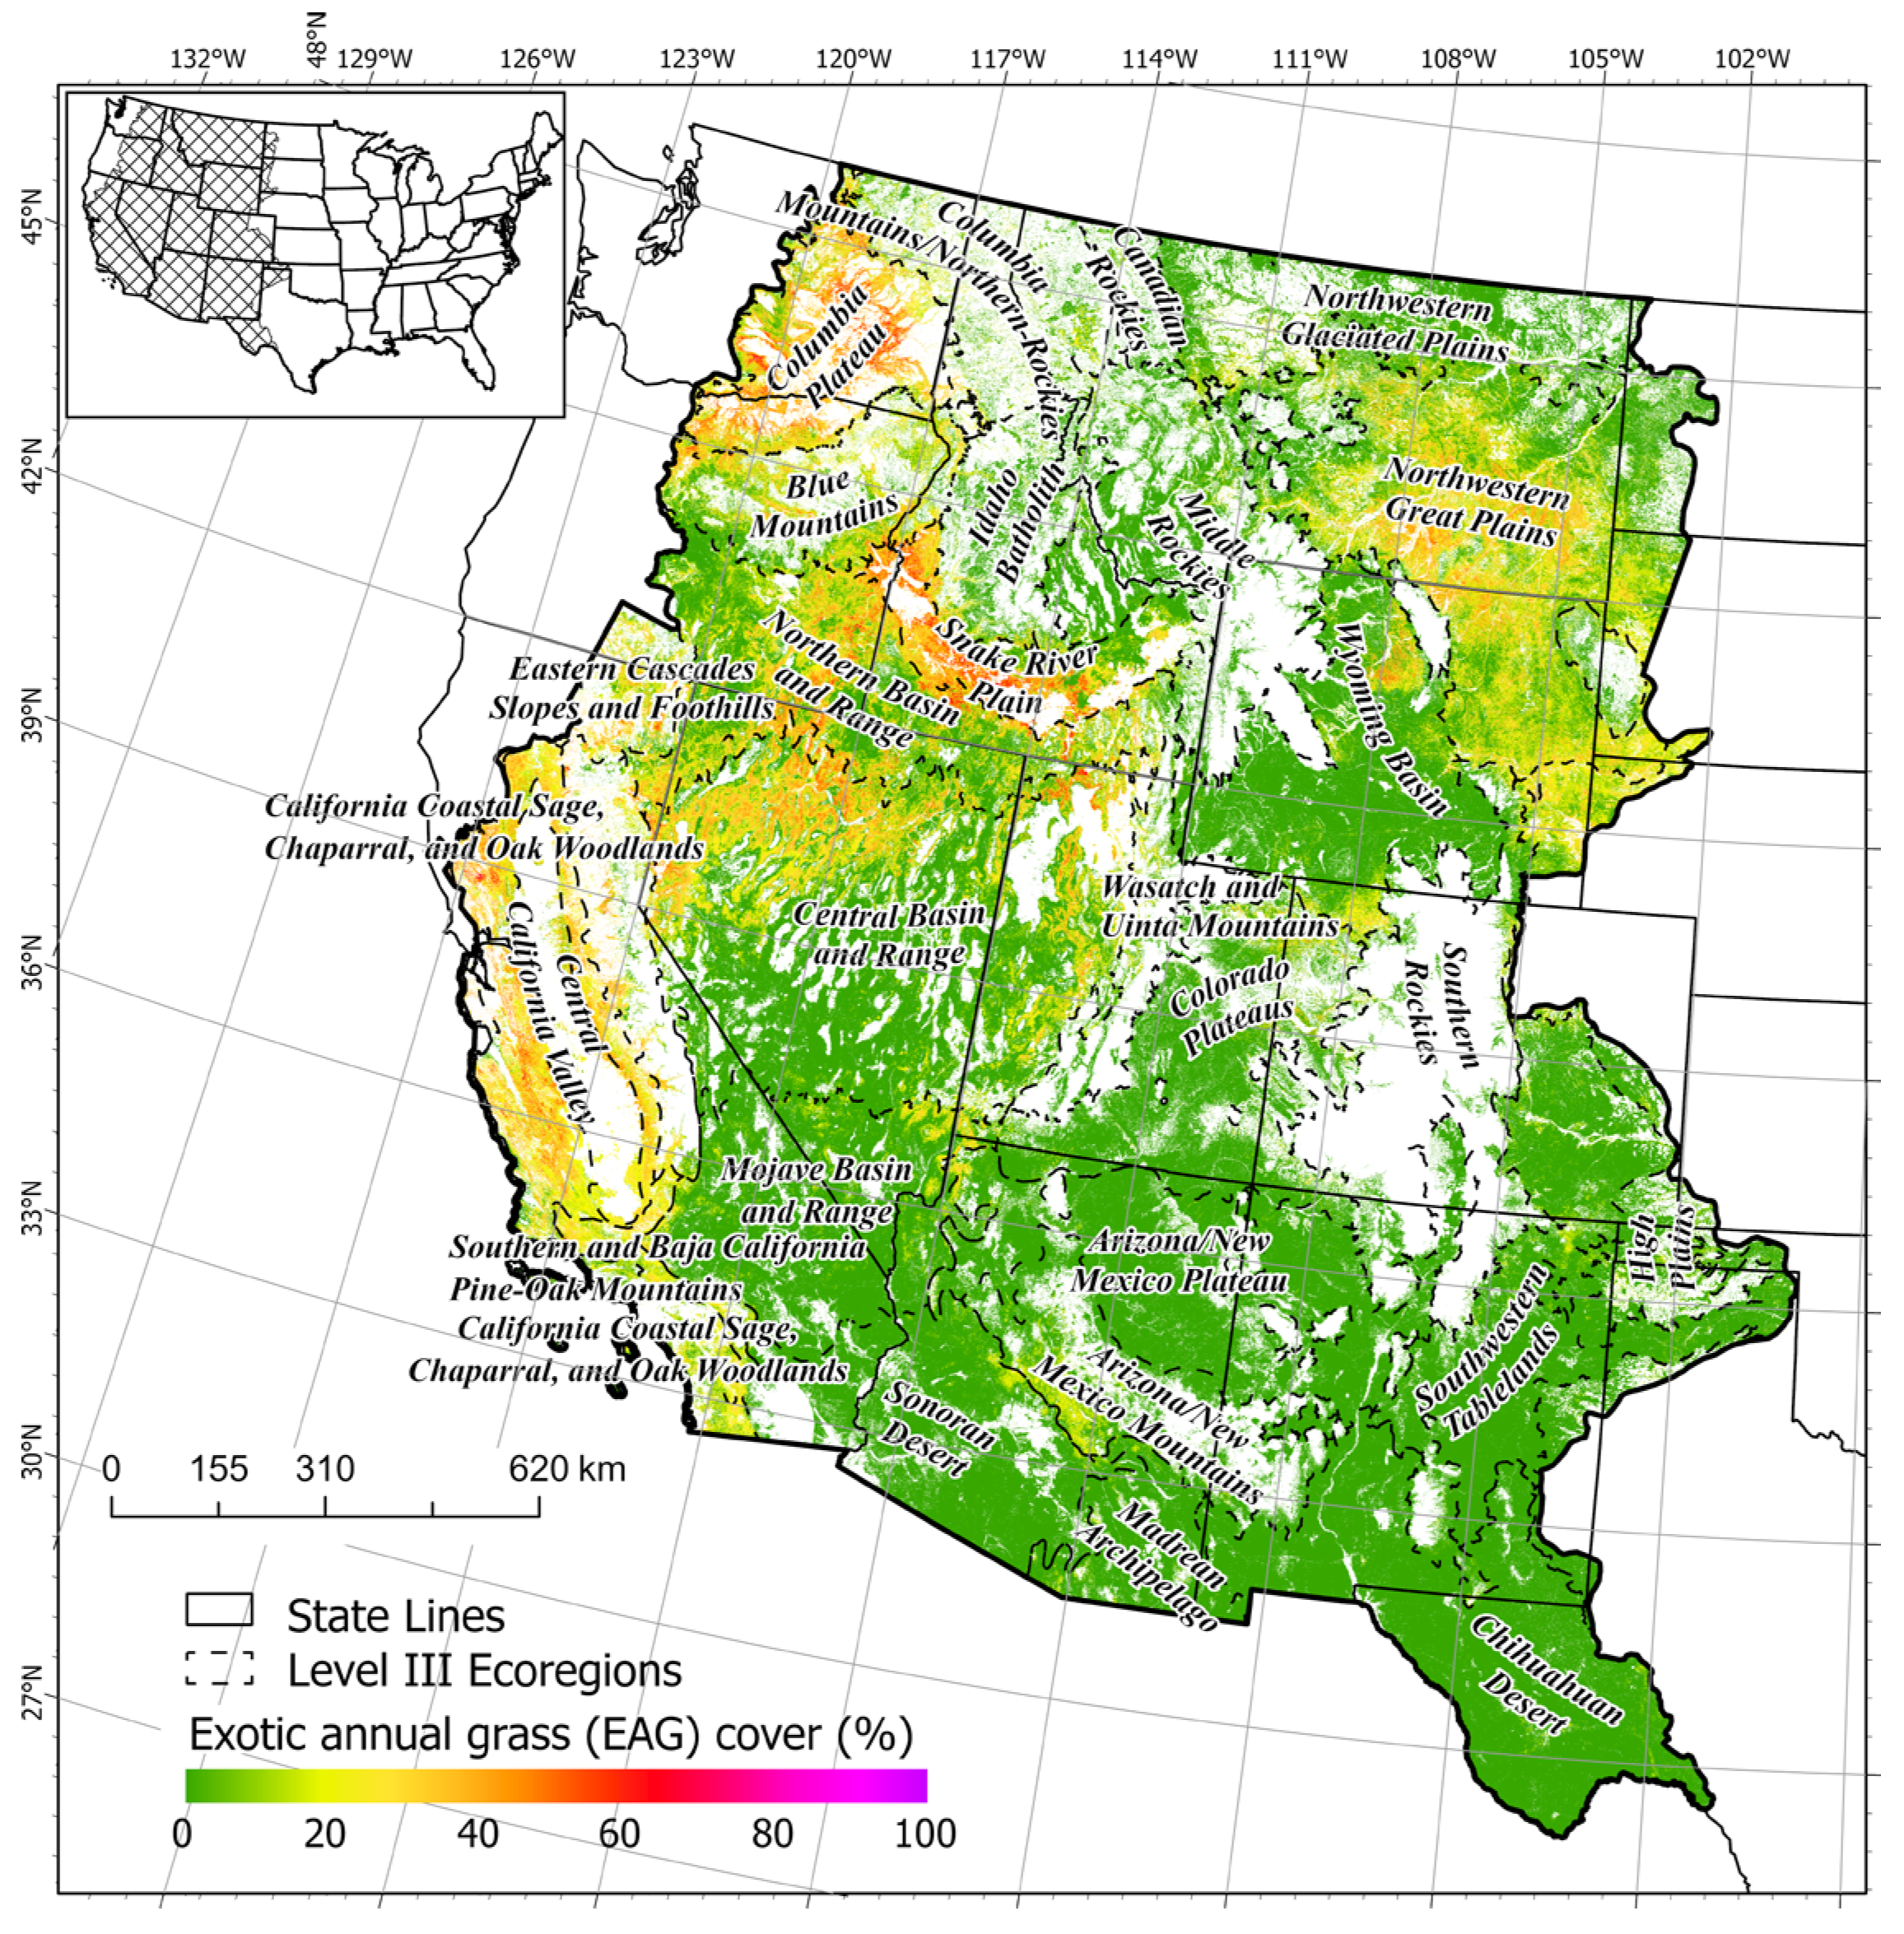
Figure 1. Exotic annual grass (EAG) percent cover predicted in the normal (PPT_1.0) precipitation scenario (results for 2022 shown as an example). Level III ecoregions indicated with labels [49]. Entire conterminous U.S. with study area highlighted with crosshatching in inset.
Remotesensing 17 03821 g001
Figure 2. Spatial distribution of all EAG anomalies by precipitation scenarios.
Remotesensing 17 03821 g002
Figure 3. Logarithmic location quotient (LQ) (ratio) of exotic annual grass (EAG) anomalies by edaphic variable and precipitation scenario compared to the highly invaded areas (areas with ≥10% EAG cover) in the normal precipitation (PPT_1.0) scenario as the baseline. LQ values > 0 indicate that anomaly density is greater in the strata of that variable than in highly invaded areas overall.
Remotesensing 17 03821 g003
Figure 4. Spatial distribution of exotic annual grass (EAG) cover within −EAG anomalies in relation to three soil types (silt, sand, and clay) predicted with 150% (PPT_1.5) and 200% (PPT_2.0) of normal precipitation. Gray lines are ecoregion level III boundaries [49]. Green (red) shading shows percent cover of EAG with soil content > 10% (≤10%) of each type. Light gray shading indicates the lack of a −EAG anomaly.
Remotesensing 17 03821 g004
Figure 5. Spatial distribution of exotic annual grass (EAG) cover within +EAG anomalies in relation to three soil types (silt, clay, and sand) predicted in 50% of normal (PPT_0.5) and 75% of normal (PPT_0.75) precipitation scenarios. Gray lines are ecoregion level III boundaries [49]. Green (red) shading is percent cover of EAG with soil content of >10% (≤10%) of each type. Light gray shading indicates the lack of a +EAG anomaly.
Remotesensing 17 03821 g005
Figure 6. Logarithmic location quotient (LQ) (ratio) of EAG anomalies by topographic variable and precipitation scenario compared to the highly invaded areas (areas with ≥10% EAG cover) in the normal precipitation (PPT_1.0) scenario as the baseline. LQ values > 0 indicate that anomaly density is greater in the strata of that variable than in highly invaded areas overall. DEM is digital elevation model, and PADR is potential annual direct radiation.
Remotesensing 17 03821 g006
Figure 7. Spatial distribution of exotic annual grass (EAG) cover within anomalous areas in relation to the digital elevation model (DEM) and potential annual direct radiation (PADR) with +EAG anomalies (PPT_0.5 and PPT_0.75 scenarios) and −EAG anomalies (PPT_1.5 and PPT_2.0 scenarios). Gray lines are ecoregion level III boundaries [49]. Red shading is percent cover of EAG in the low range (DEM: ≤1350 m and PADR: ≤0.78), blue shading is percent cover of EAG in the mid-range (DEM: >1350 m and ≤2200 m and PADR: >0.78 and ≤0.9), and green shading is percent cover of EAG in the high range (DEM: >2200 m and PADR: >0.9). PADR unit is MJ/cm2/yr.
Remotesensing 17 03821 g007
Figure 8. Logarithmic location quotient (LQ) (ratio) of exotic annual grass (EAG) anomales by vegetation and precipitation scenario compared to the highly invaded areas (areas with ≥10% EAG cover) in the normal precipitation (PPT_1.0) scenario as the baseline. LQ values > 0 indicate that anomaly density is greater in the strata of that variable than in highly invaded areas overall. P. Herb is perennial herbaceous.
Remotesensing 17 03821 g008
Figure 9. Spatial distribution of exotic annual grass (EAG) cover that co-exists with perennial herbaceous (P. Herb) and shrub with +EAG anomalies (PPT_0.5 and PPT_0.75 scenarios) and −EAG anomalies (PPT_1.5 and PPT_2.0 scenarios). Red-shaded pixels represent percent cover of EAG in areas where there is 8% or less perennial herbaceous and/or shrub cover coexisting within EAG anomalous areas. Blue-shaded pixels represent percentage cover of EAG in areas where there is more than 8% and less than or equal to 20% perennial herbaceous and/or shrub coexisting within EAG anomalous areas. Green-shaded pixels represent percentage cover of EAG in areas where there is more than 20% P. Herb and/or shrub coexisting within EAG anomalous areas. Gray lines are ecoregion level III boundaries [49].
Remotesensing 17 03821 g009
Table 1. Relationship of edaphic to EAG cover anomalies. Mean, median, and Kolmogorov–Smirnov (KS) test of exotic annual grass percent cover (EAG) by strata of variables within anomalous areas. A higher KS value (1.0) indicates a good fit, while a lower value (0.0) suggests a poor fit. Mean and median of EAG percent cover values are calculated for the anomalous areas with highly invaded areas of strata. B-mean and B-med values are mean and median EAG percentage cover of baseline within the strata. PPT_0.5, PPT_0.75, PPT_1.5, and PPT_2.0 are 50, 75, 150, and 200% of normal precipitation (PPT_1.0) scenarios. Area (in percent) is calculated using highly invaded areas of normal precipitation as the baseline. p-values are <0.001 for all strata.
Precipitation ScenarioStatisticClay (%)Sand (%)Silt (%)
≤10>10≤10>10≤10>10
PPT_0.5Mean19.4619.8117.2719.6418.5819.67
Median171716171717
B_mean15.6916.0813.9415.8415.1715.82
B_med141413141414
KS_test0.270.250.320.270.280.27
Area%14.010.461.0713.402.7211.75
PPT_0.75Mean21.6621.8619.9921.8220.7421.93
Median201918201920
B_mean18.3418.0216.8418.4617.6618.51
B_med171615171617
KS_test0.1820.210.220.180.190.18
Area%20.470.891.7419.614.7016.65
PPT_1.5Mean21.3420.0422.4121.2119.6521.74
Median191720191819
B_mean25.6823.0126.4625.5623.7126.13
B_med242124242224
KS_test0.230.200.200.230.240.22
Area%28.550.622.3526.826.0123.17
PPT_2.0Mean21.8519.2622.9721.720.0722.25
Median201721191820
B_mean27.122.4727.8926.9424.6727.62
B_med252126252426
KS_test0.250.220.220.250.260.25
Area%28.190.532.3126.425.8722.85
PPT_1.0Area%96.573.4399124.3175.69
Table 2. Relationship of topography to EAG cover anomalies. Mean, median, and Kolmogorov–Smirnov (KS) test of exotic annual grass percent cover (EAG) by strata of variables within anomalous areas. A higher KS value (1.0) indicates a good fit, while a lower value (0.0) suggests a poor fit. Mean and median of EAG percent cover values are calculated for the anomalous areas with highly invaded areas of strata. B-mean and B-med values are mean and median EAG percentage cover of baseline within the strata. PPT_0.5, PPT_0.75, PPT_1.5, and PPT_2.0 are 50, 75, 150, and 200% of normal precipitation (PPT_1.0) scenarios. Area (in percent) is calculated using highly invaded areas of normal precipitation as the baseline. p-values are <0.001 for all strata.
Precipitation ScenarioStatisticElevation (m)Potential Annual Direct Radiation (PADR) (MJ/cm2/yr)
≤1350>1350 and ≤2200>2200≤0.78>0.78 and ≤0.9>0.9
PPT_0.5Mean21.3816.9215.1619.3519.6820.32
Median191513171718
B_mean17.1713.7910.8115.7315.5416.33
B_med151310141414
KS_test0.230.320.570.260.310.27
Area%6.326.990.1510.243.710.52
PPT_0.75Mean23.0220.0315.9621.4322.2322.54
Median211814192021
B_mean19.317.1712.5818.2118.5818.83
B_med171611171717
KS_test0.170.200.450.180.200.18
Area%10.8811.350.1315.265.250.85
PPT_1.5Mean22.3420.0316.8921.2721.4221.59
Median201815191919
B_mean26.7824.2120.9925.5525.8626.27
B_med252320242424
KS_test0.210.240.310.230.220.23
Area%16.2812.780.1122.795.680.70
PPT_2.0Mean22.9320.5216.6121.921.4221.37
Median211815202019
B_mean28.225.6721.6127.1226.6226.27
B_med262421252524
KS_test0.230.270.360.250.260.25
Area%15.4513.160.1122.965.220.55
PPT_1.0Area%57.9141.750.3577.1319.693.18
Table 3. Relationship of vegetation cover to EAG cover anomalies. Mean, median, and Kolmogorov–Smirnov (KS) test of exotic annual grass percent cover (EAG) by strata of variables within anomalous areas. A higher KS value (1.0) indicates a good fit, while a lower value (0.0) suggests a poor fit. Mean and median of EAG percent cover values are calculated for the anomalous areas with highly invaded areas of strata. B-mean and B-med values are mean and median EAG percentage cover of baseline within the strata. PPT_0.5, PPT_0.75, PPT_1.5, and PPT_2.0 are 50, 75, 150, and 200% of normal precipitation (PPT_1.0) scenarios. Area (in percent) is calculated using highly invaded areas of normal precipitation as the baseline. p-values are <0.001 for all strata.
Precipitation ScenarioStatisticPerennial Herbaceous (%)Shrub (%)
≤8>8 and ≤20>20≤8>8 and ≤20>20
PPT_0.5Mean19.1819.9718.5720.8517.4818.57
Median171817181517
B_mean16.2816.1314.961713.9214.69
B_med141414151214
KS_test0.260.250.290.220.340.30
Area%5.343.155.977.754.272.45
PPT_0.75Mean22.6423.0520.2423.1719.6120.04
Median212118211718
B_mean19.0519.6717.119.7416.5216.56
B_med171815181515
KS_test0.170.160.210.150.230.21
Area%7.124.769.4711.935.953.46
PPT_1.5Mean22.7622.120.6322.7919.5519.07
Median192118211717
B_mean25.1927.6324.7827.1323.6923.62
B_med242623252222
KS_test0.240.210.230.200.250.28
Area%7.477.6114.0916.557.874.76
PPT_2.0Mean22.0321.8320.9523.3619.7819.17
Median192119211817
B_mean25.9729.4426.0428.6824.7424.41
B_med242724272323
KS_test0.270.240.250.230.280.31
Area%6.458.3413.9316.937.554.24
PPT_1.0Area%30.1225.8344.0657.1626.8416.01
Disclaimer/Publisher’s Note: The statements, opinions and data contained in all publications are solely those of the individual author(s) and contributor(s) and not of MDPI and/or the editor(s). MDPI and/or the editor(s) disclaim responsibility for any injury to people or property resulting from any ideas, methods, instructions or products referred to in the content.