Article

Climate Surpasses Soil Texture in Driving Soil Salinization Alleviation in Arid Xinjiang

1
College of Resources and Environment, Xinjiang Agricultural University, Urumqi 830052, China
2
Xinjiang Engineering Technology Research Center of Soil Big Data, Urumqi 830052, China
*
Author to whom correspondence should be addressed.
Remote Sens. 2025, 17(23), 3812; https://doi.org/10.3390/rs17233812
Submission received: 15 October 2025 / Revised: 5 November 2025 / Accepted: 21 November 2025 / Published: 25 November 2025

Highlights

What are the main findings?
  • Obtained an inversion model suitable for soil salinization monitoring in arid regions, demonstrating high accuracy and stability.
  • Revealed the spatiotemporal dynamics of soil salinization in southern Xinjiang.
  • Quantitatively elucidated the driving mechanisms of climate and soil texture, highlighting the predominant role of climatic factors across multiple temporal scales.
What is the implication of the main finding?
  • Provided a methodological framework for large-scale identification of soil salinization in arid regions.
  • Offered a scientific basis for identifying high-risk areas of soil salinization and implementing targeted monitoring.
  • Strengthened the empirical evidence for the predominant role of climate, thereby supporting the development of adaptive management and differentiated regulation strategies under climate change.

Abstract

Soil salinization in arid regions has drawn considerable attention due to its constraints on agricultural productivity and ecological security. Climate and soil texture, as key drivers at the macroscale, still lack systematic quantitative assessments regarding their mechanisms in shaping the long-term dynamics of salinity, and comparative evaluations of their relative contributions remain insufficient. Therefore, there is an urgent need to explore the spatiotemporal variations in soil salinization in arid regions and its responses to climate and soil texture. This study was based on salinity sampling sites collected in southern Xinjiang in 2023. A Random Forest (RF)-based inversion model was constructed using spectral indices derived from Landsat-9 and Sentinel-2 as environmental predictors. The predictive performance of models using all variables was compared with those using RF-based feature selection. The optimal model was then applied to retrieve soil salinity concentrations for 2008, 2013, 2018, and 2023 at four equidistant time points, enabling the spatiotemporal evolution of soil salinization across the study area to be assessed. Finally, a Boosted Regression Tree (BRT) model was employed to quantify the driving contributions of climate and soil texture. Results showed that the feature-selected Landsat-9 model performed best, with an R2 of 0.747, significantly outperforming the Sentinel-2 model. The mean soil salinity concentration declined rapidly from 2008 to 2013, followed by a relatively slower but sustained decrease thereafter. The proportion of non-salinized land increased from 3.08% to 30.81%. The Sen’s slope−Mann−Kendall test indicated that 78.6% of salinity levels exhibited a significant downward trend, while 18.8% showed a slight increase. The relative contribution analysis indicated that climatic factors consistently exerted a stronger influence on the evolution of soil salinization than soil texture. Specifically, the contribution of climatic variables increased from 65.2% in 2008 to 66.8% in 2023, whereas that of soil texture decreased slightly from 34.8% to 33.2%. Among the climatic variables, the effect of potential evapotranspiration gradually weakened, while the impacts of temperature and precipitation continued to intensify. In contrast, soil texture variables played a comparatively minor yet stable role throughout the study period. These findings provide an effective framework for long-term monitoring of soil salinization and offer critical insights for adaptive management in arid regions under climate change.

1. Introduction

Soil salinization is one of the most widespread forms of land degradation in global arid and semi-arid regions, posing a severe threat to agricultural sustainability and ecological security. Globally, approximately 23% of croplands (about 0.34 × 10⁹ ha) are affected by salinity, threatening crop production and ecosystem stability [1,2]. In arid regions, low precipitation and intense evaporation hinder salt leaching, leading to salinity accumulation that exacerbates desertification and land degradation, thereby severely constraining agricultural sustainability and food security [3,4]. Xinjiang, China, is a typical arid region and one of the areas most severely affected by soil salinization [5]. In southern Xinjiang, long-term intensive irrigation and shallow groundwater tables, combined with the upward migration of saline groundwater, readily induce surface salt accumulation. The cations and anions involved—primarily Na+, Ca2+, Mg2+, Cl, and SO42−—originate from the dissolution of parent materials and capillary rise in saline groundwater, which deposit at the surface upon evaporation, thereby affecting cropping systems, crop quality, and regional ecological stability [6,7]. Accurate characterization of the spatial distribution and temporal evolution of soil salinization is of great theoretical significance for advancing precision agriculture, optimizing land use, and implementing ecological restoration projects [8]. Conventional ground surveys are constrained by high labor demands and restricted spatial coverage, rendering them unsuitable for large-scale, long-term monitoring and underscoring the necessity of adopting more efficient and continuous observation approaches.
The integration of remote sensing technology and machine learning offers new opportunities for refined monitoring and inversion of soil salinization in arid regions [9,10,11]. Compared with traditional approaches, this integration enables rapid acquisition and dynamic monitoring of soil salt content at large scales, thereby demonstrating significant advantages. However, the accuracy of inversion models strongly depends on the construction and selection of input variables. Previous studies have primarily employed vegetation indices and salinity indices as modeling variables [12]. However, their sensitivity varies considerably, and redundant information may lead to model overfitting, reduced computational efficiency, and limited generalization [13]. Therefore, feature selection techniques have become increasingly important for enhancing model performance. Random Forest (RF) can effectively identify key variables contributing to prediction through feature importance evaluation and eliminate redundancy, thereby improving model performance [14]. In addition, RF exhibits notable advantages in capturing nonlinear relationships, integrating multi-source data, and maintaining robustness, and has therefore been widely applied in soil salinization inversion studies [15,16,17]. Meanwhile, differences in remote sensing data sources can also significantly affect inversion outcomes. Sentinel imagery, with its high spatial resolution, is suitable for fine-scale analyses, whereas Landsat imagery, with its higher temporal resolution, is more advantageous for monitoring the temporal dynamics of salinization [18,19]. A systematic evaluation of the suitability and accuracy of different remote sensing data sources, along with the development of a scientifically robust variable framework, is essential for enhancing the reliability and applicability of soil salinization inversion in arid regions.
The processes of soil salinization in arid regions are highly complex, with their formation and evolution jointly driven by multiple factors. Previous studies have demonstrated that climate and soil texture are key driving factors of soil salinization [20,21]. Climate directly regulates soil water input and consumption through precipitation, evapotranspiration, and temperature, thereby affecting salt leaching and precipitation within soil horizons. Increased precipitation enhances downward water flux and promotes the dissolution and leaching of soluble salts, whereas high temperature and strong evapotranspiration accelerate upward capillary movement of saline groundwater, leading to salt crystallization and surface accumulation under arid conditions [8]. Soil texture controls the rate and depth of water–salt transport in soil profiles through pore structure and hydraulic conductivity [22]. However, most existing studies have remained at static spatial scales, lacking quantitative assessments of their long-term dynamic effects. Particularly under extreme hydrothermal conditions in arid regions, the driving effects of climate and soil texture on salinity dynamics may differ substantially from those observed in other ecological zones [23,24,25]. Taking southern Xinjiang as a representative arid region, climate and soil texture jointly control the dominant processes of water–salt transport in soils [26]. Clarifying the relative contributions of climate and soil texture to soil salinization dynamics provides theoretical support for site-specific management, regionalized governance, and optimized irrigation strategies [27]. In recent years, the Boosted Regression Tree (BRT) model has been widely applied in ecological and environmental studies. This model allows a comprehensive assessment of the effects of individual environmental factors on the response variable via relative contribution and partial dependence analyses, offering clearer insights into system-level interactions [28]. Therefore, the BRT model is particularly suitable for evaluating the relative impacts of climate change and soil texture on soil salinization. Based on remotely sensed inversion results of soil salt content, this study incorporates the BRT model to systematically evaluate, from a time-series perspective, the driving effects of climate conditions and soil texture on salinity dynamics, with the aim of providing data support for salinization management in arid regions.
The specific objectives of this study are as follows: (1) To evaluate the suitability and accuracy differences in various remote sensing data sources in soil salinization inversion and to identify the optimal model for arid regions; (2) To characterize the spatiotemporal patterns of soil salinization in southern Xinjiang and to elucidate its dynamic change processes; (3) To clarify the dominant roles of climatic factors and soil texture in salinity distribution and to quantify their response relationships to the salinization process.

2. Materials and Methods

2.1. Study Area

Southern Xinjiang lies south of the Tianshan Mountains in China’s Xinjiang Uygur Autonomous Region. The terrain slopes from surrounding mountains toward the Tarim Basin, forming a distinct “mountain–oasis–desert” transition zone. The region is extremely arid, with annual precipitation typically below 200 mm and potential evaporation exceeding 2000 mm. Water resources mainly originate from glacial and snowmelt in the Tianshan, Kunlun, and Altun Mountains, feeding the Tarim River and its tributaries that sustain agriculture and ecological stability in the oases [29]. The study focuses on the oasis zones of southern Xinjiang, distributed across piedmont alluvial fans, fluvial plains, and basin margins, where loam- and sand-dominated soils prevail [30]. Intense evaporation and extensive irrigation diversion have led to severe soil salinization in some locations. The extent of the study region and sampling sites is shown in Figure 1.

2.2. Technical Framework

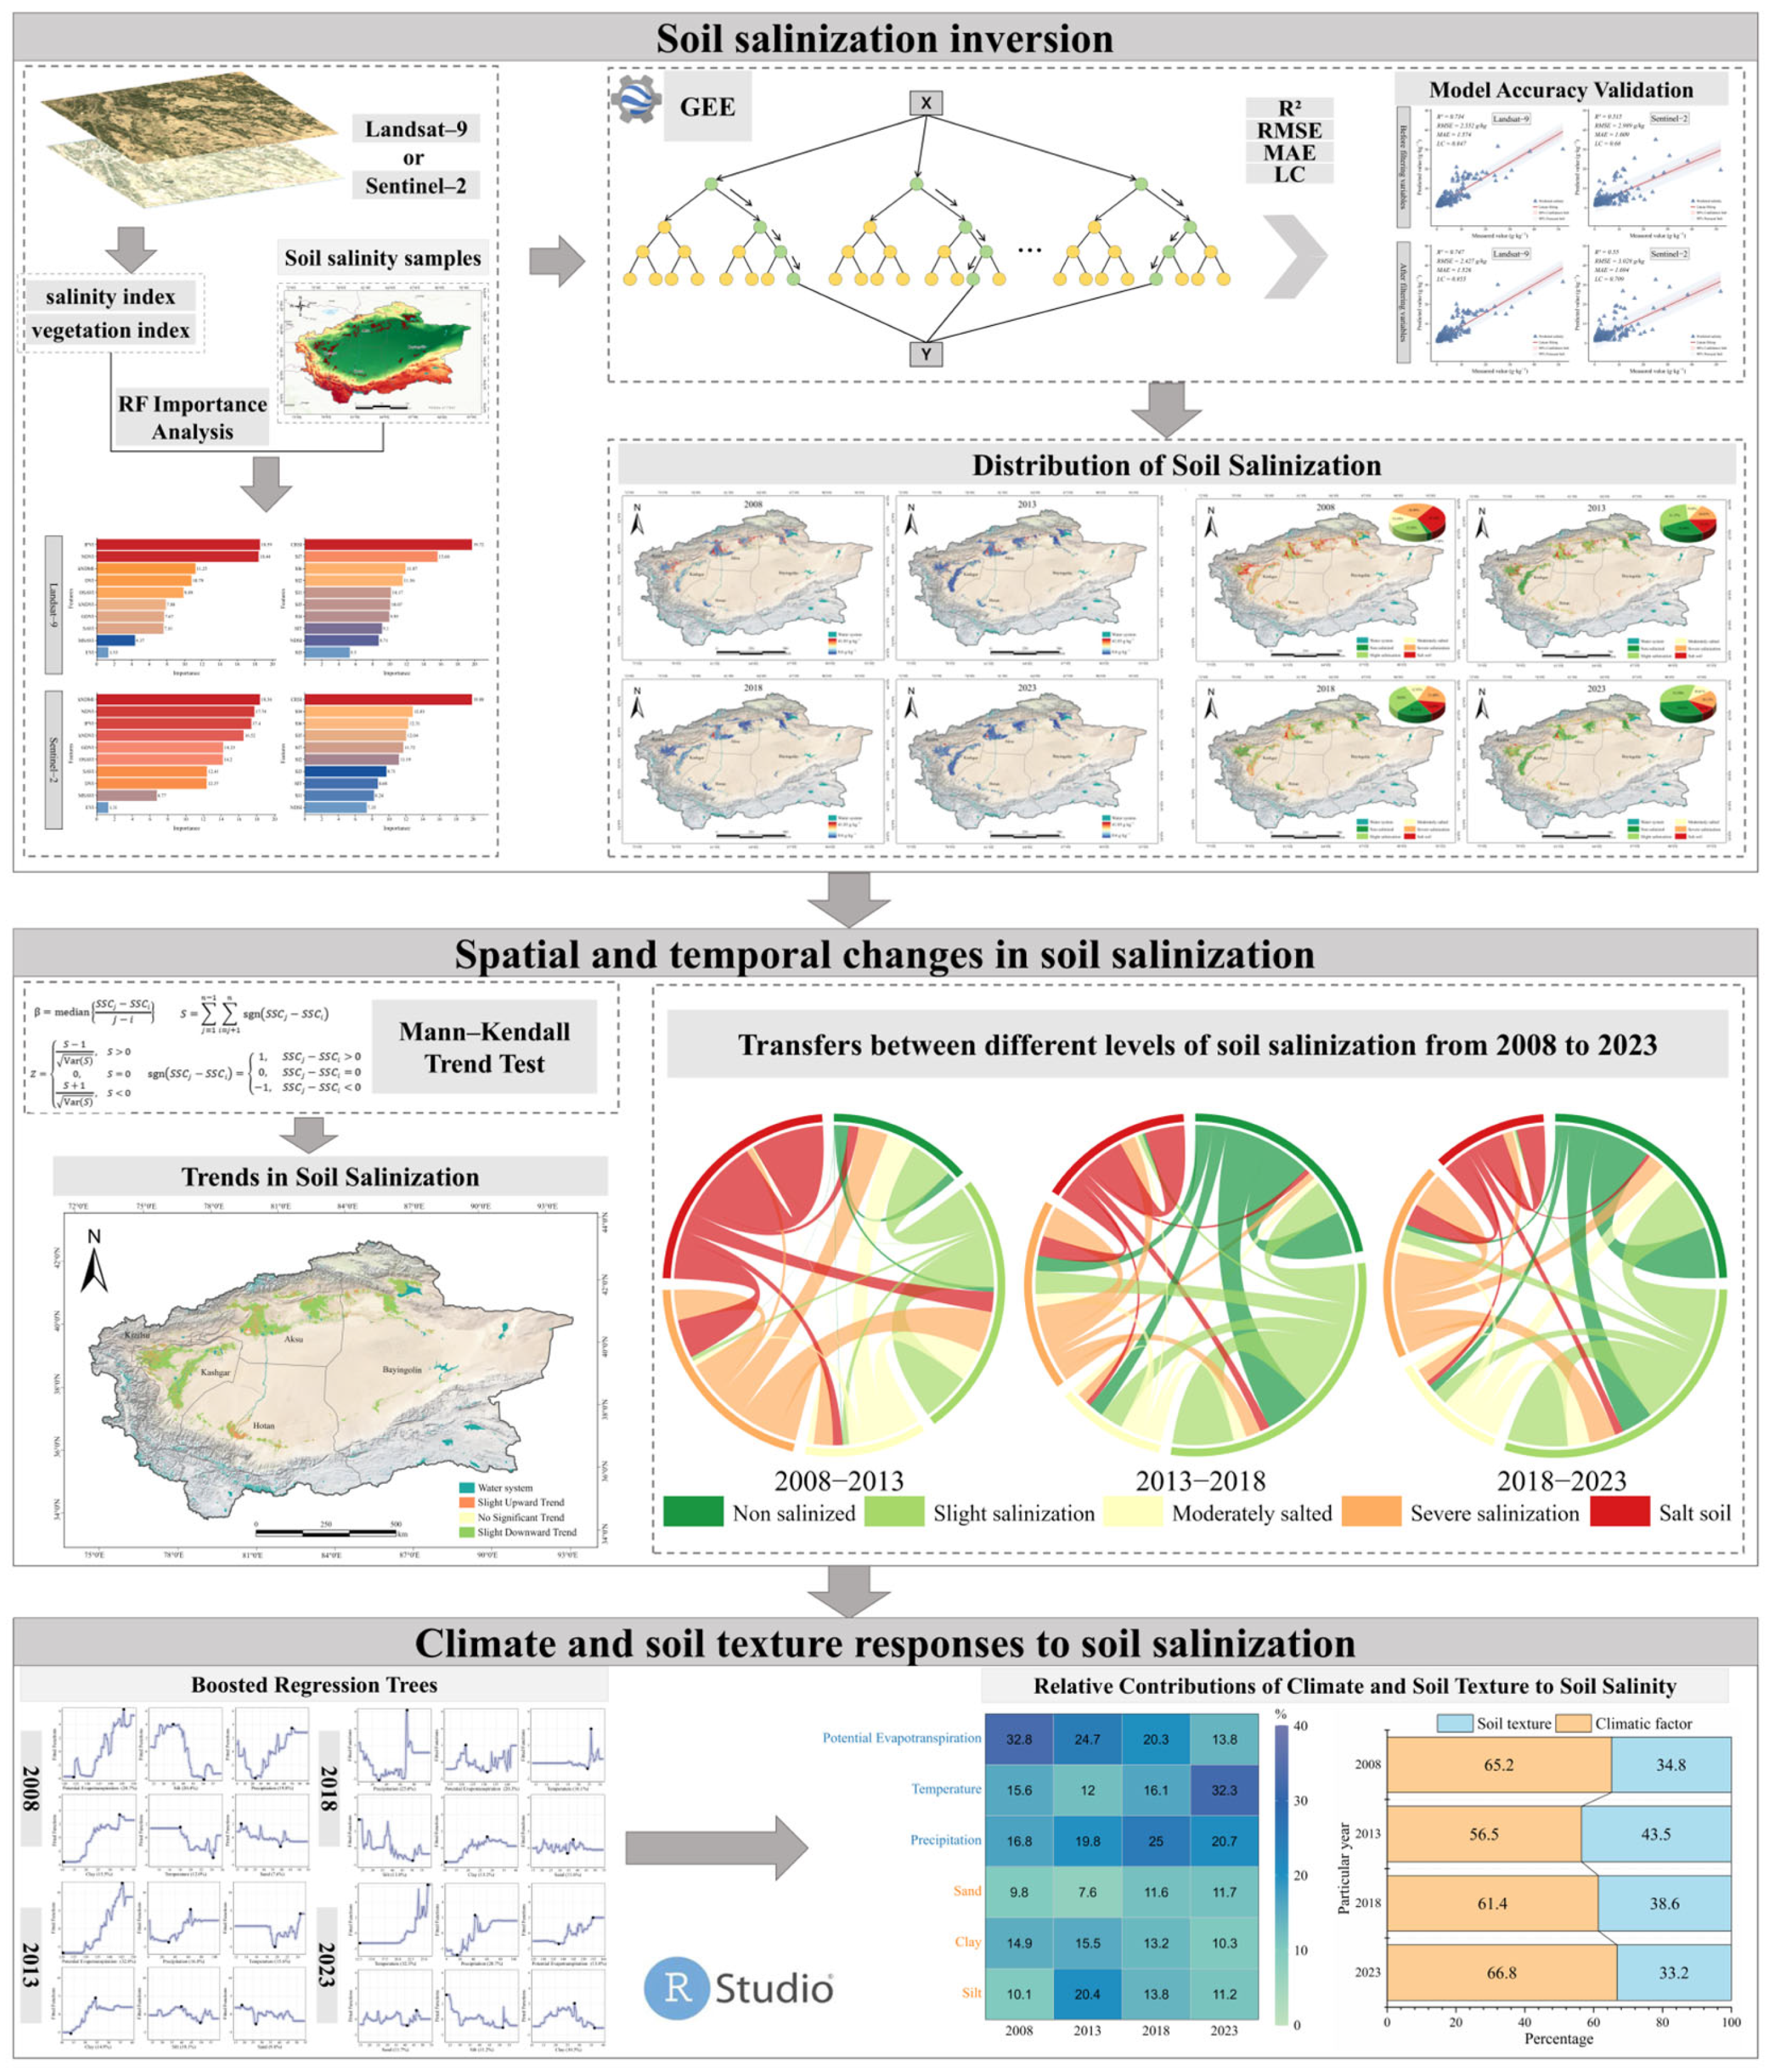
As illustrated in Figure 2, this study established a technical framework integrating field investigations, multi-source remote sensing data, and Random Forest (RF) modeling to analyze the spatiotemporal dynamics of soil salinization in southern Xinjiang. Field sampling data, together with salinity- and vegetation-sensitive spectral indices extracted from Landsat-9 and Sentinel-2 imagery, were used to construct the RF model for evaluating feature importance and comparing the performance between full-variable and feature-selected models. The optimal model was then applied on the Google Earth Engine platform to invert soil salt content (SSC) for 2008, 2013, 2018, and 2023. Subsequently, the Mann–Kendall test was employed to identify long-term salinization trajectories and assess their statistical significance. Finally, the Boosted Regression Tree (BRT) model was utilized to quantify the relative impacts of climatic factors and soil texture, thereby elucidating the driving mechanisms of salinization processes at the regional scale.

2.3. Data Sources and Processing

2.3.1. Field Data

Soil salinity data were collected through field sampling from August to November 2023. Given the vast area and environmental heterogeneity of Xinjiang, sampling was designed to ensure representativeness and spatial balance. The sampling design comprehensively considered soil type, vegetation cover, and land use. A 5 km × 5 km grid was applied to distribute sampling points across the entire study area. Within each grid point, five subsampling sites were arranged in a plum-blossom pattern. Surface soils at 0–30 cm depth were collected and thoroughly mixed to form composite samples. This depth corresponds to the typical plow layer and root zone of crops in Xinjiang, effectively reflecting the impacts of salinization on agriculture and vegetation growth. During sampling, surface impurities were removed, and the soil was homogenized; representative samples were then retained using the quartering method. In total, 1103 soil samples were collected. In the laboratory, soil samples were air-dried to constant weight, ground, and passed through a 2 mm sieve, with the fine fraction preserved for analysis. Soil extracts were prepared at a 1:5 soil-to-water ratio, and soluble salts were determined using the gravimetric residue method [31]. The results were expressed as soil salt content (SSC, g kg−1).

2.3.2. Spectral Index Extraction

This study utilized the Google Earth Engine platform to extract representative spectral indices from Landsat-9 and Sentinel-2 multispectral imagery acquired concurrently with the field sampling period. The imagery comprehensively covered the sampling sites across the study area, with acquisition dates strictly aligned with the 2023 sampling campaign, ensuring spatiotemporal consistency between remote sensing data and field observations. Image preprocessing was performed entirely within GEE, including cloud masking, mosaicking, and clipping to the study extent, with all images selected to match the field sampling period to ensure temporal consistency and improve inversion reliability. Salinity indices, derived from specific band combinations, directly capture the spectral characteristics of surface soil salinity and serve as critical variables for spatial inversion of salinity intensity and distribution. Accordingly, ten commonly used salinity indices (SI1–SI8, NDSI, and SI-T) were selected for modeling. Moreover, soil salinization directly affects vegetation growth, leading to reduced surface greenness and photosynthetic capacity. Therefore, vegetation indices, as indirect indicators of soil salinity, also play a vital role in salinization monitoring. In addition to conventional indices such as NDVI, DVI, EVI, CRSI, GDVI, OSAVI, SAVI, and MSAVI, this study also incorporated kNDVI and kNDMI to expand the dimensionality and sensitivity of vegetation spectral responses. Specifically, kNDVI enhances the characterization of vegetation vigor and canopy greenness by integrating red and near-infrared reflectance, while kNDMI is particularly responsive to vegetation moisture status and stress conditions, enabling a more accurate assessment of vegetation responses under saline environments. The inclusion of these indices provides a more comprehensive representation of vegetation characteristics, thereby improving the robustness of salinity inversion. The formulas and corresponding references for all spectral indices are presented in Table 1.

2.3.3. Climatic and Soil Texture Data

To investigate the driving roles of climatic factors and soil texture in the formation and evolution of soil salinization, this study obtained the relevant data from publicly available high-resolution datasets. The climatic variables included potential evapotranspiration, precipitation, and surface air temperature, derived from the TerraClimate, CHIRPS, and ERA5-Land datasets, respectively. These variables play critical regulatory roles in processes such as water–salt migration, salinity accumulation, and leaching in arid regions, thereby reflecting the response mechanisms of regional hydrothermal conditions to salinization patterns. The climatic background across the study period (August–November) showed stable hydrothermal conditions, with cumulative precipitation ranging from 31 to 38 mm, mean temperature from 22 to 23 °C, and potential evapotranspiration from 129 to 136 mm, indicating limited rainfall and consistently high evaporative demand throughout 2008–2023. Soil texture data were extracted from the SoilGrids dataset, including clay, sand, and silt fractions, which determine water retention capacity, infiltration rate, and capillary transport properties, thereby influencing the pathways and accumulation of salts within soil profiles. To ensure spatial consistency among datasets, all climatic and soil texture variables were resampled to a uniform spatial resolution of 30 m. The sources and spatial resolutions of all variables are summarized in Table 2.

2.4. Random Forest

Random Forest is a supervised modeling technique based on ensemble learning that constructs a large number of independent decision trees and integrates their outputs during prediction to improve generalization performance and noise resistance [53]. For regression tasks, RF predicts continuous variables by averaging the outputs of all decision trees and demonstrates strong performance in handling high-dimensional features, multi-source heterogeneous data, and complex nonlinear relationships [15]. In this study, the RF method was applied to accomplish two main tasks. First, the RF model was used to assess the feature importance of environmental factors, identify dominant variables influencing the spatial variation in soil salinization, and eliminate redundant features to optimize the input dataset. Second, based on the optimal environmental variables, a regression model was constructed to invert and spatially predict surface soil salt content. To enhance model robustness and ensure reliable outcomes, the measured samples were randomly split into training (70%) and validation (30%) sets for fitting and performance assessment.

2.5. Mann–Kendall Trend Test

To identify the temporal evolution trends of SSC in typical arid regions and their statistical significance, this study employed the non-parametric Mann–Kendall (M–K) test in combination with the Theil–Sen median method to estimate trend rates. This combined approach is suitable for long-term series with non-normal distributions, small sample sizes, or outliers, offering strong robustness and high resistance to interference [54,55]. Sen’s trend analysis calculates the slope between any two time points and takes the median of all slopes as the overall trend (β). This value quantitatively reflects both the direction and magnitude of the trend. The calculation formula is expressed as follows:
Here, SSC j and SSC i denote the soil salt content in 2008 and 2023, respectively.
β = m e d i a n SSC j SSC i j i
The M–K test statistic is constructed based on the rank differences in all observations, and the statistic S is defined as follows:
S = j = 1 n 1 i = j + 1 n sgn SSC j SSC i
where the sign function sgn(x) is defined as:
s g n ( SSC j SSC i ) = 1 , SSC j SSC i > 0 0 , SSC j SSC i = 0 1 , SSC j SSC i < 0
The standardized statistic Z and its variance are calculated as follows:
Z = S 1 V a r S , S > 0 0 , S = 0 S + 1 V a r S , S < 0
V a r ( S ) = n ( n 1 ) ( 2 n + 5 ) 18
Based on the Z value and the significance level (α = 0.05), the significance of soil salinity trends can be determined. A positive Z denotes an increasing trend, a negative Z a decreasing trend, and a value of zero indicates no significant variation. As this method does not rely on any specific data distribution and is highly robust to missing and outlier values, it has been widely applied in time-series analyses of remote sensing and ecological environments.

2.6. Boosted Regression Trees

Boosted Regression Trees (BRT) are an ensemble modeling approach that integrates Classification and Regression Trees (CART) with boosting algorithms [56]. The algorithm sequentially builds multiple weak regression trees, with each iteration fitting the residuals of the previous model, thereby progressively enhancing overall predictive accuracy and stability [57]. During model construction, BRT dynamically evaluates the importance of explanatory variables, making it suitable for identifying dominant factors influencing the response variable. Compared with traditional regression methods, BRT demonstrates superior ability to capture nonlinear relationships, characterize complex interactions among variables, and enhance model generalization while mitigating overfitting risks. In this study, the BRT model was employed to establish the response relationships between soil salt content, climatic factors, and soil texture properties, and to further quantify the relative contributions of each environmental factor. Model construction was implemented in R using the “dismo” and “gbm” packages, with parameter ranges including a learning rate of 0.001–0.1 and tree complexity of 1–10. The final model parameters were set as follows: learning rate = 0.01, bag fraction = 0.5, and tree complexity = 5. The model exhibited strong performance in both predictive accuracy and explanatory capacity.

2.7. Model Accuracy Assessment

To rigorously assess the predictive performance of the soil salinity inversion model, four statistical indicators were applied: the coefficient of determination (R2), root mean square error (RMSE), mean absolute error (MAE), and Lin’s concordance correlation coefficient (LC) [58,59]. R2 quantifies the proportion of variance in observed values explained by the model, with values approaching 1 indicating a stronger fit. RMSE, calculated as the square root of the mean squared error, is highly sensitive to large deviations. MAE measures the average absolute difference between predictions and observations, offering an intuitive representation of error magnitude. Together, these three metrics capture complementary aspects of predictive accuracy, while LC provides a joint evaluation of accuracy and precision. Their mathematical formulations are as follows:
R 2 = 1 i y ^ i y i 2 i y ¯ i y i 2
R M S E = 1 n i = 1 n y i y ^ i 2
M A E = 1 n i = 1 n y i y ^ i
L C = 2 × r × s Y model × s Y testing s Y model 2 + s Y testing 2 + Y ¯ model Y ¯ testing 2
In the formulas, y i denotes the observed soil salt content, y ^ i represents the predicted soil salt content, and y indicates the mean of the observed soil salt content. n refers to the number of samples. r denotes the Pearson correlation between predicted and observed values; s Y model 2 and s Y testing 2 are their respective standard deviations, respectively; Y ¯ model and Y ¯ testing correspond to their means.

3. Results

3.1. Descriptive Statistics of Soil Salinity

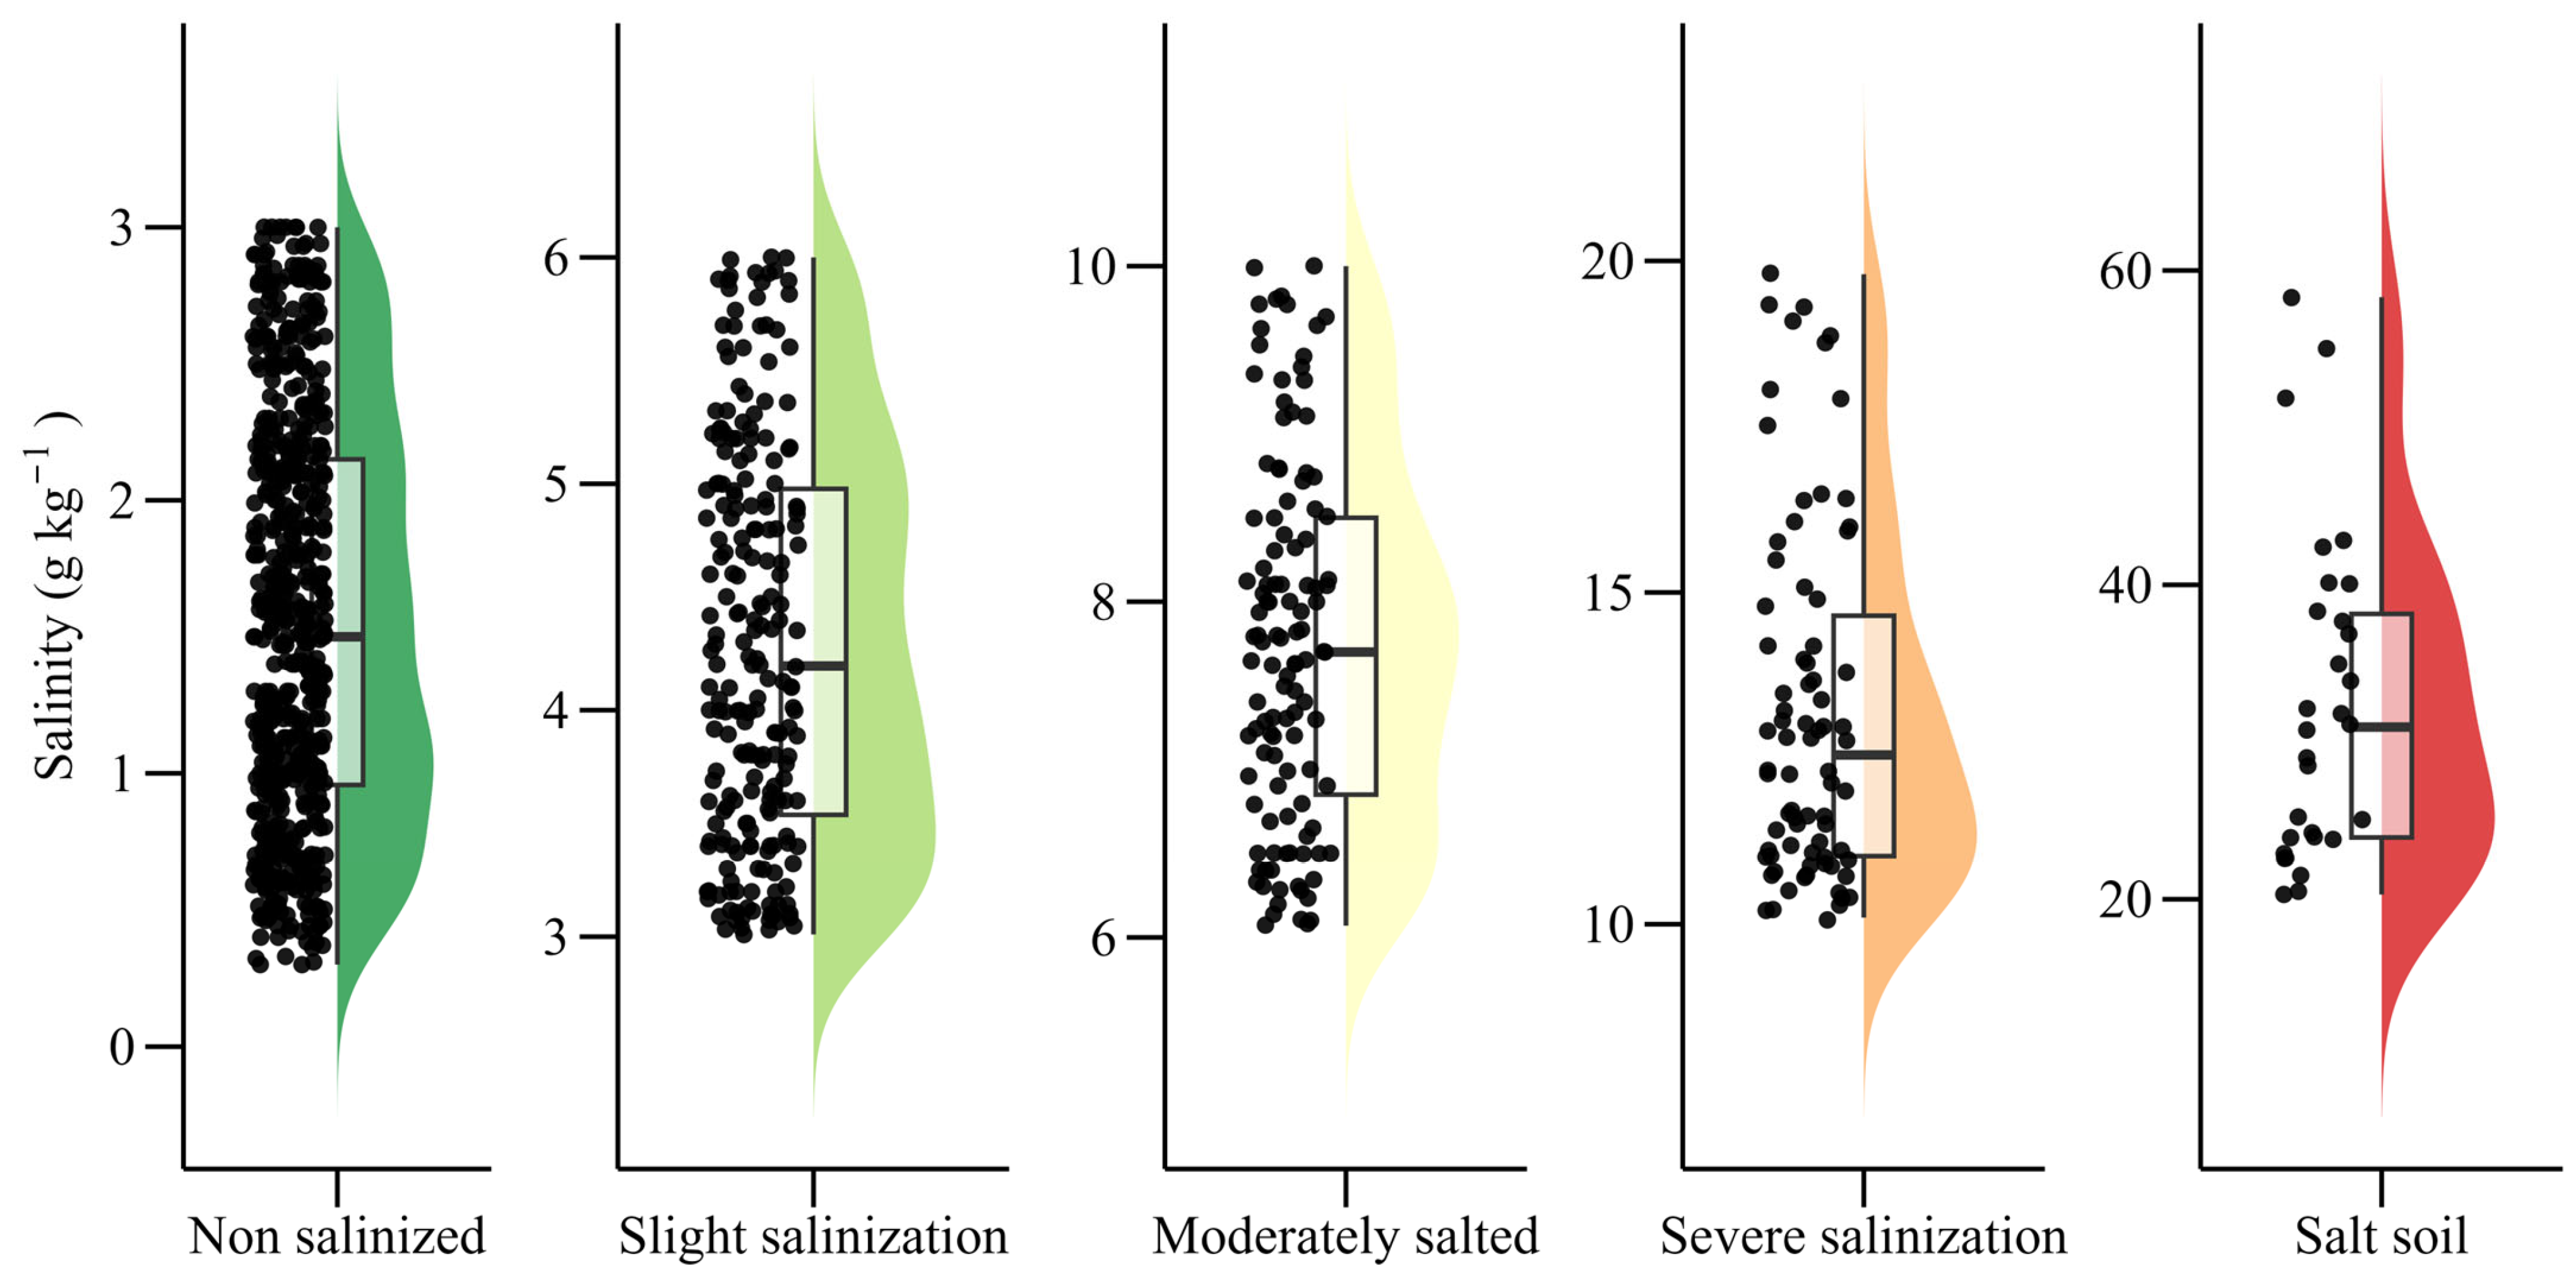
To characterize the spatial distribution and variability of soil salinity in 2023, salinization levels were classified according to the Xinjiang Agricultural Technical Manual [60] (Table 3), and descriptive statistics were performed for each class (Table 4; Figure 3). In non-salinized soils, SSC ranged from 0.30 to 3.00 g·kg−1 with a mean of 1.55 g·kg−1, and the high coefficient of variation (CV) of 47.61% indicated substantial spatial heterogeneity despite low overall salinity. Mildly salinized soils had a mean of 4.29 g·kg−1 with a standard deviation of 0.87 g·kg−1, and the CV dropped to 20.34%, reflecting more stable conditions. Moderate salinization showed SSC values between 6.07 and 10.00 g·kg−1, averaging 7.75 g·kg−1 with a CV of 14.03%, suggesting a more concentrated distribution. In severely salinized soils, the mean rose to 13.21 g·kg−1, with values up to 19.80 g·kg−1, and variability increased, indicating marked salt accumulation and strong ecological stress. Salt-affected soils displayed the highest salinity, ranging from 20.30 to 58.30 g·kg−1, with a mean of 32.41 g·kg−1, a standard deviation of 10.32 g·kg−1, and a CV of 31.85%, representing typical features of both high salt content and strong variability, and constituting a major risk type of soil degradation in the region.
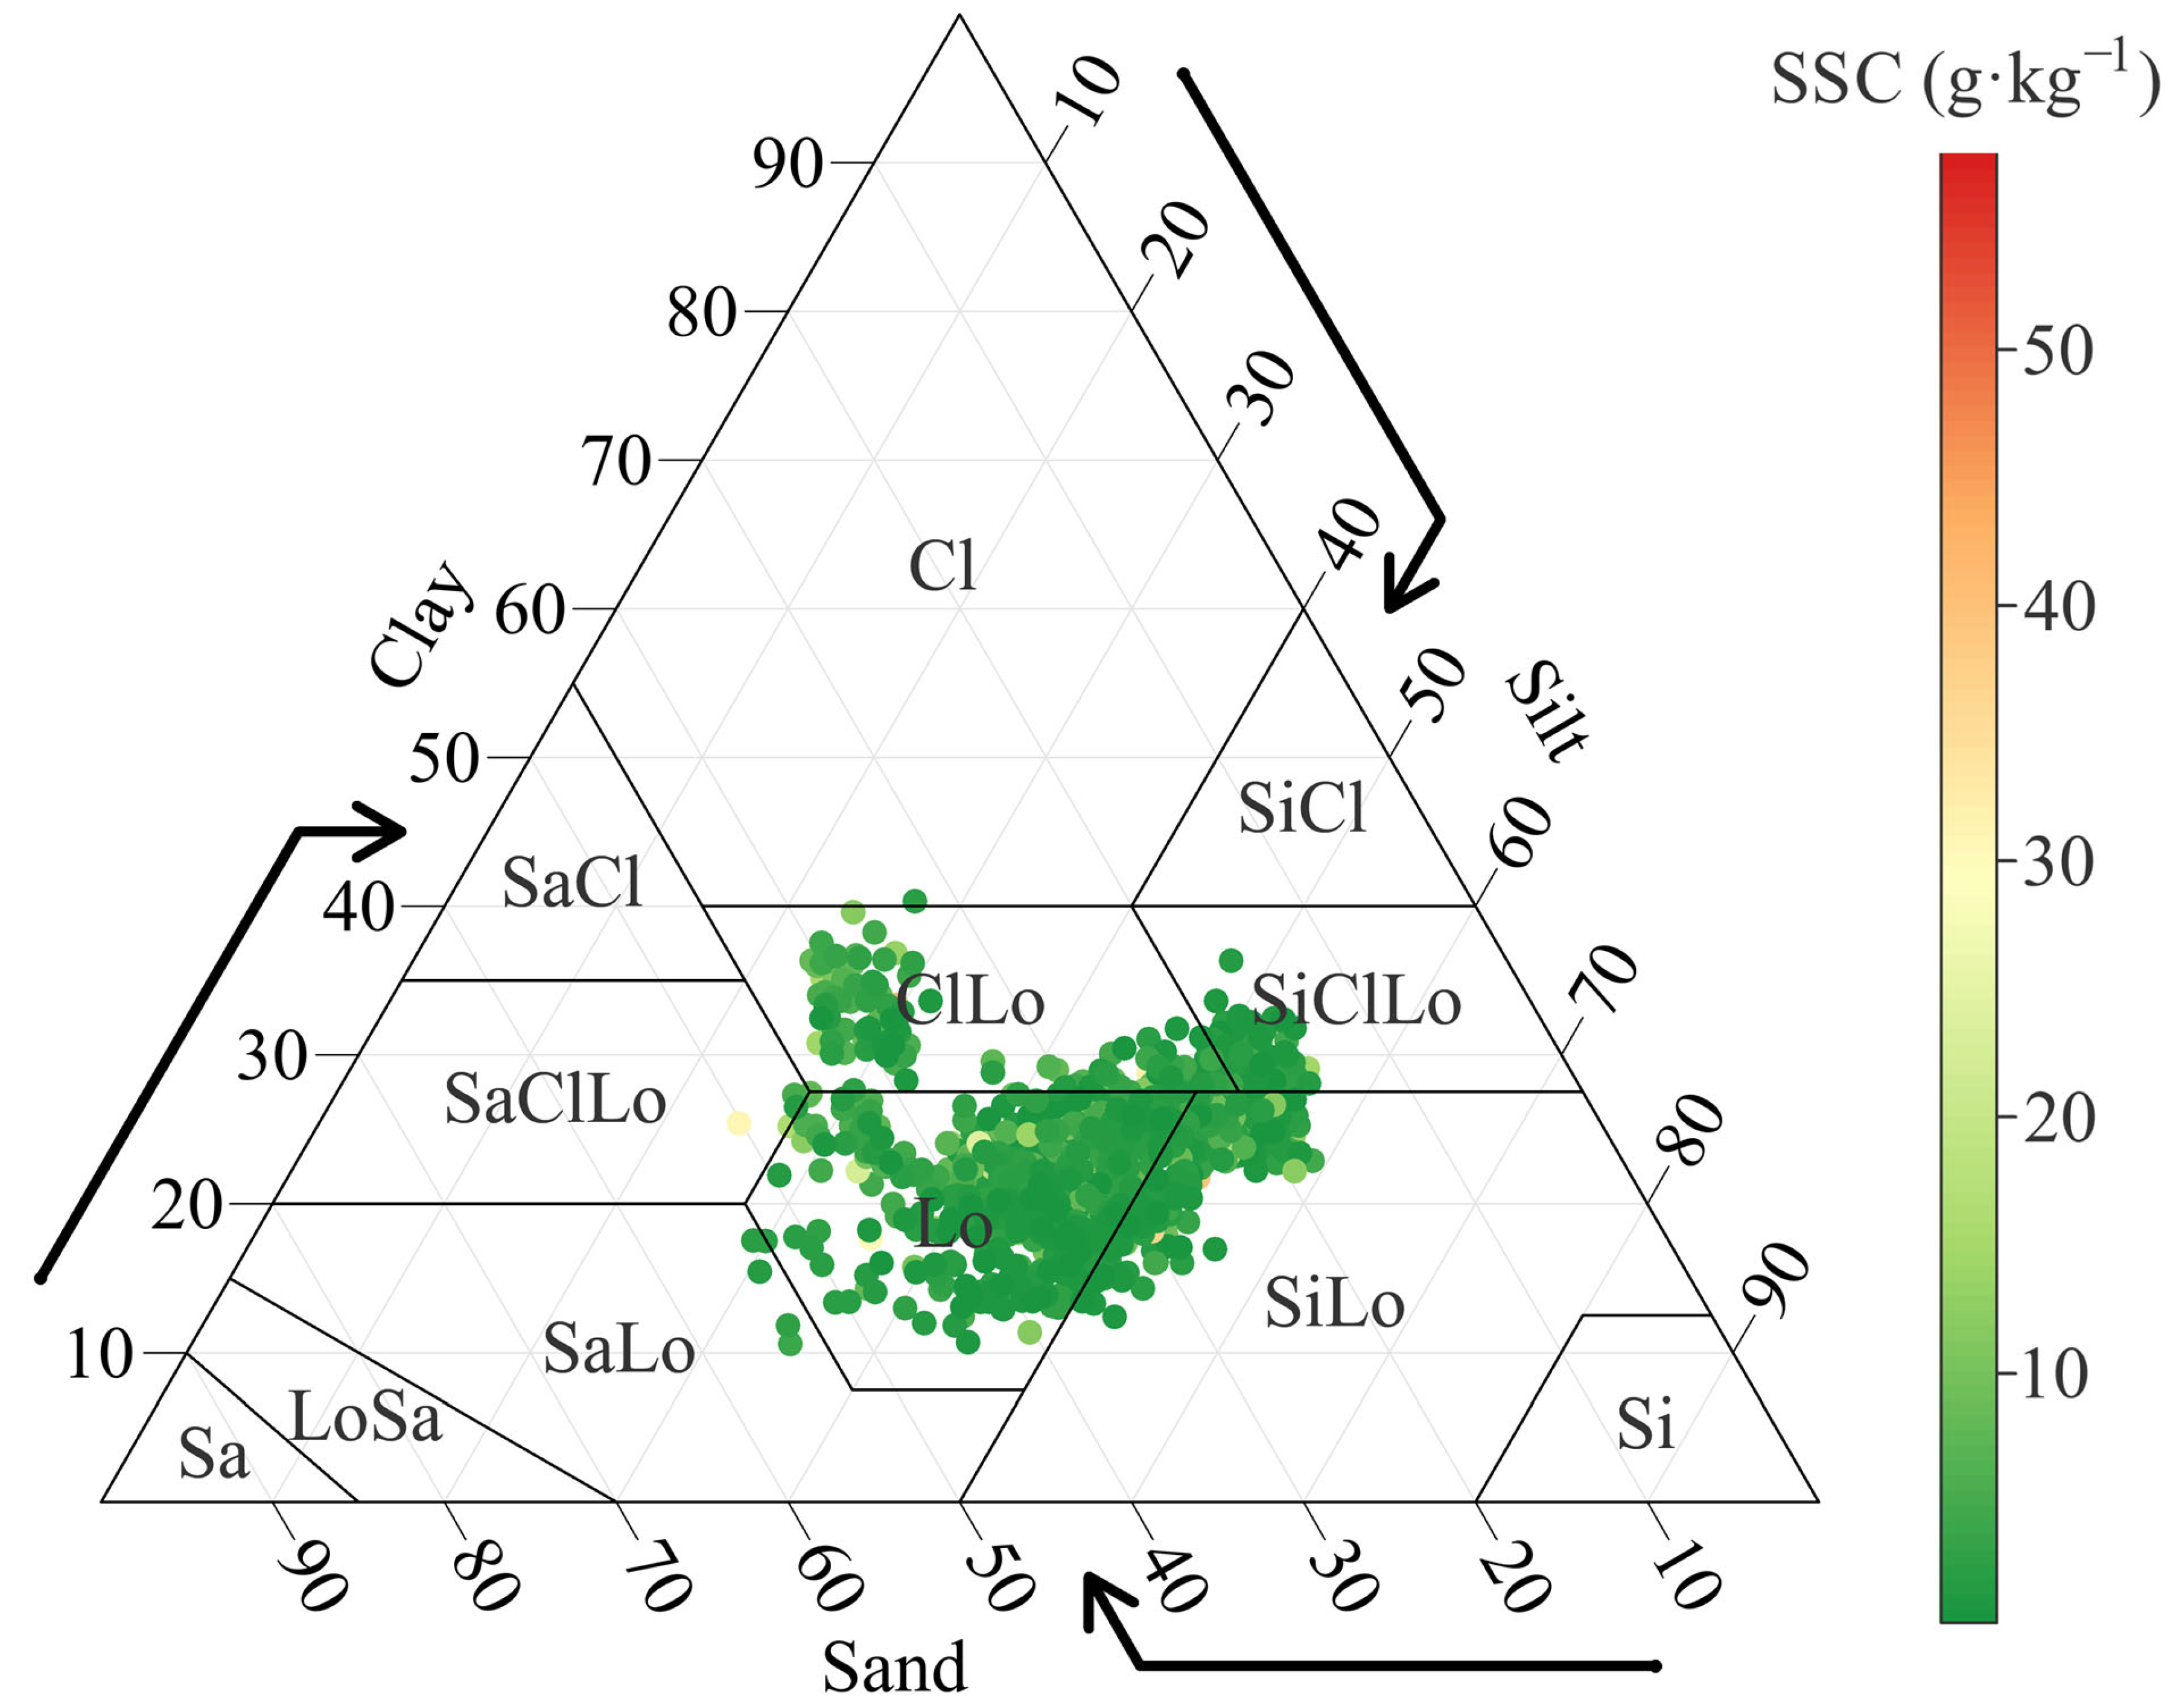
The sampling points in this study were primarily concentrated in the loam (Lo)–silt loam (SiLo)–silty clay loam (SiCLo) region of the USDA soil texture triangle (Figure 4). This distribution exhibited a transitional pattern from medium sand fractions toward higher silt and clay contents. Sampling points with extreme textures—pure sand (Sa), silt (Si), and clay (Cl)—were relatively scarce, indicating that the study area is dominated by medium-textured soils with relatively limited diversity. At the same time, SSC still exhibited considerable variability within the same texture class, suggesting that soil texture is not the sole controlling factor of salinity; climatic conditions, hydrological processes, topography, and cultivation practices may also interact to shape soil salinity patterns. The soil texture data were obtained from the SoilGrids dataset, which provides globally harmonized estimates of clay, silt, and sand fractions and is widely used in regional-scale studies.

3.2. Soil Salinization Inversion Based on Landsat-9 and Sentinel-2 Data

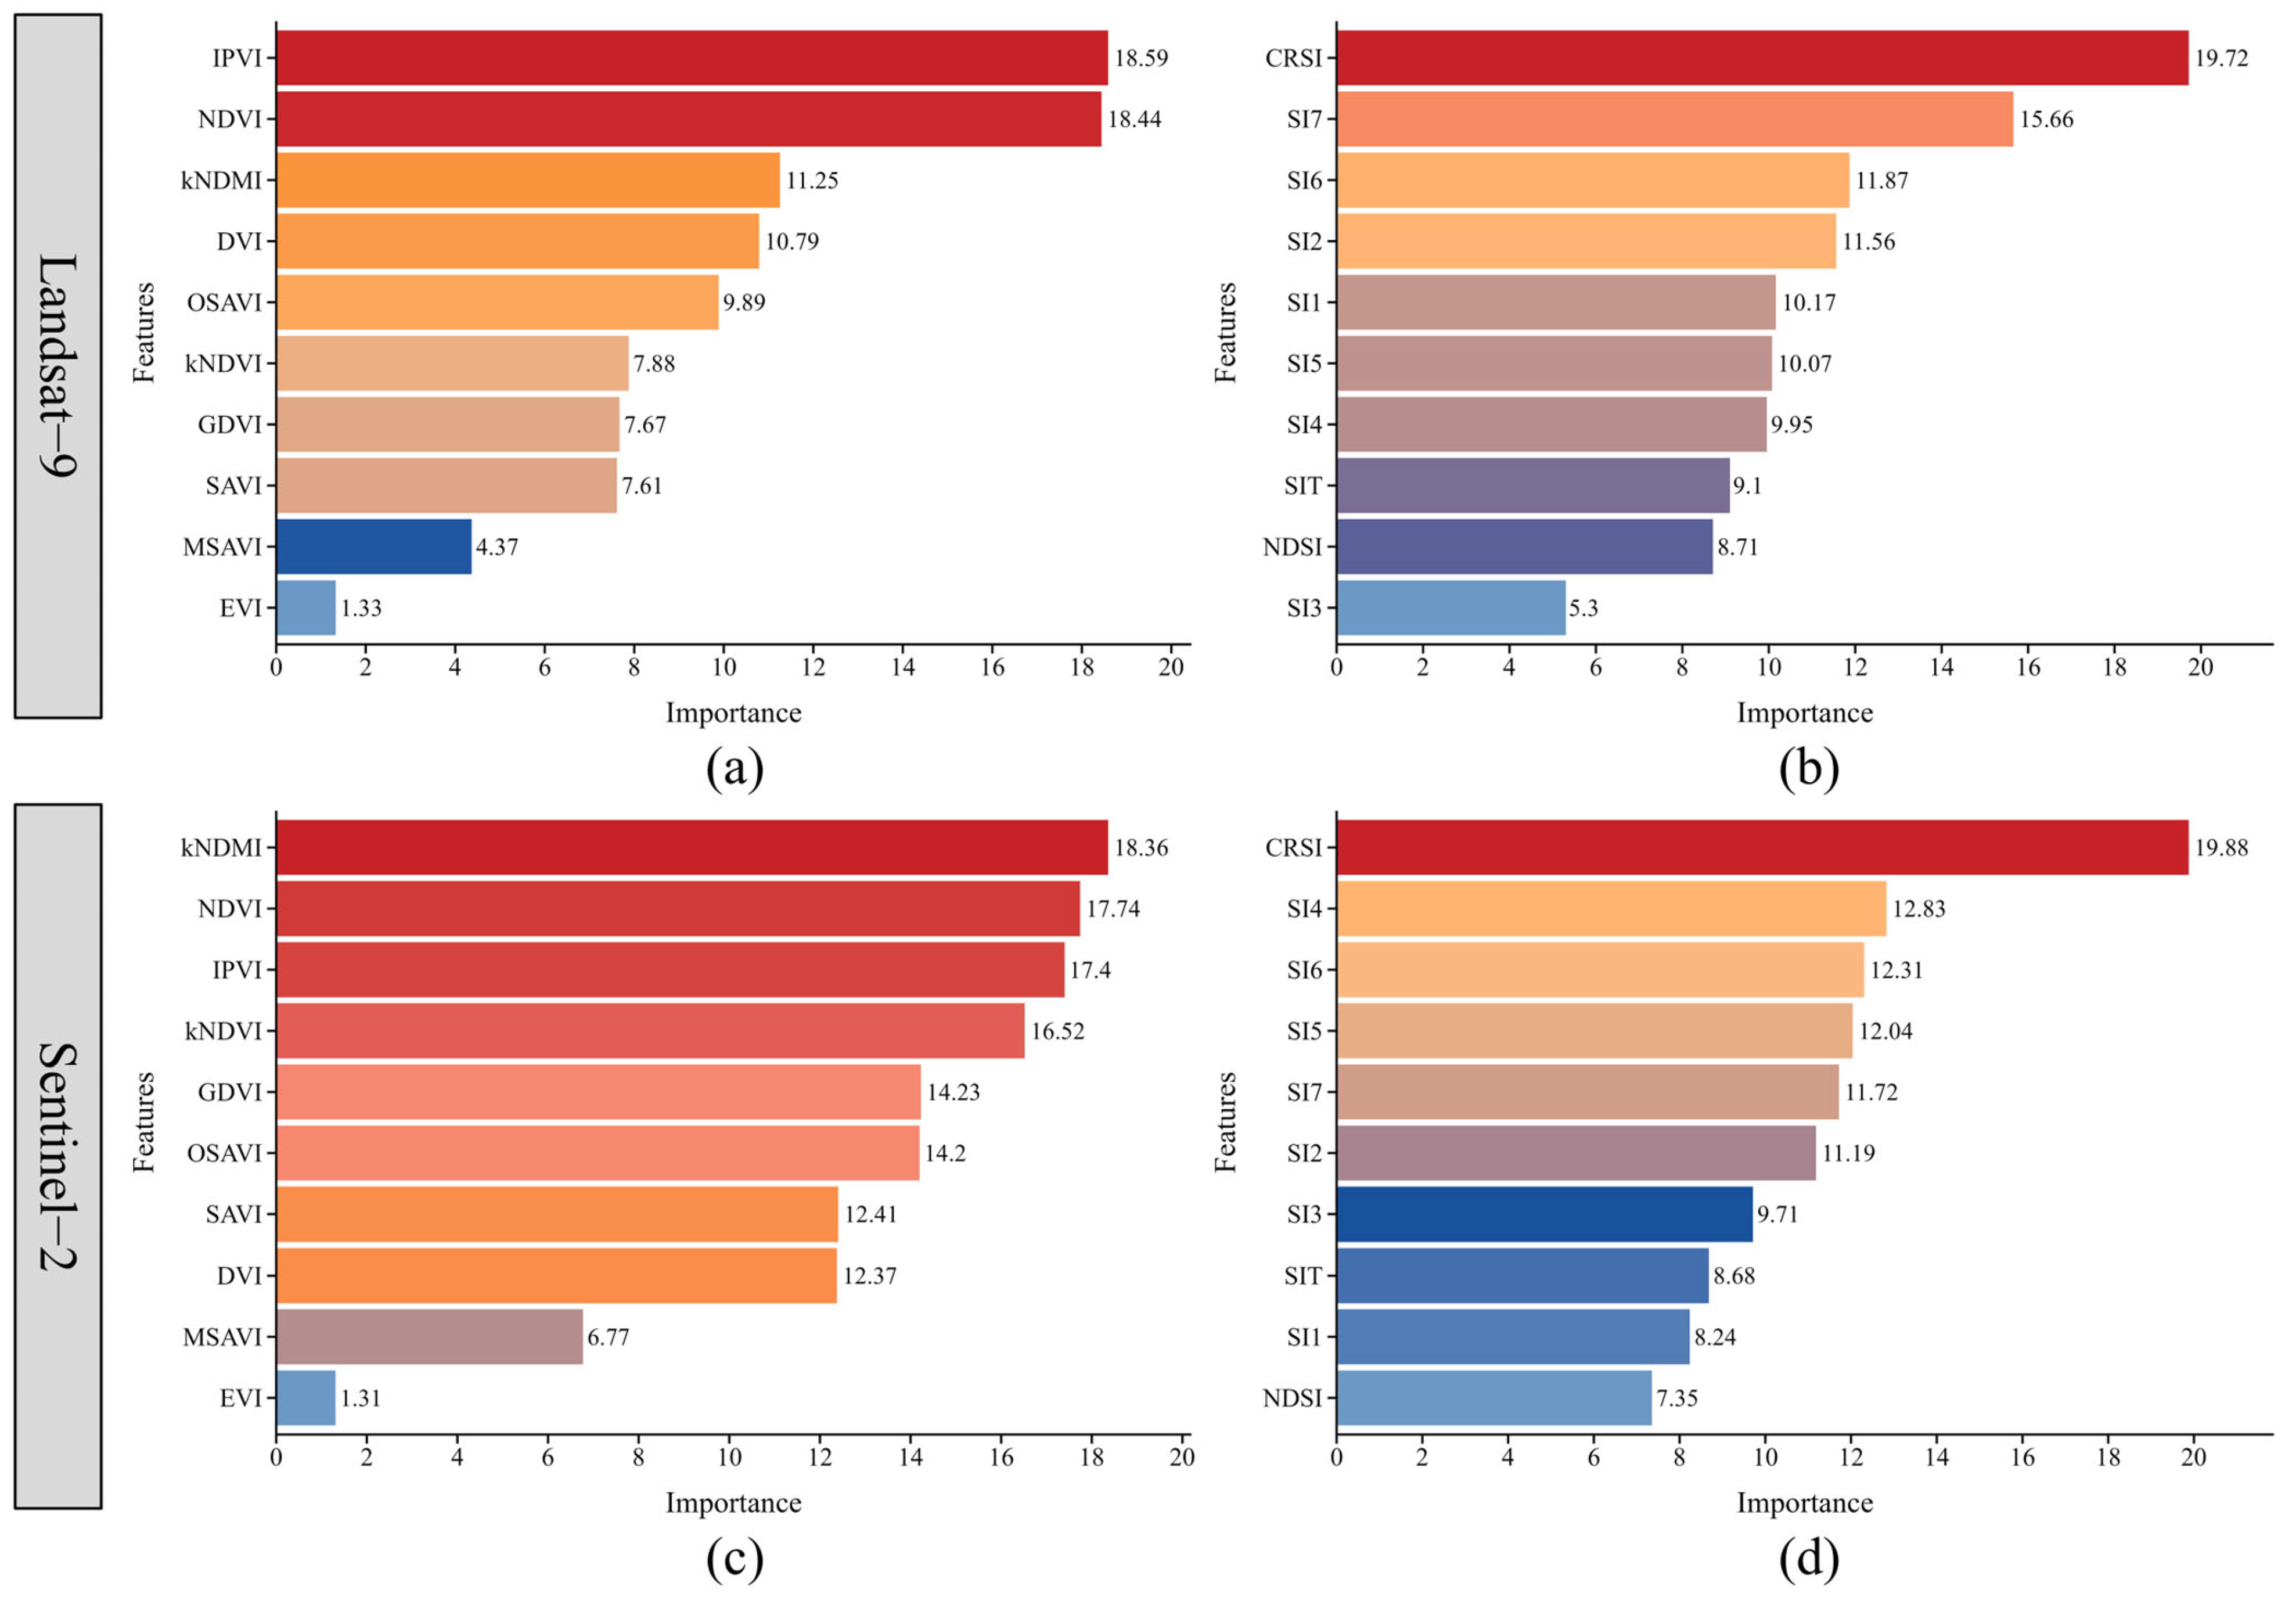
To enhance the accuracy and generalizability of soil salinization inversion in typical arid regions, this study constructed Random Forest (RF) regression models to estimate soil salt content (SSC) based on spectral indices calculated from multispectral imagery of both Landsat-9 and Sentinel-2. According to the feature importance analysis of the RF model, the top five vegetation indices and the top five salinity indices with the highest contributions to SSC prediction were selected from all indices derived from the two satellites to form an optimized feature subset. For Landsat-9, IPVI, NDVI, kNDMI, DVI, and OSAVI exhibited the highest importance among vegetation indices, while CRSI, SI7, SI6, SI2, and SI1 made the greatest contributions among salinity indices. In contrast, Sentinel-2 showed a different ranking pattern, with kNDMI, NDVI, IPVI, kNDVI, and GDVI being the most influential vegetation indices, and CRSI, SI4, SI6, SI5, and SI2 ranking highest among salinity indices. Subsequently, comparative modeling experiments were conducted using both the full-variable set and the feature-selected subset to systematically evaluate the effects of variable selection and different remote sensing datasets on model performance. The feature importance rankings derived from the RF models are illustrated in Figure 5.
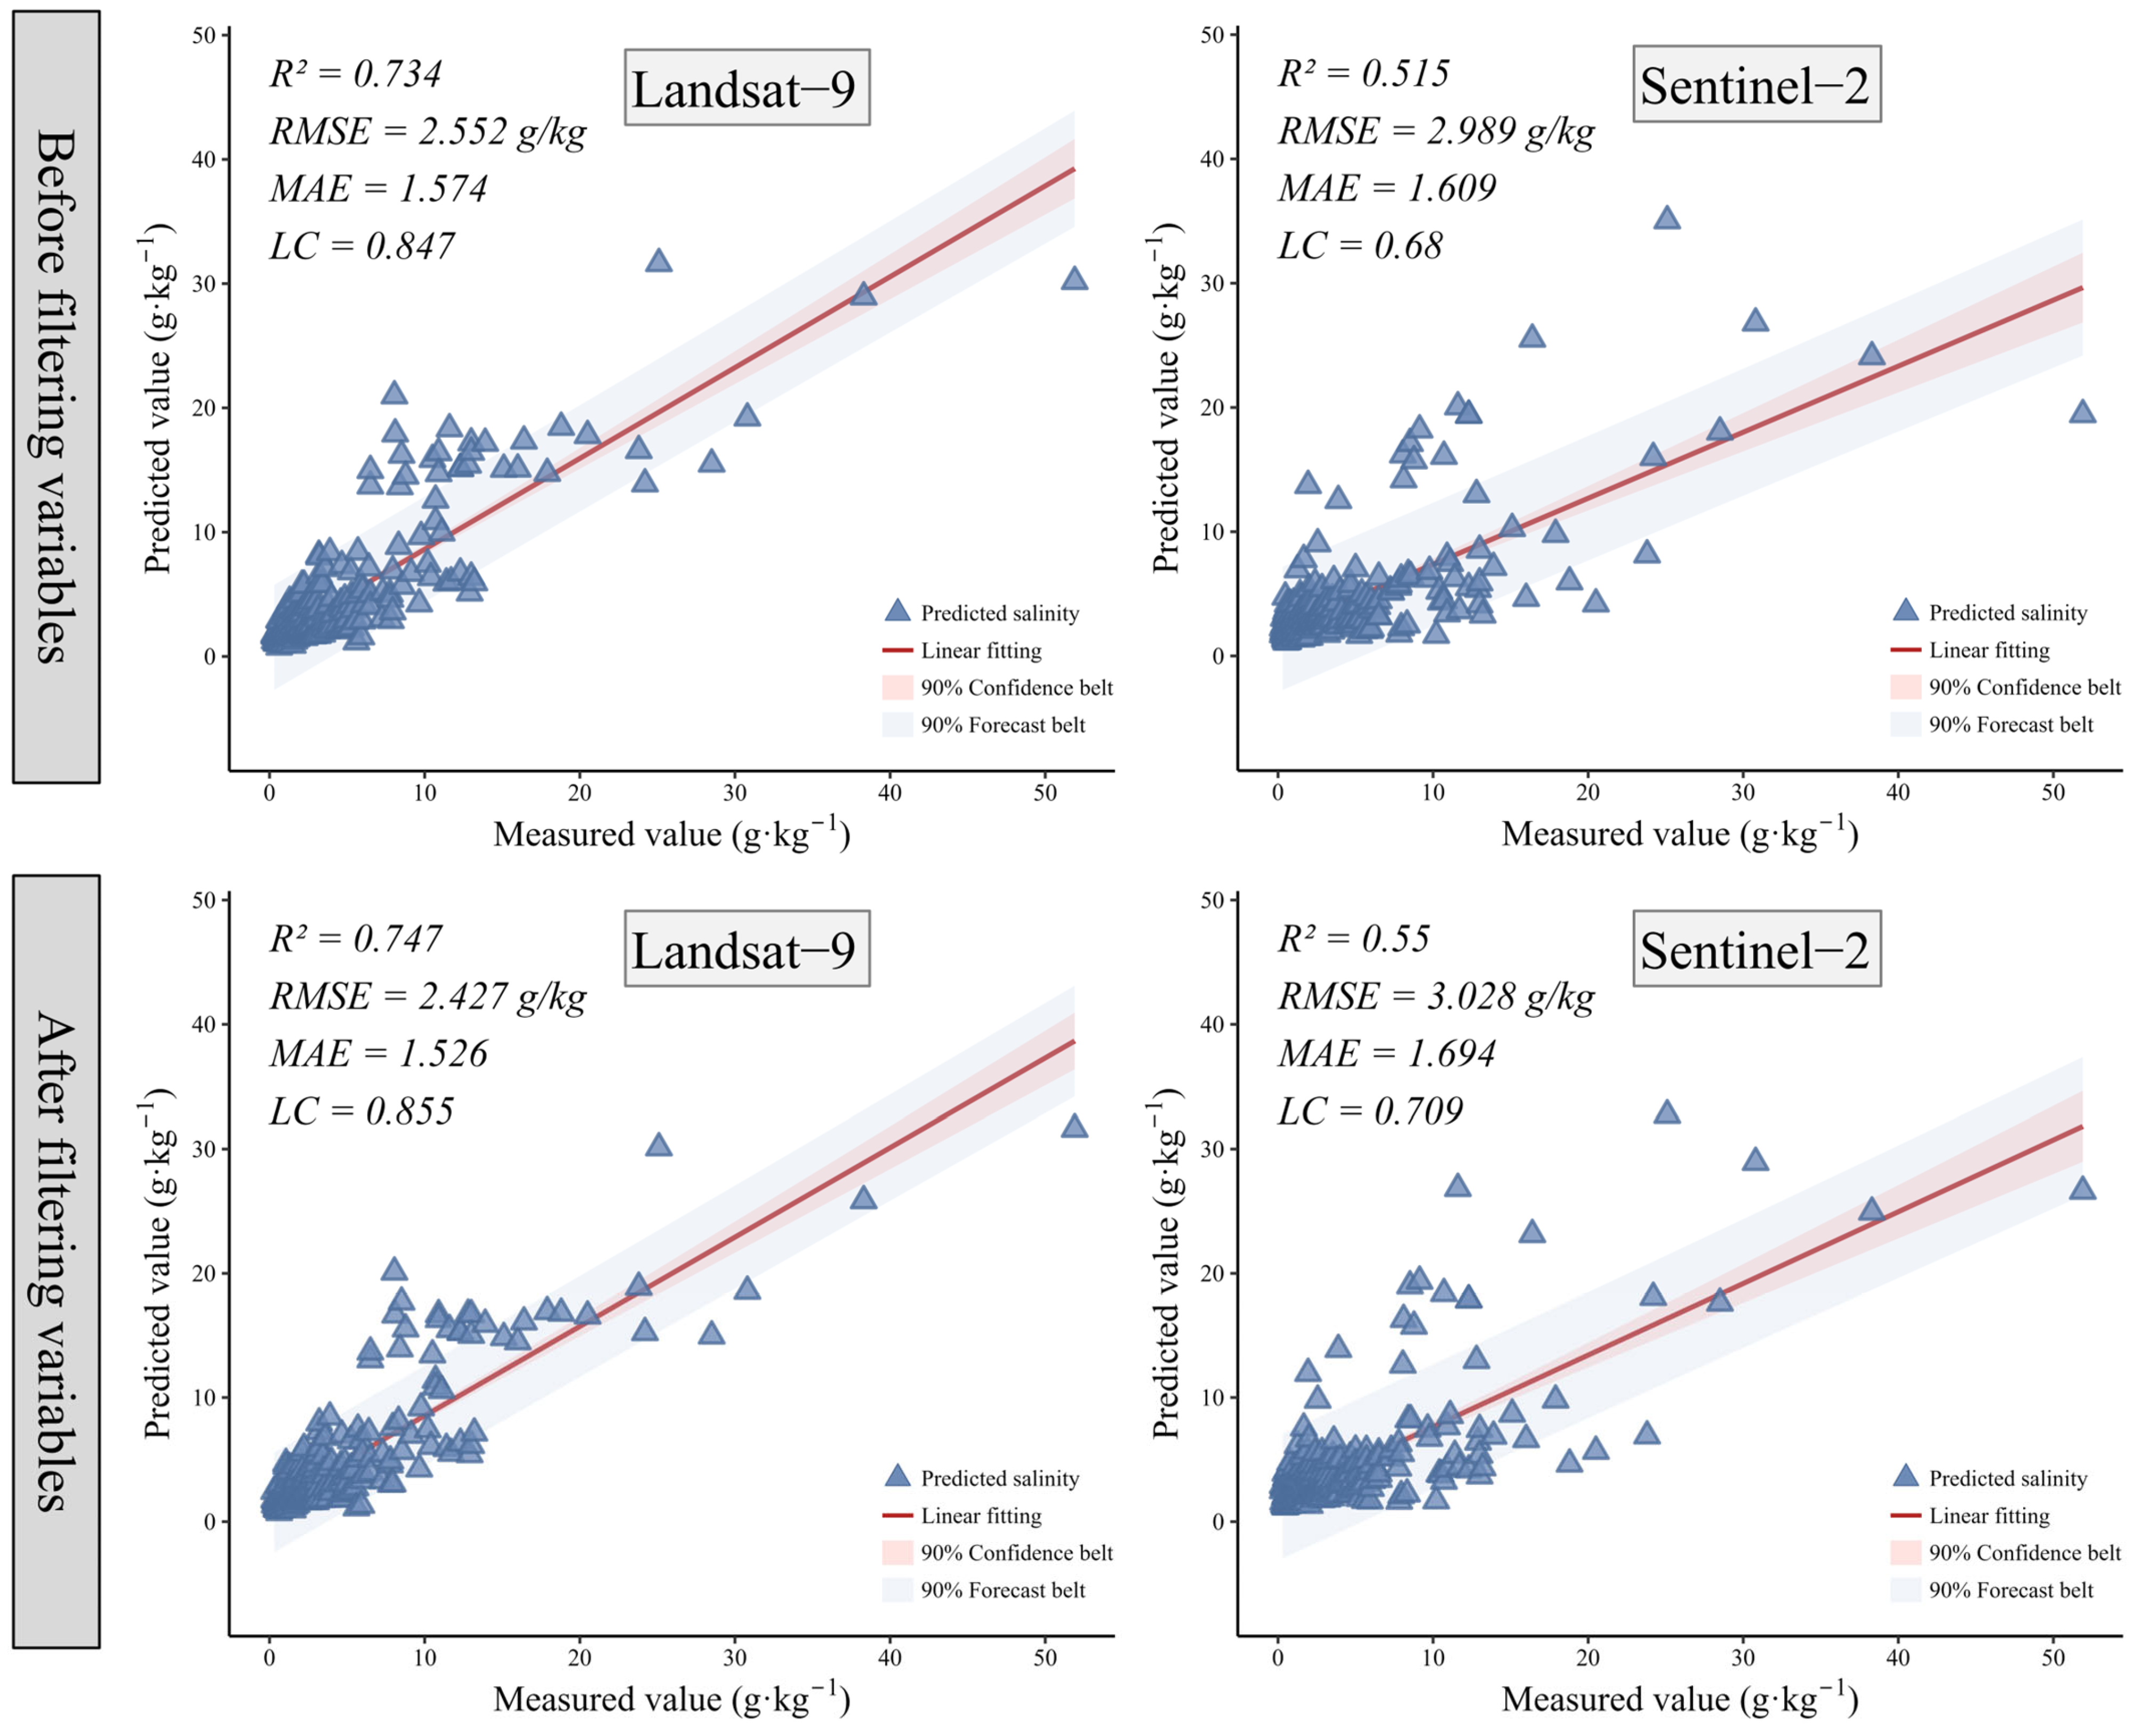
Under the full-variable input condition, the Landsat-9 model achieved higher fitting accuracy and consistency (R2 = 0.734, RMSE = 2.552 g·kg−1, LC = 0.847) than Sentinel-2 (R2 = 0.515, RMSE = 2.989 g·kg−1, LC = 0.680). After feature selection, the overall model performance improved, confirming the potential disruptive effect of redundant variables on model stability. With the optimized variable set, the R2 of the Landsat-9 model increased to 0.747 and the LC rose to 0.855, indicating stronger fitting capability and trend consistency. The Sentinel-2 model also improved, with R2 increasing to 0.550 and LC rising to 0.709. Although the RMSE changed only marginally, the overall fitting trend became more consistent (see Figure 6). Overall, the Landsat-9 model demonstrated higher predictive accuracy than Sentinel-2, particularly showing greater sensitivity in high-salinity areas. Feature selection not only enhanced model accuracy and stability but also improved structural parsimony and interpretability. These findings highlight the importance of selecting appropriate feature variables and sensor-specific strategies to improve the accuracy and reliability of soil salinization inversion in arid regions.

3.3. Spatiotemporal Dynamics of Soil Salinization

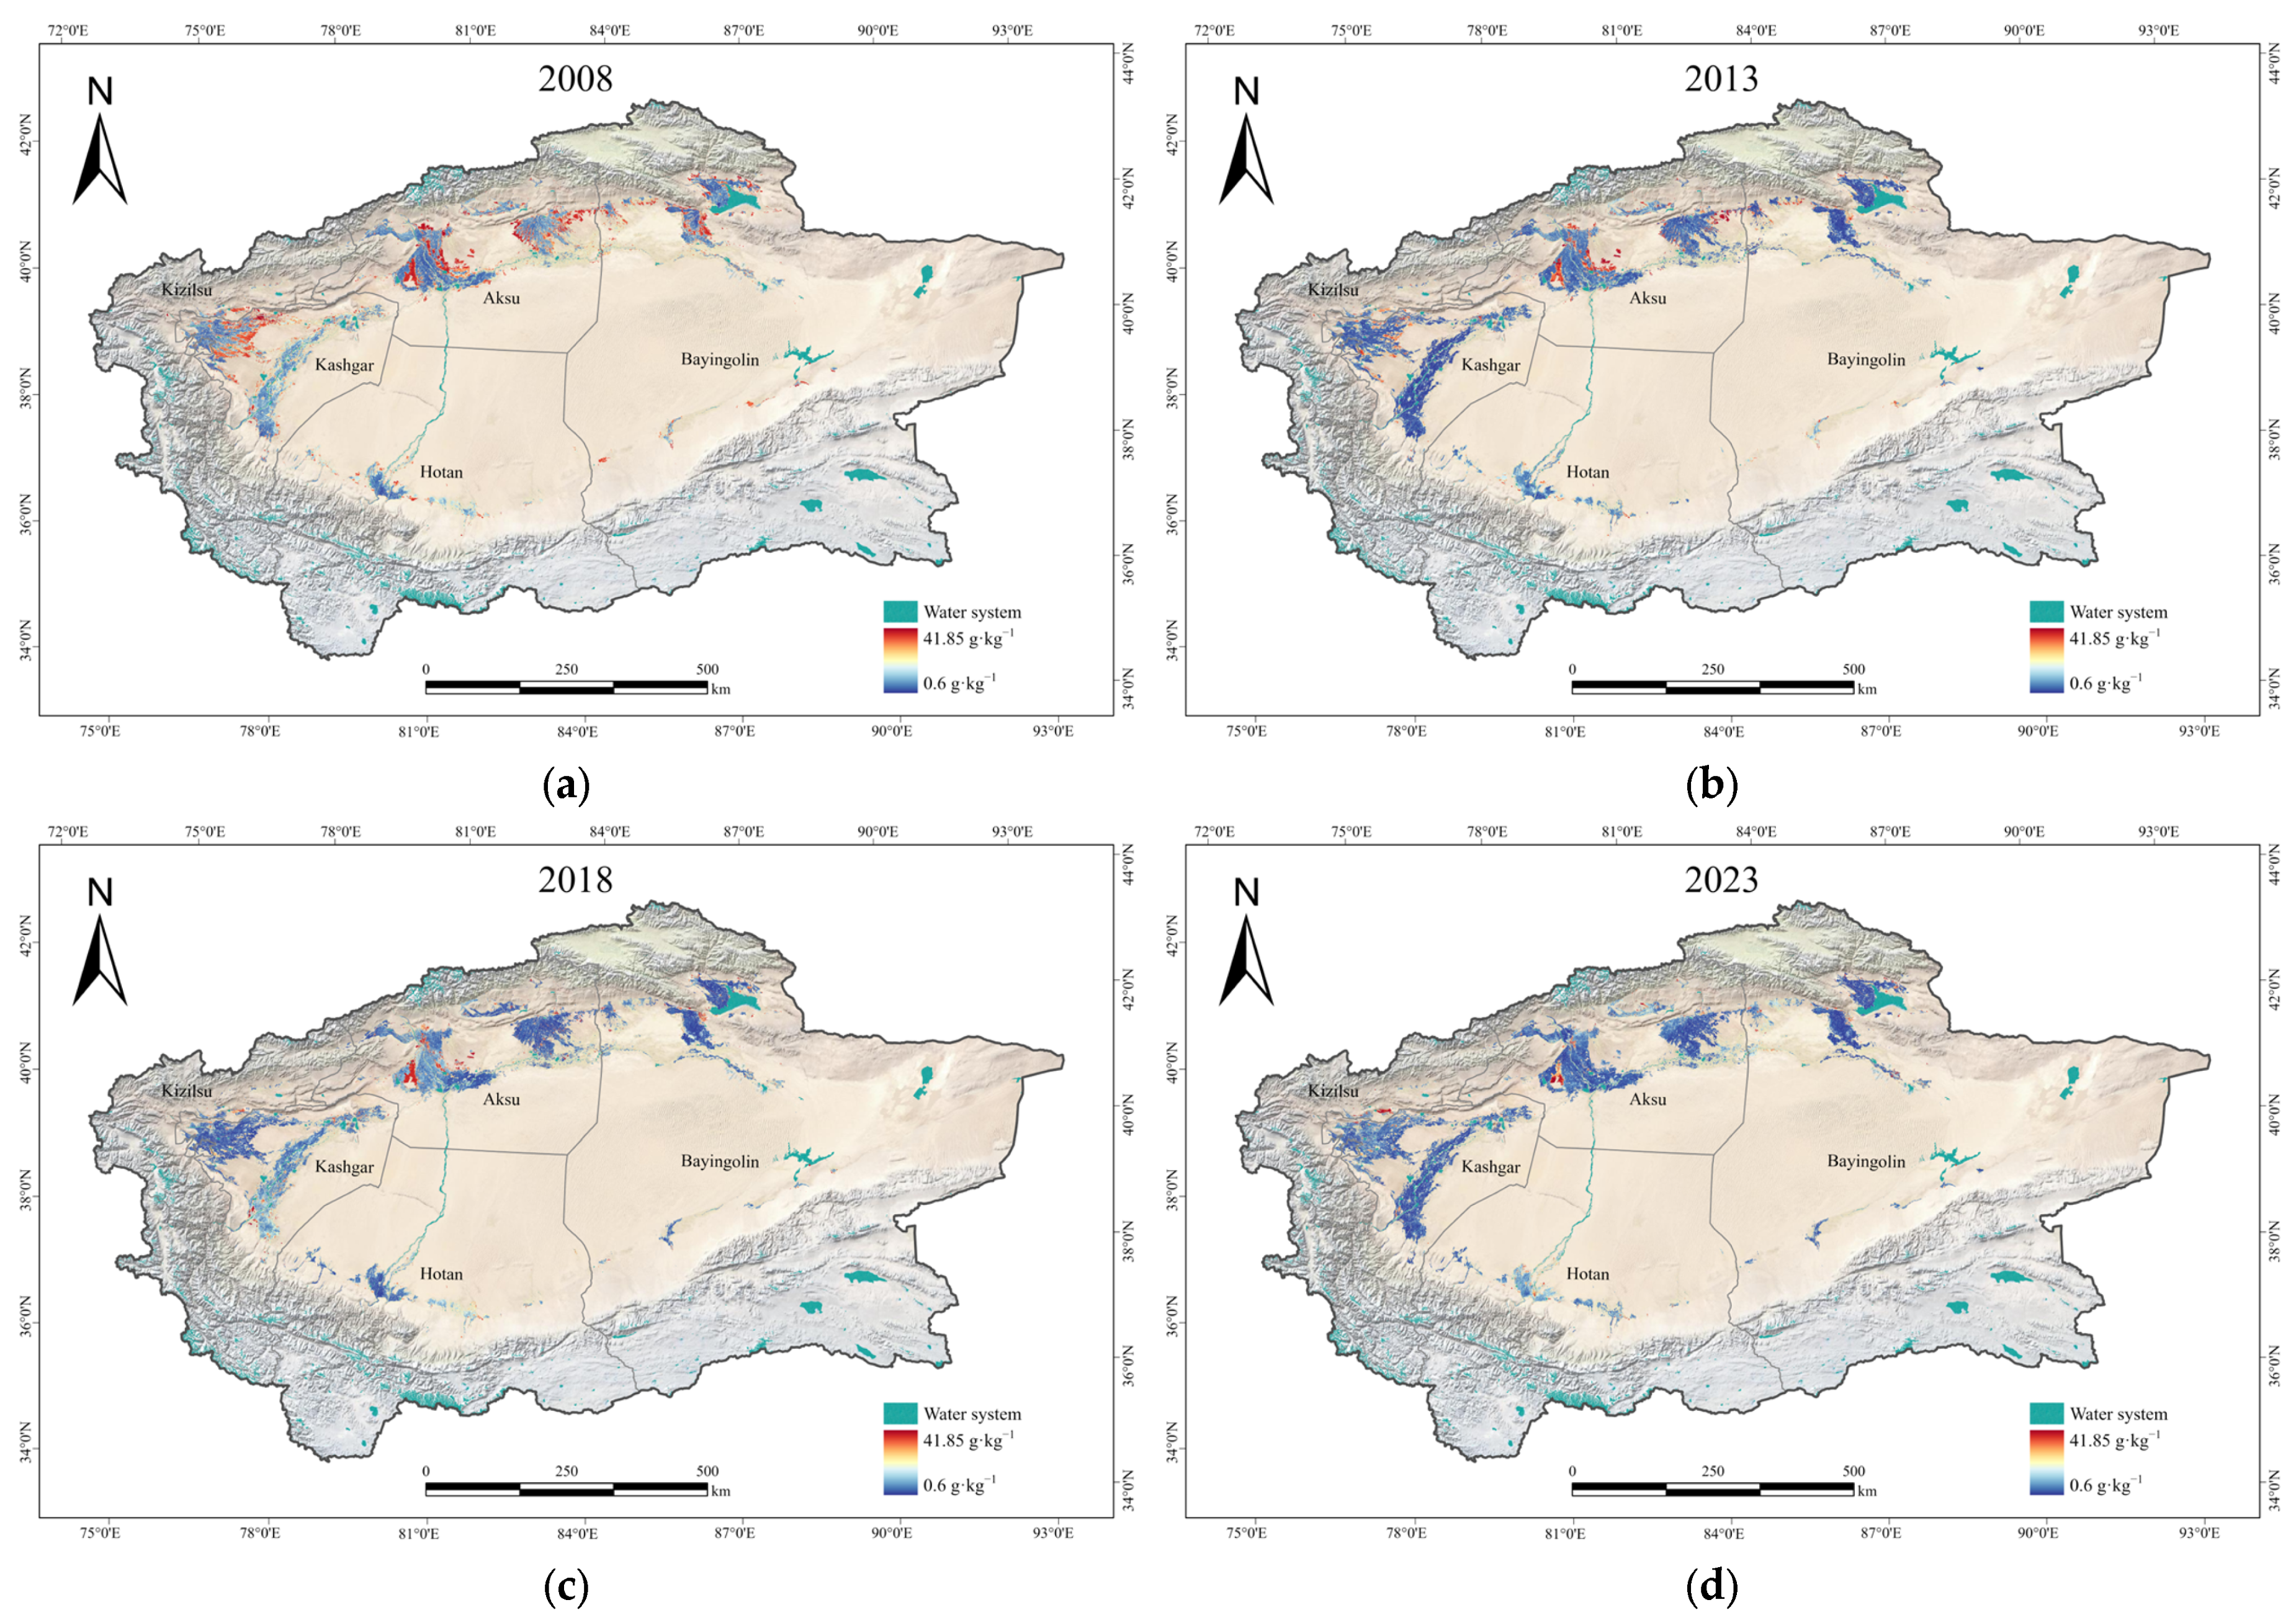
To systematically reveal the long-term evolution of soil salinization in typical arid regions of southern Xinjiang, this study first constructed an RF model using 2023 field-measured soil salt content (SSC) data and selected environmental variables. The trained model was then applied to Landsat imagery from 2008, 2013, and 2018 to infer soil salinity conditions for each corresponding period. For every target year, satellite images acquired during the same phenological phase as the 2023 field campaign (August to November) were used to calculate spectral indices and perform inversion, ensuring temporal consistency and comparability among datasets. The spatial distribution of SSC in the study area is shown in Figure 7. The inversion results revealed a persistent alleviation of soil salinization, with a marked reduction in mean SSC. In 2008, the mean SSC reached 16.37 g·kg−1 with a standard deviation of 11.19 g·kg−1, indicating strong accumulation and high spatial variability. By 2013 and 2018, the mean SSC decreased to 10.10 g·kg−1 and 10.00 g·kg−1, respectively, with standard deviations reduced to 10.18 g·kg−1 and 9.20 g·kg−1, suggesting a convergence of salinity levels and reduced spatial heterogeneity. In 2023, the mean SSC further declined to 8.03 g·kg−1 with a standard deviation of 8.05 g·kg−1, reflecting the effectiveness of long-term measures such as efficient irrigation, ecological restoration, and salinity regulation in mitigating salinization stress across oasis areas [61,62,63]. Overall, SSC in southern Xinjiang showed a sharp decline from 2008 to 2013, followed by a relatively slower yet steady decrease thereafter.
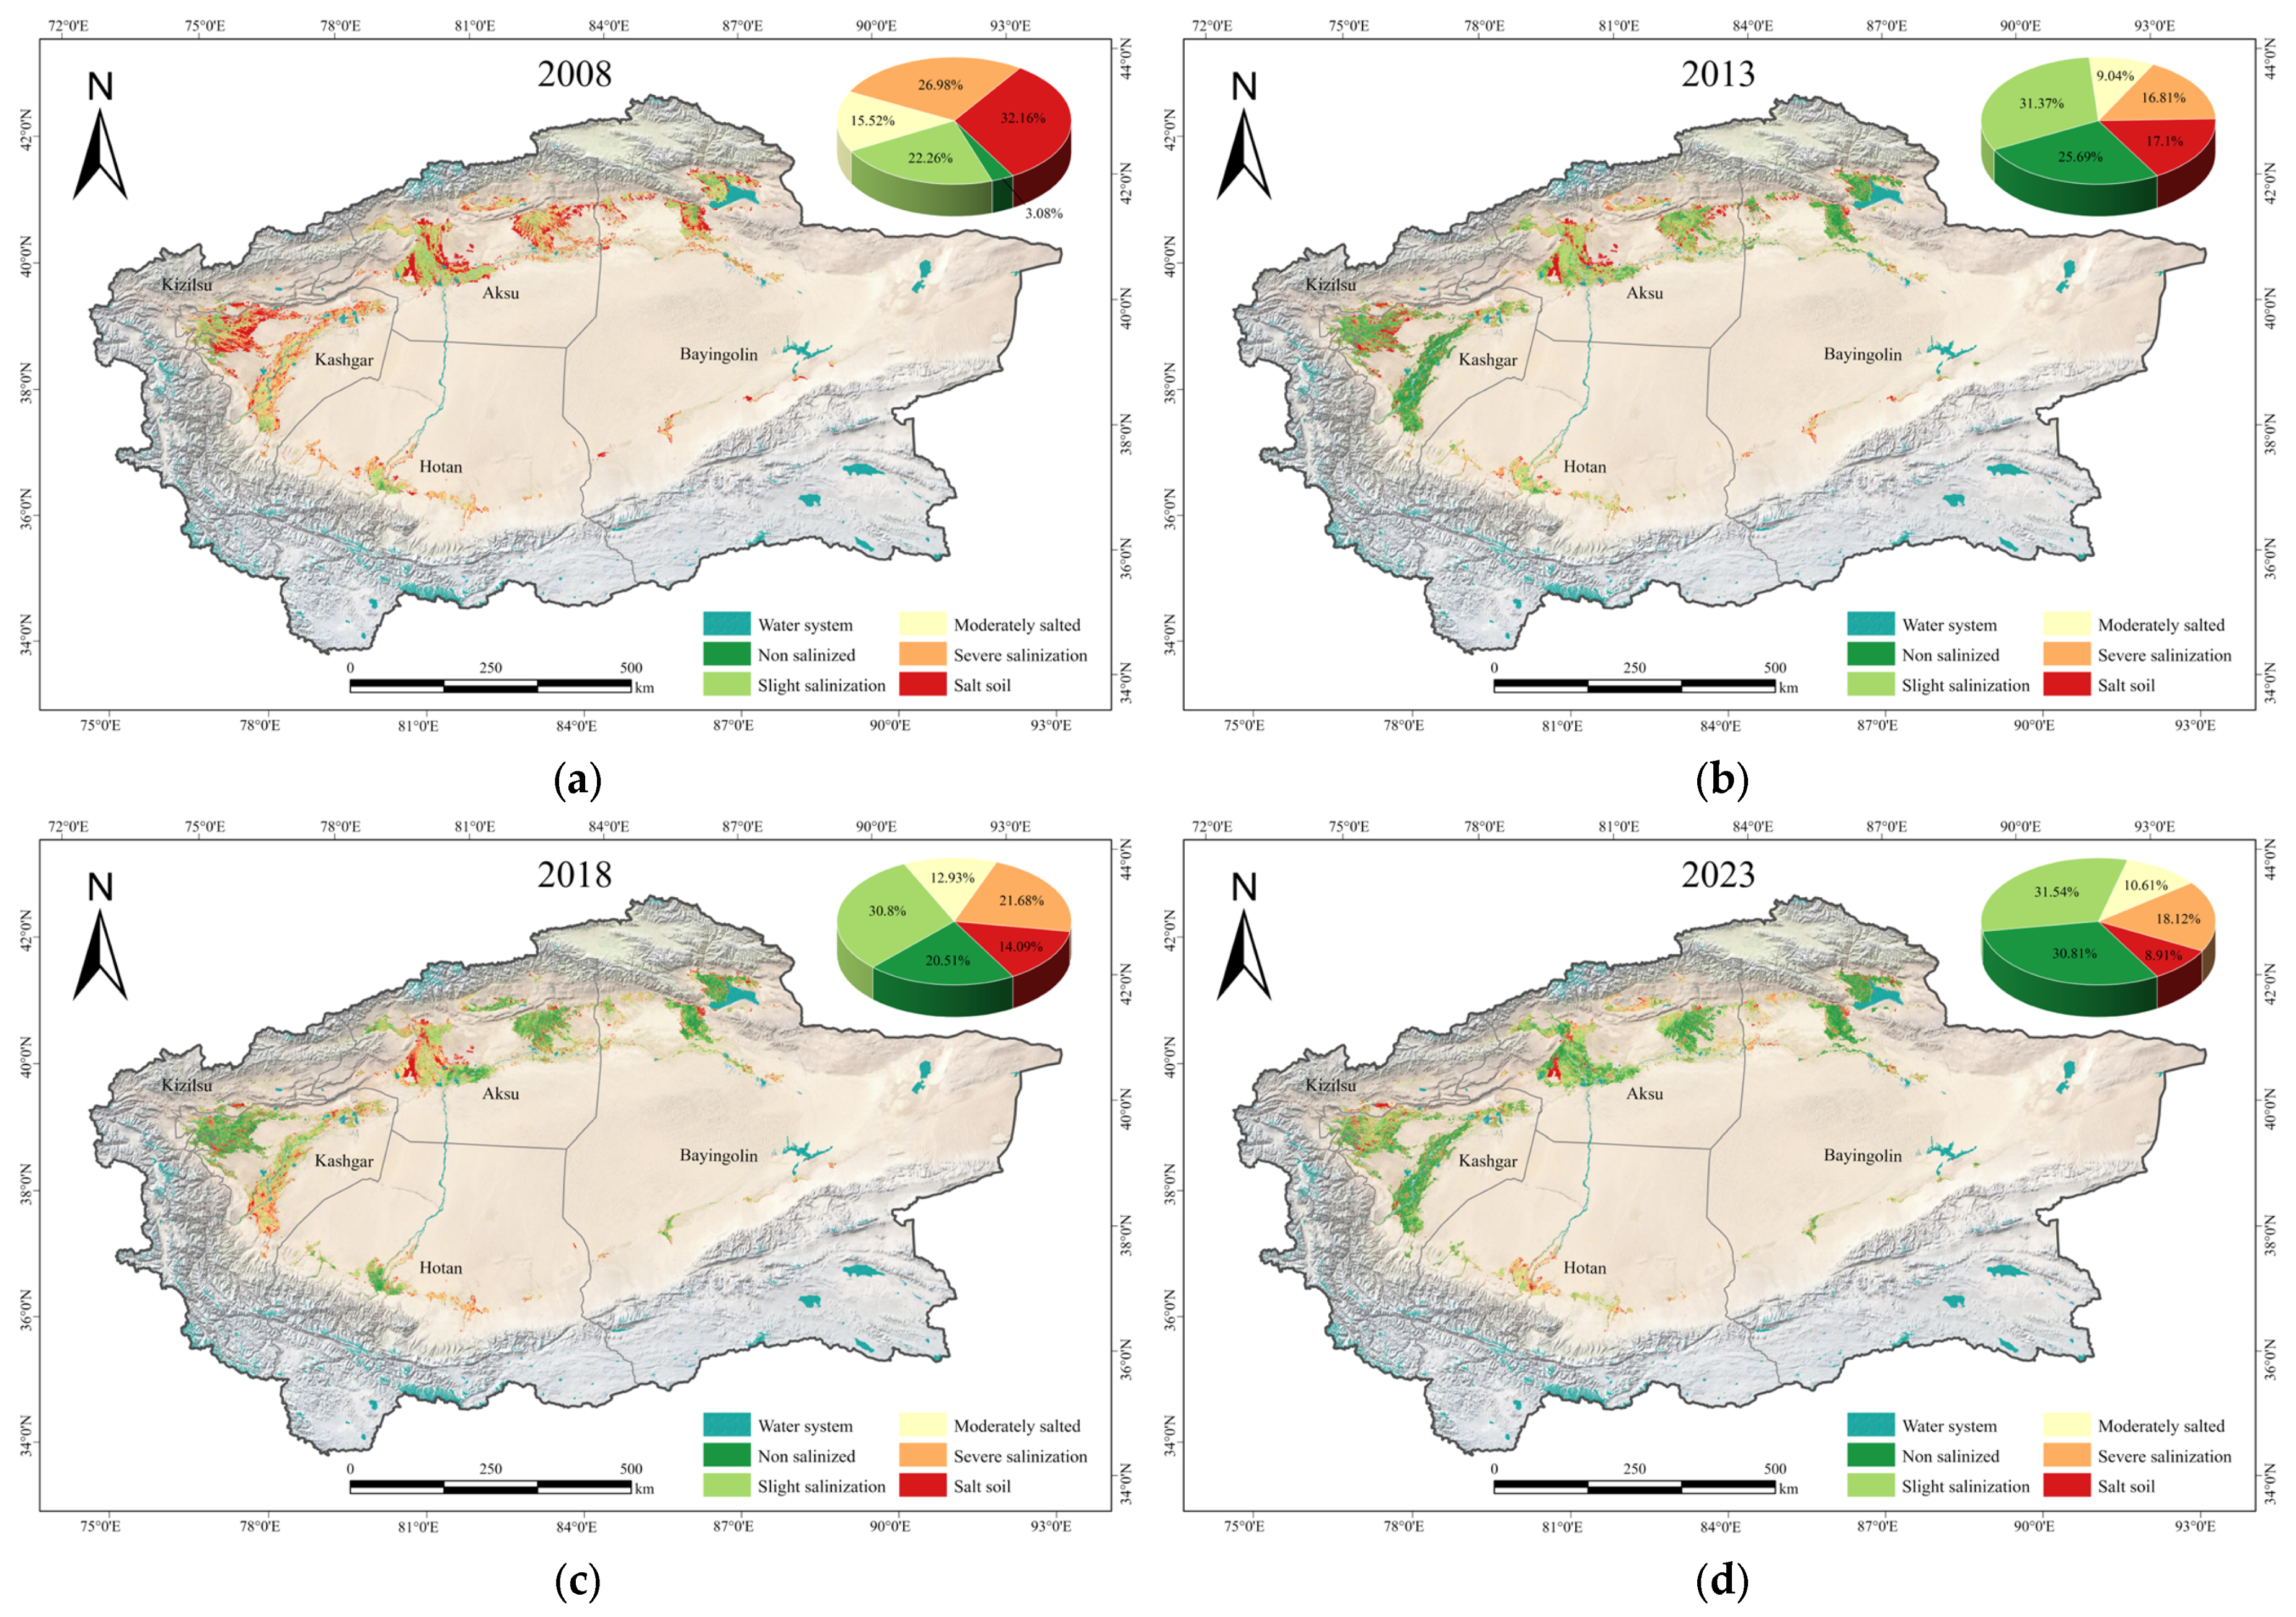
According to the soil salinization classification map (Figure 8), the region exhibited a high degree of salinization in 2008, with saline soil and severely salinized areas together accounting for nearly 60%. Among these, saline soil contributed the largest share (32.16%), followed by severe salinization (26.98%), whereas non-salinized areas accounted for only 3.08%. By 2013, the salinization structure underwent a notable reconfiguration, with non-salinized and slightly salinized areas expanding markedly to 25.69% and 31.37%, respectively. Meanwhile, saline soil declined to 17.10%, and moderately to severely salinized areas also decreased, indicating improved water–salt regulation capacity and the initial effectiveness of optimized irrigation practices. In 2018, the classification pattern remained relatively stable, with slight salinization persisting above 30%, while non-salinized areas slightly decreased to 20.51%. Moderate and severe salinization slightly increased to 12.93% and 21.68%, suggesting localized risks of salinity reoccurrence, potentially driven by groundwater fluctuations or heterogeneous irrigation. By 2023, non-salinized areas expanded to 30.81%, while saline soil sharply decreased to 8.91%, representing a 23% reduction compared with 2008, and severely salinized areas further contracted to 18.12%.
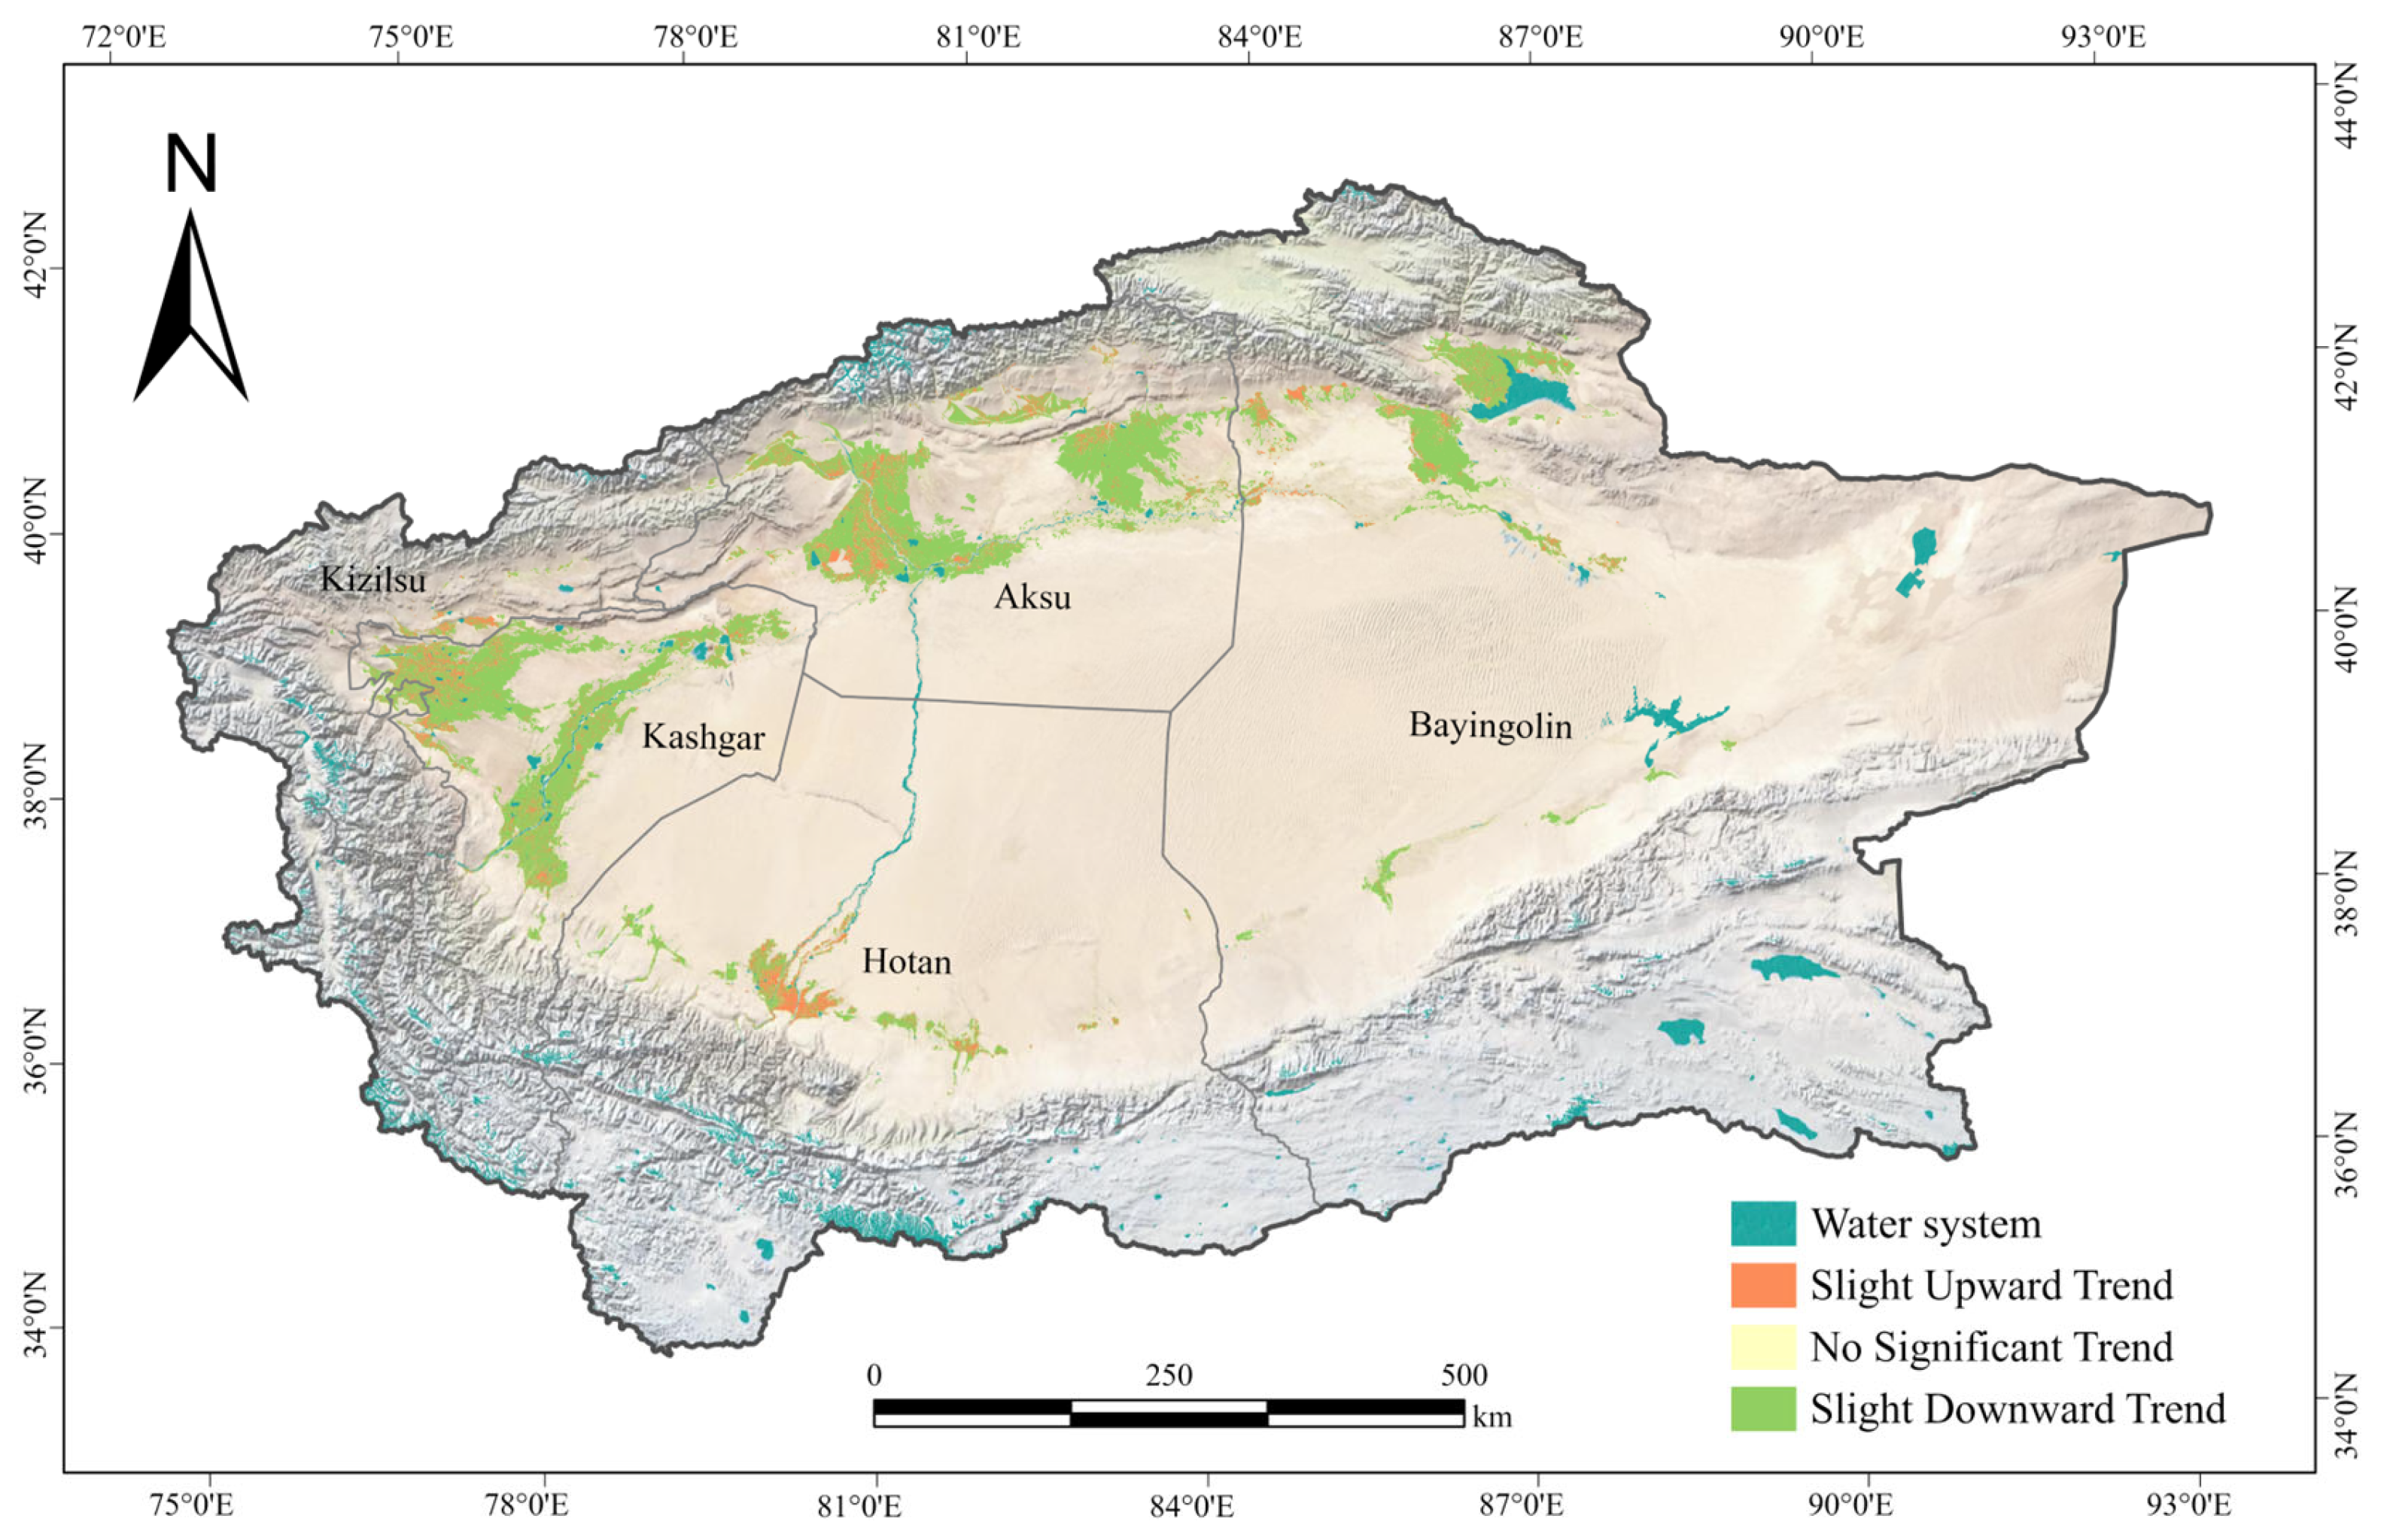
To comprehensively reveal the spatiotemporal evolution of soil salinity in the southern Xinjiang oasis and its statistical significance, this study applied Sen’s slope estimation in combination with the non-parametric MK test to detect trends in the four reconstructed datasets (2008, 2013, 2018, and 2023), as shown in Figure 9. The results indicated an overall decreasing trend in soil salinity across the region, with slight declines accounting for as much as 78.63%, suggesting that salinization has been alleviated in most areas over the past 15 years. Areas with no significant change were relatively scarce, accounting for only 2.53%. Notably, approximately 18.84% of the region exhibited a slight upward trend, indicating potential risks in water–salt regulation; these areas should be prioritized for targeted management in the future.
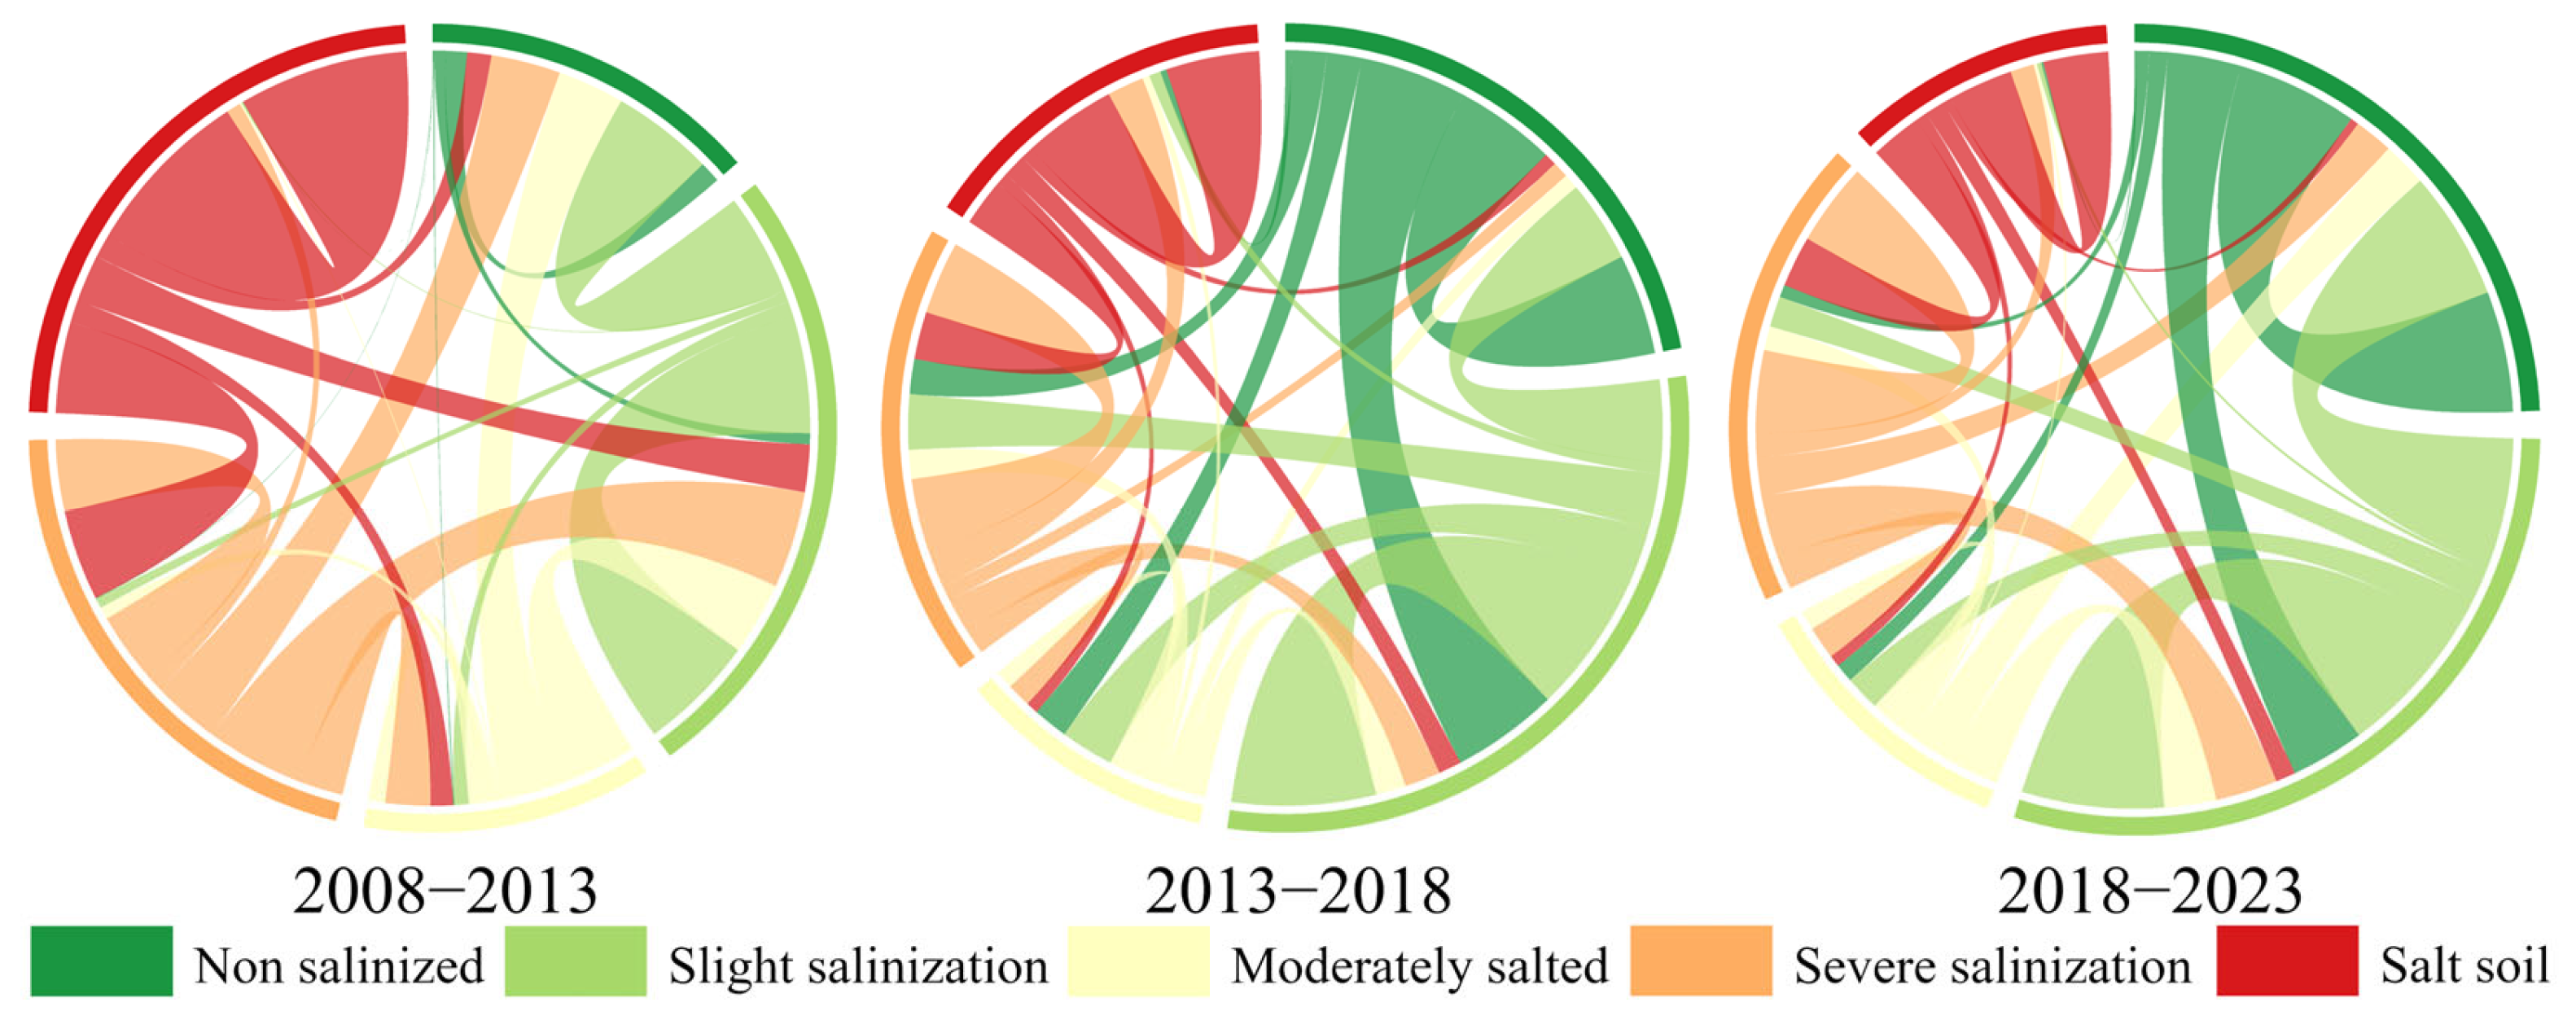
According to the soil salinization transition matrix from 2008 to 2023 (Figure 10), the evolutionary trajectory and improvement effects of soil salinization in the study area are clearly revealed. During 2008–2013, 15.41% of saline soils remained unchanged, while 8.24% shifted to severe salinization, 4.31% declined to slight salinization, and 2.18% successfully converted into non-salinized soils. Meanwhile, 6.30% of severely salinized areas transitioned to non-salinized status, and 8.78% shifted toward slight salinization. From 2013 to 2018, identified as a period of accelerated remediation, 9.13% of non-salinized soils remained stable, while 9.66% of slightly salinized soils and 1.13% of saline soils were successfully converted to non-salinized status, indicating the progressive effectiveness of integrated remediation measures. During 2018–2023, the remediation trend became more pronounced, with 11.65% of slightly salinized soils successfully converted to non-salinized status, demonstrating that recent remediation practices were more effective than those in earlier periods. However, fluctuations between saline soils and moderately salinized soils persisted, highlighting the need for sustained remediation efforts and region-specific management strategies.

3.4. Driving Effects of Climate and Soil Texture on Soil Salinization

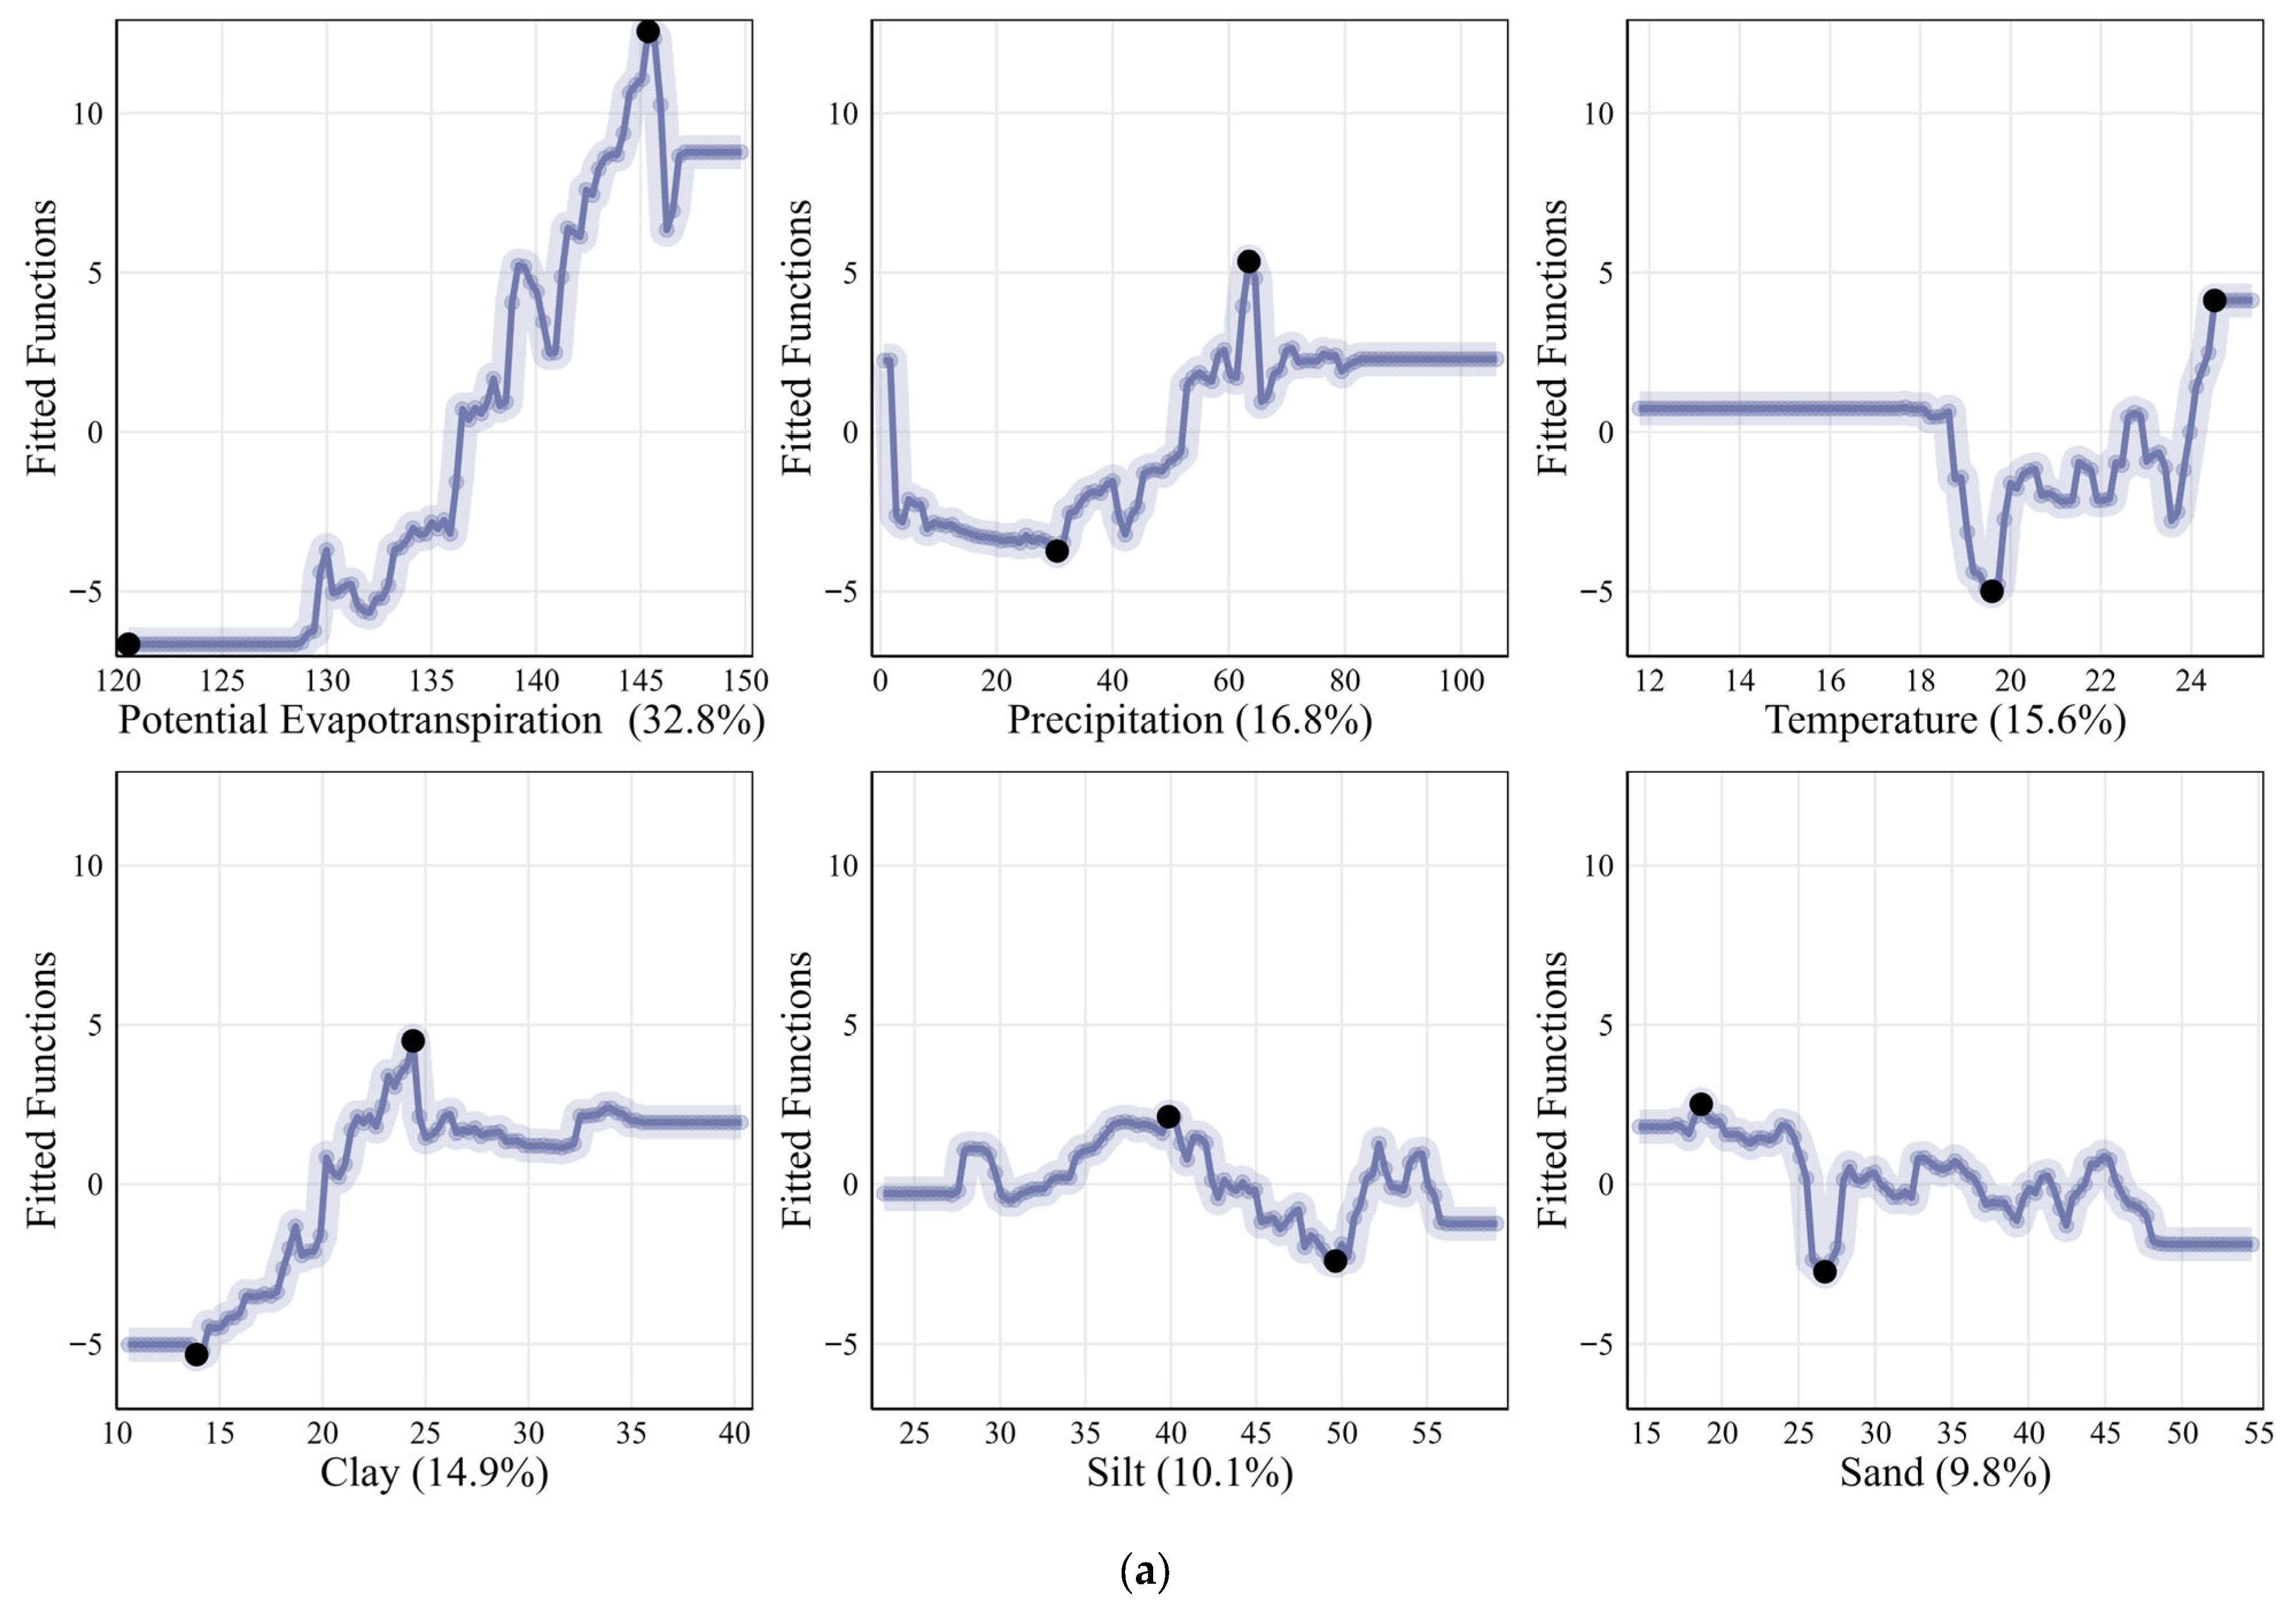
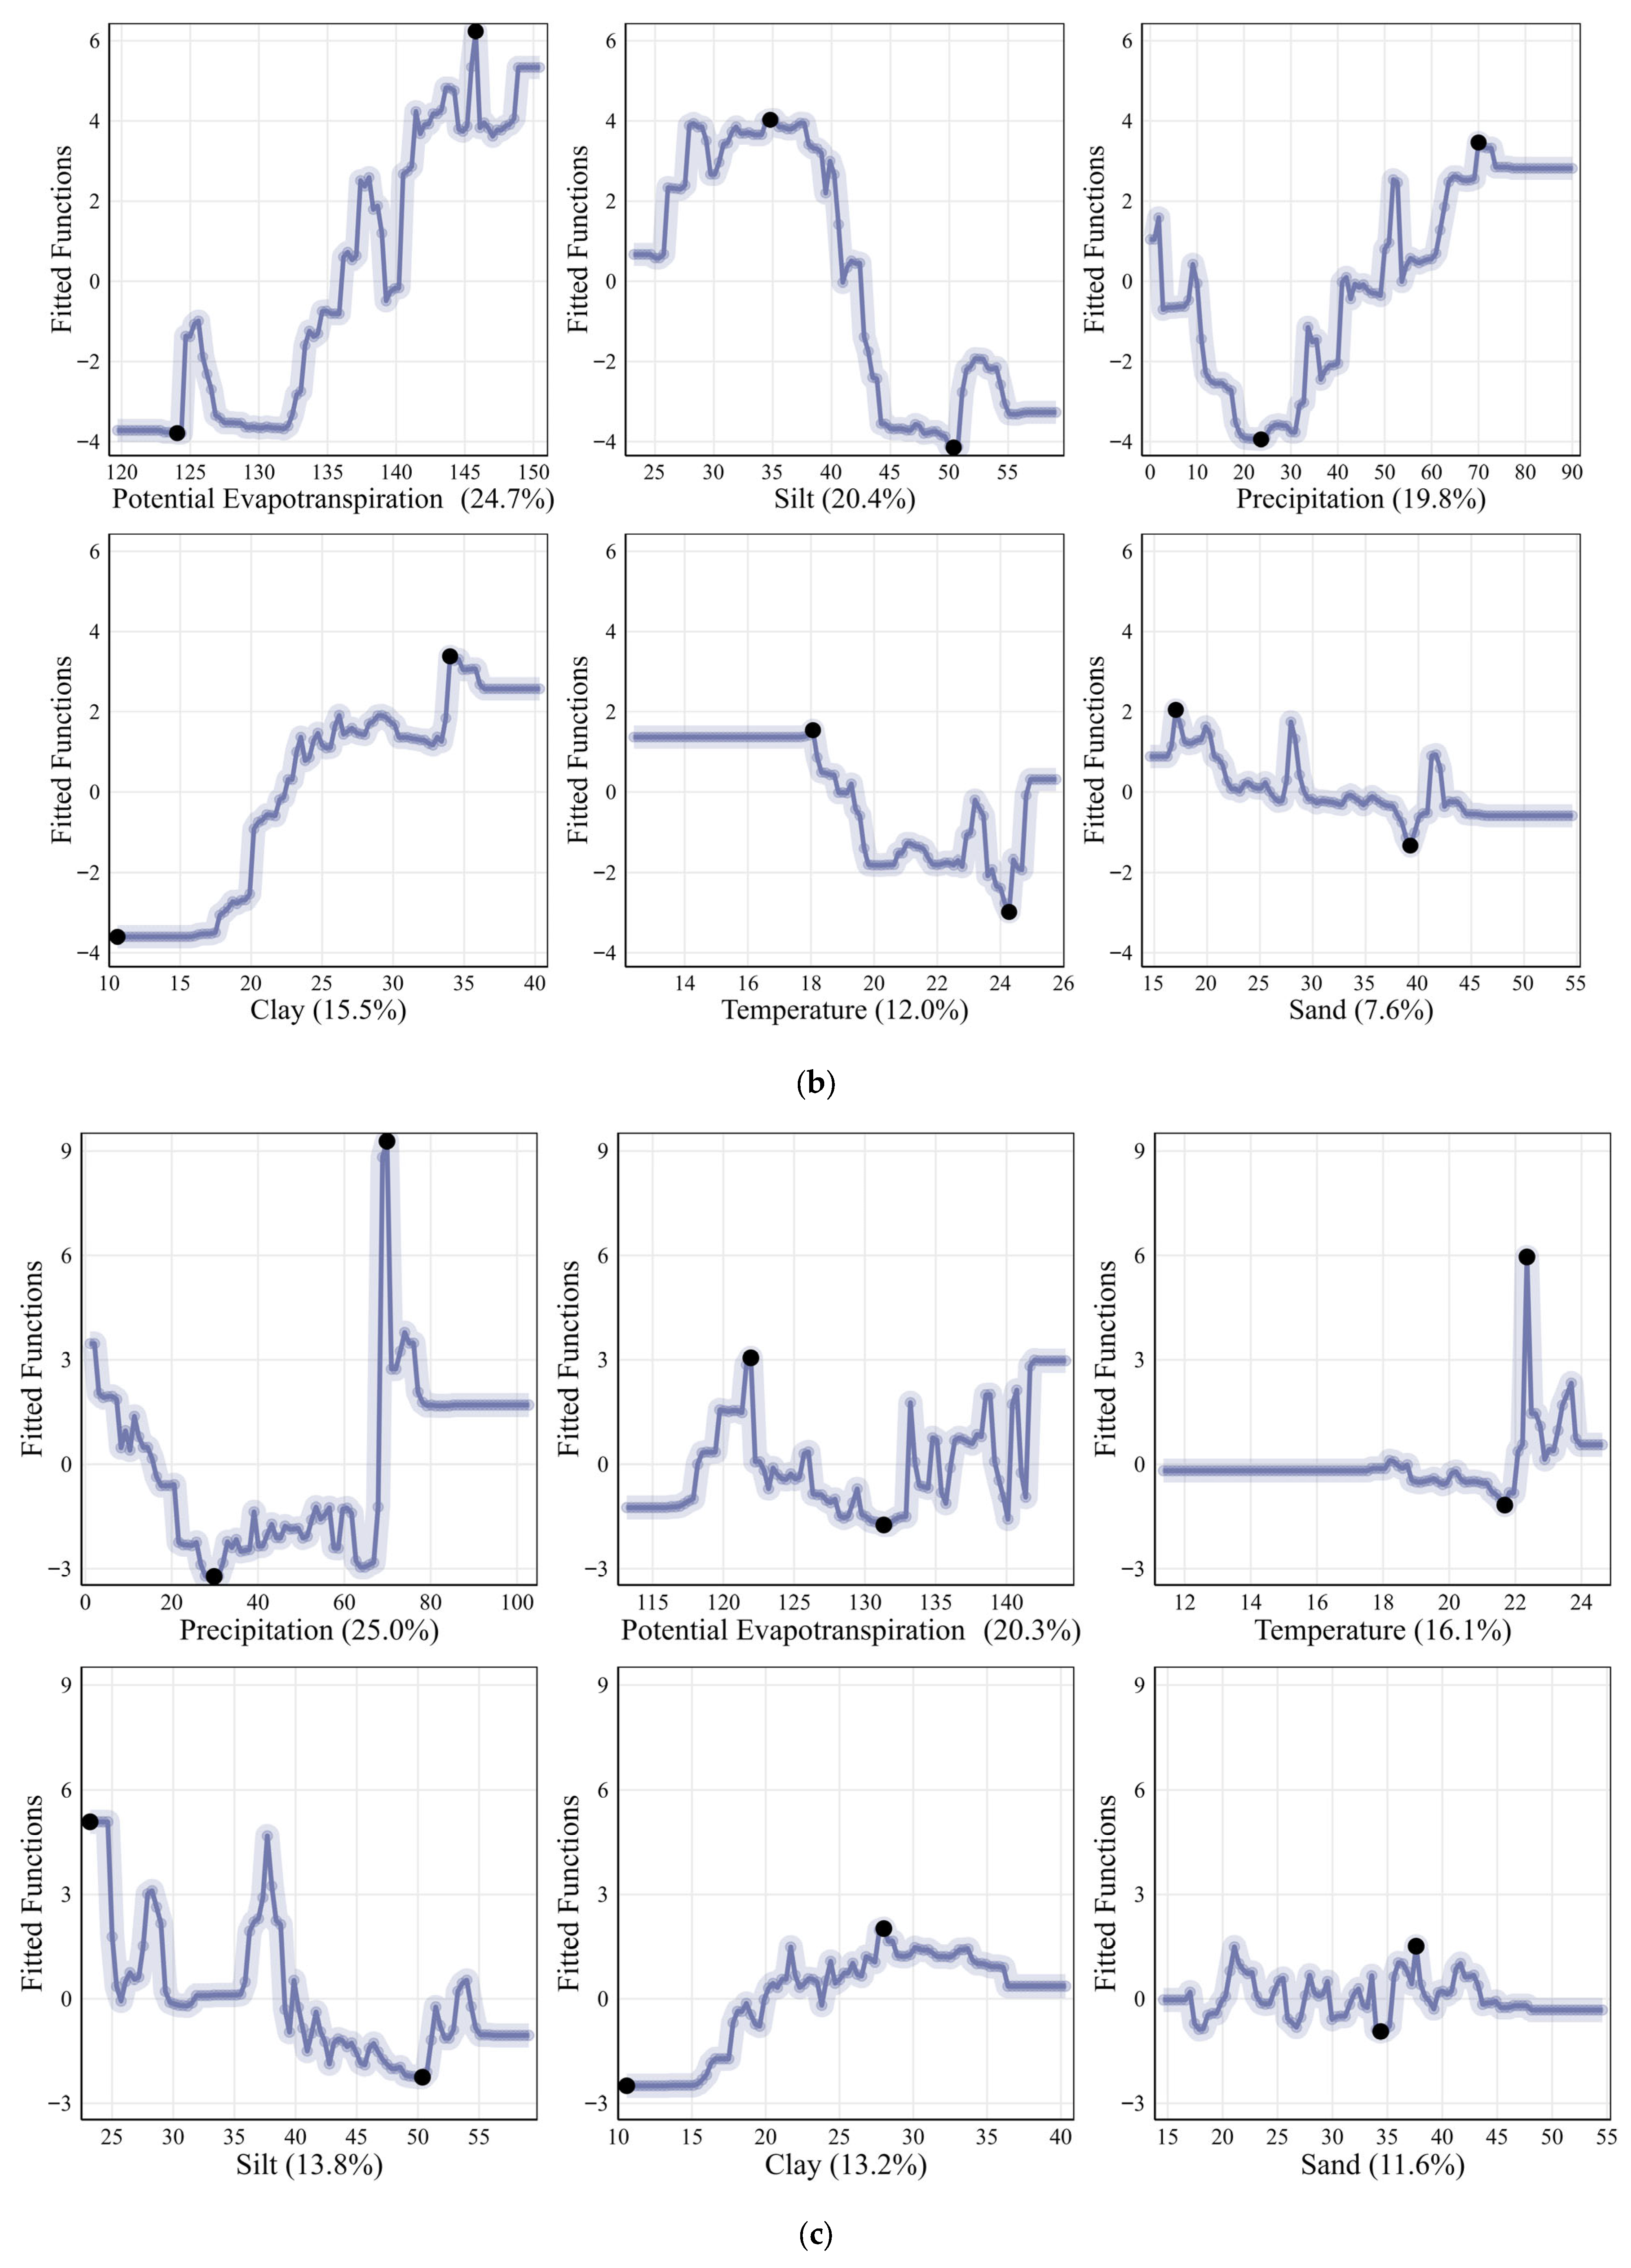
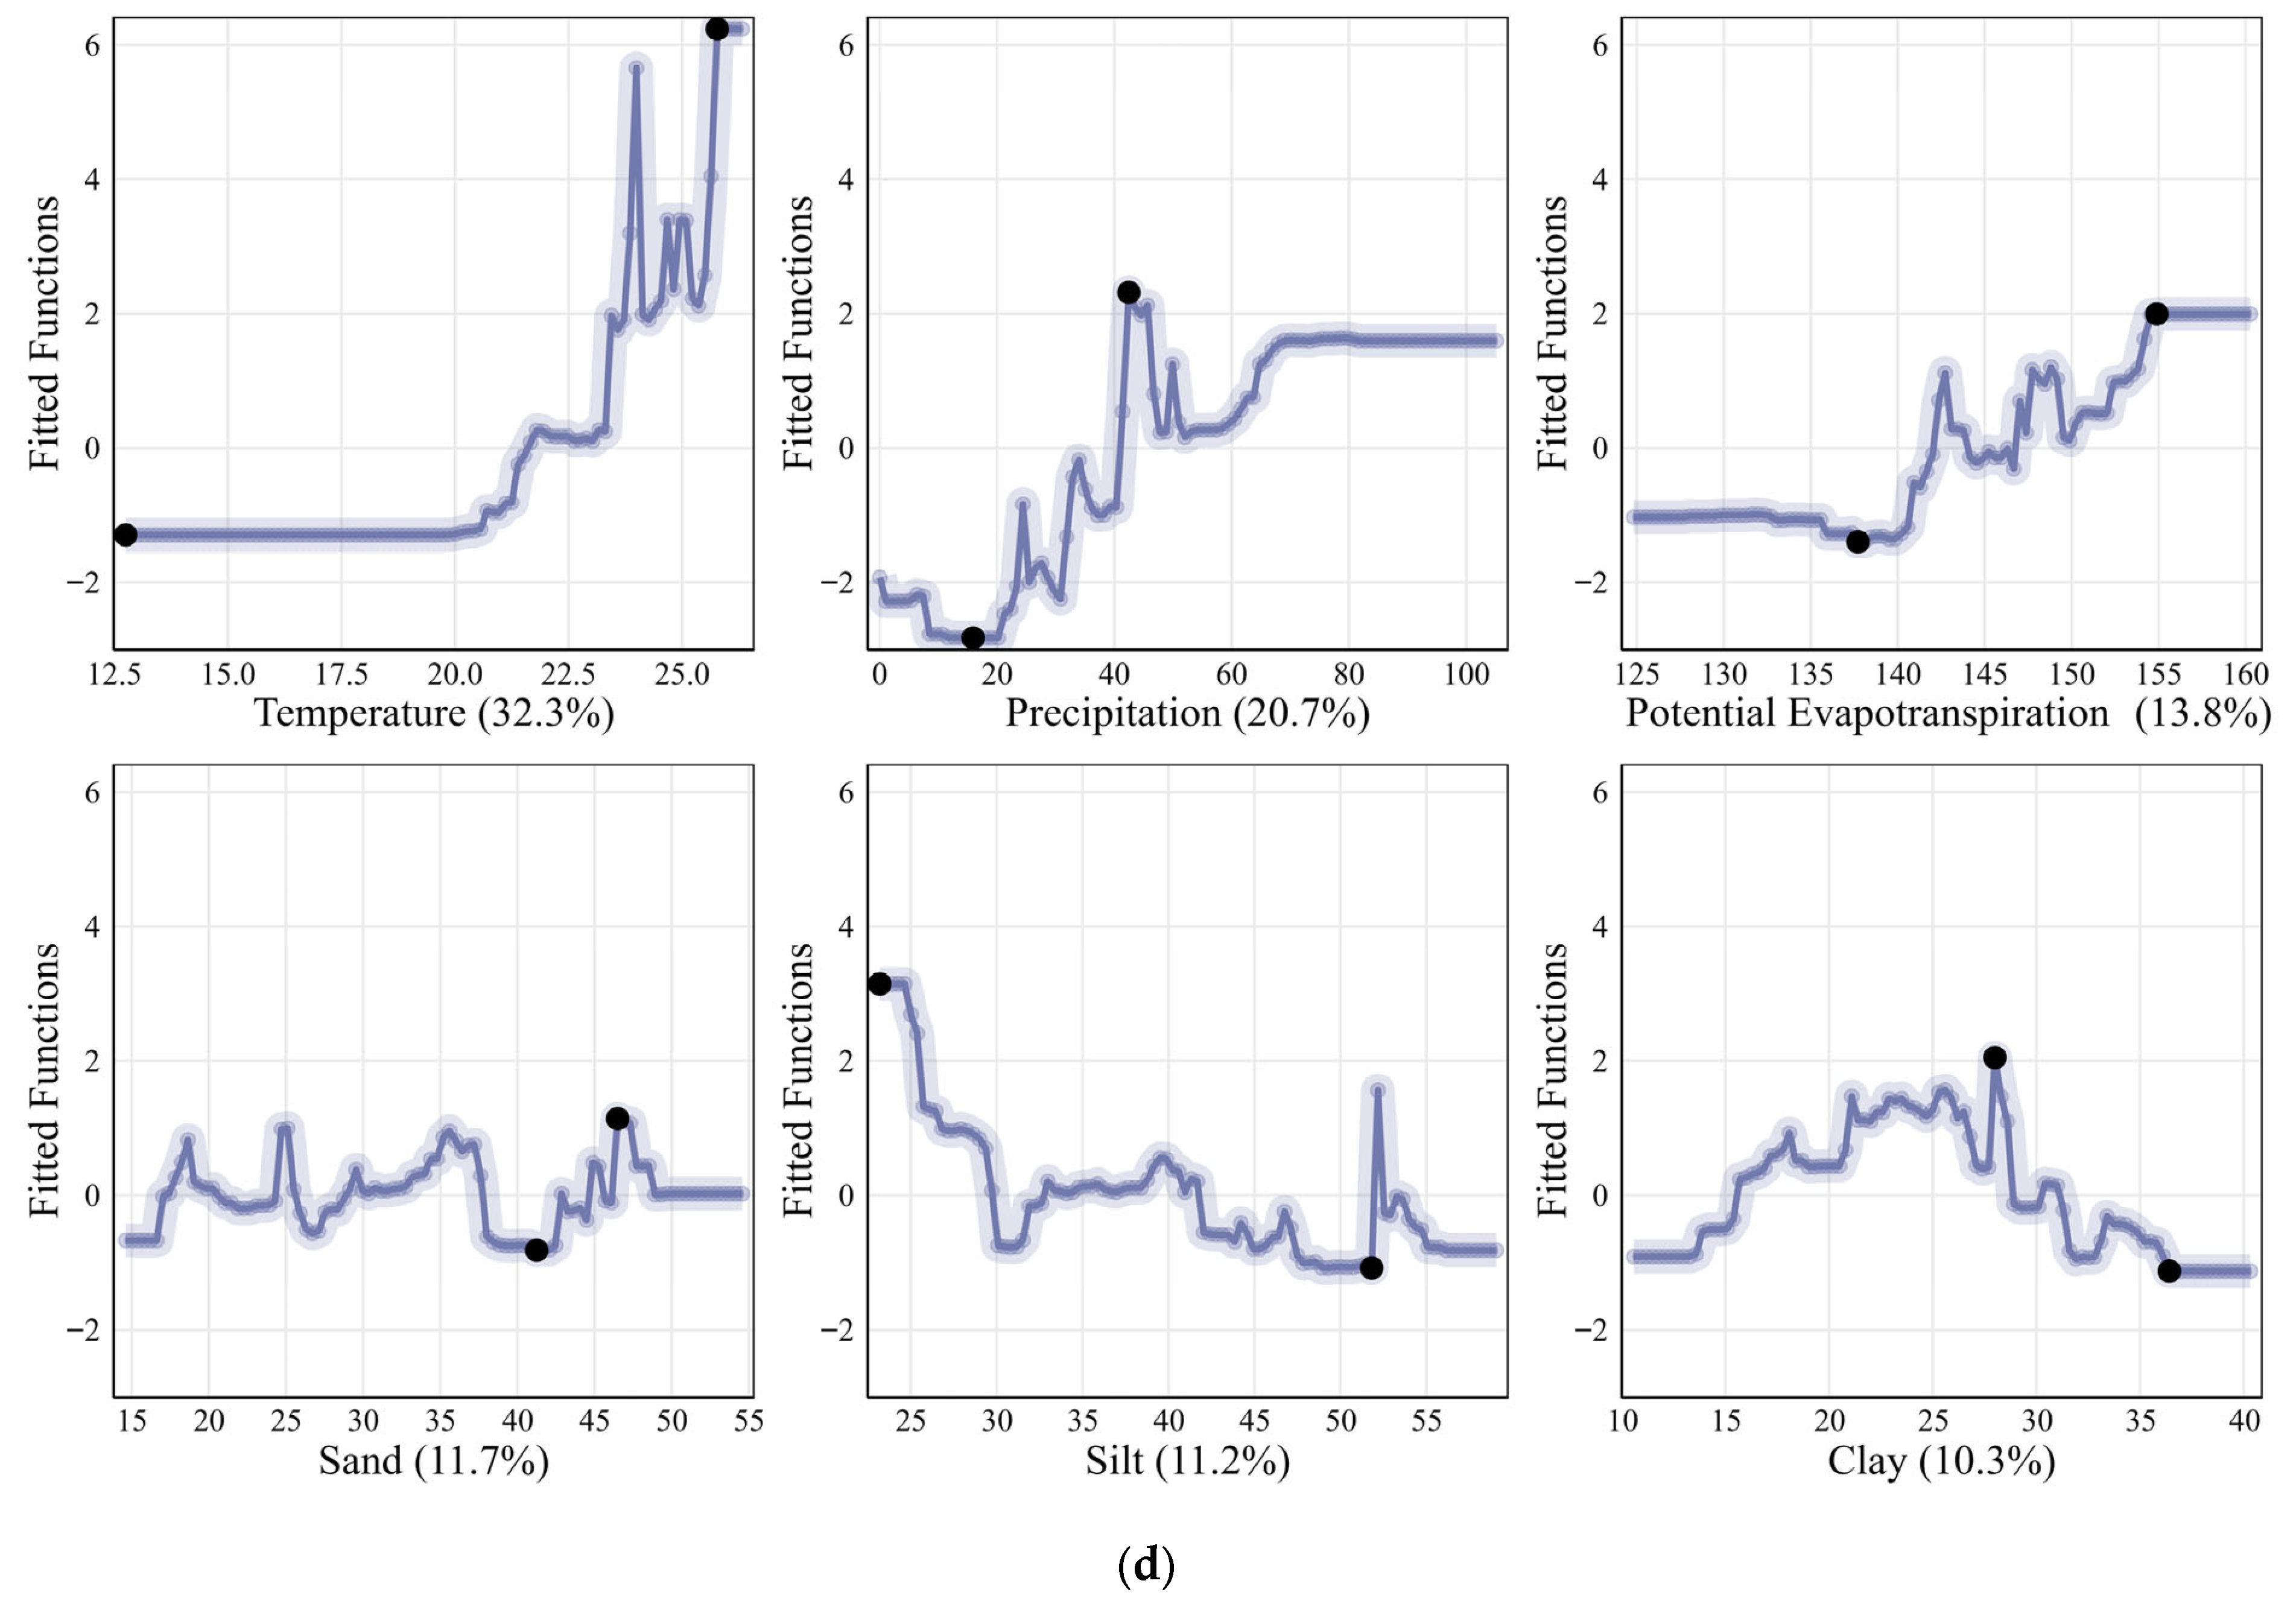
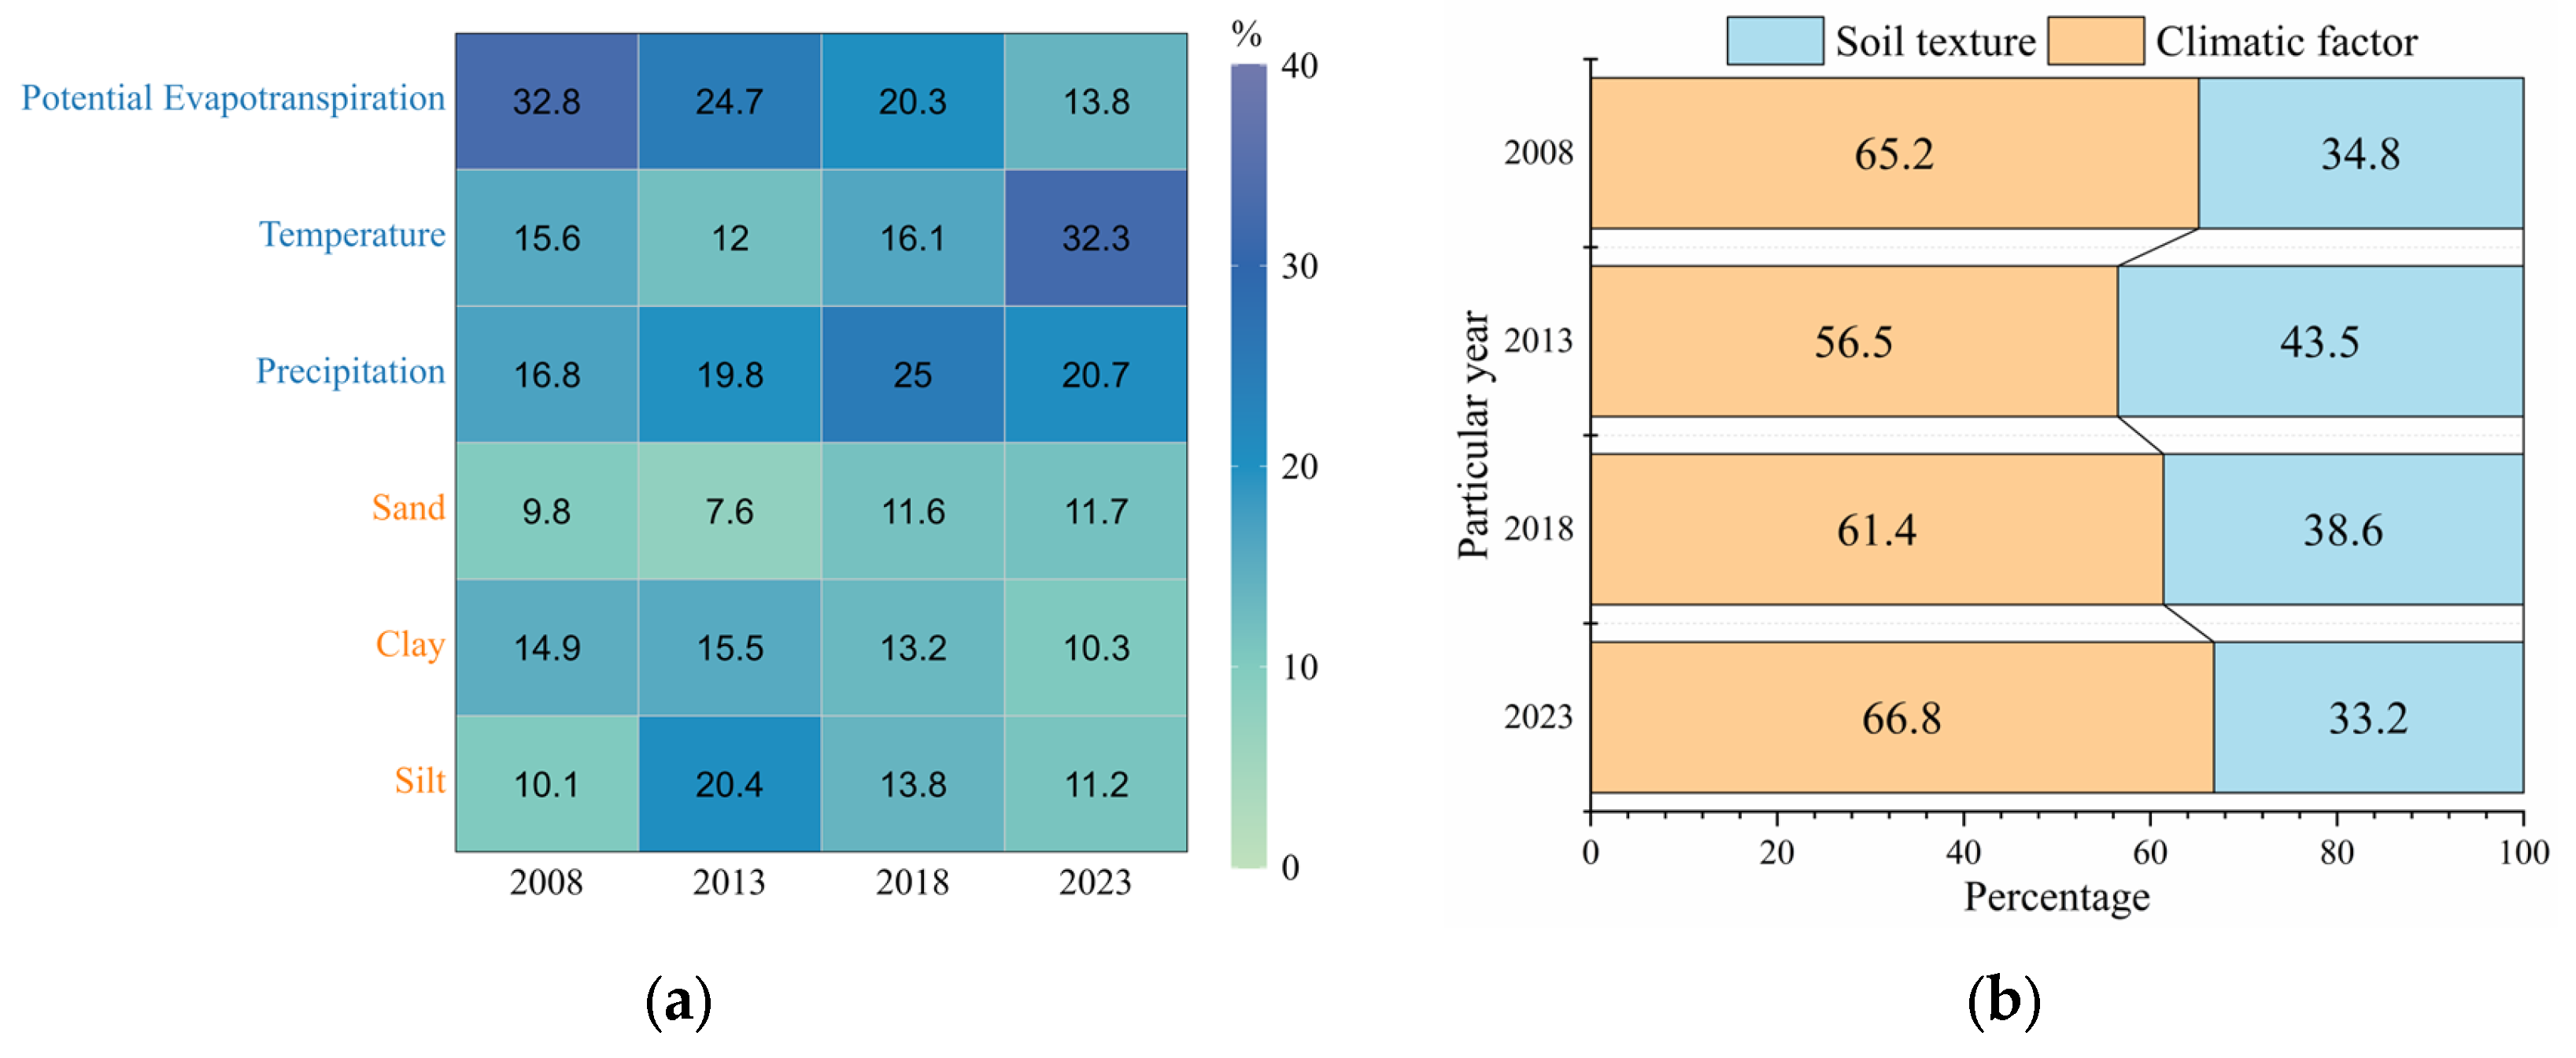
The relative contributions and partial dependence plots of climate and soil texture to soil salinization in southern Xinjiang, derived from the BRT model, are shown in Figure 11. In 2008, potential evapotranspiration contributed the most (32.8%), with salinity increasing sharply when evapotranspiration reached 135 mm. Precipitation accounted for 16.8%, with a marked reduction in salinity observed at 20–30 mm, while temperature contributed 15.6%, exhibiting a threshold effect on salinity accumulation at 24 °C. Among soil textures, clay contributed 14.5% with relatively stable effects, while sand contributed 10.3%, exerting a moderate influence on salinization. In 2013, potential evapotranspiration remained the dominant factor, though its contribution decreased to 24.7%; salinity still rose markedly when evapotranspiration exceeded 130 mm. Silt contributed 20.4%, significantly influencing salinity, particularly at 35–40%. Precipitation contributed 19.8%, while temperature (12%) sharply increased its impact at 24 °C. By 2018, precipitation contributed 25.0%, with leaching effects significantly reducing salinity when precipitation ranged from 20 to 50 mm. Potential evapotranspiration accounted for 20.3%, continuing to drive salinity accumulation above 130 mm. Temperature contributed 16.1%, markedly intensifying salinization near 22 °C, while silt contributed 13.8%, with salinity rising notably when its content approached 36%. In 2023, temperature reached the highest contribution (32.3%), with salinity rising sharply near 25 °C, indicating a strong correlation. Precipitation contributed 20.7% and potential evapotranspiration 13.8%, with salinity accumulating significantly when evapotranspiration reached 140 mm, further driving salinization. For soil texture, silt and sand contributed 11.2% and 11.7%, respectively, both exerting notable effects at varying contents, particularly within specific ranges where salinity substantially increased.
As shown in Figure 12, from 2008 to 2023, the driving effect of climate factors on soil salinization consistently exceeded that of soil texture. In 2008, climate factors contributed 65.2%, while soil texture accounted for 34.8%; by 2023, the contribution of climate factors increased to 66.8%, whereas soil texture decreased to 33.2%. Specifically, potential evapotranspiration exerted the greatest influence on salinity accumulation in 2008, contributing 32.8%, but gradually declined to 13.8% by 2023. In contrast, the effects of temperature and precipitation on salinization increased annually, rising from 15.6% and 16.8% in 2008 to 32.3% and 20.7% in 2023, respectively. Overall, the contribution of climate factors remained consistently higher than that of soil texture, with temperature emerging as the most critical and increasingly dominant driver of soil salinization.

4. Discussion

4.1. Soil Salinization Inversion

In soil salinization inversion studies, the selection of environmental factors directly determines model accuracy. A single spectral index is often insufficient to capture the complex spectral characteristics of soil salinization, particularly in arid regions with sparse vegetation, which significantly reduces model stability and reliability [64,65,66]. Consequently, recent studies have increasingly emphasized the use of multiple spectral indices to construct composite variables, thereby capturing soil salinity characteristics more comprehensively and accurately [16]. In this study, the RF model was used to rank the importance of vegetation and salinity indices, and the top five indices from each group were selected to construct an optimized variable set. Compared with the full-variable models, R2 improved from 0.734 to 0.747 for Landsat-9 and from 0.515 to 0.550 for Sentinel-2, with feature-selected models consistently outperforming their full-variable counterparts. These findings align with previous studies, confirming that feature selection not only removes redundant variables and noise but also enhances model generalization and stability [12].
Moreover, Landsat-9 data exhibited a clear performance advantage over Sentinel-2 in salinity inversion in the arid regions of southern Xinjiang, a phenomenon that merits attention. Although Sentinel-2 provides higher spatial resolution, Landsat data in this study demonstrated greater sensitivity to salinity spectral features, while also offering superior long-term stability. This supports the conclusion that Landsat data are more reliable for long-term monitoring of soil salinization at the regional scale [67,68]. One possible reason is that Landsat-9’s near-infrared spectral range (0.85–0.88 μm) covers bands that are particularly sensitive to salinity [69,70]. In addition, its 14-bit radiometric resolution, which exceeds Sentinel-2’s 12-bit resolution [71], is particularly advantageous under conditions of strong salinization and high surface brightness in southern Xinjiang, ensuring higher model accuracy. Therefore, by integrating feature selection with an appropriate choice of remote sensing data sources, this study provides a methodological reference for achieving high accuracy and stability in soil salinization inversion in arid regions, as well as a clear pathway and theoretical support for enhancing the reliability and applicability of long-term regional monitoring.

4.2. Response of Soil Salinization to Climate and Soil Texture

This study revealed the significant evolutionary patterns of soil salinization in the typical arid regions of southern Xinjiang from 2008 to 2023. Overall, soil salinity levels declined markedly, with the mean SSC decreasing from 16.37 g·kg−1 in 2008 to 8.03 g·kg−1 in 2023. The trend showed a sharp decline during 2008–2013, followed by a more gradual decrease thereafter. Non-salinized areas expanded significantly, while saline soils and severely salinized land contracted markedly, shifting toward slight and non-salinized categories. These findings are consistent with previous studies reporting reduced salinization in southern Xinjiang [72]. MK trend analysis indicated that 78.63% of soils exhibited a slight decreasing trend, largely attributable to the transition on farmland from traditional flood irrigation to efficient water-saving practices and the implementation of ecological restoration measures, as well as the gradual improvement in regional climatic conditions, which collectively enhanced salinity control [73].
When examining the relative contributions of climate and soil texture, climate factors consistently exerted stronger control over salinization than soil texture. In 2008, climate factors contributed 65.2% compared with 34.8% for soil texture; by 2023, climate contributions had risen slightly to 66.8%, while soil texture declined to 33.2%. Among climatic variables, potential evapotranspiration (PET) contributed most in 2008 (32.8%) but gradually weakened thereafter. In contrast, the contributions of temperature and precipitation increased, aligning with the observed salinity trends. This not only highlights the increasing influence of rising temperatures and changing precipitation on soil salt transport and accumulation but also reinforces existing evidence regarding the critical role of climate change in shaping salinization processes in arid regions [8,24,74,75]. Specifically, cumulative PET around 135 mm was associated with sharp increases in soil salinity, while 20–30 mm of precipitation effectively leached salts from the soil. However, when cumulative precipitation exceeded 60 mm, shallow groundwater tables combined with high evapotranspiration led to salt accumulation near the surface [23,76,77]. A critical temperature threshold of approximately 24 °C also exacerbated salinization. Previous studies have shown that rising temperatures under climate warming increase precipitation variability [78], and modest increases in effective precipitation only slightly mitigate salinization. This pattern is consistent with the regional trend of warming and humidification, with mean annual temperature in Xinjiang rising by about 0.32 °C per decade and precipitation increasing by approximately 9.24 mm per decade during 1960–2019 [79]. This warming–wetting trend explains the growing role of precipitation in moderating salinity. Overall, climate factors continued to dominate salinization dynamics, with increasing evapotranspiration intensifying surface soil salinity, while greater precipitation partially offset salt accumulation through leaching, jointly shaping the dynamic balance of water and salt at the land surface [5].

4.3. Future Challenges and Perspectives

This study not only characterized the dynamics of soil salinization using multi-temporal remote sensing inversion but also quantified the relative contributions of climate and soil texture through machine learning models, providing an important methodological supplement to previous studies that relied mainly on field surveys or single-period data. However, it should be noted that soil salinization in southern Xinjiang is influenced not only by climatic and textural factors but also by natural and anthropogenic drivers. The region’s shallow groundwater table, coupled with high mineralization and poor soil permeability, facilitates upward capillary movement of saline groundwater, leading to the surface accumulation of salts [80,81,82]. Meanwhile, long-term irrigation practices and insufficient drainage further exacerbate secondary salinization. While this study primarily focused on the roles of climate and soil texture, future research should integrate multi-source data—including groundwater depth, irrigation methods, and soil hydraulic properties—to enhance the explanatory power of salinization-driving mechanisms. Moreover, the approach applied here may not be directly applicable to coastal regions, underscoring the need for developing more generalized models. Future work should also address the vertical distribution and temporal dynamics of soil profile salinity to more comprehensively capture salinization processes across both spatial and depth dimensions. For areas with localized salinity reoccurrence and fluctuating moderate-to-severe salinization, long-term monitoring and zonal management should be strengthened to achieve precise and sustainable water–salt regulation. Overall, this study confirmed the alleviation of soil salinization in southern Xinjiang and clarified the dominant roles of climate and soil texture across multiple temporal scales, providing essential data support for improving salinization management strategies in arid regions.

5. Conclusions

This study, based on multi-source remote sensing data and the Random Forest (RF) model, elucidated the spatiotemporal dynamics of soil salinization in southern Xinjiang from 2008 to 2023 and its response mechanisms to climate and soil texture. The main conclusions are as follows:
(1) By constructing RF models with spectral indices extracted from Landsat and Sentinel imagery, the accuracy of salinization inversion was substantially improved. The optimized model using selected Landsat variables achieved an R2 of 0.747, confirming the effectiveness of redundant variable elimination and sensor–source matching strategies in enhancing model performance.
(2) The four-phase inversion results from 2008 to 2023 demonstrated a sustained decline in soil salinity, with mean SSC decreasing from 16.37 g·kg−1 to 8.03 g·kg−1. The trend showed a marked decline during 2008–2013, followed by a relatively slower yet sustained decrease thereafter. Non-salinized and slightly salinized areas expanded considerably, with 78.6% of the region exhibiting a decreasing salinity trend.
(3) The BRT model quantified the relative contributions of environmental drivers, showing that climatic factors consistently acted as the dominant drivers, with their contribution increasing from 65.2% in 2008 to 66.8% in 2023. The influence of potential evapotranspiration weakened, whereas the roles of temperature and precipitation became increasingly prominent. Among soil texture variables, silt and sand contents exerted significant effects on salinity accumulation under specific thresholds.
In conclusion, this study developed a robust method for long-term monitoring of soil salinity in arid environments and elucidated the dominant influences of climate variability and soil texture on salinization processes. The results offer empirical evidence and practical guidance for combating soil degradation and designing adaptive, region-specific management strategies in arid regions.

Author Contributions

Conceptualization, J.Z. and H.W.; methodology, Y.F.; software, J.Z.; validation, Y.F., H.G. and Y.F.; formal analysis, Y.F.; investigation, P.W. and Z.Z.; resources, C.L.; data curation, H.W. and J.Z.; writing—original draft preparation, J.Z.; writing—review and editing, Y.F.; visualization, J.Z.; supervision, Y.F.; project administration, H.W.; funding acquisition, H.W. All authors have read and agreed to the published version of the manuscript.

Funding

Integration and Demonstration of Technical Models for Soil Improvement and Capacity Enhancement in Northwest Saline Soil Area 2023YFD1901503.

Data Availability Statement

The raw data supporting the conclusions of this article will be made available by the authors on request.

Conflicts of Interest

The authors declare no conflicts of interest.

References

  1. Scudiero, E.; Skaggs, T.H.; Corwin, D.L. Regional-scale soil salinity assessment using Landsat ETM+ canopy reflectance. Remote Sens. Environ. 2015, 169, 335–343. [Google Scholar] [CrossRef]
  2. Scudiero, E.; Skaggs, T.; Corwin, D. Regional scale soil salinity evaluation using Landsat 7, western San Joaquin Valley, California, USA. Geoderma Reg. 2014, 2, 82–90. [Google Scholar] [CrossRef]
  3. Sarkar, S.K.; Rudra, R.R.; Sohan, A.R.; Das, P.C.; Ekram, K.M.M.; Talukdar, S.; Rahman, A.; Alam, E.; Islam, M.K.; Islam, A.R.M.T. Coupling of machine learning and remote sensing for soil salinity mapping in coastal area of Bangladesh. Sci. Rep. 2023, 13, 17056. [Google Scholar] [CrossRef] [PubMed]
  4. Peng, J.; Biswas, A.; Jiang, Q.; Zhao, R.; Hu, J.; Hu, B.; Shi, Z. Estimating soil salinity from remote sensing and terrain data in southern Xinjiang Province, China. Geoderma 2019, 337, 1309–1319. [Google Scholar] [CrossRef]
  5. Zhang, M.; Fan, X.; Gao, P.; Guo, L.; Huang, X.; Gao, X.; Pang, J.; Tan, F. Monitoring Soil Salinity in Arid Areas of Northern Xinjiang Using Multi-Source Satellite Data: A Trusted Deep Learning Framework. Land 2025, 14, 110. [Google Scholar] [CrossRef]
  6. Peng, B.; Dong, R.; He, Y.; Liu, Y.; Zhao, Y. Influence of Groundwater Depth on Soil Ion Distribution in the Agricultural Irrigation Areas of Northwest China. Agriculture 2025, 15, 747. [Google Scholar] [CrossRef]
  7. Wang, G.; Guo, H.; Zhu, Q.; An, D.; Song, Z.; Ma, L. Optimizing Subsurface Drainage Pipe Layout Parameters in Southern Xinjiang’s Saline–Alkali Soils: Impacts on Soil Salinity Dynamics and Oil Sunflower Growth Performance. Sustainability 2025, 17, 4797. [Google Scholar] [CrossRef]
  8. Hassani, A.; Azapagic, A.; Shokri, N. Global predictions of primary soil salinization under changing climate in the 21st century. Nat. Commun. 2021, 12, 6663. [Google Scholar] [CrossRef]
  9. Kaplan, G.; Gašparović, M.; Alqasemi, A.S.; Aldhaheri, A.; Abuelgasim, A.; Ibrahim, M. Soil salinity prediction using machine learning and sentinel–2 remote sensing data in hyper–arid areas. Phys. Chem. Earth Parts A/B/C 2023, 130, 103400. [Google Scholar] [CrossRef]
  10. Wei, Q.; Nurmemet, I.; Gao, M.; Xie, B. Inversion of soil salinity using multisource remote sensing data and particle swarm machine learning models in Keriya Oasis, northwestern China. Remote Sens. 2022, 14, 512. [Google Scholar] [CrossRef]
  11. Xiong, J.; Ge, X.; Ding, J.; Wang, J.; Zhang, Z.; Zhu, C.; Han, L.; Wang, J. Optimal time-window for assessing soil salinity via Sentinel-2 multitemporal synthetic data in the arid agricultural regions of China. Ecol. Indic. 2025, 176, 113642. [Google Scholar] [CrossRef]
  12. Xie, J.; Shi, C.; Liu, Y.; Wang, Q.; Zhong, Z.; He, S.; Wang, X. Soil salinization prediction through feature selection and machine learning at the irrigation district scale. Front. Earth Sci. 2025, 12, 1488504. [Google Scholar] [CrossRef]
  13. Li, J.; Ding, J.; Tan, J.; Wang, J.; Han, L.; Cui, K. Estimating soil salinity in cotton fields using UAV multispectral remote sensing and SSA–SVM optimised machine learning model. Int. J. Digit. Earth 2025, 18, 2548378. [Google Scholar] [CrossRef]
  14. Zhou, J.; Chen, L.; Hu, T.; Lu, H.; Shi, Y.; Chen, L. The comparative study of machine learning agent models in flood forecasting for tidal river reaches. Sci. Rep. 2025, 15, 1–17. [Google Scholar] [CrossRef]
  15. Wang, F.; Yang, S.; Wei, Y.; Shi, Q.; Ding, J. Characterizing soil salinity at multiple depth using electromagnetic induction and remote sensing data with random forests: A case study in Tarim River Basin of southern Xinjiang, China. Sci. Total Environ. 2021, 754, 142030. [Google Scholar] [CrossRef]
  16. Chen, H.; Wu, J.; Xu, C. Optimization of Multi-Source Remote Sensing Soil Salinity Estimation Based on Different Salinization Degrees. Remote Sens. 2025, 17, 1315. [Google Scholar] [CrossRef]
  17. Zhang, J.; Ge, X.; Hou, X.; Han, L.; Zhang, Z.; Feng, W.; Zhou, Z.; Luo, X. Strategies for Soil Salinity Mapping Using Remote Sensing and Machine Learning in the Yellow River Delta. Remote Sens. 2025, 17, 2619. [Google Scholar] [CrossRef]
  18. Metwaly, M.M.; AbdelRahman, M.A.; Mohamed, S.A. A machine learning model and multi-temporal remote sensing for sustainable soil management in Egypt’s Western Nile delta. Earth Syst. Environ. 2024, 127894. [Google Scholar] [CrossRef]
  19. Golestani, M.; Ghahfarokhi, Z.M.; Esfandiarpour-Boroujeni, I.; Shirani, H. Evaluating the spatiotemporal variations of soil salinity in Sirjan Playa, Iran using Sentinel-2A and Landsat-8 OLI imagery. Catena 2023, 231, 107375. [Google Scholar] [CrossRef]
  20. Akca, E.; Aydin, M.; Kapur, S.; Kume, T.; Nagano, T.; Watanabe, T.; Cilek, A.; Zorlu, K. Long-term monitoring of soil salinity in a semi-arid environment of Turkey. Catena 2020, 193, 104614. [Google Scholar] [CrossRef]
  21. Shokri, N.; Hassani, A.; Sahimi, M. Multi-scale soil salinization dynamics from global to pore scale: A review. Rev. Geophys. 2024, 62, e2023RG000804. [Google Scholar] [CrossRef]
  22. Li, X.; Chang, S.X.; Salifu, K.F. Soil texture and layering effects on water and salt dynamics in the presence of a water table: A review. Environ. Rev. 2014, 22, 41–50. [Google Scholar] [CrossRef]
  23. Corwin, D.L. Climate change impacts on soil salinity in agricultural areas. Eur. J. Soil Sci. 2021, 72, 842–862. [Google Scholar] [CrossRef]
  24. Eswar, D.; Karuppusamy, R.; Chellamuthu, S. Drivers of soil salinity and their correlation with climate change. Curr. Opin. Environ. Sustain. 2021, 50, 310–318. [Google Scholar] [CrossRef]
  25. Szypłowska, A.; Lewandowski, A.; Jones, S.B.; Sabouroux, P.; Szerement, J.; Kafarski, M.; Wilczek, A.; Skierucha, W. Impact of soil salinity, texture and measurement frequency on the relations between soil moisture and 20 MHz–3 GHz dielectric permittivity spectrum for soils of medium texture. J. Hydrol. 2019, 579, 124155. [Google Scholar] [CrossRef]
  26. Ma, Z.; Ge, Y.; Pang, B.; Liang, W.; Ruze, T. Characteristics of soil salinity and water-salt transport in the vadose zone of salt-impacted regions with variable permeability. Environ. Geochem. Health 2024, 46, 442. [Google Scholar] [CrossRef]
  27. Zhang, Y.; Ye, H.; Liu, R.; Nie, C.; Tang, M.; Huang, Y.; Wang, H.; Zhao, X.; Wang, W.; Lyu, Z. Spatiotemporal variability of soil salinity and the driving factors of cultivated land in Xinjiang, China. Int. J. Agric. Biol. Eng. 2025, 18, 197–207. [Google Scholar] [CrossRef]
  28. Yu, H.; Cooper, A.R.; Infante, D.M. Improving species distribution model predictive accuracy using species abundance: Application with boosted regression trees. Ecol. Model. 2020, 432, 109202. [Google Scholar] [CrossRef]
  29. Huang, Y.; Zhao, Y.; Gong, B.; Yang, J.; Li, Y. Effects of Potential Large-Scale Irrigation on Regional Precipitation in Northwest China. Remote Sens. 2023, 16, 58. [Google Scholar] [CrossRef]
  30. Zhang, J.; Zhang, P.; Deng, X.; Ren, C.; Deng, M.; Wang, S.; Lai, X.; Long, A. Study on the Spatial and Temporal Trends of Ecological Environment Quality and Influencing Factors in Xinjiang Oasis. Remote Sens. 2024, 16, 1980. [Google Scholar] [CrossRef]
  31. Su, T.; Wang, X.; Ning, S.; Sheng, J.; Jiang, P.; Gao, S.; Yang, Q.; Zhou, Z.; Cui, H.; Li, Z. Enhancing Soil Salinity Evaluation Accuracy in Arid Regions: An Integrated Spatiotemporal Data Fusion and AI Model Approach for Arable Lands. Land 2024, 13, 1837. [Google Scholar] [CrossRef]
  32. Allbed, A.; Kumar, L.; Aldakheel, Y.Y. Assessing soil salinity using soil salinity and vegetation indices derived from IKONOS high-spatial resolution imageries: Applications in a date palm dominated region. Geoderma 2014, 230, 1–8. [Google Scholar] [CrossRef]
  33. Abbas, A.; Khan, S. Using remote sensing techniques for appraisal of irrigated soil salinity. In Proceedings of the International Congress on Modelling and Simulation (MODSIM), Christchurch, New Zealand, 10–13 December 2007; pp. 2632–2638. [Google Scholar]
  34. Nicolas, H.; Walter, C. Detecting salinity hazards within a semiarid context by means of combining soil and remote-sensing data. Geoderma 2006, 134, 217–230. [Google Scholar] [CrossRef]
  35. Khan, N.M.; Rastoskuev, V.V.; Sato, Y.; Shiozawa, S. Assessment of hydrosaline land degradation by using a simple approach of remote sensing indicators. Agric. Water Manag. 2005, 77, 96–109. [Google Scholar] [CrossRef]
  36. Al-Khaier, F. Soil salinity detection using satellite remote sensing. Geo-Inf. Sci. Earth Obs. 2003, 1–70. [Google Scholar]
  37. Khan, N.M.; Rastoskuev, V.V.; Shalina, E.V.; Sato, Y. Mapping salt-affected soils using remote sensing indicators—A simple approach with the use of GIS IDRISI. In Proceedings of the 22nd Asian Conference on Remote Sensing, Singapore, 5–9 November 2001. [Google Scholar]
  38. Guo, B.; Yang, X.; Yang, M.; Sun, D.; Zhu, W.; Zhu, D.; Wang, J. Mapping soil salinity using a combination of vegetation index time series and single-temporal remote sensing images in the Yellow River Delta, China. Catena 2023, 231, 107313. [Google Scholar] [CrossRef]
  39. Camps-Valls, G.; Campos-Taberner, M.; Moreno-Martínez, Á.; Walther, S.; Duveiller, G.; Cescatti, A.; Mahecha, M.D.; Muñoz-Marí, J.; García-Haro, F.J.; Guanter, L. A unified vegetation index for quantifying the terrestrial biosphere. Sci. Adv. 2021, 7, eabc7447. [Google Scholar] [CrossRef]
  40. Taghizadeh-Mehrjardi, R.; Minasny, B.; Sarmadian, F.; Malone, B. Digital mapping of soil salinity in Ardakan region, central Iran. Geoderma 2014, 213, 15–28. [Google Scholar] [CrossRef]
  41. Yan, K.; Gao, S.; Chi, H.; Qi, J.; Song, W.; Tong, Y.; Mu, X.; Yan, G. Evaluation of the vegetation-index-based dimidiate pixel model for fractional vegetation cover estimation. IEEE Trans. Geosci. Remote Sens. 2021, 60, 1–14. [Google Scholar] [CrossRef]
  42. Zeng, Y.; Hao, D.; Huete, A.; Dechant, B.; Berry, J.; Chen, J.M.; Joiner, J.; Frankenberg, C.; Bond-Lamberty, B.; Ryu, Y. Optical vegetation indices for monitoring terrestrial ecosystems globally. Nat. Rev. Earth Environ. 2022, 3, 477–493. [Google Scholar] [CrossRef]
  43. Crippen, R.E. Calculating the vegetation index faster. Remote Sens. Environ. 1990, 34, 71–73. [Google Scholar] [CrossRef]
  44. Wu, W.; Al-Shafie, W.M.; Mhaimeed, A.S.; Ziadat, F.; Nangia, V.; Payne, W.B. Soil salinity mapping by multiscale remote sensing in Mesopotamia, Iraq. IEEE J. Sel. Top. Appl. Earth Obs. Remote Sens. 2014, 7, 4442–4452. [Google Scholar] [CrossRef]
  45. Fern, R.R.; Foxley, E.A.; Bruno, A.; Morrison, M.L. Suitability of NDVI and OSAVI as estimators of green biomass and coverage in a semi-arid rangeland. Ecol. Indic. 2018, 94, 16–21. [Google Scholar] [CrossRef]
  46. Ren, H.; Zhou, G.; Zhang, F. Using negative soil adjustment factor in soil-adjusted vegetation index (SAVI) for aboveground living biomass estimation in arid grasslands. Remote Sens. Environ. 2018, 209, 439–445. [Google Scholar] [CrossRef]
  47. Xu, H.; Sun, H.; Xu, Z.; Wang, Y.; Zhang, T.; Wu, D.; Gao, J. kNDMI: A kernel normalized difference moisture index for remote sensing of soil and vegetation moisture. Remote Sens. Environ. 2025, 319, 114621. [Google Scholar] [CrossRef]
  48. Haboudane, D.; Miller, J.R.; Pattey, E.; Zarco-Tejada, P.J.; Strachan, I.B. Hyperspectral vegetation indices and novel algorithms for predicting green LAI of crop canopies: Modeling and validation in the context of precision agriculture. Remote Sens. Environ. 2004, 90, 337–352. [Google Scholar] [CrossRef]
  49. Abatzoglou, J.T.; Dobrowski, S.Z.; Parks, S.A.; Hegewisch, K.C. TerraClimate, a high-resolution global dataset of monthly climate and climatic water balance from 1958–2015. Sci. Data 2018, 5, 1–12. [Google Scholar] [CrossRef]
  50. Funk, C.; Peterson, P.; Landsfeld, M.; Pedreros, D.; Verdin, J.; Shukla, S.; Husak, G.; Rowland, J.; Harrison, L.; Hoell, A. The climate hazards infrared precipitation with stations—A new environmental record for monitoring extremes. Sci. Data 2015, 2, 1–21. [Google Scholar] [CrossRef]
  51. Muñoz-Sabater, J.; Dutra, E.; Agustí-Panareda, A.; Albergel, C.; Arduini, G.; Balsamo, G.; Boussetta, S.; Choulga, M.; Harrigan, S.; Hersbach, H. ERA5-Land: A state-of-the-art global reanalysis dataset for land applications. Earth Syst. Sci. Data 2021, 13, 4349–4383. [Google Scholar] [CrossRef]
  52. Hengl, T.; Mendes de Jesus, J.; Heuvelink, G.B.; Ruiperez Gonzalez, M.; Kilibarda, M.; Blagotić, A.; Shangguan, W.; Wright, M.N.; Geng, X.; Bauer-Marschallinger, B. SoilGrids250m: Global gridded soil information based on machine learning. PLoS ONE 2017, 12, e0169748. [Google Scholar] [CrossRef]
  53. Jia, P.; Zhang, J.; He, W.; Hu, Y.; Zeng, R.; Zamanian, K.; Jia, K.; Zhao, X. Combination of hyperspectral and machine learning to invert soil electrical conductivity. Remote Sens. 2022, 14, 2602. [Google Scholar] [CrossRef]
  54. Gao, S.; Lü, Y.; Jiang, X. Increased precipitation and vegetation cover synergistically enhanced the availability and effectiveness of water resources in a dryland region. J. Hydrol. 2025, 654, 132812. [Google Scholar] [CrossRef]
  55. Yang, X.; Meng, F.; Fu, P.; Zhang, Y.; Liu, Y. Spatiotemporal change and driving factors of the Eco-Environment quality in the Yangtze River Basin from 2001 to 2019. Ecol. Indic. 2021, 131, 108214. [Google Scholar] [CrossRef]
  56. Breiman, L.; Friedman, J.; Olshen, R.A.; Stone, C.J. Classification and Regression Trees; Routledge: New York, NY, USA, 2017. [Google Scholar]
  57. Zhou, K.; Zheng, X.; Huang, S.; Li, H.; Yin, H. Quantifying the combined and individual impacts of climate and human activity on the urban green space carbon sink capacity in Beijing. Sustain. Cities Soc. 2025, 122, 106253. [Google Scholar] [CrossRef]
  58. Wang, N.; Chen, S.; Huang, J.; Frappart, F.; Taghizadeh, R.; Zhang, X.; Wigneron, J.-P.; Xue, J.; Xiao, Y.; Peng, J. Global soil salinity estimation at 10 m using multi-source remote sensing. J. Remote Sens. 2024, 4, 0130. [Google Scholar] [CrossRef]
  59. Zhang, S.; Tian, J.; Lu, X.; Tian, Q. Temporal and spatial dynamics distribution of organic carbon content of surface soil in coastal wetlands of Yancheng, China from 2000 to 2022 based on Landsat images. Catena 2023, 223, 106961. [Google Scholar] [CrossRef]
  60. Shi, C.; Chao, G.; Bin, X.; Yunxiang, J.; Jinya, L.; Hailong, M.; Fen, Z.; Jian, G.; Xiuchun, Y. Quantitative inversion of soil salinity and analysis of its spatial pattern in agricultural area in Shihezi of Xinjiang. Geogr. Res. 2015, 33, 2135–2144. [Google Scholar]
  61. Wang, Z.; Chen, R.; Li, W.; Zhang, J.; Zhang, J.; Song, L.; Wang, J.; Li, H.; Mou, H.; Li, Z. Mulched drip irrigation: A promising practice for sustainable agriculture in China’s arid region. Npj Sustain. Agric. 2024, 2, 17. [Google Scholar] [CrossRef]
  62. Shao, J.; Li, S.; Yang, X.; Zhang, F.; Yang, H.; Peng, Z.; Zulfiqar, T. Evaluating soil salinity dynamics under drip irrigation in the Manas River Basin, Xinjiang: A long-term analysis (1996–2019). PeerJ 2025, 13, e19295. [Google Scholar] [CrossRef]
  63. Zhao, L.; Heng, T.; Yang, L.; Xu, X.; Feng, Y. Study on the farmland improvement effect of drainage measures under film mulch with drip irrigation in saline–alkali land in arid areas. Sustainability 2021, 13, 4159. [Google Scholar] [CrossRef]
  64. Mirzaee, S.; Nafchi, A.M.; Ostovari, Y.; Seifi, M.; Ghorbani-Dashtaki, S.; Khodaverdiloo, H.; Chakherlou, S.; Taghizadeh-Mehrjardi, R.; Raei, B. Monitoring and assessment of spatiotemporal soil salinization in the Lake Urmia region. Environ. Monit. Assess. 2024, 196, 958. [Google Scholar] [CrossRef]
  65. Muhetaer, N.; Nurmemet, I.; Abulaiti, A.; Xiao, S.; Zhao, J. A quantifying approach to soil salinity based on a radar feature space model using ALOS PALSAR-2 data. Remote Sens. 2022, 14, 363. [Google Scholar] [CrossRef]
  66. Wang, Z.; Zhang, F.; Zhang, X.; Chan, N.W.; Kung, H.-T.; Ariken, M.; Zhou, X.; Wang, Y. Regional suitability prediction of soil salinization based on remote-sensing derivatives and optimal spectral index. Sci. Total Environ. 2021, 775, 145807. [Google Scholar] [CrossRef] [PubMed]
  67. Saad, K.; Kallel, A.; Castaldi, F.; Sahli Chahed, T. Soil Salinity Detection and Mapping by Multi-Temporal Landsat Data: Zaghouan Case Study (Tunisia). Remote Sens. 2024, 16, 4761. [Google Scholar] [CrossRef]
  68. Madani, A.A. Soil salinity detection and monitoring using Landsat data: A case study from Siwa Oasis, Egypt. GIScience Remote Sens. 2005, 42, 171–181. [Google Scholar] [CrossRef]
  69. Bannari, A.; Musa, N.H.M.; Abuelgasim, A.; El-Battay, A. Sentinel-msi and landsat-oli data quality characterization for high temporal frequency monitoring of soil salinity dynamic in an arid landscape. IEEE J. Sel. Top. Appl. Earth Obs. Remote Sens. 2020, 13, 2434–2450. [Google Scholar] [CrossRef]
  70. Allbed, A.; Kumar, L. Soil salinity mapping and monitoring in arid and semi-arid regions using remote sensing technology: A review. Adv. Remote Sens. 2013, 2, 373–385. [Google Scholar] [CrossRef]
  71. Xu, H.; Ren, M.; Lin, M. Cross-comparison of Landsat-8 and Landsat-9 data: A three-level approach based on underfly images. GIScience Remote Sens. 2024, 61, 2318071. [Google Scholar] [CrossRef]
  72. Ma, S.; He, B.; Xie, B.; Ge, X.; Han, L. Investigation of the spatial and temporal variation of soil salinity using Google Earth Engine: A case study at Werigan–Kuqa Oasis, West China. Sci. Rep. 2023, 13, 2754. [Google Scholar] [CrossRef]
  73. Wang, Y.; Yang, P.; Wang, H.; Zhou, L.; Li, X.; Li, Z. Study on the evolution of ecological environment and irrigation behavior since mulched drip irrigation in Yanqi basin, Xinjiang. Sci. Rep. 2025, 15, 14778. [Google Scholar] [CrossRef]
  74. Okur, B.; Örçen, N. Soil salinization and climate change. In Climate Change and Soil Interactions; Elsevier: Amsterdam, The Netherlands, 2020; pp. 331–350. [Google Scholar]
  75. Zhang, W.T.; Wu, H.Q.; Gu, H.B.; Feng, G.L.; Wang, Z.; Sheng, J.D. Variability of soil salinity at multiple spatio-temporal scales and the related driving factors in the oasis areas of Xinjiang, China. Pedosphere 2014, 24, 753–762. [Google Scholar] [CrossRef]
  76. McCauley, A.; Jones, C. Salinity and sodicity management. Soil Water Manag. Modul. 2005, 2, 4481–4482. [Google Scholar]
  77. Gerardo, R.; de Lima, I.P. Sentinel-2 satellite imagery-based assessment of soil salinity in irrigated rice fields in Portugal. Agriculture 2022, 12, 1490. [Google Scholar] [CrossRef]
  78. Zhang, W.; Furtado, K.; Wu, P.; Zhou, T.; Chadwick, R.; Marzin, C.; Rostron, J.; Sexton, D. Increasing precipitation variability on daily-to-multiyear time scales in a warmer world. Sci. Adv. 2021, 7, eabf8021. [Google Scholar] [CrossRef] [PubMed]
  79. Zhou, G.; Chen, Y.; Yao, J. Variations in precipitation and temperature in Xinjiang (Northwest China) and their connection to atmospheric circulation. Front. Earth Sci. 2022, 10, 1082713. [Google Scholar] [CrossRef]
  80. Li, S.; Nurmemet, I.; Seydehmet, J.; Lv, X.; Aili, Y.; Yu, X. Spatiotemporal Dynamics and Driving Factors of Soil Salinization: A Case Study of the Yutian Oasis, Xinjiang, China. Land 2024, 13, 1941. [Google Scholar] [CrossRef]
  81. Guo, H.; Wang, G.; Song, Z.; Xu, P.; Li, X.; Ma, L. Optimization of Subsurface Drainage Parameters in Saline–Alkali Soils to Improve Salt Leaching Efficiency in Farmland in Southern Xinjiang. Agronomy 2025, 15, 1222. [Google Scholar] [CrossRef]
  82. Xu, Z.; Wallach, R.; Mao, X. Understanding evaporation from salinized soils in Xinjiang: Impact of sodium adsorption ratio, salt type, and concentrations. Soil Sci. Soc. Am. J. 2025, 89, e20796. [Google Scholar] [CrossRef]
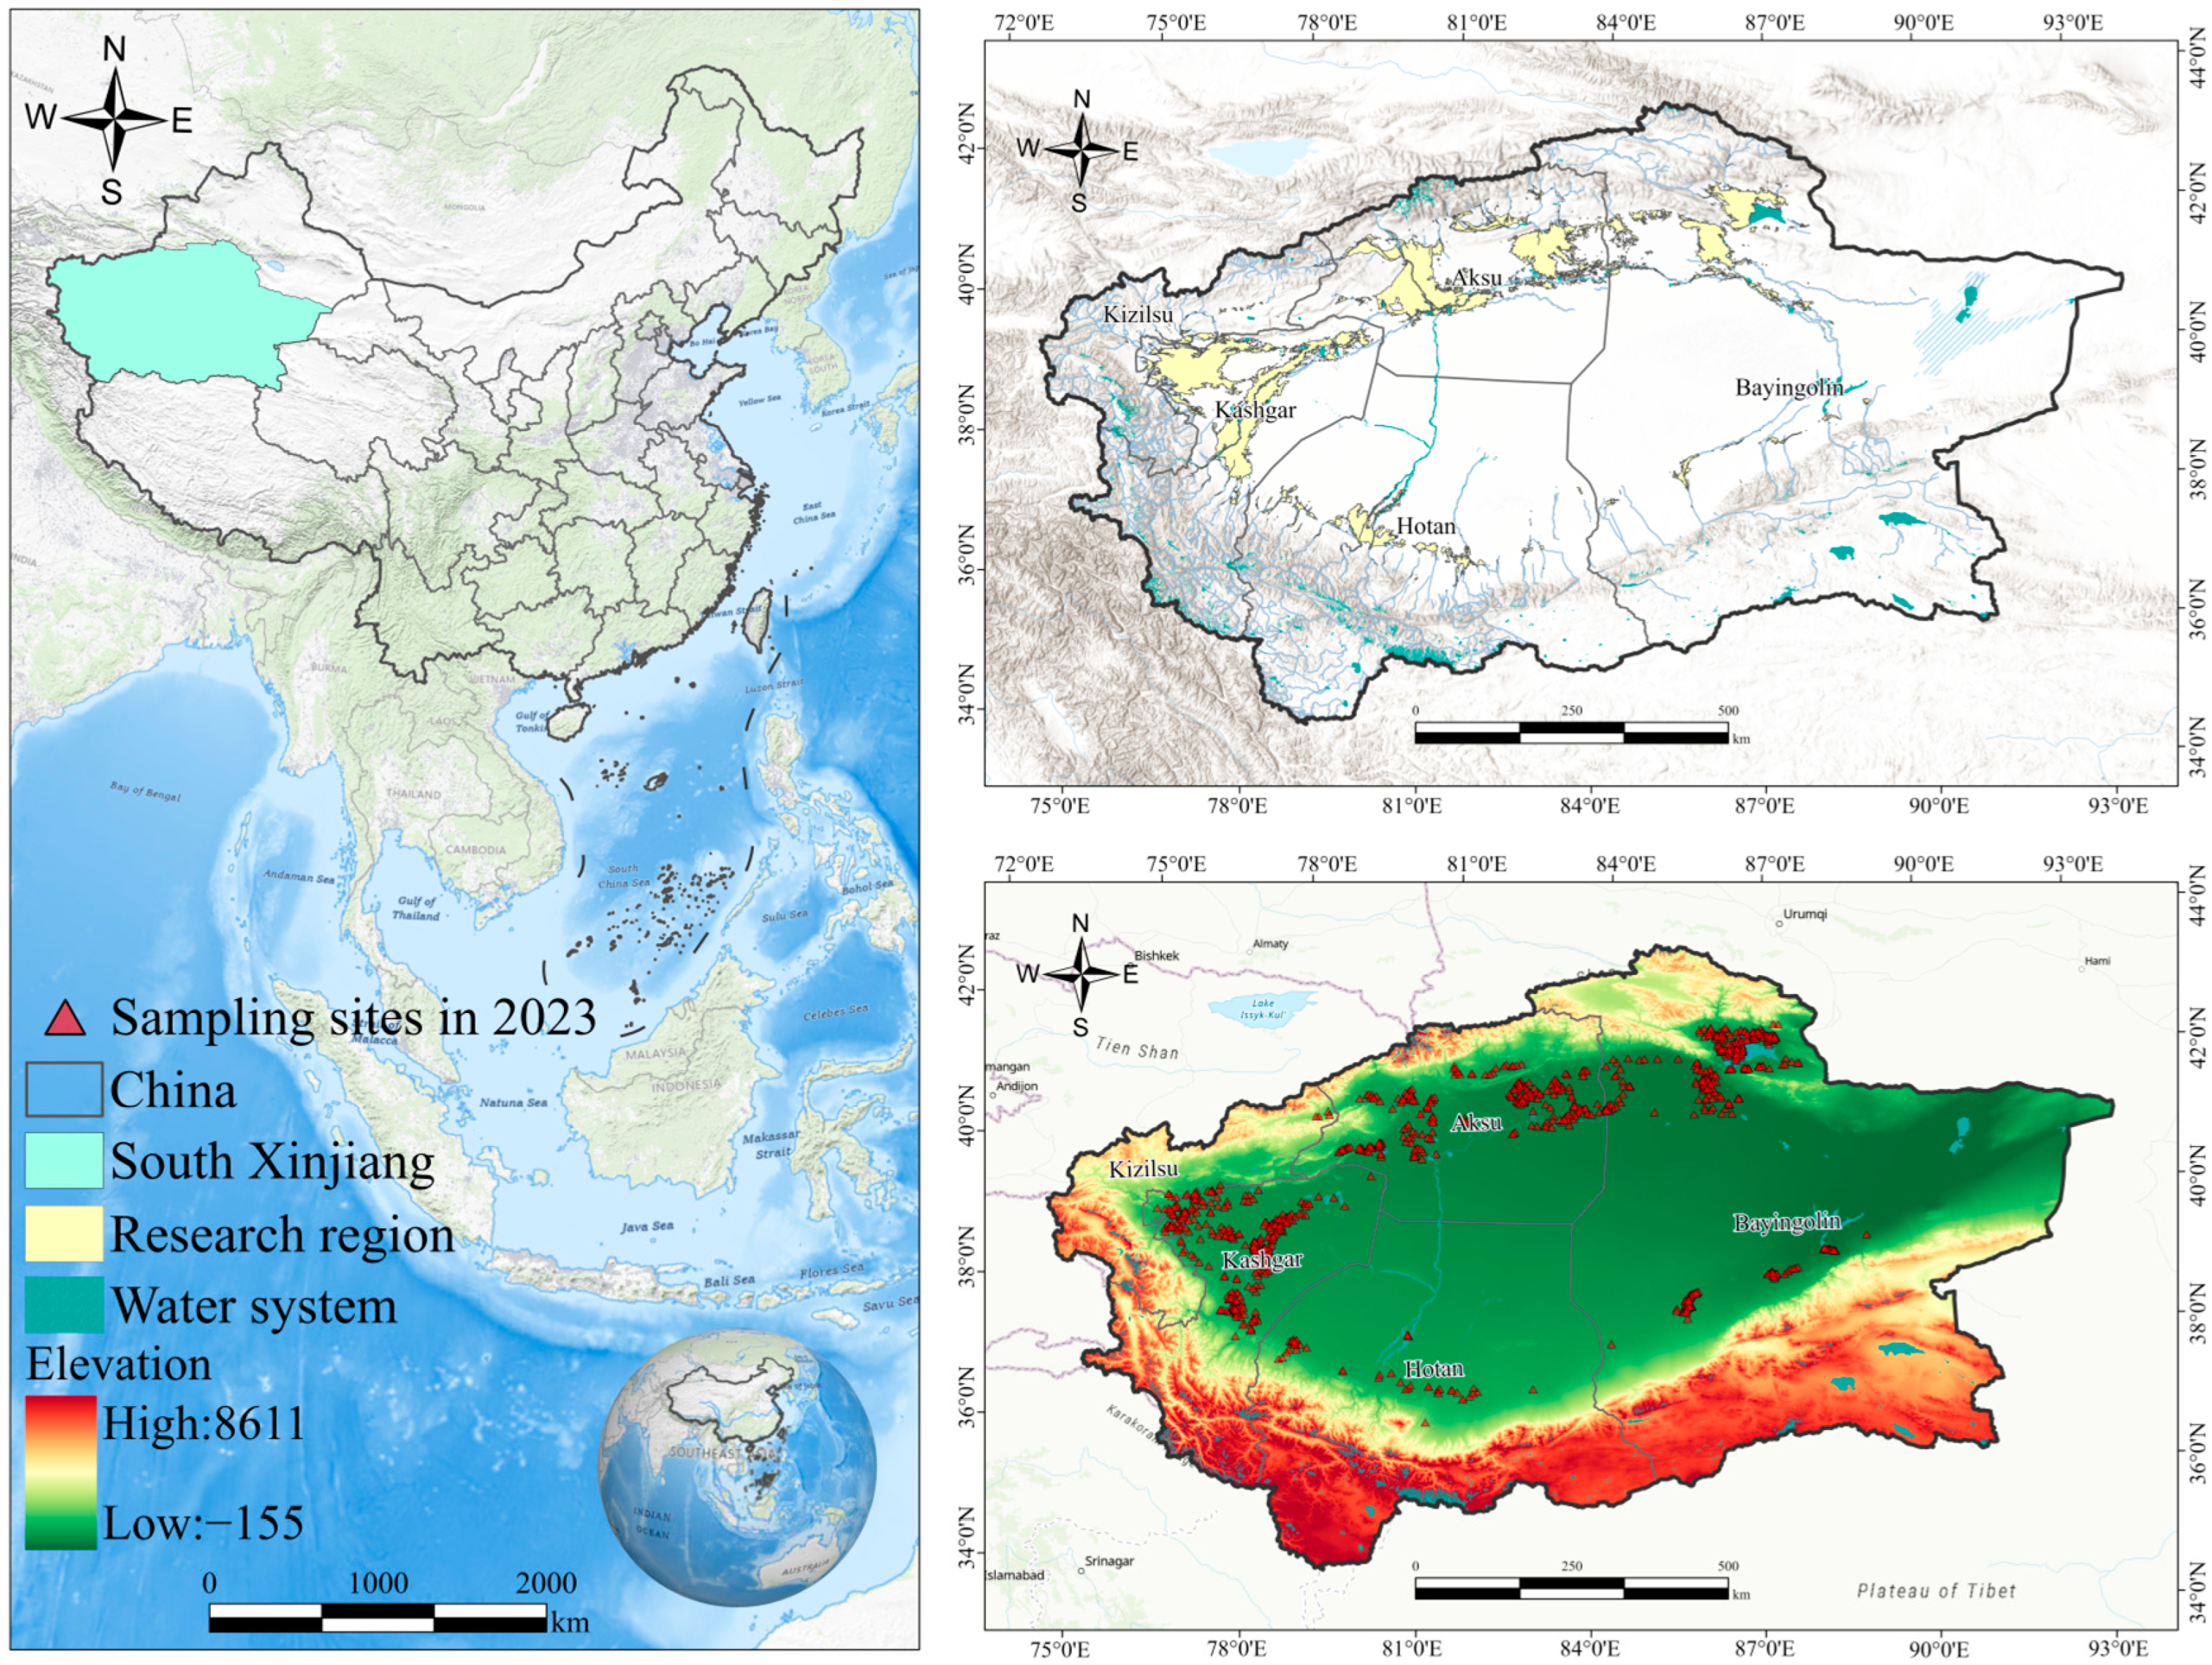
Figure 1. Geographical extent of the study.
Remotesensing 17 03812 g001
Figure 2. The workflow of this study.
Remotesensing 17 03812 g002
Figure 3. Salinity distribution across sampling points.
Remotesensing 17 03812 g003
Figure 4. Distribution of sampling points on the USDA soil texture triangle.
Remotesensing 17 03812 g004
Figure 5. Distribution Variable importance rankings of vegetation and salinity indices derived from Random Forest models using Landsat-9 and Sentinel-2 data. (a) Importance ranking of vegetation indices derived from Landsat-9 imagery; (b) salinity indices derived from Landsat-9 imagery; (c) vegetation indices derived from Sentinel-2 imagery; (d) salinity indices derived from Sentinel-2 imagery.
Remotesensing 17 03812 g005
Figure 6. Model accuracy evaluation.
Remotesensing 17 03812 g006
Figure 7. Spatial distribution of SSC from 2008 to 2023: (a) 2008; (b) 2013; (c) 2018; (d) 2023.
Remotesensing 17 03812 g007
Figure 8. Proportional distribution of soil salinization classes from 2008 to 2023: (a) 2008; (b) 2013; (c) 2018; (d) 2023.
Remotesensing 17 03812 g008
Figure 9. Spatiotemporal trend analysis of soil salinization during 2008–2023.
Remotesensing 17 03812 g009
Figure 10. Transition of soil salinization classes from 2008 to 2023.
Remotesensing 17 03812 g010
Figure 11. Relative contributions and partial dependence plots of climate factors and soil texture on soil salinization in southern Xinjiang. (a) 2008; (b) 2013; (c) 2018; (d) 2023.
Remotesensing 17 03812 g011aRemotesensing 17 03812 g011bRemotesensing 17 03812 g011c
Figure 12. Relative contributions of climate factors and soil texture to soil salinity. (a) Contribution rates of individual factors; (b) Aggregated contributions of climate and soil texture.
Remotesensing 17 03812 g012
Table 1. Formulas of the spectral indices used for soil salinization inversion and their corresponding references.
CategoryVariableFormulaReference
Salinity indicesSI1 Blue × R [32]
SI2 ( Blue × R ) / Green [33]
SI3 ( Green × R ) / Blue [33]
SI4 ( Blue × R ) / 2 [34]
SI5 Green 2 × R 2 + NIR 2 [34]
SI6 Green × R [35]
SI7 ( SWIR 1 × SWIR 2 SWIR 2 × SWIR 2 ) / SWIR 1 [36]
SI-T R / NIR × 100 [32]
NDSI R NIR / R + NIR [37]
CRSI ( ( NIR × R G × B ) / ( NIR × R + G × B ) ) 0.5 [38]
Vegetation indiceskNDVI t a n h ( NDVI 2 ) [39]
NDVI ( NIR R ) / ( NIR + R ) [40]
DVI NIR R [41]
EVI 2.5 × ( NIR R ) / ( NIR + 6 × R 7.5 × Blue + 1 ) ) [42]
IPVI NIR / ( NIR + R ) [43]
GDVI ( NIR 2 R 2 ) / ( NIR 2 + R 2 )[44]
OSAVI ( 1.16 × ( NIR R ) ) / ( NIR + R + 0.16 ) [45]
SAVI [ NIR R NIR + R + L × 1 + L ] [46]
kNDMI 1 3 2   k ϱ BLUE , ϱ RED 2   k ϱ BLUE , ϱ SWIR 2 + k ϱ RED , ϱ SWIR 2 3 + 2   k ϱ BLUE , ϱ RED + 2   k ϱ BLUE , ϱ SWIR 2 + k ϱ RED , ϱ SWIR 2 [47]
MSAVI 2 NIR + 1 2 NIR + 1 2 8 NIR R / 2 [48]
Table 2. Sources and spatial resolution of climate and soil texture data.
CategoryVariableData SourceSpatial ResolutionReference
Climatic factorsPotential evapotranspiration (PET)TerraClimate1/24°[49]
PrecipitationCHIRPS0.05°[50]
Mean air temperatureERA5-Land0.1°[51]
Soil textureClay, Sand, SiltSoilGrids250 m[52]
Table 3. Criteria for soil salinity classification.
Degree of Soil SalinizationNon-SalinizedSlight SalinizedModerately SalinizedSeverely SalinizedSaline Soil
(SSC, g·kg−1)0 ≤ SSC < 33 ≤ SSC < 66 ≤ SSC < 1010 ≤ SSC < 20SSC ≥ 20
Table 4. Descriptive statistics of Soil salt content in 2023 (g·kg−1).
Salinization LevelMinMaxMeanSDMedianCV
Non-salinized0.303.001.550.741.5047.61
Slight salinized3.016.004.290.874.2020.34
Moderately salted6.0710.007.751.097.7014.03
Severely salinized10.1019.8013.212.6512.5520.10
Saline soil20.3058.3032.4110.3230.9531.85
Disclaimer/Publisher’s Note: The statements, opinions and data contained in all publications are solely those of the individual author(s) and contributor(s) and not of MDPI and/or the editor(s). MDPI and/or the editor(s) disclaim responsibility for any injury to people or property resulting from any ideas, methods, instructions or products referred to in the content.