Article

Comparative Analysis of Tropospheric Correction Methods for Ground Deformation Monitoring over Mining Area with DS-InSAR

1
School of Environment Science and Spatial Informatics, China University of Mining and Technology (CUMT), Xuzhou 221116, China
2
Key Laboratory of Xinjiang Coal Resources Green Mining, Ministry of Education, Urumqi 830023, China
3
Minmetals Mining Holdings Limited, Hefei 230091, China
4
State Key Laboratory of Disaster Prevention and Ecology Protection in Open-Pit Coal Mines, China University of Mining and Technology (CUMT), Xuzhou 221116, China
5
Key Laboratory of Land Environment and Disaster Monitoring, MNR, China University of Mining and Technology (CUMT), Xuzhou 221116, China
*
Author to whom correspondence should be addressed.
Remote Sens. 2025, 17(23), 3811; https://doi.org/10.3390/rs17233811
Submission received: 3 October 2025 / Revised: 13 November 2025 / Accepted: 17 November 2025 / Published: 24 November 2025

Highlights

What are the main findings?
  • The performances and effectiveness of the commonly used InSAR tropospheric delay correction methods over mining areas have been compared.
  • An improved common scene stacking (CSS) InSAR tropospheric delay correction method has been proposed.
What are the implication of the main finding?
  • Offer guidance for the selection of the appropriate InSAR tropospheric delay correction methods over mining areas.
  • The proposed improved CSS is well-suited for scenarios requiring fast and efficient tropospheric delay corrections.

Abstract

In recent years, differential synthetic aperture radar interferometry (DInSAR) has been widely used to monitor ground deformation induced by mineral resource exploitation. Compared with conventional DInSAR, InSAR time series (TS-InSAR) techniques offer significantly improved monitoring accuracy. However, their results still remain strongly influenced by atmospheric delays. To address this and discuss the applicability of tropospheric delay correction methods over mining areas, this study applied multiple correction strategies to distributed scatterer InSAR (DS-InSAR), including the Linear, ERA5, GACOS, spatio-temporal filtering method, and their adaptive weighted fusion approach. Meanwhile, an improved Common Scene Stacking (CSS) InSAR tropospheric delay correction method has been proposed. These methods’ performance have been evaluated by the quantitative comparisons of the corrected interferometric phases and by in situ measurements. The results indicated that the adaptive fusion method outperformed any individual model included, where spatio-temporal filtering should be applied with caution, as it may undermine part of the deformation signal. The effectiveness of ERA5 and GACOS is limited due to their resolution mismatch with that of the SAR images. On the other hand, the improved CSS method achieved the best results over the study area, with an average reduction of 32.22% in the RMSE of the interferometric phase, resulting in an RMSE below 8 mm on average and as low as 5 mm over certain areas. Thus, over local mining areas with large-magnitude and ground deformation, the improved CSS outperforms all the other compared methods, where it can effectively mitigate atmospheric delays while preserving the deformation signals.

1. Introduction

The large-scale exploitation of mineral resources has promoted rapid socio-economic development. However, it has also brought a series of environmental problems. Among these, mining-induced movements and deformations of rock layers and the ground surface can cause persistent damage to surface structures, leading to various geological and environmental hazards in mining areas. Therefore, monitoring and predicting mining-induced deformations are crucial for assessing potential geological hazards and analyzing subsidence mechanisms. Currently, deformation monitoring in mining areas mainly relies on traditional techniques such as total station measurements or Global Navigation Satellite System (GNSS). These methods have been applied for many years and are relatively mature, generally meeting the basic requirements for displacement monitoring. However, they can only provide displacement information at limited points due to their sparse spatial distribution, making it difficult to achieve comprehensive coverage of the entire area of interest. In addition, these approaches are often associated with high labor and economic costs. Hence, there is an urgent need to adopt more efficient monitoring technologies with broader coverage to improve both the accuracy and efficiency of deformation monitoring in mining regions.
Compared with traditional monitoring methods, Differential Interferometric Synthetic Aperture Radar (DInSAR) enables high-precision detection of ground deformation over large areas. It allows long-term monitoring of surface displacements with centimeter-level accuracy and is not limited by weather conditions, providing the capability for wide-area detection of ground deformation. Due to these significant advantages, InSAR has been widely applied in deformation monitoring across various geological and engineering fields, including mining subsidence [1,2,3,4], volcanic activity [5,6], landslide hazards [7,8], earthquake-induced deformation [9,10], urban surface deformation [11,12], and glacier movement monitoring [13].
Although InSAR can rapidly and efficiently acquire wide-area ground deformation information, it has inherent limitations. Its accuracy is often affected by temporal and spatial decorrelation, atmospheric delay, speckle noise, DEM errors, phase unwrapping errors, or geometric distortions in SAR imagery. To overcome these limitations of conventional InSAR, various time-series InSAR techniques(TS-InSAR) have been developed. These include Persistent Scatterer (PS) methods based on a single master image, such as PSInSAR, StaMPS, and STUN [14,15,16]; Small Baseline Subset (SBAS) approaches [17], ISBAS [18]; and Distributed Scatterer (DS) methods, including DS-InSAR and SqueeSAR [19]. Although SBAS-InSAR offer higher monitoring point density compared with PS-InSAR, the number of coherent points is still insufficient for detailed deformation monitoring in mining areas with extensive farmland and vegetation cover. Therefore, DS-InSAR techniques, which can provide a higher density of monitoring points, have been widely applied and further developed.
However, not all error sources can be completely eliminated through TS-InSAR. Among these, atmospheric delay significantly reduces the accuracy of deformation monitoring and may introduce errors of up to several tens of centimeters in a single interferogram [20], making it one of the primary error sources in current InSAR deformation monitoring. Therefore, atmospheric correction is an essential step in InSAR data processing in most cases.
To address this issue, researchers have proposed different strategies, which can be broadly divided into two categories. The first category involves correction methods assisted by external data, including numerical weather models (NWMs), GNSS observations, or spectrometer measurements [21,22,23,24,25]. The performance of these models varies depending on their spatial and temporal resolution and assimilation algorithms. The second category is the phase-based method, such as stacking [26], spatio-temporal filtering [27], linear model [28,29,30], power-law model [31], or common scene stacking (CSS) [32]. These approaches have achieved relatively good correction results in certain regions. Typically, atmospheric delay correction methods need to be tailored to the characteristics of specific areas. However, comparative studies applying these methods in mining areas are still limited. Furthermore, the accuracy of the CSS method decreases at the temporal edges, where only shorter or one-sided averaging stencils can be used.
To address the problem of atmospheric delays and discuss the applicability of tropospheric delay correction methods over local mining areas with large-magnitude deformation, multiple methods were applied to the DS-InSAR results. In addition, an improved CSS method is proposed to mitigate the reduced accuracy of atmospheric delay estimation at the edge dates in the original CSS method. The applicability of different approaches was validated by considering both root mean square(RMS) of phase and their agreement with in situ measurements. Subsequently, the optimal method was selected to analyze deformation over the mining area, providing a scientific basis for mine management.
The structure of this paper is as follows: Section 2 describes the materials and methods, followed by Section 3, which introduces the comparative results of different methods. Section 4 the deformation analysis, and finally, Section 5 concludes the study.

2. Materials and Methods

2.1. Study Area and Data

2.1.1. Overview of the Mining Area

The mining area is located in Shandong Province, as shown in Figure 1a. The region experiences a warm-temperate continental climate, with temperature, rainfall, and snowfall having minimal impact on underground mining operations. Geomorphologically, the area is situated on a piedmont plain, with elevations ranging from +191 m to +219 m and a relative relief of 28 m. The mining area extends approximately 3.5 km from north to south and 2 km from east to west, covering an area of 10.4451 km2, with mining depths ranging from −140 m to −700 m.
The area mainly comprises three ore deposits: Zhangjiawa, Xiaoguanzhuang, and Gangli, whose locations are shown in Figure 1c. Figure 1b indicates the location of the study area. A total of nine GNSS continuous monitoring stations were deployed in the mining area, with monitoring conducted from December 2024 to June 2025. In the tailing dam, 26 effective prism monitoring points were installed along the southwestern dam, with monitoring from January 2024 to April 2025. The distribution of the ground measurement stations is shown in Figure 1c,d.

2.1.2. InSAR and Numerical Weather Models Data

The Sentinel-1 satellite operates in TOPS interferometric SAR mode, providing a spatial coverage of approximately 250 km × 160 km, with spatial resolutions of about 5 m in range and 20 m in azimuth and a minimum revisit period of 6 days. Based on the Sentinel-1 data and the characteristics of the study mining area, 34 ascending Sentinel-1A images (Frame: 69, Path: 114) acquired over the mining area between 27 January 2024 and 14 June 2025 were used.
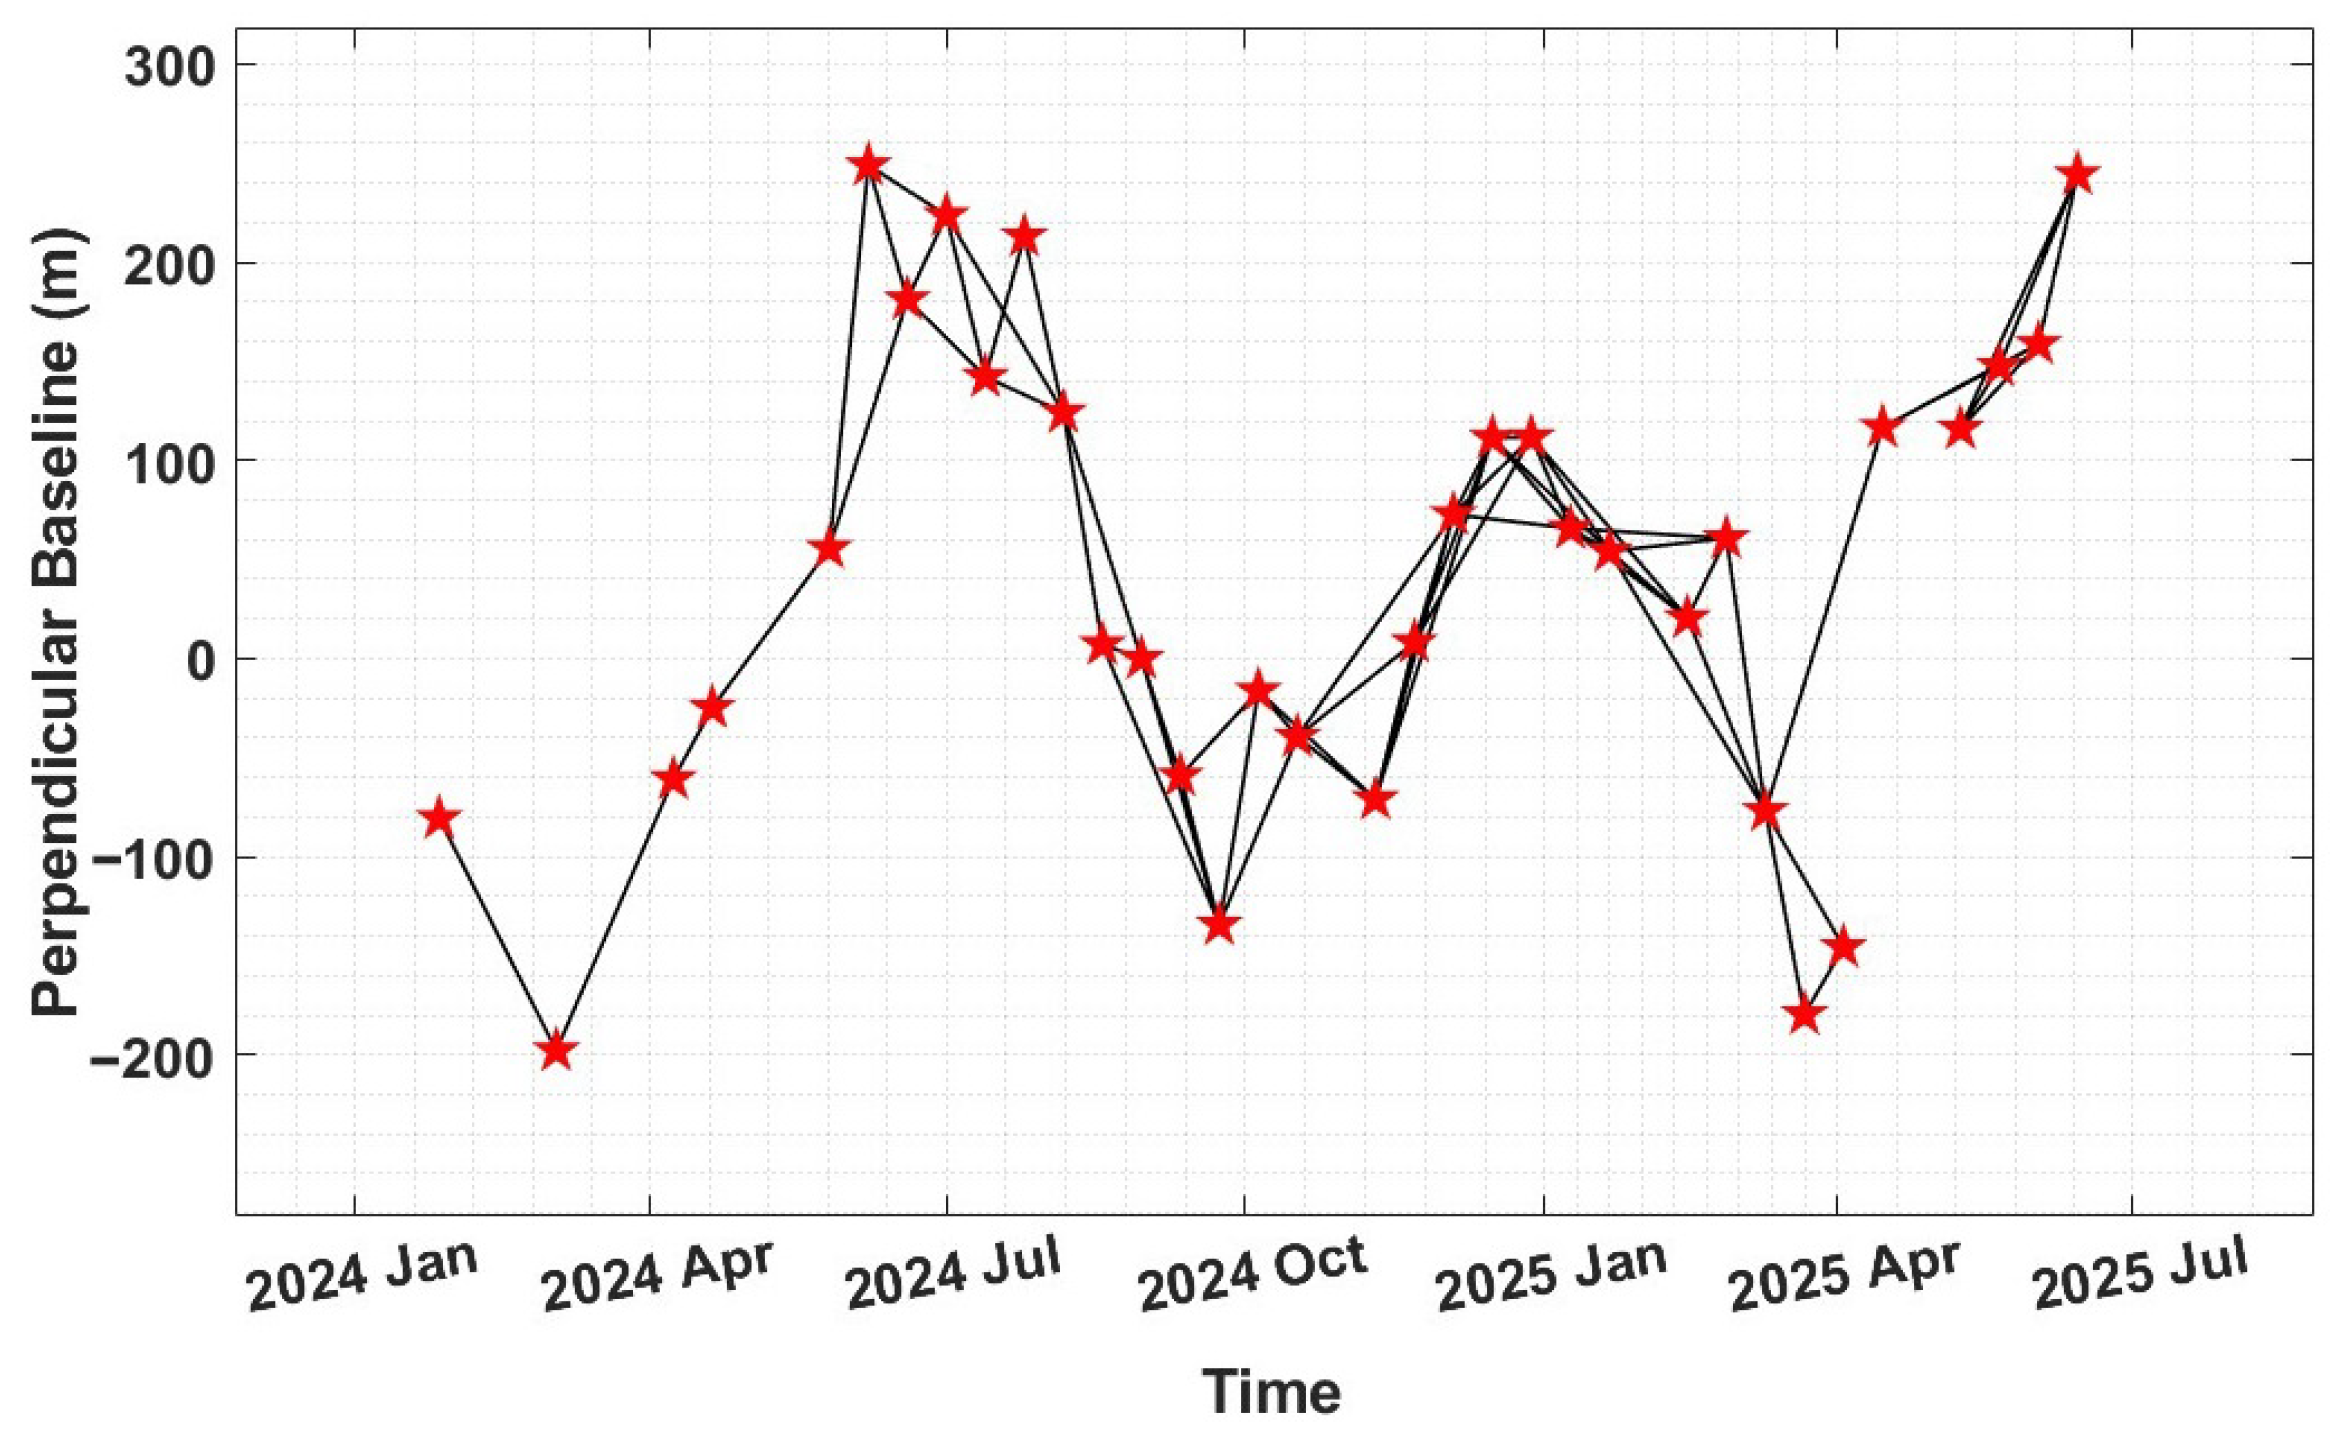
The SLC images were first processed for image coregistration and differential interferogram generation. A 30 m SRTM DEM was employed for geocoding and removal of the topographic phase from the interferograms. Time-series InSAR processing was then performed by StaMPS. And multiple master images were used to generate interferograms. By setting the temporal baseline < 80 days and spatial baseline < 200 m, and manually excluding interferograms with low coherence, a total of 66 interferograms were generated. The temporal and spatial baselines are shown in Figure 2. In addition, the main parameters of the GACOS and ERA5 data used are listed in Table 1.

2.2. Methods

This study is based on the DS-InSAR corrected by multiple atmospheric correction methods. Specifically, we first applied Linear, ERA5, GACOS, and spatio-temporal filtering approaches. Subsequently, an adaptive weighted fusion of these methods was applied. In addition, CSS was partly improved, and its performance was compared with the aforementioned methods using ground-based measurements.
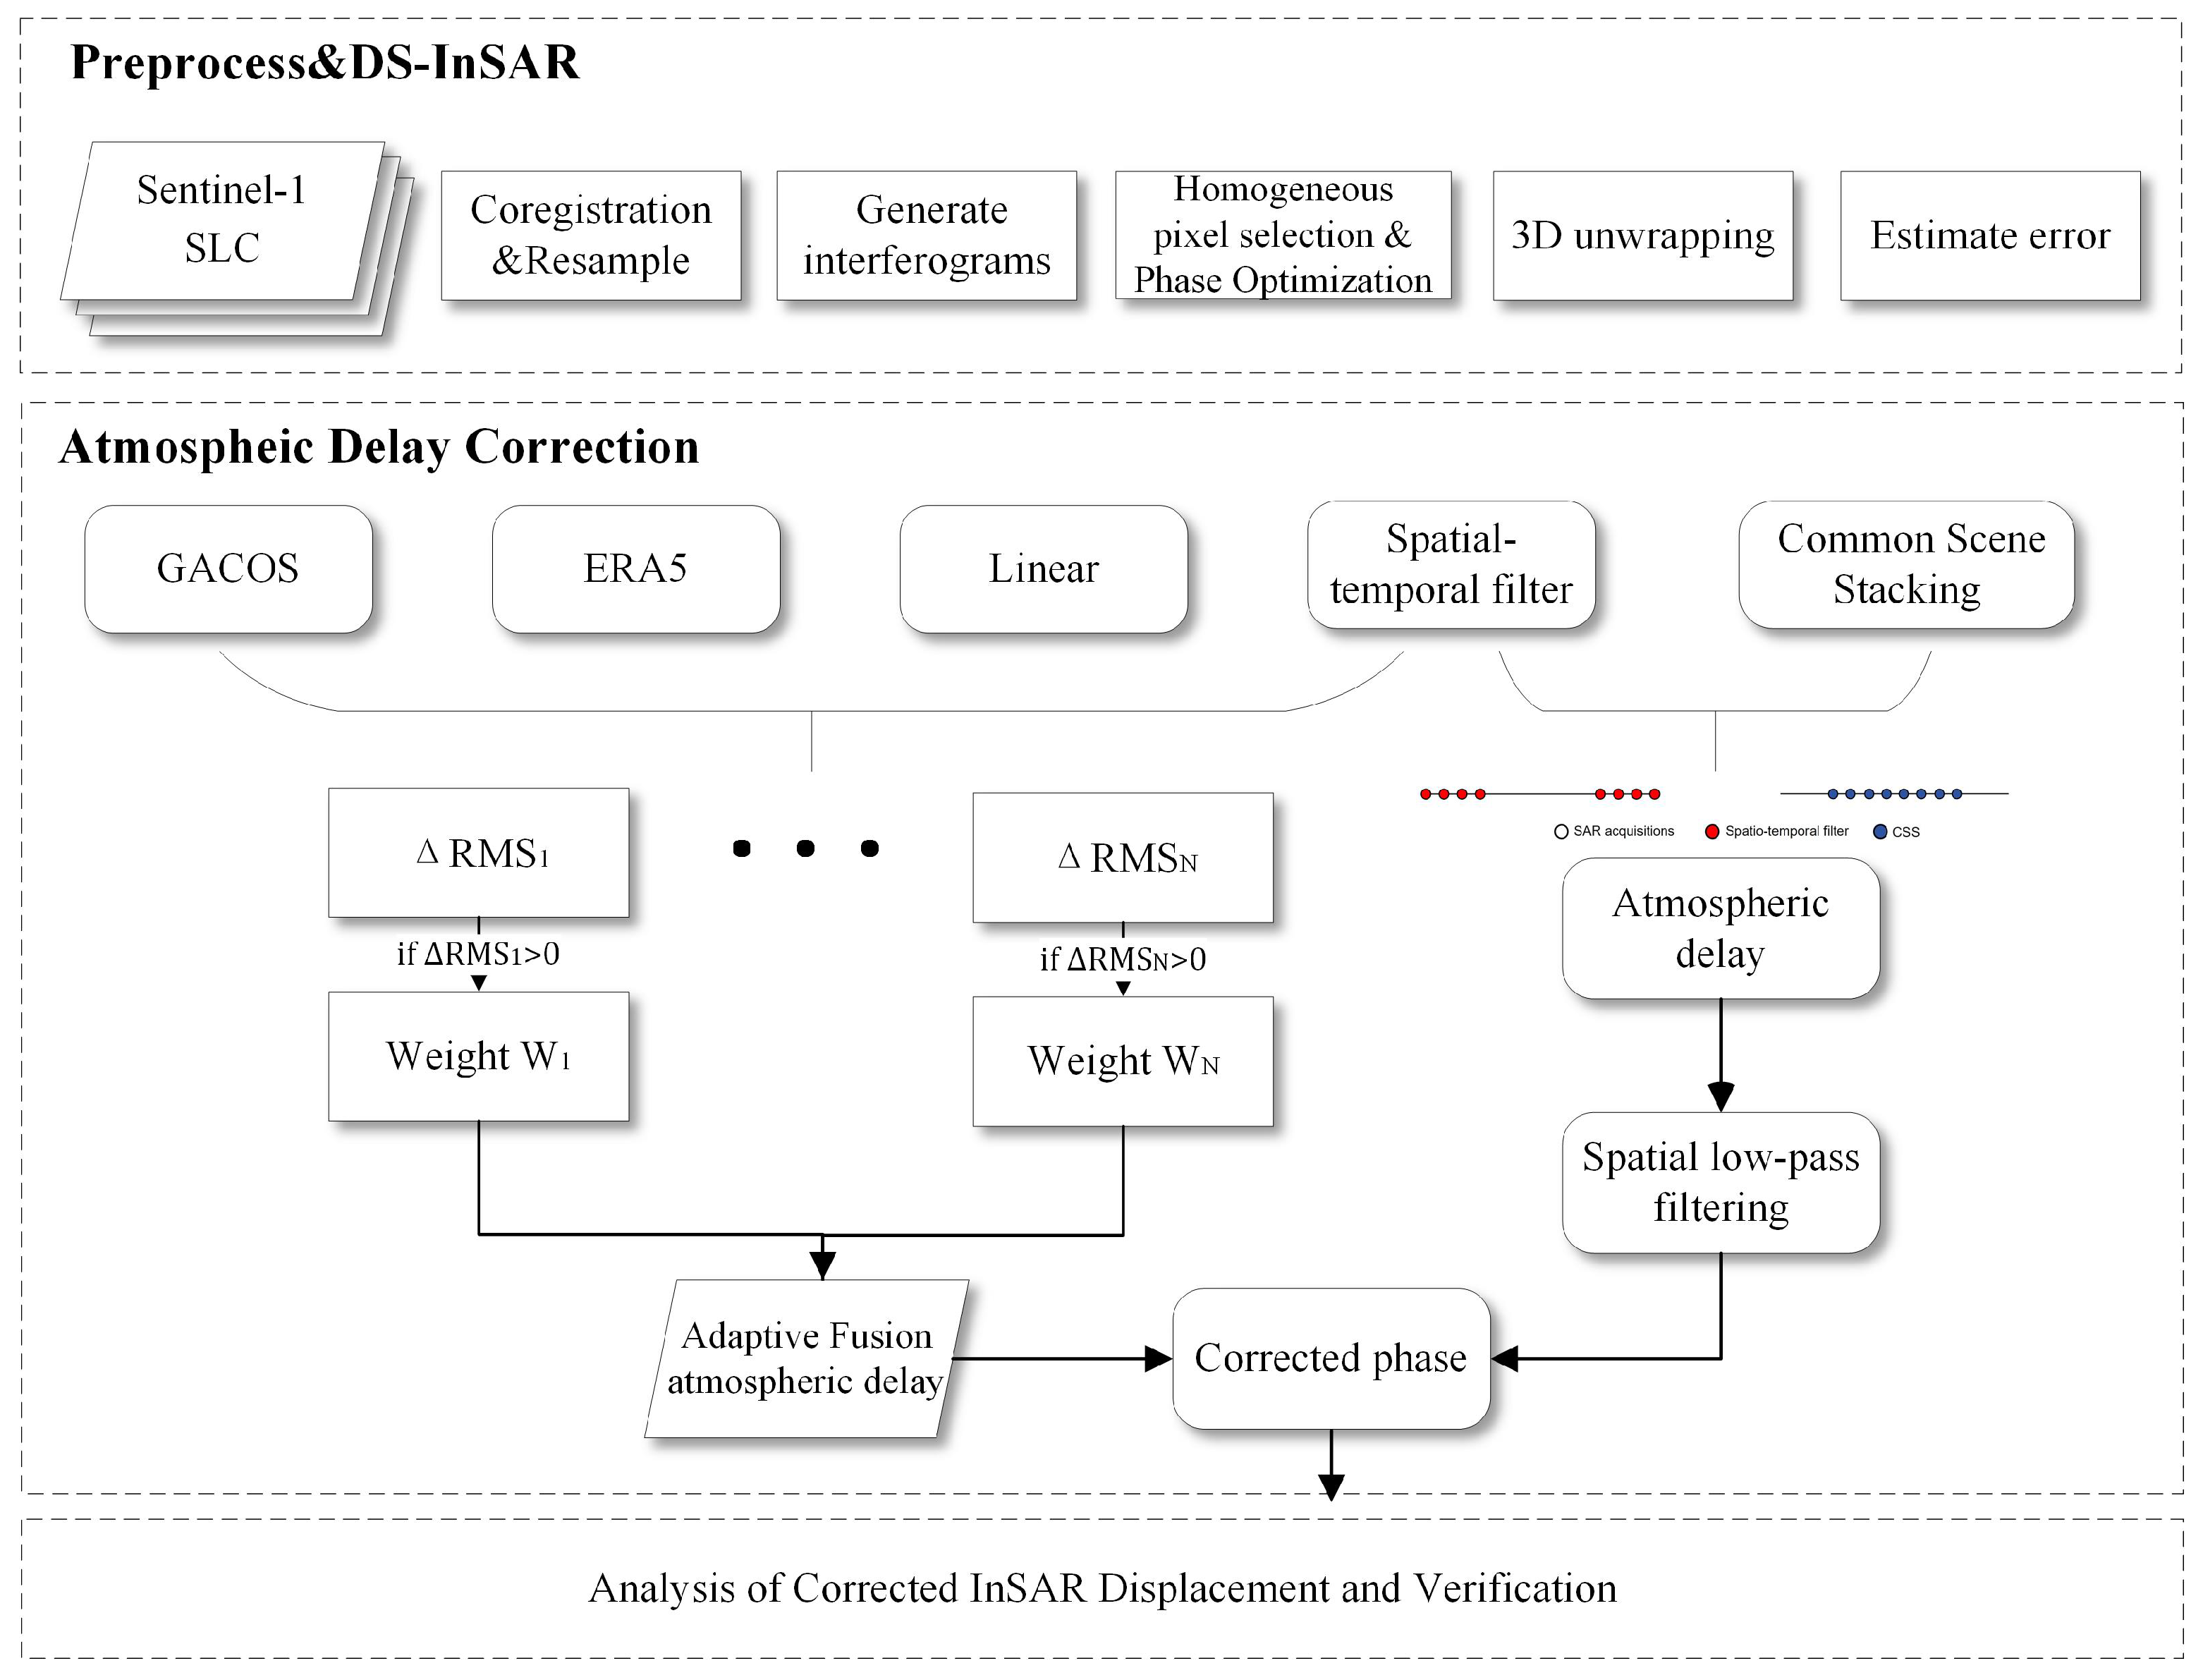
The overall research workflow is shown in Figure 3. The principles and details of each method are described in the following section.

2.2.1. DS-InSAR

Conventional TS-InSAR techniques are limited by numbers of monitoring points, uneven spatial distribution, and insufficient capability to capture the deformation characteristics of mining areas. To effectively increase the spatial density of measurement points and obtain more accurate information on surface deformation in mining regions, this study employed DS-InSAR that integrates distributed targets for subsequent deformation monitoring. The core steps of this method mainly include the identification of homogeneous pixels of distributed targets and phase optimization.
First, FaSHPS was employed to select homogeneous pixels [33]. The basic step of this approach is to average the three-dimensional data and take the averaged reference pixel value as the true value, while the neighboring pixel values are regarded as the values to be estimated. At a given confidence level, if the estimated value falls within the confidence interval constructed from the true value, it is considered homogeneous with the reference pixel. According to the central limit theorem, the sample mean of the amplitude, A ¯ ( p ) = 1 N i = 1 N A i ( p ) , gradually follows a Gaussian distribution as the sample size N increases; that is, A ¯ ( p ) N u ( p ) , Var ( A ( p ) ) N . Thus, the analytical expression of the confidence interval can be obtained:
P μ ( P ) z 1 α / 2 · Var A ( P ) N < A ¯ ( p ) < μ ( P ) + z 1 α / 2 · Var A ( P ) N = 1 α
where μ ( P ) denotes the true amplitude value of the reference pixel, Var A ( P ) represents the variance of amplitude, z 1 α / 2 denotes the 1 α / 2 quantile of the standard normal probability density function. According to the statistical theory of SAR images, the amplitude of a single-look complex image follows a Rayleigh distribution in homogeneous regions. Since the coefficient of variation of the Rayleigh distribution is a constant, we obtain:
CV = 4 π 1 0.52
Var A ( p ) = CV · μ ( p ) 2 0.52 L · μ ( p ) 2
Then, the complete analytical expression of the confidence interval is obtained:
P μ p z 1 α / 2 · 0.52 · μ p N · L < A ¯ ( p ) < μ p + z 1 α / 2 · 0.52 · μ p N · L = 1 α
where L denotes the number of looks.
Next, phase optimization is performed for DS points, whose interferometric phases are often noisy. This procedure refines the phase estimates under phase-consistency constraints, thereby reducing the effects of decorrelation and other noise sources.
In this study, the Singular Value Decomposition (SVD) algorithm was applied for phase optimization [34]. Specifically, within each window, the time-series phases of homogeneous pixels are arranged column-wise to form a matrix D, where each row corresponds to a single homogeneous pixel. The matrix D has dimensions M × N, with M representing the number of homogeneous pixels associated with the reference DS pixel and N denoting the number of interferograms in the time series. SVD is then performed on D:
D = i = 1 r S i U i V i
The denoised matrix D is constructed using the largest singular value s 1 and its corresponding left and right singular vectors u 1 and v 1 , as expressed by the following equation:
D = u 1 s 1 v 1
For each matrix D in the iteration process, the n-th row is extracted as the new reference pixel time-series phase, forming a newly optimized interferogram. Coherence estimation is performed on the decomposed interferograms, and the final DS-optimized interferometric phase is obtained by weighted averaging of homogeneous DS pixels based on their coherence, as expressed in the following equation:
φ r e f = i = 1 n φ i · C o h i i = 1 n C o h i
where φ r e f represents phase of the reference pixel, φ i denotes the phases of neighboring homogeneous pixels, and C o h i is the estimated coherence. After extracting distributed targets and performing phase optimization, the optimized phases are processed in the StaMPS workflow. Three-dimensional phase unwrapping is applied, external DEM data are introduced for error correction, and phase errors caused by atmospheric delays and nonlinear deformation are compensated. Finally, the ground deformation rate in the study area can be derived.

2.2.2. Multi-Model Adaptive Weighted Fusion

Given the significant variations in the performance of different atmospheric correction methods across regions, an adaptive fusion algorithm was employed to optimally integrate tropospheric delays predicted by multiple weather models [29,35]. Specifically, GACOS [36], ERA5 [37], Linear, and spatiotemporal filtering methods were combined through adaptive weighted fusion to achieve an optimal correction of atmospheric errors.
ϕ tropo = k = 1 M w k ϕ tropo k
ϕ tropo represents the atmospheric phase delay from the k-th atmospheric correction method with an associated weight. Following the concept of the inverse distance weighting (IDW) algorithm, the weight w k is derived from the root mean square (RMS) r m s k value of the phase corrected by each method:
w k = 1 r m s k k = 1 M 1 r m s k
If the RMS value of the phase does not decrease after correction for a given interferogram, the corresponding method is excluded from the weighted fusion. In this way, the weighted atmospheric phase delay ϕ tropo for all interferograms is obtained, achieving better correction of atmospheric delays than any single model. Finally, the corrected deformation is derived by subtracting the atmospheric phase ϕ tropo from the interferometric phase.

2.2.3. Common Scene Stacking

We first estimate the atmospheric delay for each SAR acquisition based on the Atmospheric Noise Coefficient (ANC), which quantifies the relative level of atmospheric noise in each acquisition. The calculation formula of ANC is shown as follows:
A N C i = ( 10.0 ) ( R m a x ) 1 1 M m = 1 M ( a t m i ( x m ) a t m i ¯ ) 2
where a t m i ( x m ) denotes atmospheric delay at pixel m on date i, and its computation will be described below. a t m i ¯ = M 1 m = 1 M a t m i ( x m ) represents the mean atmospheric delay over all m pixels. R m a x denotes the RMS value of the phase with the highest noise level, which is used to normalize the ANC value.
Next, consider three SAR acquisitions at times t 1 , t 2 , and t 3 , which form two wrapped interferograms ( t 1 , t 2 ) and ( t 2 , t 3 ) . The differential phase associated with each interferogram is defined as:
Δ ϕ 12 = Δ τ 12 + α t m 2 α t m 1 + ϵ 12 ,
Δ ϕ 23 = Δ τ 23 + α t m 3 α t m 2 + ϵ 23 .
Here, α t m i represents the atmospheric delay at acquisition date t i , Δ τ denotes the ground deformation phase, and ϵ refers to errors such as those caused by an inaccurate digital elevation model or other noise. If the interferograms are assumed to have equal temporal intervals and the deformation occurs at a slow and constant rate, then the differential phase is independent of ground deformation. In this case, the atmospheric delay at the common date α t m 2 can be estimated by differencing the two interferograms, i.e., Δ ϕ 12 Δ ϕ 23 . If the atmospheric contributions are uncorrelated over time, combining multiple interferograms that share the same acquisition date can improve the accuracy of estimating α t m . If there are N date pairs with equal time intervals, the atmospheric delay at each acquisition date α t m i can be estimated using the following equation:
α t m i = lim N 1 2 N j = 1 N Δ ϕ i ( i j ) Δ ϕ ( i + j ) i
As N increases, the precision of atmospheric phase estimation for each acquisition date will improve. In addition, atmospheric delays for all acquisitions are calculated iteratively. In each iteration, the ANC coefficients are recalculated, and the atmospheric delay for each acquisition date is estimated according to the ranking of these coefficients. The corresponding atmospheric phase is subsequently removed from the interferometric phase, after which a t m is updated and recalculated for each subsequent dates.
However, the accuracy of atmospheric phase estimation often decreases at the temporal edges of SAR acquisitions. In order to improve this issue, CSS is combined spatio-temporal filtering in this study. Specifically, atmospheric delays are estimated using spatio-temporal filtering for the edge data of SAR acquisitions, while for the central data, corrections are performed using CSS. Figure 4 illustrates a schematic of the improved CSS method.

3. Results

3.1. Comparision of Interferograms

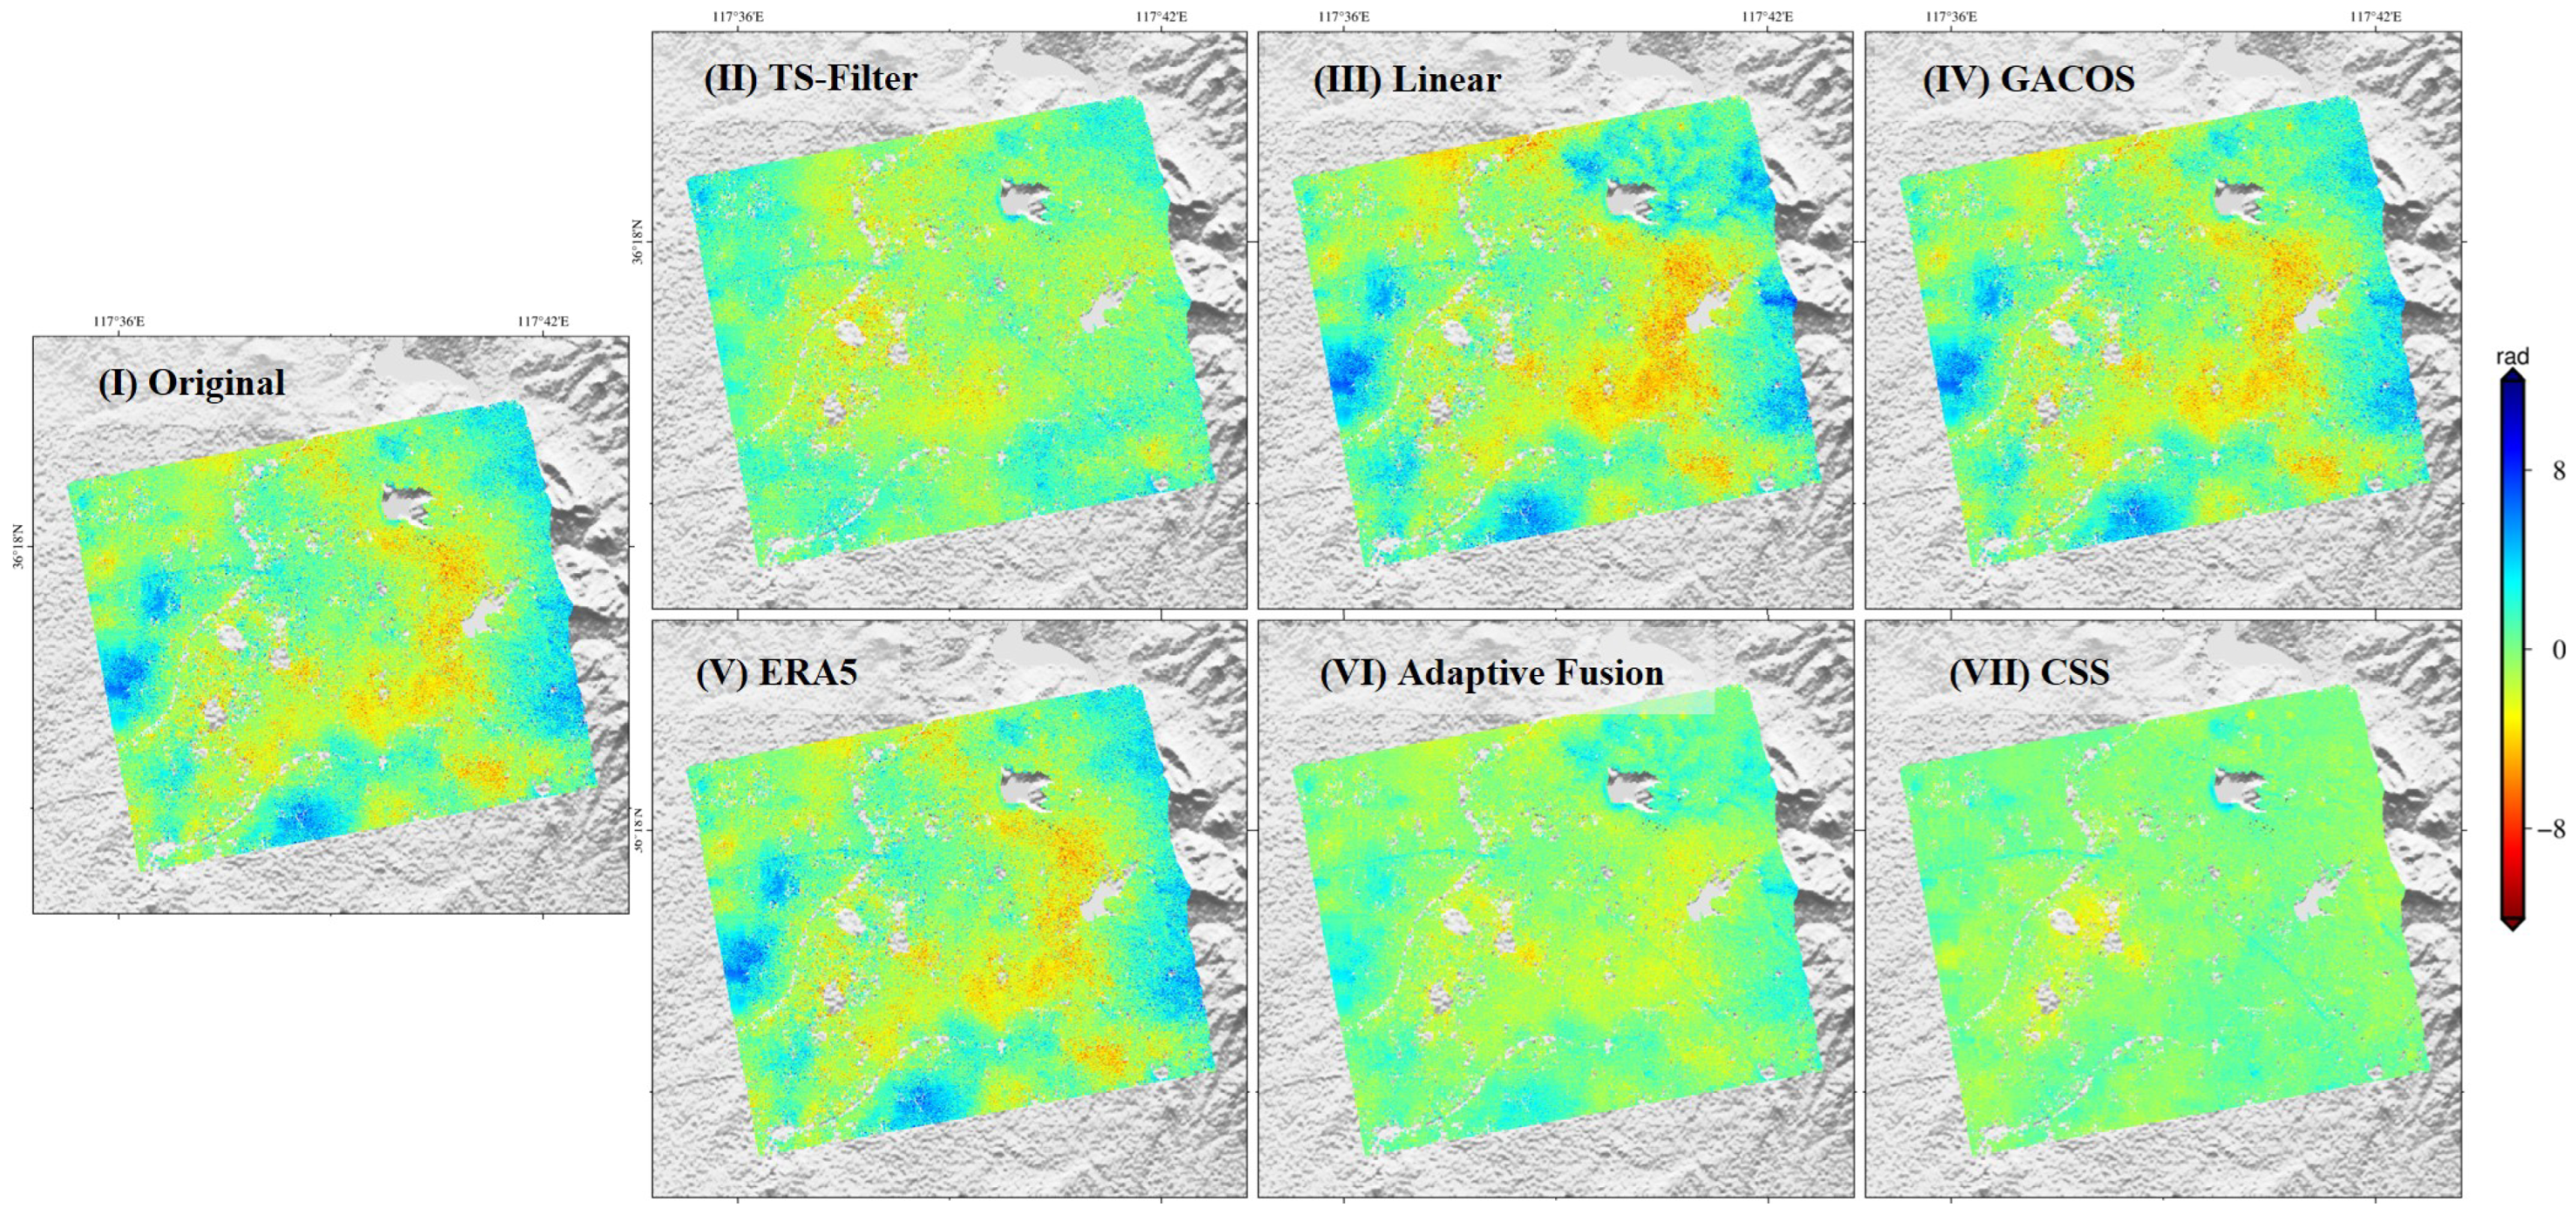
This section presents both qualitative and quantitative comparisons of atmospheric correction methods applied to interferograms over the mining area. Figure 5 presents the 20240830–20240725 interferogram, which is significantly affected by atmospheric delays: multiple spatially correlated turbulent delay partially obscure the deformation signal.
The variability of local turbulence may be too complex to be fully captured by global numerical weather models. Consequently, the correction performance of GACOS and ERA5 is limited owing to their coarse spatial resolution. In the northeastern sector of the study area, where elevations are relatively high, some vertically stratified delays are partially mitigated by GACOS, but the main turbulence remains largely uncorrected. And correction performance of Linear model is essentially consistent with that of GACOS and ERA5. In comparison, spatio-temporal filtering significantly mitigates atmospheric errors, although there still exists residual turbulence. Its effectiveness is constrained by the manually chosen filtering window and prior assumptions regarding atmospheric behavior, which may also risk removel of deformation signals.
Adaptive fusion exhibits overall performance comparable to that of spatio-temporal filtering. Because it performs weighted fusion on a per-interferogram basis, its corrective impact on this particular interferogram shows both strengths and weaknesses relative to spatio-temporal filtering.
Overall, CSS efficiently removes the turbulence evident in the original interferogram. In the mining area, CSS also restores deformation signals that were previously masked by turbulent delays.
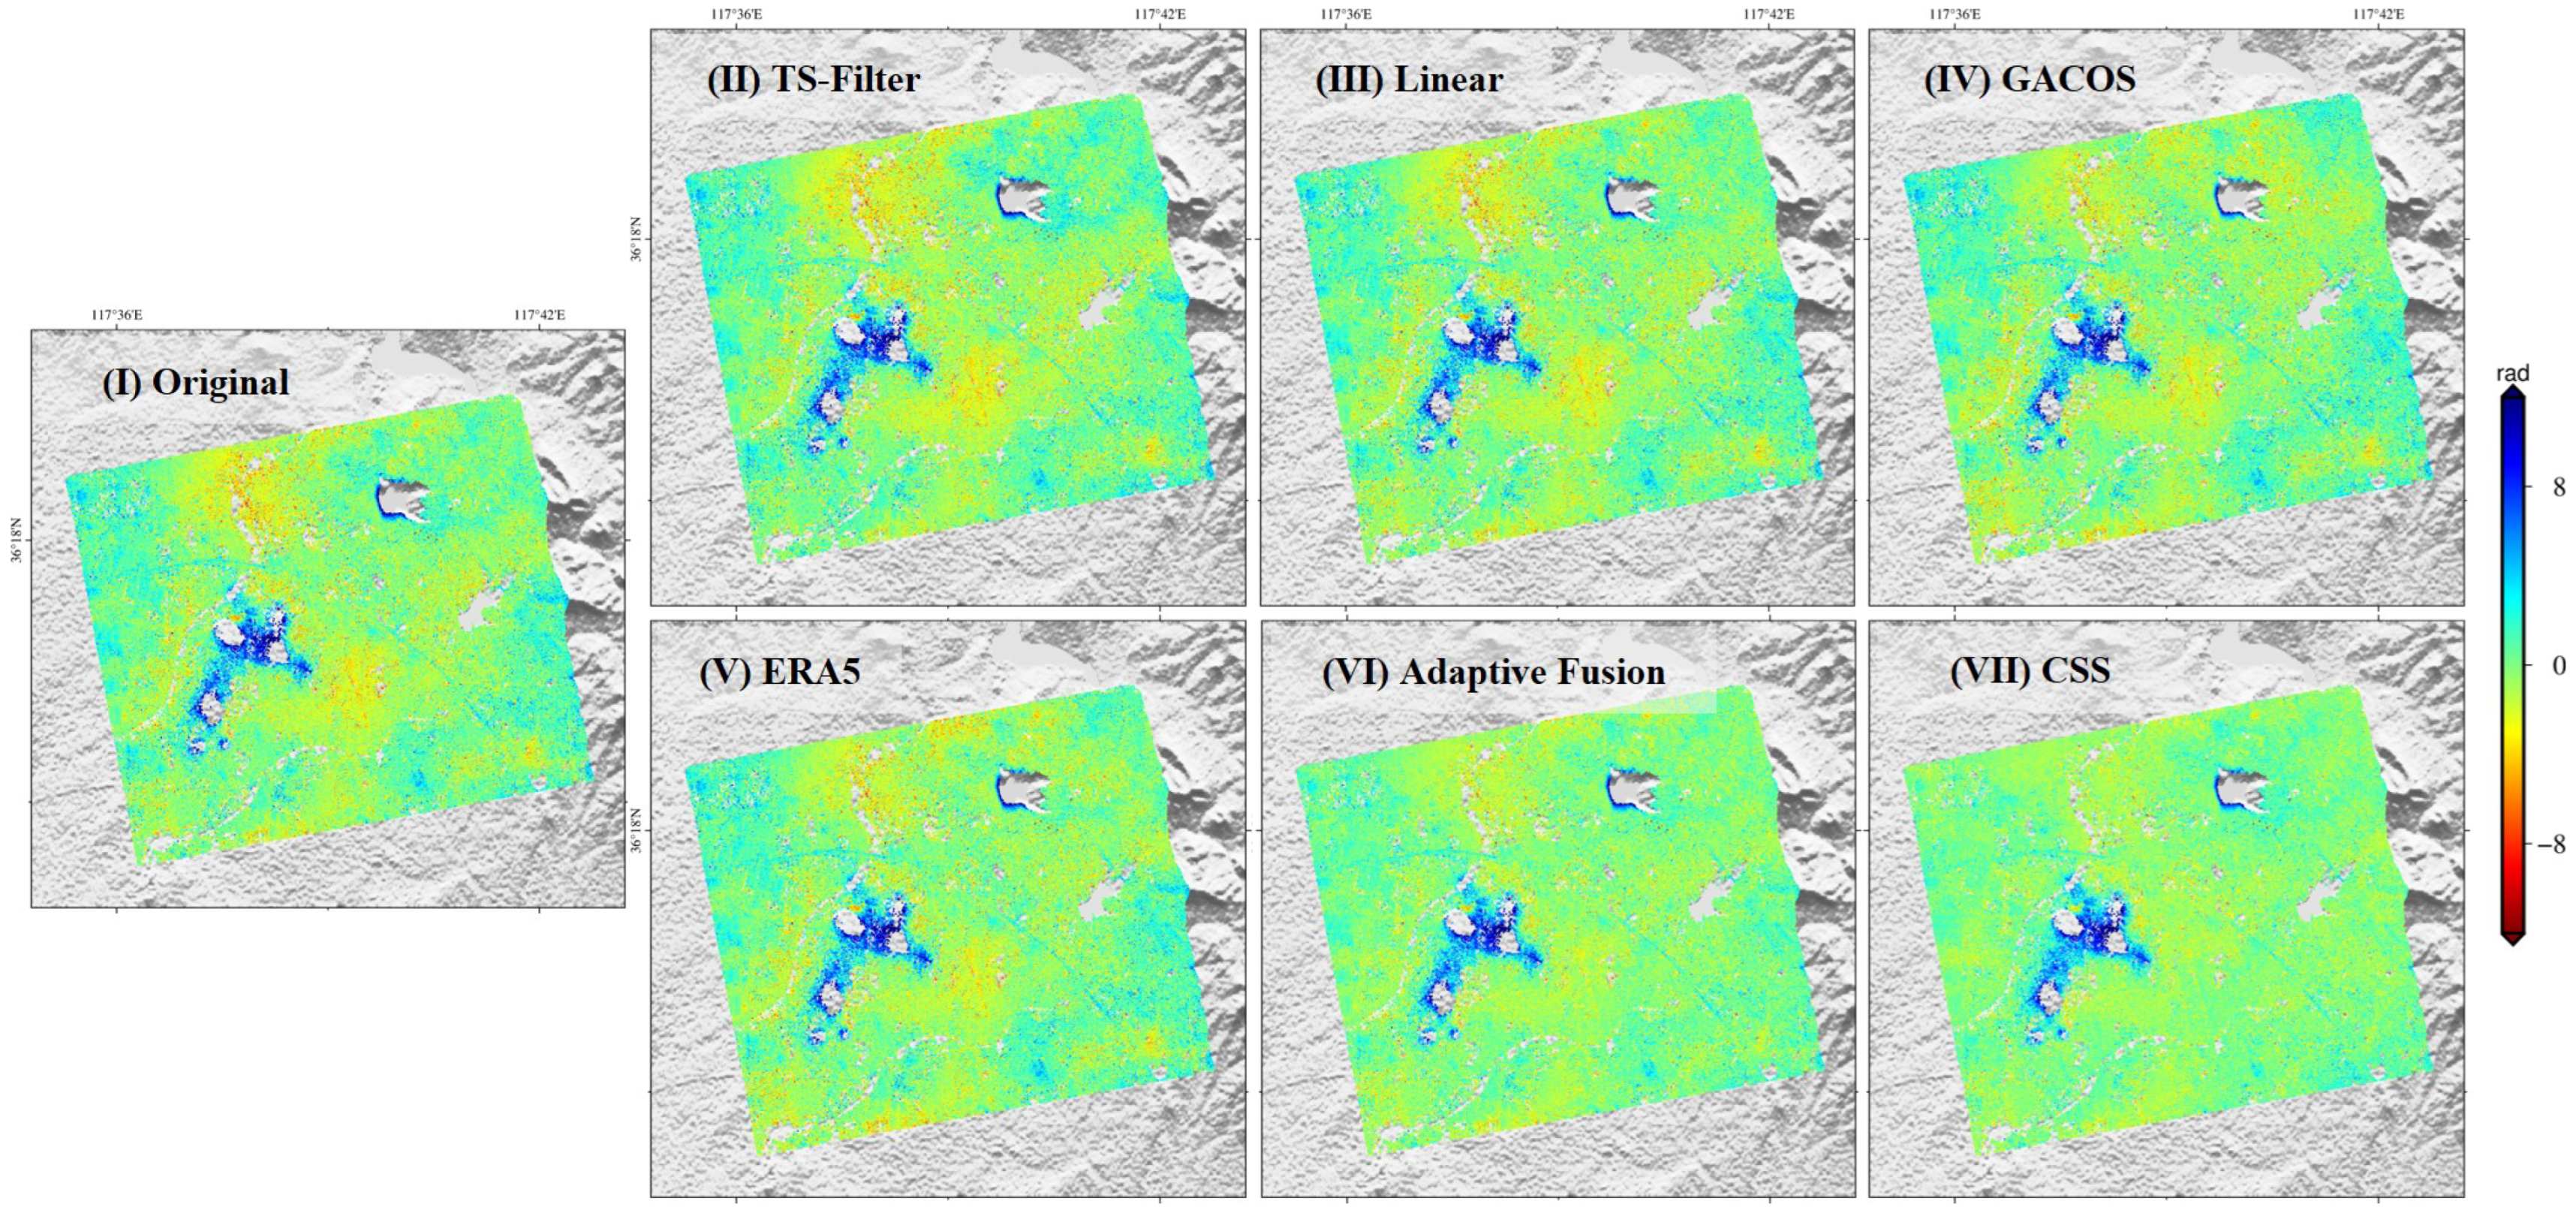
Figure 6 shows another interferogram 20240830–20250310, which exhibits pronounced deformation phase. The performance of each method is generally consistent with that observed in the previous interferogram. However, additional errors were introduced in the tailings area after GACOS and ERA5 corrections. The adaptive fusion method effectively mitigates turbulent delays in the central and northern parts and outperforms any single model. However, its overall performance is still inferior to that of CSS. After correction with CSS, the atmospheric phase in this interferogram is effectively corrected, while the main deformation phases in both the mining and tailings areas are preserved.
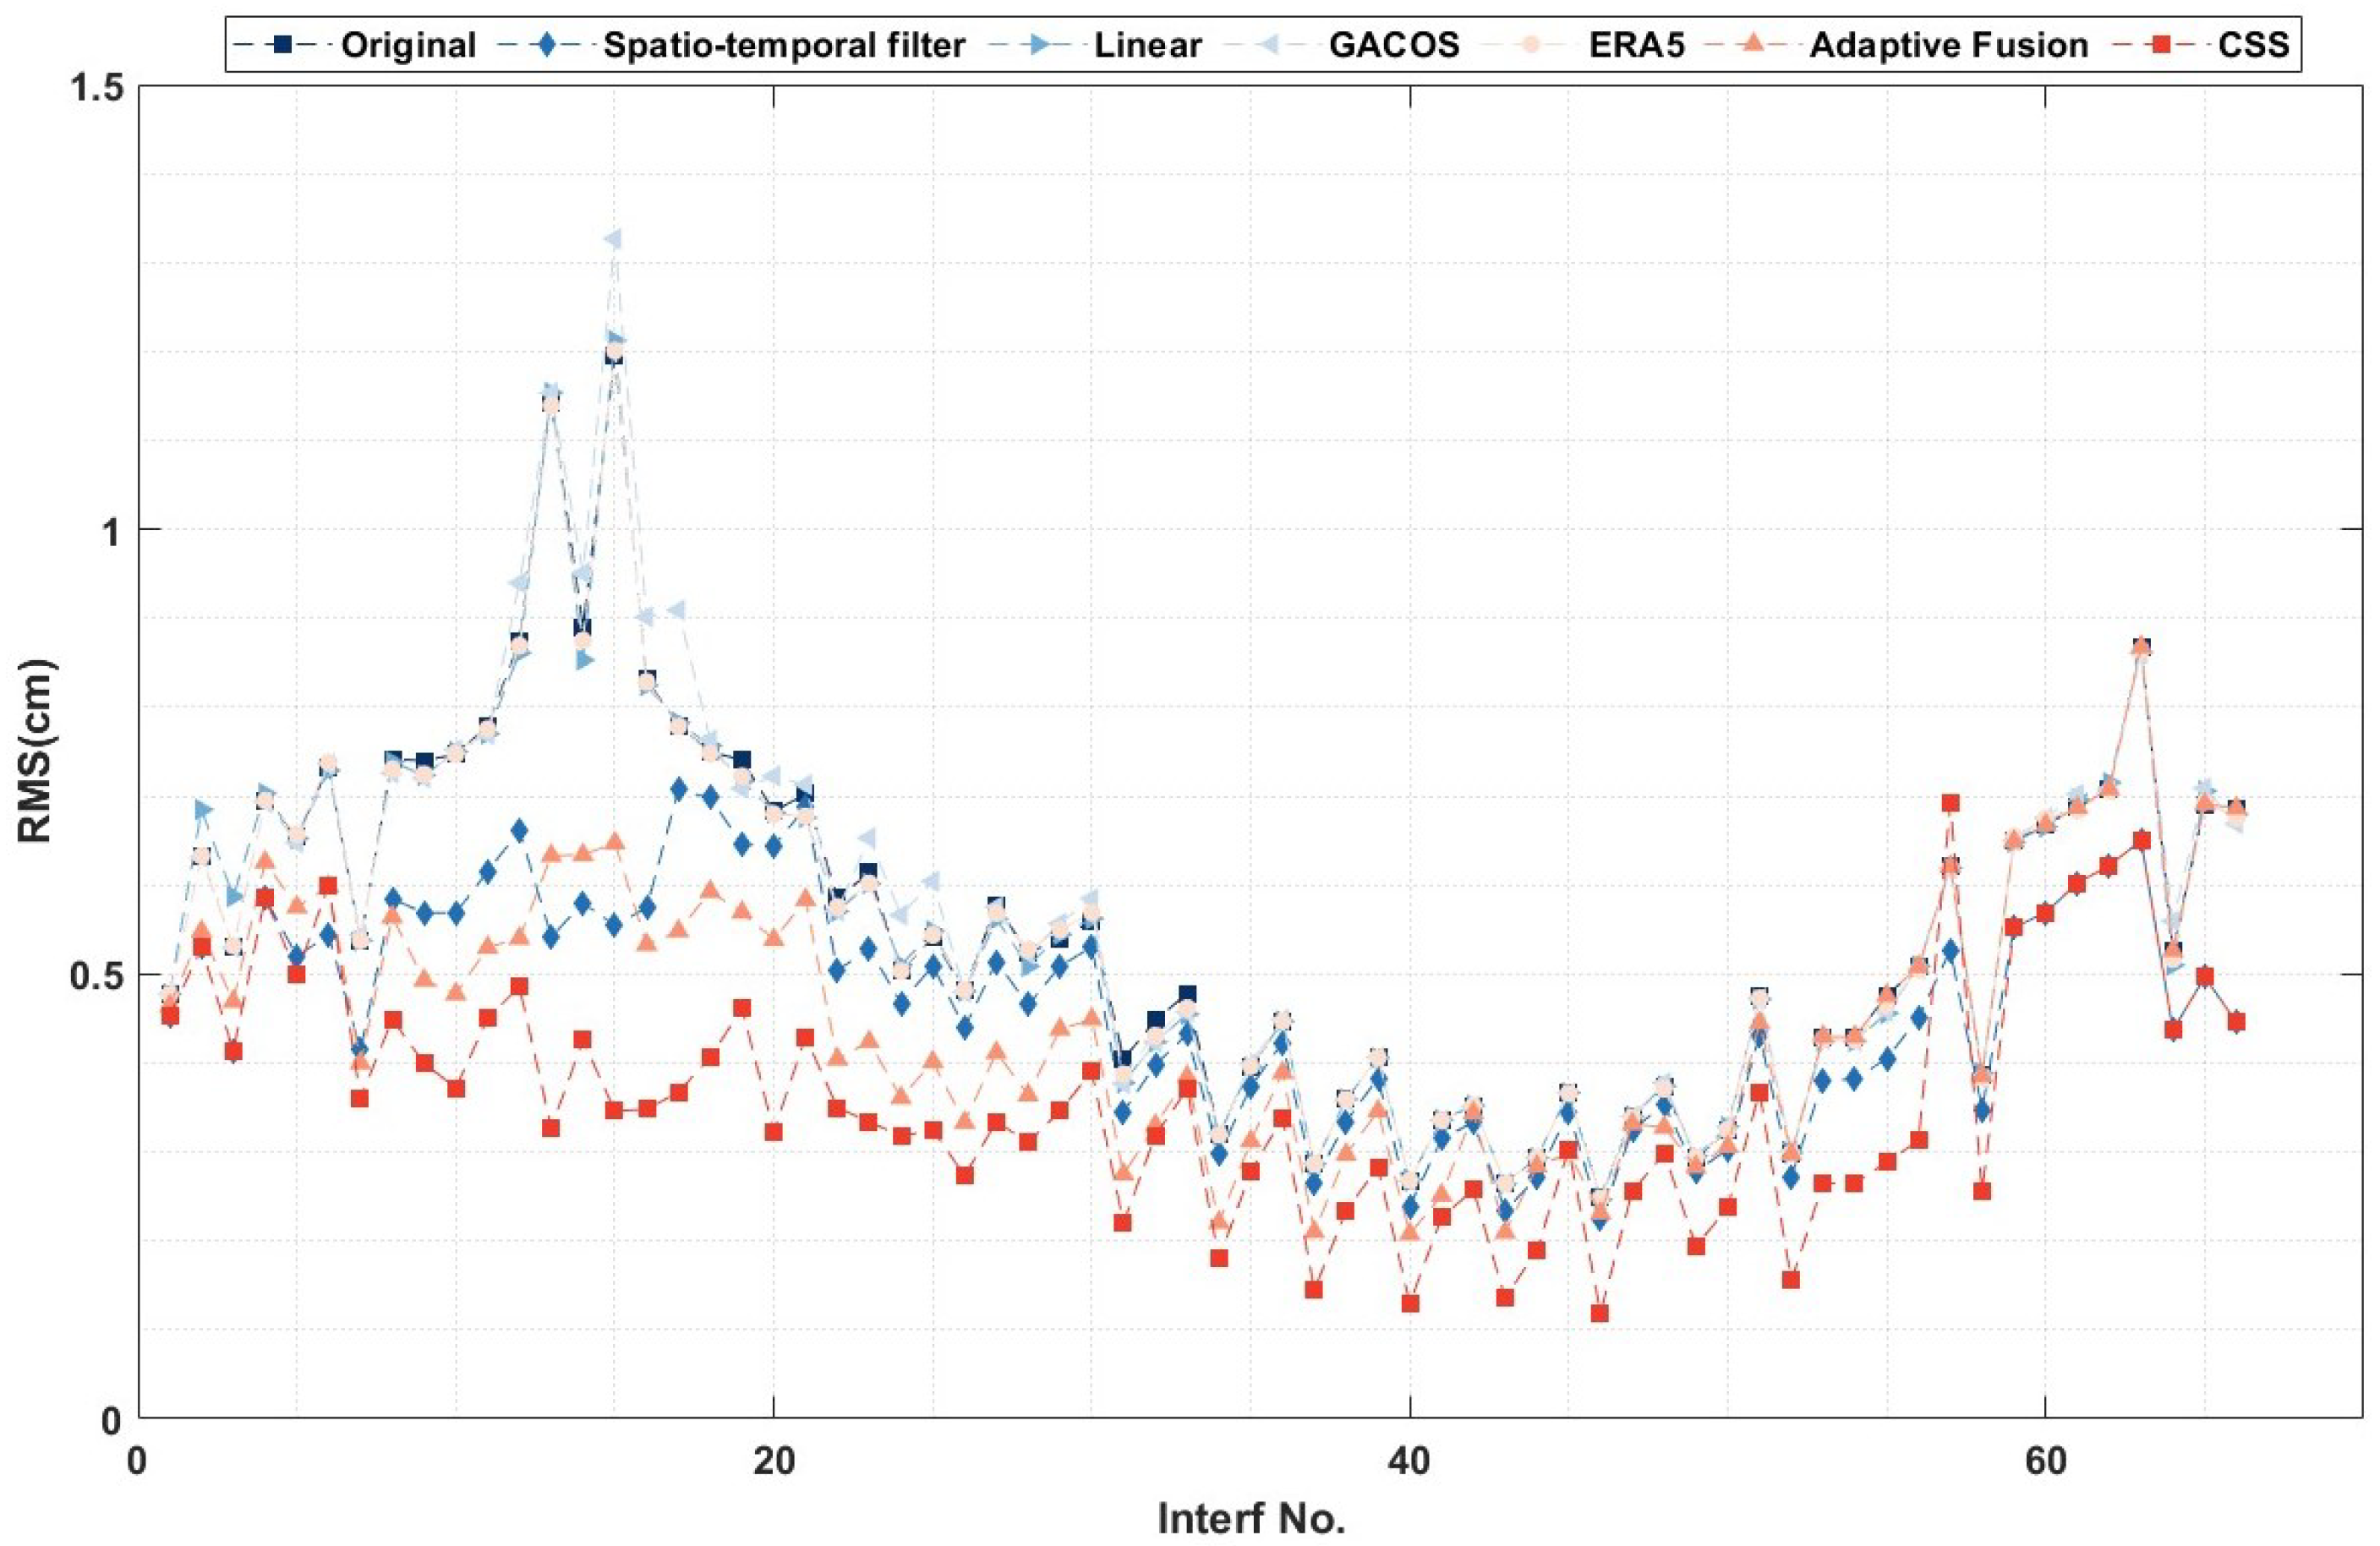
Then we used root mean square (RMS) as the evaluation metric to quantitatively assess the correction performance of each method across the study area. In the absence of deformation, RMS is generally considered to represent the noise level in the interferogram. A lower RMS of the corrected phase generally indicates a more effective atmospheric correction.
Figure 7 and Table 2 present the RMS of corrected phase reduction after applying different atmospheric correction methods. As shown, interferograms acquired during summer typically exhibit higher RMS values. Under such conditions, the substantial resolution mismatch between GACOS and ERA5 products and InSAR observations results in unsatisfactory corrections. The simulated atmospheric phases deviate significantly from actual conditions. As a result, they provide little or no reduction in RMS. In some cases, they even increase RMS by introducing additional errors. Application of the Linear and GACOS leads to negative average RMS reductions, indicating that these approaches fail to effectively mitigate atmospheric errors in this region. By contrast, the adaptive fusion method performs better than single-model corrections, though its performance still remains inferior to CSS.
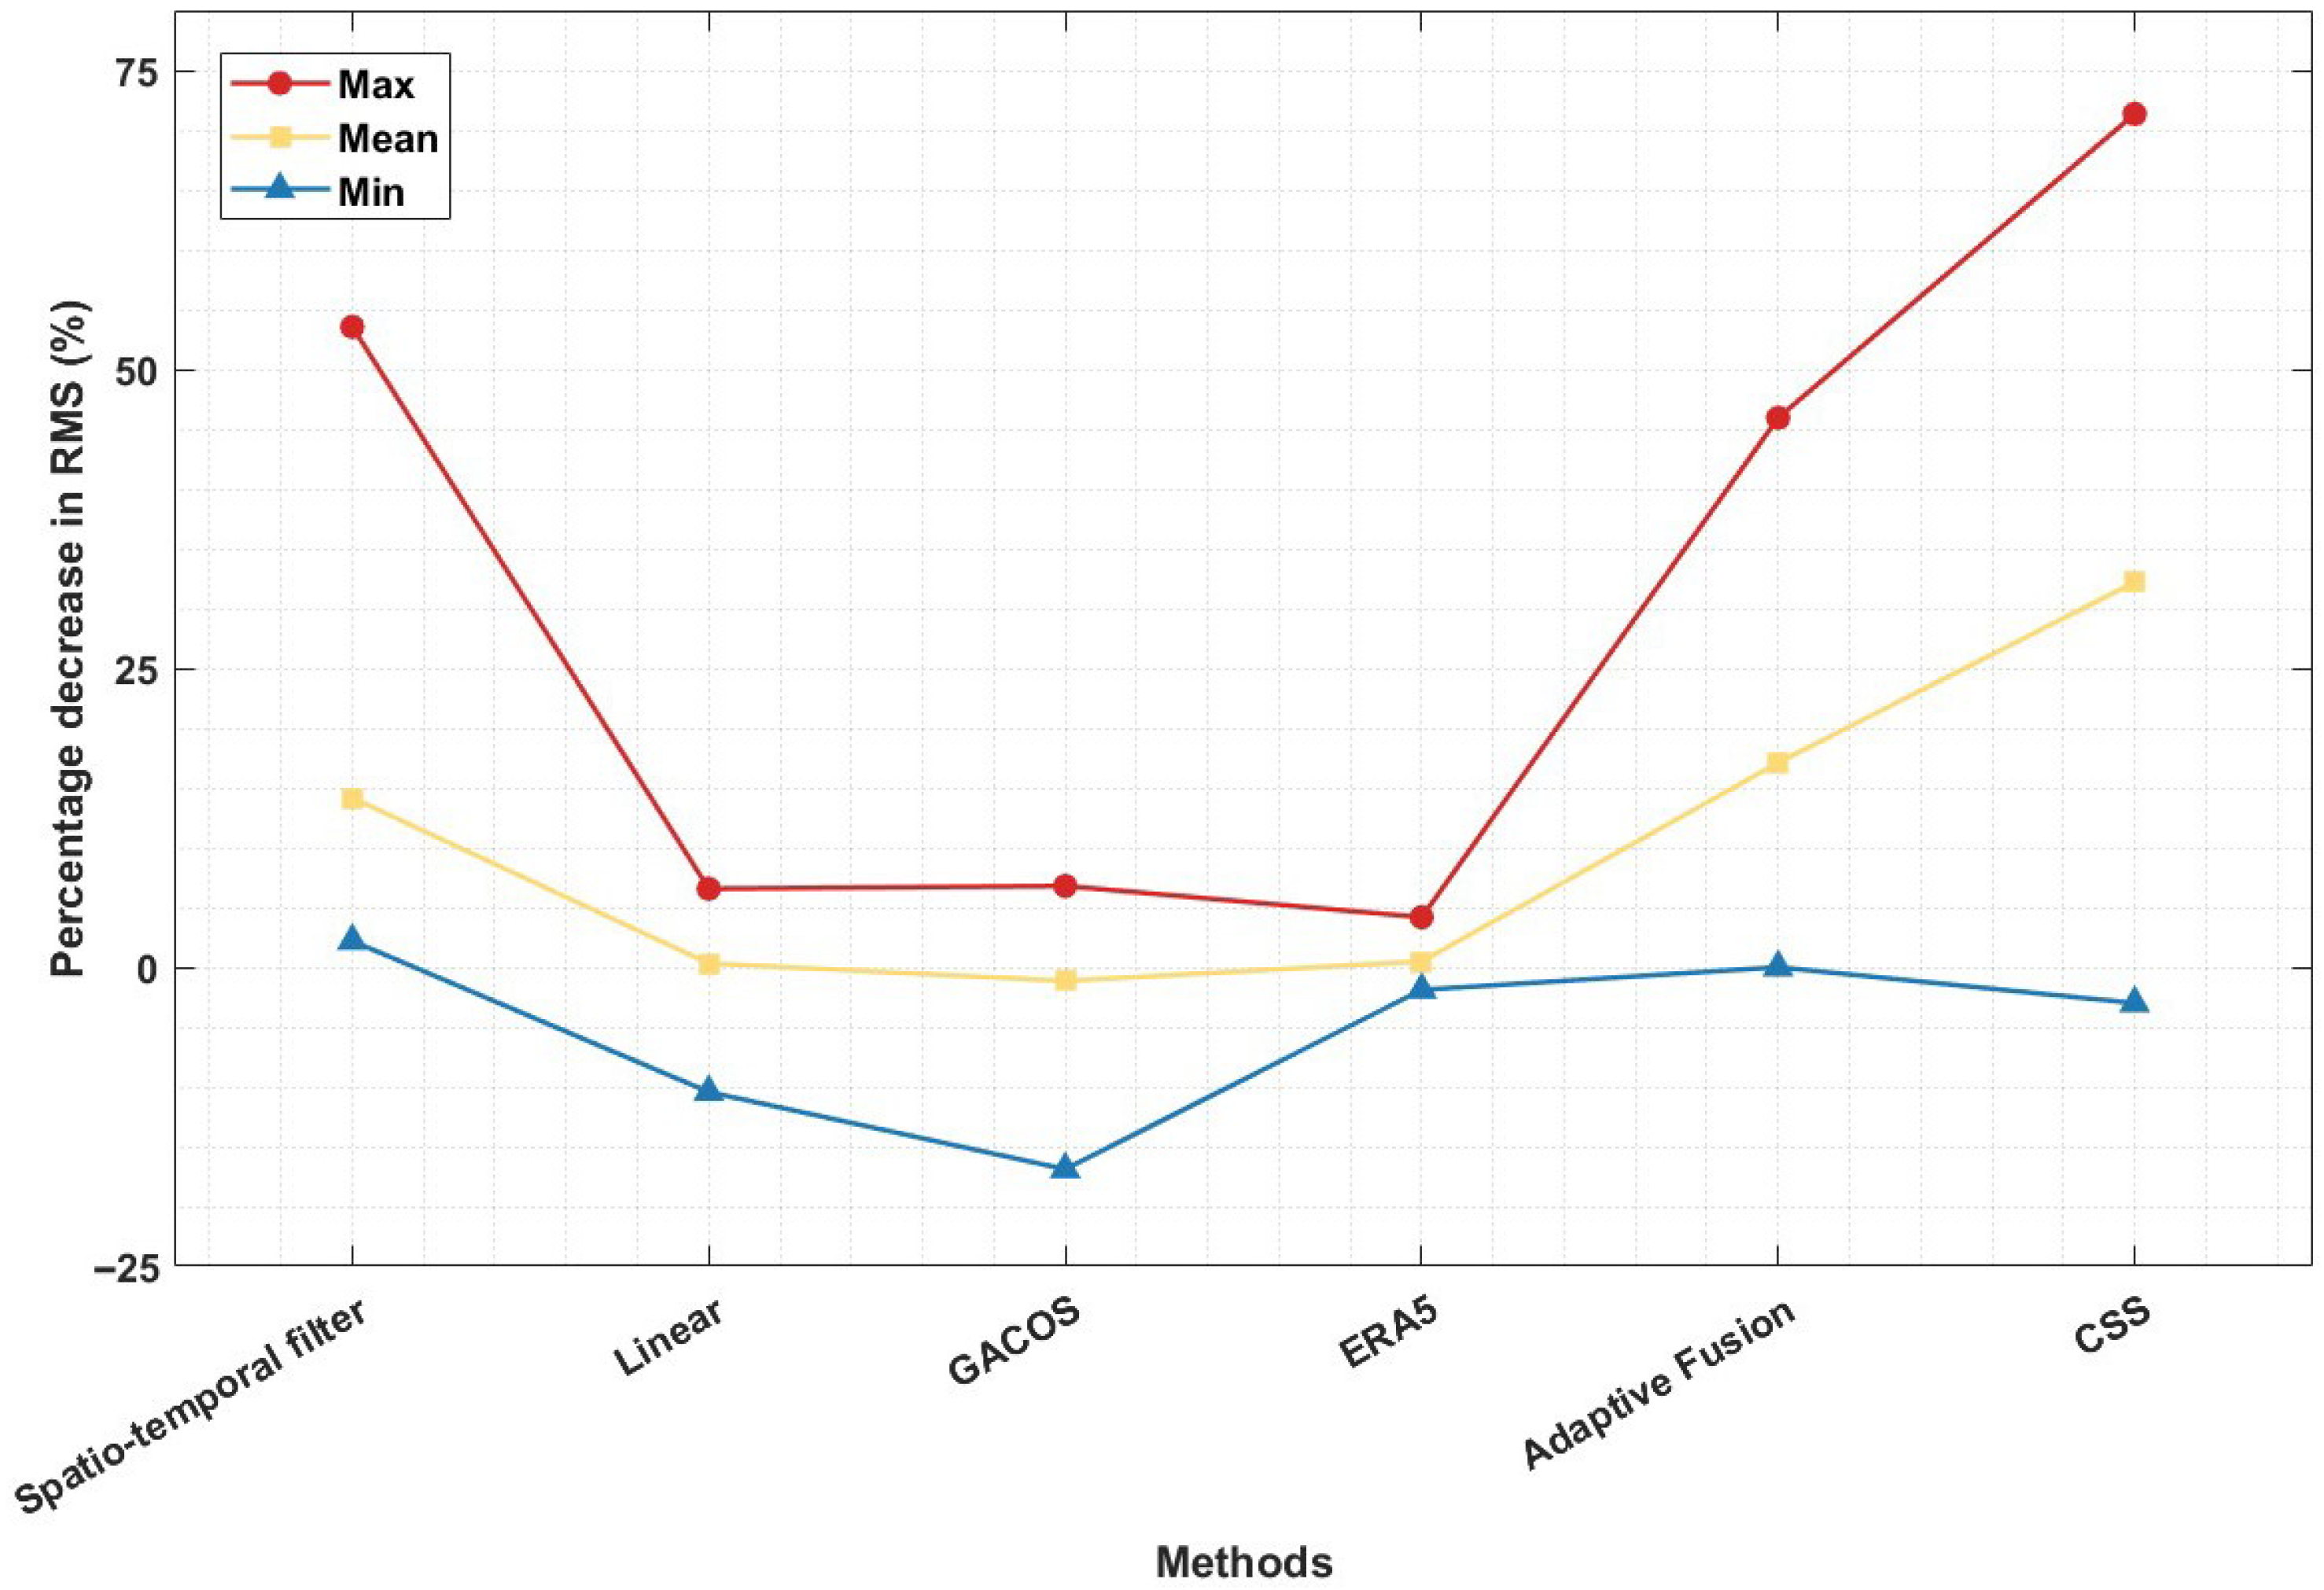
Furthermore, Figure 8 compares the maximum, minimum, and average percentages of RMS reduction achieved by different methods across all interferograms, providing an intuitive overview of their performance. The correction effects of GACOS, Linear, and ERA5 are similar, with maximum reductions of 6.8%, 6.6%, and 4.2%, and minimum values of −16.9%, −10.4%, and −1.89%, respectively. The adaptive fusion outperforms single models but remains less effective than spatio-temporal filtering and CSS. Spatio-temporal filtering achieves the second-best performance, with a maximum RMS reduction of 52.9%. CSS consistently delivers the highest performance, with a maximum RMS reduction of up to 71.4%. It also yields the highest mean reduction among all six methods. These quantitative comparisons confirm that CSS provides the most effective improvement over other correction methods, consistent with the findings discussed in the previous section.

3.2. Results of Deformation Mornitoring and Comparison with In Situ Measurements

In the Gangli mining area, a GNSS continuous monitoring system was deployed, providing hourly observations from December 2024 to June 2025. Meanwhile, numerous prisms were installed in the tailings dam, and a total station was used to periodically monitor groud displacement from January 2024 to April 2025. To validate the accuracy of the InSAR results and assess the effectiveness of different methods, this section compares the corrected InSAR time series with the corresponding in situ measurements.

3.2.1. Comparison with In Situ Measurements over the Mining Area

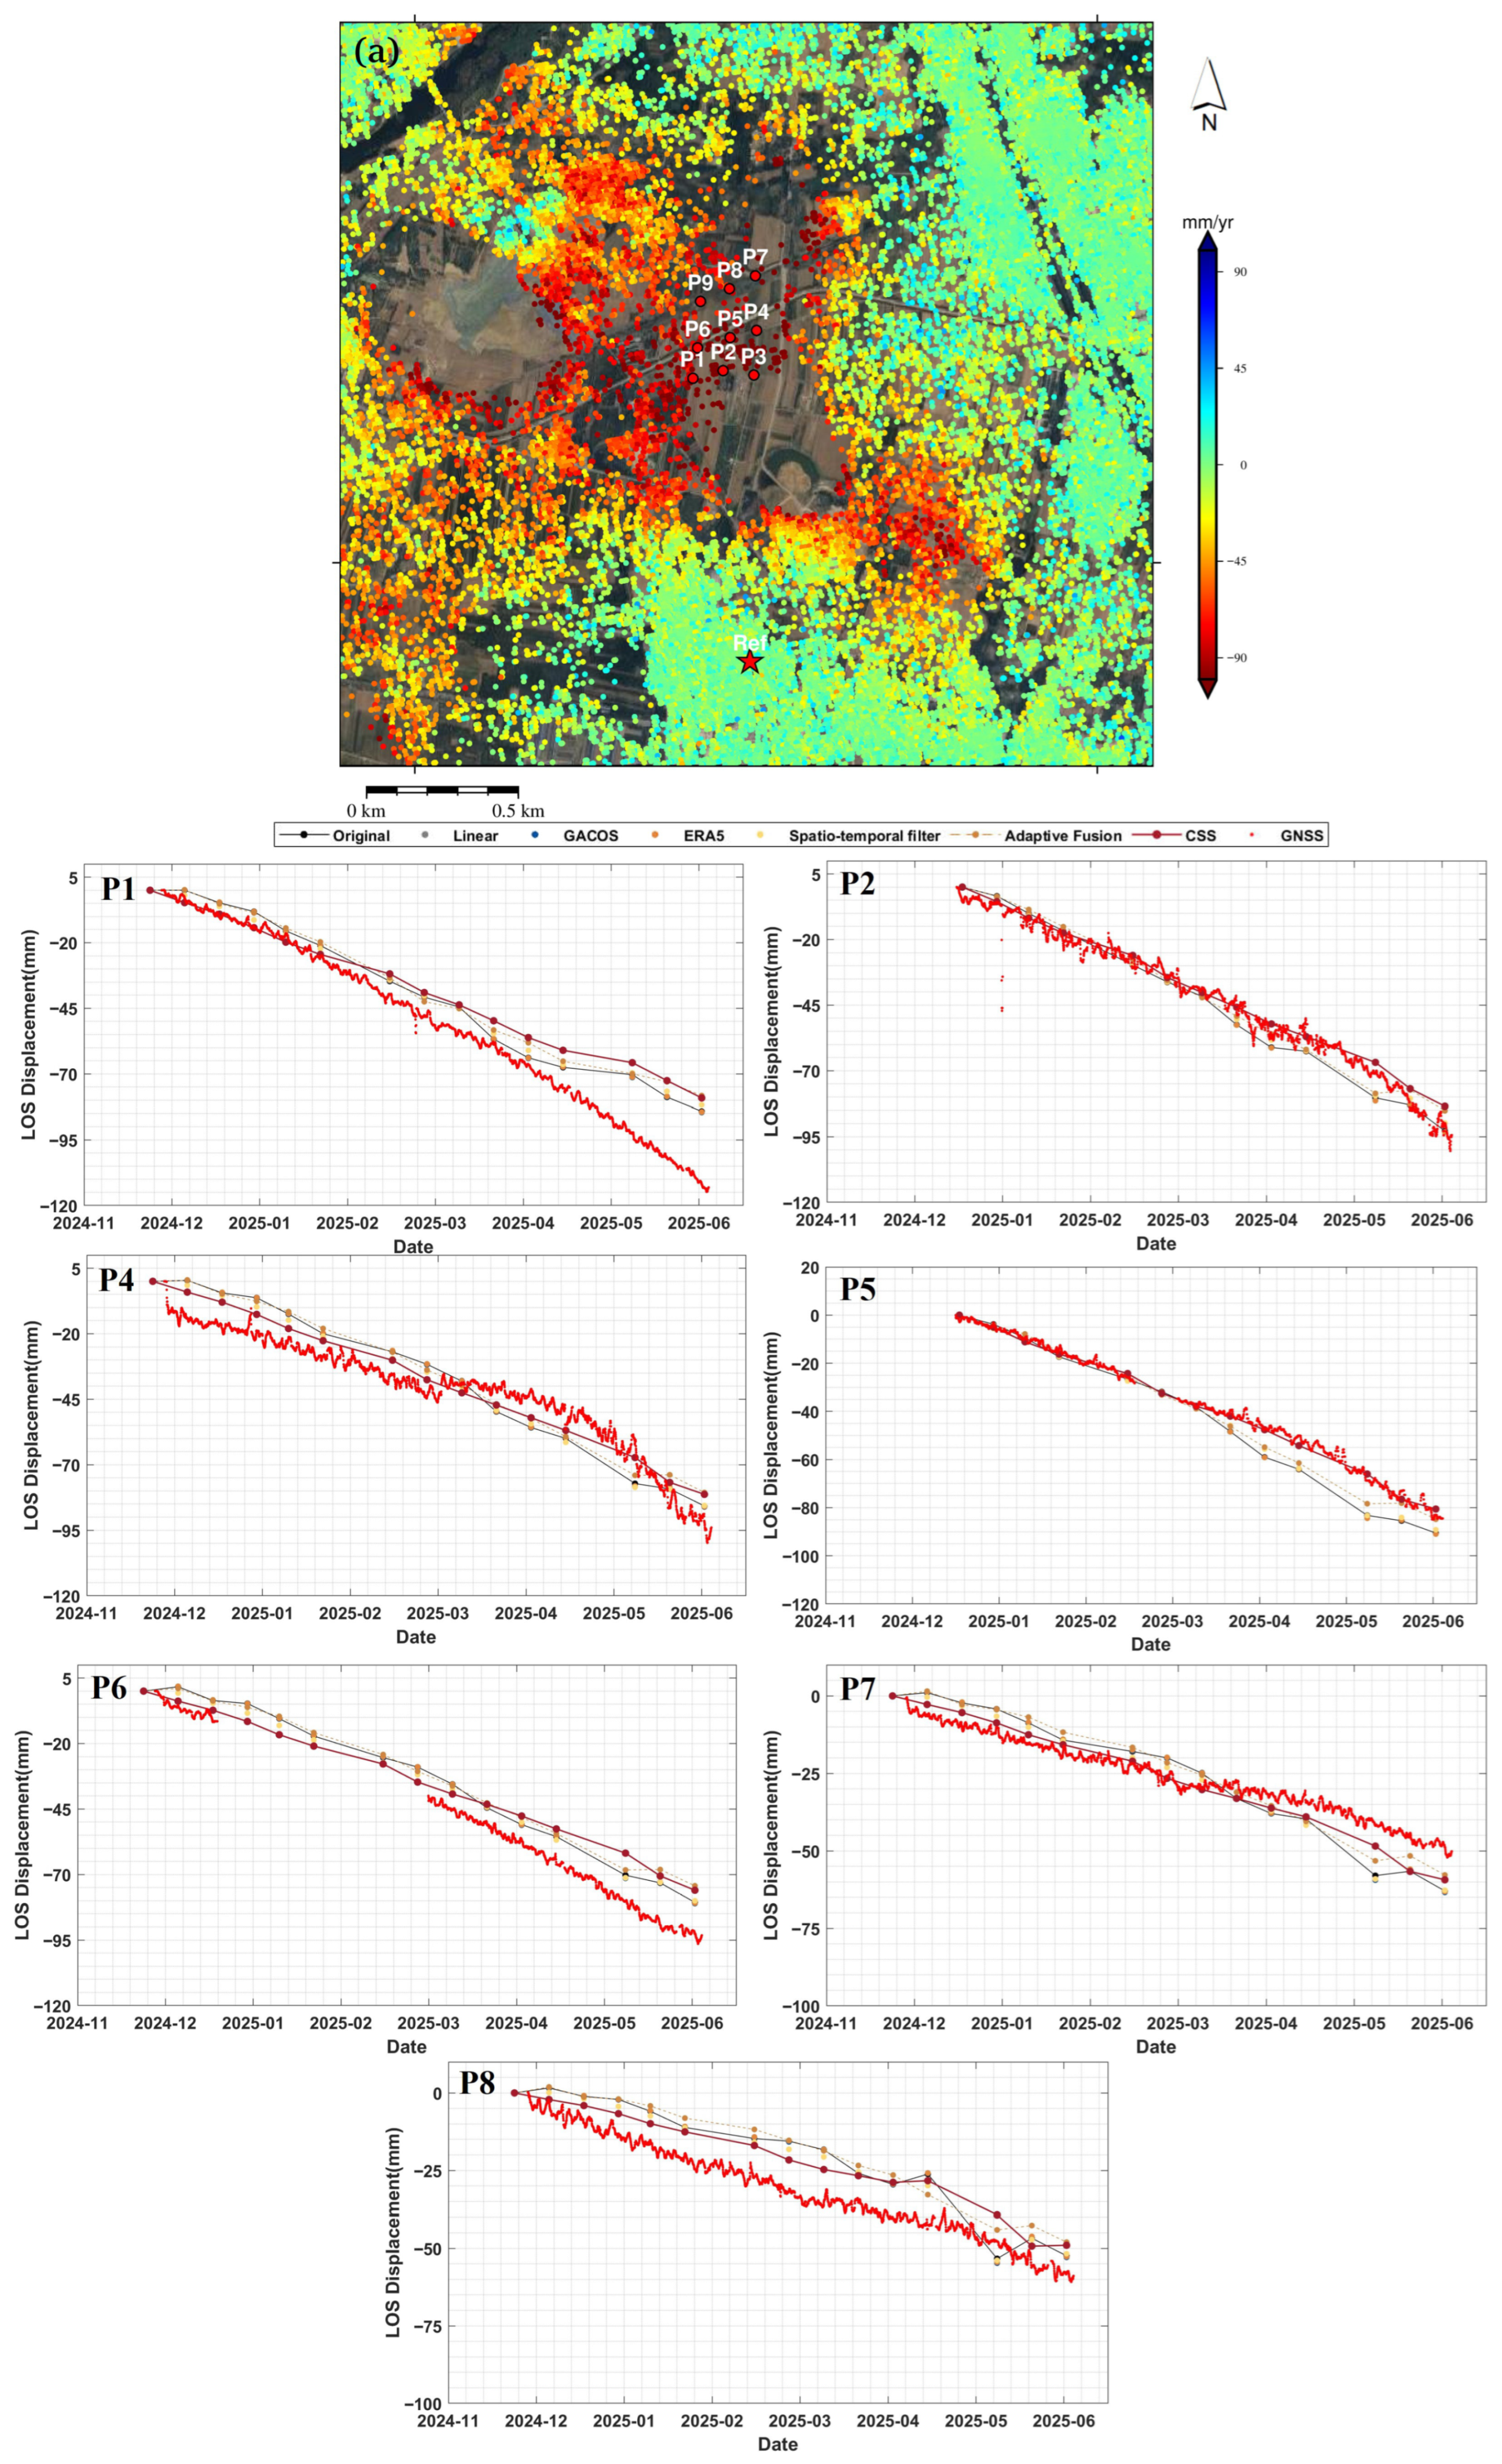
In this section, the InSAR results corresponding to the same observation period were selected and the same reference point was used for comparison. The InSAR monitoring points nearest to the GNSS stations within 100 m are selected for the comparions. Since GNSS measures three-dimensional (3D) deformation while InSAR observes deformation along the line-of-sight (LOS) direction. The GNSS 3D displacements were projected onto the LOS direction for comparison to validate the accuracy of InSAR monitoring. The spatial distribution of the monitoring points and the comparison results are shown in the Figure 9a.
As shown in Figure 9, the overall deformation at the monitoring points in this area exhibits a relatively linear trend, with a stable deformation rate during the study period. It is evident that atmospheric disturbances during this period were weak and differences among methods were small with generally consistent performance.
Notably, P3 is located at the edge of the central area of the Gangli East subsidence basin. GNSS observations show that the maximum cumulative LOS displacement at this point reached 228 mm during the this period. However, the C-band Sentinel data fail to provide enough stable coherent points in regions with large deformation gradients, resulting in low monitoring density. Consequently, InSAR could not effectively capture the deformation characteristics at this point. And P9 exhibits a similar condition. So results of these points are omitted.
Overall, our comparison focuses on the remaining available points. Comparison results indicate that the GNSS deformation rates at P1 and P8 are slightly higher than the corresponding InSAR results. The other points (P2, P4–P7) exhibit strong consistent with InSAR for both deformation rates and cumulative displacements. Notably, P2, P5, P6, and P7 have similar deformation rates, and the time series deformation of P2 and P5 are almost identical. It is also worth noting that P4 shows a brief uplift in March 2025, likely due to system errors. However, its final cumulative displacement remains comparable to the InSAR results.
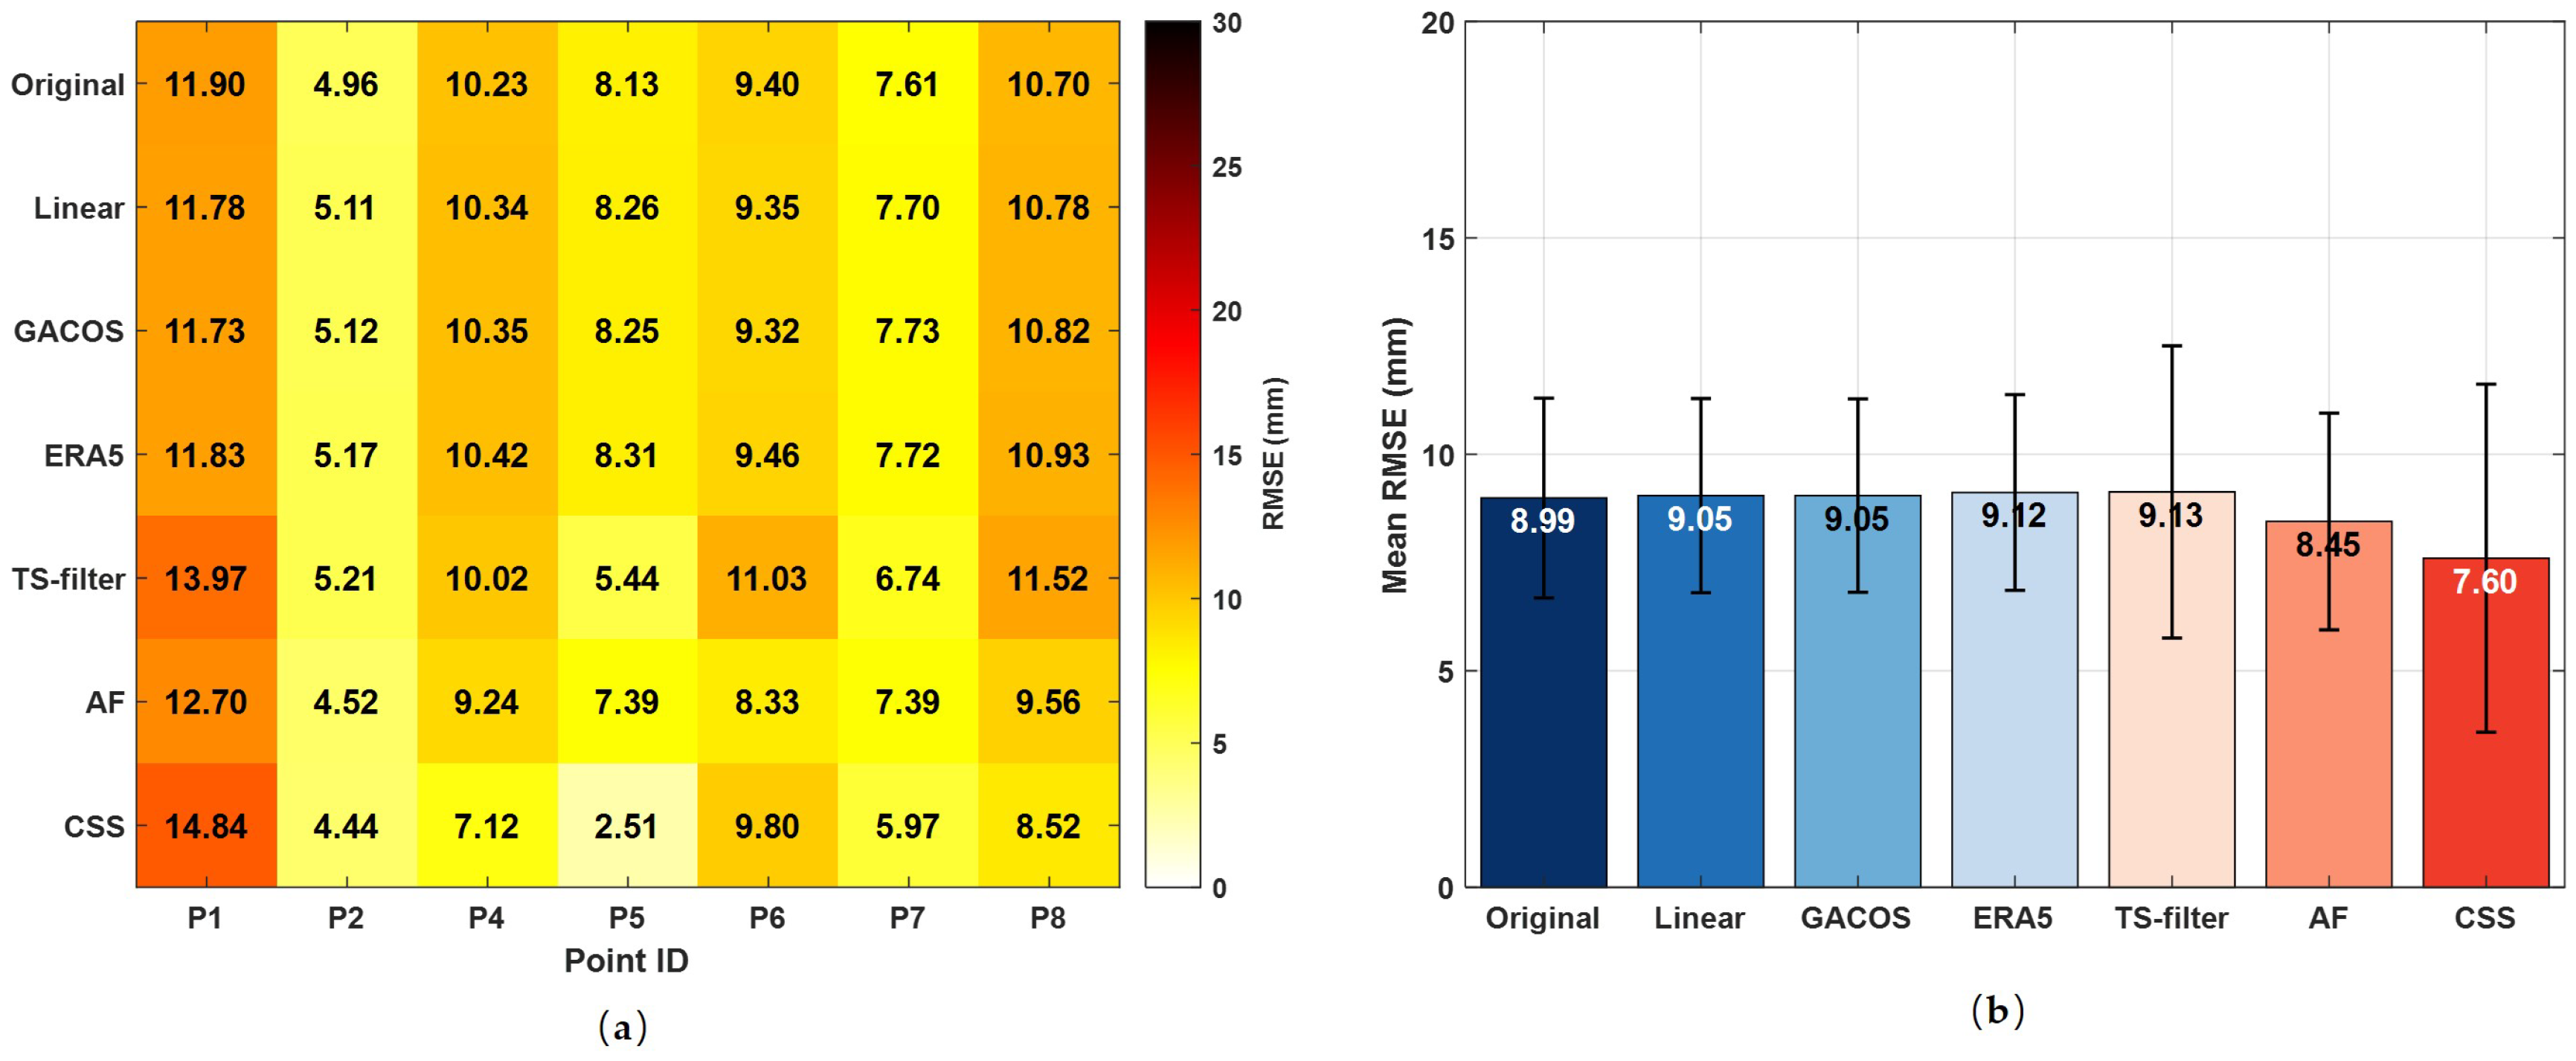
Further, the root mean square error (RMSE) was calculated to quantitatively compare corrected InSAR time series with GNSS results (Figure 10). Since the InSAR measurements during this period were less affected by atmospheric disturbances, the correction effect of each method was relatively limited. Overall, the RMSE after applying these correction methods showed little improvement compared with the original RMSE. However, the results indicate that CSS performs best with an average RMSE of 7.6 mm, followed by the adaptive fusion method with 8.45 mm. The other methods have average RMSE values around 9 mm, showing minor differences. Notably, likely due to partial filtering of deformation signal, spatio-temporal filtering exhibits the highest average RMSE. In addition, the RMSE values at P1, P4, and P8 are noticeably higher than those at the other points. The elevated RMSE values at P1 is mainly because the deformation rate detected by InSAR is slightly lower than that measured by GNSS. At P4, the higher RMSE is attributed to an anomalous uplift in the GNSS observations. Finally, the increased RMSE at P8 results from a systematic bias between the InSAR and GNSS measurements.
In summary, although the overall deformation magnitude in this area is relatively large, the accuracy of InSAR monitoring can be maintained within 10 mm, and after CSS correction, it can be controlled within 8 mm.

3.2.2. Comparison with In Situ Measurements over the Tailings Dam

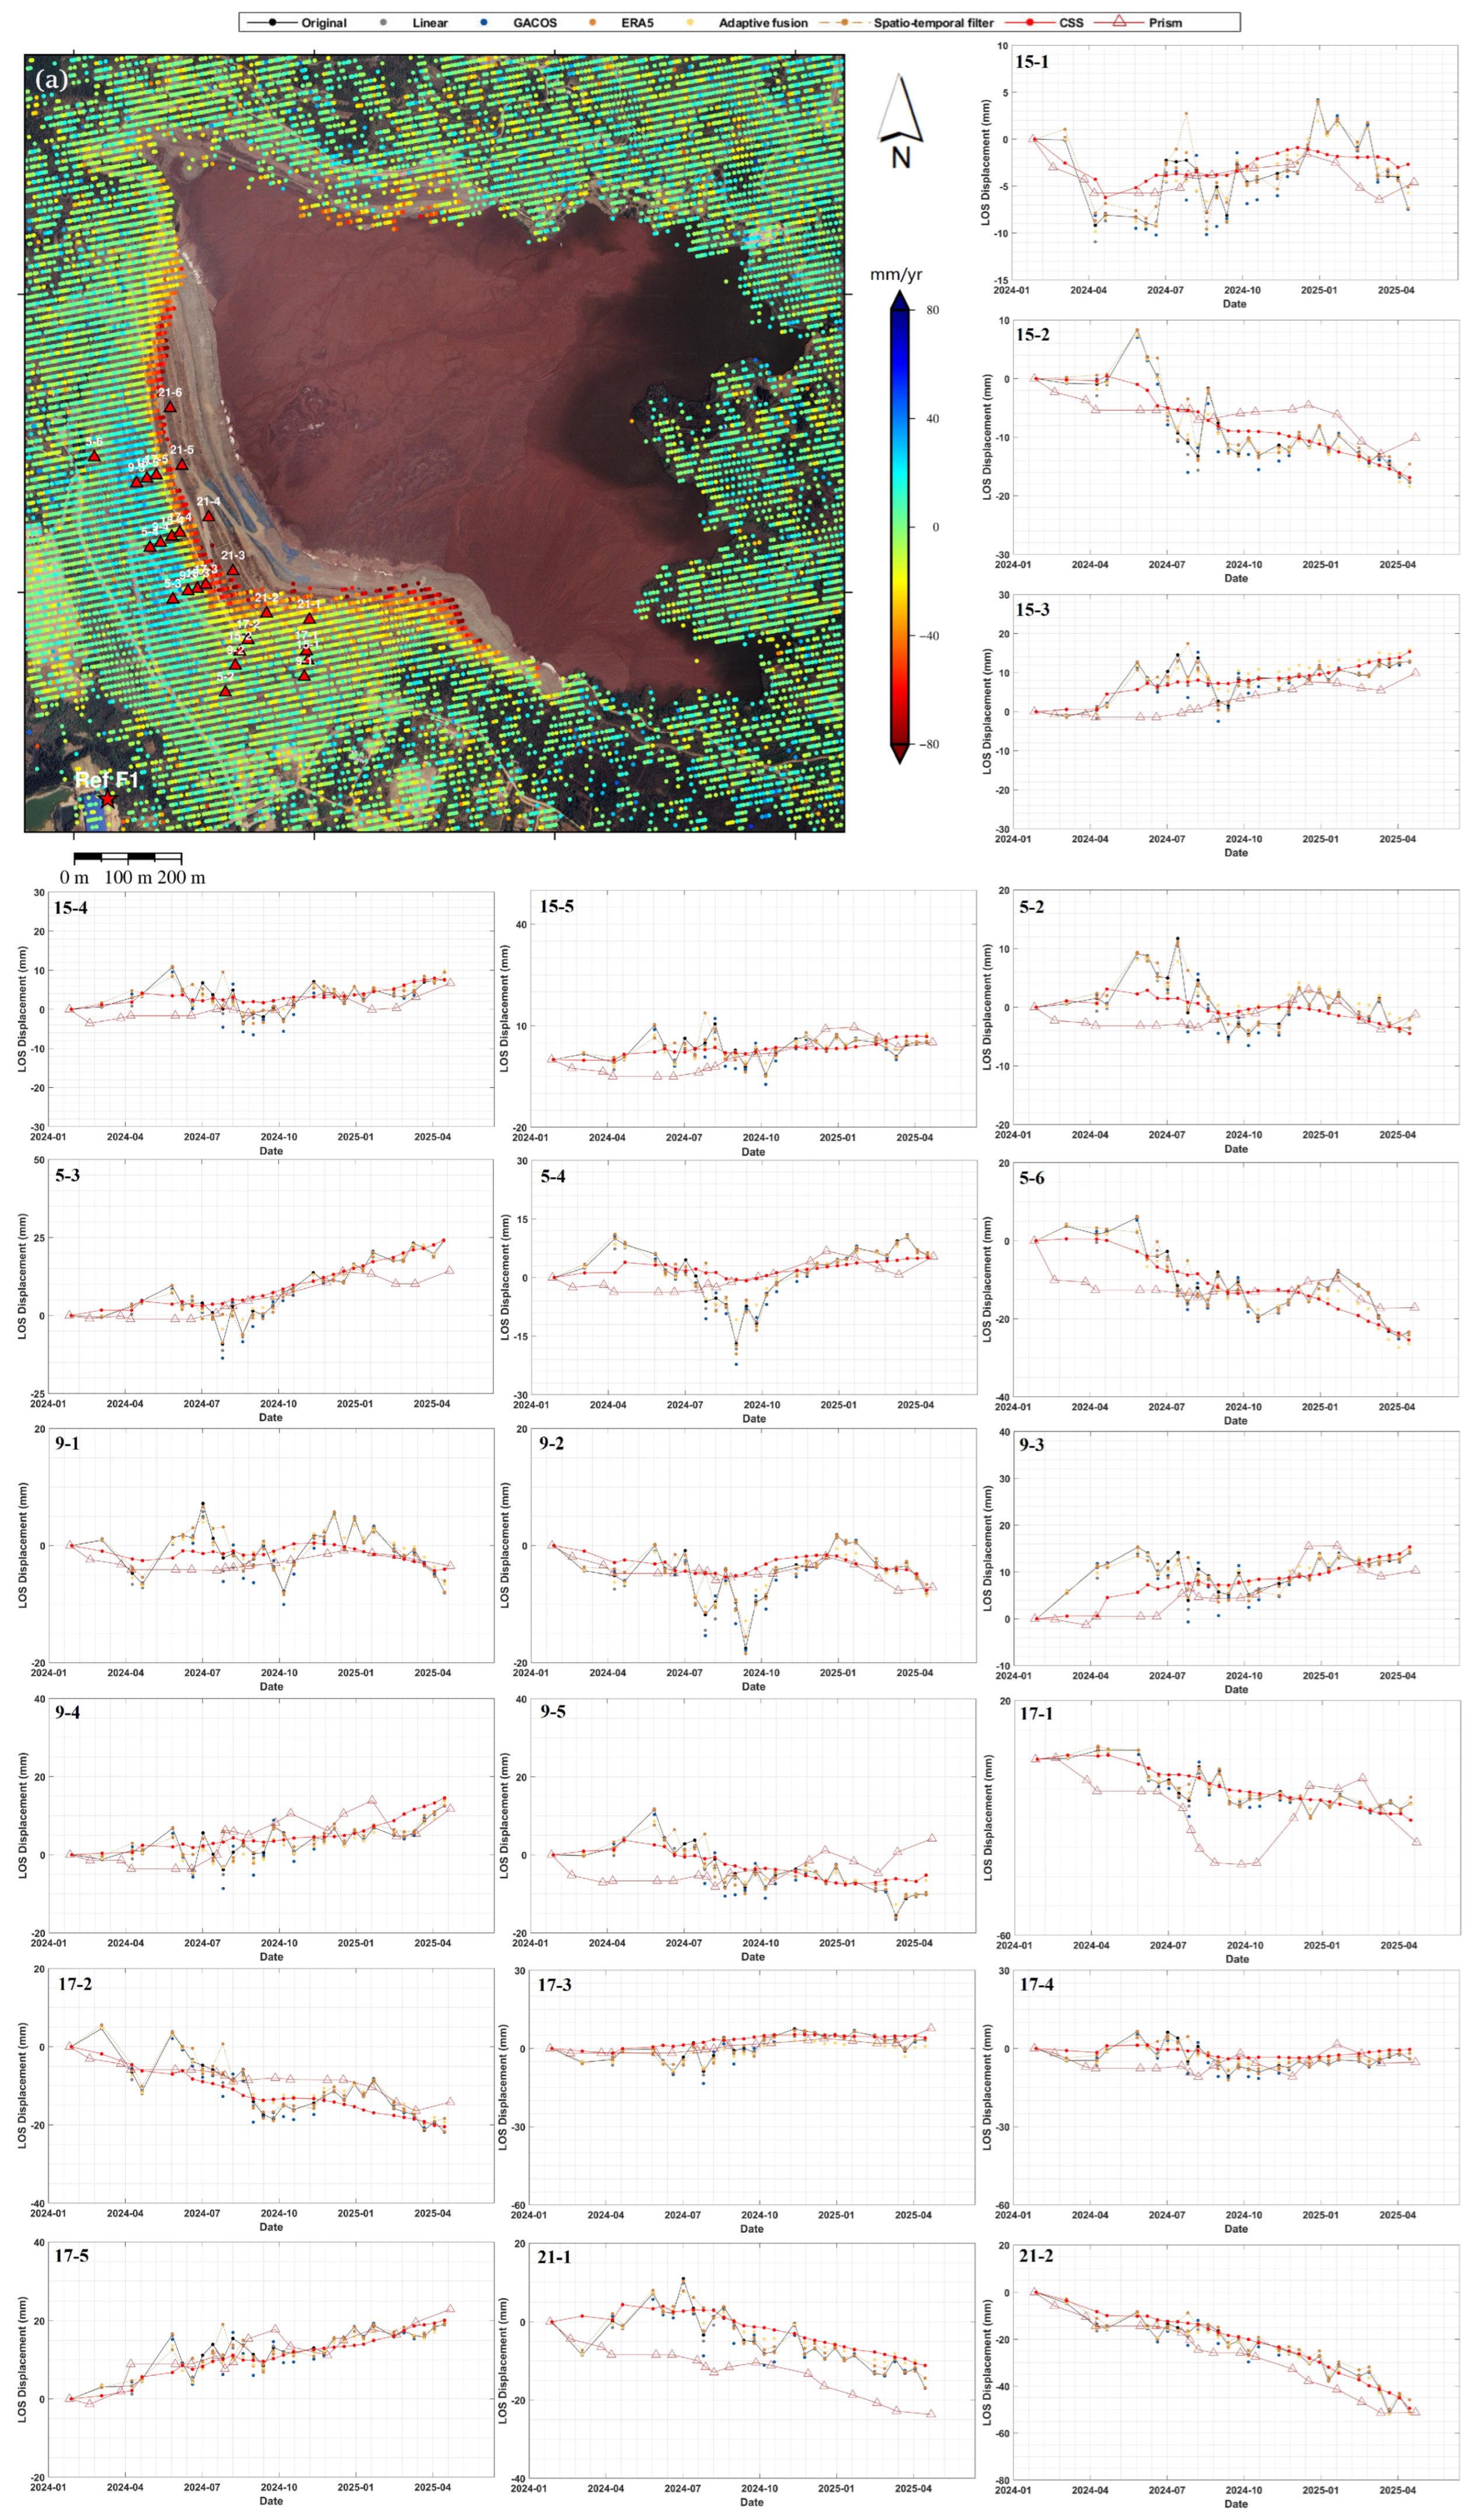
In the tailings dam, 26 prism sites were installed along the southwestern dam as shown in Figure 11a. Monitoring was conducted monthly from January 2024 to April 2025. For comparison with InSAR results, the 3D displacements were also projected onto the LOS direction. The InSAR monitoring points nearest to the prisms within 100 m are selected for the comparions.
Similarly, no available coherent points exist near 21-3, 21-4, 21-5, and 21-6, so their comparison results are not presented. As shown in Figure 11, the overall deformation trend and cumulative displacement observed by InSAR show a high correlation with prism measurements. Some sites measurements, particularly points with suffixes 3, 4, and 5, show apparent uplift after projection onto the LOS direction. These points are located on the same slope, with the dam facing the sensor and slope angles smaller than the radar incidence angle. In such cases, landslide displacement causes the ground to move toward the satellite along the line of sight (LOS). This movement results in apparent uplift. The observed uplift is generally consistent with the InSAR results.
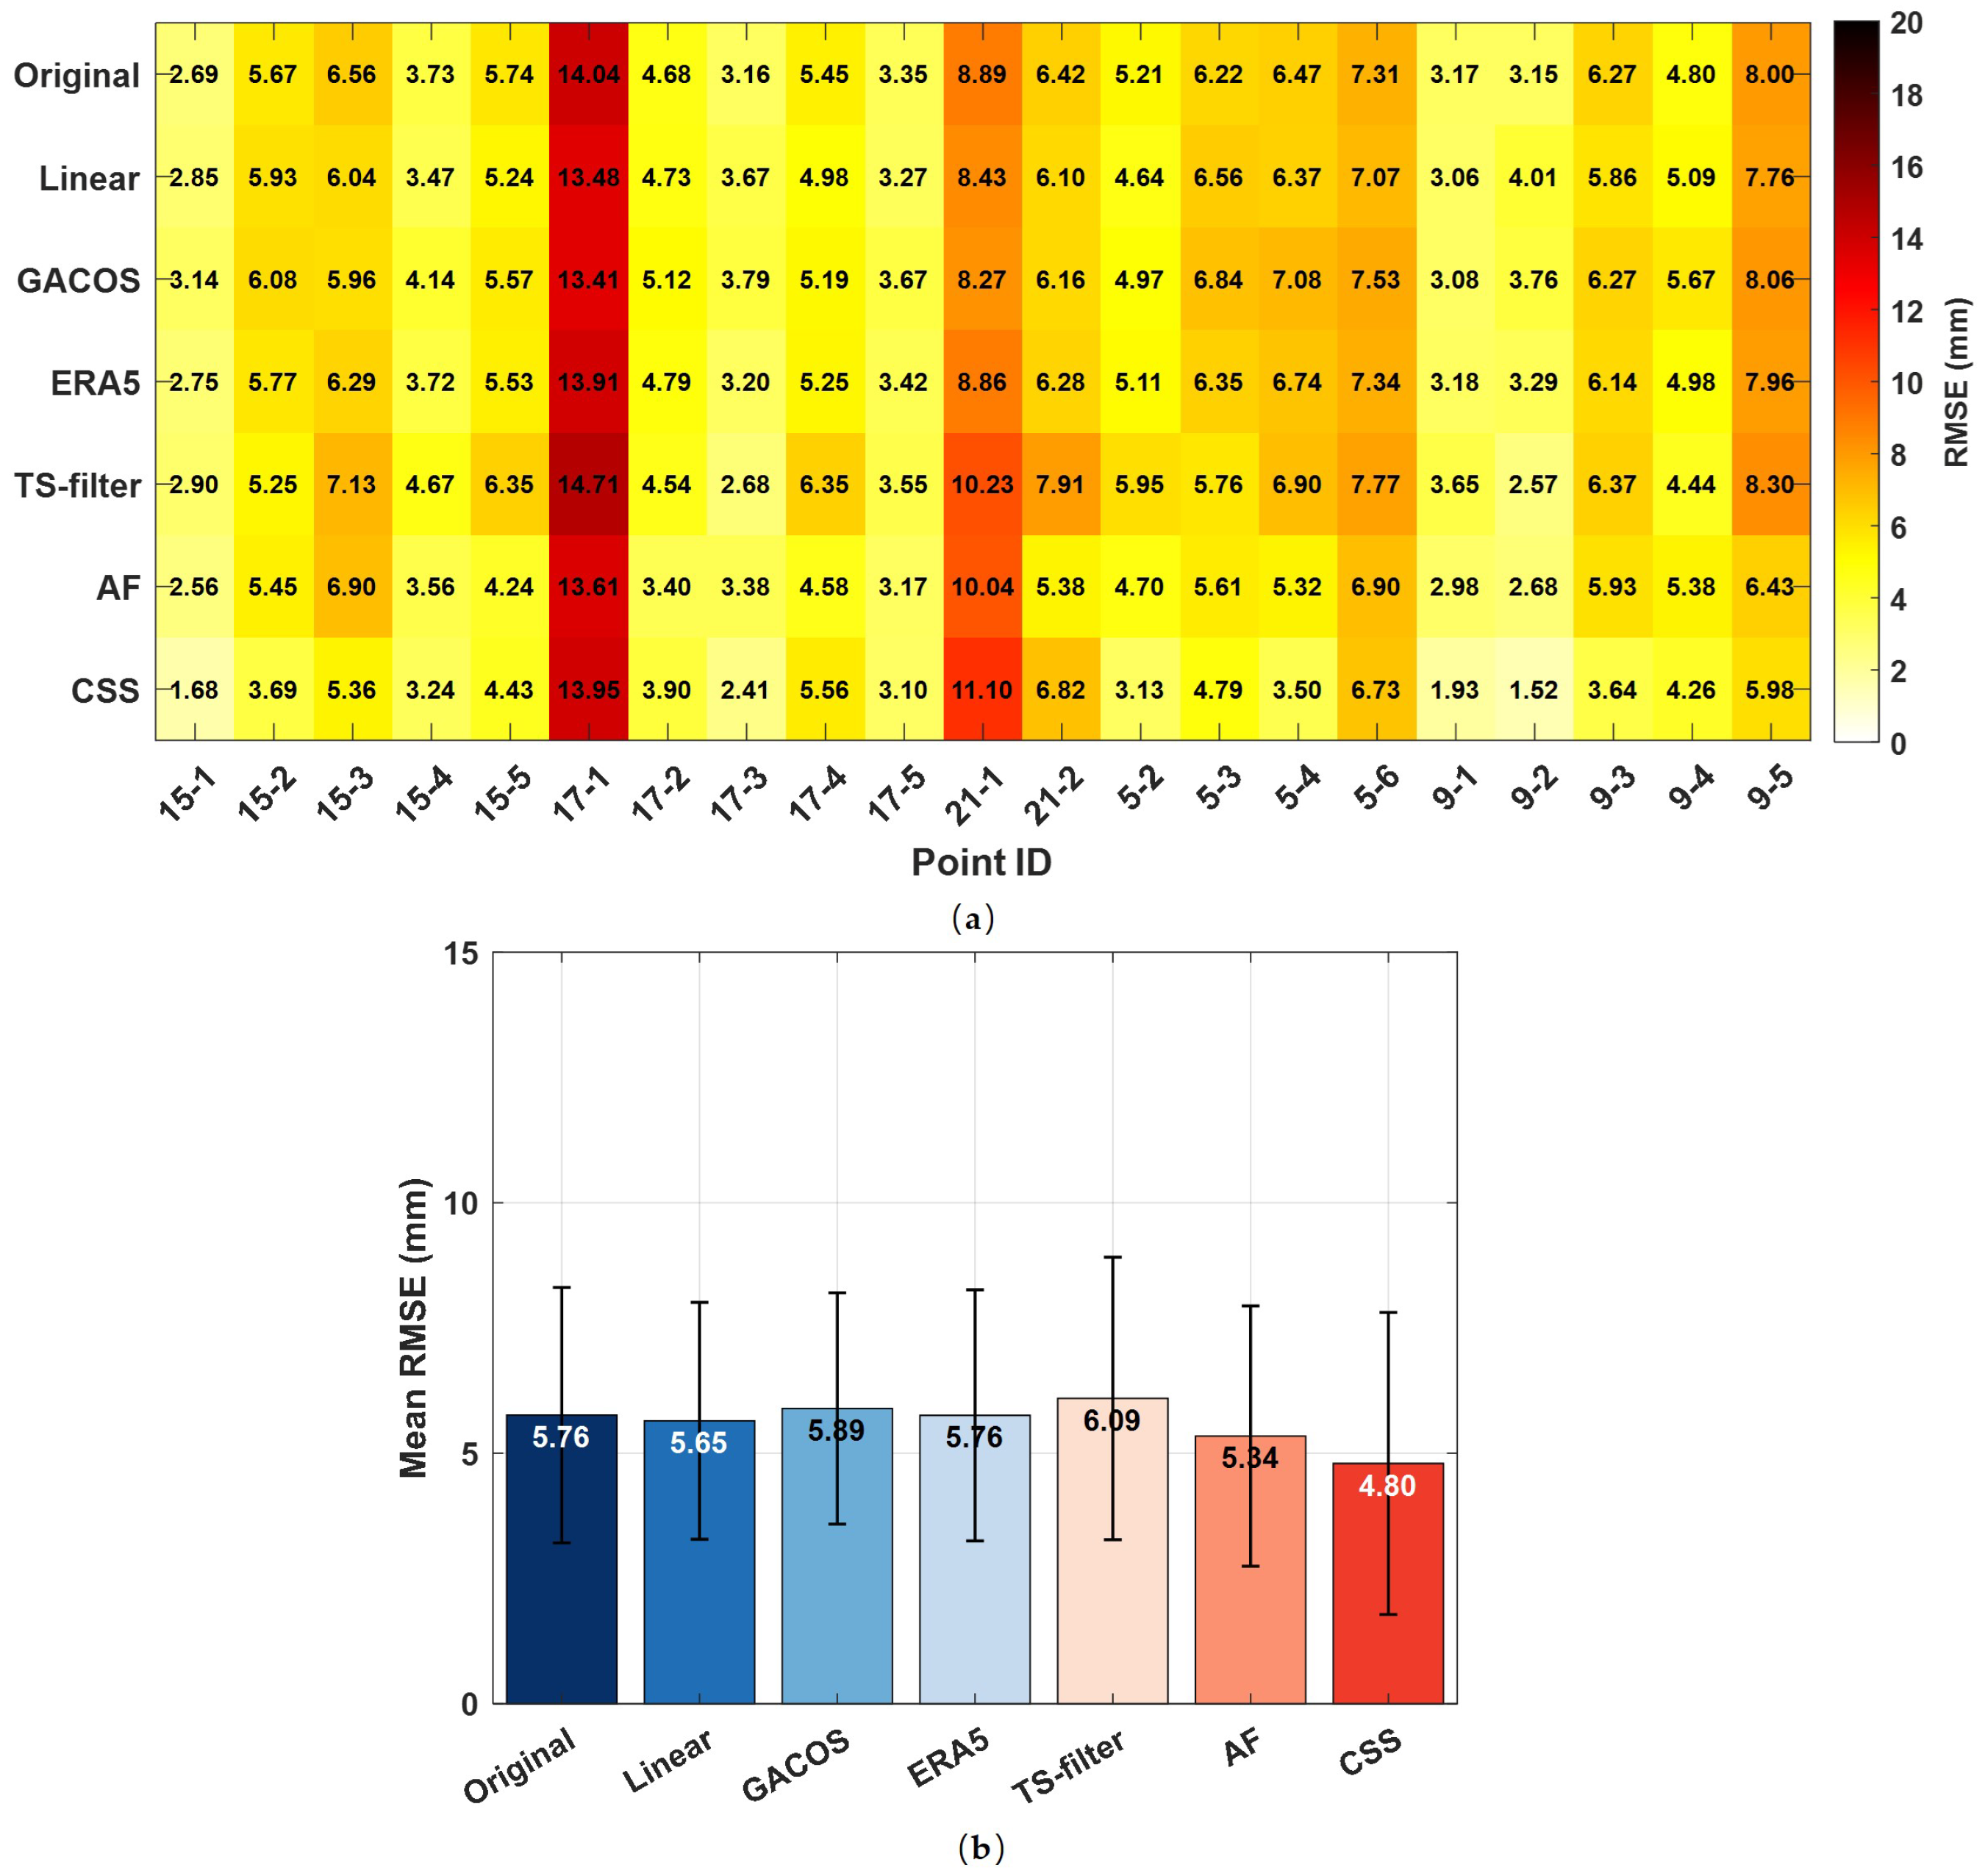
Figure 12 presents the RMSE values comparing InSAR and prism measurements. Points 17-1 shows large oscillations, which cause significant deviations from the in-situ data. Points 21-1 and 21-2 show a systematic bias relative to the InSAR results, leading to higher RMSE values as well. However, the overall deformation rates at these points remain similar to the InSAR results.
Regarding the performance of different methods, the tailings dam shows results consistent with the mining area. CSS achieves the lowest average RMSE of 4.80 mm and performs best among all methods. Except for points 15-5, 17-1, 17-2, 17-4, 21-1, and 21-2, the remaining monitoring points have the lowest RMSE values. Adaptive fusion ranks second with an average RMSE of 5.34 mm, while spatio-temporal filtering still maintains the highest RMSE. Since the deformation magnitude in this area is smaller than in the mining area, the InSAR monitoring accuracy is higher. After CSS correction, the InSAR time series can achieve a precision within 5 mm.

4. Discussion

4.1. Comparison of Original and Improved CSS

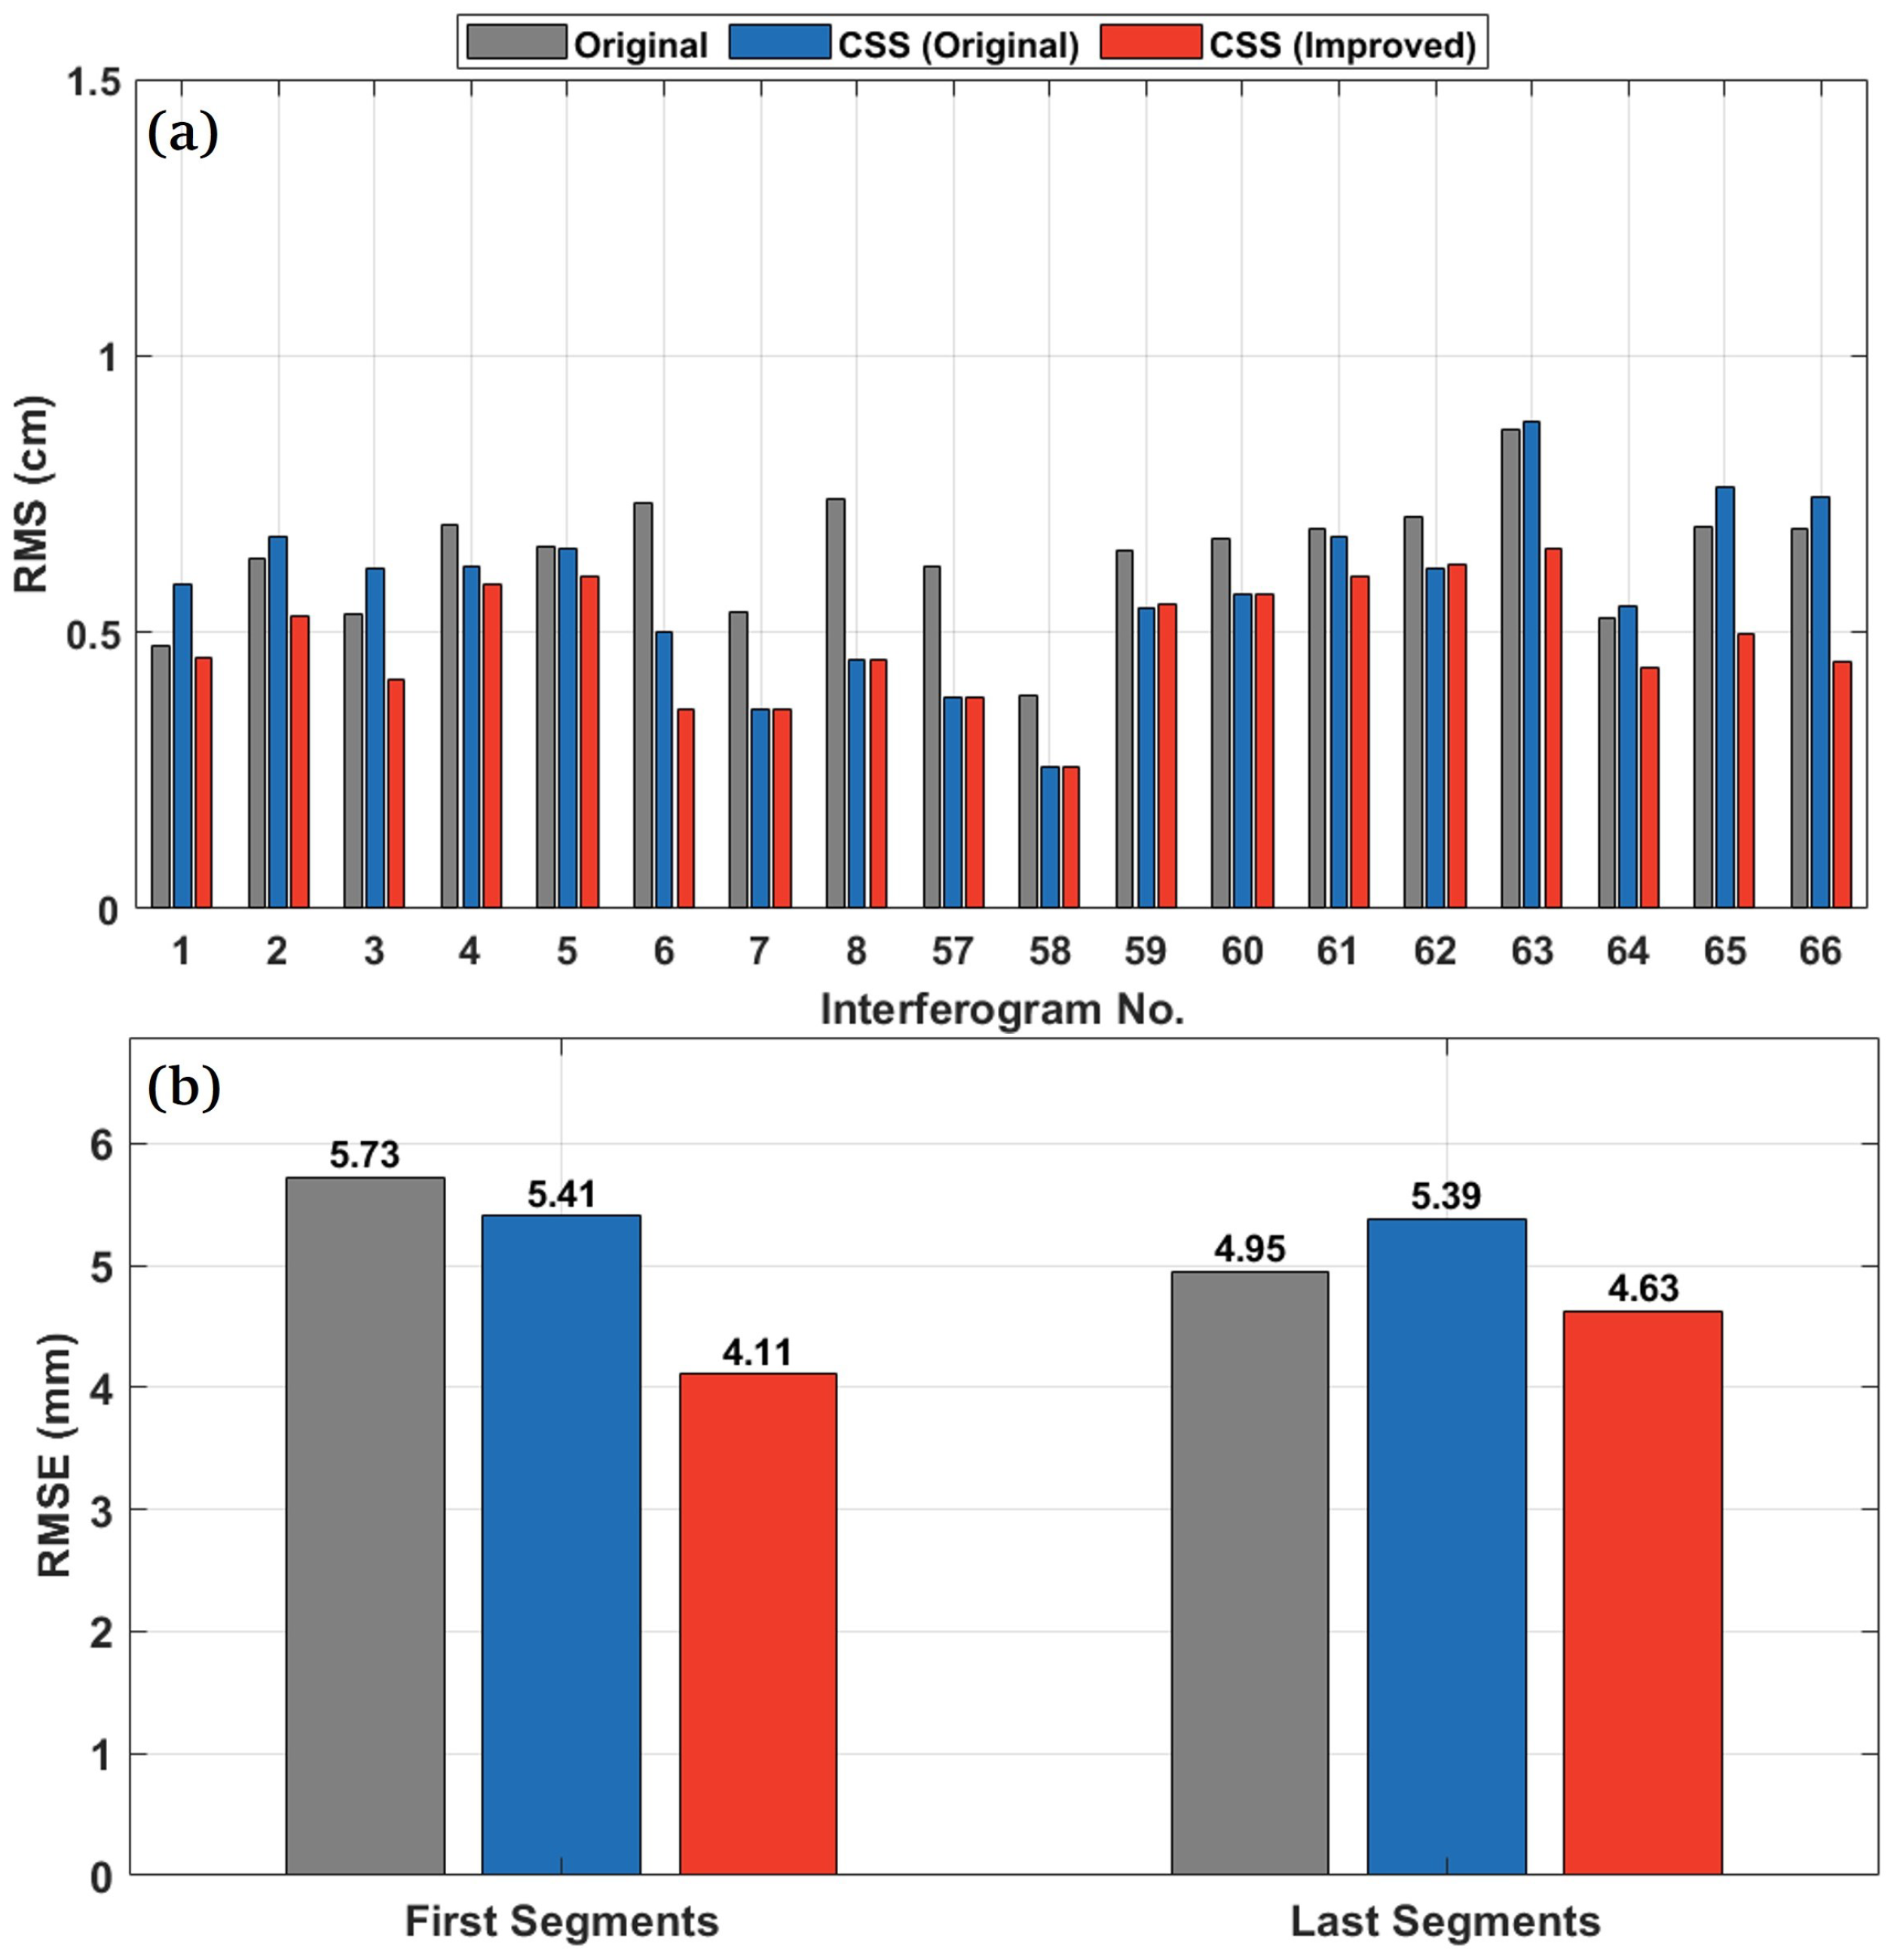
This section evaluates the performance improvement of the improved CSS method for SAR acquisitions at the temporal edges. We observed that when the number of edge dates n exceeds six, the performance of the original and improved CSS methods converges. Therefore, we set n = 6 as the standard and compute the RMS of the corrected interferometric phase and the RMSE of in-situ measurements to assess the optimization achieved by the improved CSS compared with the original CSS method.
Figure 13 compares the RMS of the corrected interferometric phase and the RMSE of observed deformations for the interferograms corresponding to the edge acquisition dates. As shown in Figure 13a, the improved CSS method clearly outperforms the original CSS at the temporal edges. Near the center of the time series, both methods achieve comparable correction performance. The average RMS values are 0.49 cm and 0.58 cm for the improved and original CSS, respectively, corresponding to a 19.1% improvement over the original method. Similarly, Figure 13b shows the comparison of the average RMSE between the temporal deformation and in-situ measurements. Here, we selected the in-situ measurements from the tailings area, which include a larger number of points, span a longer time period, and are more susceptible to tropospheric delay effects. So it can be observed that the improved CSS method also outperforms the original CSS, achieving lower RMSE values, with improvements of 24.0% and 14.1% in the front and back segments, respectively. Therefore, for the data corresponding to edge acquisition dates, improved CSS outperforms the original in both interferometric phase RMS and RMSE, providing a more accurate estimation of tropospheric delays.

4.2. Deformation Analysis

4.2.1. Deformation Analysis over the Mining Area

In the previous section, we compared InSAR results with in situ measurements to confirm the reliability of the InSAR monitoring. Based on these validated results, this section will analyze the deformation over the mining area.
During long-term collapse mining, ground surface of the study area has experienced extensive subsidence, cracking, and collapse, forming multiple sinkholes. Some of these collapse zones are extensive and have existed for a long time. For example, a portion of the Xiaoguanzhuang mining area has collapsed, with the affected surface area reaching 6 km2. And this collapse patterns are complex. Outside these collapse zones, the ground surface includes farmland, rivers, roads, and villages, creating a complex environment that requires controlling the further expansion of subsidence.
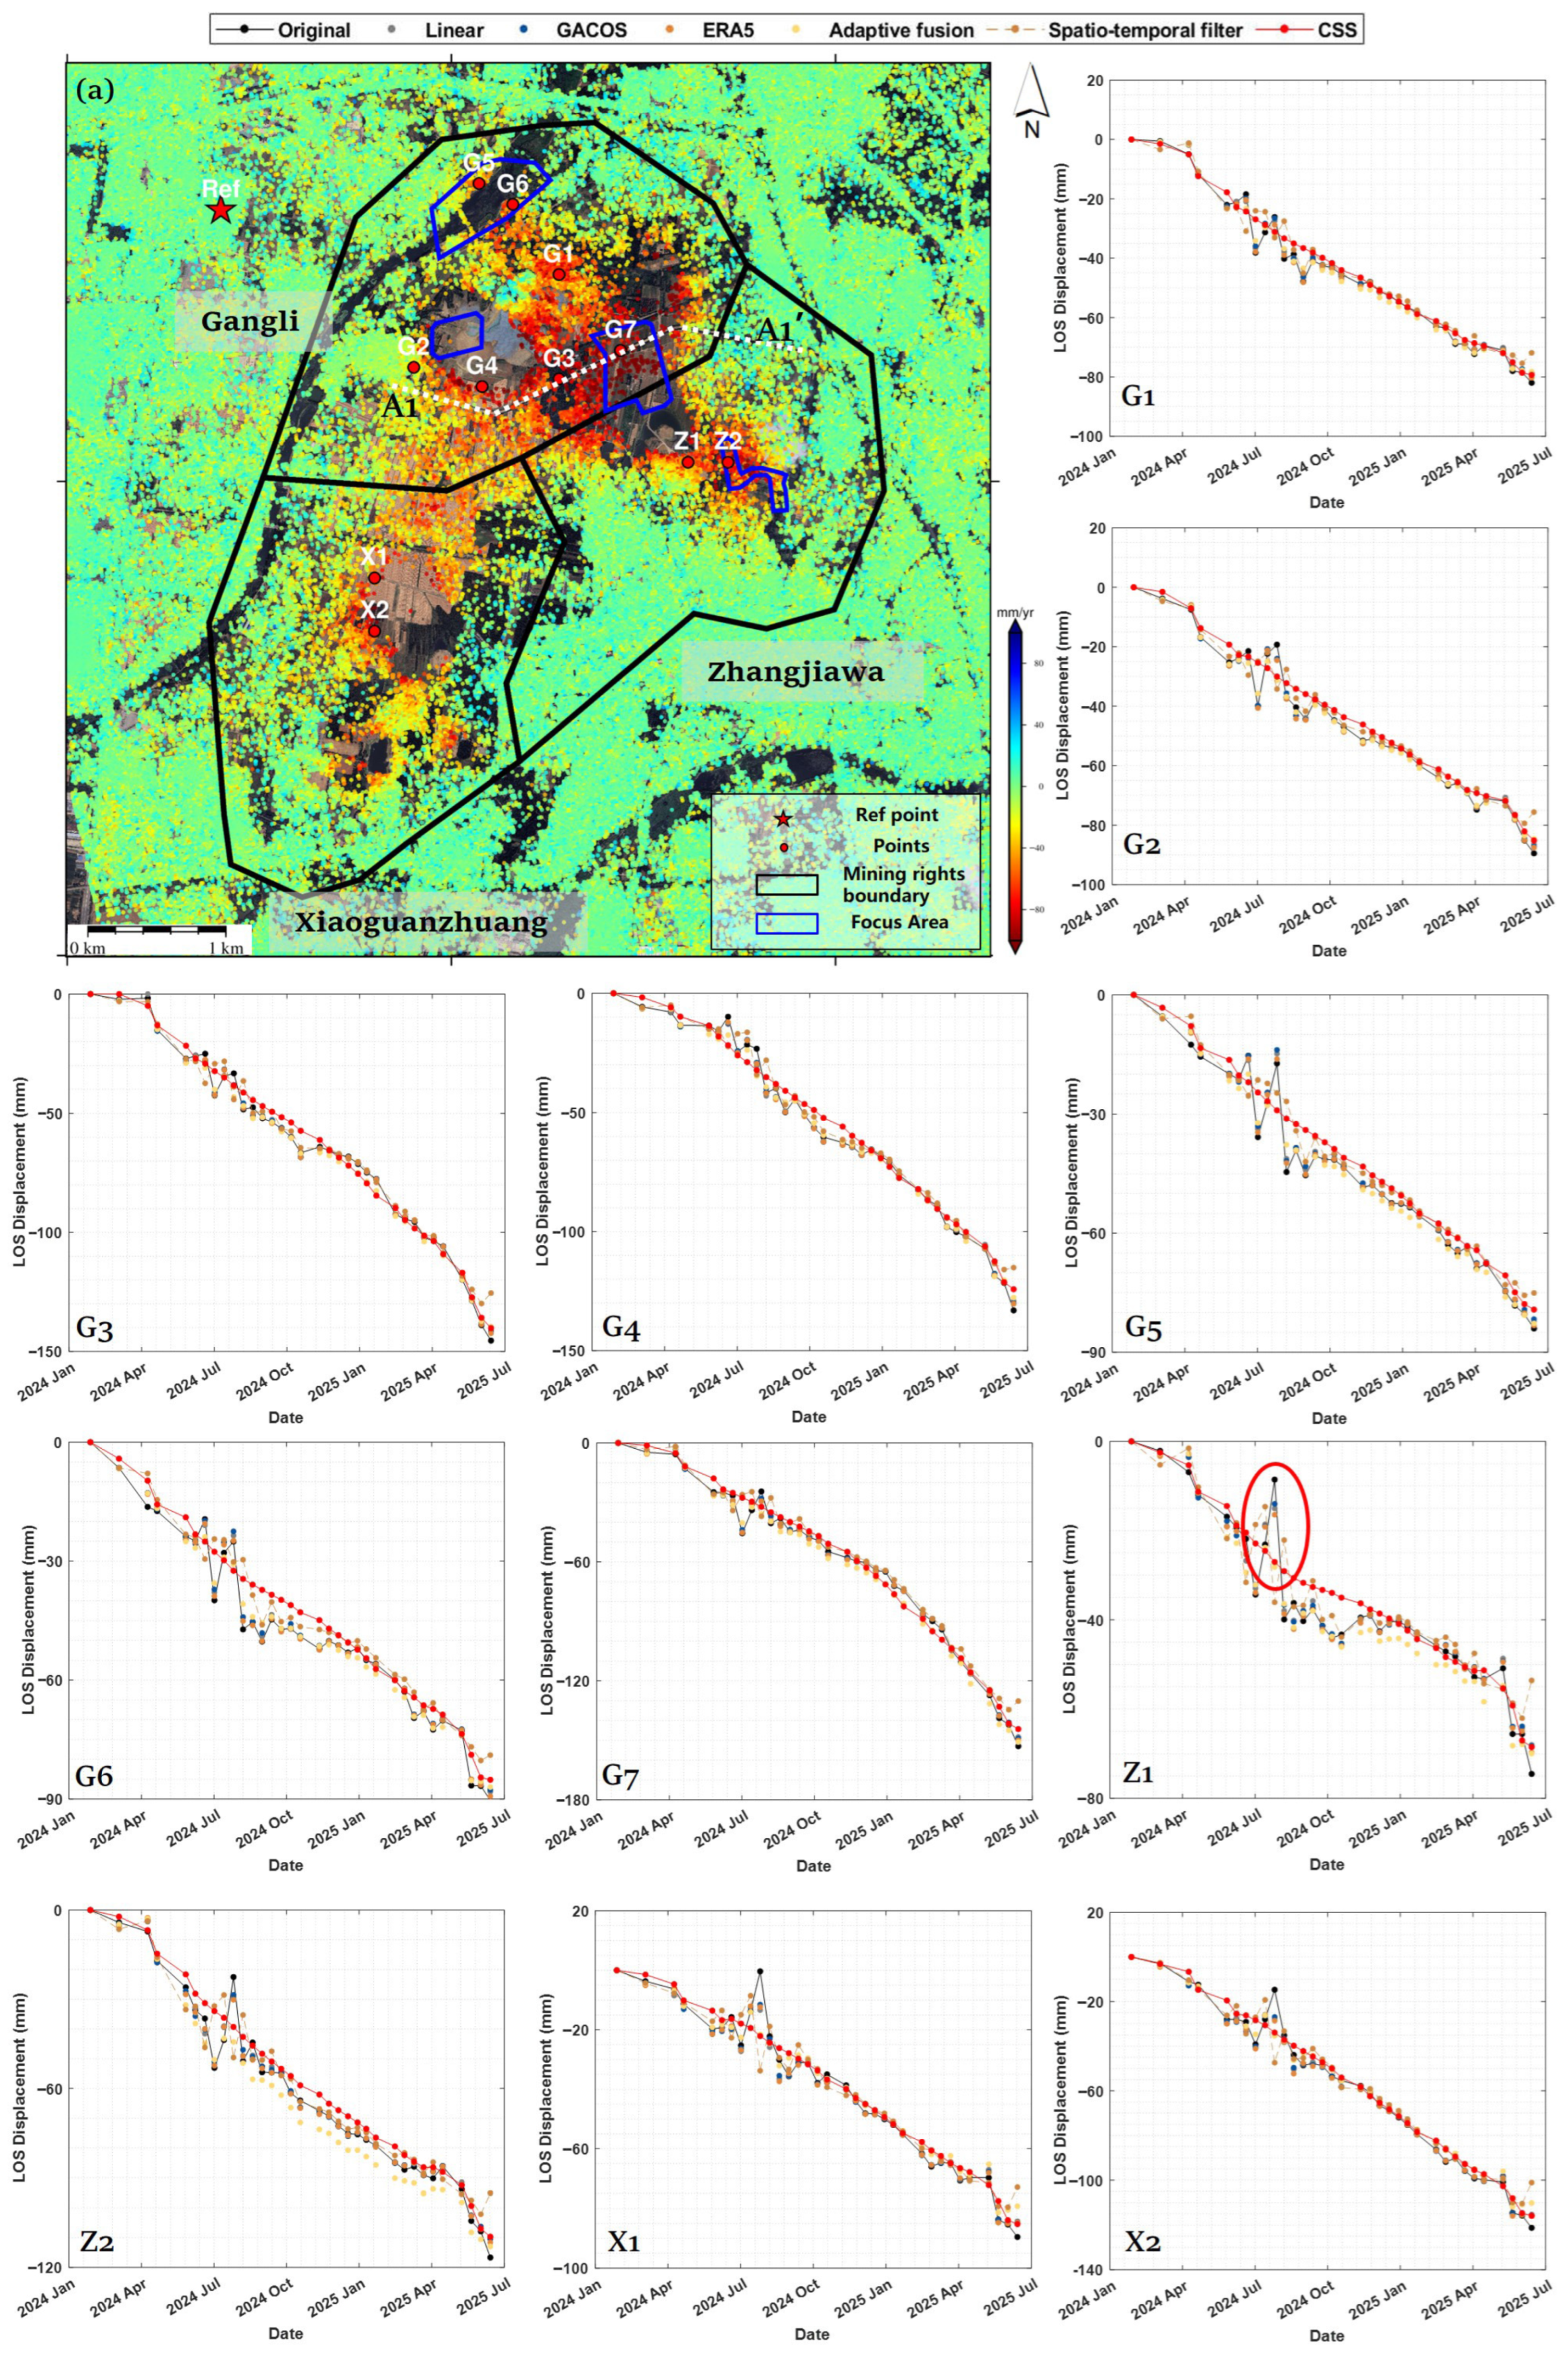
As shown in Figure 14a, the annual average deformation rate reveals multiple subsidence funnels caused by underground mining. These are mainly distributed in Gangli West, Gangli East, Zhangjiawa, and Xiaoguanzhuang mining areas. Due to intensive mining activity, the deformation gradients at the funnel centers exceed the monitoring capability of C-band SAR, resulting in insufficient coherent points. The maximum ground subsidence rate at the funnel edges reaches 168.5 mm/y, located in the backfilling area of Gangli East.
To better reveal the temporal evolution of deformation, several representative monitoring points were selected for time series analysis. Figure 14 presents the InSAR time series at G1–X2 using different methods. G1–G7, X1–X2, and Z1–Z2 are located in the Gangli, Xiaoguanzhuang, and Zhangjiawa mining areas, respectively. The tropospheric delay in this region is relatively minor, with major atmospheric errors concentrated in summer. InSAR results during the summer months (June–September) exhibit varying degrees of oscillation due to uneven precipitation distribution which is mainly concentrated in this period. Frequent changes in water vapor exacerbate atmospheric effects and reduce coherence. For instance, the time series at Z1 shows an anomalous uplift on 25 July 2024 due to strong convective weather; after CSS correction, the subsidence trend becomes stable.
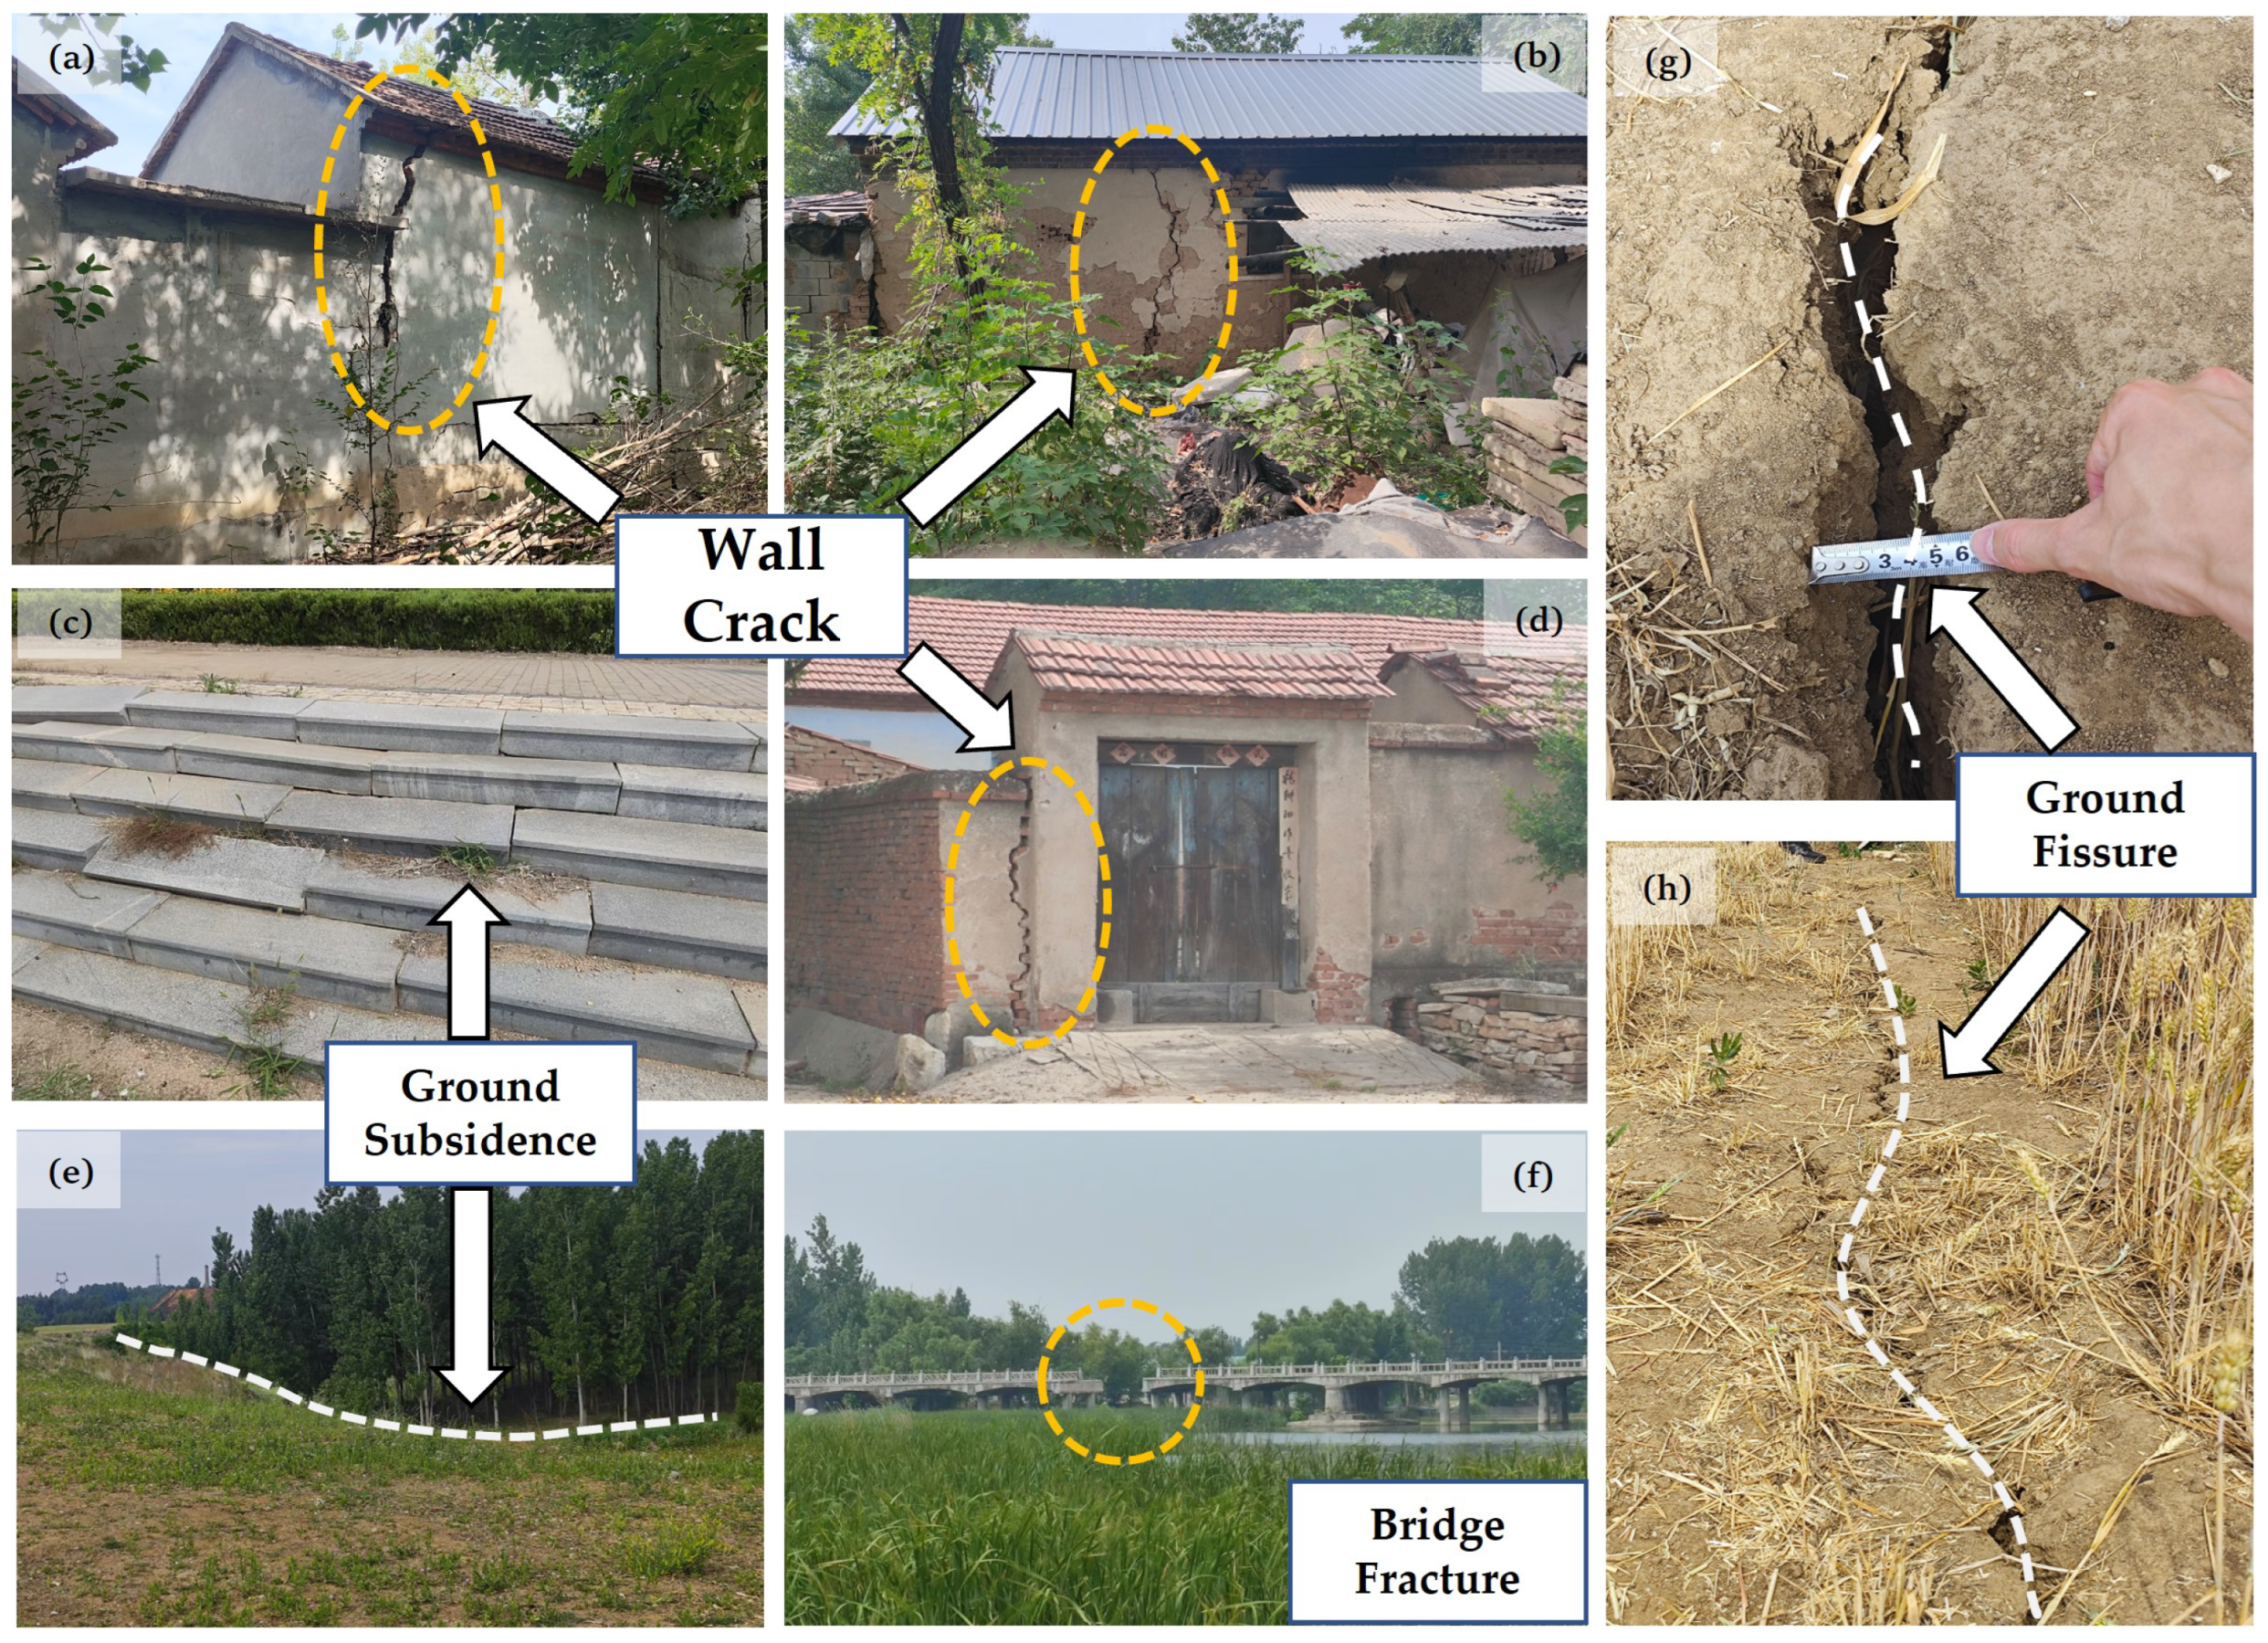
Based on the results corrected by CSS, we analyzed deformation over the mining area. G1 is located north of the Gangli mining area, while G2, G3, and G4 are situated at the edges of the subsidence basin. These points exhibit similar deformation trends. During this period, continuous subsidence is observed with the maximum cumulative displacement exceeding 145 mm. Notably, G2 is located east of Shantoudian Village, close to the Gangli West subsidence basin, with a maximum deformation rate of −40 mm/y. Despite ongoing backfilling activities, many buildings in this village are affected by mining activities, exhibiting ground fissures and wall cracks of varying severity as shown in Figure 15.
In terms of the correction performance, all methods provide some degree of improvement. GACOS, Linear, and ERA5 yield similar but limited corrections. Adaptive fusion outperforms any single model but cannot fully remove high-frequency tropospheric delays. Spatio-temporal filtering can correct part of atmospheric errors, and the time series becomes somewhat smoother, but summer fluctuations remain large and some deformation signals may be filtered out. Overall, CSS performs best and produces the smoothest InSAR time series.
G5 and G6 are located on both sides of the Longma River, where deformation has occurred at a relatively uniform rate since 2024. The maximum cumulative displacements are 83.6 mm, with deformation rates of −55.3 mm/y and −56.5 mm/y, respectively. As shown in Figure 15c,f, significant collapse phenomena are observed on the plaza steps, and mining-induced subsidence has further caused bridge damage. Although underground mining activities continue in Gangli West and the Longma River area, surface deformation remains relatively stable and exhibits approximately linear behavior.
G7 is located in the backfilling area on the eastern side of the Gangli. In 2024, subsidence occurred at a constant rate. While accelerated subsidence is observed after 2025 with a rate of −167.4 mm/y. This phenomenon is highly correlated with underground mining activities. The overall deformation rate at G7 is −107.3 mm/y, with a maximum cumulative displacement of 144.3 mm. This area corresponds to the region with the largest detectable deformation and covers extensive farmland. Due to underground mining, ground fissures exceeding 5 cm have developed as shown in Figure 15g–h.
Z1 is located at the southern edge of the Zhangjiawa subsidence basin. The time series indicates two distinct deformation stages: from January to July 2024, subsidence occurred at a relatively high rate, followed by a slower rate until April 2025. Subsidence accelerated again after April 2025. The maximum cumulative displacement at Z1 is 63.5 mm, with an overall deformation rate of −39.9 mm/y. Z2 is a key monitoring point within the Zhangjiawa mining area, situated closer to the underground mining activities. Deformation at this location is more pronounced than at Z1, with a maximum cumulative displacement of 109.7 mm and a deformation rate of −79.0 mm/y. The time series for both points show that accelerated subsidence began in April 2025, which may indicate an increased risk in this area and warrants attention.
X1 and X2 are located at the western edge of the Xiaoguanzhuang subsidence basin. They exhibit similar deformation patterns and magnitudes, with deformation rates of −45.0 mm/y and −54.0 mm/y, respectively. During this period, the surface subsidence in this area occurred at a relatively constant rate without significant acceleration, resulting in a stable deformation pattern and a maximum cumulative displacement of 59 mm.
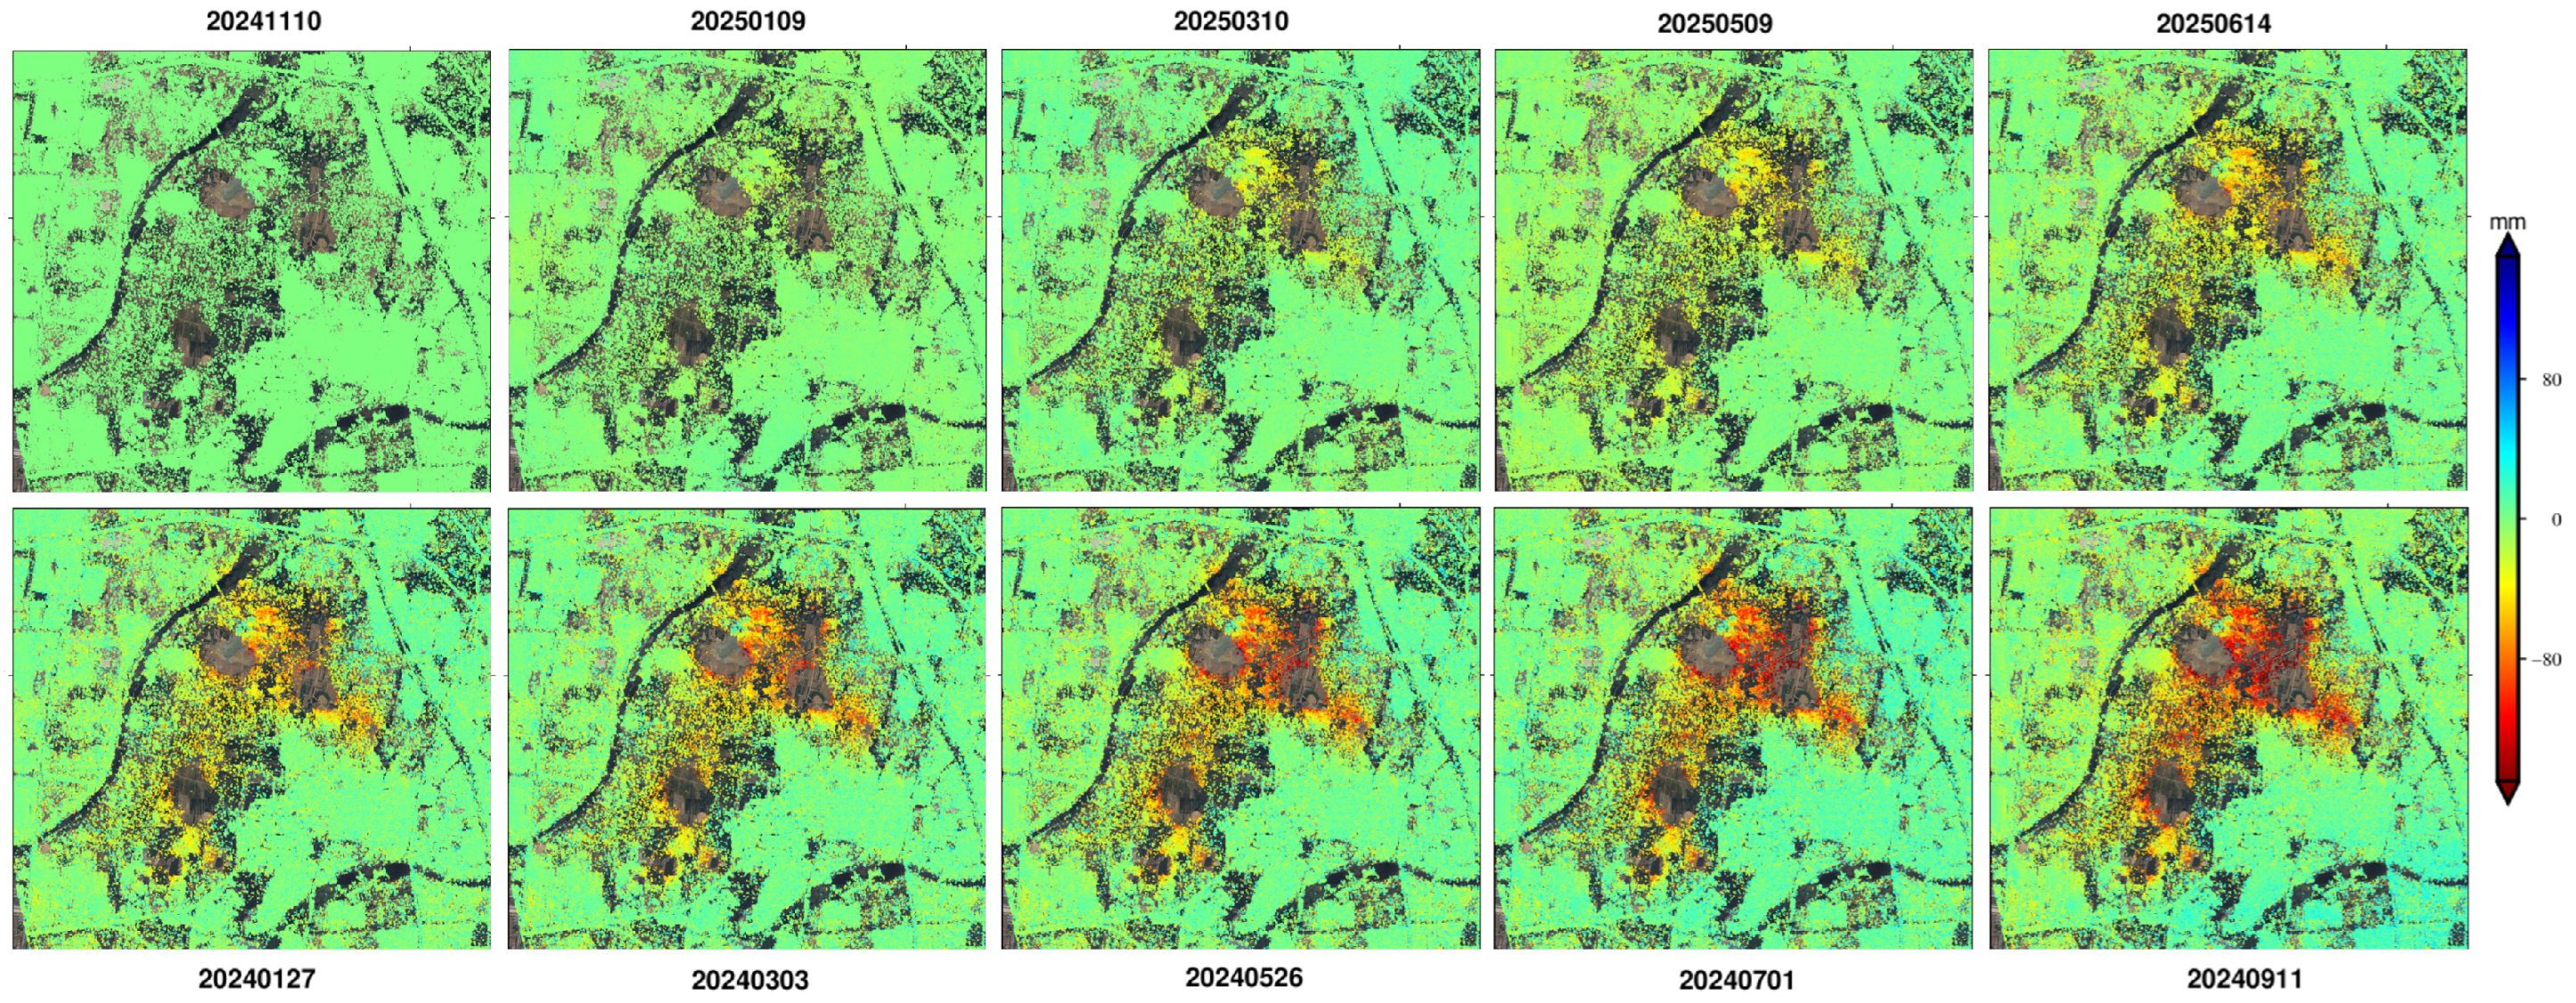
In order to better understand the spatial variation of surface displacement over the mining area, the CSS-corrected spitial InSAR time series were further analyzed. Figure 16 presents the spatial-temporal InSAR results at approximately two-month intervals. It is evident that from January 2024 to June 2025, deformation has exhibited a relatively stable spatial distribution. The affected area does not show significant spatial expansion. However, cumulative subsidence continues to increase with time. Multiple subsidence funnels have formed, exhibiting the typical characteristics of ongoing subsidence.
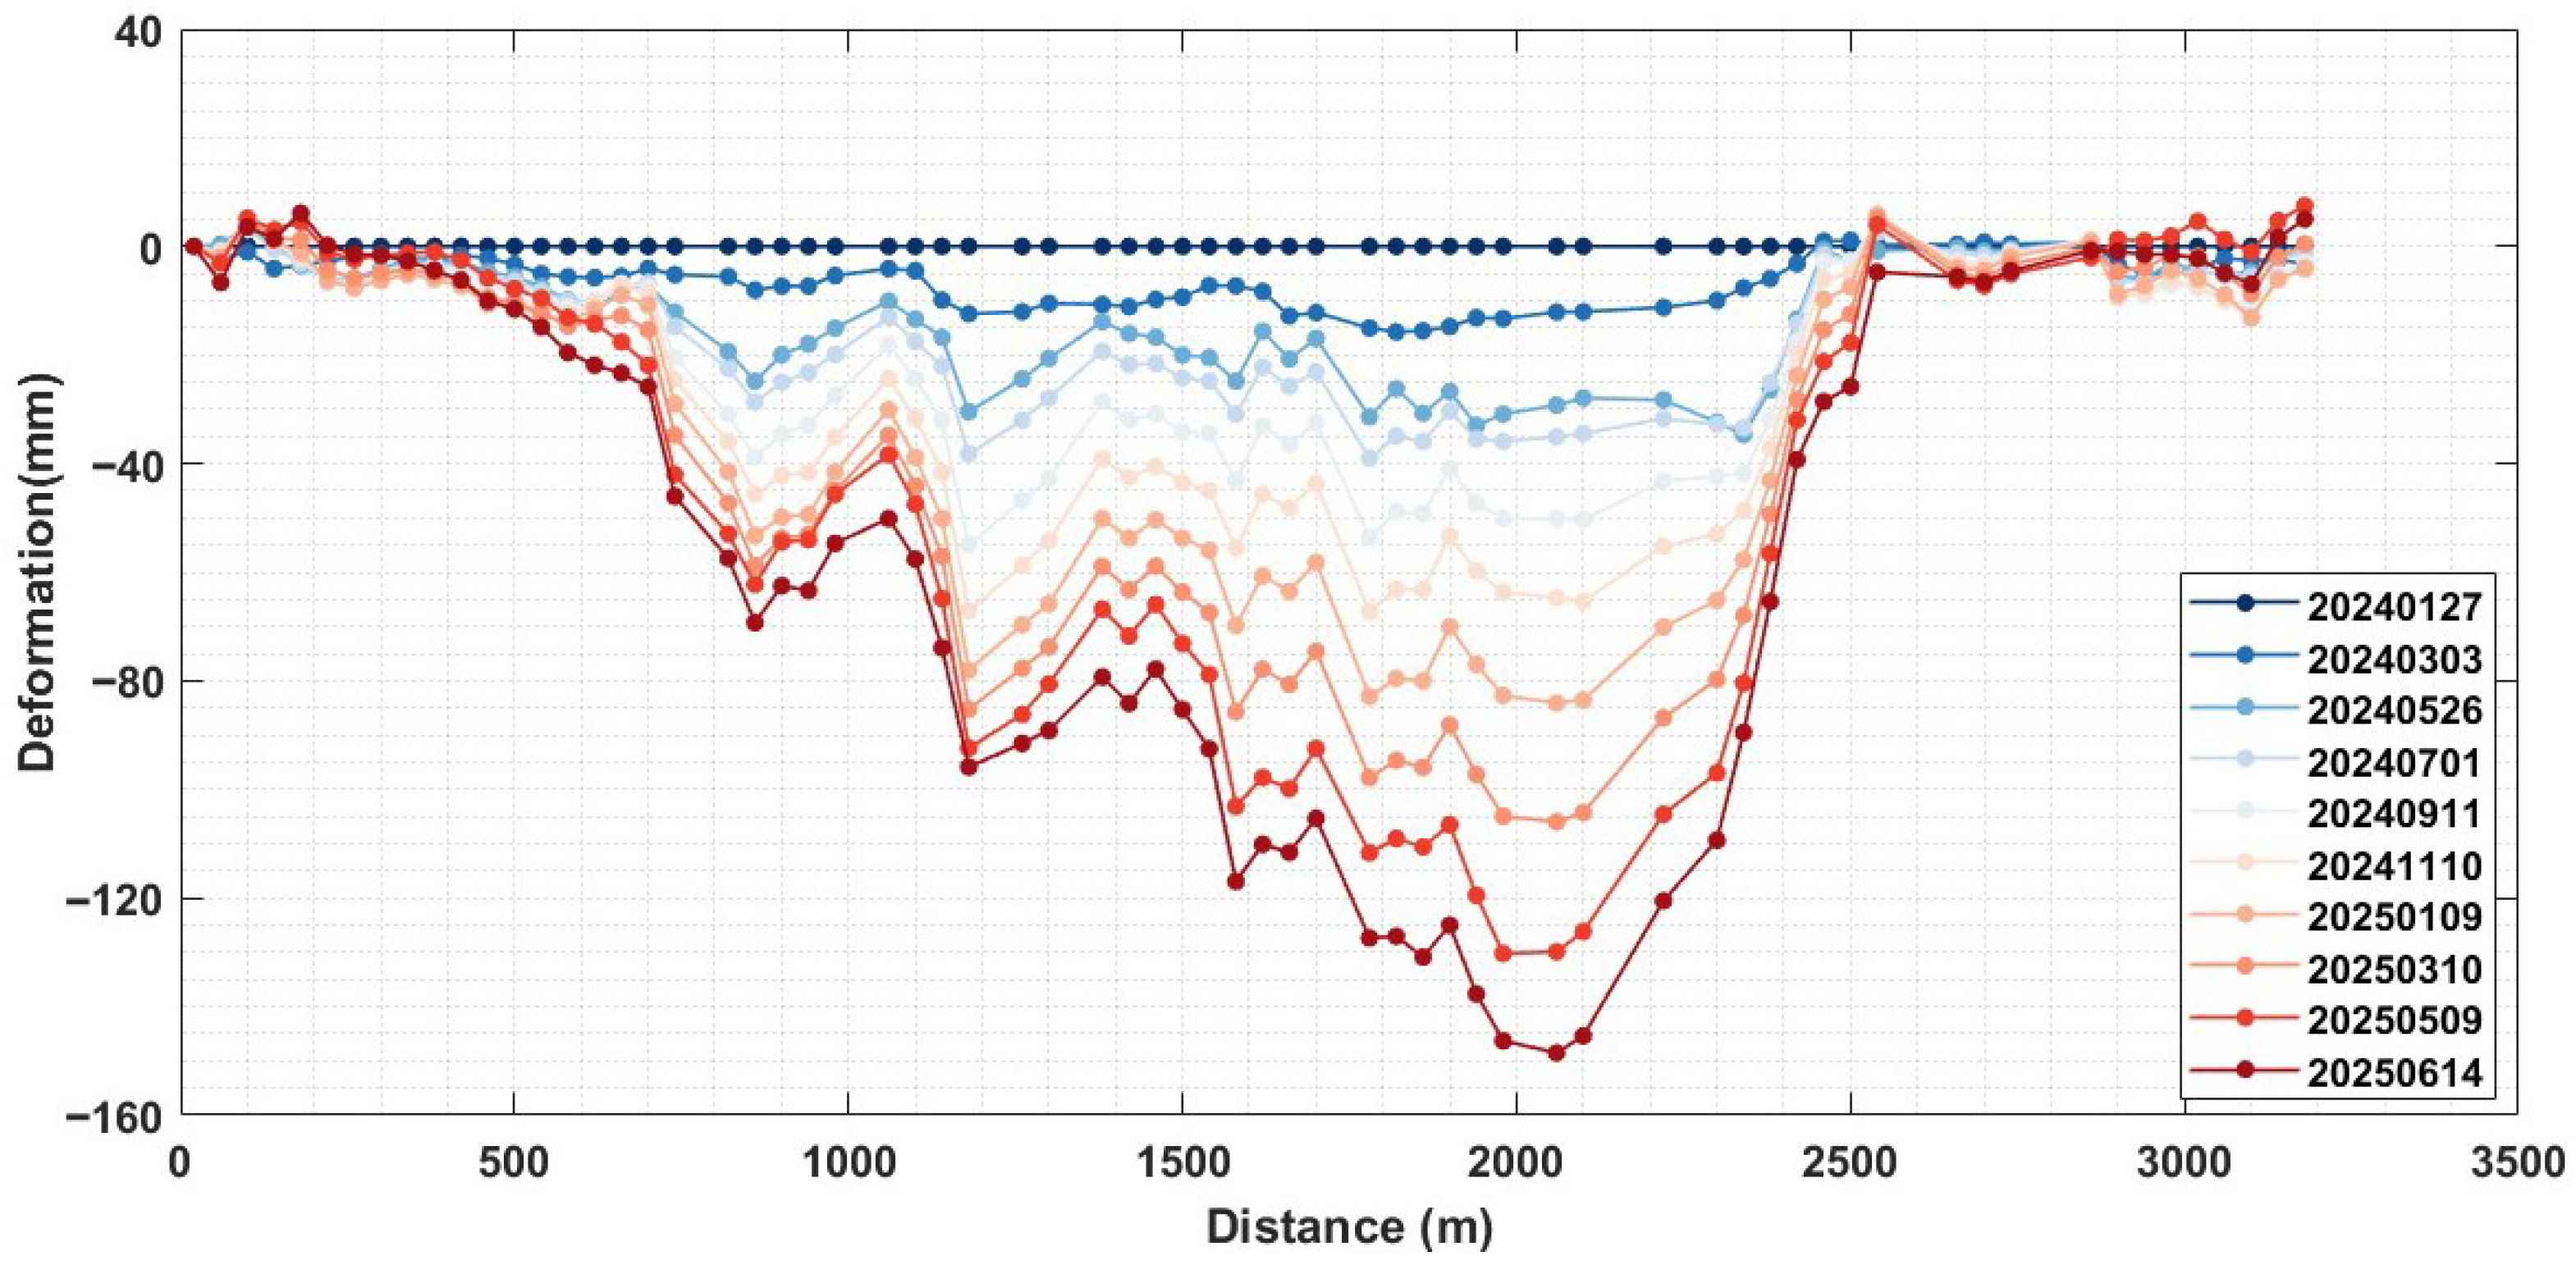
Considering the spatial distribution of InSAR coherent points, the A1–A1′ profile was selected for time series analysis of surface displacement. This profile runs approximately east–west along the main access road, crossing the primary subsidence regions of the Gangli and Zhangjiawa. We selected the monitoring points nearest to the profile within a 30 m range to construct the cumulative displacement time series. Figure 17 presents its displacement time series along the A1–A1′ profile. It can be clearly observed that the center of the profile exhibits a pronounced funnel-shaped subsidence located at the junction of subsidence basins, with cumulative displacement increasing over time. The overall subsidence extent remains relatively stable without significant lateral expansion. The maximum cumulative displacement along this profile reaches 148.5 mm, occurring at 2.06 km from starting point.
In summary, the mining area and its surrounding regions show significant surface subsidence under continuous mining activities. The observed ground deformation has already affected regional water management facilities, road networks, and local residential areas. Therefore, continuous monitoring and early warning in this area are of critical importance.

4.2.2. Deformation Analysis over the Tailings Dam

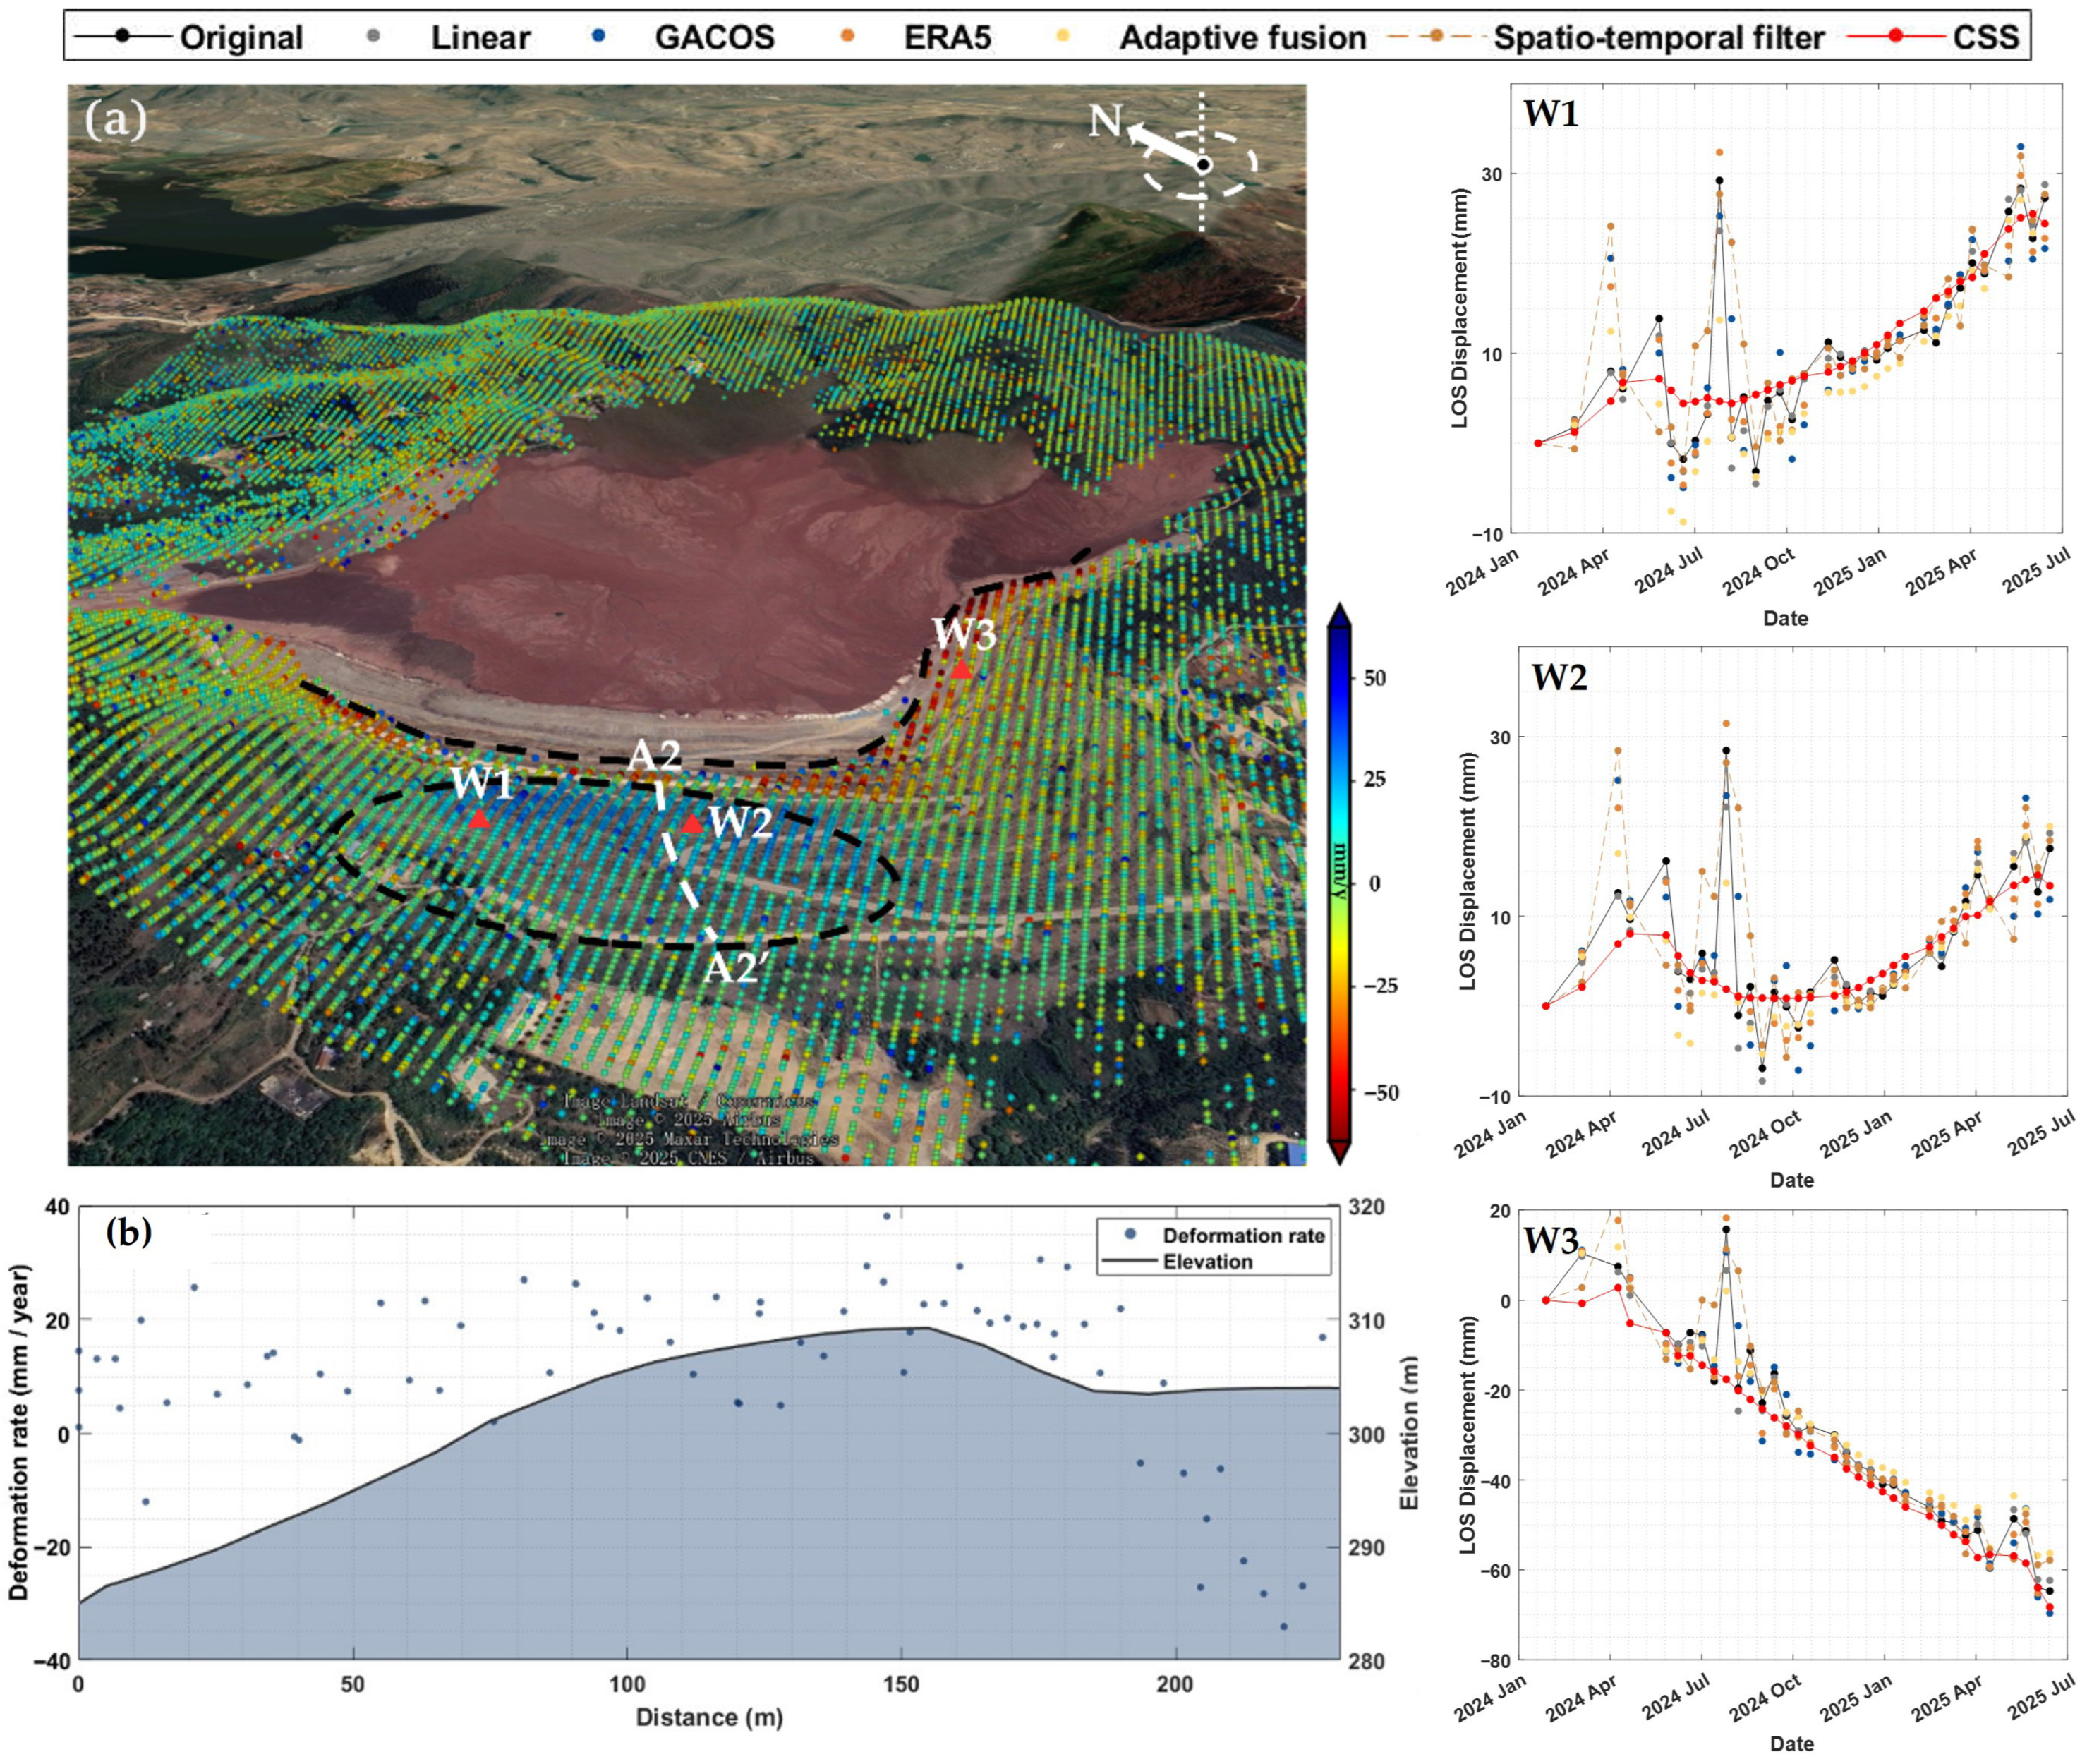
The tailings area is located in a valley with mountains on three sides and an open slope on one side. Figure 18a shows the annual average deformation rate in this area, where the maximum observed deformation rate reaches −61.1 mm/y. At the mid-slope of the dam, due to the geometric relationship between the slope, satellite flight direction, and radar incidence angle, an apparent uplift trend is observed with a maximum rate of 30.1 mm/y. The dam base remains relatively stable with no significant subsidence detected.
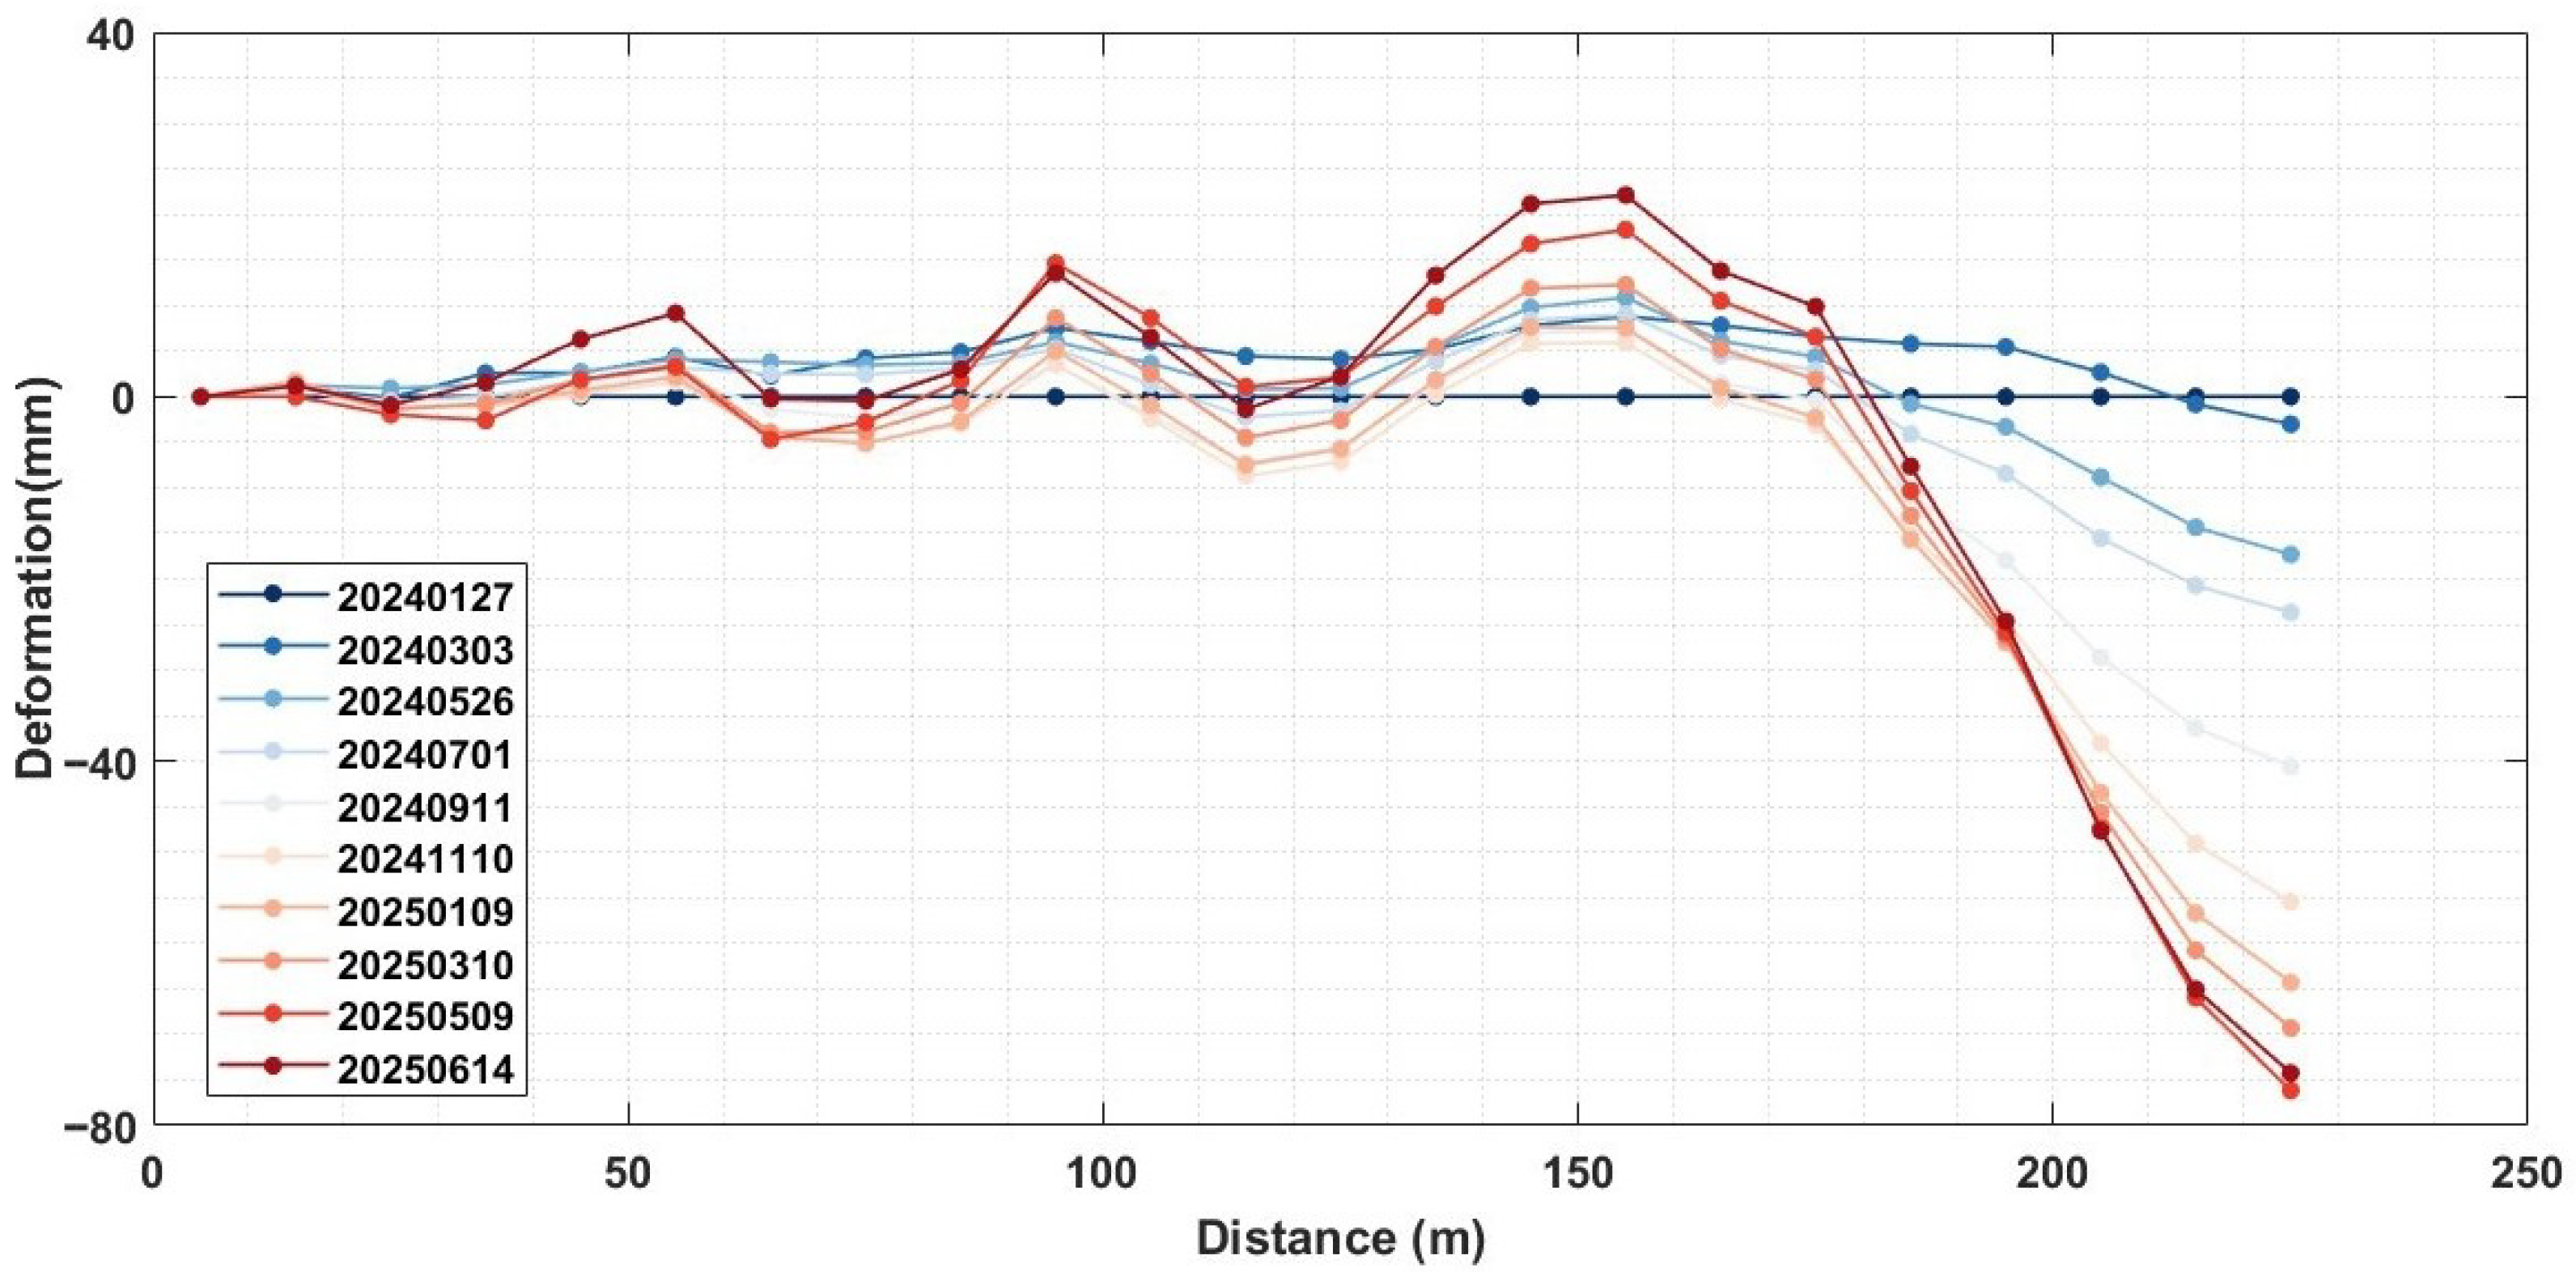
Figure 18b shows the deformation rate along the A2–A2′ profile crossing the uplift region of the tailings dam. The slope along the profile has an average gradient of 8.8°. The maximum deformation rate of −34.1 mm/y occurs at the dam crest, 220 m away from the starting point. To further characterize dam deformation, the cumulative displacement along the A2–A2′ profile was plotted as Figure 19. Similarly, the monitoring points nearest to the profile within a 30 m range were selected to construct the cumulative displacement time series. The results show a clear overall uplift trend. With increasing elevation, the LOS-projected deformation exhibits an “uplift–subsidence” pattern, with a maximum cumulative displacement of 76.2 mm. This behavior is probably associated with slope movement at the dam center and the compaction of deposited tailings at the top.
Similarly, we selected several representative points for time series analysis. W1 is located at the northern center of the dam. Its result shows oscillations in the time series due to its relatively higher elevation and the influence of partial vertical stratified delays. Under these conditions, GACOS, Linear, ERA5, adaptive fusion, and spatio-temporal filtering show limited correction effectiveness. After CSS correction, the time series exhibits improved stability. The corrected displacement shows rapid uplift during the first quarter of 2024. From April to July 2024, continuous subsidence occurs. This is followed by subsequent accelerated uplift. The maximum cumulative displacement reaches 24.4 mm, with an overall deformation rate of 17.9 mm/y. W2 is located at the southern dam, exhibiting smaller deformation magnitudes. Its subsidence pattern is similar to W1, but a relatively stable period occurred from August to November 2024 before steady uplift resumed. The maximum cumulative displacement is 13.4 mm, with an overall rate of 8.2 mm/y. At the dam crest edge, W3 exhibits the largest subsidence, with a maximum displacement of 68.3 mm and an overall rate of −52.1 mm/y. All methods show strong nonlinear behavior before June 2024, likely due to longer acquisition intervals during which significant surface subsidence occurred.
Overall, the tailing deformation during this period is relatively stable. Different regions exhibit varying deformation magnitudes: the dam crest experiences the largest displacements, the mid-slope shows moderate deformation, and the dam base remains stable.

5. Conlusions

Tropospheric delay is one of the main sources of error in deformation retrieval from InSAR measurements. In order to solve this problem and offers guidance for the selection of appropriate tropospheric delay correction methods in mining areas, we applied several mainstream tropospheric correction methods and assessed their applicability over local mining areas with large-magnitude deformation. In this study, multiple methods (Linear, ERA5, GACOS, spatio-temporal filtering, Adaptive Fusion, and CSS) were applied to DS-InSAR results for a mining area in Shandong Province. In addition, some improvements were made to the CSS. Then each method was validated using both in interferometric phase analysis and in situ measurements.
The comparative analysis results showed that adaptive fusion approach generally outperformed individual models included, indicating that incorporating additional models could further enhance monitoring accuracy. And spatio-temporal filtering must be used cautiously because it may attenuate deformation signals. Additionally, its effectiveness is also sensitive to manually selected parameters. GACOS and ERA5 exhibited limited effectiveness over local regions and could not guarantee consistent correction accuracy, which are more suitable for larger study areas. Among these methods, CSS exhibited the best performance among these methods. And the improved CSS method further outperformed the original CSS in correcting interferograms at the edge dates. The phase RMS of all interferograms decreased on average by 32.22% after CSS correction. The corrected deformation time series showed high consistency with the in situ measurements, with the average RMSE controlled within 8 mm over the mining area and within 5 mm over the tailings dam. CSS is computationally efficient and easy to implement, making it an effective method for quickly correcting tropospheric delays. However, it should be noted that CSS could probably remove some nonlinear deformation signals. It is more suitable for areas with relatively constant deformation rates.
Furthermore, the mining area exhibited multiple pronounced subsidence funnels due to long-term underground mining, with the maximum observable deformation rate reaching −168.5 mm/y. Most regions including the tailings dam, showed relatively stable deformation. But some areas exhibited accelerating deformation trends that warrant attention. The observed subsidence has already impacted regional water facilities, transportation infrastructure, and residential environments. Therefore, regular surface deformation monitoring is essential for environmental protection, disaster mitigation, and for guiding the sustainable transformation of mining operations.

Author Contributions

Conceptualization, Y.M. and F.Z.; methodology, Y.M. and F.Z.; software, Y.M.; validation, Y.M., F.Z., B.H., K.H., R.W. and S.B.; formal analysis, Y.M. and F.Z.; investigation, L.L., X.X., F.Z., B.H., R.W., K.H., N.C., Y.W. (Yifei Wei) and L.Z.; writing—original draft preparation, Y.M. and F.Z.; writing—review and editing, Y.M. and F.Z.; visualization, Y.M. and F.Z.; supervision, Y.W. (Yunjia Wang), F.Z., L.L. and X.X.; project administration, Y.W. (Yifei Wei), F.Z., L.L., X.X., N.C., L.Z. and Y.W. (Yunjia Wang). All authors have read and agreed to the published version of the manuscript.

Funding

This work has been supported in part by the National Natural Science Foundation of China (Grant No. 42474018), in part by the Fundamental Research Funds for the Central Universities (Grant No. 2025ZDPYQB1007), in part by the China Postdoctoral Science Foundation (Grant No. 2023T160685, No. 2020M671646), in part by the National Natural Science Foundation of China (Grant No. 52474184), and in part by the Young Elite Scientists Sponsorship Program by CAST(Grant No. 2023QNRC001-YESS20230599).

Data Availability Statement

The base data used for this study are available in publicly accessible web links: https://search.asf.alaska.edu/ (accessed on 26 March 2025), https://earthexplorer.usgs.gov/ (accessed on 26 March 2025), http://www.gacos.net/ (accessed on 30 March 2025), and https://www.ecmwf.int/ (accessed on 30 March 2025).

Acknowledgments

The authors would like to thank the anonymous reviewers for their constructive suggestions that improve the manuscript greatly. The authors would also like to thank the European Space Agency (ESA) for providing the Sentinel–1A images over study areas. Meanwhile, some figures were prepared using the public domain GMT software (Wessel and Smith, 1998). Optical images provided by GoogleEarth.

Conflicts of Interest

Authors Liyong Li, Xianlong Xu, Yifei Wei, Ning Chen and Lin Zhu were employed by Minmetals Mining Holdings Limited. The remaining authors declare that the research was conducted in the absence of any commercial or financial relationships that could be construed as a potential conflict of interest.

References

  1. Ji, Y.; Zhang, X.; Li, T.; Fan, H.; Xu, Y.; Li, P.; Tian, Z. Mining Deformation Monitoring Based on Lutan-1 Monostatic and Bistatic Data. Remote Sens. 2023, 15, 5668. [Google Scholar] [CrossRef]
  2. Jiang, L.; Lin, H.; Ma, J.; Kong, B.; Wang, Y. Potential of small-baseline SAR interferometry for monitoring land subsidence related to underground coal fires: Wuda (Northern China) case study. Remote Sens. Environ. 2011, 115, 257–268. [Google Scholar] [CrossRef]
  3. Li, Y.; Yang, K.; Zhang, J.; Hou, Z.; Wang, S.; Ding, X. Research on time series InSAR monitoring method for multiple types of surface deformation in mining area. Nat. Hazards 2022, 114, 2479–2508. [Google Scholar] [CrossRef]
  4. Tang, W.; Motagh, M.; Zhan, W. Monitoring active open-pit mine stability in the Rhenish coalfields of Germany using a coherence-based SBAS method. Int. J. Appl. Earth Obs. Geoinf. 2020, 93, 102217. [Google Scholar] [CrossRef]
  5. Pavez, A.; Remy, D.; Bonvalot, S.; Diament, M.; Gabalda, G.; Froger, J.L.; Julien, P.; Legrand, D.; Moisset, D. Insight into ground deformations at Lascar volcano (Chile) from SAR interferometry, photogrammetry and GPS data: Implications on volcano dynamics and future space monitoring. Remote Sens. Environ. 2006, 100, 307–320. [Google Scholar] [CrossRef]
  6. Pritchard, M.; Simons, M. A satellite geodetic survey of large-scale deformation of volcanic centres in the central Andes. Nature 2002, 418, 167–171. [Google Scholar] [CrossRef] [PubMed]
  7. Dong, J.; Zhang, L.; Tang, M.; Liao, M.; Xu, Q.; Gong, J.; Ao, M. Mapping landslide surface displacements with time series SAR interferometry by combining persistent and distributed scatterers: A case study of Jiaju landslide in Danba, China. Remote Sens. Environ. 2018, 205, 180–198. [Google Scholar] [CrossRef]
  8. Zhao, F.; Mallorqui, J.J.; Iglesias, R.; Gili, J.A.; Corominas, J. Landslide Monitoring Using Multi-Temporal SAR Interferometry with Advanced Persistent Scatterers Identification Methods and Super High-Spatial Resolution TerraSAR-X Images. Remote Sens. 2018, 10, 921. [Google Scholar] [CrossRef]
  9. Wang, S.; Lu, Z.; Wang, B.; Niu, Y.; Song, C.; Li, X.; Ma, Z.; Xu, C. A Phase-Based InSAR Tropospheric Correction Method for Interseismic Deformation Based on Short-Period Interferograms. IEEE Trans. Geosci. Remote Sens. 2023, 61, 5212318. [Google Scholar] [CrossRef]
  10. Wang, Z.; Zhang, R.; Wang, X.; Liu, G. Retrieving Three-Dimensional Co-Seismic Deformation of the 2017 Mw7.3 Iraq Earthquake by Multi-Sensor SAR Images. Remote Sens. 2018, 10, 857. [Google Scholar] [CrossRef]
  11. Zhao, F.; Mallorqui, J.J. A Temporal Phase Coherence Estimation Algorithm and Its Application on DInSAR Pixel Selection. IEEE Trans. Geosci. Remote Sens. 2019, 57, 8350–8361. [Google Scholar] [CrossRef]
  12. Zhao, Z.; Wu, Z.; Zheng, Y.; Ma, P. Recurrent neural networks for atmospheric noise removal from InSAR time series with missing values. ISPRS J. Photogramm. Remote Sens. 2021, 180, 227–237. [Google Scholar] [CrossRef]
  13. Hu, Y.; Harrison, S.; Liu, L.; Wood, J.L. Modelling rock glacier ice content based on InSAR-derived velocity, Khumbu and Lhotse valleys, Nepal. Cryosphere 2023, 17, 2305–2321. [Google Scholar] [CrossRef]
  14. Ferretti, A.; Prati, C.; Rocca, F. Permanent scatterers in SAR interferometry. IEEE Trans. Geosci. Remote Sens. 2001, 39, 8–20. [Google Scholar] [CrossRef]
  15. Hooper, A.; Zebker, H.; Segall, P.; Kampes, B. A new method for measuring deformation on volcanoes and other natural terrains using InSAR persistent scatterers. Geophys. Res. Lett. 2004, 31, L23611. [Google Scholar] [CrossRef]
  16. Kampes, B.; Adam, N.A. The STUN algorithm for persistent scatterer interferometry. In Proceedings of the FRINGE 2005, Frascati, Italy, 28 November–2 December 2005. [Google Scholar]
  17. Berardino, P.; Fornaro, G.; Lanari, R.; Sansosti, E. A new algorithm for surface deformation monitoring based on small baseline differential SAR interferograms. IEEE Trans. Geosci. Remote Sens. 2002, 40, 2375–2383. [Google Scholar] [CrossRef]
  18. Bateson, L.; Cigna, F.; Boon, D.; Sowter, A. The application of the Intermittent SBAS (ISBAS) InSAR method to the South Wales Coalfield, UK. Int. J. Appl. Earth Obs. Geoinf. 2015, 34, 249–257. [Google Scholar] [CrossRef]
  19. Ferretti, A.; Fumagalli, A.; Novali, F.; Prati, C.; Rocca, F.; Rucci, A. A New Algorithm for Processing Interferometric Data-Stacks: SqueeSAR. IEEE Trans. Geosci. Remote Sens. 2011, 49, 3460–3470. [Google Scholar] [CrossRef]
  20. Ma, Z.F.; Wei, S.J.; Aoki, Y.; Liu, J.H.; Huang, T. A New Spatiotemporal InSAR Tropospheric Noise Filtering: An Interseismic Case Study Over Central San Andreas Fault. IEEE Trans. Geosci. Remote Sens. 2022, 60, 5235016. [Google Scholar] [CrossRef]
  21. Albergel, C.; Dutra, E.; Munier, S.; Calvet, J.C.; Munoz-Sabater, J.; de Rosnay, P.; Balsamo, G. ERA-5 and ERA-Interim driven ISBA land surface model simulations: Which one performs better? Hydrol. Earth Syst. Sci. 2018, 22, 3515–3532. [Google Scholar] [CrossRef]
  22. Jolivet, R.; Agram, P.S.; Lin, N.Y.; Simons, M.; Doin, M.P.; Peltzer, G.; Li, Z. Improving InSAR geodesy using Global Atmospheric Models. J. Geophys. Res. Solid Earth 2014, 119, 2324–2341. [Google Scholar] [CrossRef]
  23. Xiao, R.; Yu, C.; Li, Z.; Jiang, M.; He, X. InSAR stacking with atmospheric correction for rapid geohazard detection: Applications to ground subsidence and landslides in China. Int. J. Appl. Earth Obs. Geoinf. 2022, 115, 103082. [Google Scholar] [CrossRef]
  24. Yu, C.; Li, Z.; Penna, N.T. Interferometric synthetic aperture radar atmospheric correction using a GPS-based iterative tropospheric decomposition model. Remote Sens. Environ. 2018, 204, 109–121. [Google Scholar] [CrossRef]
  25. Li, Z.; Muller, J.P.; Cross, P.; Fielding, E.J. Interferometric synthetic aperture radar (InSAR) atmospheric correction: GPS, Moderate Resolution Imaging Spectroradiometer (MODIS), and InSAR integration. J. Geophys. Res. Solid Earth 2005, 110, B03410. [Google Scholar] [CrossRef]
  26. Sandwell, D.T.; Price, E.J. Phase gradient approach to stacking interferograms. J. Geophys. Res. Solid Earth 1998, 103, 30183–30204. [Google Scholar] [CrossRef]
  27. Hooper, A.; Segall, P.; Zebker, H. Persistent scatterer interferometric synthetic aperture radar for crustal deformation analysis, with application to Volcán Alcedo, Galápagos. J. Geophys. Res. Solid Earth 2007, 112, B07407. [Google Scholar] [CrossRef]
  28. Chaabane, F.; Avallone, A.; Tupin, F.; Briole, P.; Maitre, H. A Multitemporal Method for Correction of Tropospheric Effects in Differential SAR Interferometry: Application to the Gulf of Corinth Earthquake. IEEE Trans. Geosci. Remote Sens. 2007, 45, 1605–1615. [Google Scholar] [CrossRef]
  29. Dong, J.; Zhang, L.; Liao, M.; Gong, J. Improved correction of seasonal tropospheric delay in InSAR observations for landslide deformation monitoring. Remote Sens. Environ. 2019, 233, 111370. [Google Scholar] [CrossRef]
  30. Murray, K.D.; Lohman, R.B.; Bekaert, D.P.S. Cluster-Based Empirical Tropospheric Corrections Applied to InSAR Time Series Analysis. IEEE Trans. Geosci. Remote Sens. 2021, 59, 2204–2212. [Google Scholar] [CrossRef]
  31. Bekaert, D.P.S.; Hooper, A.; Wright, T.J. A spatially variable power law tropospheric correction technique for InSAR data. J. Geophys.-Res.-Solid Earth 2015, 120, 1345–1356. [Google Scholar] [CrossRef]
  32. Tymofyeyeva, E.; Fialko, Y. Mitigation of atmospheric phase delays in InSAR data, with application to the eastern California shear zone. J. Geophys.-Res.-Solid Earth 2015, 120, 5952–5963. [Google Scholar] [CrossRef]
  33. Jiang, M.; Ding, X.; Hanssen, R.F.; Malhotra, R.; Chang, L. Fast Statistically Homogeneous Pixel Selection for Covariance Matrix Estimation for Multitemporal InSAR. IEEE Trans. Geosci. Remote Sens. 2015, 53, 1213–1224. [Google Scholar] [CrossRef]
  34. Peng, K.; Zhao, F.; Wang, Y.; Yan, S.; Feng, H. DS-InSAR phase optimization based on singular value decomposition. J. Remote Sens. 2023, 27, 533–542. [Google Scholar]
  35. Zhang, L.; Dong, J.; Zhang, L.; Wang, Y.; Tang, W.; Liao, M. Adaptive Fusion of Multi-Source Tropospheric Delay Estimates for InSAR Deformation Measurements. Front. Environ. Sci. 2022, 10, 859363. [Google Scholar] [CrossRef]
  36. Yu, C.; Li, Z.; Penna, N.T.; Crippa, P. Generic Atmospheric Correction Model for Interferometric Synthetic Aperture Radar Observations. J. Geophys. Res. Solid Earth 2018, 123, 9202–9222. [Google Scholar] [CrossRef]
  37. Hersbach, H.; Dee, D. ERA5 reanalysis is in production. ECMWF Newsl. 2016, 147, 5–6. [Google Scholar]
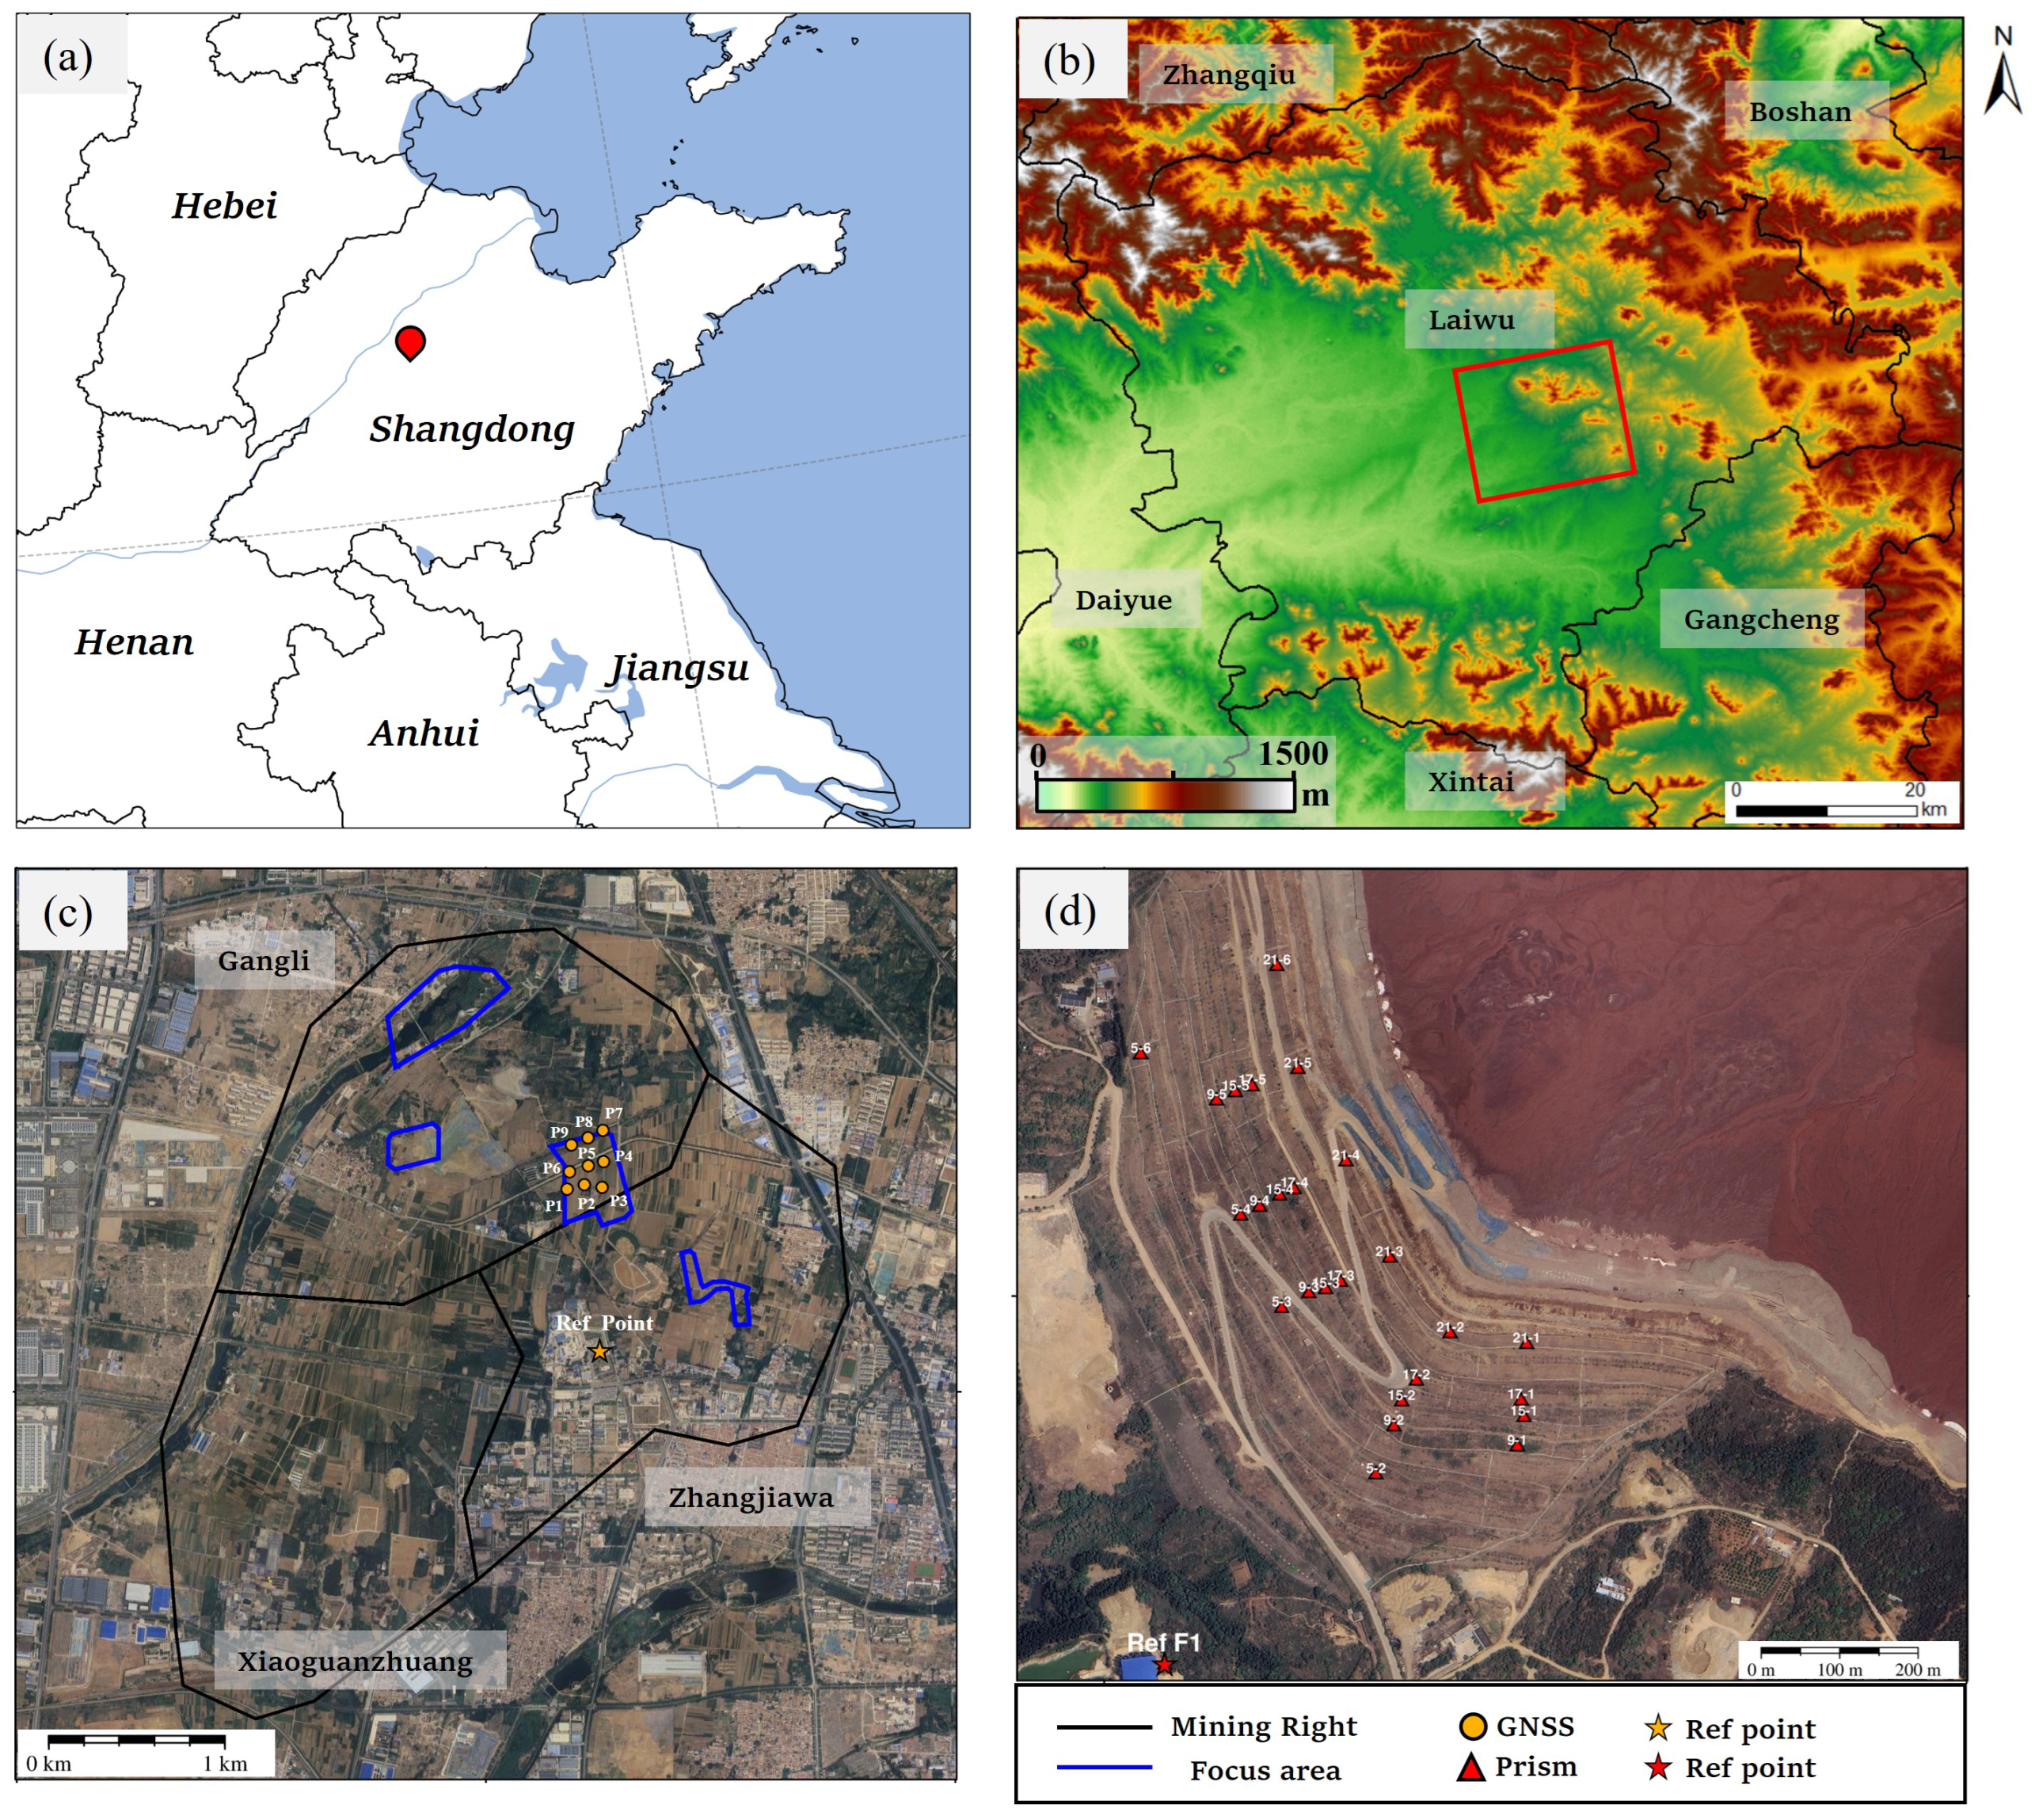
Figure 1. Overview of study area and distribution of observation stations. (a) Location of study area; (b) DEM of study area (the red box denotes the data coverage used); (c) Optical image showing the mining concession boundaries; (d) Optical image of the tailings dam.
Remotesensing 17 03811 g001
Figure 2. Perpendicular and temporal baseline.
Remotesensing 17 03811 g002
Figure 3. Flowchart of DS-InSAR and atmospheric delay correction.
Remotesensing 17 03811 g003
Figure 4. Schematic of the improved CSS method.
Remotesensing 17 03811 g004
Figure 5. Unwrapped phase of interferogram 20240830–20240725. (I) Original unwrapped phase and phases corrected by (II) spatio-temporal filter, (III) Linear, (IV) GACOS, (V) ERA5, (VI) Adaptive Fusion, (VII) CSS, respectively.
Remotesensing 17 03811 g005
Figure 6. Unwrapped phase of interferogram 20240830–20250310. (I) Original unwrapped phase and phases corrected by (II) spatio-temporal filter, (III) Linear, (IV) GACOS, (V) ERA5, (VI) Adaptive Fusion, (VII) CSS, respectively.
Remotesensing 17 03811 g006
Figure 7. Comparison of RMS values of corrected phase.
Remotesensing 17 03811 g007
Figure 8. The maximum, minimum, and average percentage reductions in RMS corrected by different methods.
Remotesensing 17 03811 g008
Figure 9. Validation of InSAR time-series with in-situ measurements over the mining area. (a) annual deformation rate of the mining area. (P1P8): Comparison between InSAR and GNSS results.
Remotesensing 17 03811 g009
Figure 10. RMSE of different methods relative to GNSS measurements and their overall mean. (a) RMSE at individual points; (b) Average RMSE and standard deviation error bars for the different methods.
Remotesensing 17 03811 g010
Figure 11. Validation of InSAR time-series with in-situ measurements over the tailings dam. (a) Annual deformation rate of the tailings dam; (15-1)–(21-2) Comparison between InSAR and GNSS results.
Remotesensing 17 03811 g011
Figure 12. RMSE of different methods relative to GNSS observations and their overall mean. (a) RMSE at individual points; (b) Average RMSE and standard deviation error bars for the different methods.
Remotesensing 17 03811 g012
Figure 13. Comparison of Improved and Original CSS Methods. (a) shows the RMS of the corrected interferometric phase for the front and back segments. (b) shows the mean RMSE with in-situ measurements over the tailings area.
Remotesensing 17 03811 g013
Figure 14. Ground deformation over the mining area. (a) Annual LOS deformation rate of the mining area. (G1X2) shows time series comparison from different methods (Ref: deformation reference point; blue box: area of interest).
Remotesensing 17 03811 g014
Figure 15. Collapses and cracks caused by ground subsidence. (a,b,d) show wall cracks caused by deformation; (c,e) represent ground subsidence; (fh) show ground fissures.
Remotesensing 17 03811 g015
Figure 16. The InSAR displacement time series over the mining area (20240127–20250614).
Remotesensing 17 03811 g016
Figure 17. Cumulative displacement along the A1–A1′ profile.
Remotesensing 17 03811 g017
Figure 18. Ground deformation in the tailings dam. (a) shows the annual average LOS deformation rate of the tailings dam. The white dashed line indicates the A2–A2′ profile and black dashed line indicates main deformation areas. (b) represents comparison between velocity and elevation along the A2–A2′ profile. (W1W3) represent the time series comparison using different methods.
Remotesensing 17 03811 g018
Figure 19. Cumulative displacement along the A2–A2′ profile.
Remotesensing 17 03811 g019
Table 1. Basic parameters of the used weather model datasets.
DatasetsTime ResolutionSpatial ResolutionNumber of Vertical Layers
GACOS6 h∼16 km137 levels
ERA51 h∼32 km137 levels
Table 2. Comparison of different methods based on average RMS and RMS reduction.
MethodsAve. RMS (cm)RMS Reduction (%)
Original0.56
Linear0.56−0.06
GACOS0.57−1.24
ERA50.550.51
Spatio-temporal filter0.4614.17
Adaptive fusion0.4417.11
CSS0.3732.22
Disclaimer/Publisher’s Note: The statements, opinions and data contained in all publications are solely those of the individual author(s) and contributor(s) and not of MDPI and/or the editor(s). MDPI and/or the editor(s) disclaim responsibility for any injury to people or property resulting from any ideas, methods, instructions or products referred to in the content.