Article

A Novel Framework Based on Data Fusion and Machine Learning for Upscaling Evapotranspiration from Flux Towers to the Regional Scale

1
Key Laboratory of Crop Water Use and Regulation, Ministry of Agriculture and Rural Affairs, Institute of Farmland Irrigation, Chinese Academy of Agriculture Sciences, Xinxiang 453003, China
2
College of Horticulture and Landscape Architecture, Henan Institute of Science and Technology, Xinxiang 453003, China
3
School of Information Engineering, Henan Institute of Science and Technology, Xinxiang 453003, China
*
Author to whom correspondence should be addressed.
Remote Sens. 2025, 17(23), 3813; https://doi.org/10.3390/rs17233813
Submission received: 10 October 2025 / Revised: 10 November 2025 / Accepted: 17 November 2025 / Published: 25 November 2025

Highlights

What are the main findings?
  • An integrated framework was developed that combines multi-source data fusion (MODIS, Landsat, and CLDAS), a footprint model, and machine learning to upscale evapotranspiration from site to field scale, successfully achieving daily seamless 30 m ET estimation.
  • The 1D CNN model using both remote sensing and meteorological data performed best in homogeneous croplands (R = 0.90, RMSE = 0.66 mm/d), while the model using only remote sensing data achieved superior accuracy in heterogeneous urban–agricultural areas (R = 0.93, RMSE = 0.88 mm/d). SHAP analysis indicated that LST and EVI2 were the most influential drivers of ET.
What are the implications of the main findings?
  • By integrating multi-source remote sensing and reanalysis data, the framework enables accurate daily seamless 30 m estimation of LST and vegetation indices, effectively bridging the gap between remote sensing observations and flux measurements and providing strong support for the application of upscaling methods at the field scale.
  • By generating high-spatiotemporal-resolution evapotranspiration maps, the framework offers a practical tool for precision water resource management in heterogeneous landscapes.

Abstract

Accurate quantification of regional ET is essential for agricultural water management. Upscaling methods based on flux tower observations have been widely applied in large-scale ET estimation. However, the coarse spatial resolution of existing upscaling approaches limits their utility in field-scale management. Therefore, this study proposes an integrated upscaling framework that combines data fusion and machine learning, enabling spatiotemporally continuous ET estimation at the field scale (30 m × 30 m). First, daily 30 m resolution land surface temperature (LST) and vegetation indices were generated by fusing MODIS, Landsat, and China Land Data Assimilation System (CLDAS) datasets. These variables, along with meteorological data and the footprint model, were used as inputs for machine learning. The upscaled ET was evaluated under varying surface heterogeneity using optical-microwave scintillometers (OMS). The results show that a one-dimensional convolutional neural network (1D CNN) using both remote sensing and meteorological data performed best in relatively homogeneous croplands, achieving a correlation coefficient (R) of 0.90, a bias of −0.14 mm/d, a mean absolute error (MAE) of 0.46 mm/d, and a root mean square error (RMSE) of 0.66 mm/d. In contrast, for heterogeneous urban-agricultural landscapes, the 1D CNN using only remote sensing data outperformed other models, with R, bias, MAE, and RMSE of 0.93, −0.14 mm/d, 0.66 mm/d, and 0.88 mm/d, respectively. Furthermore, SHapley Additive exPlanations (SHAP) revealed that LST and the two-band enhanced vegetation index (EVI2) were the most influential drivers in the models. The framework successfully enables ET modeling and spatial extrapolation in heterogeneous regions, providing a foundation for precision water resource management.

1. Introduction

Evapotranspiration (ET) is a crucial component of land surface processes, which plays a pivotal role in the water balance, energy balance, and carbon cycle [1]. As the major driver of water consumption in agricultural ecosystems, ET is closely associated with the optimal allocation of water resources. Therefore, precisely quantifying the spatiotemporal variations in ET at regional scales is essential to informing scientific irrigation strategies, enhancing water productivity, and optimizing water resource utilization efficiency [2].
ET is typically derived from in situ measurements, such as lysimeters, eddy covariance systems (EC) and scintillometers [3,4,5,6]. However, these methods remain constrained by high equipment costs and insufficient spatial representativeness, which hinder their application over large areas. Remote sensing-based ET estimation methods have gradually become the primary means for estimating ET at regional or global scales due to their cost-effectiveness and efficiency [7,8,9,10,11]. However, due to surface complexity and intricate land-atmosphere interactions, these methods require extensive parameterization and local calibration [12]. As a result, their applicability for high-accuracy ET estimation in localized agricultural regions is limited [13,14,15,16]. This limitation is particularly evident in heterogeneous agricultural landscapes with fragmented farmland, where diverse irrigation practices and cropping structures lead to pronounced spatial variability in surface water and energy conditions. Although the TSEB model [17,18,19,20] incorporates a more comprehensive physical mechanism and is suitable for heterogeneous surfaces, it often faces difficulties in spatializing impedance and surface characteristic parameters [21]. Furthermore, it exhibits high complexity in practical applications [22,23,24].
The use of empirical statistical models to upscale observations from EC tower networks offers an alternative, independent approach for regional ET estimation [25,26]. These methods typically use statistical techniques to establish relationships between flux tower measurements and auxiliary data, such as remote sensing and meteorological variables. Based on regional or global meteorological and remote sensing gridded data, ET can then be scaled up accordingly. With the rapid evolution of artificial intelligence (AI), data-driven methods have become increasingly popular in regional ET studies. For instance, Yang et al. [27] applied a support vector machine (SVM) approach using MODIS products and observed surface shortwave radiation data to upscale ET measurements from 25 AmeriFlux sites, successfully predicting the spatiotemporal variations in ET across the continental United States in 2004. Zhang et al. [28] developed an object-based machine learning method incorporating MODIS products and meteorological variables to upscale flux tower ET for an entire wetland reserve, whereas Bodesheim et al. [29] employed a random forest (RF) model to produce a global latent heat flux dataset at half-hourly intervals from FLUXNET measurements. Shang et al. [30] integrated eight remote sensing ET products with surface auxiliary data using deep learning, achieving daily ET estimates at a 0.01° resolution. Meanwhile, Li et al. [31] introduced an integrated framework that applies the coefficient of variation (CV) for partitioning heterogeneous surfaces, revealing that an RF-based upscaling method performed best in highly heterogeneous areas. Because machine learning methods do not rely on physically based principles but instead infer patterns directly from data [32], they are especially adept at capturing complex land–atmosphere interactions in agricultural landscapes. Numerous studies indicate that merging machine learning techniques with two-dimensional surface information from satellites can effectively extrapolate ET to unmonitored regions, all while preserving high accuracy [33]. Nonetheless, the scarcity of high-resolution remote sensing data often constrains current upscaling methods to relatively coarse resolutions, typically at the kilometer scale. For instance, Pang et al. [34] generated 8-day ET estimates at a 1 km resolution, Xu et al. [35] produced daily ET at 1 km, and Zhang et al. [28] released 32-day ET products at 1 km. Although suitable for watershed- or global-scale evaluations, such coarse resolutions fail to meet the demands of field-scale monitoring, especially in agricultural landscapes where diverse irrigation practices and daily shifts in water and energy conditions introduce significant uncertainty in ET estimation [27]. Consequently, achieving more reliable ET at finer spatial (tens of meters) and temporal (daily) resolutions has become critical [36].
To address the limitations of existing studies, this research proposes a newly developed integrated framework for upscaling tower-based ET, which combines multi-source data fusion, footprint model, and machine learning. The primary aim is to produce high-resolution, daily ET estimates for heterogeneous agricultural landscapes. The main objectives of this study are as follows: (1) Generate daily ET estimates at a spatial resolution of 30 m × 30 m based on the proposed framework. The input data include remote sensing auxiliary variables such as land surface temperature (LST), normalized difference vegetation index (NDVI), two-band enhanced vegetation index (EVI2), and leaf area index (LAI), together with meteorological data. (2) Investigate the key drivers of ET and evaluate the effects of different input scenarios on the accuracy of the upscaled ET results (Upscaling_ET). (3) Generate ET distribution maps for the key growth stages of winter wheat during 2019–2023 by applying the optimal model and analyze the spatiotemporal variability in wheat ET during this period.

2. Materials and Methods

2.1. Study Area

The study was conducted in the flux observation field of the Xinxiang Comprehensive Experimental Base, Chinese Academy of Agricultural Sciences, located in Xinxiang City, Henan Province (Figure 1). This region, located in the northern plain of Henan and downstream of the Yellow River, represents a typical warm-temperate, semi-humid to semi-arid climate zone. The study area is dominated by farmland, with the remainder occupied by buildings, roads, forests, bare land, and shrubs. Winter wheat is the primary crop, generally grown from mid-October to early June of the following year. Two distinct underlying surface conditions were investigated. From 2019 to 2022, the flux observation field was characterized by a highly heterogeneous urban-agricultural landscape comprising 51% farmland, 33% buildings, 10% forests and shrubs, and 6% bare land (Figure 1d). In 2023, a more homogeneous farmland area was selected, featuring 73.5% farmland, 12.7% buildings, 7.2% bare land, and 6.6% forests and shrubs (Figure 1c). EC and gradient weather station (GWS) were consistently positioned within a farmland area in the study region (35°8′12″N, 113°45′48″E) (Figure 1f). The optical-microwave scintillometers (OMS) were deployed over the urban-agricultural mixed surface from 2019 to 2022 and relocated to the farmland surface in 2023. Table 1 provides detailed information about the observation equipment.

2.2. Data Collection and Preprocessing

2.2.1. Eddy Covariance System

From October 2019 to June 2022, raw 10 Hz turbulent flux data were collected using an EC system and processed with EddyPro Software (Version 7.0.9) to generate 30 min ET. These 30 min ET values were subsequently aggregated into daily ET, which served as the target variable for the model. Data processing included outlier removal, sonic virtual temperature correction, coordinate rotation, signal detrending, WPL correction [37], and response frequency correction. Data quality control excluded measurements with a quality grade of 2 [38], those collected during precipitation events and within two hours before and after precipitation, and nighttime data under weak turbulence. Linear interpolation was applied to data gaps shorter than two hours, whereas gaps exceeding two hours were filled using the mean diurnal variation (MDV) method based on the same time on adjacent days [39]. Additionally, ET values below zero, which indicate condensation, were discarded. The overall energy closure rate for the three growing seasons was approximately 0.74. Notably, latent heat flux (LE) was not adjusted to enforce energy balance closure, but rather it was treated as part of the uncertainty.

2.2.2. Optical-Microwave Scintillometer System

OMS measurements from January to June 2020 and March to June 2023 was used to validate the Upscaling_ET over an urban–agricultural mixed surface and a homogeneous farmland surface, respectively. For the OMS data, C n 2 was first calculated based on the relationship provided by Wang et al. [40]. Next, the coefficients A were calculated in real time using actual data [41], C T 2 , C q 2 and C Tq , were derived from C n , LAS 2 , C n , MWS 2 , and C n , OMS 2 using the inverse matrix M−1 [42]. Finally, LE was iteratively calculated based on Monin-Obukhov Similarity Theory (MOST) [43] and the MOST functions provided by Andreas et al. [44]. In addition, data exceeding saturation conditions were excluded using the standard condition C n _ LAS 2 < 0.193L−8/3λ1/3D5/3 [45,46]. Data recorded during rainfall events, nighttime periods with weak turbulence, and periods of poor atmospheric visibility were also removed. Moreover, 30 min average flux data exceeding 700 W/m2 were excluded. To calculate daily ET, gaps in the data were filled using the same interpolation method applied to the eddy covariance flux data.

2.2.3. Meteorological Data

This study collected 10 min interval data from the GWS at a height of 5 m between October 2019 and June 2023, including wind speed (Ws), wind direction (Wd), air temperature (Ta), relative humidity (RH), vapor pressure (e), net radiation (Rn), and precipitation (Prec). These meteorological data were converted into 30 m resolution grid data, with consistent values across the entire study area, and utilized for subsequent ET modeling, spatial upscaling, and OMS-based validation. The quality assessment and calibration of the meteorological data involved the following steps: (1) verifying whether each day contained a complete dataset (144 records at 10 min intervals) and processing the data into 30 min averages, (2) removing duplicate or physically unrealistic observations caused by sensor malfunctions, interference from rain or dust, sudden power outages, or data logger anomalies, and filling gaps using linear interpolation. Finally, the 30 min interval data were aggregated into daily values.

2.2.4. Remote Sensing and Reanalysis Data

For MODIS products, this study utilized MOD09Q1 (8-day, 250 m surface reflectance) and MOD11A1 (Terra, daily, 1 km land surface temperature), both of which have been shown to be valuable for ET upscaling [28,47]. For Landsat products, the datasets included Landsat-7 ETM+ Level-2 surface reflectance products (16-day, 30 m), Landsat-8 Level-2 surface reflectance products (16-day, 30 m), and Level-2 land surface temperature products (16-day, 100 m). All the remote sensing products mentioned above were accessed via Google Earth Engine (GEE), a cloud-based geospatial analysis platform [48]. The reanalysis data were derived from the near-real-time LST reanalysis product of the China Land Data Assimilation System (CLDAS-V2.0) at 11:00 local solar time [49]. The land surface models (LSMs) within CLDAS has been shown to effectively predict spatiotemporally continuous LST, which closely matches ground-based observations [50]. Furthermore, land use information was extracted by supervised classification methods using SuperView-1 satellite data.

2.3. Data Processing Procedure

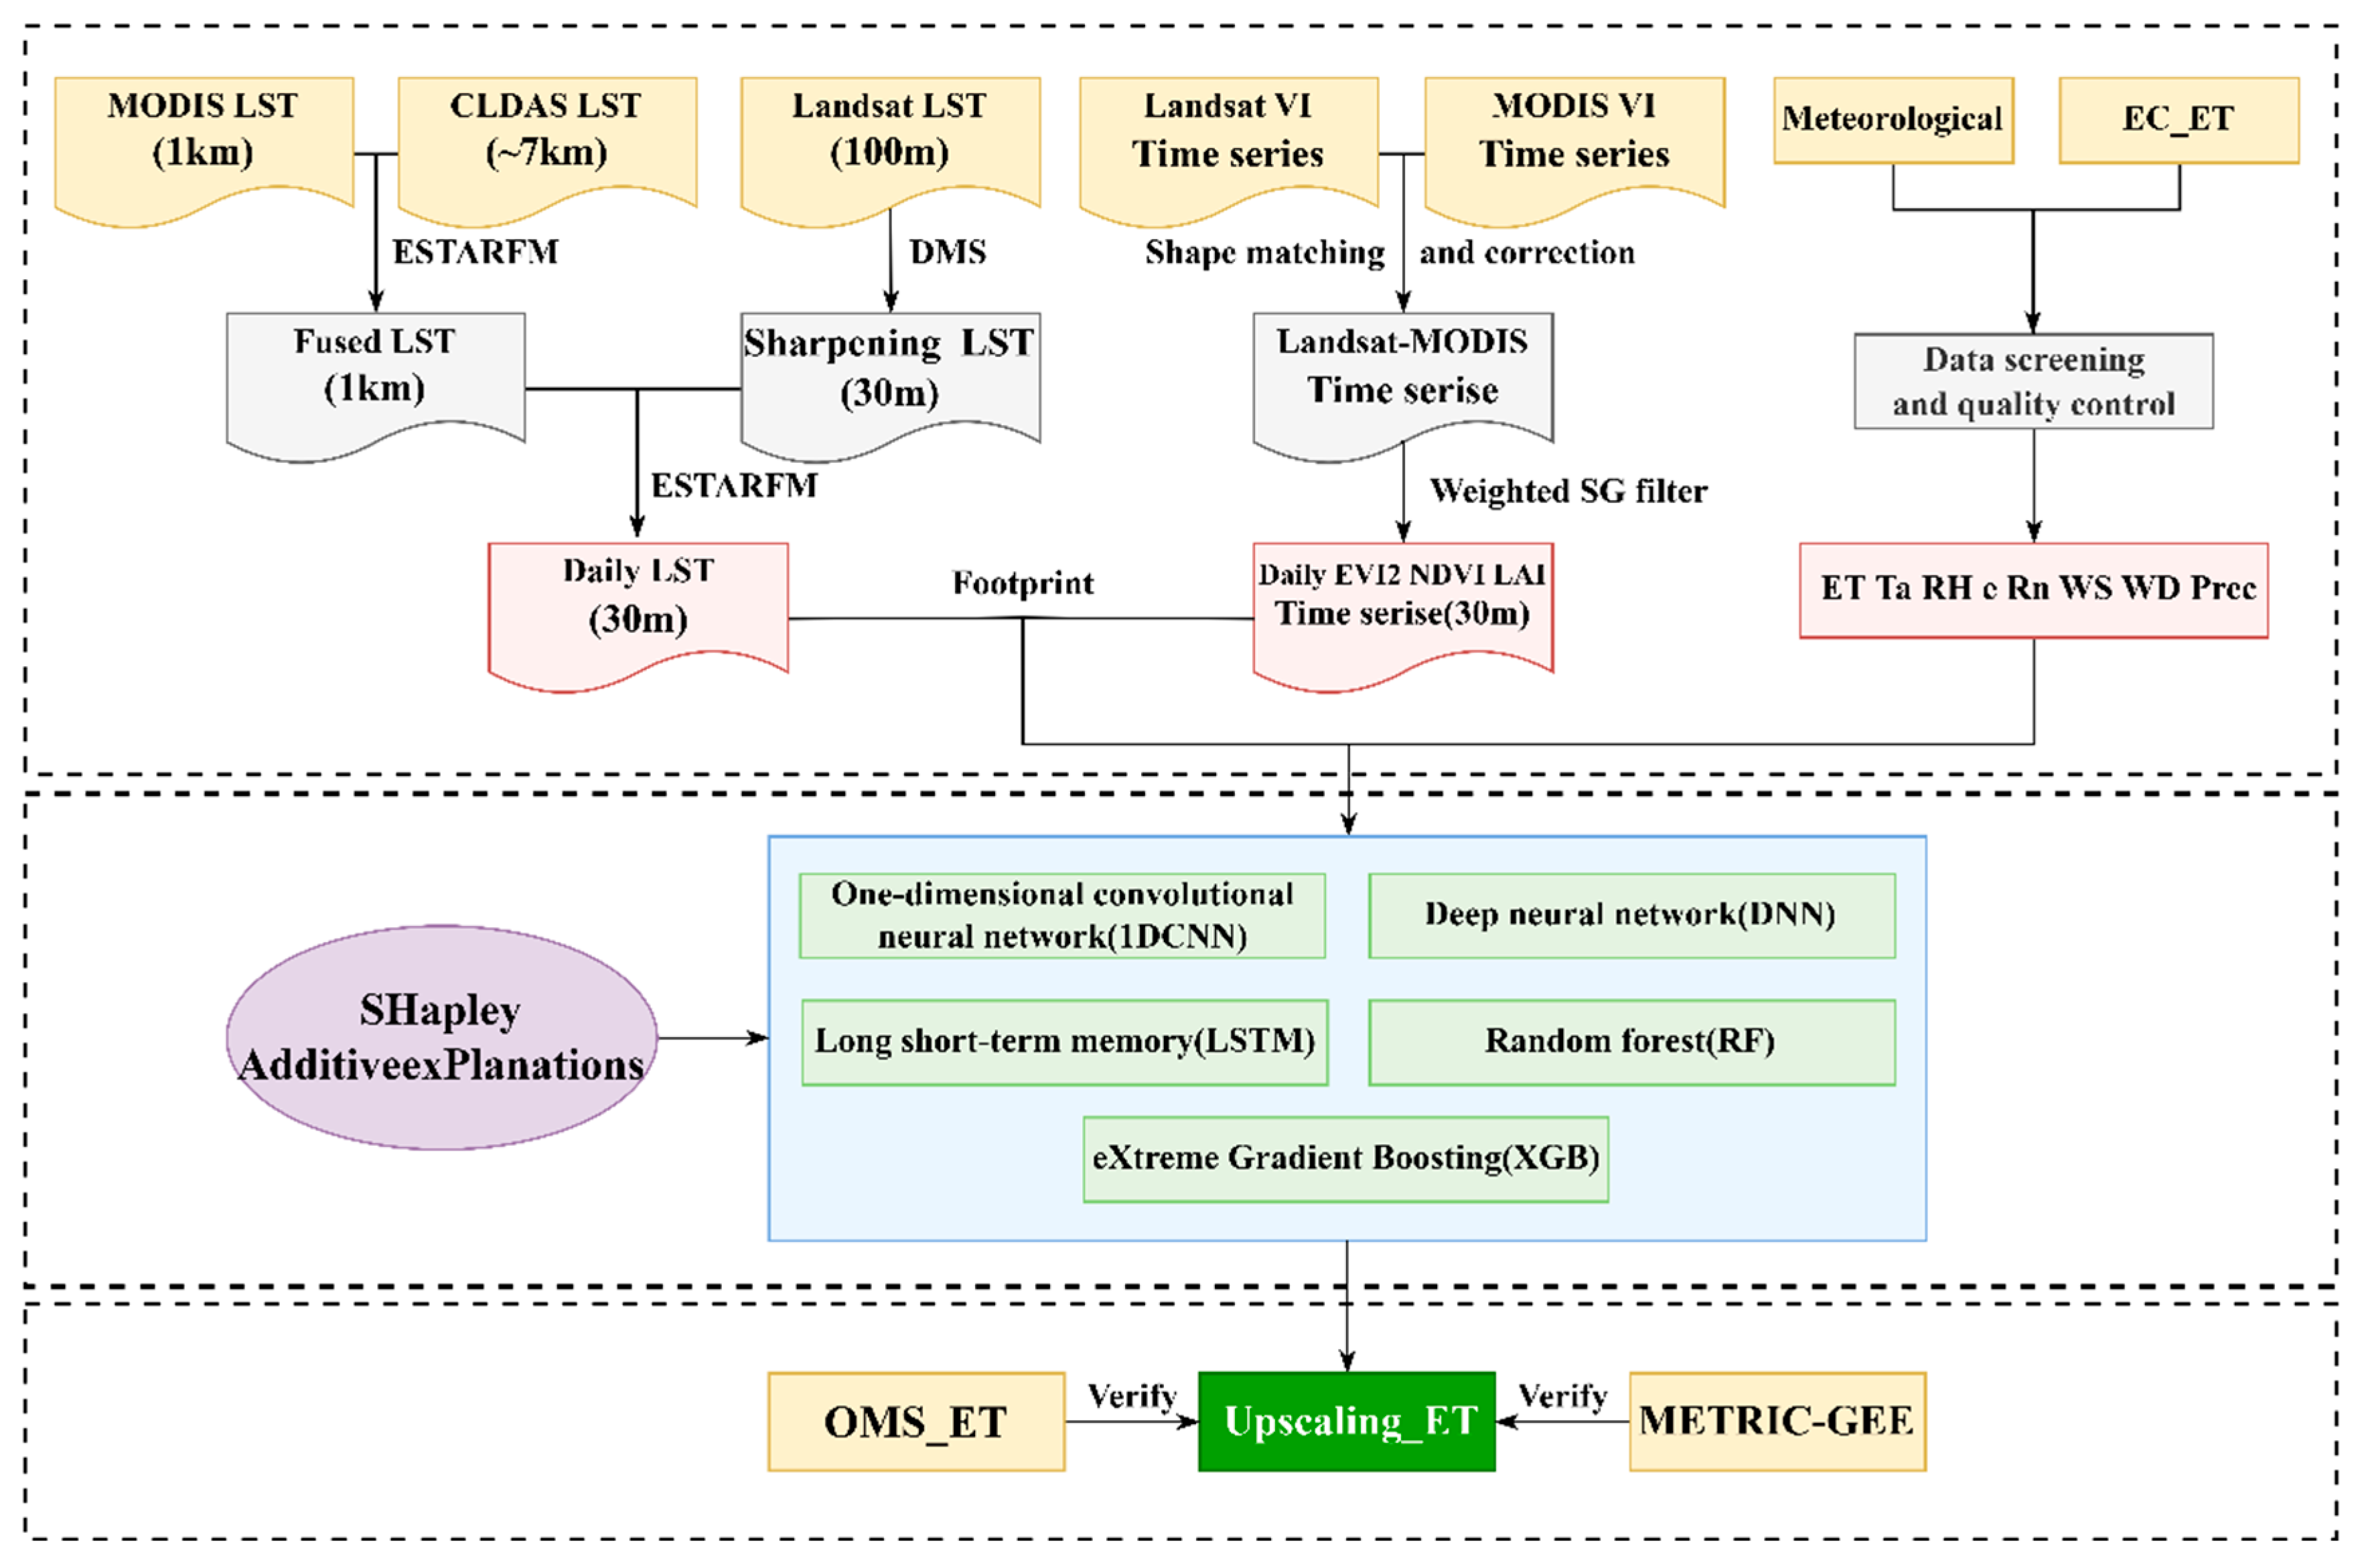
The overall workflow of the proposed daily 30 m resolution ET estimation framework is illustrated in Figure 2. First, MODIS, Landsat, and CLDAS data were fused to generate spatiotemporally continuous remote sensing auxiliary data (i.e., LST, EVI2, NDVI, and LAI) at a 30 m resolution. Weighted averages of the remote sensing data were then extracted using a footprint model. Subsequently, the weighted remote sensing data and meteorological data were used as predictors to train machine learning models. In this study, we employed two machine learning algorithms (RF and Extreme Gradient Boosting, XGB) and three deep learning algorithms (one-dimensional Convolutional Neural Network, 1D CNN; Deep Neural Network, DNN; and Long Short-Term Memory, LSTM) for model development. Key drivers of ET were identified through SHapley Additive exPlanations (SHAP). Finally, the model was applied to each grid cell within the study area. The Upscaling_ET were independently validated using OMS for both the urban-agricultural mixed surface and the farmland surface. ET distribution maps during the critical growth periods of wheat from 2019 to 2023 were generated based on the optimal model. The main steps included data fusion, footprint analysis, machine learning and deep learning model development, feature importance analysis, and accuracy evaluation.

2.3.1. Generation of Daily 30 m Vegetation Indices and LST

Gap-Filling and Savitzky–Golay filtering (GF-SG) method, developed by [51], was used to reconstruct high-quality Landsat vegetation index time series data. The GF-SG first applies linear interpolation and the Savitzky–Golay filter [52] to fill gaps and reduce noise in the MODIS vegetation index time series. The processed MODIS vegetation index data are then resampled to a 30 m resolution using bicubic interpolation, resulting in a spatially interpolated MODIS vegetation index time series (M_interpol). Next, correlation coefficients are calculated between the target pixel in the cloud-free Landsat series and neighboring pixels in M_interpol to identify similar pixels (correlation coefficient > 0.8). The reference time series for the target pixel is then constructed by weighting the neighboring pixels based on their correlation coefficients with the target pixel:
M _ reference ( x , y )   =   j   =   1 n w ( x j , y j ) ×   M _ similar _ series ( x j , y j )
To address discrepancies caused by differences in the spectral response functions of MODIS and Landsat, the reference time series was corrected using a linear transfer function [53]. Missing Landsat data were then filled, and noise in the time series was reduced using the Savitzky–Golay filter. The GF-SG method is particularly well-suited for reconstructing time series of vegetation indices with high spatial autocorrelation. Therefore, we applied the GF-SG method to generate NDVI, EVI2 [54], and LAI at 8-day intervals, which were subsequently linearly interpolated to obtain daily data.
The enhanced spatial and temporal adaptive reflectance fusion model (ESTARFM) was employed to construct daily 30 m LST [36,55,56,57]. ESTARFM requires two pairs of coarse- and fine-resolution images from the same dates as reference images, along with coarse-resolution images from the target prediction period. Within a specified moving window, the predicted LST for the central pixel can be expressed as:
F ( x w / 2 , y w / 2 , t p , B )   =   T m   ×   F m ( x w / 2 , y w / 2 , t p , B )   +   T n   ×   F n ( x w / 2 , y w / 2 , t p , B )
F k x w / 2 , y w / 2 , t p , B = L ( x w / 2 , y w / 2 , t k , B ) + i = 1 N W i   ×   V i   ×   ( C ( x i , y i , t p , B )   -   C ( x i , y i , t m , B ) )
where F ( x w / 2 , y w / 2 , t p , B ) represents the final prediction of the fine-resolution LST at the center pixel ( x w / 2 , y w / 2 ) within a search window of size www on date t p ; x i , y i are the positions of the i-th spectrally similar pixels, N is the number of spectrally similar pixels, B represents the spectral band, and Vi is the transformation coefficient. T m and T n are the temporal weights for dates m and n, respectively. t m represents the acquisition time of known fine-resolution images, and t p represents the time of the image to be predicted. F k ( x w / 2 , y w / 2 , t p , B ) is the fine-resolution LST of the central pixel derived from the coarse-resolution LST on date k = (m,n). L and C represent Landsat and MODIS LST, respectively. T k and W i are the weight coefficients, calculated as follows:
W i   =   ( 1 / D i ) i   =   1 N ( 1 / D i )
D i = ( 1 R i )   ×   d i
d i = 1 + ( x w / 2 x i ) 2 +   ( y w / 2 y i ) 2 / ( w / 2 )
T k = 1 / | j = 1 w l = 1 w C ( x j , y l , t k , B ) j = 1 w l = 1   w C ( x j , y l , t p , B ) | k = m , n ( 1 / | j = 1 w l = 1 w C ( x j , y l , t k , B ) j = 1 w l = 1 w C ( x j , y l , t p , B ) | )
where D i is the combination of the spectral distance and geographical distance of the similar pixel i; R i is the spectral correlation coefficient describing the relationship between the fine-resolution and coarse-resolution pixels for similar pixel i; and d i is the geographical distance of similar pixel i.
To generate spatially complete 30 m LST data from 2019 to 2023, the following steps were undertaken. First, MODIS LST under cloud-free conditions was fused with CLDAS LST to produce 1 km MODIS-like LST product [58]. Second, the data mining sharpener (DMS) algorithm, developed by [59], was applied to downscale cloud-free 100 m Landsat LST to create sharpened 30 m Landsat LST. The DMS algorithm utilizes decision regression trees to establish relationships between low-resolution LST and reflectance, without relying on pre-assumed relationships, making it broadly applicable [60,61]. A detailed description of the DMS algorithm and Landsat LST data is provided in [62]. Finally, the MODIS-like LST and sharpened Landsat LST were fused to produce spatiotemporally continuous 30 m LST data.

2.3.2. Footprint Computation

The turbulent fluxes measured by EC and OMS, representing energy exchanges over a dynamic upwind area, can be estimated using a footprint model. The source area for EC measurements was calculated using the method proposed by [63], with the functional expression given as follows:
F c ( 0 , 0 , z m )   =   R Q c ( x , y ) f ( x , y ) d x   d y
z m represents the effective observation height, R denotes the surface area contributing to the flux, and Q c is the point source strength of the surface source or sink. f is the transfer function of the passive scalar source or sink from the surface, and the footprint function represents the contribution percentage (%) of a point ( x , y ) to the observation at height z m . The source area of the OMS was determined using the method proposed by [64], which integrates the model of [65] with scintillometer path weighting:
f OMS ( x , y , z m )   =   x 1 x 2 W ( x ) f ( x     x , y     y , z m ) dx
x1 and x2 represent the positions of the OMS transmitter and receiver, respectively, while x, y are points along the beam path, and x , y are the upwind coordinates of point (x, y). The footprint source area was calculated at 30 min intervals with a spatial resolution of 30 m and weighted by LE to obtain daily values [6,66]. The weighted average of the remote sensing data and the validation of Upscaling_ET were performed by reducing the daily EC and OMS footprint grids to the 90% probability area, which were then multiplied with the raster layers of the remote sensing auxiliary variables and the Upscaling_ET results.

2.3.3. ET Modeling

We selected 11 predictors commonly used in ET estimation, including Ta, RH, e, Rn, WS, WD, Precipitation, LST, NDVI, EVI2, and LAI [67], to develop machine learning models. Two input scenarios were tested: (1) using only remote sensing data as inputs (LST, NDVI, EVI2, and LAI), denoted as “rs” (e.g., 1D CNN_rs), and (2) using both remote sensing and meteorological data (all 11 predictors), denoted as “all” (e.g., 1D CNN_all). The dataset was split into two parts: 80% of the data were used for model training and cross-validation, while the remaining 20% were reserved as a test set to evaluate model performance.
RF is an ensemble learning algorithm based on decision trees [68]. It uses bootstrap sampling to construct decision trees on random subsets of training data and features, averaging their outputs for predictions. Its ability to handle nonlinear relationships and resist overfitting makes it widely used in surface parameter modeling [69,70,71].
XGBoost, developed by [72], enhances traditional Gradient Boosting Decision Tree (GBDT) by incorporating second-order derivatives and a regularization term, improving accuracy and efficiency.
DNNs extend artificial neural networks (ANNs) by incorporating multiple hidden layers [73]. The DNN architecture used in this study consists of two hidden layers, each with 64 neurons, and employs ReLU activation functions. To mitigate overfitting, Dropout layers with a 50% rate were added after each hidden layer.
1D CNN processes sequential data and time series by applying convolutional kernels along the temporal dimension [74]. The model includes two convolutional layers, followed by max-pooling layers and a fully connected layer. ReLU activation functions were applied, and hyperparameters were determined via trial-and-error.
LSTM improve recurrent neural networks (RNNs) by using gating mechanisms and memory cells to capture long-term dependencies in sequential data [75]. The LSTM architecture includes two hidden layers, with 64 and 32 units, respectively, and applies Sigmoid and Tanh activation functions. Dropout layers with a 50% rate were added after each hidden layer to further reduce overfitting. Training used the Adam optimizer [76] with an MSE loss function, an initial learning rate of 0.001, and a maximum of 100 epochs. Figure 3 illustrates the architectures of the deep learning models, where input variables were standardized.
For the LSTM and 1D CNN models, a sliding window approach with a sequence length of five days was used. For each sample, the model input consisted of the features from the previous five days, and the target output was the ET on the fifth day. This corresponds to a single-step regression setup.

2.3.4. Model Interpretability and Importance Analysis

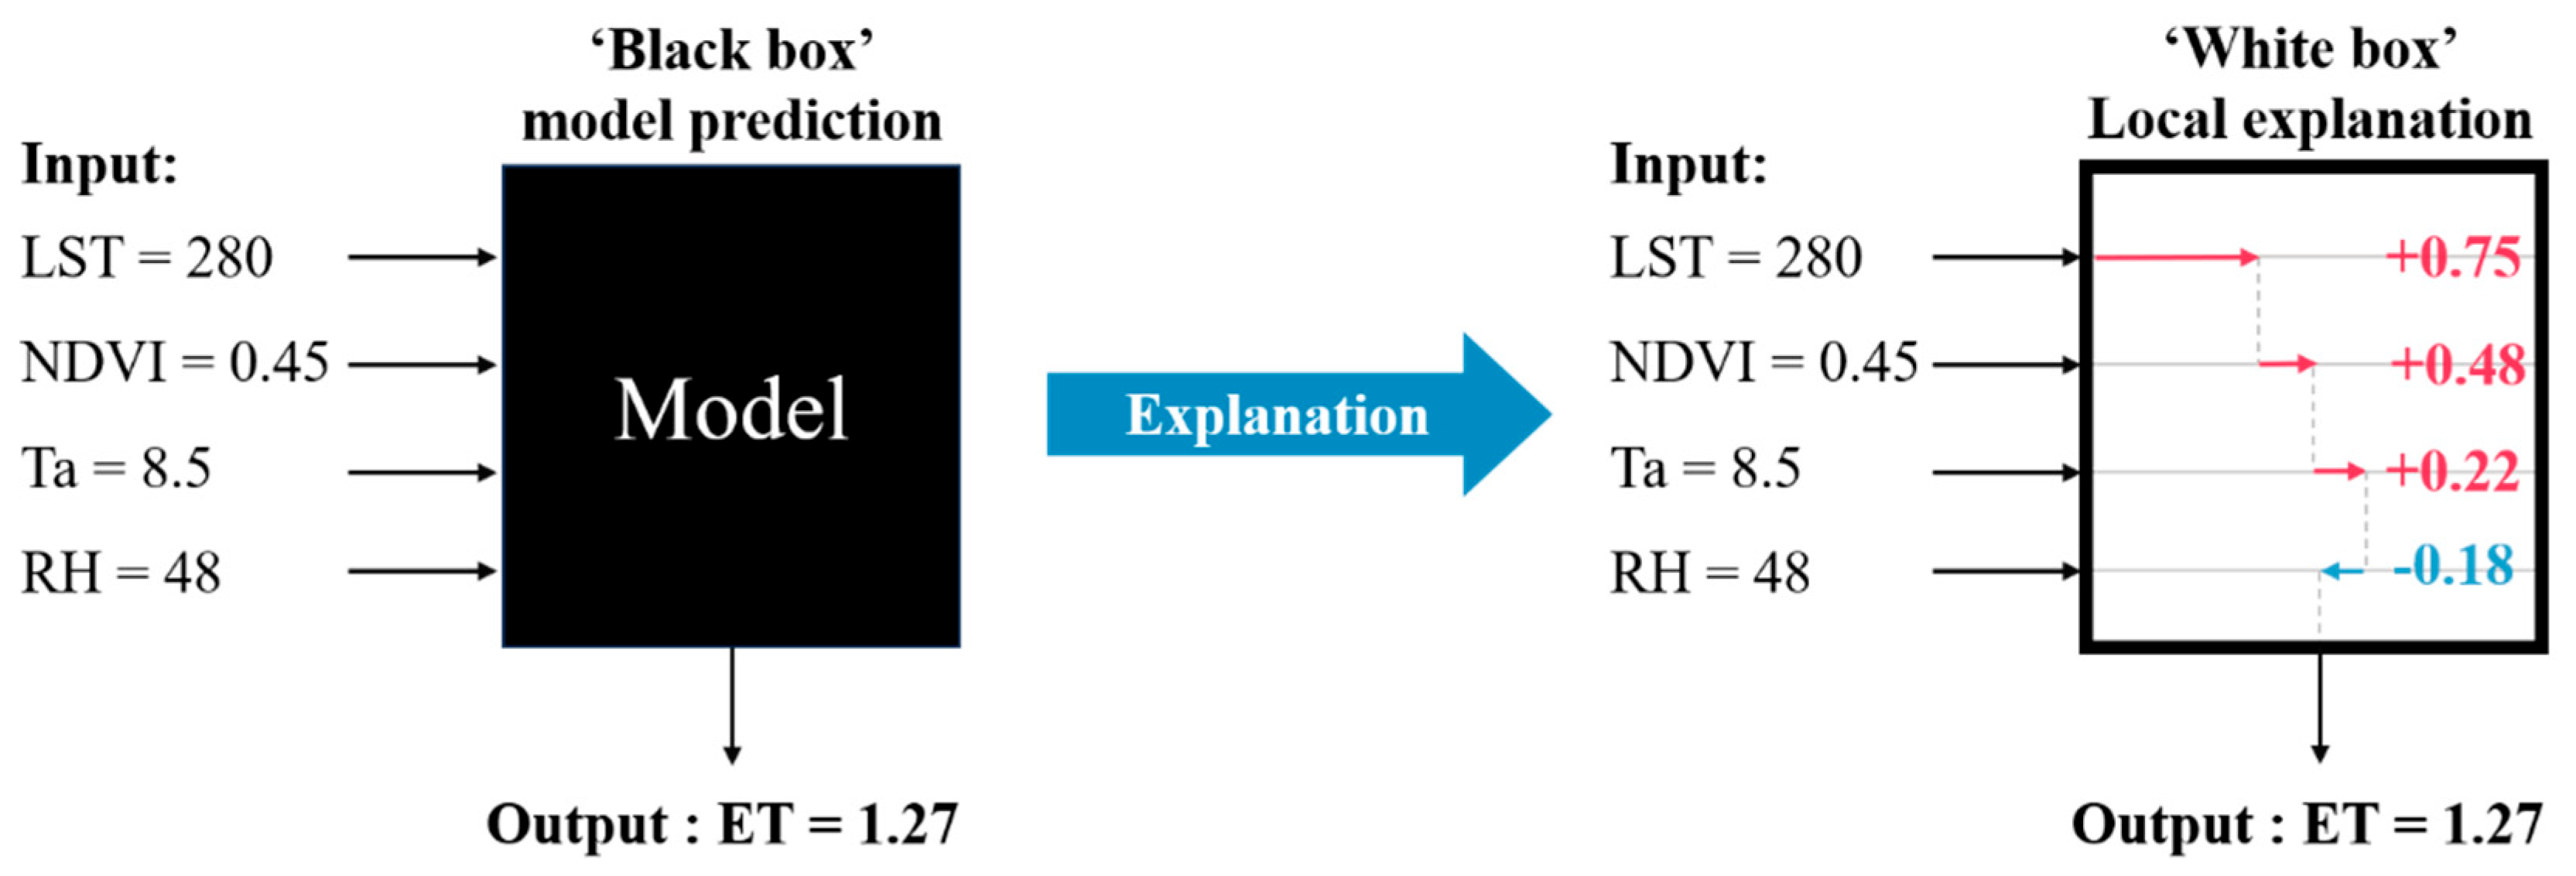
Model interpretability is a critical topic in the fields of machine learning. While complex models such as deep neural networks and ensemble models often exhibit excellent predictive performance [3,77], they are frequently regarded as “black boxes” due to their lack of transparency in explaining how selected features influence ET predictions [78]. SHAP is a powerful tool for explaining model outputs by assigning importance values to features (Figure 4). Based on Shapley values [79], SHAP offers a fair method for distributing contributions among cooperative participants [80,81]. In this study, SHAP was utilized to evaluate the influence of predictors on ET predictions and to quantify the relative importance of each feature.

2.3.5. Statistical Metrics

To assess the performance of the models and the accuracy of Upscaling ET, this study utilized root mean square error (RMSE), Pearson correlation coefficient (R), mean absolute error (MAE), and Bias as the primary evaluation metrics. These metrics are widely recognized and have been extensively applied in previous related studies [55,69]. The formulas for their calculation are as follows:
R = i   =   1 n ( y i ^   y ^ ¯ ) ( y i     y - ) i   =   1 n ( y i ^   y ^ ¯ ) 2 i   =   1 n ( y i     y - ) 2
B i a s = 1 n i = 1 n ( y i ^   y i )
M A E = 1 n i = 1 n y i ^   y i
R M S E = 1 n i = 1 n ( y i ^ y i ) 2
where y i ^ is the predicted value for the i-th sample, y i is the corresponding true value, y - and y ^ ¯ are the means of the true values and predicted values, respectively, and n is the number of samples.

3. Results

3.1. Performance of Daily LST and Vegetation Indices

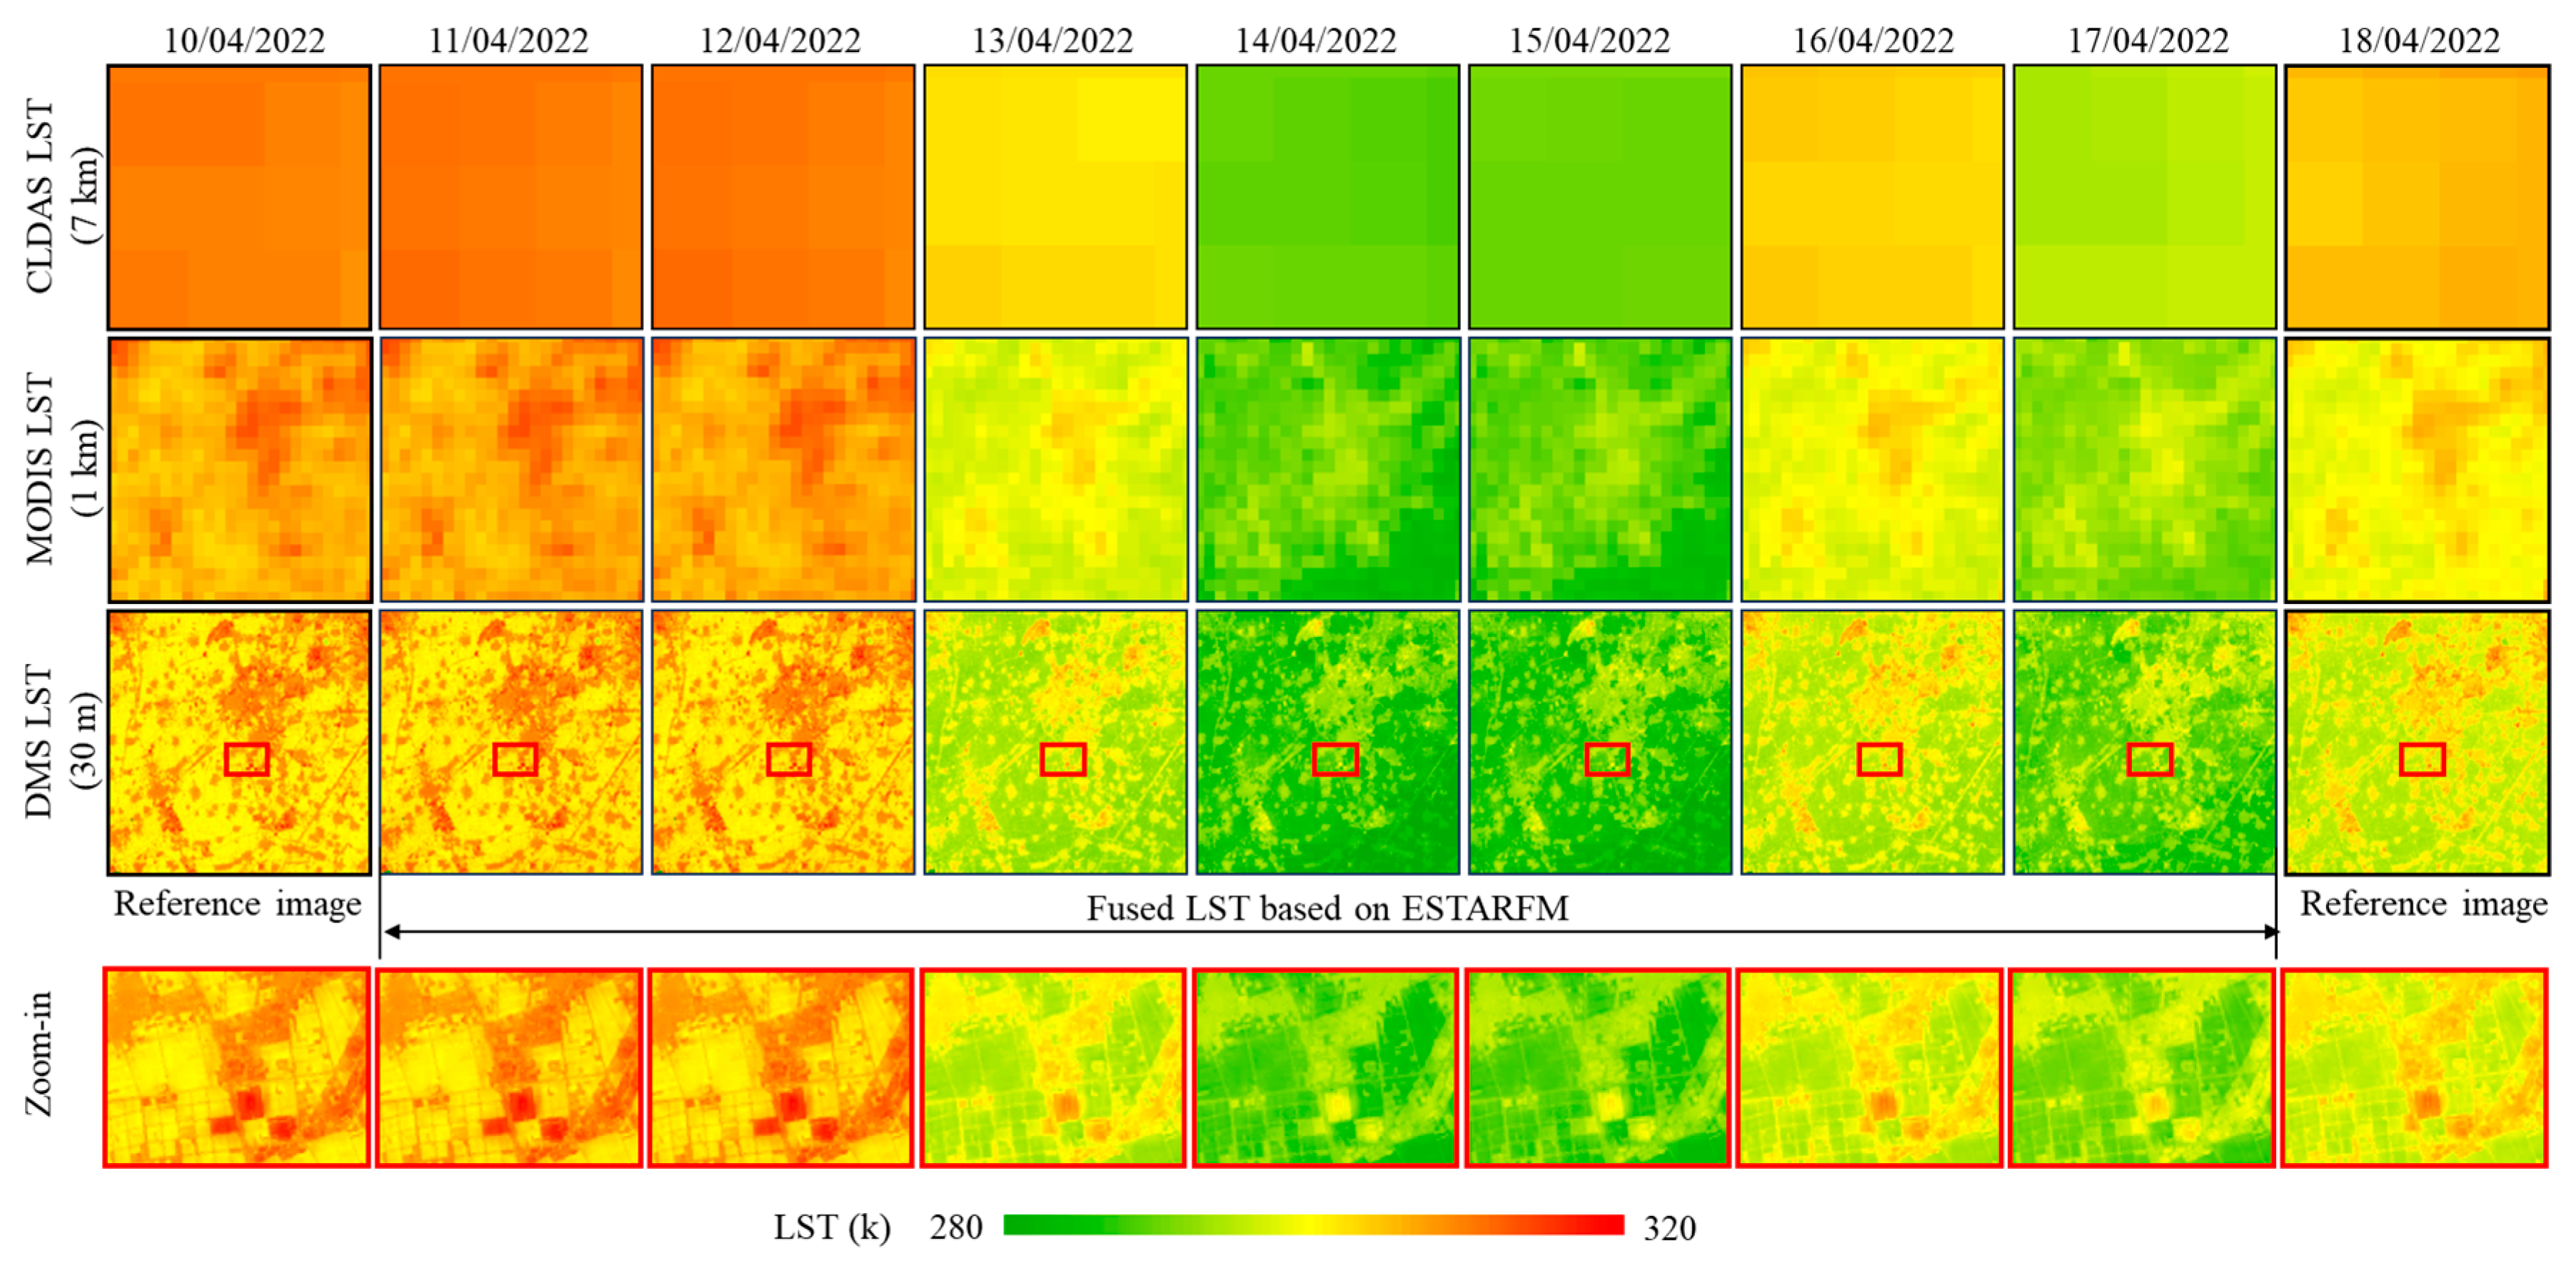
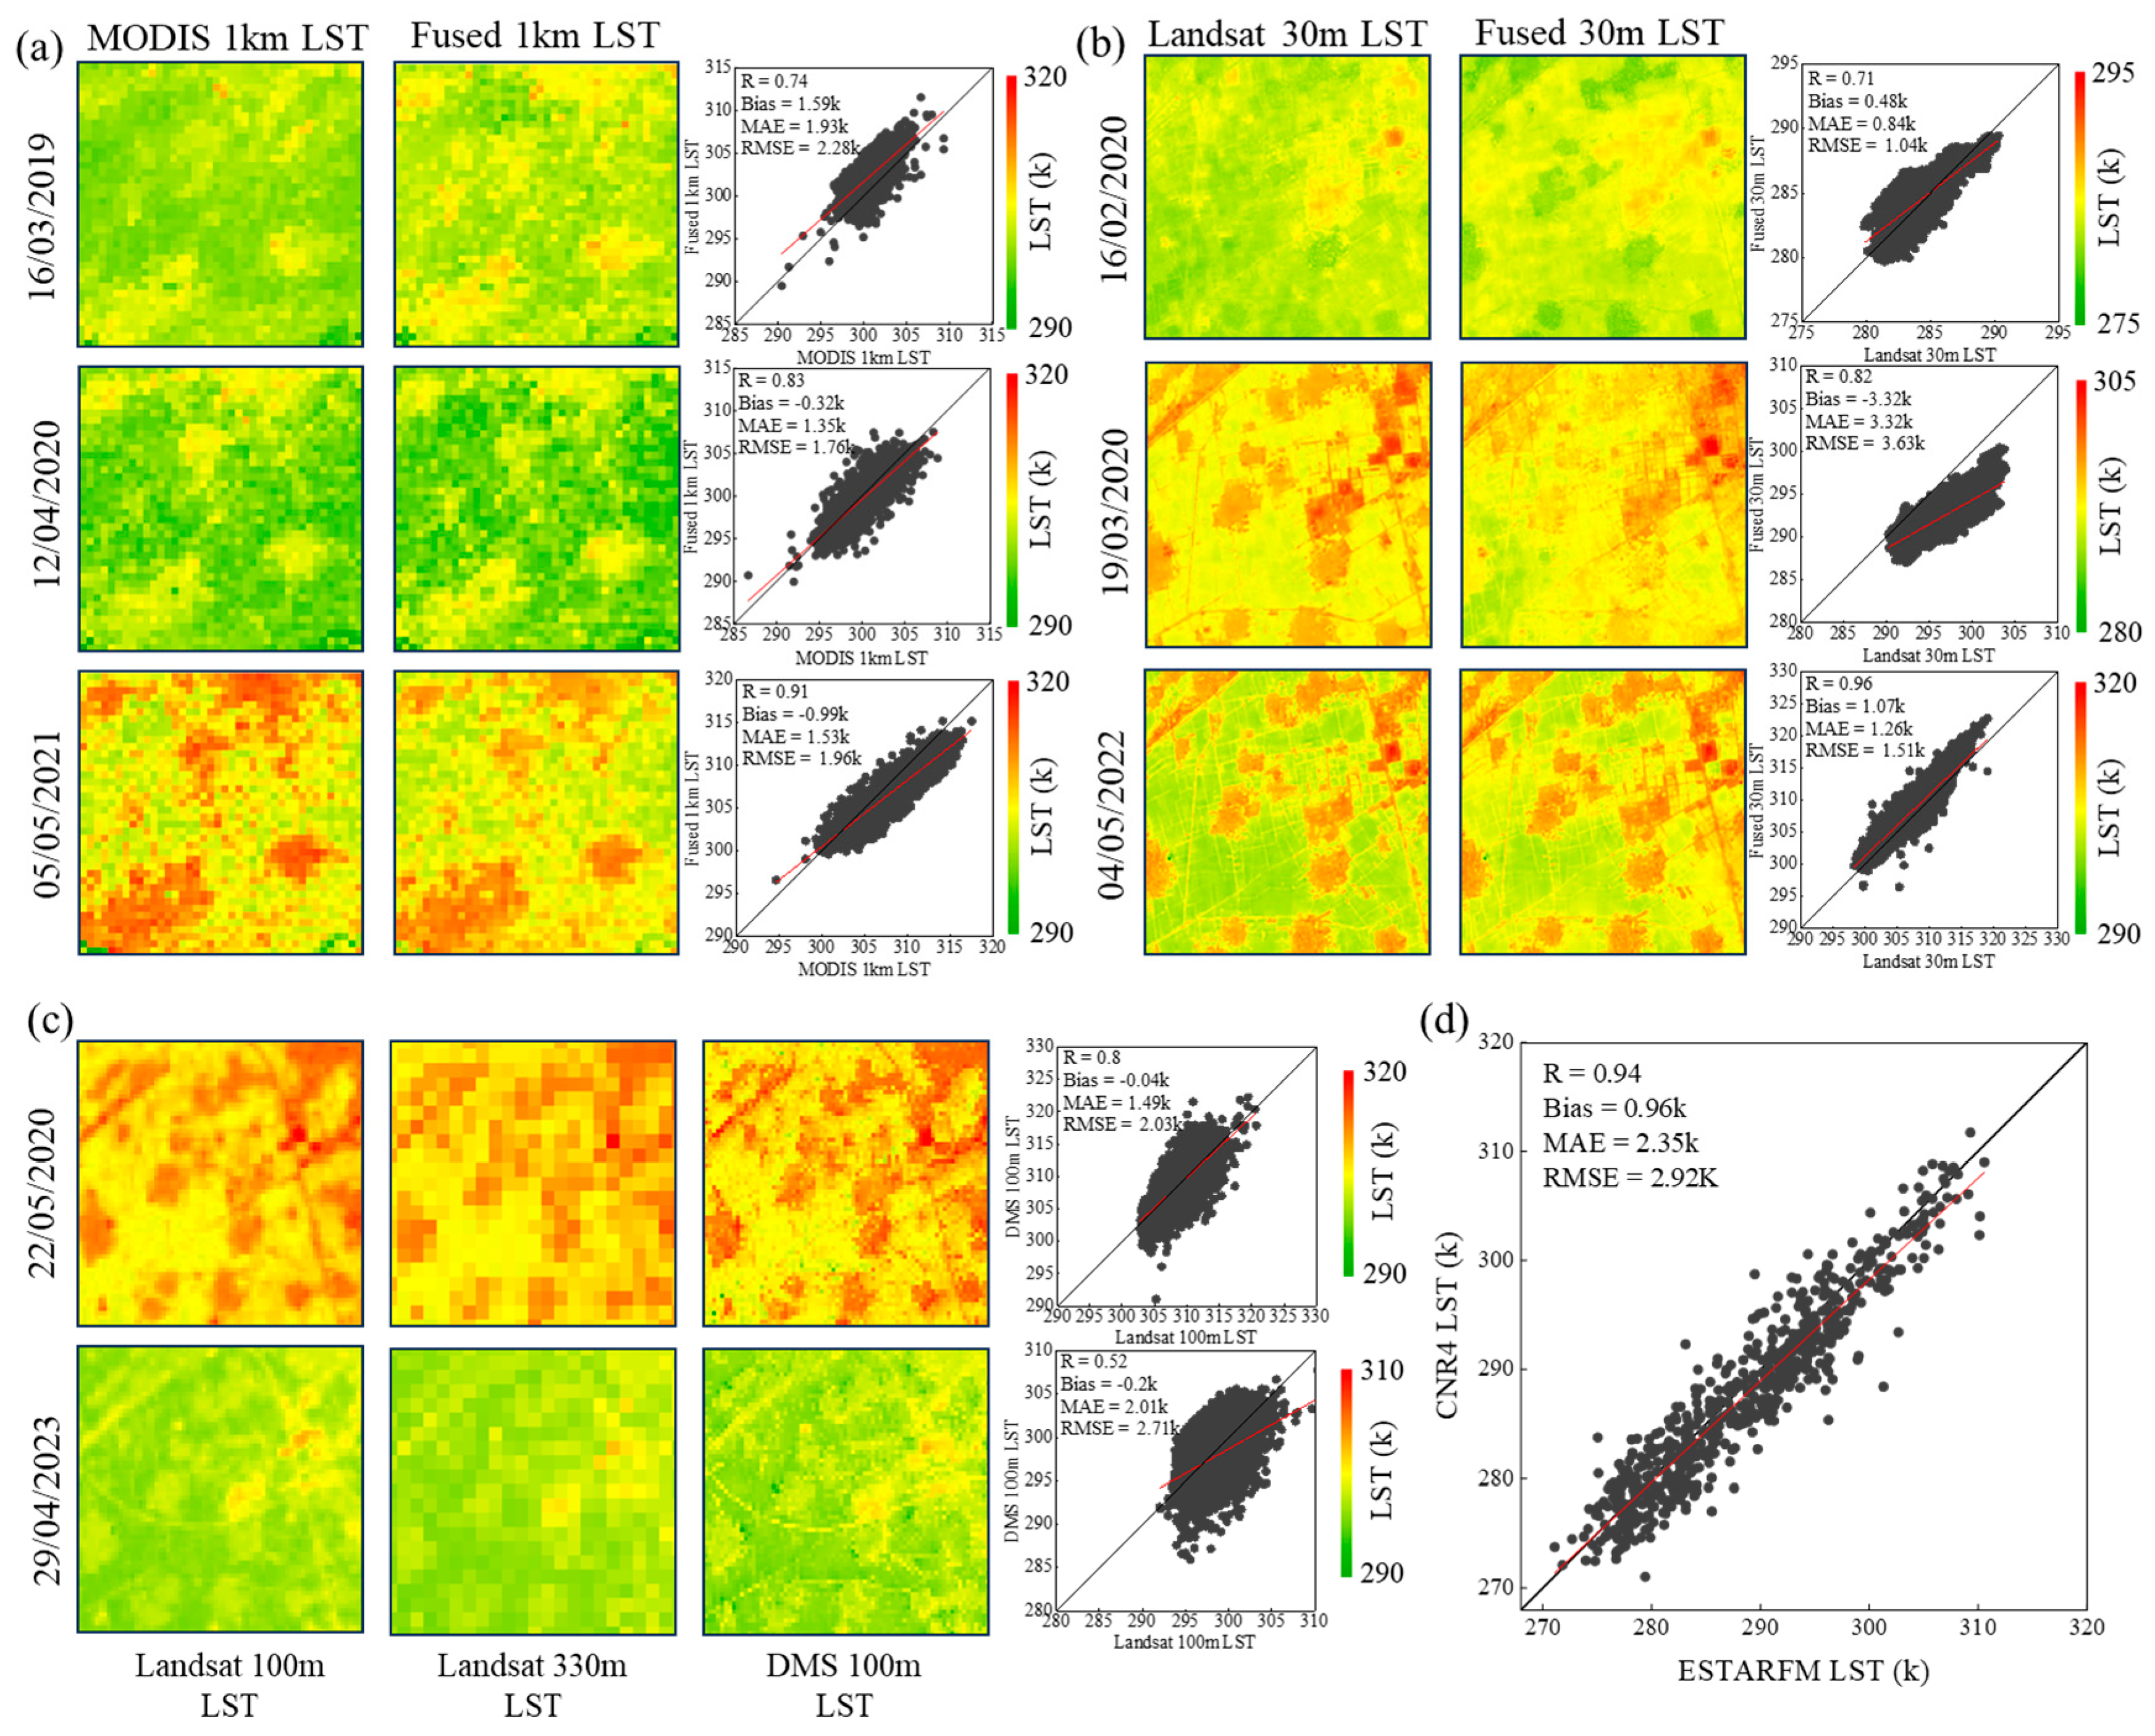
Figure 5 illustrates the overall process of generating daily 30 m LST through the fusion of CLDAS, MODIS, and Landsat LST. The fused 30 m LST effectively captures subtle spatial details and accurately reflects spatial variability. Impervious surfaces, such as buildings and roads, exhibit higher LST values, whereas farmland areas show relatively lower LST. Validation of the 30 m LST was conducted using both the original imagery and the CNR4 observations (Figure 6). When compared with the original imagery, the R, Bias, MAE, and RMSE ranged from 0.52 to 0.96, −0.04 K to 3.32 K, 1.26 K to 3.32 K, and 1.04 K to 3.63 K, respectively. When validated against CNR4 observations, the corresponding values of R, bias, MAE, and RMSE were 0.94, 0.96 K, 2.35 K, and 2.92 K, respectively. Figure 7 illustrates the spatial distribution of the monthly mean EVI2 derived from daily composites. EVI2 shows a gradual increase in March, corresponding to the jointing stage of winter wheat, characterized by rapid growth and development. It peaks in April, then gradually declines, reaching its lowest levels in June. Distinct differences and clear boundaries are observed between farmland and non-farmland areas. Validation of the EVI2 values was performed using original Landsat imagery. For 2 April, 18 April, and 4 May 2022, and 4 March 2023, the R ranged from 0.953 to 0.977, while Bias ranged from 0.015 to 0.074. The MAE and RMSE values ranged from 0.010 to 0.070 and 0.047 to 0.083, respectively. These validation results demonstrate that the EVI2 generated using the GF-SG is highly consistent with the original Landsat imagery. Overall, the framework proposed in this study successfully generated high-accuracy remote sensing data, providing reliable input data for the models.

3.2. Model Performance on the Test Set

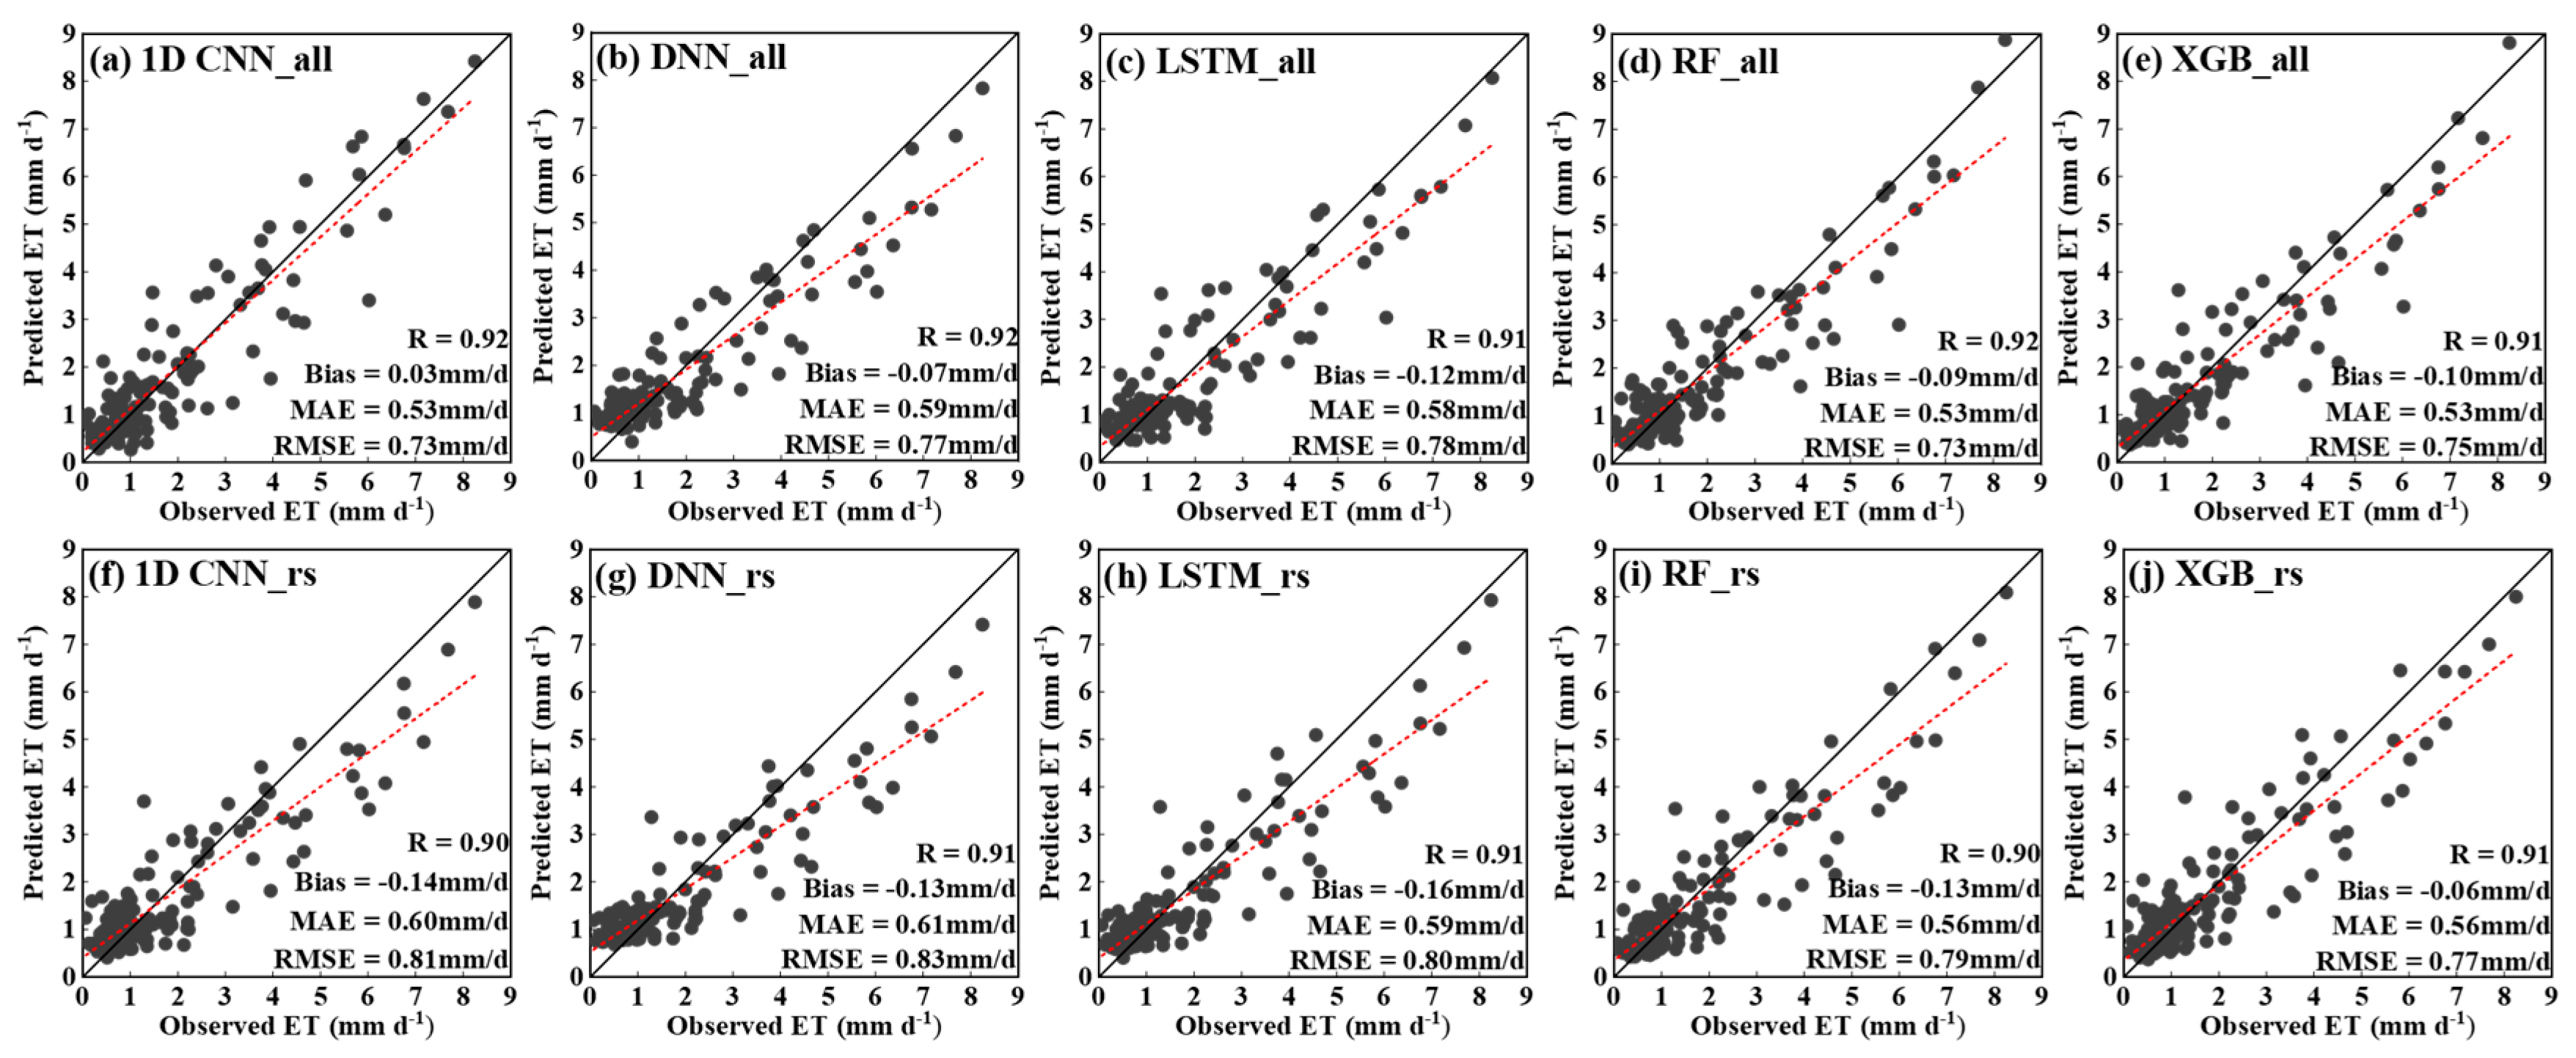
Figure 8 presents the performance of different models on the test set. The RMSE values for the models 1DCNN_all, 1DCNN_rs, DNN_all, DNN_rs, LSTM_all, LSTM_rs, RF_all, RF_rs, XGB_all, and XGB_rs are 0.73 mm/d, 0.81 mm/d, 0.77 mm/d, 0.83 mm/d, 0.78 mm/d, 0.80 mm/d, 0.73 mm/d, 0.79 mm/d, 0.75 mm/d, and 0.77 mm/d, respectively. All models achieved an R value exceeding 0.9. Among these, the 1DCNN_all model exhibited the best performance, with lower Bias and MAE values. For the same type of model, incorporating meteorological data improved accuracy. Overall, the predictions from all models showed strong consistency with the test set, with data distributions closely aligned with the 1:1 line, demonstrating robust model performance.

3.3. Global Interpretability of the Model

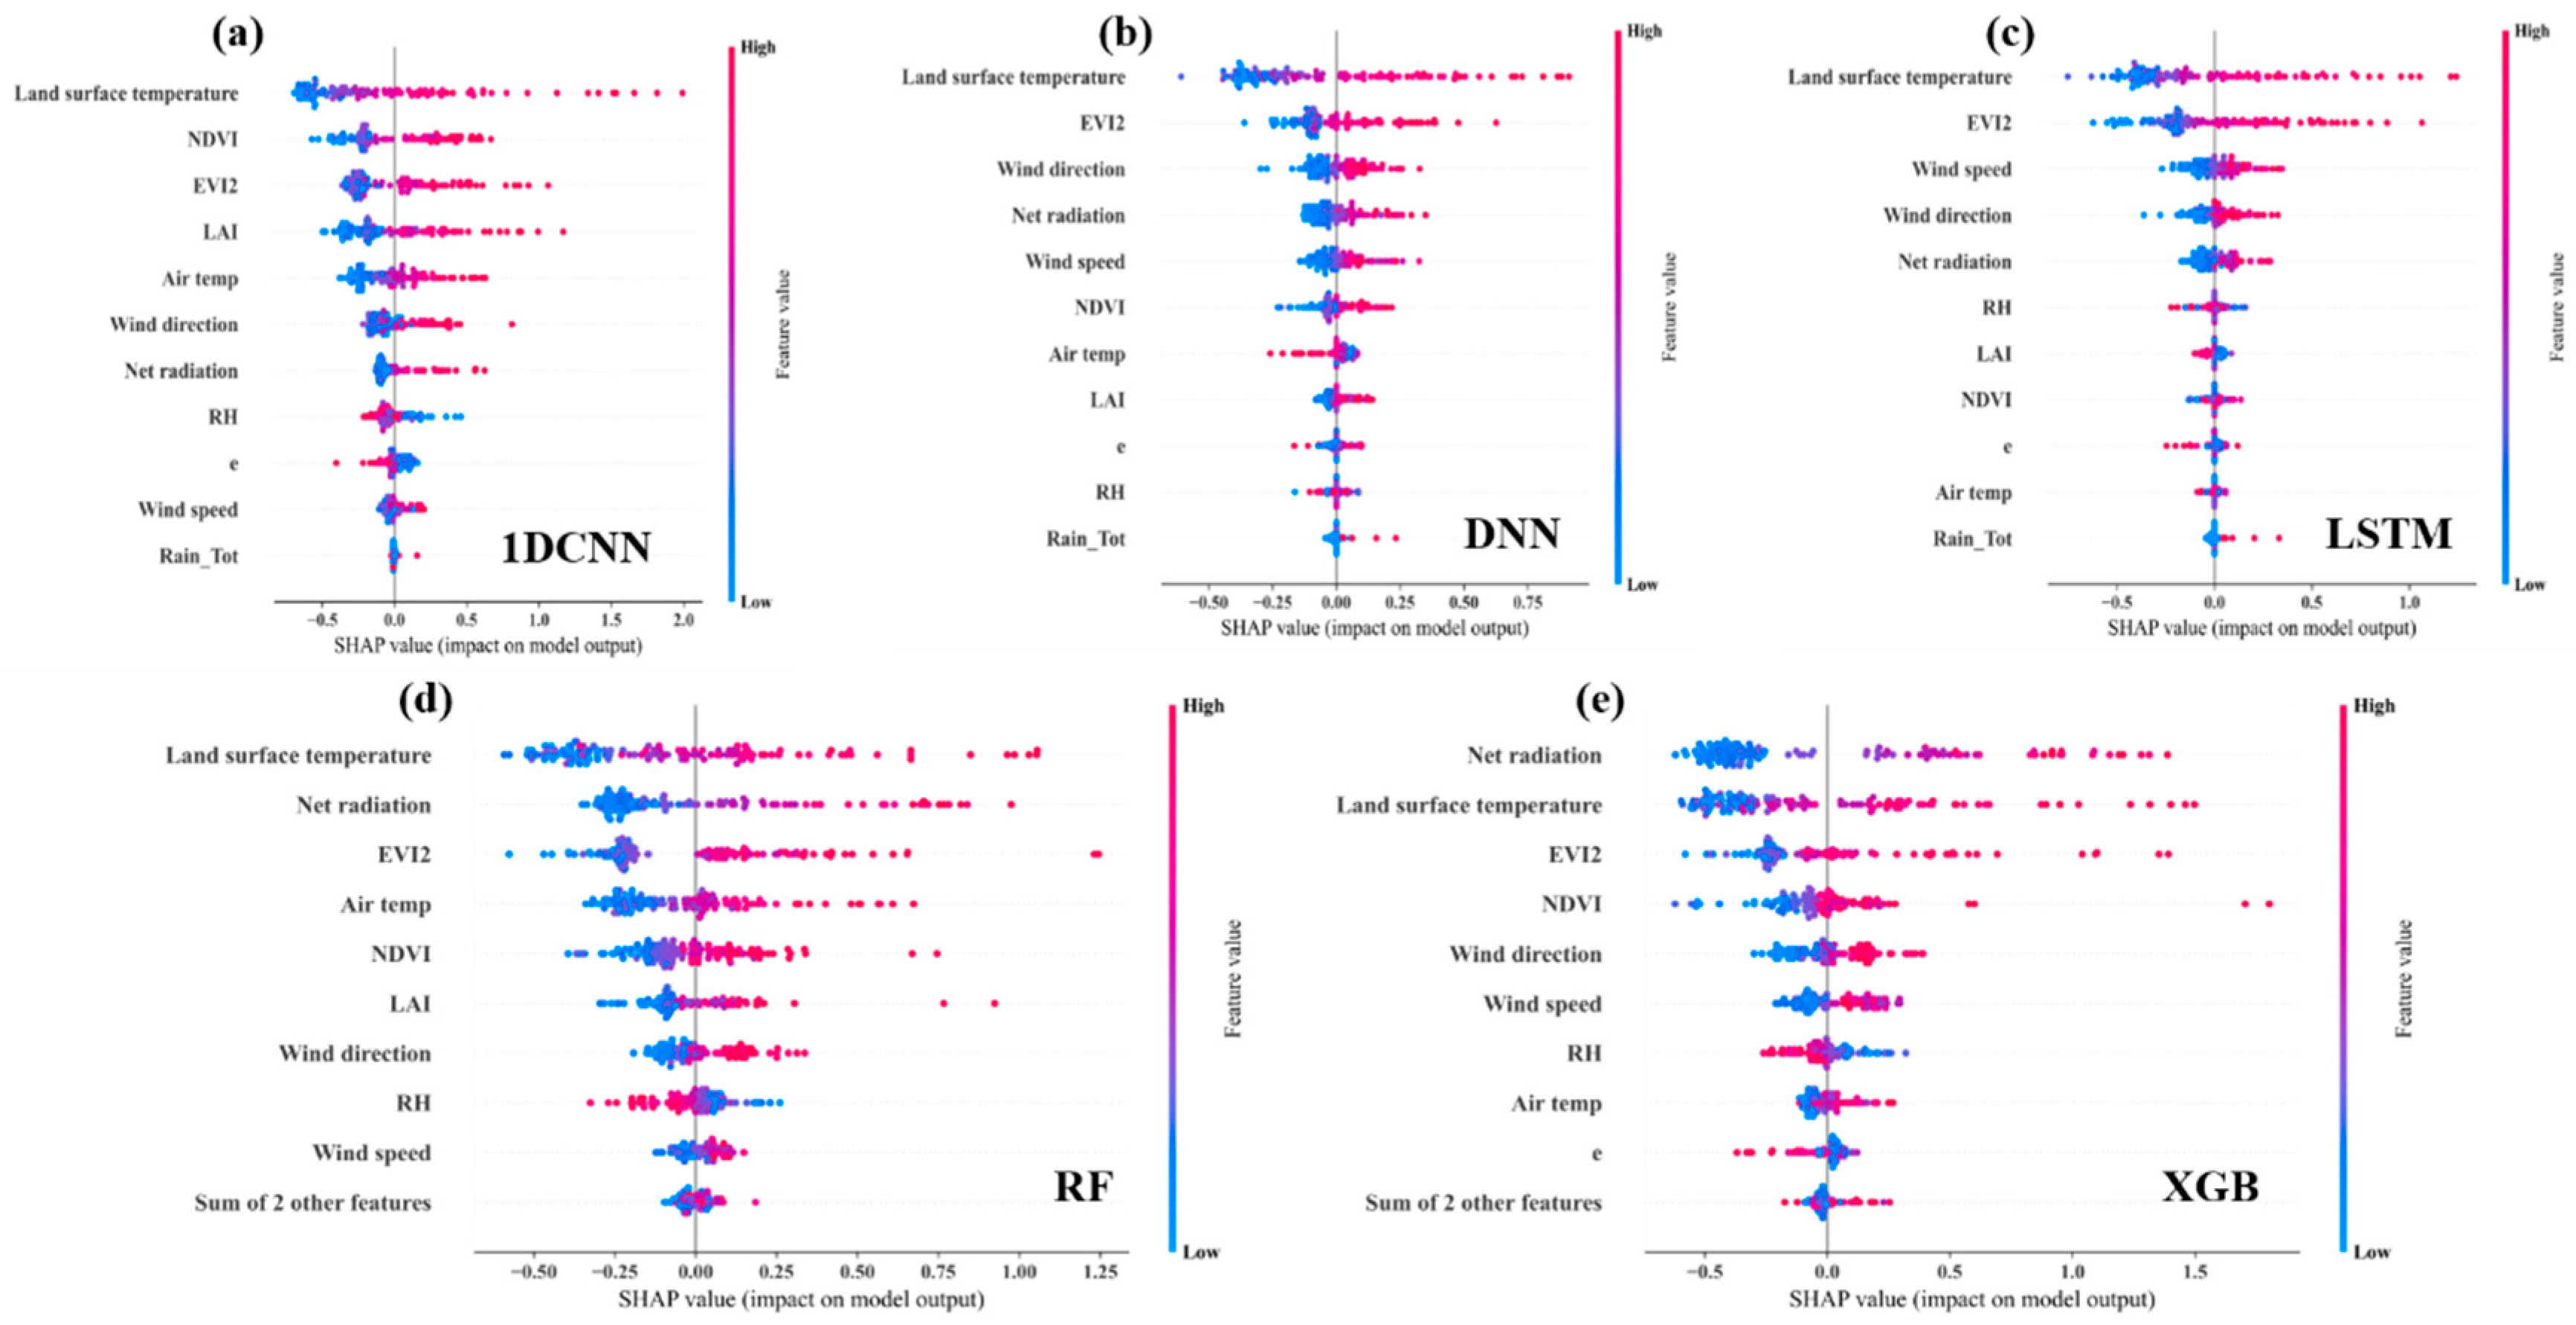
In Figure 9, the x-axis represents SHAP values, indicating each feature’s contribution to ET predictions—positive values increase predicted ET, while negative values decrease it. The y-axis ranks features by importance. Each point represents a test sample, with blue indicating lower feature values and red indicating higher values. The distribution of red and blue points reveals the direction of feature effects.
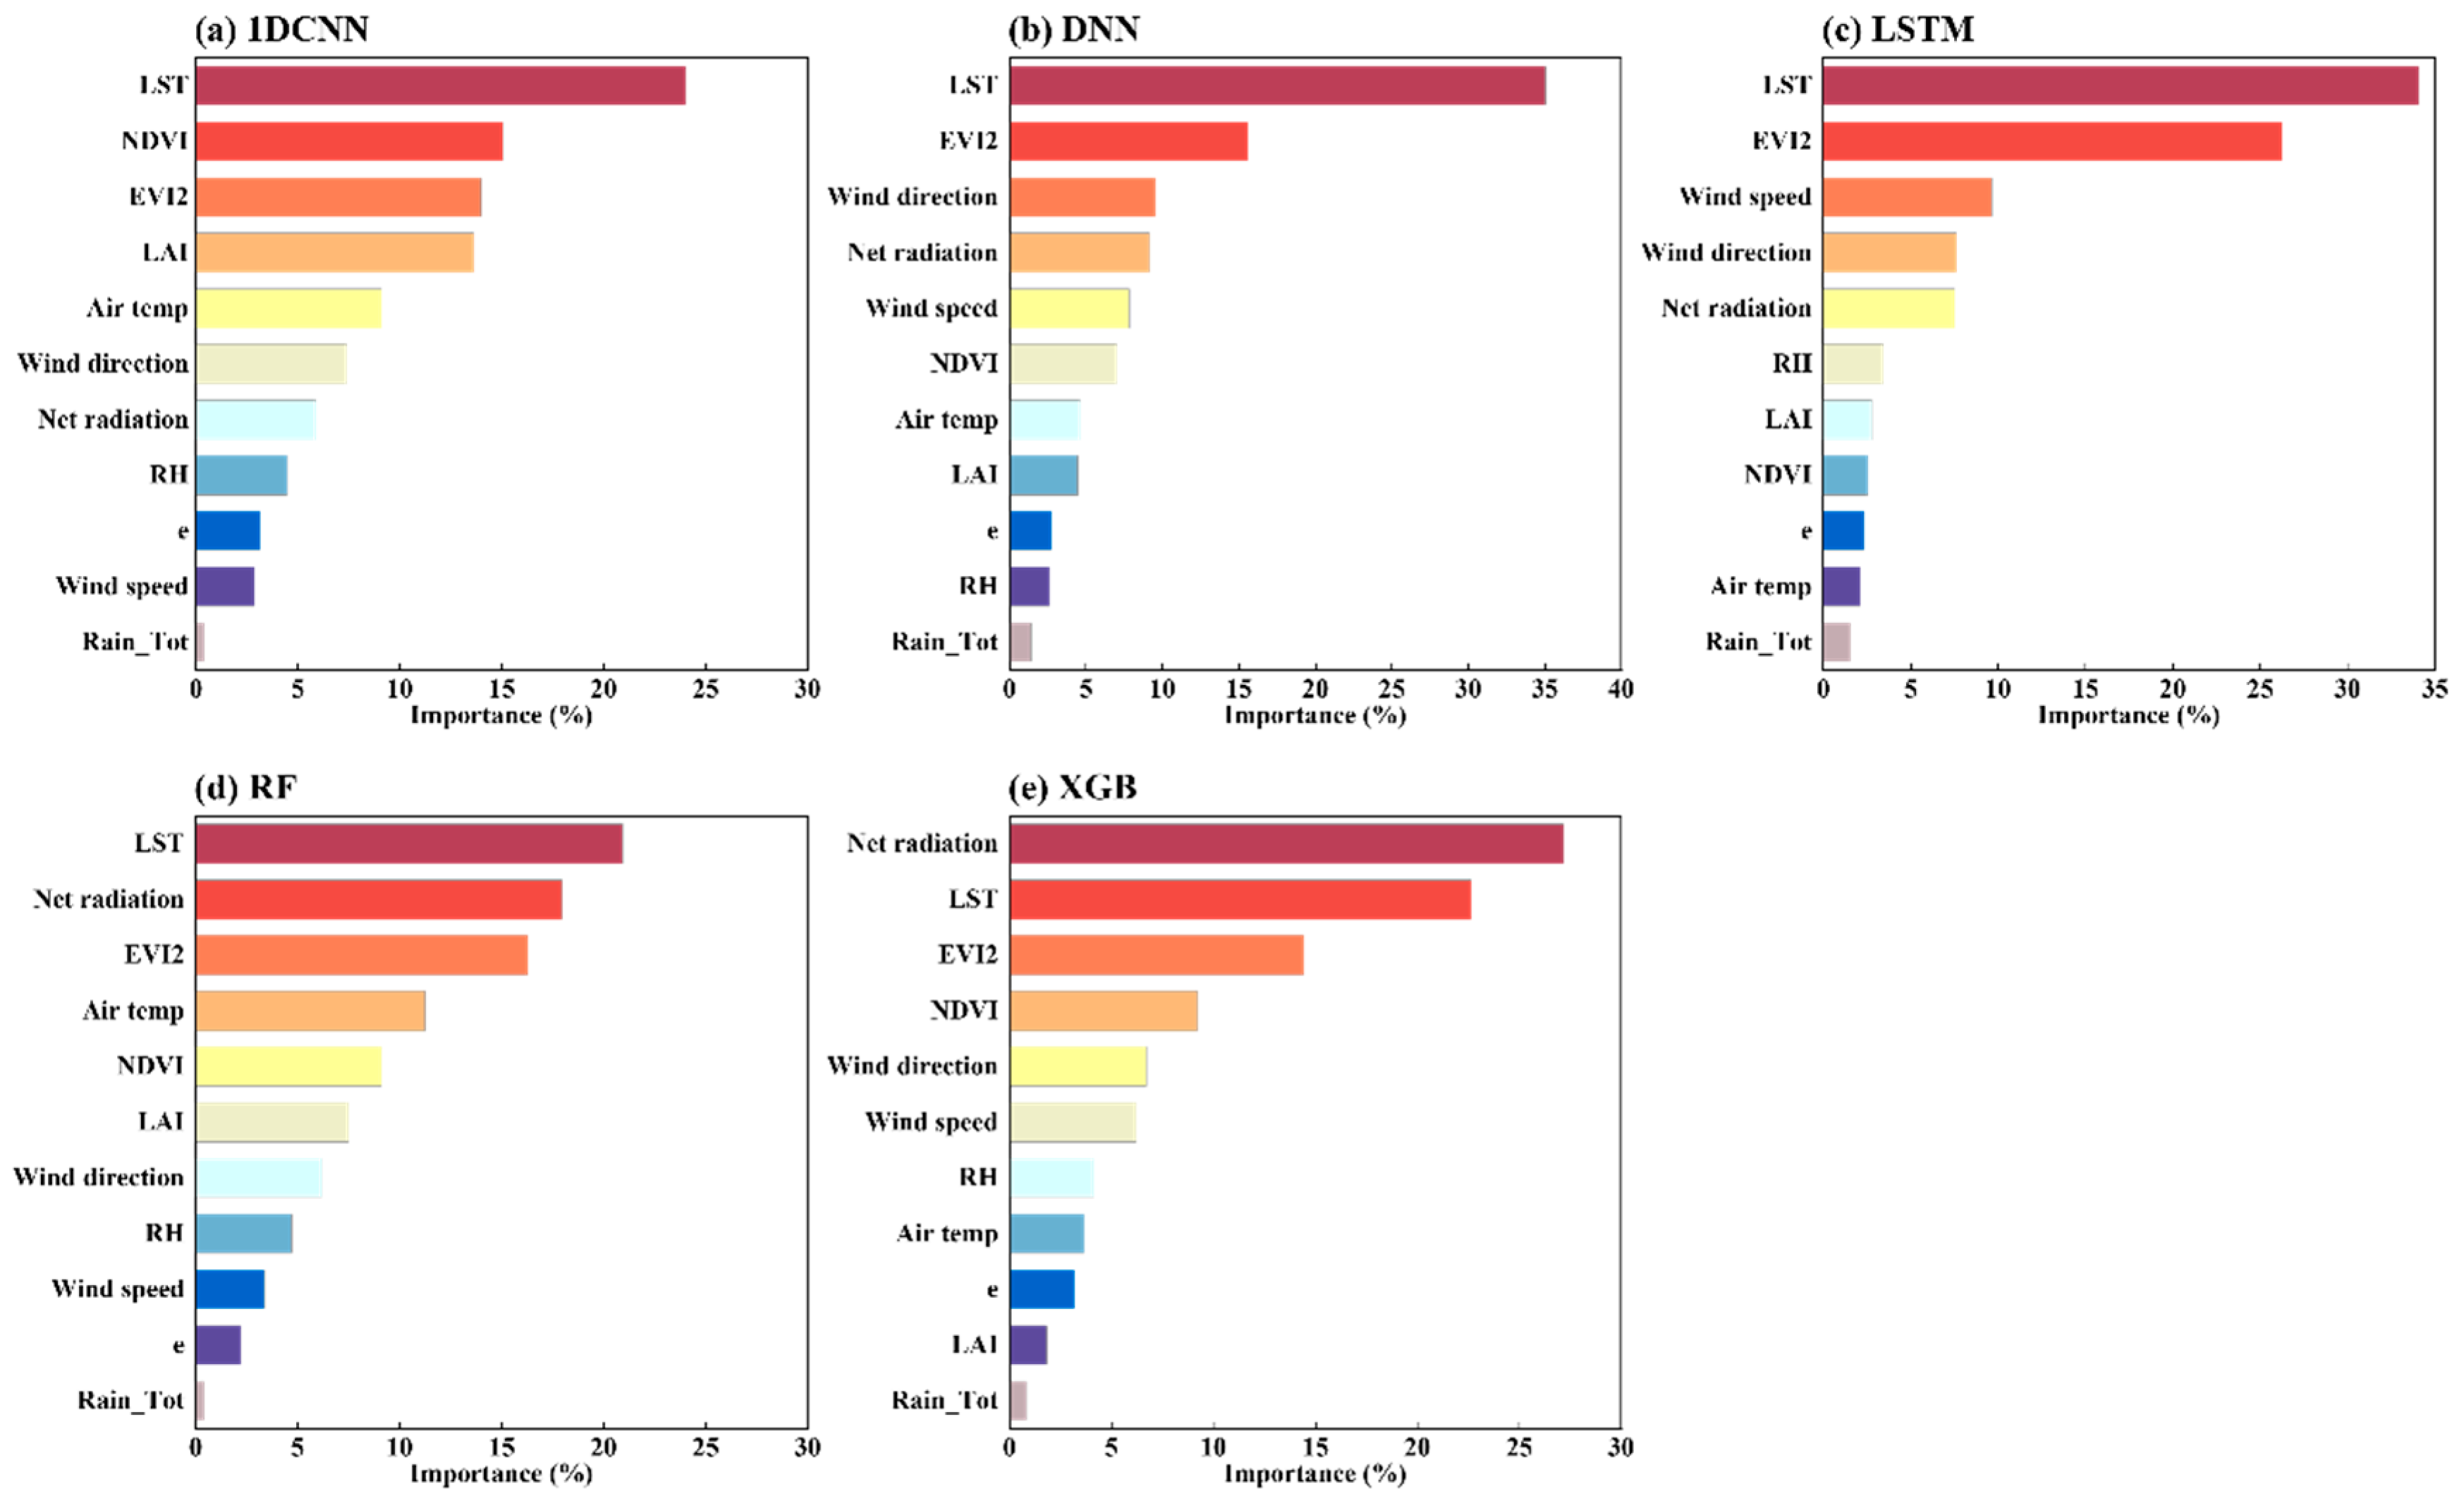
The results indicate that higher values of LST, EVI2, LAI, NDVI, Ta, Rn, and Ws are associated with increased ET predictions. Conversely, higher RH and e are associated with decreased ET predictions, aligning with the established driving mechanisms of ET. Notably, Wd greater than 180° results in higher ET predictions, as the underlying surface is predominantly farmland. In contrast, smaller Wd correspond to underlying surfaces that include buildings and roads. Furthermore, the five algorithms demonstrated limited sensitivity to precipitation events, likely due to the small number of precipitation events in the training data. Figure 10 illustrates the relative importance of predictors across the five algorithms. While ET is strongly influenced by meteorological conditions, the importance of remote sensing data is evident in all algorithms. In the 1D CNN, DNN, LSTM, RF, and XGB algorithms, the combined importance of the four remote sensing factors accounts for 66.7%, 62.1%, 65.7%, 53.9%, and 48.1%, respectively. Among all models, LST and EVI2 consistently rank among the top three predictors, regardless of the order, with respective contributions of 38%, 50.1%, 60.3%, 37.2%, and 37%. For the 1D CNN algorithm, Ta emerges as the most important meteorological factor, contributing 9.1%. In the DNN algorithm, Wd and Rn are the most critical meteorological factors, collectively accounting for 18.7%. In the LSTM algorithm, Ws and Wd are identified as the most critical meteorological predictors, highlighting the model’s sensitivity to the heterogeneity of the underlying surface. For the RF and XGB algorithms, the relative importance of meteorological factors is nearly equivalent to that of remote sensing factors, with net radiation identified as the most significant meteorological predictor, contributing 17.9% and 27.1%, respectively.

3.4. Direct Comparison of Upscaling_ET with OMS

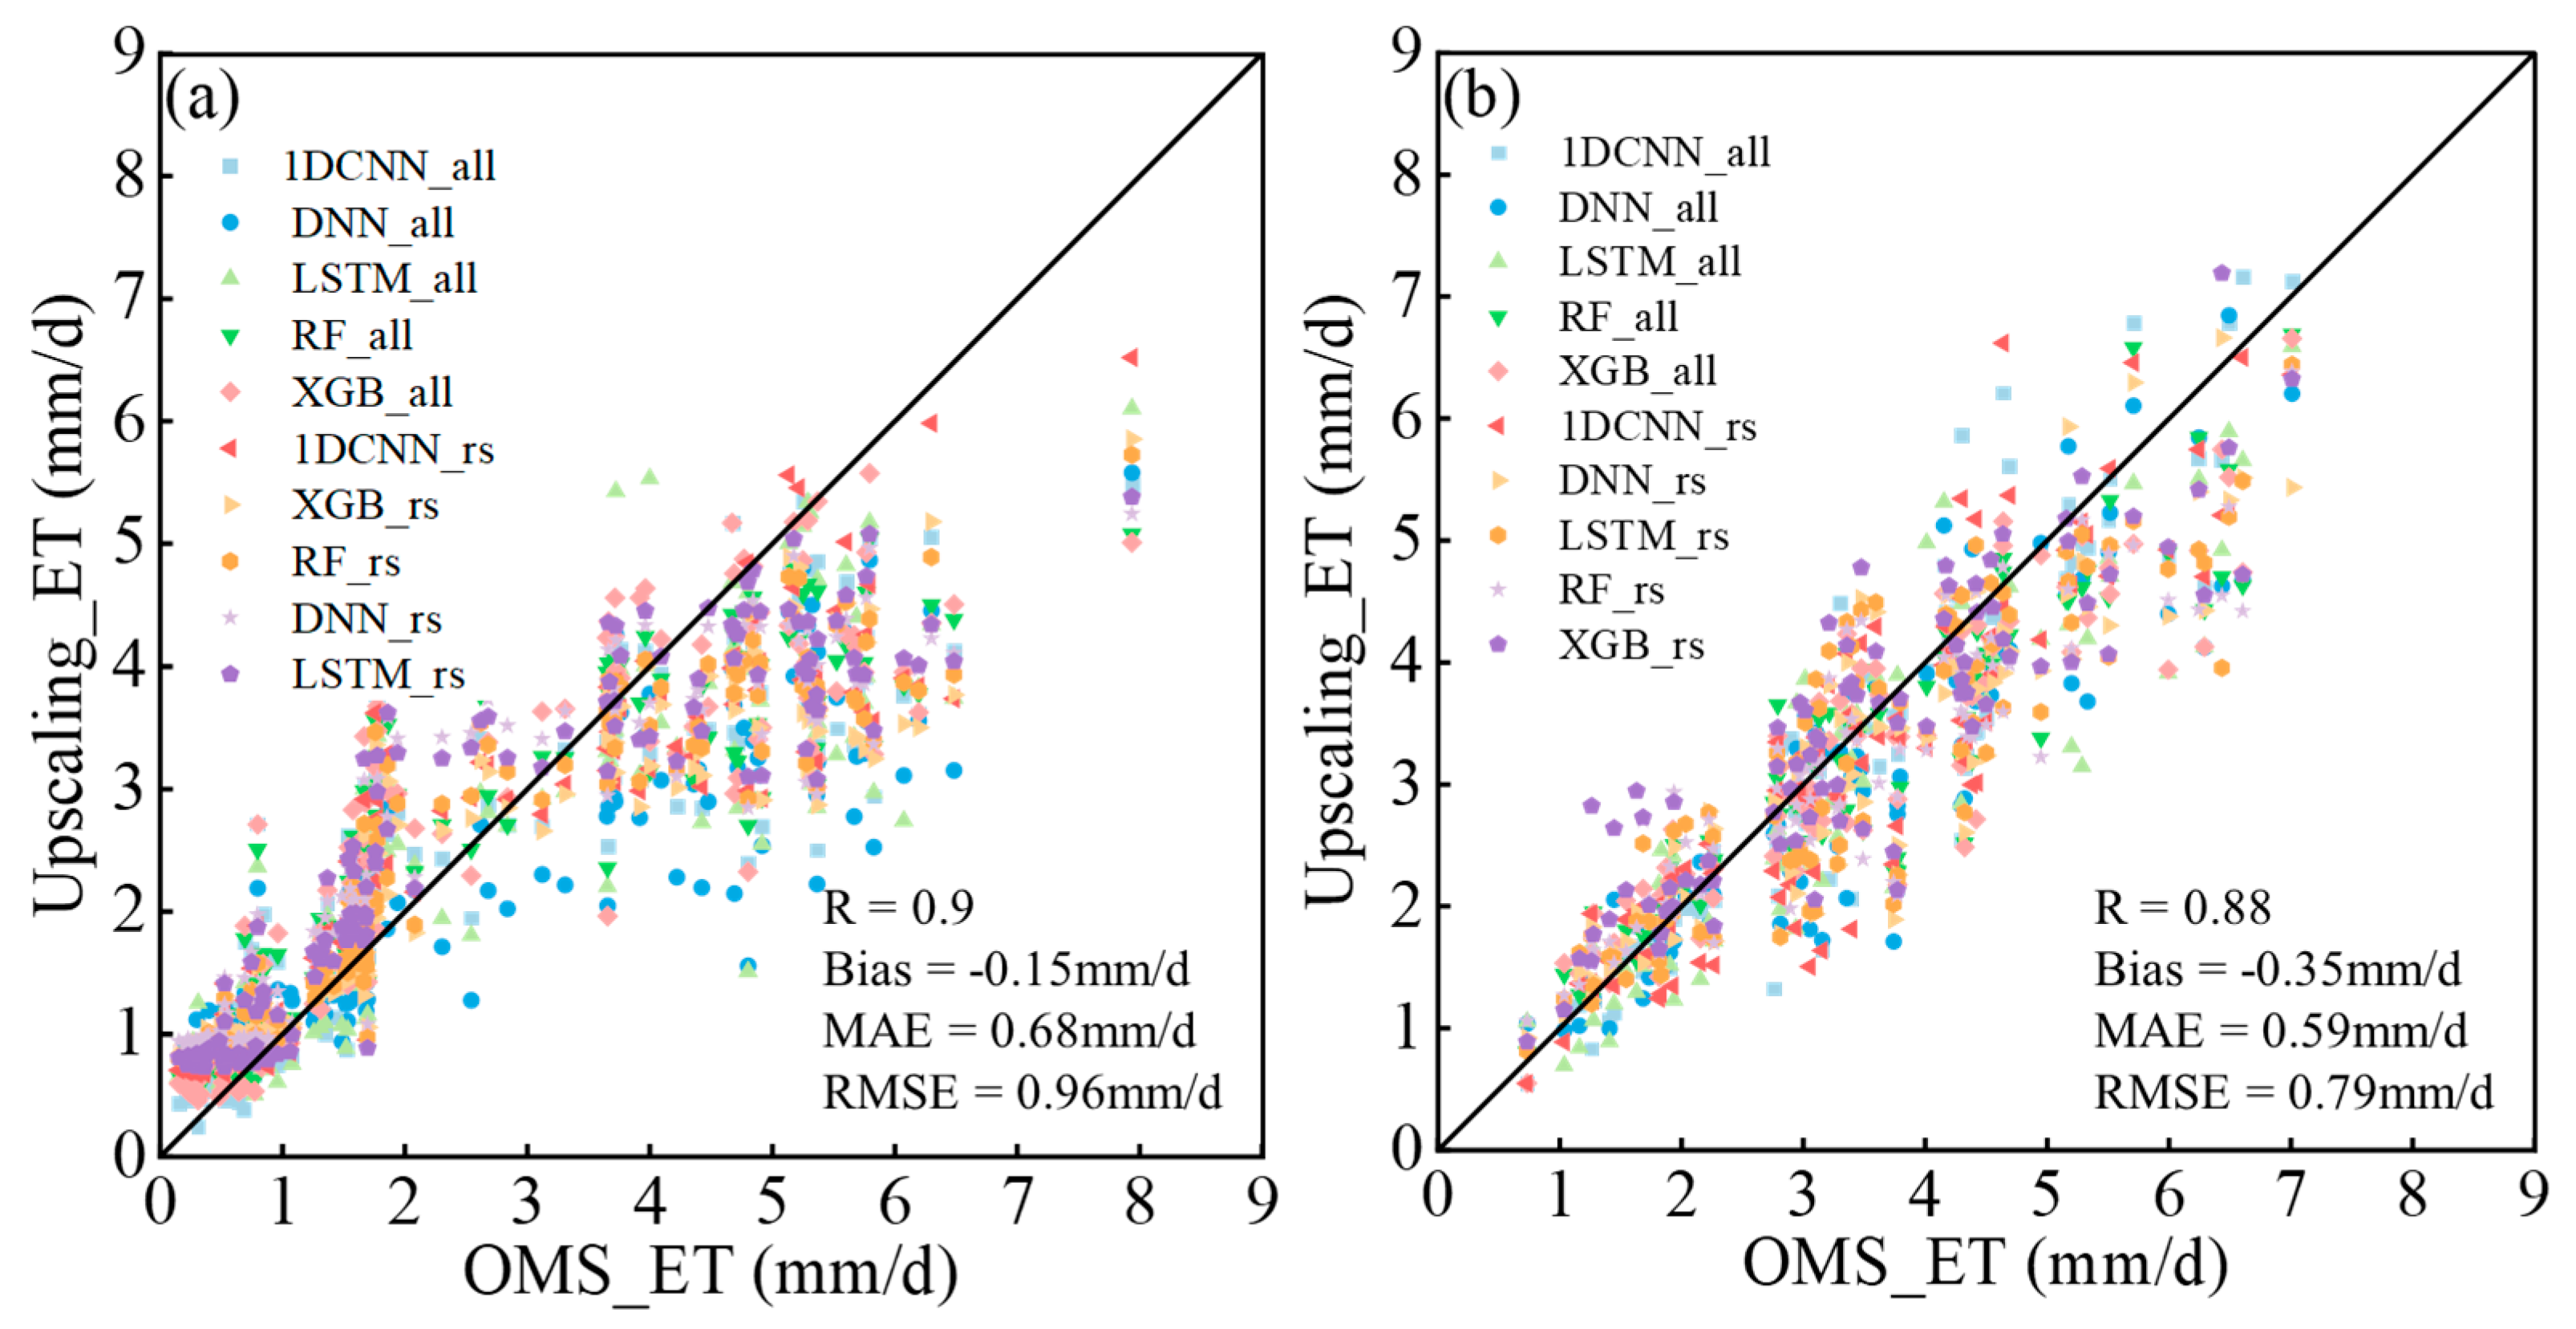
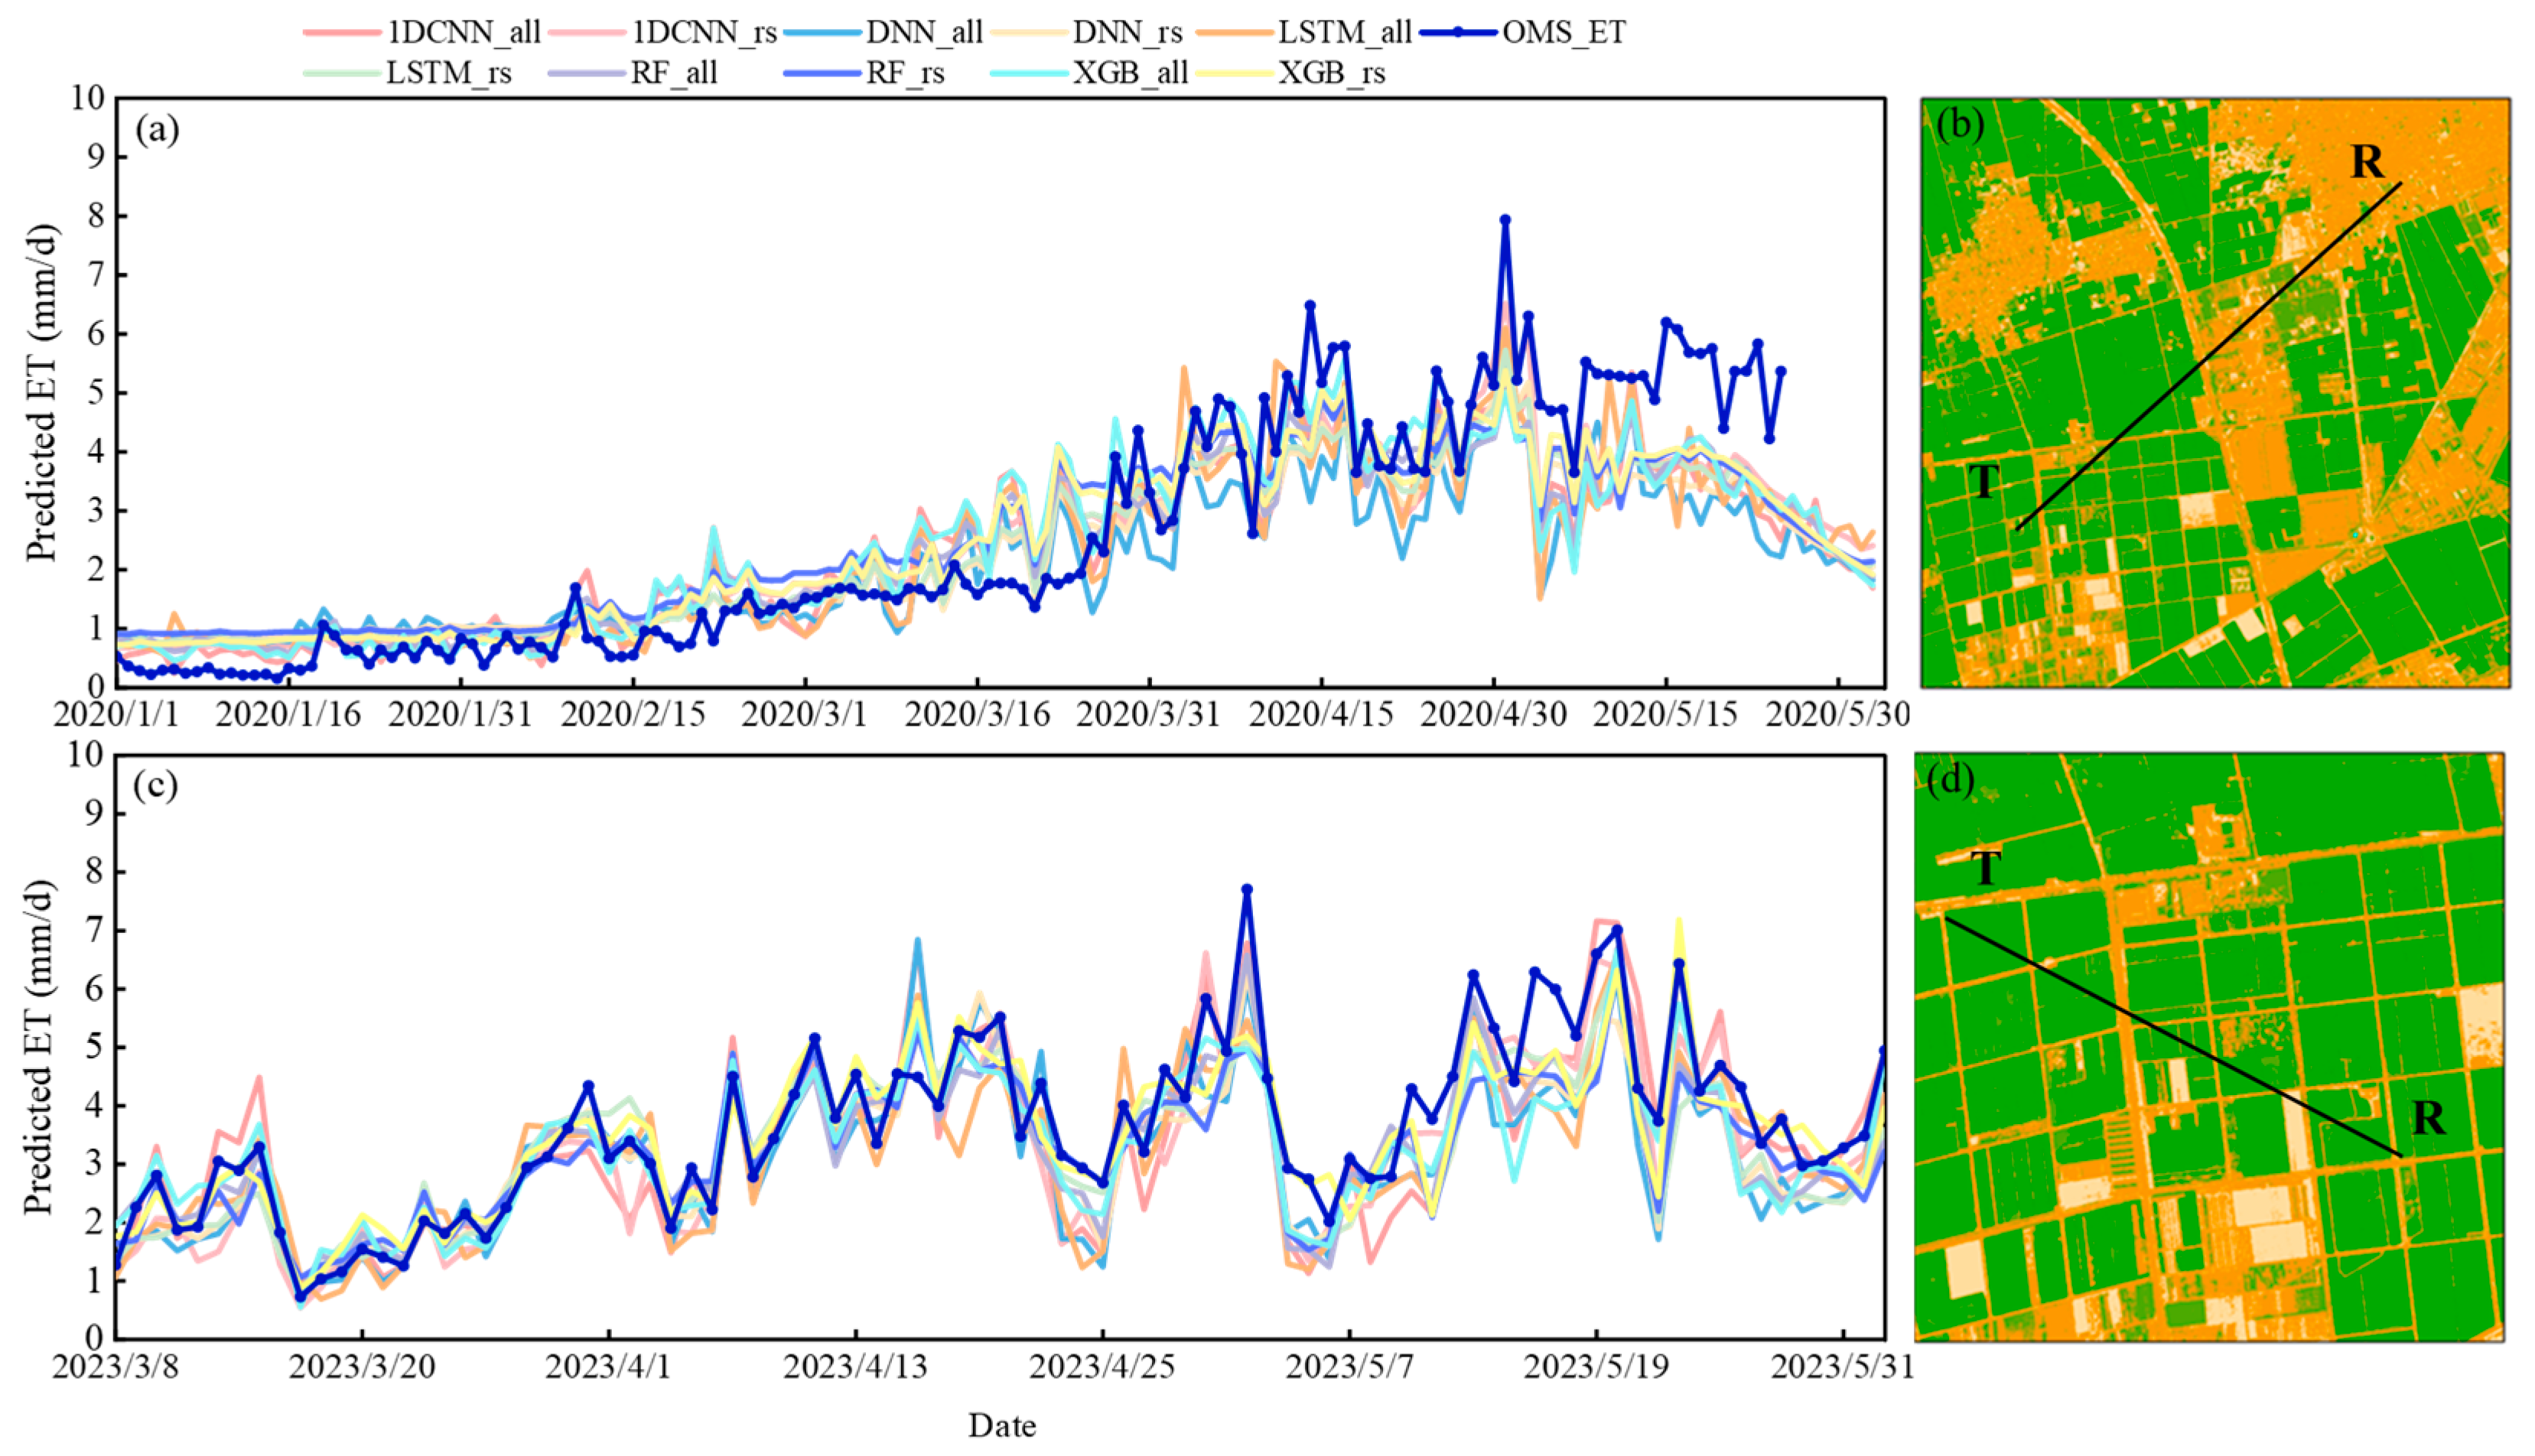
Figure 11 and Table 2 present a comparison between the Upscaling_ET generated by the 10 models and OMS measurements (OMS_ET). For the highly heterogeneous urban-agricultural mixed surface, models relying solely on remote sensing data generally outperformed those utilizing both remote sensing and meteorological data. Specifically, 1DCNN_rs and LSTM_rs exhibited similar performance, with RMSE, MAE, and R values of 0.88 mm/d, 0.66 mm/d, 0.93 and 0.90 mm/d, 0.66 mm/d, 0.94, respectively. However, 1DCNN_rs demonstrated slightly better performance, with lower RMSE and Bias. The next best-performing model was XGB_rs, achieving RMSE, MAE, and R values of 0.90 mm/d, 0.68 mm/d, and 0.92, respectively. Following this, RF_all, DNN_rs, RF_rs, XGB_all, LSTM_all, and 1DCNN_all showed progressively lower accuracy, with RMSE (MAE, R) values of 0.95 mm/d (0.70 mm/d, 0.91), 0.96 mm/d (0.70 mm/d, 0.94), 0.97 mm/d (0.77 mm/d, 0.91), 1.0 mm/d (0.72 mm/d, 0.88), 1.03 mm/d (0.73 mm/d, 0.88), and 1.03 mm/d (0.75 mm/d, 0.89), respectively. Among all models, DNN_all exhibited the lowest accuracy, with RMSE (MAE, R) values of 1.18 mm/d (0.88 mm/d, 0.89). Additionally, the ET_EC method, which directly uses EC_ET to represent regional-scale ET, was also evaluated, yielding RMSE (MAE, R) values of 1.35 mm/d (0.96 mm/d, 0.77). Compared to the EC_ET method, the 10 upscaling models reduced RMSE by up to 0.47 mm/d and improved R by up to 0.06. These results underscore the significance of the upscaling methods in effectively addressing heterogeneous underlying surfaces.
For the more homogeneous farmland surface, Upscaling_ET demonstrated higher accuracy and generally outperformed results from the urban-agricultural mixed surface. This improvement can be attributed to the reduced impact of surface heterogeneity. Models that incorporated both remote sensing and meteorological data consistently performed better than those relying solely on remote sensing data. For instance, in the RF model, adding meteorological data reduced the RMSE by up to 0.07 mm/d. Overall, all methods exhibited good agreement with OMS_ET. Among the models, 1D CNN_all and RF_all achieved the best performance, with RMSE (MAE, R) values of 0.66 mm/d (0.46 mm/d, 0.90) and 0.68 mm/d (0.48 mm/d, 0.90), respectively, but 1D CNN_all showed slightly better results with lower RMSE and Bias. Following these, the next best-performing models were XGB_all, XGB_rs, 1D CNN_rs, LSTM_all, RF_rs, DNN_all, and DNN_rs, with corresponding RMSE (MAE, R) values of 0.70 mm/d (0.52 mm/d, 0.88), 0.70 mm/d (0.55 mm/d, 0.88), 0.72 mm/d (0.56 mm/d, 0.91), 0.74 mm/d (0.56 mm/d, 0.86), 0.75 mm/d (0.56 mm/d, 0.87), 0.76 mm/d (0.58 mm/d, 0.87), and 0.75 mm/d (0.59 mm/d, 0.89), respectively. The LSTM_rs model performed the worst, with RMSE (MAE, R) values of 0.78 mm/d (0.62 mm/d, 0.86).
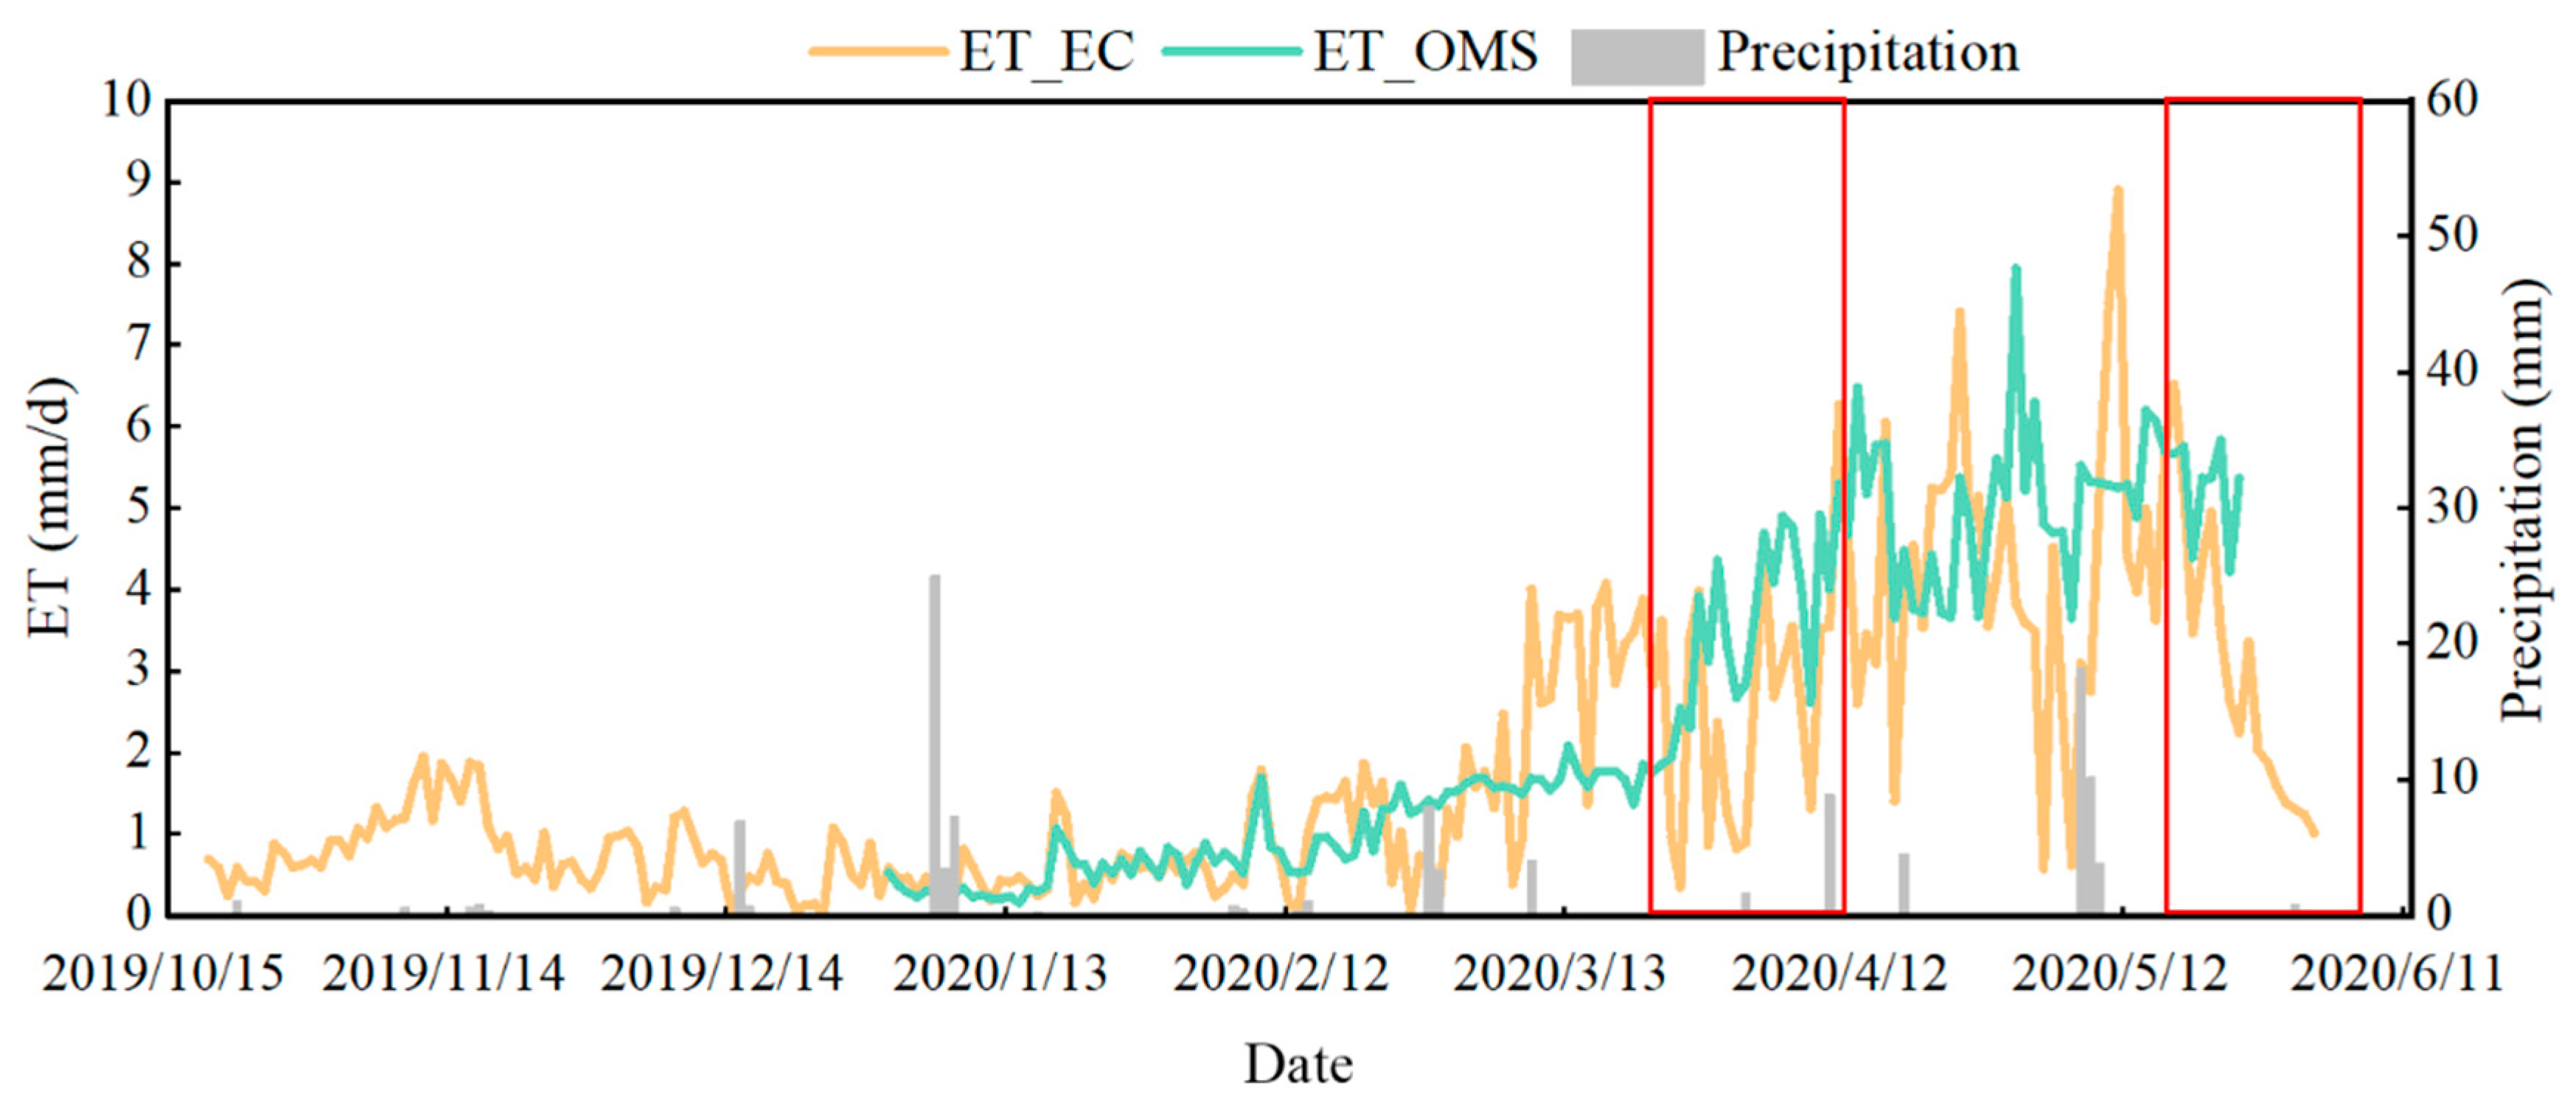
We further analyzed the temporal variation in Upscaling_ET and OMS_ET (Figure 12), and the two exhibited overall consistency in their temporal trends. However, discrepancies in ET variation were noted during the periods of 10–26 March and 1–14 May 2020. These differences primarily arose from the inconsistencies between OMS_ET and EC_ET, including variations in observation footprint areas (Figure 1d) and crop growth stages. Specifically, in the EC footprint, winter wheat is sown earlier, grows relatively faster, and has a later harvest period, whereas the growth stages in the OMS footprint area are not fully synchronized. Consequently, during periods of rapid ET changes, the two observations show obvious differences. Models trained using EC_ET as the response variable inherit these differences (Figure 13), leading to discrepancies between Upscaling_ET and OMS_ET. Overall, for the highly heterogeneous urban-agricultural mixed surface, the 1D CNN_rs demonstrated the best performance. In contrast, for the more homogeneous farmland surface, the 1D CNN_all achieved the best results.

3.5. Spatiotemporal Variations in Upscaling_ET

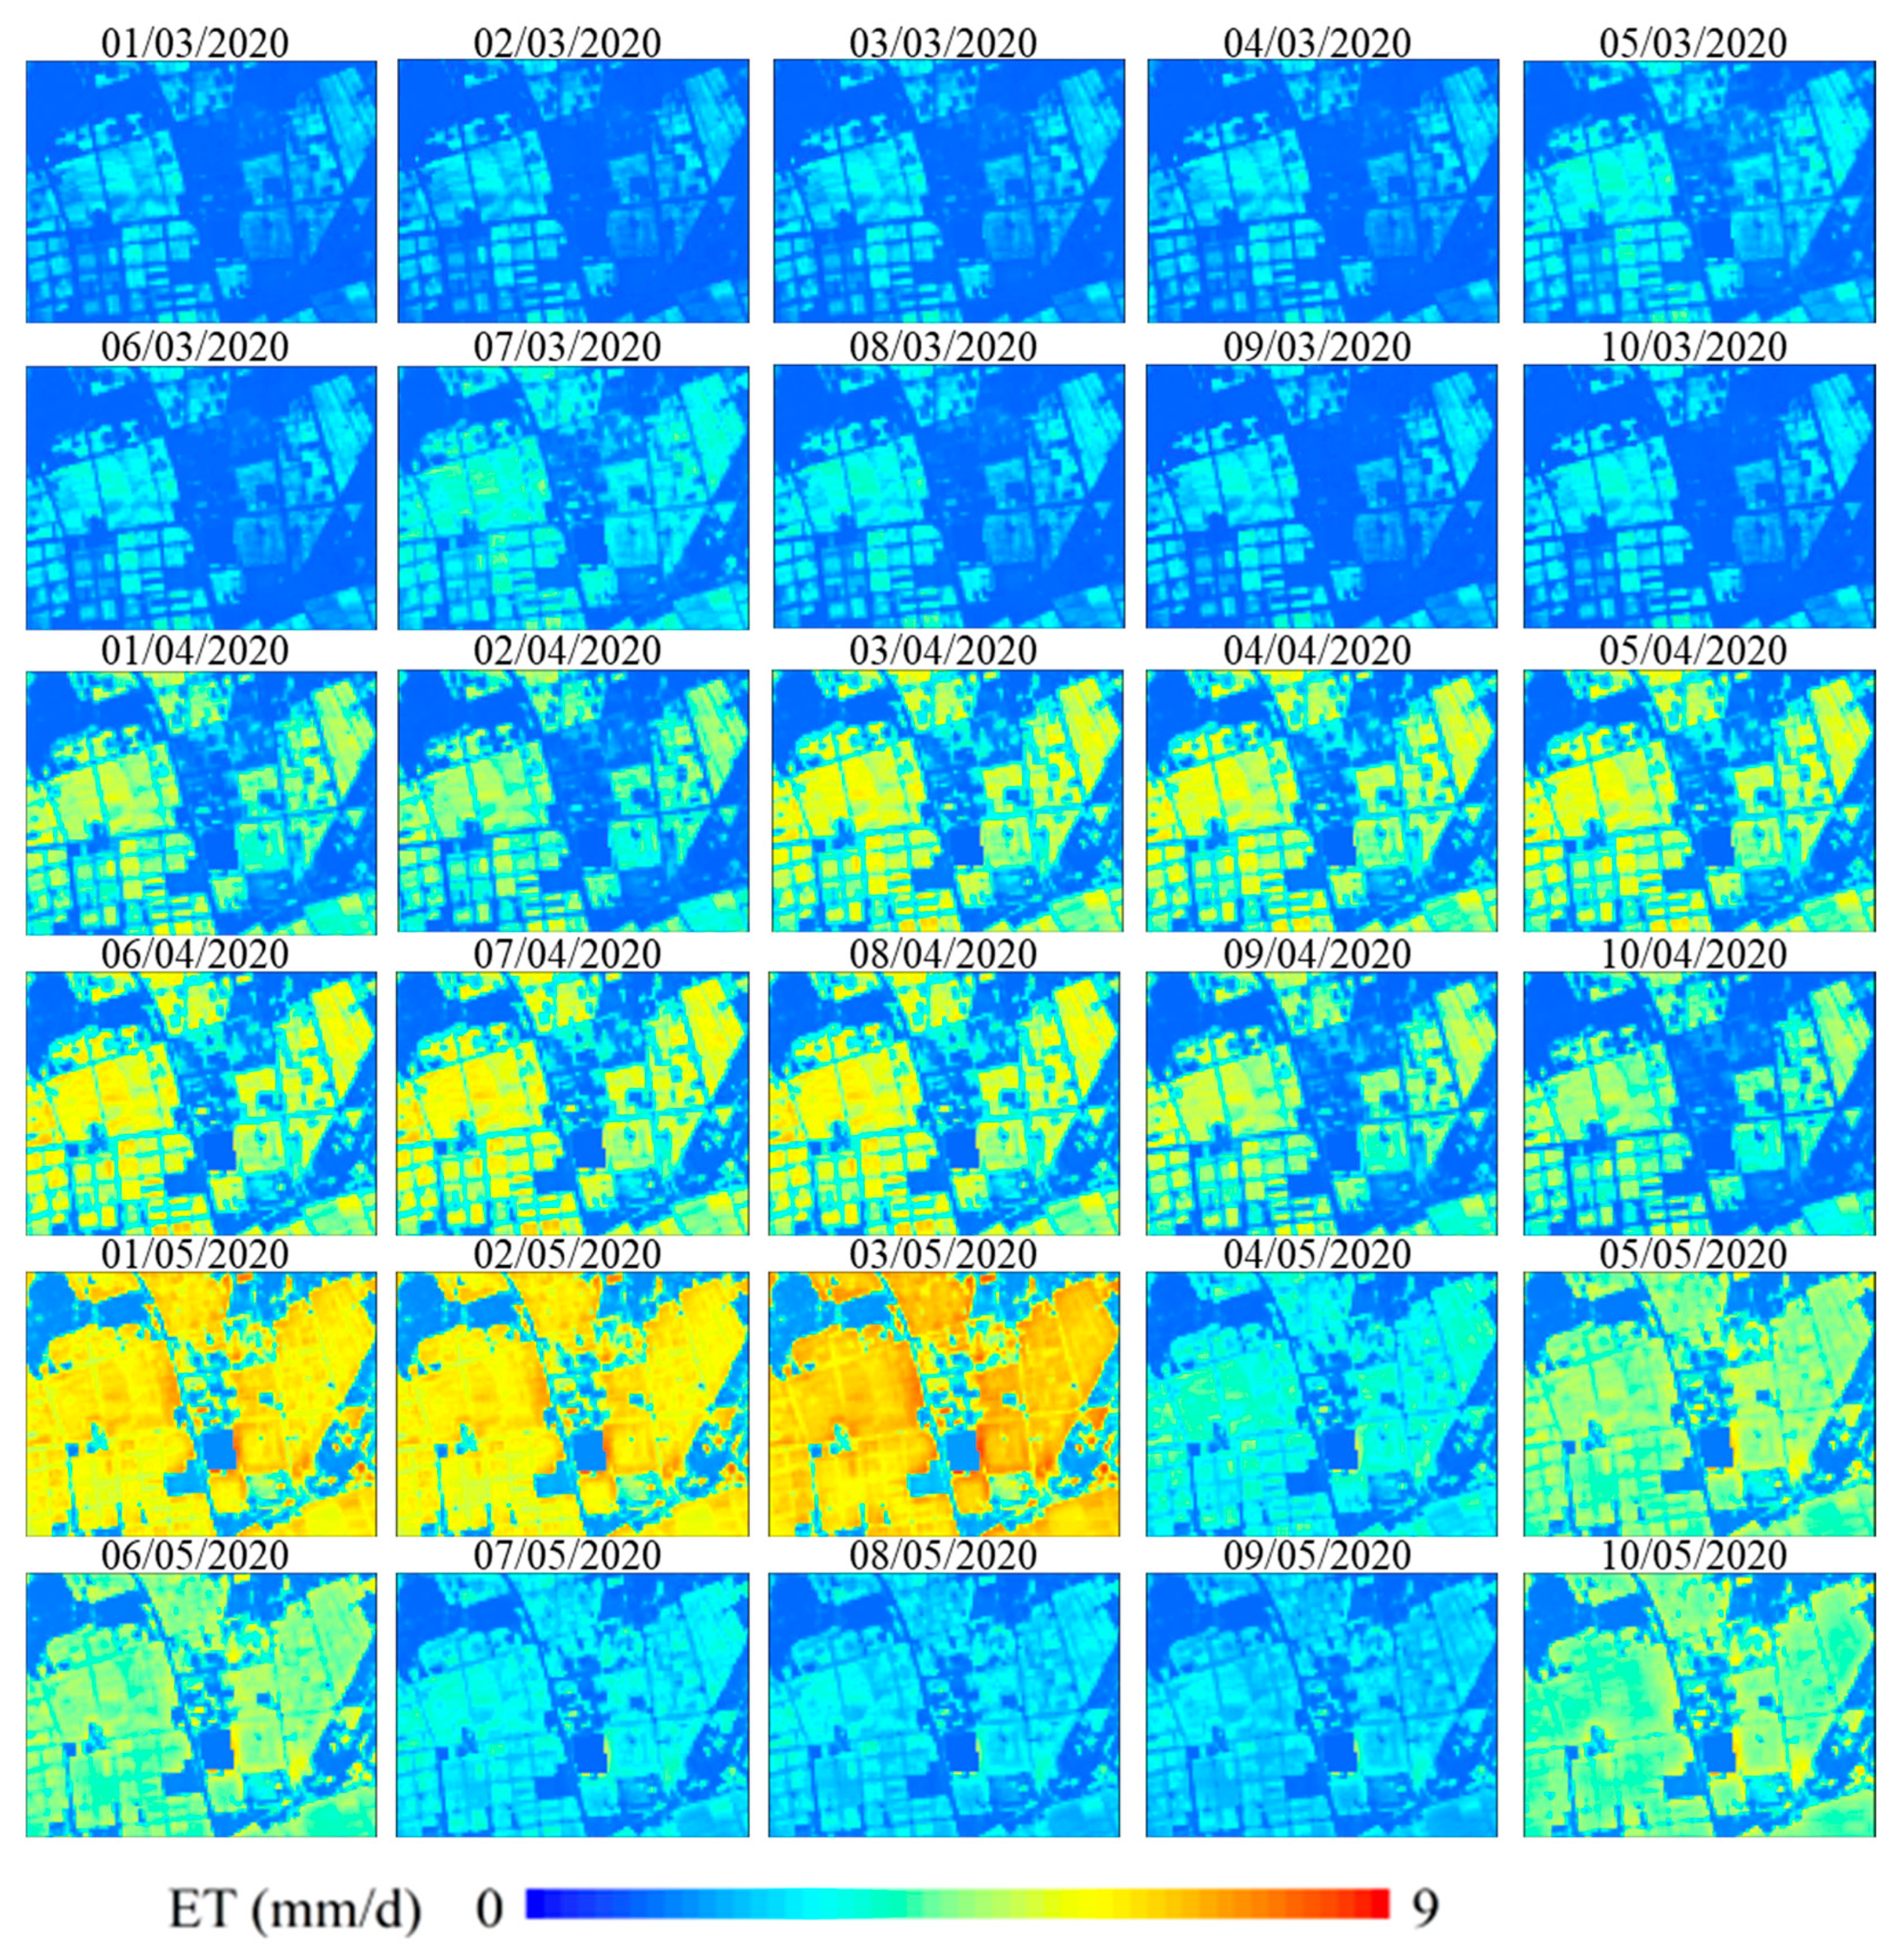
Figure 14 illustrates the spatial distribution of daily 30 m × 30 m ET during the critical growth stages of winter wheat. Spatially, the distribution of ET is closely related to land cover. High ET values are concentrated on the left and right sides of the study area, which are primarily composed of farmland and small patches of forest. In contrast, the lowest ET values are observed in the upper left corner, where urban clusters and highly impervious areas dominate. Upscaling_ET demonstrates excellent spatial resolution, clearly delineating the boundaries between roads and fields while effectively capturing changes in surface characteristics. For instance, as the crop growth stages progress, the surface becomes increasingly covered by vegetation, and the ET distribution gradually evolves into a more uniform pattern. Temporally, ET shows a gradual increasing trend from March to May, with the mean daily ET in March being 2.39 mm/d and around 3.5 mm/d in April and May. However, influenced by rainfall events and variations in meteorological conditions, ET exhibits fluctuations during the daytime.

4. Discussion

4.1. Performance of the Proposed Framework

Table 3 lists studies that used machine learning methods to upscale flux tower ET to regional scales, highlighting that model performance varies depending on the algorithm type, input data, and the climatic and geographic characteristics of the study area. The applicability and accuracy of different modeling algorithms are influenced by surface heterogeneity, with performance generally declining as surface non-uniformity increases [3,55]. Xu et al. [35] reached a similar conclusion, noting that different algorithms perform almost equally well in ET estimation, despite their varying learning strategies. Consistent with these findings, our study shows that the RMSE of Upscaling_ET increased from 0.16 mm/d to 0.42 mm/d when converting from agricultural surfaces to urban-agricultural surfaces (Table 2), while the choice of algorithm only caused a 0.23 mm/d change in RMSE. Furthermore, our study reveals that the accuracy of ET estimation is influenced by input scenarios [70]. Adding meteorological data improves model performance in agricultural surfaces during testing [78]. However, on urban-agricultural surfaces, meteorological data, sourced from site-based observations, remain spatially invariant across all grids and fail to capture subtle spatial variations within the heterogeneous surfaces. This homogeneity limits the accuracy of Upscaling_ET, and models using only remote sensing data perform best. Our proposed framework demonstrates superior performance and distinct advantages. First, through multi-source data fusion, we constructed spatiotemporally continuous, high-accuracy remote sensing auxiliary data at a 30 m resolution. Based on these remote sensing inputs, we generated daily ET estimates at a 30 m resolution with finer spatiotemporal granularity (Table 3). These estimates are spatially and temporally gap-free, avoiding the lower accuracy issues typically associated with gap-filling techniques [36]. The GF-SG algorithm outperformed ESTARFM, the spatial and temporal adaptive reflectance fusion model (STARFM), and the flexible spatiotemporal data fusion method (FSDAF) across multiple evaluation metrics [51,83,84]. Second, our framework incorporates source-area footprint analysis into the machine learning model, comprehensively considering the impacts of wind speed and atmospheric stability on ET. This enables the model to effectively capture spatial patterns of surface changes [70,85] and leverages the advantages of 1D CNNs in recognizing temporal patterns. Table 3 shows that the ET estimation accuracy across different study areas varies, with RMSE ranging from 0.07 mm/d to 0.99 mm/d. For our framework, the RMSE was 0.66 mm/d and 0.88 mm/d on homogeneous and heterogeneous surfaces, respectively, demonstrating comparable performance. Compared with studies on high-resolution but non-spatiotemporally continuous ET estimation, our framework achieved equal or even superior accuracy. For example, Wang et al. [56] developed an SEBS model based on fused land surface temperature (RMSE: 0.77 mm/d); Guzinski et al. [86,87] constructed ET models using Sentinel data and the DMS method (RMSE range: 0.59–1.04 mm/d); Ma et al. [36] applied an SEBS model based on multi-source data fusion (RMSE: 0.81 mm/d); Ma et al. [88] used a water–carbon coupling model based on Sentinel-2 data (RMSE range: 0.89–1.21 mm/d); and Awada et al. [89] proposed an ET time series construction method integrating FAO-56 and SEBAL, with an RMSE of 0.73 mm/d between the estimated and observed ET values. Finally, the integrated framework we proposed offers higher interpretability and broader application potential. SHAP analysis demonstrated that the model successfully learns the correct mechanisms driving ET, with remote sensing data showing higher relative importance, underscoring the necessity of data fusion. Additionally, the framework provides insights into the limitations caused by insufficient representativeness of meteorological data, which helps guide model selection for different application scenarios.

4.2. Comparison of Upscaling_ET with Existing 30 m Resolution Products

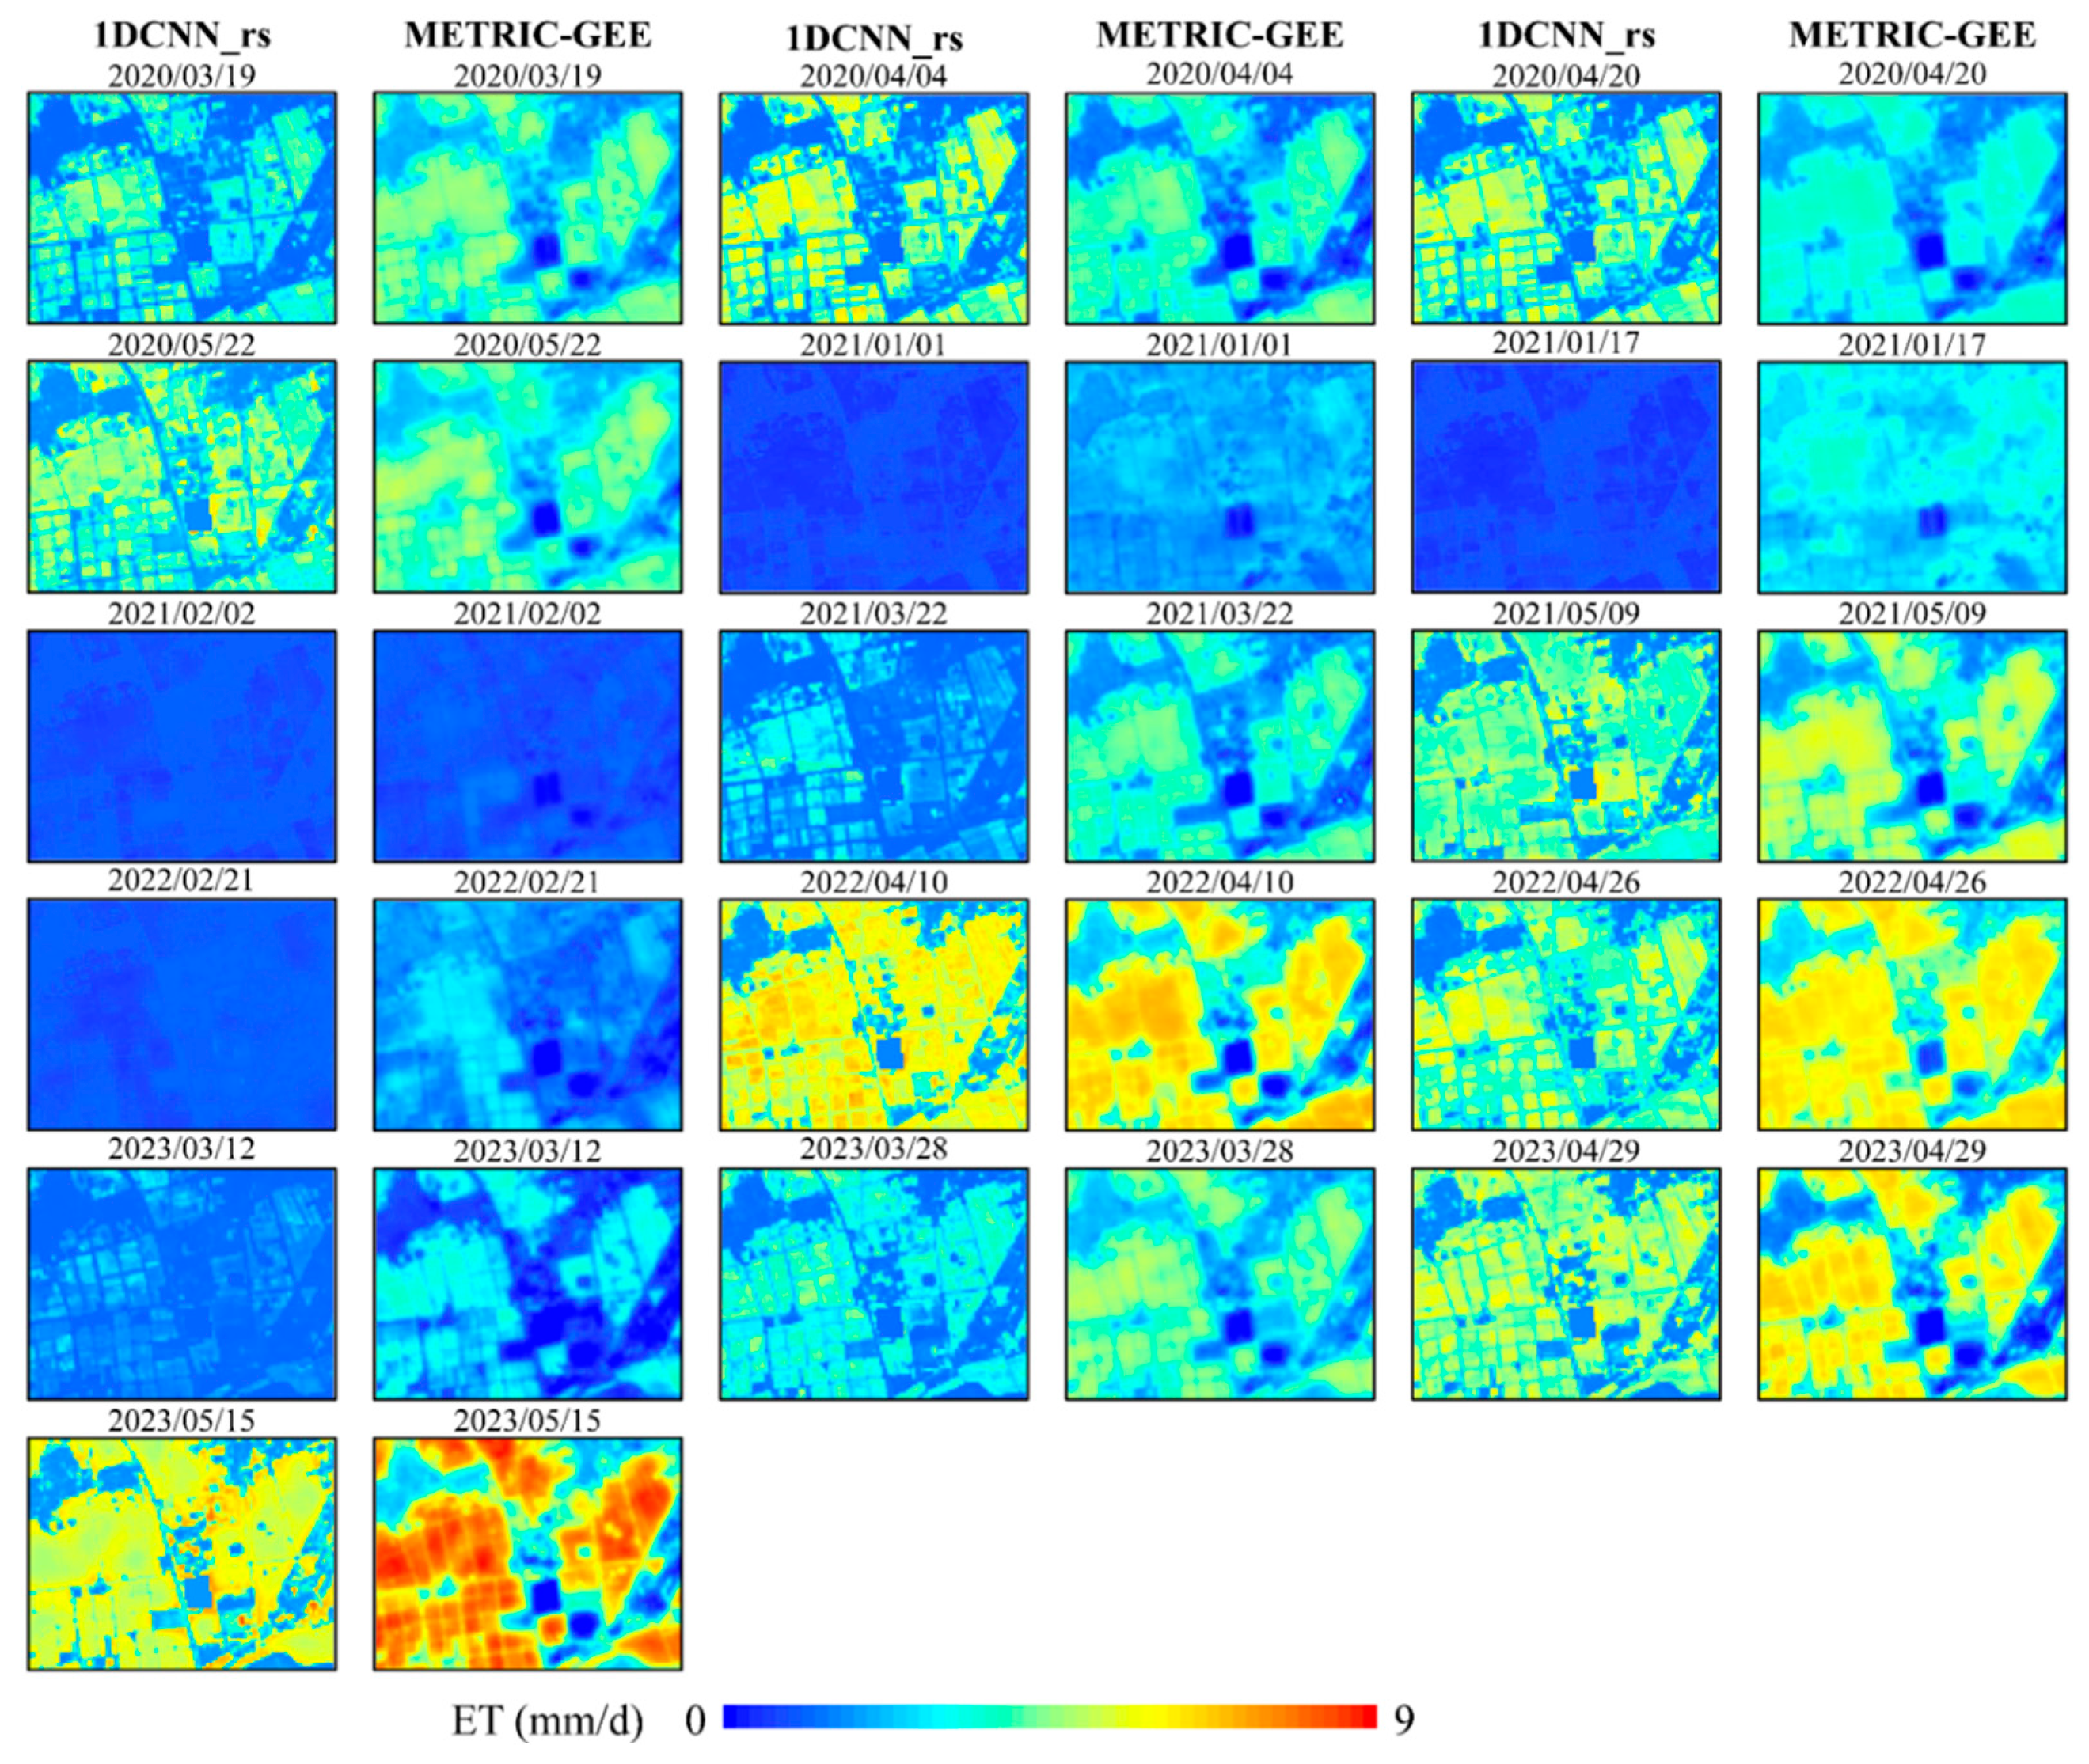
To evaluate the performance of high-resolution ET, comparisons with existing ET products are essential. However, no daily high-resolution ET products are currently available. EEFlux is an automated version of METRIC [7] implemented on the Google Earth Engine platform (https://eeflux-level1.appspot.com/, last accessed on 18 November 2025). During the study period, 16 EEFlux outputs were selected for comparison with Upscaling_ET (Figure 15). Compared with in situ observations, Upscaling_ET clearly outperformed EEFlux, with R, Bias, MAE, and RMSE of 0.85, −0.48 mm/d, 0.78 mm/d, and 0.96 mm/d, respectively, whereas EEFlux showed corresponding values of 0.66, 0.19 mm/d, 1.16 mm/d, and 1.54 mm/d. Furthermore, EEFlux produced higher ET estimates than Upscaling_ET, which may be attributed to the cold pixel ETrF value used in METRIC [93]. The METRIC method constrains ET estimates within wet and dry extremes, which are not always present in every image, potentially causing scaling inaccuracies [12]. Despite these differences, Upscaling_ET and EEFlux exhibited similar spatial distributions. However, Upscaling_ET provided more detailed results, with sharper boundaries between vegetated and non-vegetated areas. In non-vegetated regions, such as buildings and roads in the upper-left corner, ET consistently remained at lower levels, which appears more realistic.

4.3. Uncertainty and Limitations

The uncertainty in Upscaling_ET arises from ground-based observations, data fusion, machine learning algorithms, and scaling effects. The energy imbalance in EC may lead to errors ranging from 5% to 20% [94]. Although the method proposed by [95] can achieve energy balance closure, this process can introduce additional errors due to factors such as surface heterogeneity and canopy storage [96]. Consequently, we did not adjust the LE to maintain energy balance but instead considered it as a source of uncertainty. The representativeness of meteorological data may also introduce errors [97,98]. Using the same meteorological data to represent the atmospheric conditions across the entire area limits the potential for refined ET estimation, as the complex local microclimatic variations caused by surface heterogeneity cannot be accurately captured by point-scale observations. Li et al. (2021) [55] reported that when the inversion error of Rn exceeds 13 W/m2, it can significantly affect the accuracy of the upscaling results. Although various meteorological forcing products have been developed, their spatial resolution is generally too coarse to meet the requirements of field-scale ET modeling. A feasible improvement is to dynamically downscale reanalysis data using computational fluid dynamic (CFD) models. For example, Wei et al. (2025) [99] generated 30 m resolution meteorological fields based on CFD model outputs, which reduced the mean relative error (MRE) of LE from 26.53% (using in situ meteorological data) to 22.28%.
Compared to meteorological data, LST and EVI2 play a more significant role in ET estimation. However, uncertainties introduced during their fusion process can also contribute to the overall uncertainty in Upscaling_ET. In the fusion of CLDAS, MODIS, and Landsat LST, the uncertainty between CLDAS and MODIS was relatively low, with R values ranging from 0.74 to 0.91 and RMSE values between 1.76 K and 2.28 K (Figure 6a). This can be attributed to the high stability of CLDAS LST and the frequent temporal coverage of MODIS. In contrast, the downscaling and 30 m LST fusion exhibited larger uncertainty and a slight underestimation, with RMSE values ranging from 1.04 K to 3.63 K (Figure 6c). This is primarily because the DMS method employs a machine learning model to establish relationships between coarse-resolution LST and high-resolution surface reflectance, which are then applied to high-resolution imagery. Since the coarse-resolution LST used as training labels inherently contains mixed-pixel effects, the DMS model has limited ability to reproduce true LST extremes, resulting in systematic bias in ET estimation. To further improve accuracy, land use data could be incorporated to build separate models for different surface types, or higher-resolution LST data (e.g., ECOSTRESS) could be introduced to enhance the spatial detail of the downscaled results. Additionally, reducing the temporal gap between reference images during the fusion process may further decrease the uncertainty in the 30 m LST. Moreover, machine learning algorithms do not rely on predefined functional relationships but instead derive patterns from the training data, making them susceptible to the representativeness of the data [100]. When the model is applied to conditions beyond those represented in the training dataset, it may also introduce uncertainties. For example, Li et al. [91] found that monthly ET products for China derived from 36 EC sites (including five typhoon-affected sites) exhibited different ET trends compared to those based on four EC sites (including three typhoon-affected sites). In addition, the error in upscaled results tends to increase with greater surface heterogeneity, as demonstrated in studies by [3,31,35].
Due to the use of multitemporal sequential inputs and the complex internal weighting mechanisms of machine learning models, this framework cannot fully explain how uncertainties from data fusion and meteorological observations propagate to the final Upscaling_ET. This remains one of the primary limitations of the current study. In comparison, physically based models offer greater interpretability in terms of error de-composition and propagation analysis. Therefore, future work will focus on coupling machine learning approaches with physical models to further enhance model interpretability and robustness.

5. Conclusions

This study proposes a flux tower ET upscaling method that integrates a footprint model, high-resolution remote sensing data, and machine learning, successfully generating daily 30 m × 30 m regional-scale ET estimates from 2019 to 2023. Additionally, it explores the impact of five model algorithms and two input scenarios on ET estimation, with a particular focus on model interpretability, providing valuable references for precision management of agriculture and water resources. The main findings of this study are as follows: First, daily 30 m LST was successfully generated by fusing CLDAS, MODIS, and Landsat LST using the ESTARFM. Compared with original imagery and ground observations, the fused LST achieved R, Bias, MAE, and RMSE values ranging from 0.52 to 0.96, −0.04 k to −3.32 k, 0.84 k to 3.32 k, and 1.04 k to 3.63 k, respectively. In addition, vegetation indices reconstructed using the GF-SG method, including EVI2, NDVI, and LAI, also showed high accuracy, with R values exceeding 0.9. Second, the choice of optimal model algorithms and input scenarios was influenced by surface heterogeneity. For relatively homogeneous farmland surfaces, 1D CNN_all performed best, achieving R, Bias, MAE, and RMSE values of 0.90, −0.14 mm/d, 0.46 mm/d, and 0.66 mm/d, respectively. In contrast, for Urban-agricultural mixed surface with greater heterogeneity, the 1D CNN_rs was more suitable, achieving R, Bias, MAE, and RMSE values of 0.93, −0.14 mm/d, 0.66 mm/d, and 0.88 mm/d. Third, by employing interpretable machine learning techniques, the study identified LST and EVI2 as the most significant predictors for ET estimation, contributing 37–60.3% to model importance across the five algorithms, highlighting their critical role in determining model performance. Fourth, Upscaling_ET effectively captured the spatiotemporal dynamics of field-scale ET, reducing uncertainties caused by mixed pixels and providing a more accurate representation of ET spatial variability. Compared to the widely used EEFlux method, this approach produced clearer texture patterns and more reasonable ET estimates in non-cropland areas.
In conclusion, this method maximized the potential of data fusion, machine learning, and field observation data to obtain spatiotemporally continuous ET estimates at a 30 m × 30 m resolution and improved model reliability and transparency, which is of great significance for refined agricultural water management. Future work will focus on coupling machine learning models with physically based models to better quantify uncertainty propagation, improve interpretability, and enhance the generalization of ET estimation across diverse landscapes.

Author Contributions

Methodology, P.Z., Q.H. and S.L.; formal analysis, P.Z. and S.L.; investigation, P.Z. and Q.H.; resources, P.Z. and S.L.; data curation, P.Z., Q.H. and C.L.; validation, P.Z., Q.H. and S.L.; writing—original draft, P.Z. and Q.H.; writing—review and editing, P.Z., H.L., C.L., Y.M. and J.W.; visualization, P.Z. and H.L.; supervision, J.W.; funding acquisition, J.W. All authors have read and agreed to the published version of the manuscript.

Funding

This research was funded by the National Key Research and Development Program of China (2023YFD1900801).

Data Availability Statement

The raw data supporting the conclusions of this article will be made available by the authors, without undue reservation. The data are not publicly available due to copyrights cannot be available.

Conflicts of Interest

The authors declare no conflicts of interest.

Abbreviations

The following abbreviations are used in this manuscript:
ETEvapotranspiration
CLDASChina Land Data Assimilation System
LSTLand Surface Temperature
MODISModerate Resolution Imaging Spectroradiometer
OMSOptical-Microwave Scintillometers
ECEddy Covariance Systems
Upscaling_ETUpscaled ET Results
SHAPSHapley Additive exPlanations
1D CNNOne-Dimensional Convolutional Neural Network
SVMSupport Vector Machine
RFRandom Forest
DMSData Mining Sharpening
DNNDeep Neural Network
LSTMLong Short-Term Memory
XGBeXtreme Gradient Boosting
ESTARFMEnhanced Spatial and Temporal Adaptive Reflectance Fusion Model
GF-SGGap-Filling and Savitzky–Golay filtering
NDVINormalized Difference Vegetation Index
EVI2Two Band Enhanced Vegetation Index
LAILeaf Area Index
RPearson correlation coefficient
R2Coefficient of Determination
RMSERoot Mean Square Error
MAEMean Absolute Error
SEBALThe Surface Energy Balance Algorithm for Land
SEBSSurface Energy Balance System
TSEBTwo Source Energy Balance
METRICMapping ET at high Resolution with Internalized Calibration
EEfluxEarth Engine Evapotranspiration Flux
ECOSTRESSECOsystem Spaceborne Thermal Radiometer Experiment on Space Station

References

  1. Holmes, T.R.H.; Hain, C.R.; Crow, W.T.; Anderson, M.C.; Kustas, W.P. Microwave Implementation of Two-Source Energy Balance Approach for Estimating Evapotranspiration. Hydrol. Earth Syst. Sci. 2018, 22, 1351–1369. [Google Scholar] [CrossRef]
  2. Narasimhan, B.; Srinivasan, R. Development and Evaluation of Soil Moisture Deficit Index (SMDI) and Evapotranspiration Deficit Index (ETDI) for Agricultural Drought Monitoring. Agric. For. Meteorol. 2005, 133, 69–88. [Google Scholar] [CrossRef]
  3. Feng, J.; Wang, W.; Xu, F.; Wang, S. Evaluating the Ability of Deep Learning on Actual Daily Evapotranspiration Estimation over the Heterogeneous Surfaces. Agric. Water Manag. 2024, 291, 108627. [Google Scholar] [CrossRef]
  4. Hirschi, M.; Michel, D.; Lehner, I.; Seneviratne, S.I. A Site-Level Comparison of Lysimeter and Eddy Covariance Flux Measurements of Evapotranspiration. Hydrol. Earth Syst. Sci. 2017, 21, 1809–1825. [Google Scholar] [CrossRef]
  5. Shi, T.-T.; Guan, D.-X.; Wu, J.-B.; Wang, A.-Z.; Jin, C.-J.; Han, S.-J. Comparison of Methods for Estimating Evapotranspiration Rate of Dry Forest Canopy: Eddy Covariance, Bowen Ratio Energy Balance, and Penman-Monteith Equation. J. Geophys. Res. Atmos. 2008, 113, D19. [Google Scholar] [CrossRef]
  6. Xu, F.; Wang, W.; Huang, C.; Wang, J.; Ren, Z.; Feng, J.; Dong, L.; Zhang, Y.; Kang, J. Turbulent Fluxes at Kilometer Scale Determined by Optical-Microwave Scintillometry in a Heterogeneous Oasis Cropland of the Heihe River Basin. Agric. For. Meteorol. 2023, 339, 109544. [Google Scholar] [CrossRef]
  7. Allen, R.; Tasumi, M.; Morse, A.; Trezza, R.; Wright, J.; Bastiaanssen, W.G.M.; Kramber, W.J.; Lorite, I.; Robison, C. Satellite-Based Energy Balance for Mapping Evapotranspiration With Internalized Calibration (METRIC)—Applications. J. Irrig. Drain. Eng. 2007, 133, 395–406. [Google Scholar] [CrossRef]
  8. Bastiaanssen, W.G.M.; Menenti, M.; Feddes, R.A.; Holtslag, A.A.M. A Remote Sensing Surface Energy Balance Algorithm for Land (SEBAL). 1. Formulation. J. Hydrol. 1998, 212–213, 198–212. [Google Scholar] [CrossRef]
  9. Chen, J.; Dafflon, B.; Tran, A.P.; Falco, N.; Hubbard, S.S. A Deep Learning Hybrid Predictive Modeling (HPM) Approach for Estimating Evapotranspiration and Ecosystem Respiration. Hydrol. Earth Syst. Sci. 2021, 25, 6041–6066. [Google Scholar] [CrossRef]
  10. Mallick, K.; Boegh, E.; Trebs, I.; Alfieri, J.G.; Kustas, W.P.; Prueger, J.H.; Niyogi, D.; Das, N.; Drewry, D.T.; Hoffmann, L.; et al. Reintroducing Radiometric Surface Temperature into the Penman-Monteith Formulation. Water Resour. Res. 2015, 51, 6214–6243. [Google Scholar] [CrossRef]
  11. Su, Z. The Surface Energy Balance System (SEBS) for Estimation of Turbulent Heat Fluxes. Hydrol. Earth Syst. Sci. 2002, 6, 85–100. [Google Scholar] [CrossRef]
  12. Elfarkh, J.; Simonneaux, V.; Jarlan, L.; Ezzahar, J.; Boulet, G.; Chakir, A.; Er-Raki, S. Evapotranspiration Estimates in a Traditional Irrigated Area in Semi-Arid Mediterranean. Comparison of Four Remote Sensing-Based Models. Agric. Water Manag. 2022, 270, 107728. [Google Scholar] [CrossRef]
  13. Holwerda, F.; Bruijnzeel, L.A.; Scatena, F.N.; Vugts, H.F.; Meesters, A.G.C.A. Wet Canopy Evaporation from a Puerto Rican Lower Montane Rain Forest: The Importance of Realistically Estimated Aerodynamic Conductance. J. Hydrol. 2012, 414–415, 1–15. [Google Scholar] [CrossRef]
  14. Noilhan, J.; Calvet, J.-C. Mesoscale Land–Atmosphere Models and Usefulness of Microwave Remote-Sensing Data. In Passive Microwave Remote Sensing of Land—Atmosphere Interactions; CRC Press: Boca Raton, FL, USA, 1995; ISBN 978-1-00-342406-2. [Google Scholar]
  15. Sun, J.; Takle, E.S.; Acevedo, O.C. Understanding Physical Processes Represented by the Monin–Obukhov Bulk Formula for Momentum Transfer. Bound. Layer Meteorol. 2020, 177, 69–95. [Google Scholar] [CrossRef]
  16. van Dijk, A.I.; Gash, J.H.; van Gorsel, E.; Blanken, P.D.; Cescatti, A.; Emmel, C.; Gielen, B.; Harman, I.N.; Kiely, G.; Merbold, L.; et al. Rainfall Interception and the Coupled Surface Water and Energy Balance. Agric. For. Meteorol. 2015, 214–215, 402–415. [Google Scholar] [CrossRef]
  17. Anderson, M.C.; Norman, J.M.; Diak, G.R.; Kustas, W.P.; Mecikalski, J.R. A Two-Source Time-Integrated Model for Estimating Surface Fluxes Using Thermal Infrared Remote Sensing. Remote Sens. Environ. 1997, 60, 195–216. [Google Scholar] [CrossRef]
  18. Anderson, M.; Norman, J.; Kustas, W.; Houborg, R.; Starks, P.; Agam, N. A Thermal-Based Remote Sensing Technique for Routine Mapping of Land-Surface Carbon, Water and Energy Fluxes from Field to Regional Scales. Remote Sens. Environ. 2008, 112, 4227–4241. [Google Scholar] [CrossRef]
  19. Boulet, G.; Mougenot, B.; Lhomme, J.-P.; Fanise, P.; Lili-Chabaane, Z.; Olioso, A.; Bahir, M.; Rivalland, V.; Jarlan, L.; Merlin, O.; et al. The SPARSE Model for the Prediction of Water Stress and Evapotranspiration Components from Thermal Infra-Red Data and Its Evaluation over Irrigated and Rainfed Wheat. Hydrol. Earth Syst. Sci. 2015, 19, 4653–4672. [Google Scholar] [CrossRef]
  20. Norman, J.M.; Kustas, W.P.; Humes, K.S. Source Approach for Estimating Soil and Vegetation Energy Fluxes in Observations of Directional Radiometric Surface Temperature. Agric. For. Meteorol. 1995, 77, 263–293. [Google Scholar] [CrossRef]
  21. Gokool, S.; Riddell, E.; Jarmain, C.; Chetty, K.; Feig, G.; Thenga, H. Evaluating the Accuracy of Satellite-Derived Evapotranspiration Estimates Acquired during Conditions of Water Stress. Int. J. Remote Sens. 2019, 41, 704–724. [Google Scholar] [CrossRef]
  22. Li, Z.-L.; Tang, R.; Wan, Z.; Bi, Y.; Zhou, C.; Tang, B.; Yan, G.; Zhang, X. A Review of Current Methodologies for Regional Evapotranspiration Estimation from Remotely Sensed Data. Sensors 2009, 9, 3801–3853. [Google Scholar] [CrossRef]
  23. Li, X.; Pang, Z.; Xue, F.; Ding, J.; Wang, J.; Xu, T.; Xu, Z.; Ma, Y.; Zhang, Y.; Shi, J. Analysis of Spatial and Temporal Variations in Evapotranspiration and Its Driving Factors Based on Multi-Source Remote Sensing Data: A Case Study of the Heihe River Basin. Remote Sens. 2024, 16, 2696. [Google Scholar] [CrossRef]
  24. Long, D.; Singh, V.P.; Li, Z.-L. How Sensitive Is SEBAL to Changes in Input Variables, Domain Size and Satellite Sensor? J. Geophys. Res. Atmos. 2011, 116, D21. [Google Scholar] [CrossRef]
  25. Jung, M.; Koirala, S.; Weber, U.; Ichii, K.; Gans, F.; Camps-Valls, G.; Papale, D.; Schwalm, C.; Tramontana, G.; Reichstein, M. The FLUXCOM Ensemble of Global Land-Atmosphere Energy Fluxes. Sci. Data 2019, 6, 74. [Google Scholar] [CrossRef]
  26. Xiao, J.; Chen, J.; Davis, K.J.; Reichstein, M. Advances in Upscaling of Eddy Covariance Measurements of Carbon and Water Fluxes. J. Geophys. Res. Biogeosci. 2012, 117, G1. [Google Scholar] [CrossRef]
  27. Yang, F.; White, M.A.; Michaelis, A.R.; Ichii, K.; Hashimoto, H.; Votava, P.; Zhu, A.-X.; Nemani, R.R. Prediction of Continental-Scale Evapotranspiration by Combining MODIS and AmeriFlux Data Through Support Vector Machine. IEEE Trans. Geosci. Remote Sens. 2006, 44, 3452–3461. [Google Scholar] [CrossRef]
  28. Zhang, C.; Brodylo, D.; Rahman, M.; Rahman, M.A.; Douglas, T.A.; Comas, X. Using an Object-Based Machine Learning Ensemble Approach to Upscale Evapotranspiration Measured from Eddy Covariance Towers in a Subtropical Wetland. Sci. Total Environ. 2022, 831, 154969. [Google Scholar] [CrossRef] [PubMed]
  29. Bodesheim, P.; Jung, M.; Gans, F.; Mahecha, M.D.; Reichstein, M. Upscaled Diurnal Cycles of Land–Atmosphere Fluxes: A New Global Half-Hourly Data Product. Earth Syst. Sci. Data 2018, 10, 1327–1365. [Google Scholar] [CrossRef]
  30. Shang, K.; Yao, Y.; Liang, S.; Zhang, Y.; Fisher, J.B.; Chen, J.; Liu, S.; Xu, Z.; Zhang, Y.; Jia, K.; et al. DNN-MET: A Deep Neural Networks Method to Integrate Satellite-Derived Evapotranspiration Products, Eddy Covariance Observations and Ancillary Information. Agric. For. Meteorol. 2021, 308–309, 108582. [Google Scholar] [CrossRef]
  31. Li, X.; Liu, S.; Li, H.; Ma, Y.; Wang, J.; Zhang, Y.; Xu, Z.; Xu, T.; Song, L.; Yang, X.; et al. Intercomparison of Six Upscaling Evapotranspiration Methods: From Site to the Satellite Pixel. J. Geophys. Res. Atmos. 2018, 123, 6777–6803. [Google Scholar] [CrossRef]
  32. Tramontana, G.; Jung, M.; Schwalm, C.R.; Ichii, K.; Camps-Valls, G.; Ráduly, B.; Reichstein, M.; Arain, M.A.; Cescatti, A.; Kiely, G.; et al. Predicting Carbon Dioxide and Energy Fluxes across Global FLUXNET Sites with Regression Algorithms. Biogeosciences 2016, 13, 4291–4313. [Google Scholar] [CrossRef]
  33. Jung, M.; Reichstein, M.; Ciais, P.; Seneviratne, S.I.; Sheffield, J.; Goulden, M.L.; Bonan, G.; Cescatti, A.; Chen, J.; de Jeu, R.; et al. Recent Decline in the Global Land Evapotranspiration Trend Due to Limited Moisture Supply. Nature 2010, 467, 951–954. [Google Scholar] [CrossRef]
  34. Pang, X.; Lei, H.; Cong, Z.; Yang, H.; Duan, L.; Yang, D. Long Term Variation of Evapotranspiration and Water Balance Based on Upscaling Eddy Covariance Observations over the Temperate Semi-Arid Grassland of China. Agric. For. Meteorol. 2021, 308–309, 108566. [Google Scholar] [CrossRef]
  35. Xu, T.; Guo, Z.; Liu, S.; He, X.; Meng, Y.; Xu, Z.; Xia, Y.; Xiao, J.; Zhang, Y.; Ma, Y.; et al. Evaluating Different Machine Learning Methods for Upscaling Evapotranspiration from Flux Towers to the Regional Scale. J. Geophys. Res. Atmos. 2018, 123, 8674–8690. [Google Scholar] [CrossRef]
  36. Ma, Y.; Liu, S.; Song, L.; Xu, Z.; Liu, Y.; Xu, T.; Zhu, Z. Estimation of Daily Evapotranspiration and Irrigation Water Efficiency at a Landsat-like Scale for an Arid Irrigation Area Using Multi-Source Remote Sensing Data. Remote Sens. Environ. 2018, 216, 715–734. [Google Scholar] [CrossRef]
  37. Webb, E.K.; Pearman, G.I.; Leuning, R. Correction of Flux Measurements for Density Effects Due to Heat and Water Vapour Transfer. Q. J. R. Meteorol. Soc. 1980, 106, 85–100. [Google Scholar] [CrossRef]
  38. Mauder, M.; Foken, T. Documentation and Instruction Manual of the Eddy-Covariance Software Package TK3. In Arbeitsergebnisse, Universität Bayreuth, Abt. Mikrometeorologie; University of Bayreuth: Bayreuth, Germany, 2015; Volume 62, p. 62. ISSN 1614-8916. [Google Scholar]
  39. Falge, E.; Baldocchi, D.; Olson, R.; Anthoni, P.; Aubinet, M.; Bernhofer, C.; Burba, G.; Ceulemans, R.; Clement, R.; Dolman, H.; et al. Gap Filling Strategies for Long Term Energy Flux Data Sets. Agric. For. Meteorol. 2001, 107, 71–77. [Google Scholar] [CrossRef]
  40. Wang, T.; Ochs, G.R.; Clifford, S.F. A Saturation-Resistant Optical Scintillometer to Measure Cn2+. J. Opt. Soc. Am. JOSA 1978, 68, 334–338. [Google Scholar] [CrossRef]
  41. Ward, H.C.; Evans, J.G.; Hartogensis, O.K.; Moene, A.F.; De Bruin, H.A.R.; Grimmond, C.S.B. A Critical Revision of the Estimation of the Latent Heat Flux from Two-wavelength Scintillometry. Q. J. R. Meteorol. Soc. 2013, 139, 1912–1922. [Google Scholar] [CrossRef]
  42. Lüdi, A.; Beyrich, F.; Mätzler, C. Determination of the Turbulent Temperature–Humidity Correlation from Scintillometric Measurements. Bound. Layer Meteorol. 2005, 117, 525–550. [Google Scholar] [CrossRef]
  43. Wyngaard, J.C.; Clifford, S.F. Estimating Momentum, Heat and Moisture Fluxes from Structure Parameters. J. Atmos. Sci. 1978, 35, 1204–1211. [Google Scholar] [CrossRef]
  44. Andreas, E.L. Estimating Cn2 over Snow and Sea Ice from Meteorological Data. J. Opt. Soc. Am. A JOSAA 1988, 5, 481–495. [Google Scholar] [CrossRef]
  45. Kleissl, J.; Hong, S.-H.; Hendrickx, J.M.H. New Mexico Scintillometer Network: Supporting Remote Sensing and Hydrologic and Meteorological Models. Bull. Am. Meteorol. Soc. 2009, 90, 207–218. [Google Scholar] [CrossRef]
  46. Kleissl, J.; Hartogensis, O.K.; Gomez, J.D. Test of Scintillometer Saturation Correction Methods Using Field Experimental Data. Bound. Layer Meteorol. 2010, 137, 493–507. [Google Scholar] [CrossRef]
  47. Zhang, C.; Comas, X.; Brodylo, D. A Remote Sensing Technique to Upscale Methane Emission Flux in a Subtropical Peatland. J. Geophys. Res. Biogeosci. 2020, 125, e2020JG006002. [Google Scholar] [CrossRef]
  48. Gorelick, N.; Hancher, M.; Dixon, M.; Ilyushchenko, S.; Thau, D.; Moore, R. Google Earth Engine: Planetary-Scale Geospatial Analysis for Everyone. Remote Sens. Environ. 2017, 202, 18–27. [Google Scholar] [CrossRef]
  49. Shi, C.; Xie, Z.; Qian, H.; Liang, M.; Yang, X. China Land Soil Moisture EnKF Data Assimilation Based on Satellite Remote Sensing Data. Sci. China Earth Sci. 2011, 54, 1430–1440. [Google Scholar] [CrossRef]
  50. Sun, S.; Shi, C.; Liang, X.; Han, S.; Jiang, Z.; Zhang, T. Assessment of Ground Temperature Simulation in China by Different Land Surface Models Based on Station Observations. J. Appl. Meteorol. Sci. 2017, 28, 737–749. [Google Scholar] [CrossRef]
  51. Chen, Y.; Cao, R.; Chen, J.; Liu, L.; Matsushita, B. A Practical Approach to Reconstruct High-Quality Landsat NDVI Time-Series Data by Gap Filling and the Savitzky–Golay Filter. ISPRS J. Photogramm. Remote Sens. 2021, 180, 174–190. [Google Scholar] [CrossRef]
  52. Chen, J.; Jönsson, P.; Tamura, M.; Gu, Z.; Matsushita, B.; Eklundh, L. A Simple Method for Reconstructing a High-Quality NDVI Time-Series Data Set Based on the Savitzky–Golay Filter. Remote Sens. Environ. 2004, 91, 332–344. [Google Scholar] [CrossRef]
  53. Steven, M.D.; Malthus, T.J.; Baret, F.; Xu, H.; Chopping, M.J. Intercalibration of Vegetation Indices from Different Sensor Systems. Remote Sens. Environ. 2003, 88, 412–422. [Google Scholar] [CrossRef]
  54. Jiang, Z.; Huete, A.; Kim, Y.; Didan, K. 2-Band Enhanced Vegetation Index without a Blue Band and Its Application to AVHRR Data. Proc. SPIE Int. Soc. Opt. Eng. 2007, 6679, 667905. [Google Scholar] [CrossRef]
  55. Li, X.; Liu, S.; Yang, X.; Ma, Y.; He, X.; Xu, Z.; Xu, T.; Song, L.; Zhang, Y.; Hu, X.; et al. Upscaling Evapotranspiration from a Single-Site to Satellite Pixel Scale. Remote Sens. 2021, 13, 4072. [Google Scholar] [CrossRef]
  56. Wang, D.; Yu, T.; Liu, Y.; Gu, X.; Mi, X.; Shi, S.; Ma, M.; Chen, X.; Zhang, Y.; Liu, Q.; et al. Estimating Daily Actual Evapotranspiration at a Landsat-Like Scale Utilizing Simulated and Remote Sensing Surface Temperature. Remote Sens. 2021, 13, 225. [Google Scholar] [CrossRef]
  57. Wang, S.; Wang, C.; Zhang, C.; Xue, J.; Wang, P.; Wang, X.; Wang, W.; Zhang, X.; Li, W.; Huang, G.; et al. A Classification-Based Spatiotemporal Adaptive Fusion Model for the Evaluation of Remotely Sensed Evapotranspiration in Heterogeneous Irrigated Agricultural Area. Remote Sens. Environ. 2022, 273, 112962. [Google Scholar] [CrossRef]
  58. Long, D.; Yan, L.; Bai, L.; Zhang, C.; Li, X.; Lei, H.; Yang, H.; Tian, F.; Zeng, C.; Meng, X.; et al. Generation of MODIS-like Land Surface Temperatures under All-Weather Conditions Based on a Data Fusion Approach. Remote Sens. Environ. 2020, 246, 111863. [Google Scholar] [CrossRef]
  59. Gao, F.; Kustas, W.P.; Anderson, M.C. A Data Mining Approach for Sharpening Thermal Satellite Imagery over Land. Remote Sens. 2012, 4, 3287–3319. [Google Scholar] [CrossRef]
  60. Anderson, M.C.; Yang, Y.; Xue, J.; Knipper, K.R.; Yang, Y.; Gao, F.; Hain, C.R.; Kustas, W.P.; Cawse-Nicholson, K.; Hulley, G.; et al. Interoperability of ECOSTRESS and Landsat for Mapping Evapotranspiration Time Series at Sub-Field Scales. Remote Sens. Environ. 2021, 252, 112189. [Google Scholar] [CrossRef]
  61. Xue, J.; Anderson, M.C.; Gao, F.; Hain, C.; Knipper, K.R.; Yang, Y.; Kustas, W.P.; Yang, Y.; Bambach, N.; McElrone, A.J.; et al. Improving the Spatiotemporal Resolution of Remotely Sensed ET Information for Water Management through Landsat, Sentinel-2, ECOSTRESS and VIIRS Data Fusion. Irrig. Sci. 2022, 40, 609–634. [Google Scholar] [CrossRef] [PubMed]
  62. Zhang, J.; Li, S.; Wang, J.; Chen, Z. Estimation of Evapotranspiration from the People’s Victory Irrigation District Based on the Data Mining Sharpener Model. Agronomy 2023, 13, 3082. [Google Scholar] [CrossRef]
  63. Kljun, N.; Calanca, P.; Rotach, M.W.; Schmid, H.P. A Simple Two-Dimensional Parameterisation for Flux Footprint Prediction (FFP). Geosci. Model Dev. 2015, 8, 3695–3713. [Google Scholar] [CrossRef]
  64. Liu, S.M.; Xu, Z.W.; Wang, W.Z.; Jia, Z.Z.; Zhu, M.J.; Bai, J.; Wang, J.M. A Comparison of Eddy-Covariance and Large Aperture Scintillometer Measurements with Respect to the Energy Balance Closure Problem. Hydrol. Earth Syst. Sci. 2011, 15, 1291–1306. [Google Scholar] [CrossRef]
  65. Kormann, R.; Meixner, F.X. An Analytical Footprint Model For Non-Neutral Stratification. Bound. Layer Meteorol. 2001, 99, 207–224. [Google Scholar] [CrossRef]
  66. Liu, S.; Xu, Z.; Song, L.; Zhao, Q.; Ge, Y.; Xu, T.; Ma, Y.; Zhu, Z.; Jia, Z.; Zhang, F. Upscaling Evapotranspiration Measurements from Multi-Site to the Satellite Pixel Scale over Heterogeneous Land Surfaces. Agric. For. Meteorol. 2016, 230–231, 97–113. [Google Scholar] [CrossRef]
  67. Amani, S.; Shafizadeh-Moghadam, H. A Review of Machine Learning Models and Influential Factors for Estimating Evapotranspiration Using Remote Sensing and Ground-Based Data. Agric. Water Manag. 2023, 284, 108324. [Google Scholar] [CrossRef]
  68. Breiman, L. Random Forests. Mach. Learn. 2001, 45, 5–32. [Google Scholar] [CrossRef]
  69. Abowarda, A.; Bai, L.; Zhang, C.; Long, D.; Li, X.; Huang, Q.; Sun, Z. Generating Surface Soil Moisture at 30 m Spatial Resolution Using Both Data Fusion and Machine Learning toward Better Water Resources Management at the Field Scale. Remote Sens. Environ. 2021, 255, 112301. [Google Scholar] [CrossRef]
  70. Vulova, S.; Meier, F.; Rocha, A.D.; Quanz, J.; Nouri, H.; Kleinschmit, B. Modeling Urban Evapotranspiration Using Remote Sensing, Flux Footprints, and Artificial Intelligence. Sci. Total Environ. 2021, 786, 147293. [Google Scholar] [CrossRef] [PubMed]
  71. Ferreira, L.B.; da Cunha, F.F. New Approach to Estimate Daily Reference Evapotranspiration Based on Hourly Temperature and Relative Humidity Using Machine Learning and Deep Learning. Agric. Water Manag. 2020, 234, 106113. [Google Scholar] [CrossRef]
  72. Chen, T.; Guestrin, C. Kiranyaz. In Proceedings of the 22nd ACM SIGKDD International Conference on Knowledge Discovery and Data Mining, San Francisco, CA, USA, 13 August 2016; Association for Computing Machinery: New York, NY, USA, 2016; pp. 785–794. [Google Scholar]
  73. Kumar, M.; Raghuwanshi, N.S.; Singh, R.; Wallender, W.W.; Pruitt, W.O. Estimating Evapotranspiration Using Artificial Neural Network. Irrig. Drain. Eng. 2002, 128, 224–233. [Google Scholar] [CrossRef]
  74. Kiranyaz, S.; Avci, O.; Abdeljaber, O.; Ince, T.; Gabbouj, M.; Inman, D.J. 1D Convolutional Neural Networks and Applications: A Survey. Mech. Syst. Signal Process. 2021, 151, 107398. [Google Scholar] [CrossRef]
  75. Vennerød, C.B.; Kjærran, A.; Bugge, E.S. Long Short-Term Memory RNN. arXiv 2021, arXiv:2105.06756. [Google Scholar] [CrossRef]
  76. Kingma, D.P.; Ba, J. Adam: A Method for Stochastic Optimization. arXiv 2017, arXiv:1412.6980. [Google Scholar] [CrossRef]
  77. Babaeian, E.; Paheding, S.; Siddique, N.; Devabhaktuni, V.K.; Tuller, M. Short- and Mid-Term Forecasts of Actual Evapotranspiration with Deep Learning. J. Hydrol. 2022, 612, 128078. [Google Scholar] [CrossRef]
  78. Zhao, X.; Zhang, L.; Zhu, G.; Cheng, C.; He, J.; Traore, S.; Singh, V.P. Exploring Interpretable and Non-Interpretable Machine Learning Models for Estimating Winter Wheat Evapotranspiration Using Particle Swarm Optimization with Limited Climatic Data. Comput. Electron. Agric. 2023, 212, 108140. [Google Scholar] [CrossRef]
  79. Shapley, L.S. 17. A Value for n-Person Games. In Contributions to the Theory of Games, Volume II; Kuhn, H.W., Tucker, A.W., Eds.; Princeton University Press: Princeton, NJ, USA, 2016; pp. 307–318. ISBN 978-1-4008-8197-0. [Google Scholar]
  80. Hu, X.; Shi, L.; Lin, G. The Data-Driven Solution of Energy Imbalance-Induced Structural Error in Evapotranspiration Models. J. Hydrol. 2021, 597, 126205. [Google Scholar] [CrossRef]
  81. Štrumbelj, E.; Kononenko, I. Explaining Prediction Models and Individual Predictions with Feature Contributions. Knowl. Inf. Syst. 2014, 41, 647–665. [Google Scholar] [CrossRef]
  82. Lundberg, S.M.; Erion, G.; Chen, H.; DeGrave, A.; Prutkin, J.M.; Nair, B.; Katz, R.; Himmelfarb, J.; Bansal, N.; Lee, S.-I. From Local Explanations to Global Understanding with Explainable AI for Trees. Nat. Mach. Intell. 2020, 2, 56–67. [Google Scholar] [CrossRef]
  83. Cao, R.; Xu, Z.; Chen, Y.; Chen, J.; Shen, M. Reconstructing High-Spatiotemporal-Resolution (30 m and 8-Days) NDVI Time-Series Data for the Qinghai–Tibetan Plateau from 2000–2020. Remote Sens. 2022, 14, 3648. [Google Scholar] [CrossRef]
  84. Hu, Y.; Wang, H.; Niu, X.; Shao, W.; Yang, Y. Comparative Analysis and Comprehensive Trade-Off of Four Spatiotemporal Fusion Models for NDVI Generation. Remote Sens. 2022, 14, 5996. [Google Scholar] [CrossRef]
  85. Kotthaus, S.; Grimmond, S. Energy Exchange in a Dense Urban Environment—Part II: Impact of Spatial Heterogeneity of the Surface. Urban Clim. 2013, 10, 281–307. [Google Scholar] [CrossRef]
  86. Guzinski, R.; Nieto, H.; Sánchez, J.M.; López-Urrea, R.; Boujnah, D.M.; Boulet, G. Utility of Copernicus-Based Inputs for Actual Evapotranspiration Modeling in Support of Sustainable Water Use in Agriculture. IEEE J. Sel. Top. Appl. Earth Obs. Remote Sens. 2021, 14, 11466–11484. [Google Scholar] [CrossRef]
  87. Guzinski, R.; Nieto, H.; Sánchez, R.; Sánchez-Tomás, J.; Jomaa, I.; Roupsard, O.; López-Urrea, R. Improving Field-Scale Crop Actual Evapotranspiration Monitoring with Sentinel-3, Sentinel-2, and Landsat Data Fusion. Int. J. Appl. Earth Obs. Geoinf. 2023, 125, 103587. [Google Scholar] [CrossRef]
  88. Ma, Z.; Wu, B.; Yan, N.; Zhu, W.; Xu, J. Coupling Water and Carbon Processes to Estimate Field-Scale Maize Evapotranspiration with Sentinel-2 Data. Agric. For. Meteorol. 2021, 306, 108421. [Google Scholar] [CrossRef]
  89. Awada, H.; Di Prima, S.; Sirca, C.; Giadrossich, F.; Marras, S.; Spano, D.; Pirastru, M. A Remote Sensing and Modeling Integrated Approach for Constructing Continuous Time Series of Daily Actual Evapotranspiration. Agric. Water Manag. 2022, 260, 107320. [Google Scholar] [CrossRef]
  90. Lu, X.; Zhuang, Q. Evaluating Evapotranspiration and Water-Use Efficiency of Terrestrial Ecosystems in the Conterminous United States Using MODIS and AmeriFlux Data. Remote Sens. Environ. 2010, 114, 1924–1939. [Google Scholar] [CrossRef]
  91. Li, X.; He, Y.; Zeng, Z.; Lian, X.; Wang, X.; Du, M.; Jia, G.; Li, Y.; Ma, Y.; Tang, Y.; et al. Spatiotemporal Pattern of Terrestrial Evapotranspiration in China during the Past Thirty Years. Agric. For. Meteorol. 2018, 259, 131–140. [Google Scholar] [CrossRef]
  92. Zhang, L.; Xiao, J.; Zheng, Y.; Li, S.; Zhou, Y. Increased Carbon Uptake and Water Use Efficiency in Global Semi-Arid Ecosystems. Environ. Res. Lett. 2020, 15, 034022. [Google Scholar] [CrossRef]
  93. Kadam, S.A.; Stöckle, C.O.; Liu, M.; Gao, Z.; Russell, E.S. Suitability of Earth Engine Evaporation Flux (EEFlux) Estimation of Evapotranspiration in Rainfed Crops. Remote Sens. 2021, 13, 3884. [Google Scholar] [CrossRef]
  94. Foken, T. The Energy Balance Closure Problem: An Overview. Ecol. Appl. 2008, 18, 1351–1367. [Google Scholar] [CrossRef]
  95. Twine, T.E.; Kustas, W.P.; Norman, J.M.; Cook, D.R.; Houser, P.R.; Meyers, T.P.; Prueger, J.H.; Starks, P.J.; Wesely, M.L. Correcting Eddy-Covariance Flux Underestimates over a Grassland. Agric. For. Meteorol. 2000, 103, 279–300. [Google Scholar] [CrossRef]
  96. Finnigan, J.J.; Clement, R.; Malhi, Y.; Leuning, R.; Cleugh, H.A. A Re-Evaluation of Long-Term Flux Measurement Techniques Part I: Averaging and Coordinate Rotation. Bound. Layer Meteorol. 2003, 107, 1–48. [Google Scholar] [CrossRef]
  97. Rienecker, M.M.; Suarez, M.J.; Gelaro, R.; Todling, R.; Bacmeister, J.; Liu, E.; Bosilovich, M.G.; Schubert, S.D.; Takacs, L.; Kim, G.-K.; et al. MERRA: NASA’s Modern-Era Retrospective Analysis for Research and Applications. J. Clim. 2011, 24, 3624–3648. [Google Scholar] [CrossRef]
  98. Zhao, M.; Running, S.W.; Nemani, R.R. Sensitivity of Moderate Resolution Imaging Spectroradiometer (MODIS) Terrestrial Primary Production to the Accuracy of Meteorological Reanalyses. J. Geophys. Res. Biogeosci. 2006, 111, G1. [Google Scholar] [CrossRef]
  99. Wei, J.; Sun, J.; Liu, S.; Song, L.; Ma, Y.; Xu, Z.; Xu, T.; Zhou, J.; Wang, Z.; Peng, Z.; et al. A Robust Framework for Improving Fine-Scale Evapotranspiration Estimation From UAV-Based Multispectral and Thermal Images. IEEE Trans. Geosci. Remote Sens. 2025, 63, 4417615. [Google Scholar] [CrossRef]
  100. Zhou, Z.-H.; Feng, J. Deep Forest: Towards An Alternative to Deep Neural Networks. Natl. Sci. Rev. 2017, 6, 3553–3559. [Google Scholar]
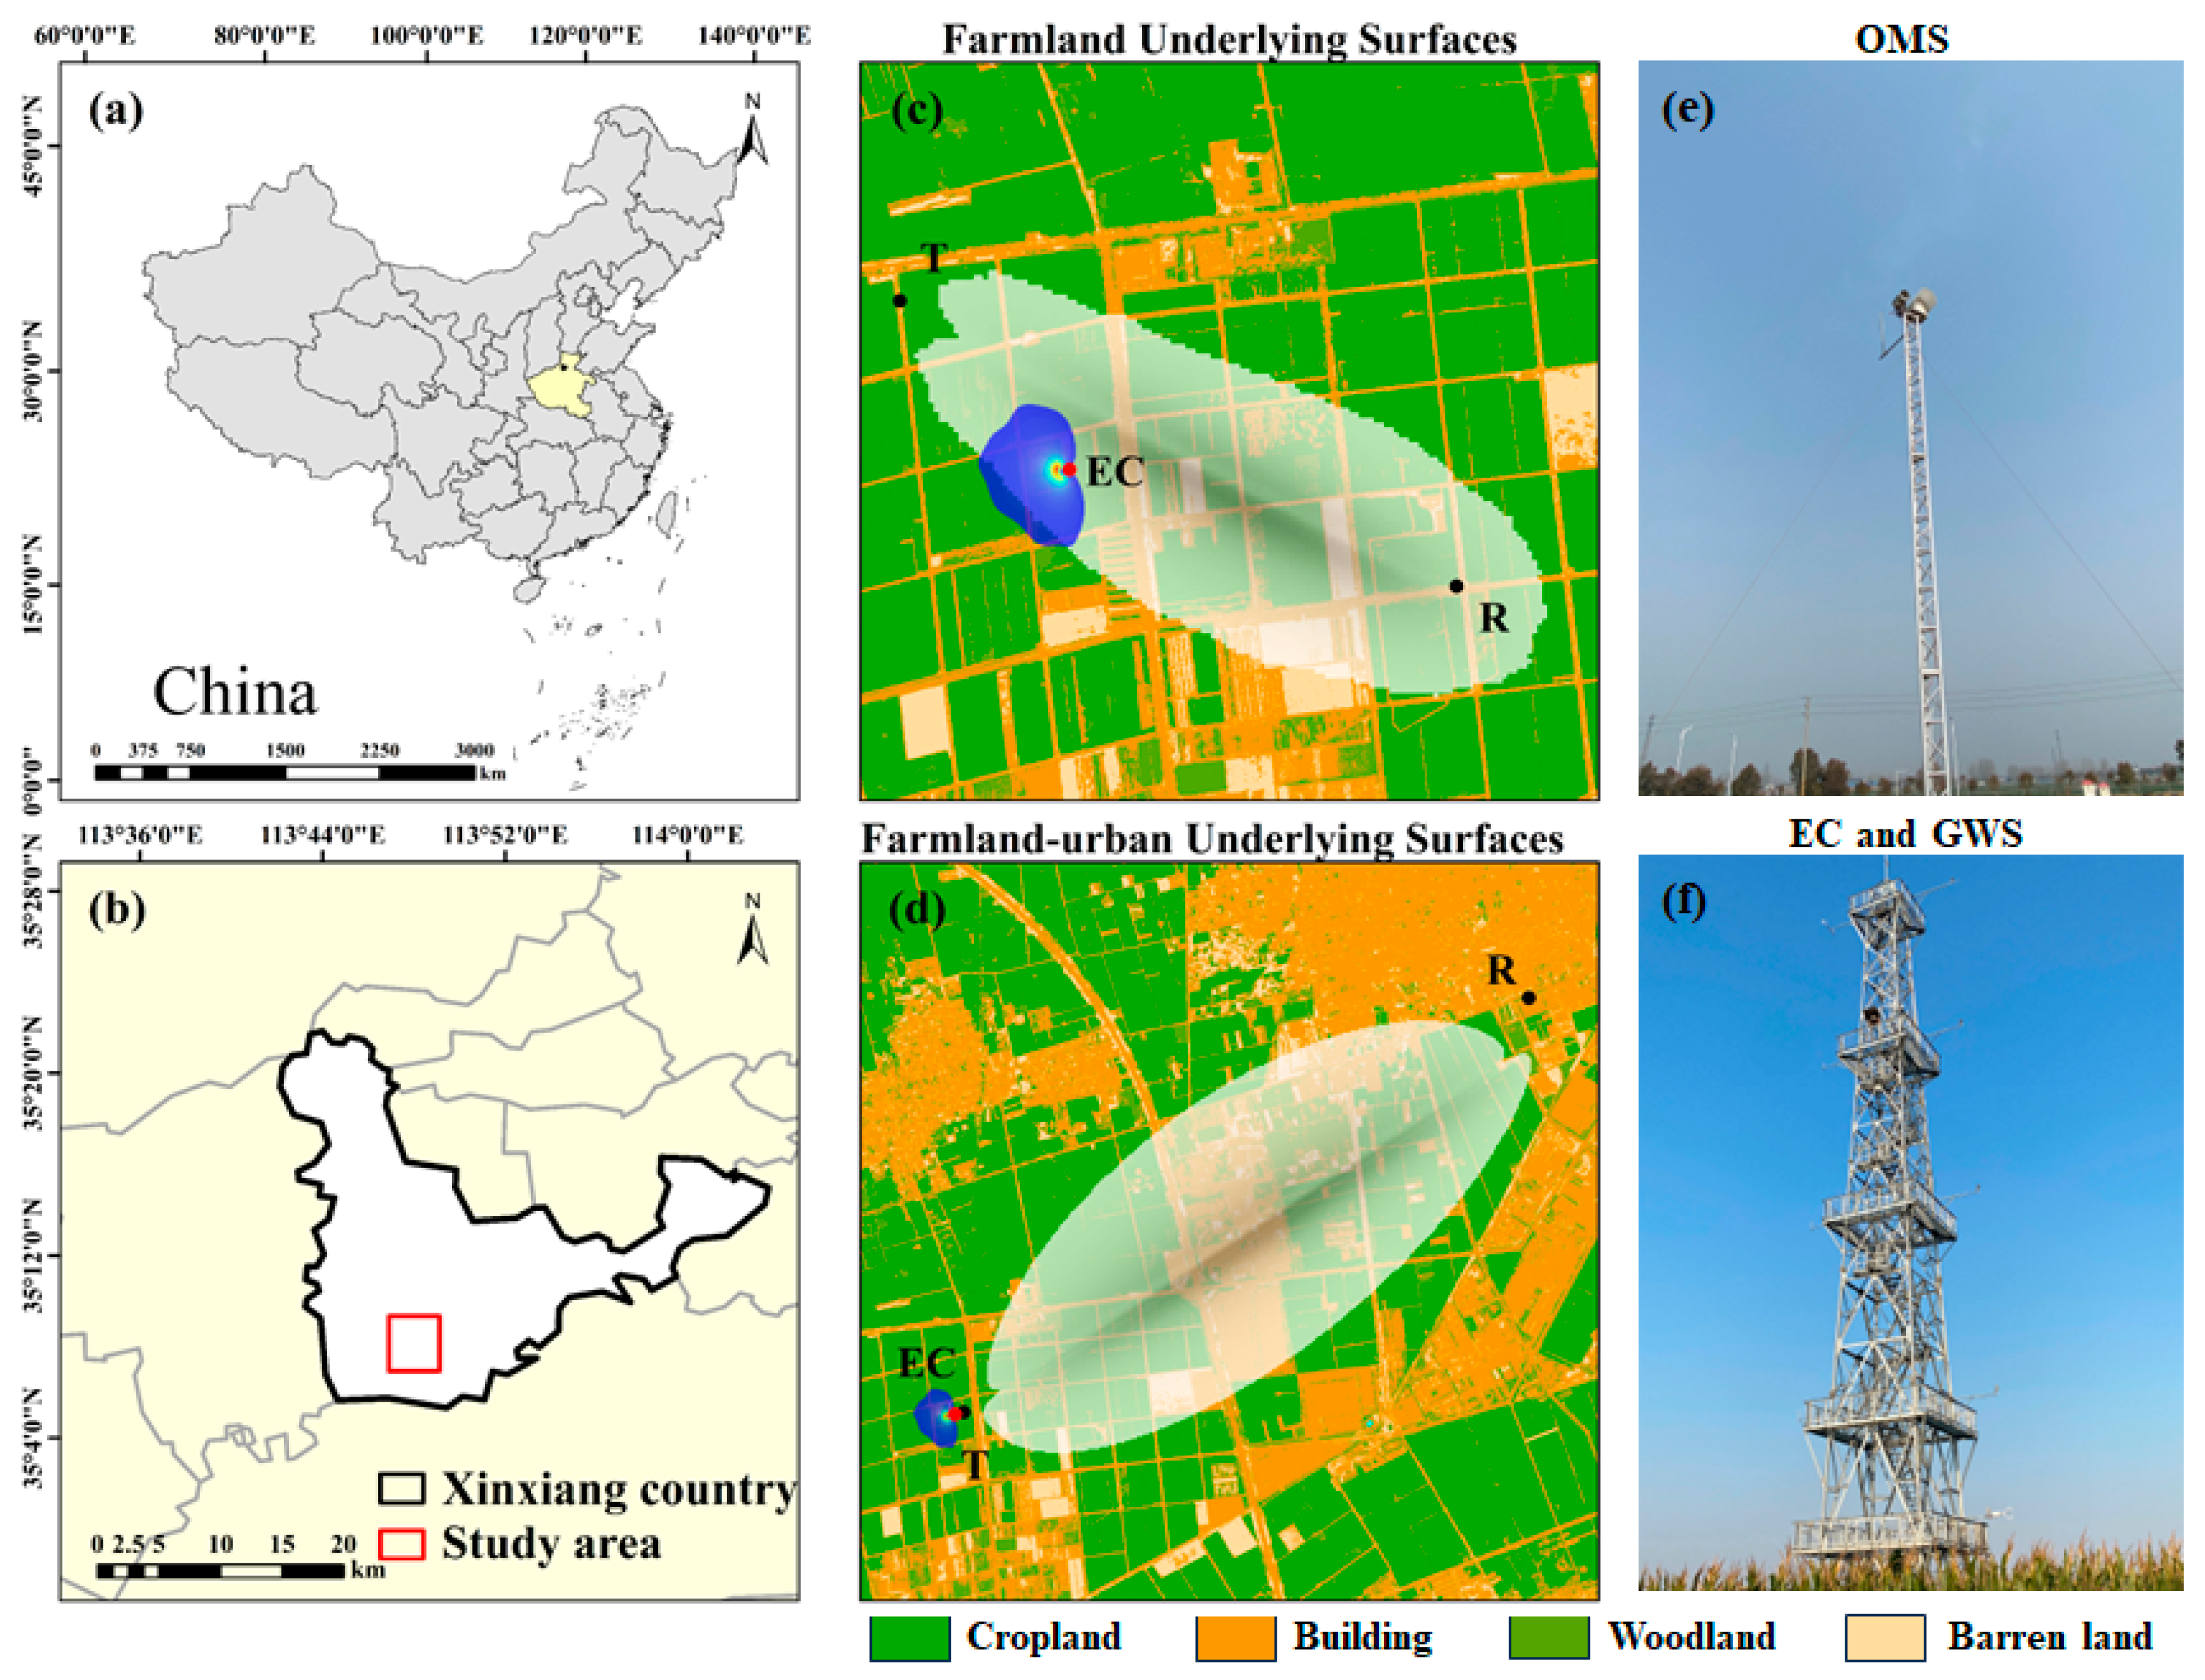
Figure 1. Overview of the study area. (a,b) show the geographical location of the study area. (c,d) illustrate the land use types of the farmland surface and the urban-agricultural mixed surface, respectively. T represents the transmitter, and R represents the receiver of the optical-microwave scintillometer (OMS). The elliptical areas indicate the flux footprint area of the OMS and EC, accounting for approximately 90% of the contribution area. (e) depicts the OMS, while (f) shows the EC and the gradient weather station (GWS).
Remotesensing 17 03813 g001
Figure 2. Schematic diagram of the integrated framework for estimating daily ET at a 30 m × 30 m resolution, incorporating multi-source data fusion, footprint model, and machine learning.
Remotesensing 17 03813 g002
Figure 3. Example architectures for deep learning models (a) 1D CNN (b) DNN (c) LSTM.
Remotesensing 17 03813 g003
Figure 4. SHAP Interpretable graphical representation [82], data used for illustrative purposes only.
Remotesensing 17 03813 g004
Figure 5. The overall workflow and zoom-in views of generating daily 30 m LST by fusing CLDAS, MODIS, and Landsat LST, using 10 April and 18 April 2022 as reference dates. The red box indicates the local zoomed-in area.
Remotesensing 17 03813 g005
Figure 6. Validation of the fused LST. (a) comparison between the 1 km fused LST and the original image; (b) comparison between the 30 m Landsat LST sharpened by DMS and the fused 30 m Landsat LST; (c) validation of the DMS sharpening results, where Landsat 100 m LST represents the original LST image, Landsat 330 m LST represents the original 100 m LST resampled to 330 m, and DMS 100 m LST represents the 330 m LST downscaled to 100 m using DMS; (d) comparison between the daily 30 m fused LST generated during the study period and the CNR4 observations. The red line represents the fitted curve, and the black line represents the 1:1 line.
Remotesensing 17 03813 g006
Figure 7. Left: Spatial distribution of the monthly mean EVI2 (derived from daily composites) at a 30 m resolution (a). Right: Scatter plots of EVI2 generated using the GF-SG method versus original Landsat EVI2 for (b) 2 April 2022, (c) 18 April 2022, (d) 4 May 2022, and (e) 4 March 2023. The red line represents the fitted curve, and the black line represents the 1:1 line.
Remotesensing 17 03813 g007
Figure 8. Scatter plots of model predictions versus test set data. (ae) represent models using both remote sensing and meteorological data. (fj) represent models using only remote sensing data. The red dashed line represents the fitted curve, and the black solid line represents the 1:1 line.
Remotesensing 17 03813 g008
Figure 9. SHAP summary plots of ET driving factors. (a) 1D CNN algorithm. (b) DNN algorithm. (c) LSTM algorithm. (d) RF algorithm. (e) XGB algorithm.
Remotesensing 17 03813 g009
Figure 10. Relative importance of 11 predictors for ET estimation across five machine learning or deep learning algorithms.
Remotesensing 17 03813 g010
Figure 11. (a,b) are scatter plots comparing Upscaling_ET generated by 10 models with OMS_ET for the urban-agricultural mixed surface and the farmland surface, respectively.
Remotesensing 17 03813 g011
Figure 12. Temporal variation in Upscaling_ET and OMS_ET. (a) Temporal variation in Upscaling_ET generated by 10 models and OMS_ET for the urban-agricultural mixed surface from 1 January to 3 June 2020. (b) Land use map of the urban-agricultural mixed underlying surface. (c) Temporal variation in Upscaling_ET generated by 10 models and OMS_ET for the farmland surface from 8 March 2020 to 3 June 2021. (d) Land use map of the farmland surface. T and R represent the transmitter and receiver of the OMS, respectively, with the black line indicating the optical path.
Remotesensing 17 03813 g012
Figure 13. Comparison of EC_ET and OMS_ET in 2019. The red boxes indicate periods with significant differences between EC_ET and OMS_ET.
Remotesensing 17 03813 g013
Figure 14. Spatial distribution of daily 30 m × 30 m ET.
Remotesensing 17 03813 g014
Figure 15. Comparison of Upscaling_ET with EEFlux estimated ET. Columns 1, 3, and 5 represent Upscaling_ET derived using the 1D CNN_rs model, while columns 2, 4, and 6 represent the EEFlux product (30 m resolution).
Remotesensing 17 03813 g015
Table 1. Instruments and observational items.
Observation ItemSensorObservation Height (m)Location
ECCSAT3&EC1554.535°8′12″N, 113°45′48″E
Sensible and latent flux
OMS (2019)LAS Mk II&RPG-MWSC-160Transmitter 3435°9′10.4″N, 113°48′3.5″E
Sensible and latent fluxReceiver 4035°8′12″N, 113°45′48″E
OMS (2023)LAS Mk II&RPG-MWSC-160Transmitter 935°08′22″N, 113°45′35″E
Sensible and latent fluxReceiver 935°08′01″N, 113°46′11″E
wind speed010C-13/5/10/20/30/40
wind direction020C-23/5/10/20/30/40
Air temperature and humidityHMP155A3/5/10/20/30/40
four-component radiationCNR4435°8′12″N, 113°45′48″E
infrared temperatureSI-1114.5
Soil heat fluxHFP01−0.15/−0.35/−0.55/−0.75/−0.95/−1.15
PrecipitationTE525MM10
Soil temperature109−0.15/−0.35/−0.55/−0.75/−0.95/−1.15
Soil water contentCS616−0.15/−0.35/−0.55/−0.75/−0.95/−1.15
Table 2. Statistics of Upscaling_ET generated by 10 models compared to EC_ET and OMS_ET.
Methods/ObservationUrban-Agricultural Mixed Surface
(2019)
Farmland Surface
(2023)
RBiasMAERMSERBiasMAERMSE
1DCNN_all0.89 −0.19 0.75 1.03 0.90 −0.14 0.46 0.66
1DCNN_rs0.93 −0.14 0.66 0.88 0.91 −0.34 0.56 0.72
DNN_all0.89 −0.41 0.88 1.18 0.87 −0.50 0.58 0.76
DNN_rs0.94 −0.25 0.700.96 0.89 −0.41 0.59 0.75
LSTM_all0.88 −0.23 0.73 1.03 0.86 −0.43 0.56 0.74
LSTM_rs0.94 −0.19 0.66 0.90 0.86 −0.36 0.62 0.78
RF_all0.91 −0.12 0.70 0.95 0.90 −0.35 0.48 0.68
RF_rs0.91 0.01 0.77 0.97 0.87 −0.37 0.56 0.75
XGB_all0.88 −0.05 0.72 1.00 0.88 −0.33 0.52 0.70
XGB_rs0.92 −0.05 0.68 0.90 0.88 −0.25 0.55 0.70
ET_EC0.77 −0.25 0.96 1.35 ----
Note: The unit of Bias, MAE and RMSE is mm/d.
Table 3. Comparison with previous studies on flux tower ET upscaling using machine learning.
Algorithm
Type
Study AreaDescription of
Input Variables
Temporal and Spatial ResolutionRMSEVerifyReference
SVM25 AmeriFlux sitesLST, EVI, SWR, LC8 days, 8 km0.62 mm/dEC[27]
ANN28 AmeriFlux sitesLST, NDVI, NDWI,
LAI, PAR, Ta, Ws, LC
daily, 4 km0.07–0.2 mm/dEC[90]
SVM13 flux towers
temperate semi-arid
grassland of China
NDVI, Srad, Rn,
P30, RH, Ws, LST.
8 days, 1 km0.50 mm/d
(typical steppe)
0.35 mm/d
(sandy grassland)
EC[34]
MTE36 flux towersTa, Rs, RH, Prec, NDVImonthly, 0.1°0.5 mm/dEC[91]
Regression-tree
ensemble
79 FLUXNETPrec, Ta, NDVI, PAR15 days, 8 km0.72 mm/dEC[92]
ANN, Cubist,
DBN, RF, SVM
36 flux towers
Heihe River Basin
Ta, Rs, RH, P30, LAIdaily, 1 km0.65–0.99 mm/d (RF)LAS[35]
ANN, RF, DBN11 flux towers
Heihe River Basin
Rn, LST, NDVI, FVCdaily, 30 m0.27–0.77 mm/dLAS[31]
DNN19 EC
flux towers
LC, topography, climate,
sampling locations, MOD16,
ET-SEMI, ET-JPL, ET-MS,
ET-HF, GLEAM, ETMonitor,
EB-ET
daily, 0.01°0.37 mm/dEC[30]
EA, ANN, SVM13 flux towers
wetland ecosystems
LST, Emissivity, LAI, FPAR,
EVI, Prec
32 days, 1 km0.27–0.44 mm/d (EA)EC[28]
Note: MTE: Model Tree Ensemble; DBN: Deep Belief Network; EA: Ensemble Algorithm; EVI: Enhanced Vegetation Index; SWR: Shortwave Radiation; LC: Land Cover; NDWI: Normalized Difference Water Index; PAR: Photosynthetically Active Radiation; Srad: Incoming Shortwave Radiation; P30: 30-day Cumulative Precipitation; Rs: Solar Radiation; FVC: Fractional Vegetation Cover; FPAR: Fraction of Photosynthetically Active Radiation.
Disclaimer/Publisher’s Note: The statements, opinions and data contained in all publications are solely those of the individual author(s) and contributor(s) and not of MDPI and/or the editor(s). MDPI and/or the editor(s) disclaim responsibility for any injury to people or property resulting from any ideas, methods, instructions or products referred to in the content.