NPPCast: A Compact CNN Integrating Satellite Data for Global Ocean Net Primary Production Forecasts
Highlights
- NPPCast outperforms UNet-family models and CESM2 hindcasts across most leads and regions.
- NPPCast maintains robust skill across different pretraining datasets.
- NPPCast offers a reliable framework for seasonal-to-multiyear ocean net primary production forecasting.
- The results support advances in climate prediction and ecosystem management.
Abstract
1. Introduction
2. Materials and Methods
2.1. Data Information
2.1.1. Model Data
2.1.2. Satellite Observation Data
2.2. NPPCast Framework
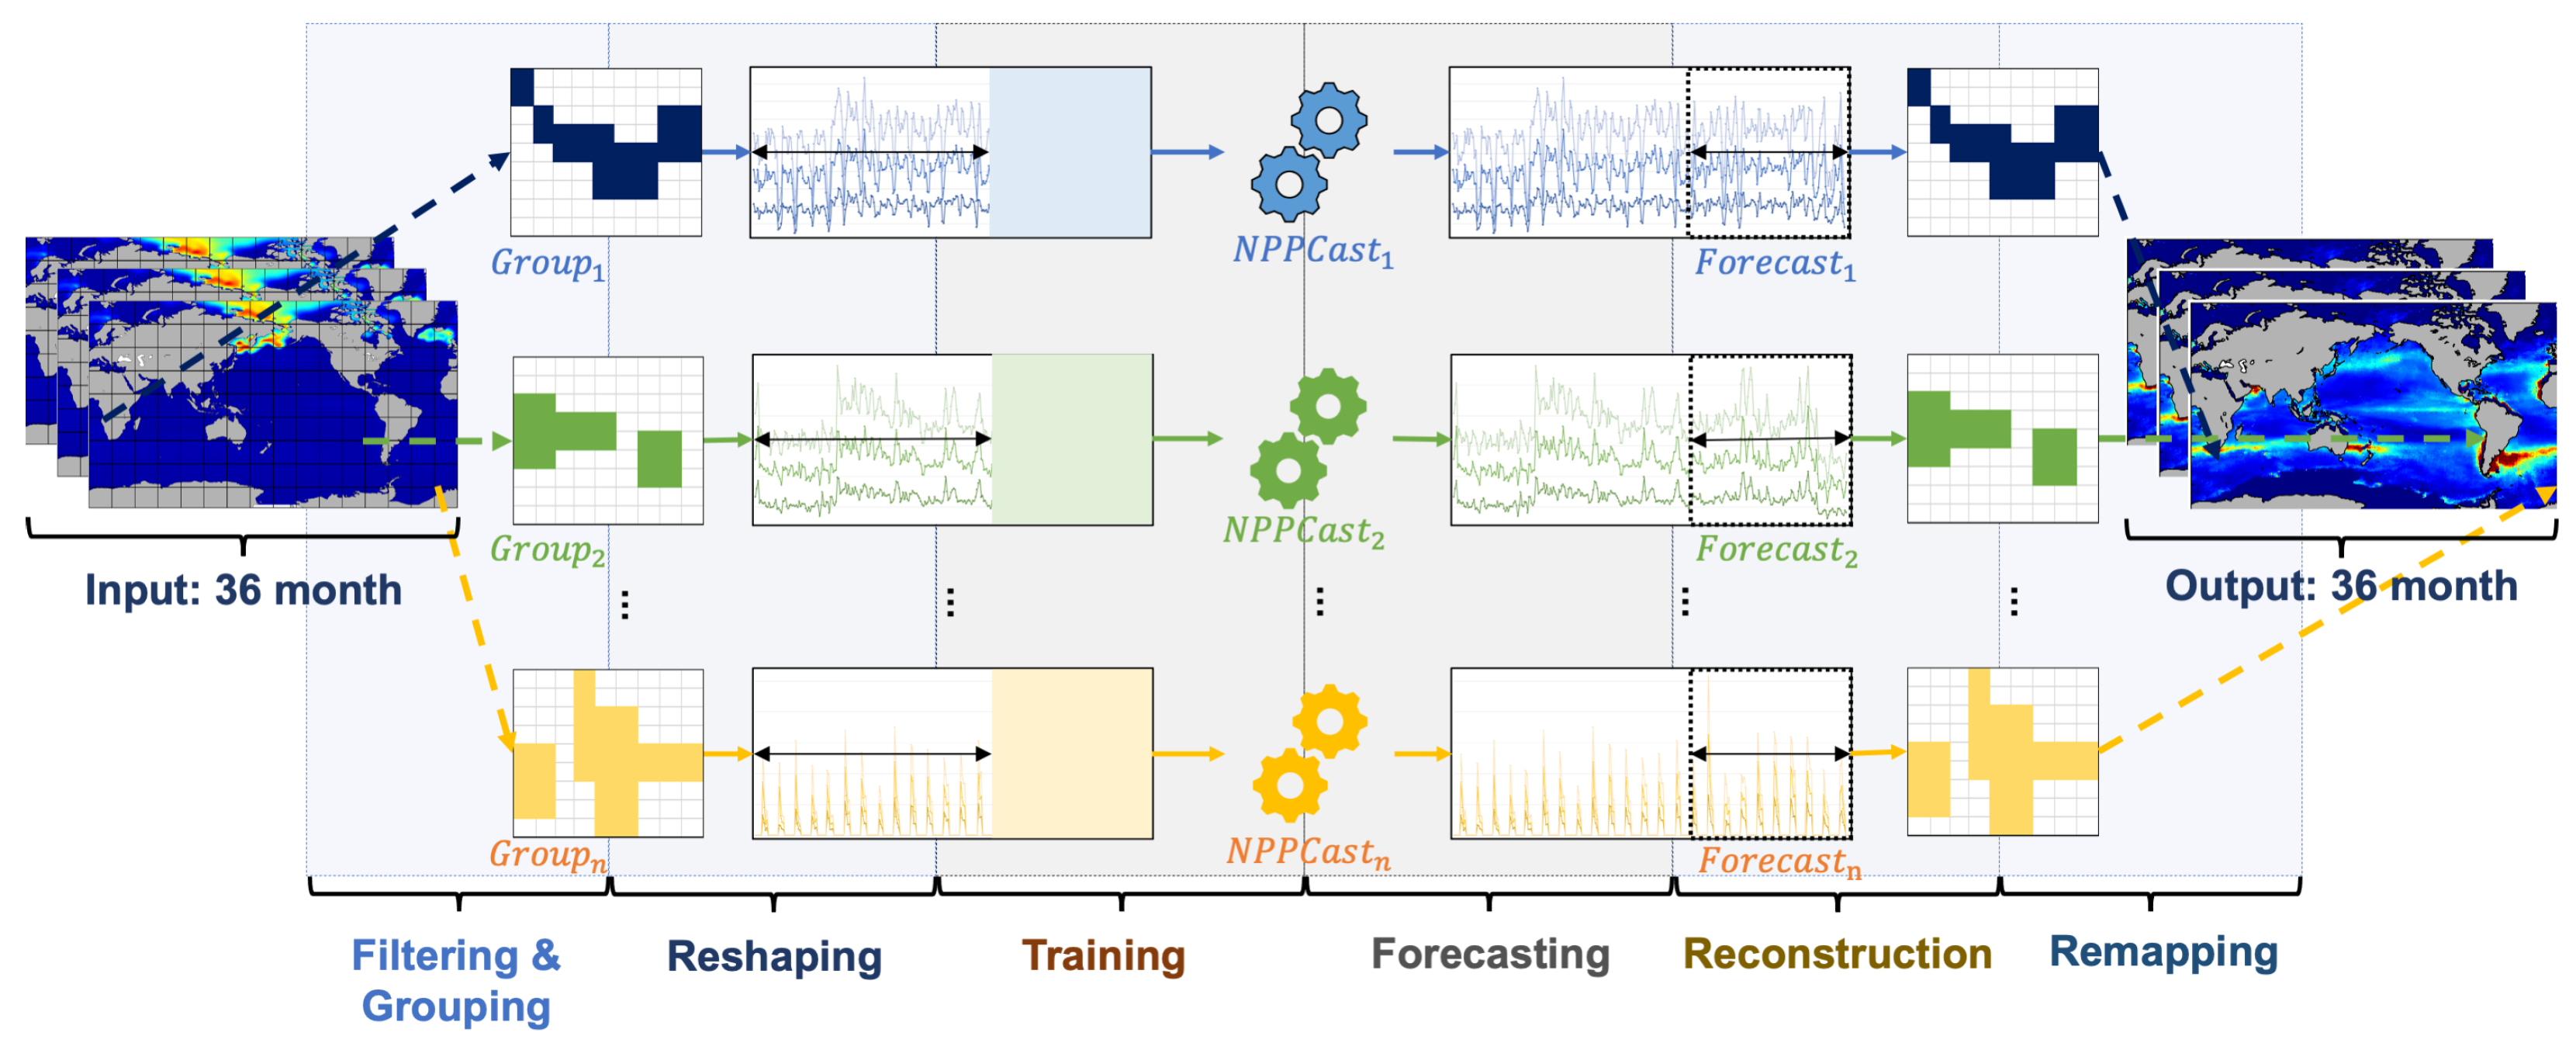
- (i)
- Filtering: We apply an ocean–land mask to the input data cube, removing all land grid points and retaining only oceanic NPP values. This produces a sparse ocean- only matrix.
- (ii)
- Grouping: The remaining ocean grid cells are divided into G geographical groups of roughly equal size. Specifically, here we simply list the ocean points in row-major order and split the list into G consecutive segment chunks, which effectively partitions the domain into contiguous latitude bands. Each group of cells will be handled by a dedicated sub-model.
- (iii)
- Reshaping: For each region g, we assemble a multivariate time series of length L (e.g., 36 months) that includes the NPP history at all locations in . This matrix is the input to the regional model .
- (iv)
- Regional Forecasting: The lightweight CNN (based on TimesNet) for region g then predicts the next time steps for that region, outputting .
- (v)
- Reconstruction and Fusion: Each regional prediction is mapped back to its original spatial coordinates. If multiple regions contribute to the same location (our groups are disjoint, so this rarely occurs), their contributions are combined. A small 1 × 1 convolution across all G regional outputs serves as a learnable fusion layer, producing the final seamless global NPP forecast . This step ensures a smooth reconstruction without discontinuities at region boundaries.
2.3. The Workflow of Transfer Learning
2.4. Spatial Partitioning and Window Slicing
2.5. Fusion of Regional Outputs
2.6. Improved TimesNet for Regional Temporal Modeling
2.6.1. Multi-Period 2D Transformation
2.6.2. TimesNet Modifications in NPPCast
2.7. Metrics
3. Results
3.1. Temporal Decay of Predictive Skill
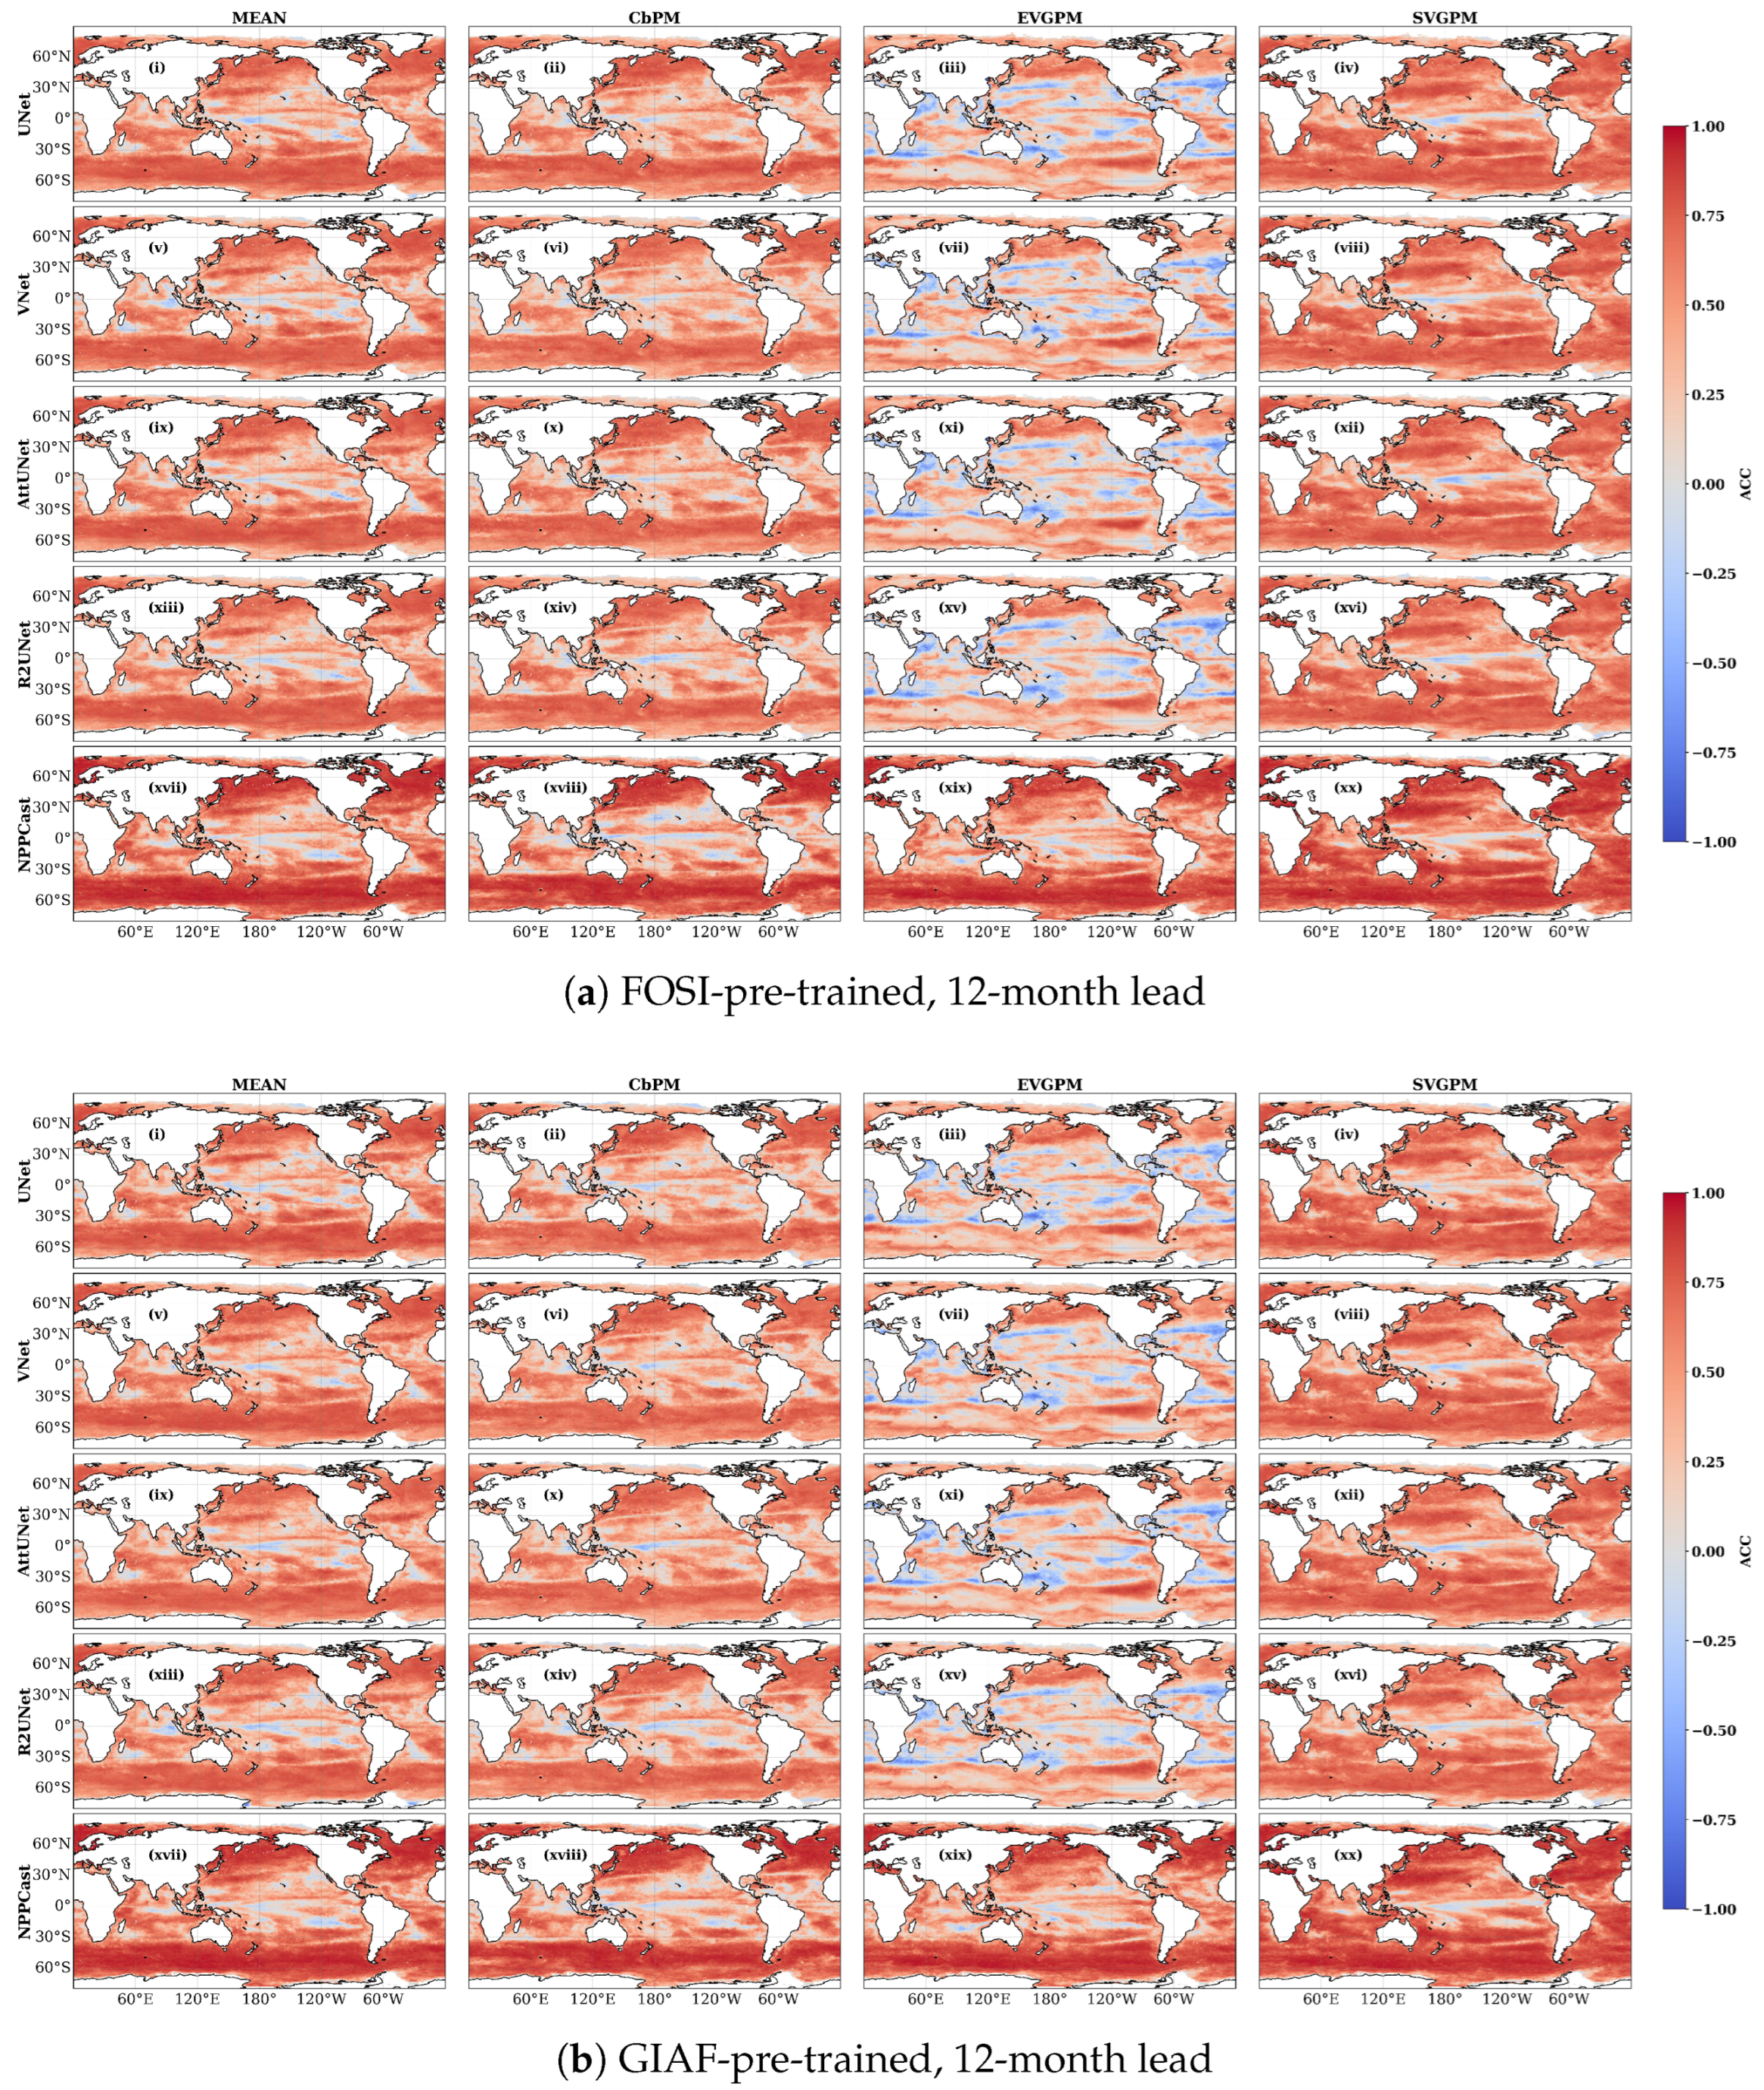
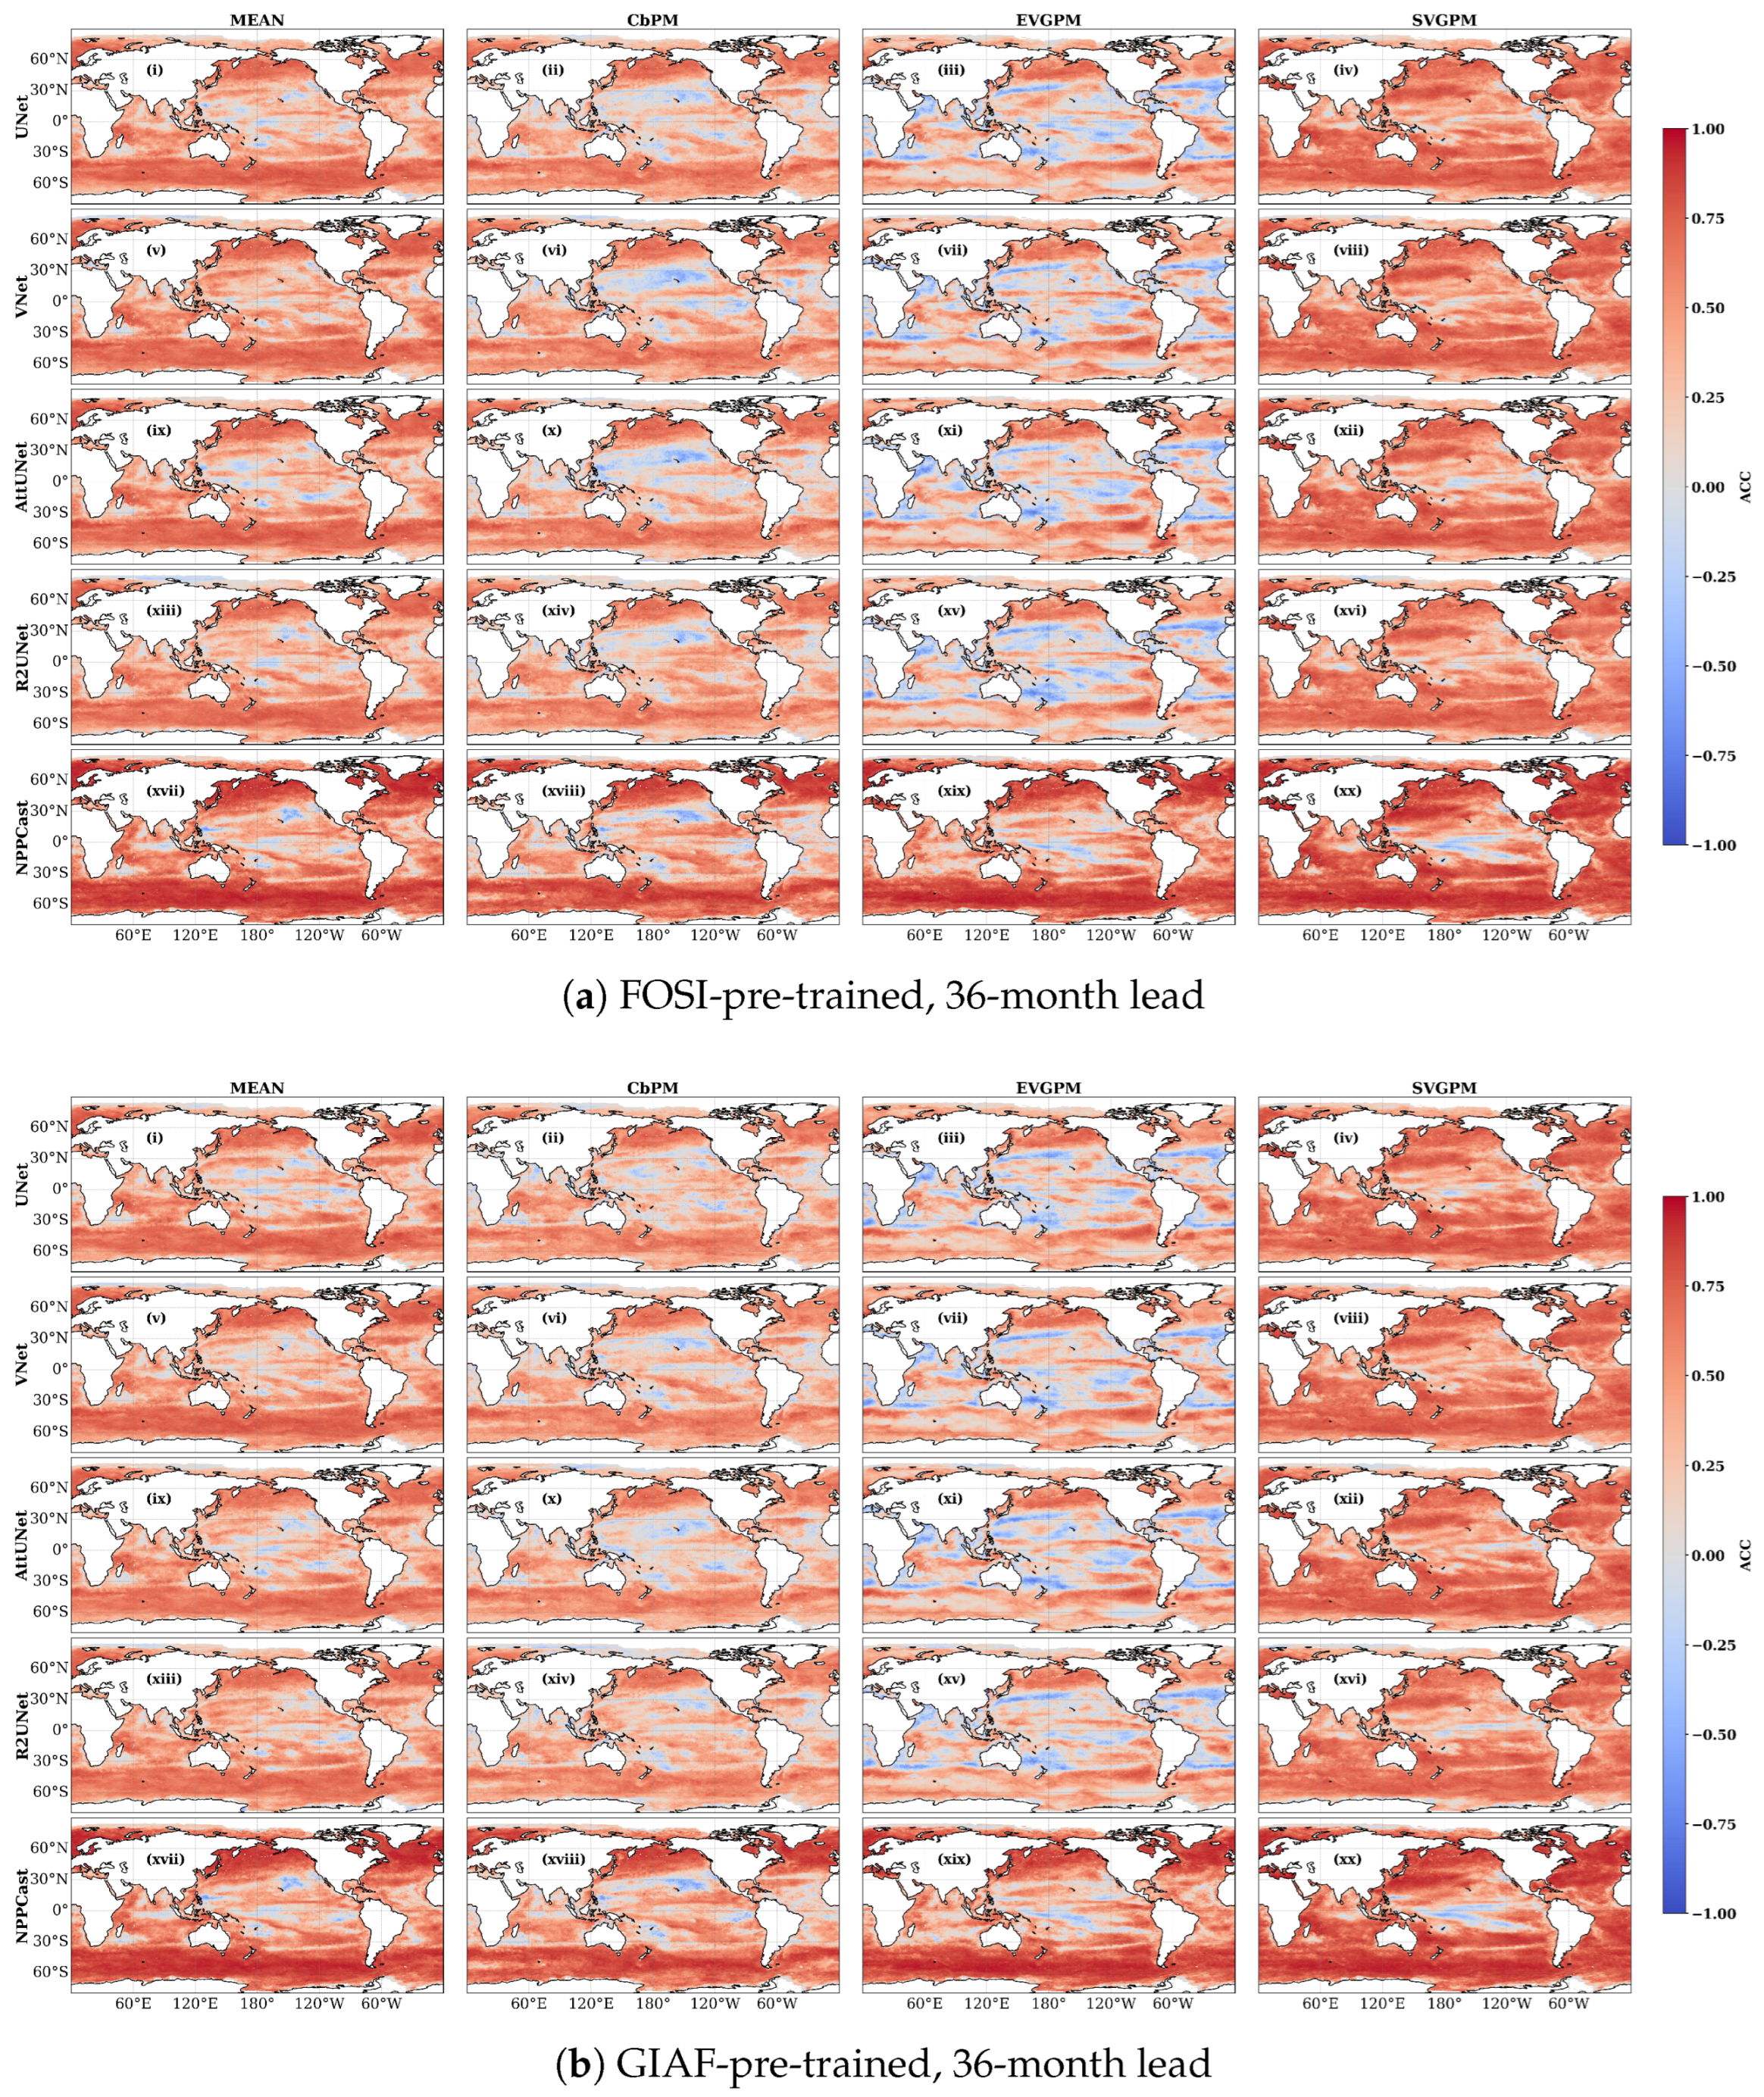
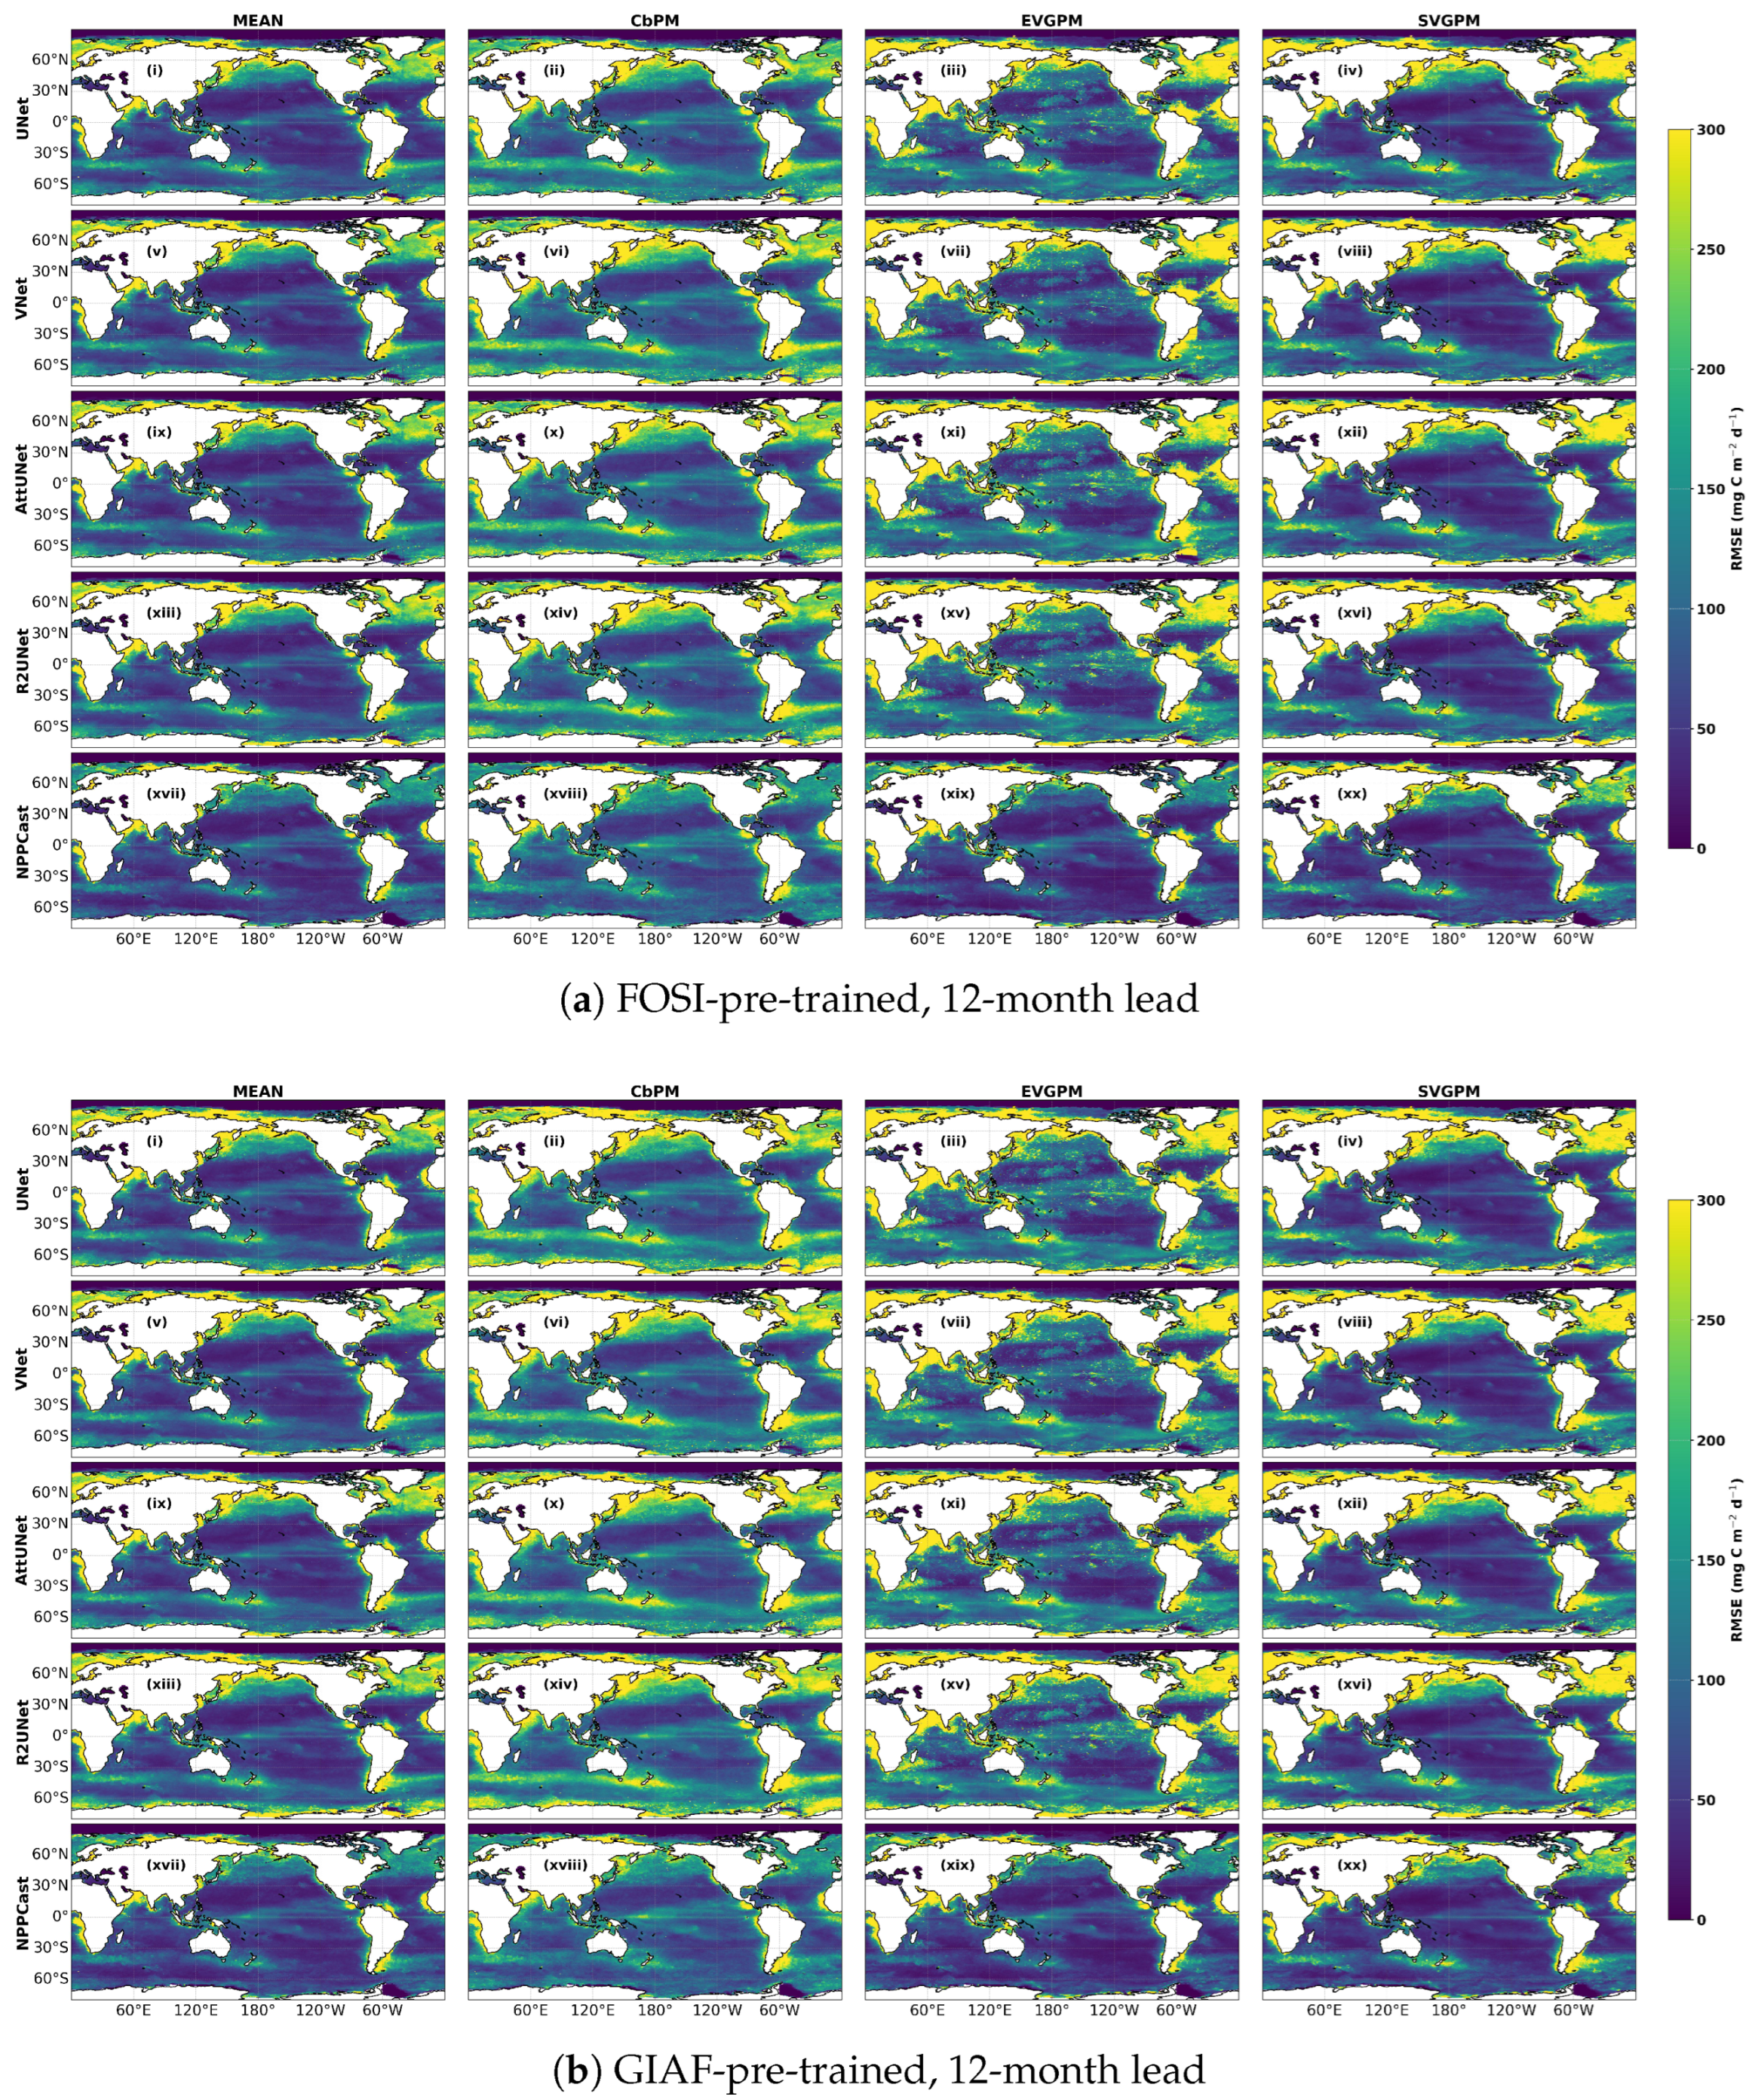
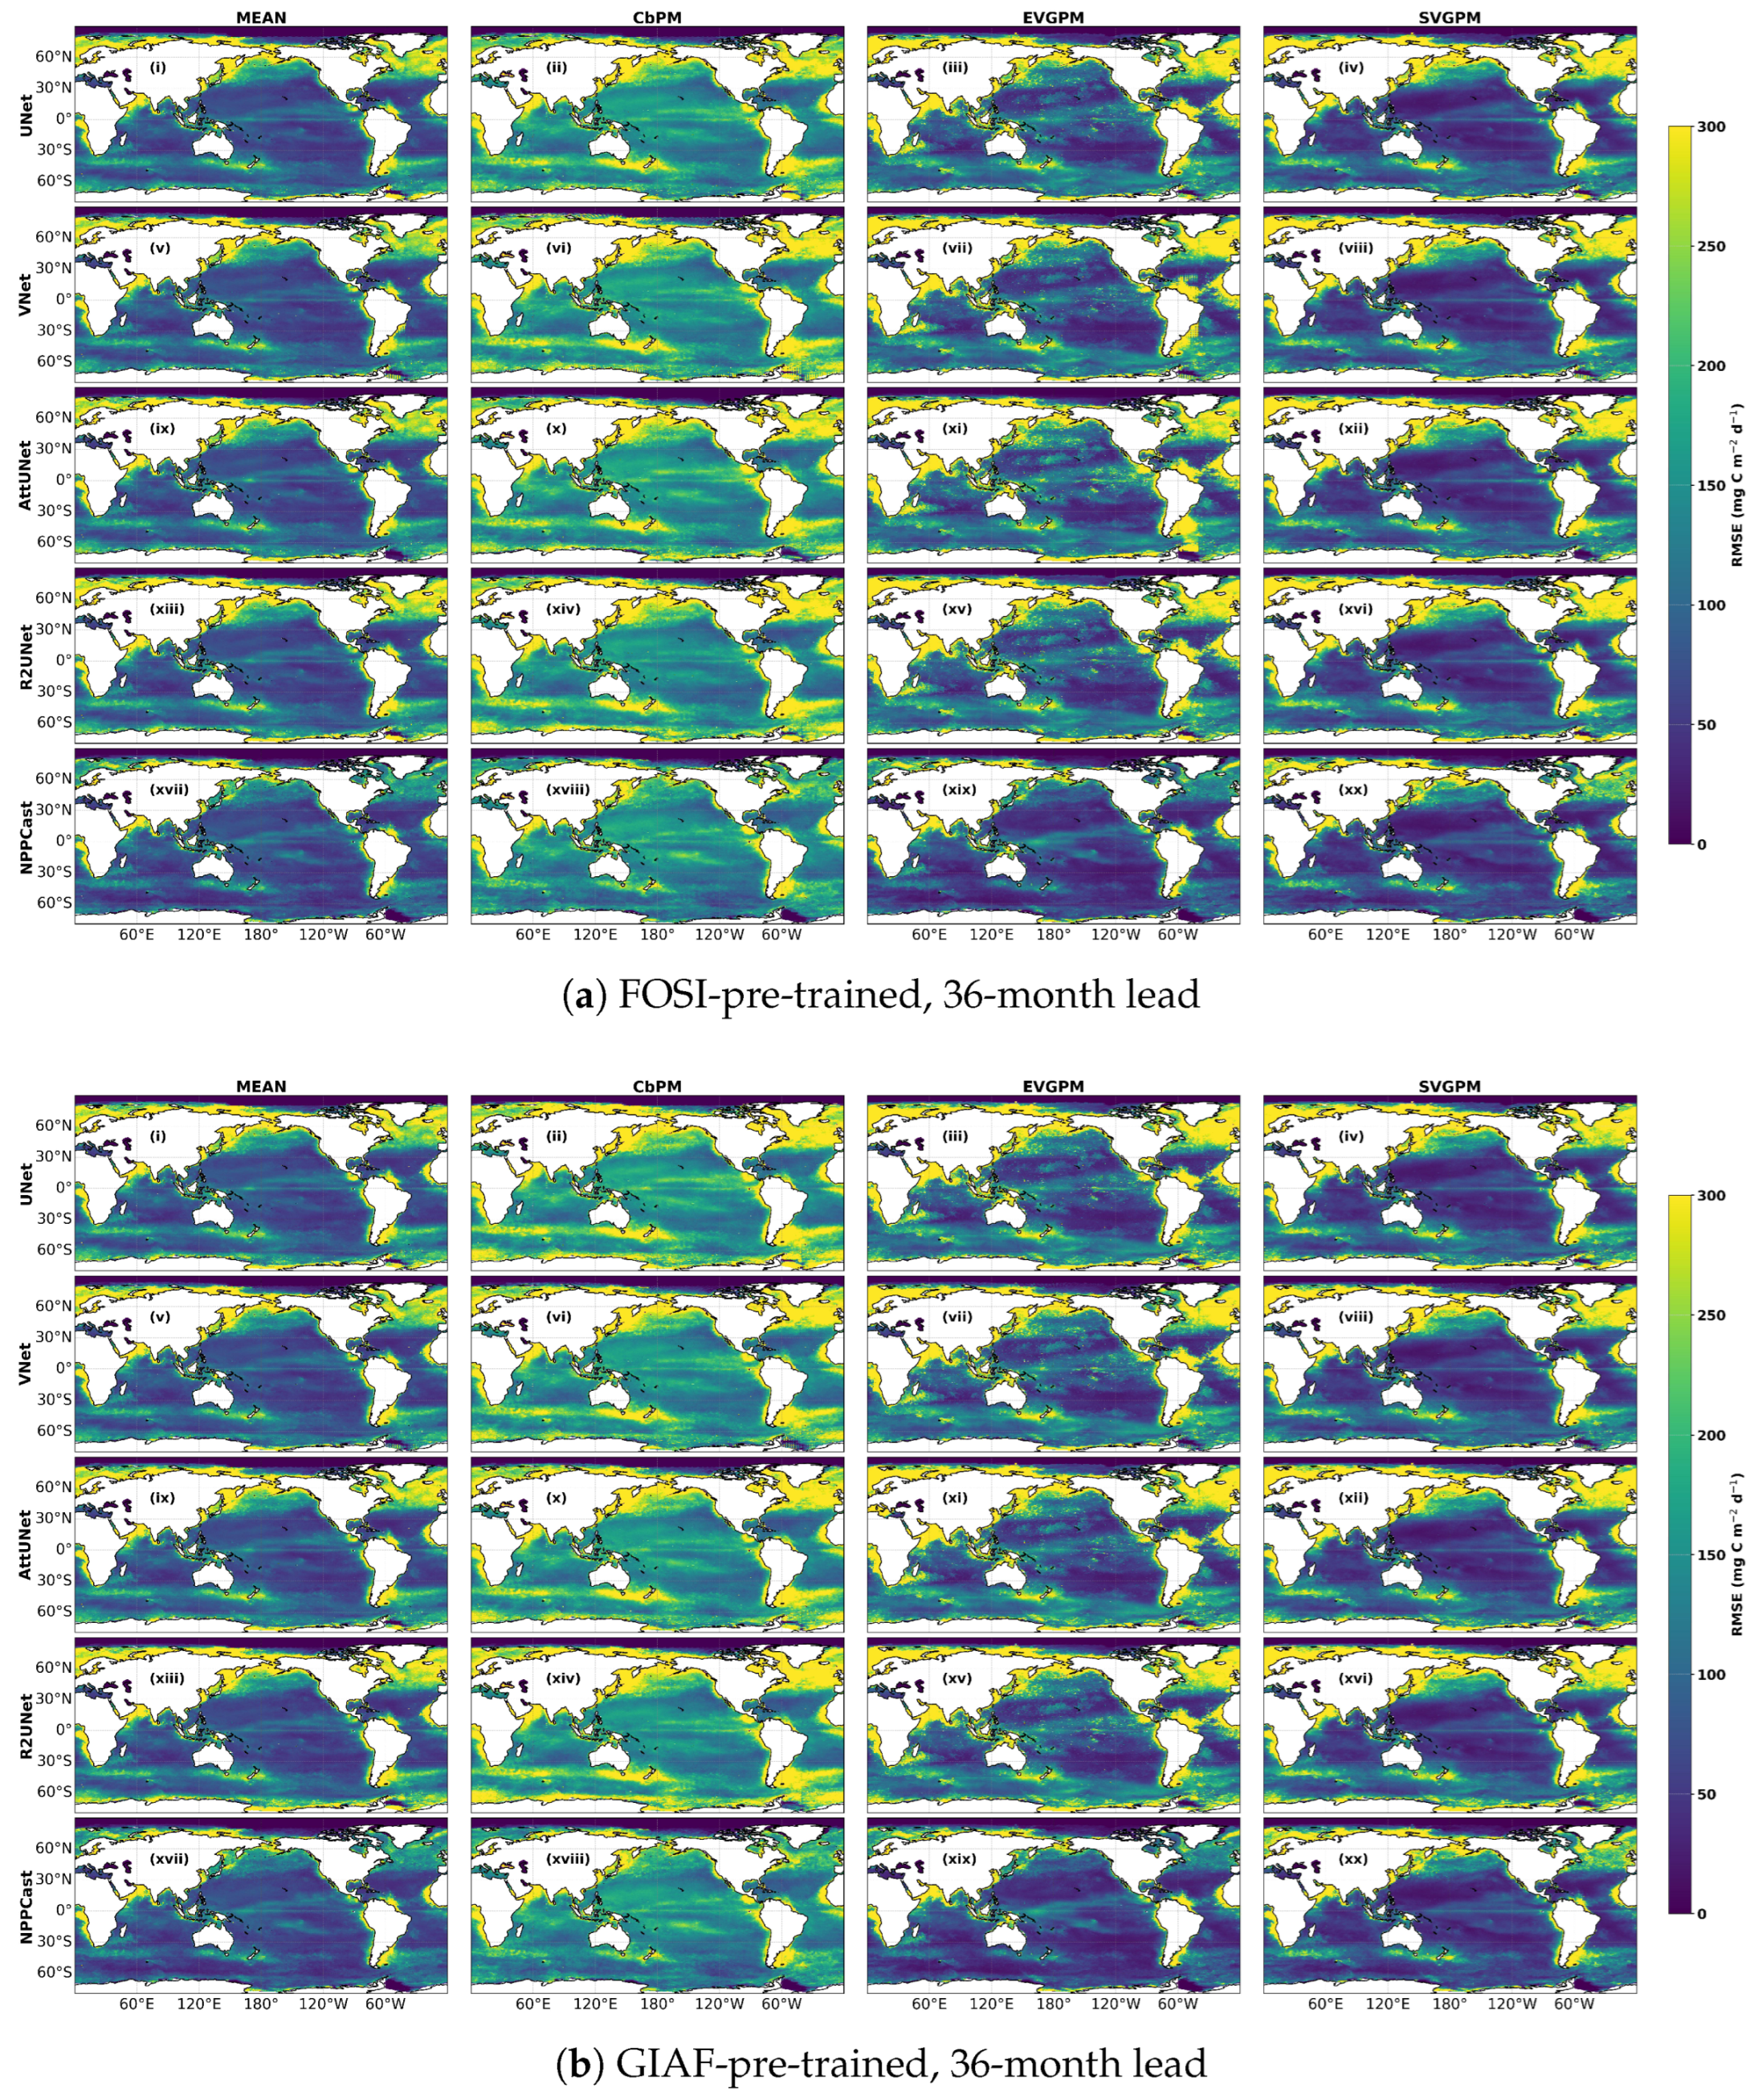
3.2. Spatial Pattern Fidelity at Different Scale Leads
3.3. Quantitative Performance Metrics
3.4. Prediction vs. Observation Scatter
3.5. Latitudinal Error Distribution
3.6. Evaluating Differences in NPP Prediction Skill Between CESM2-SMYLE and NPPCast
4. Discussion
4.1. Drivers of Prediction Skill
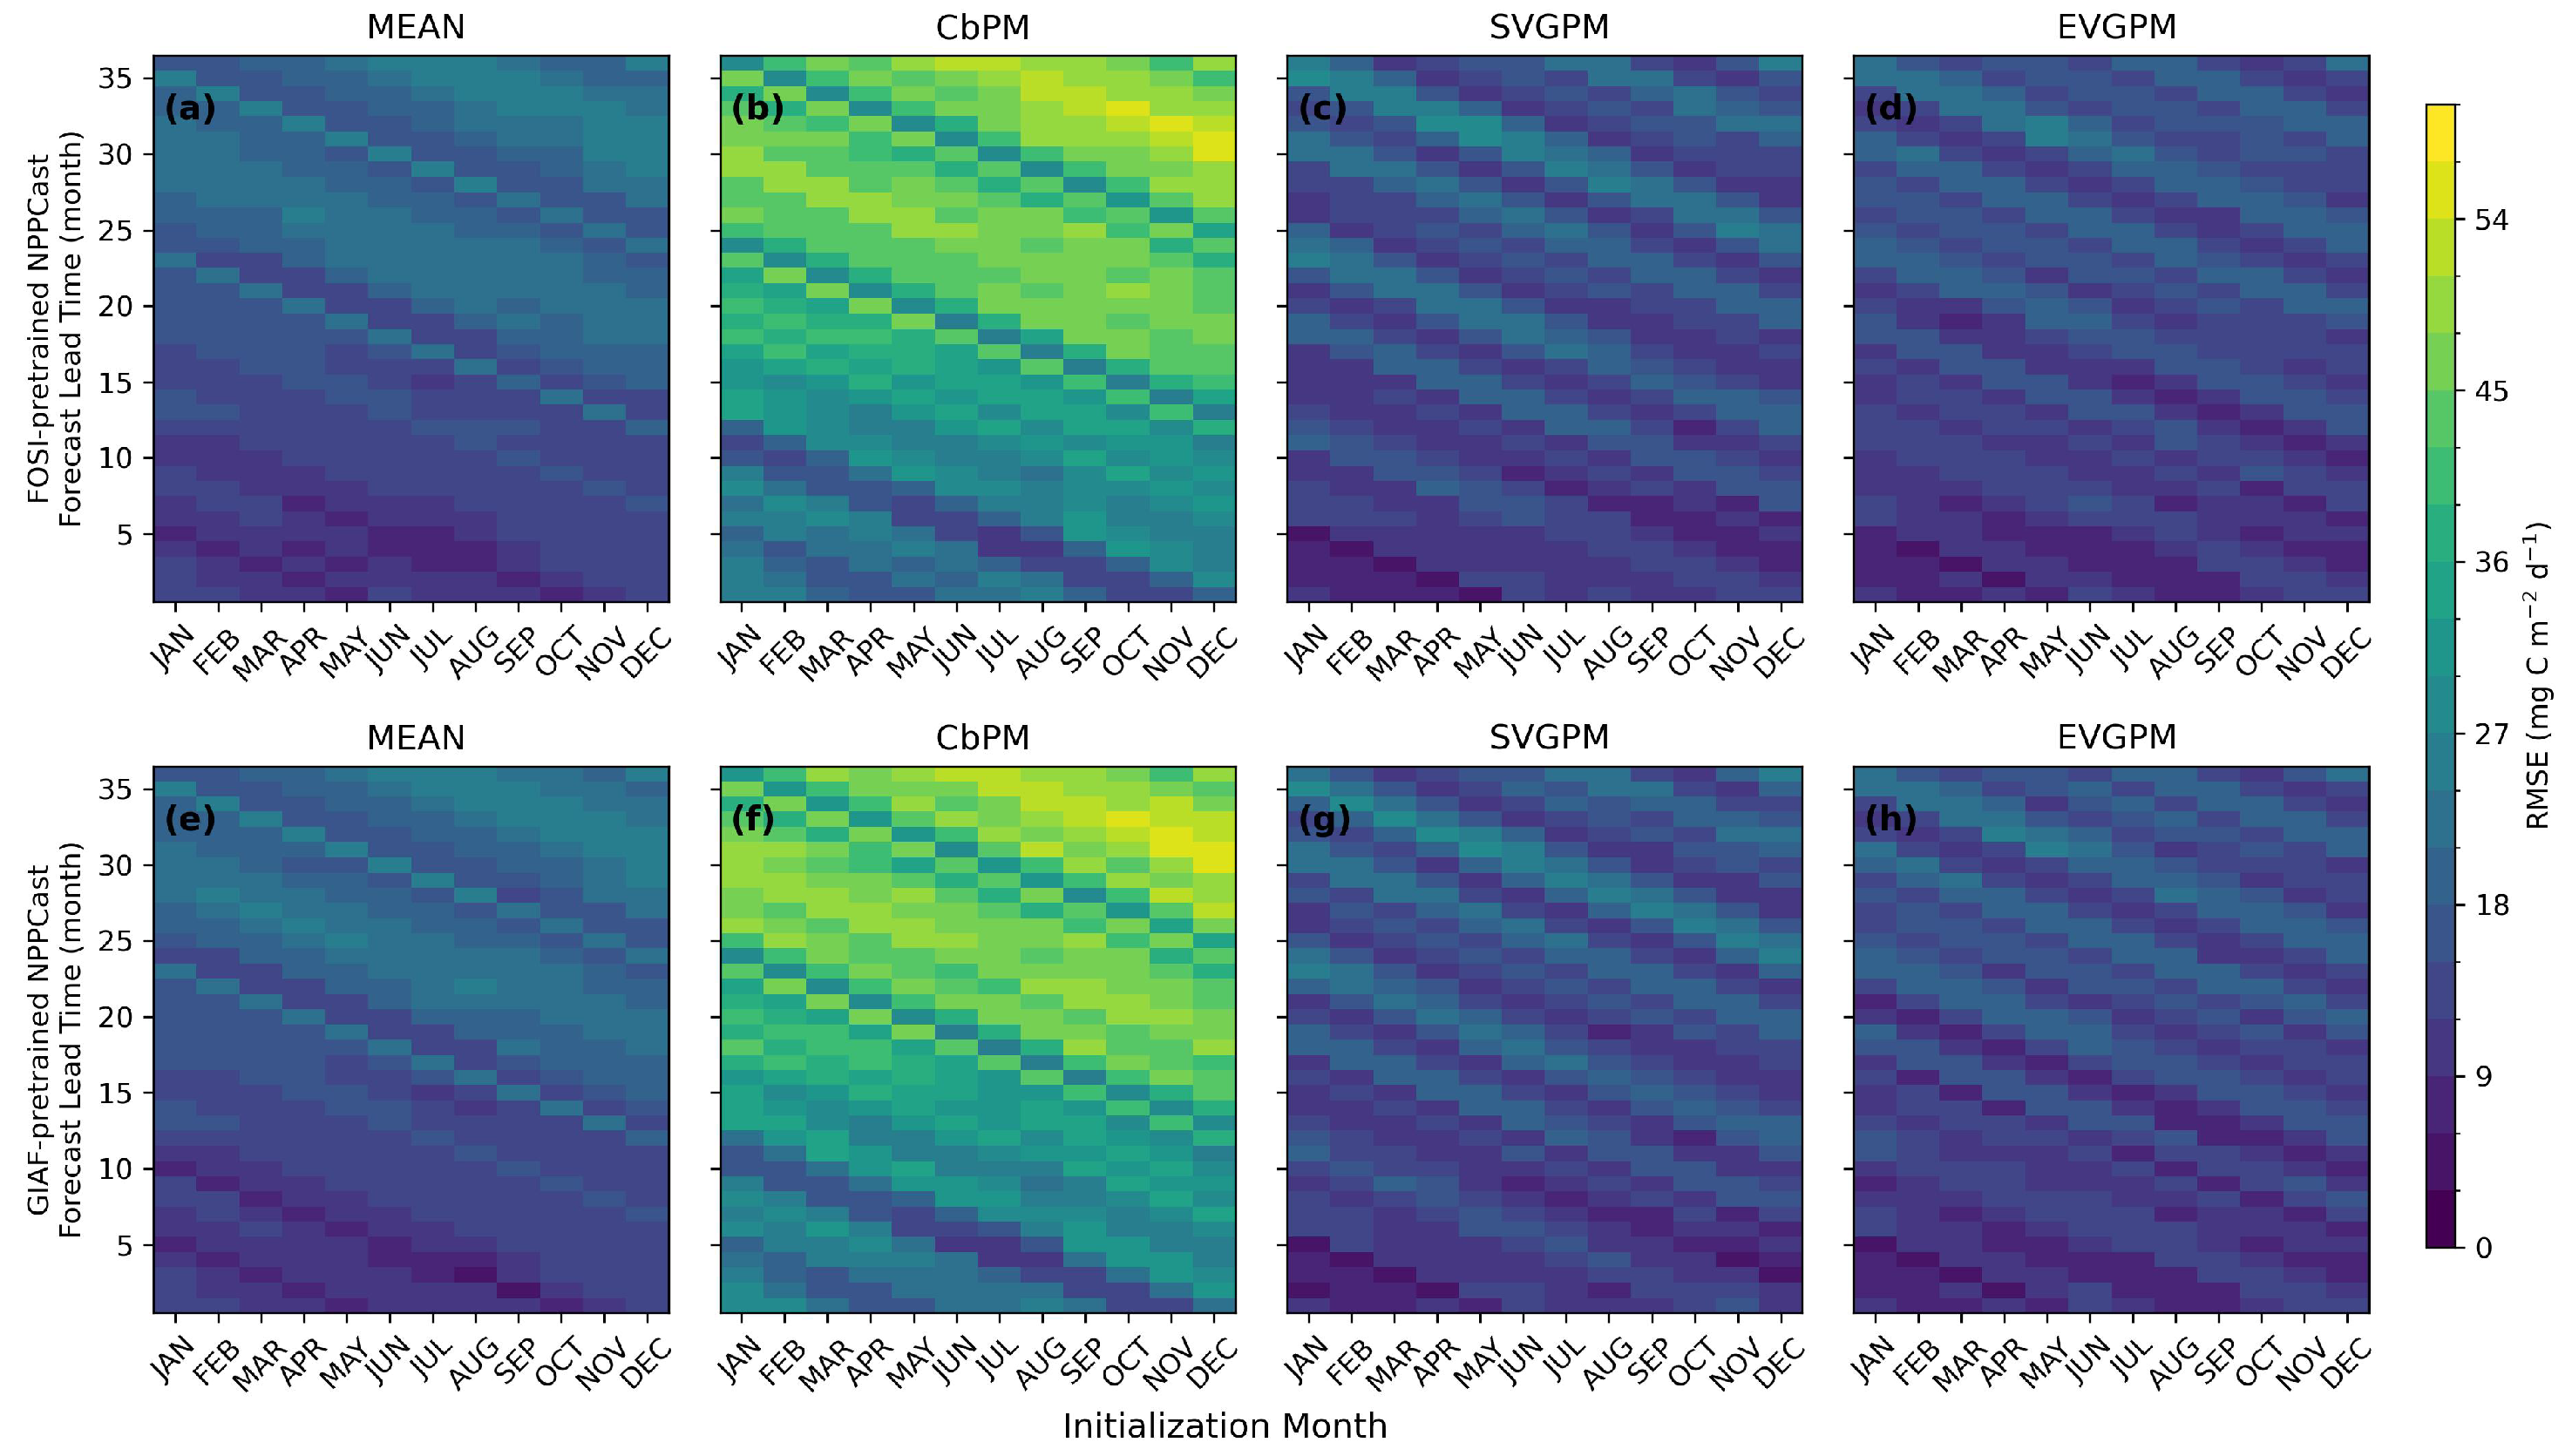
4.1.1. Evolution of Prediction Skill with Initialization Time and Lead Time
4.1.2. Sensitivity to Pre-Training Scenes
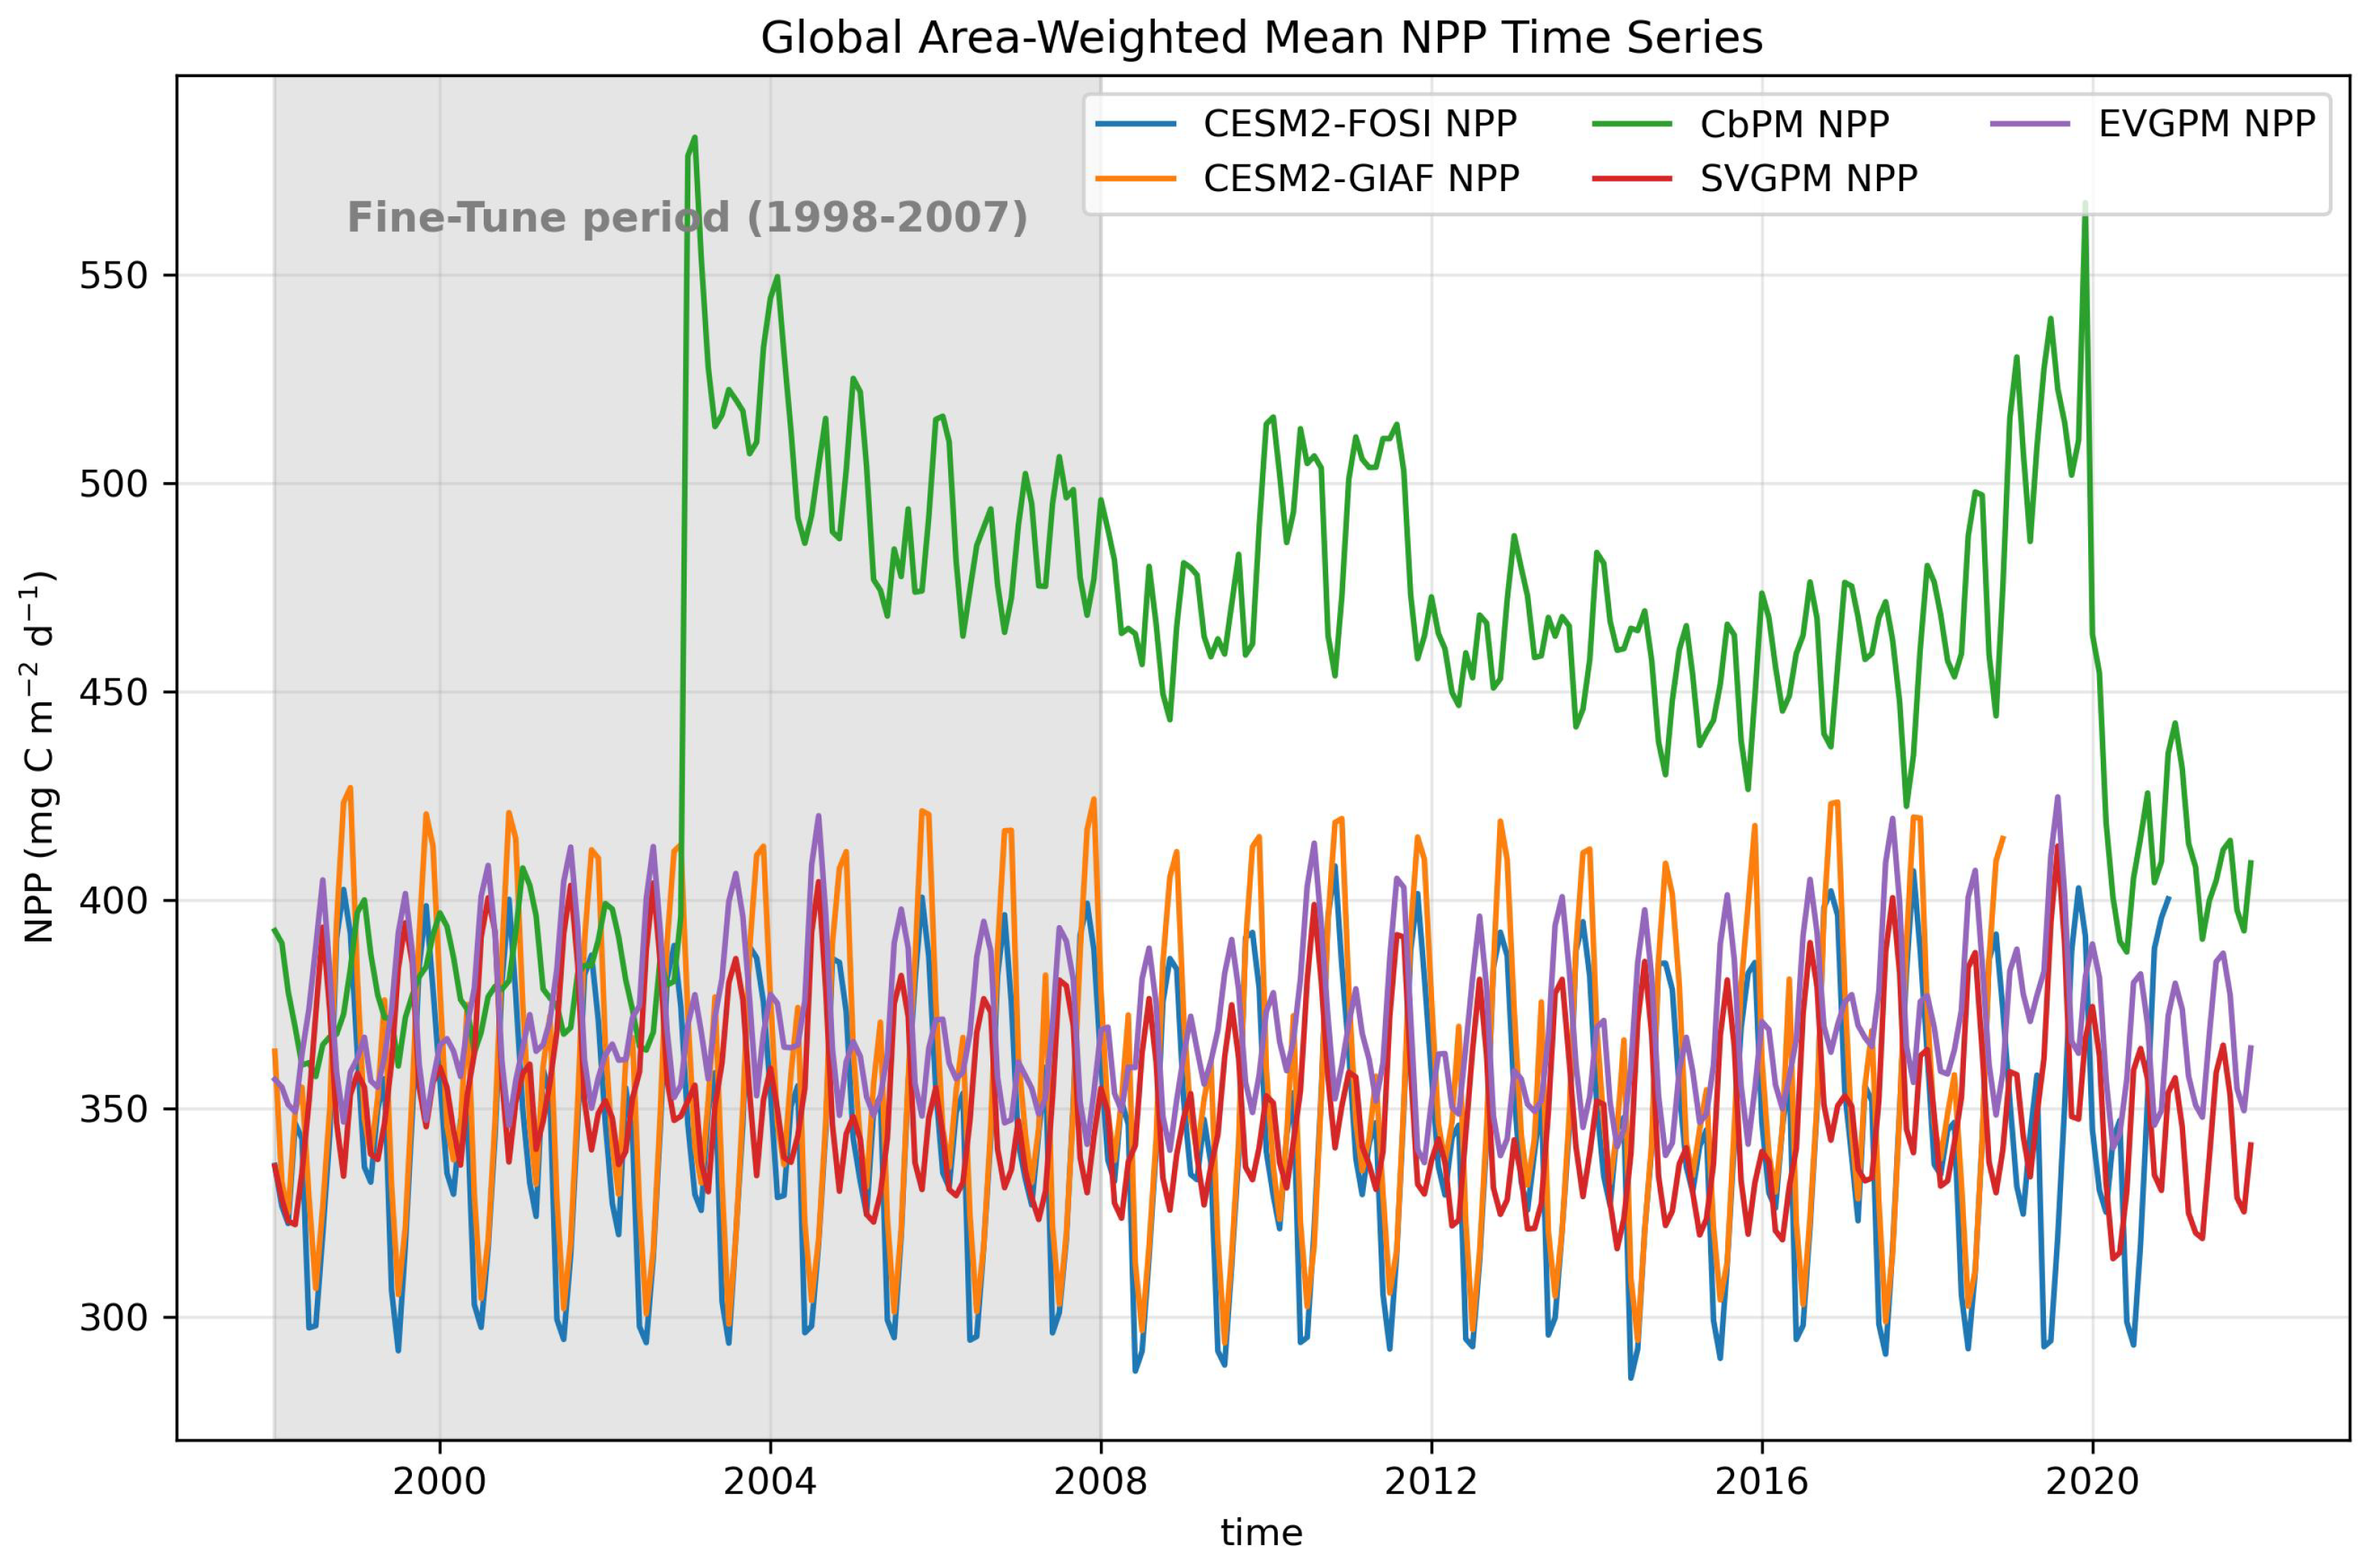
4.1.3. Impact of Fine-Tuning Dataset Differences on Model Performance
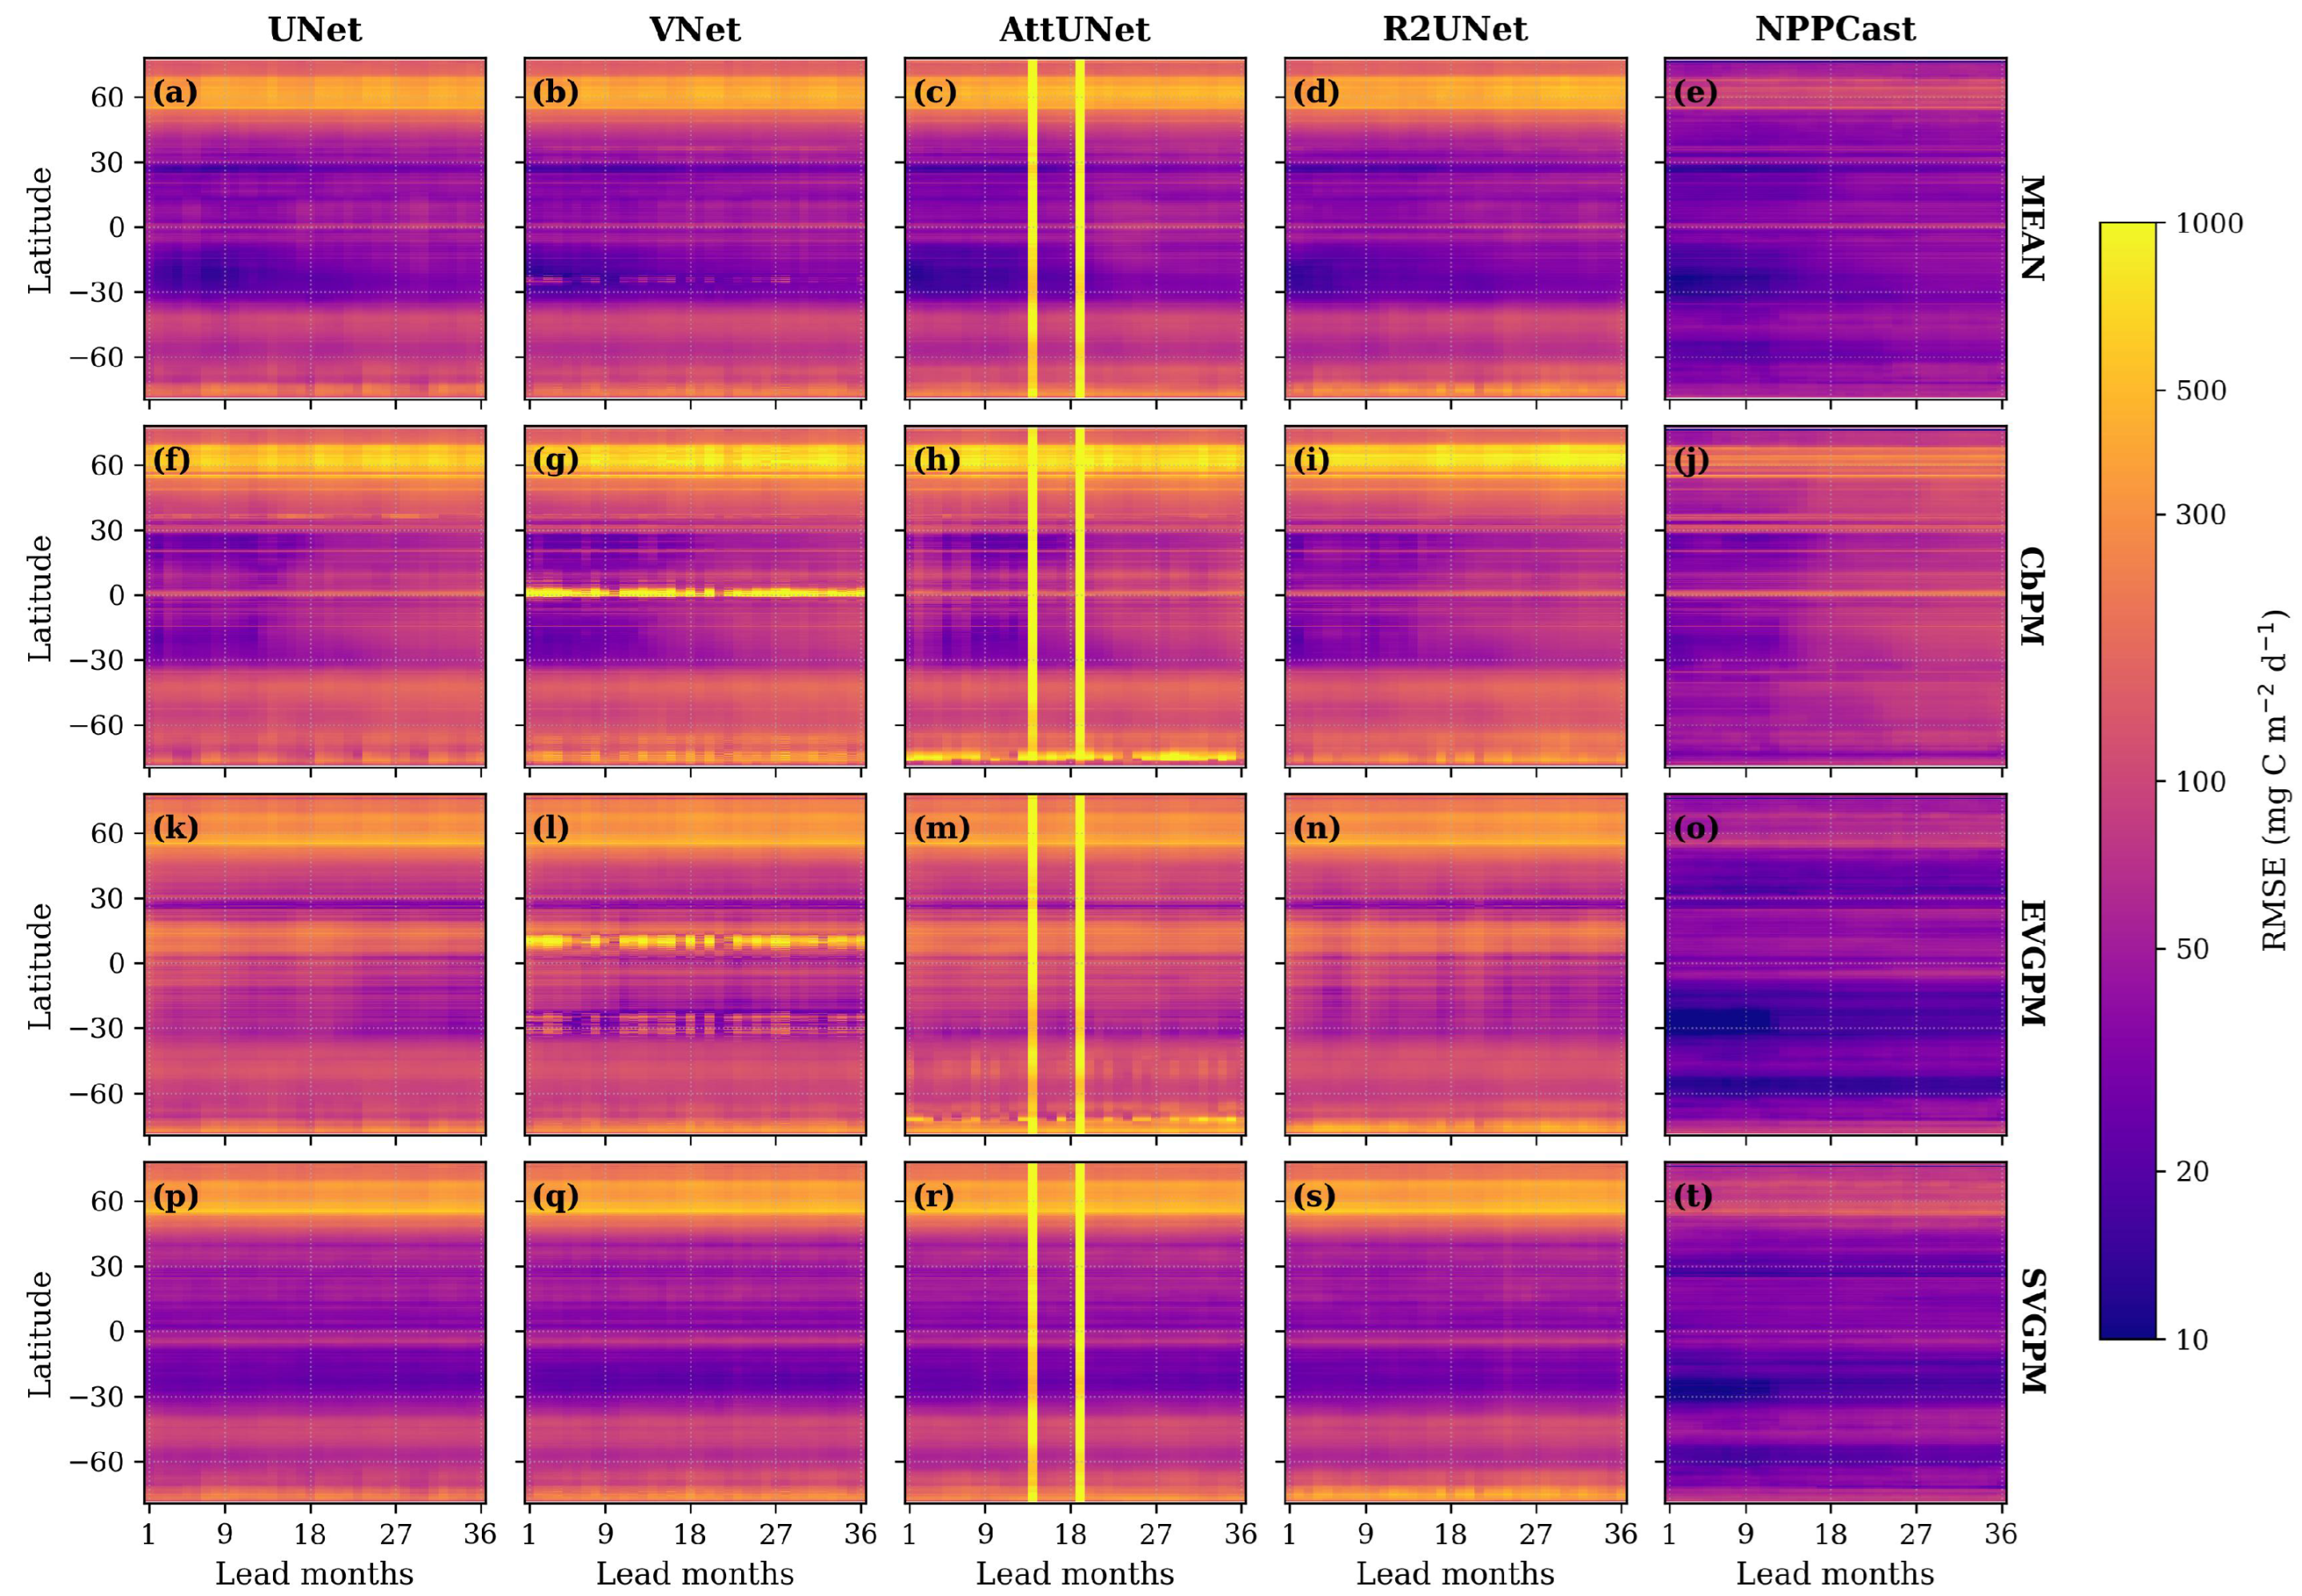
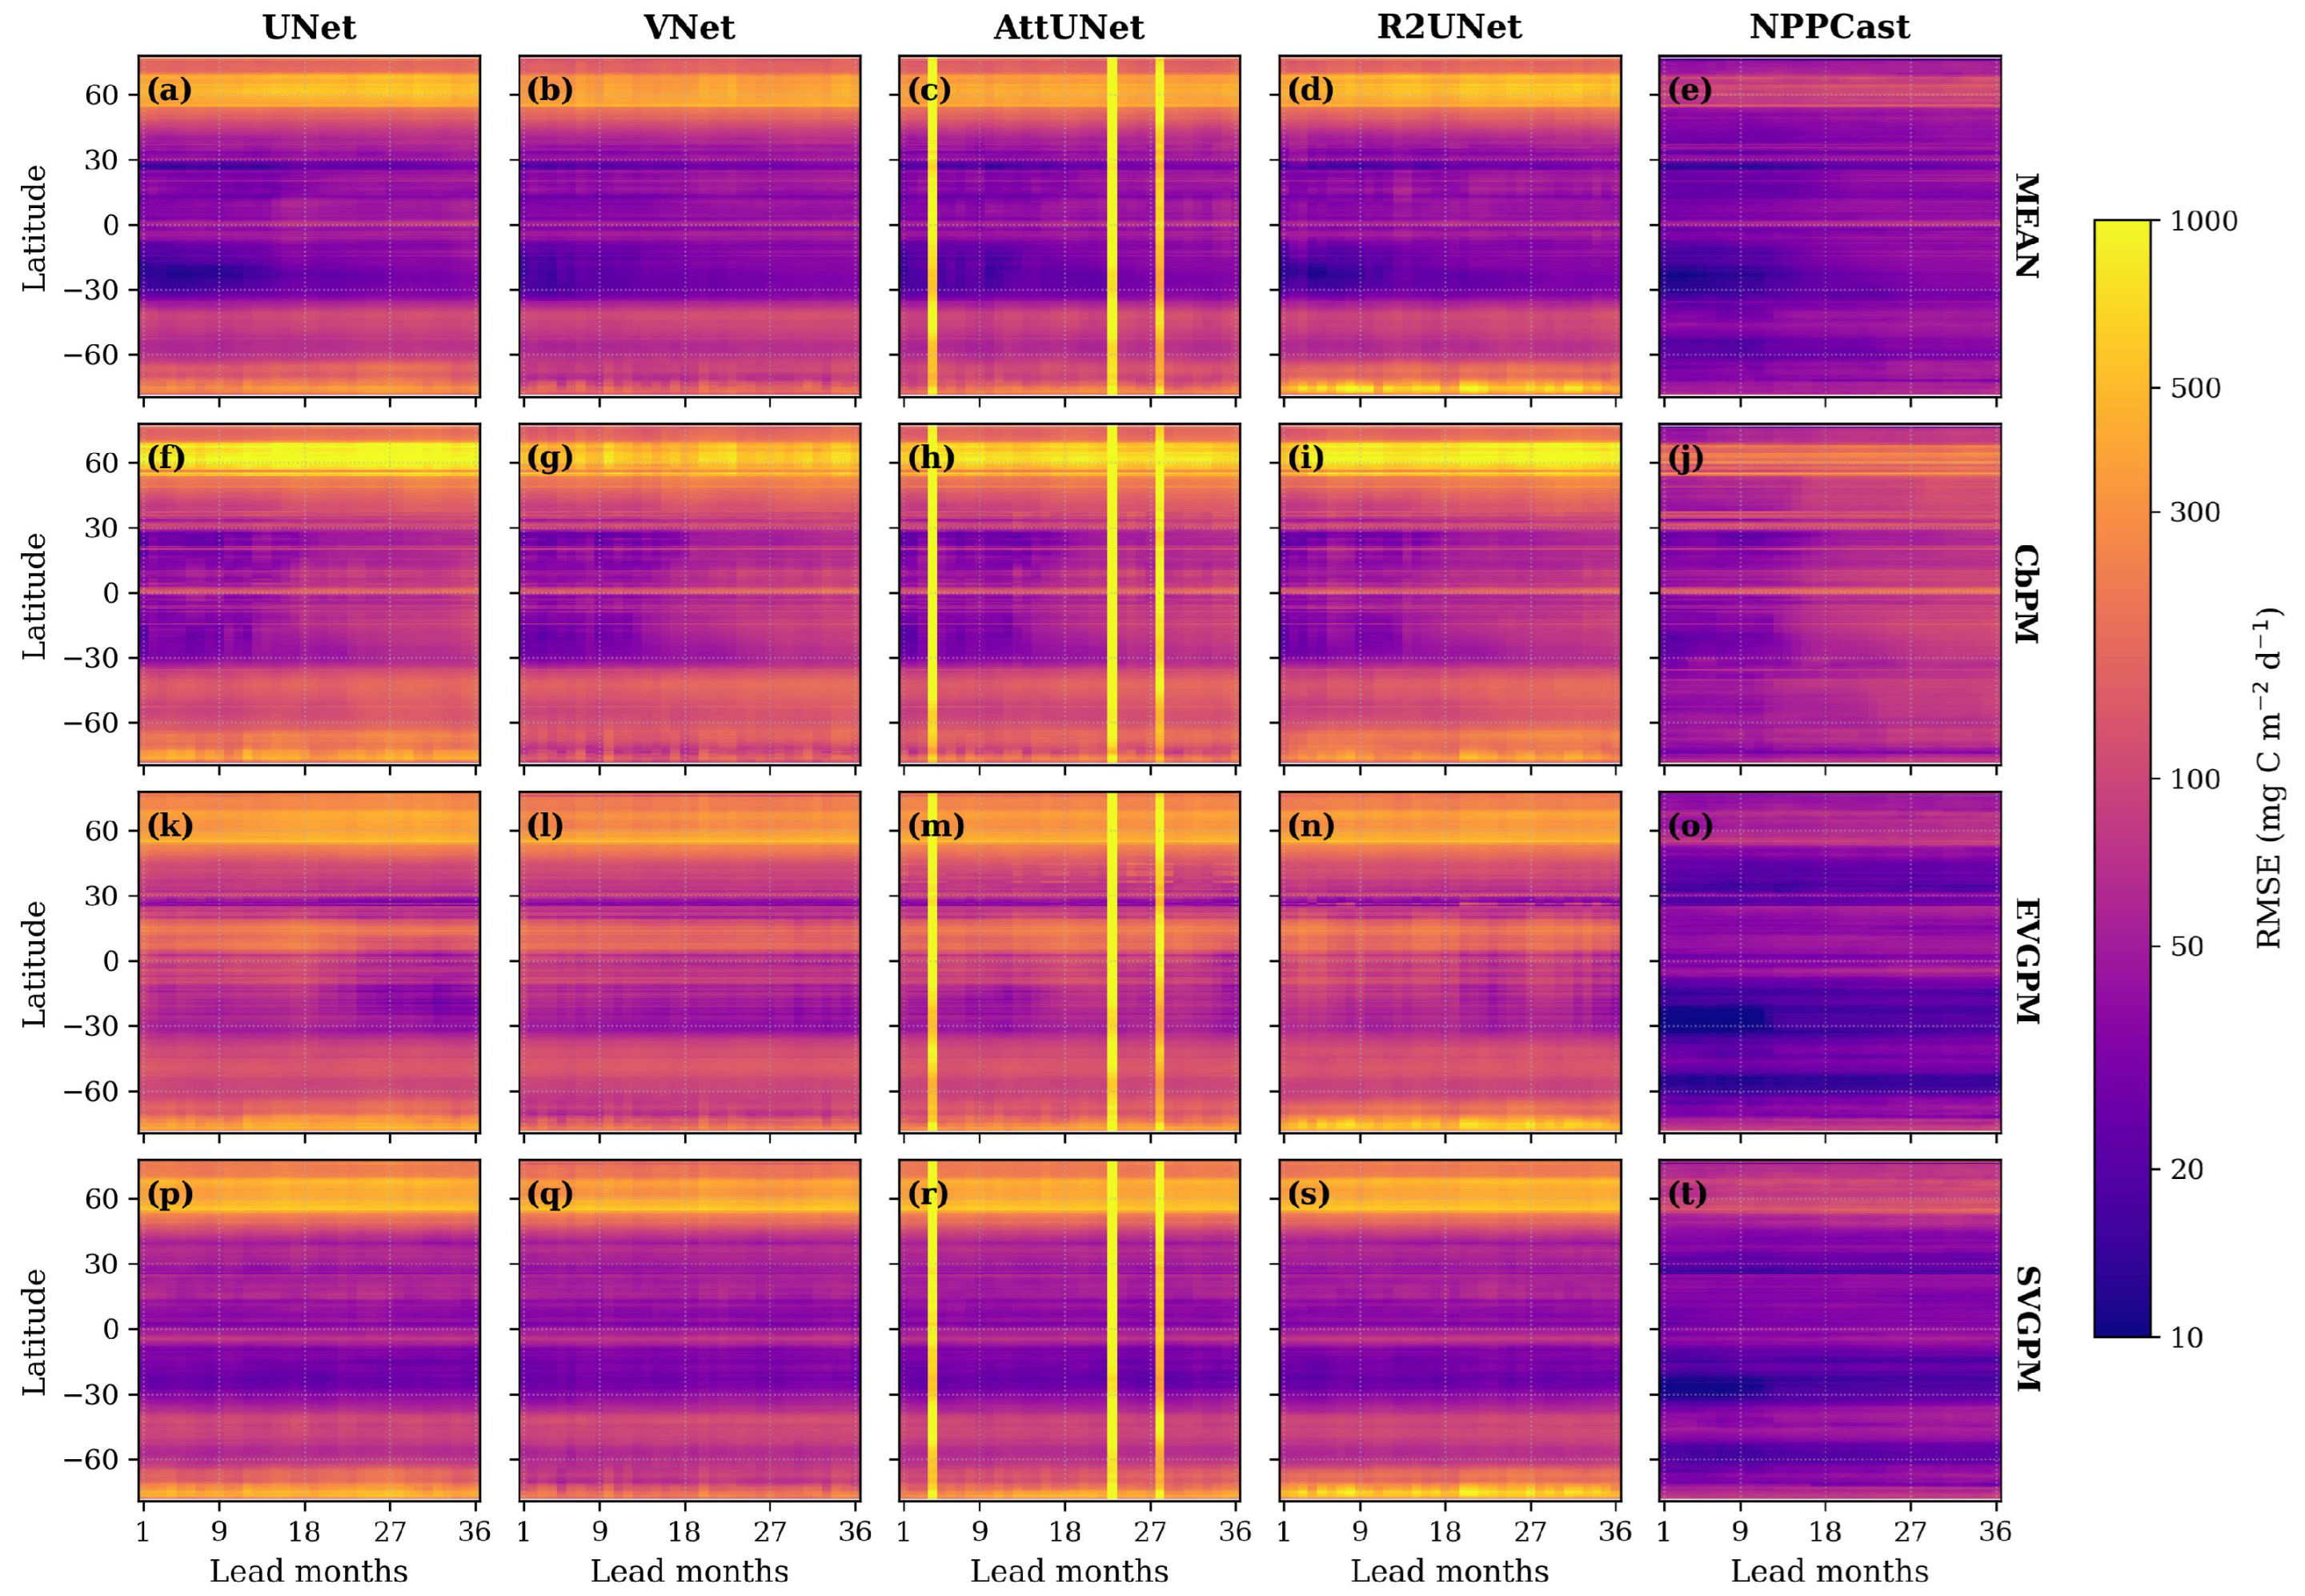
4.2. AttUNet RMSE Spikes and High-RMSE Bands
4.3. Potential Application Scenarios of the Prediction Model
5. Conclusions
Author Contributions
Funding
Data Availability Statement
Acknowledgments
Conflicts of Interest
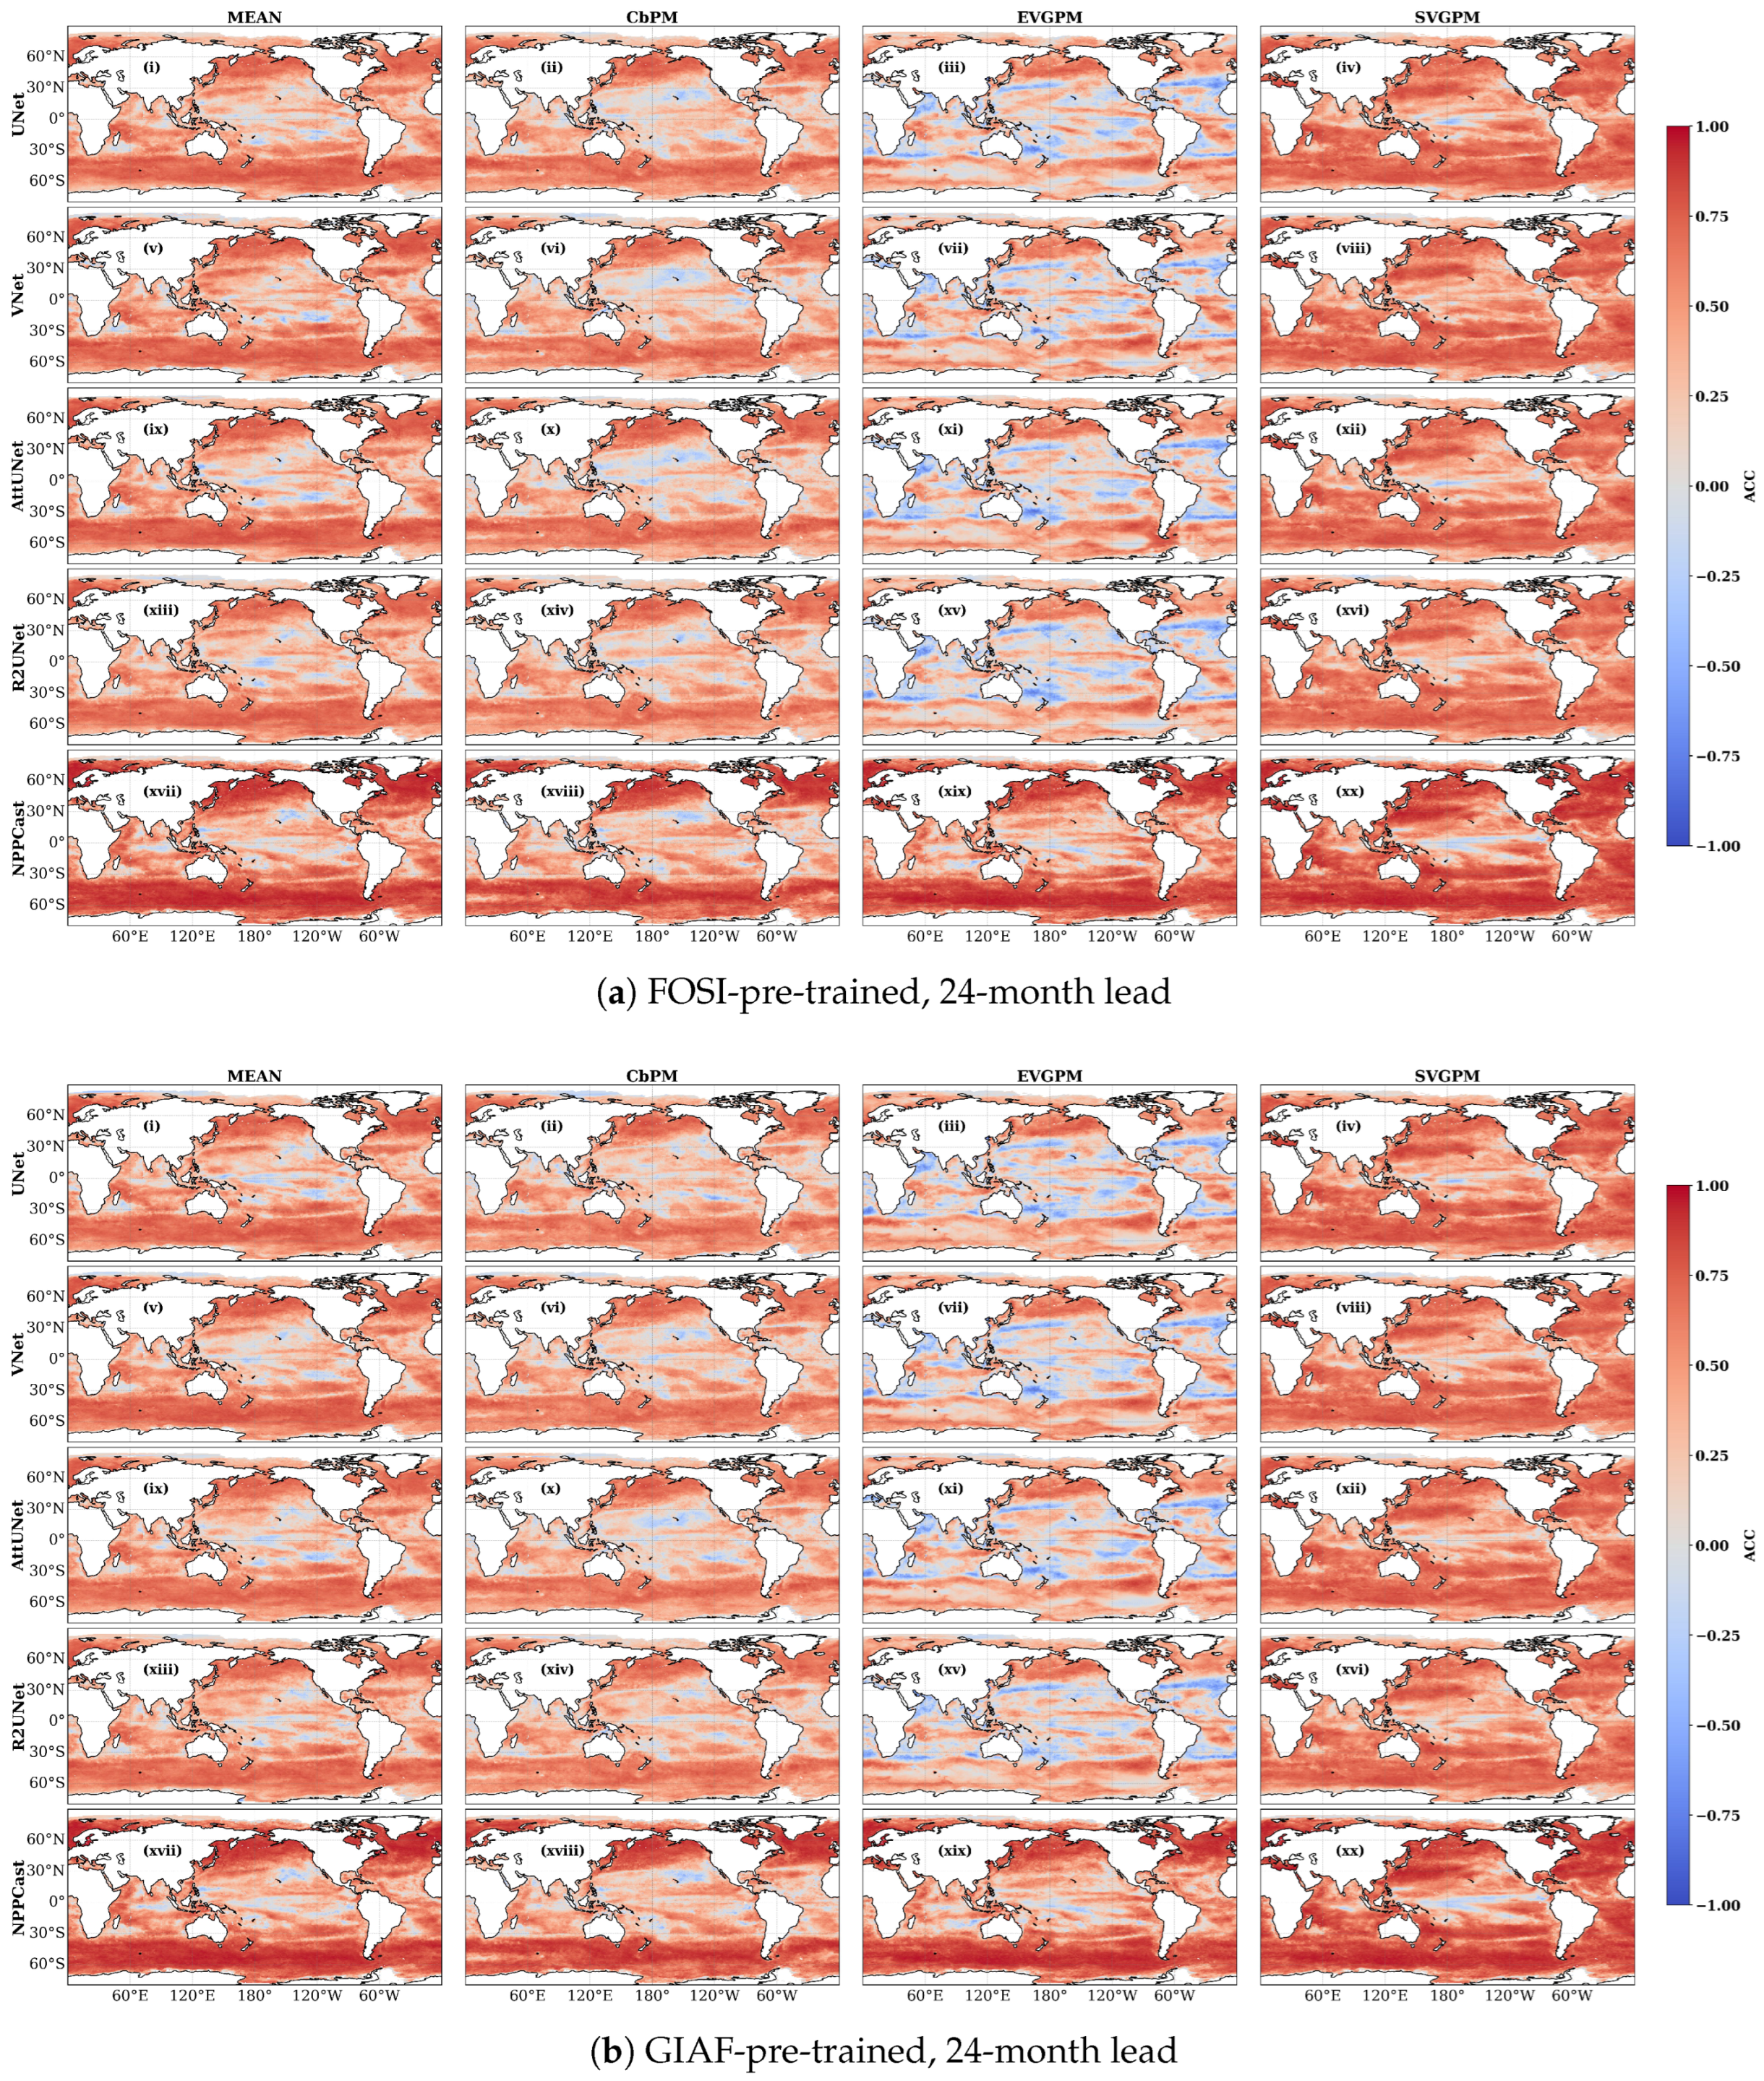
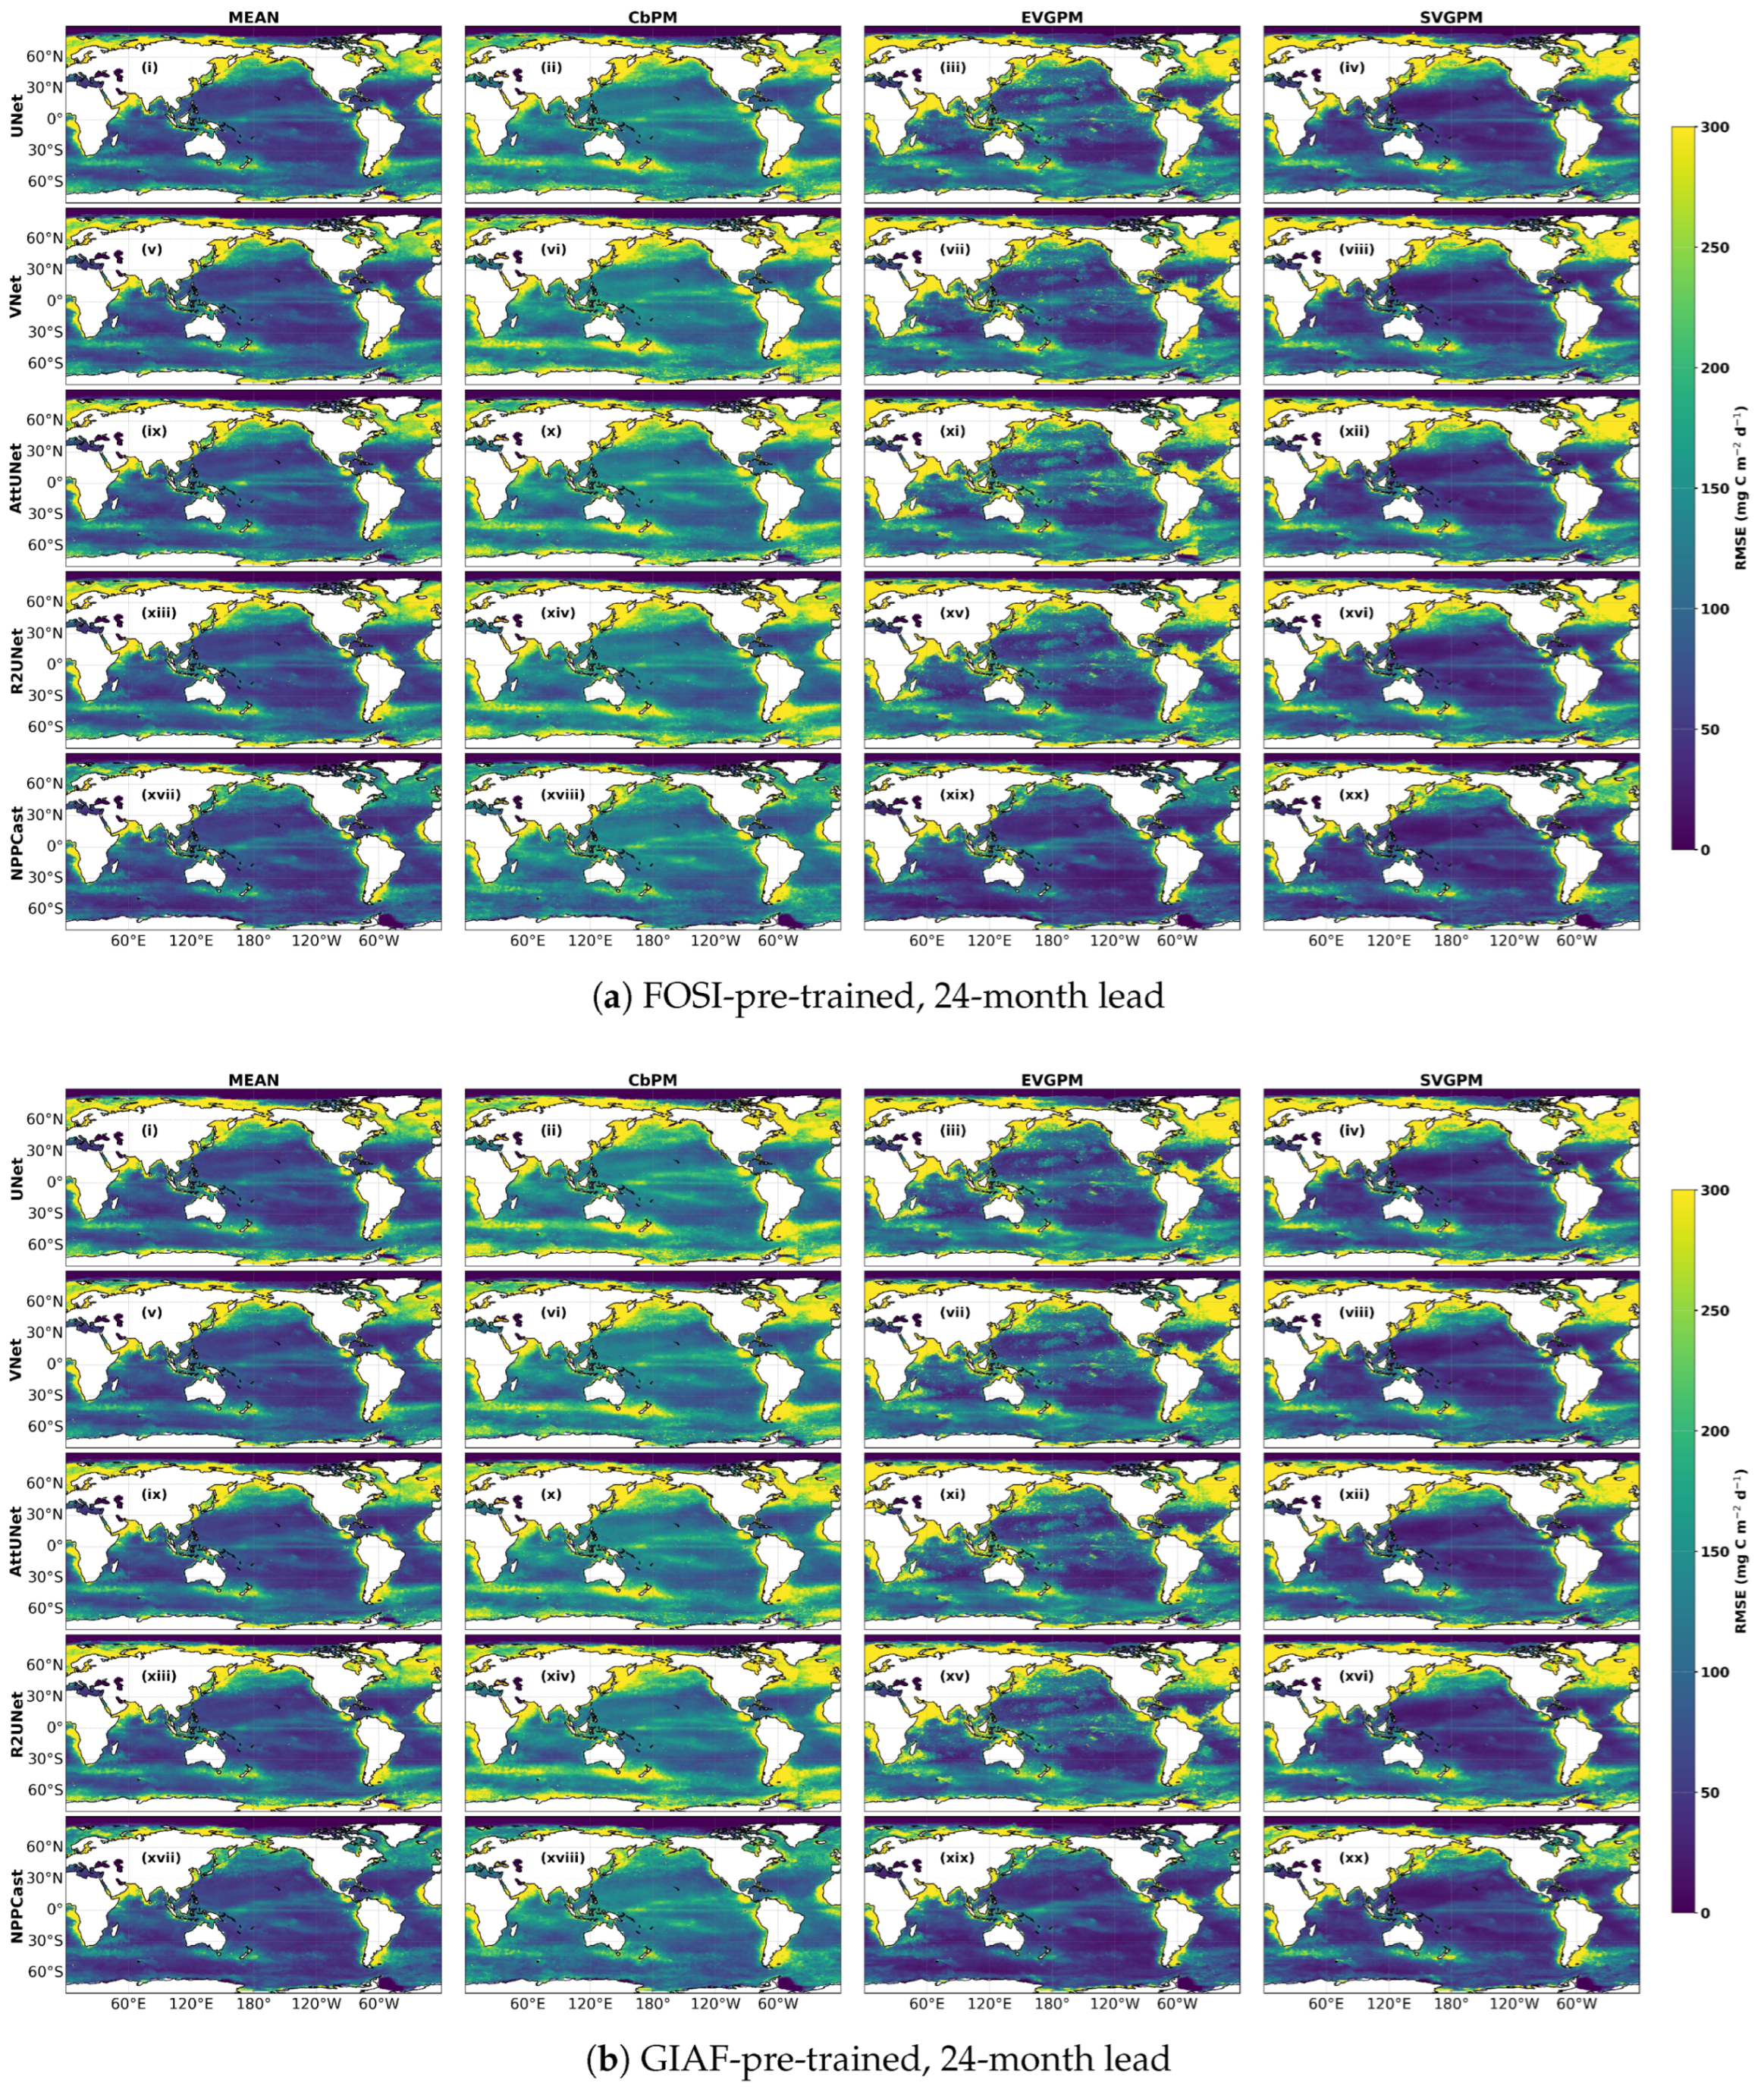
Appendix A. Spatial Pattern Fidelity at 24-Month Lead (FOSI and GIAF Pretraining)
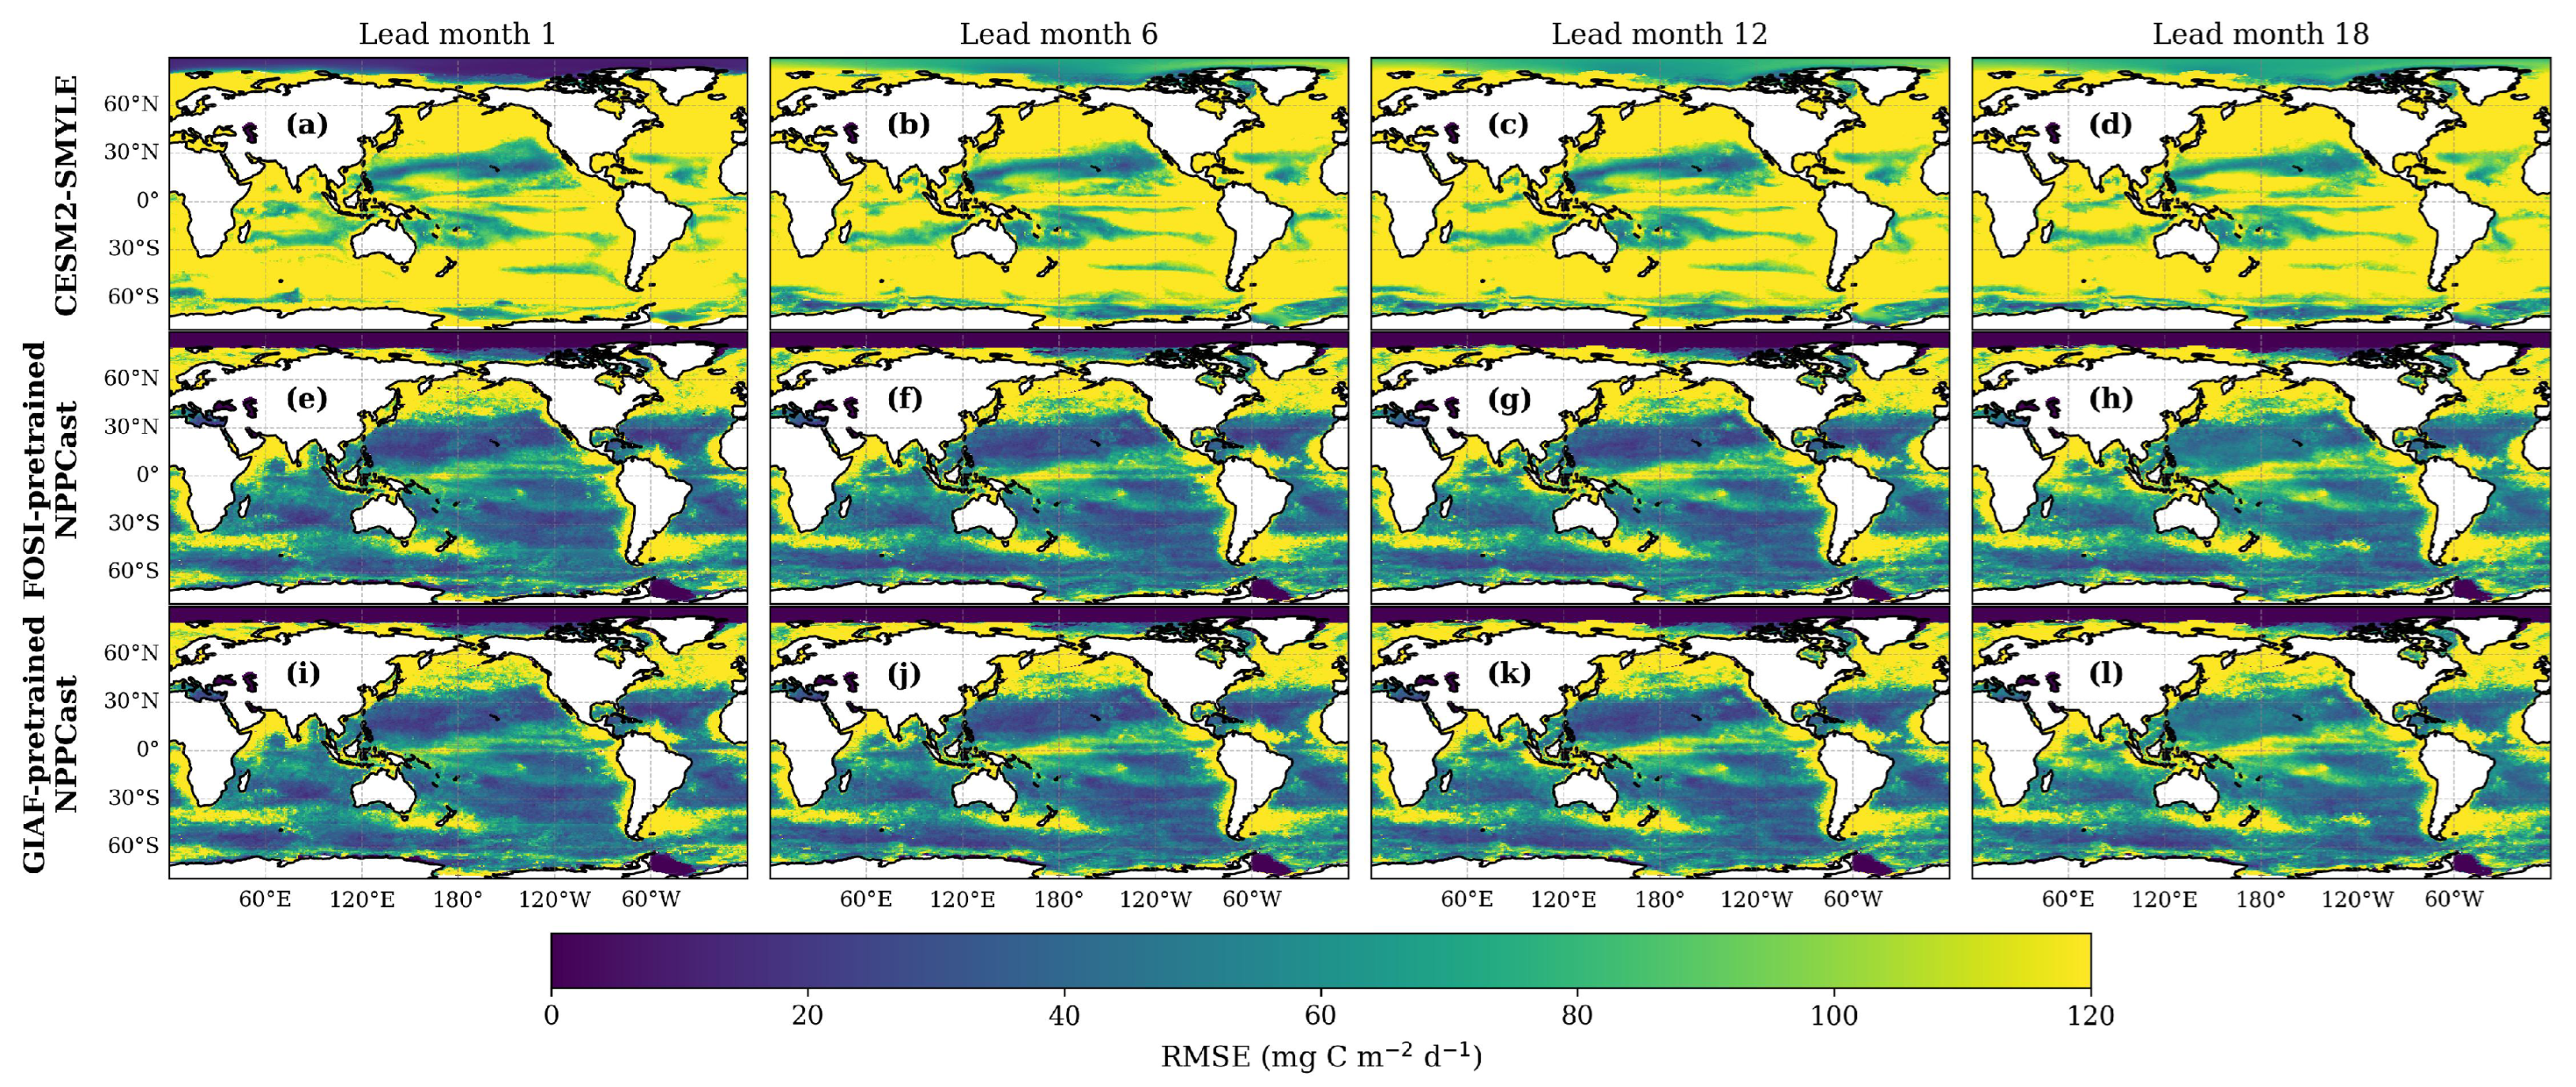
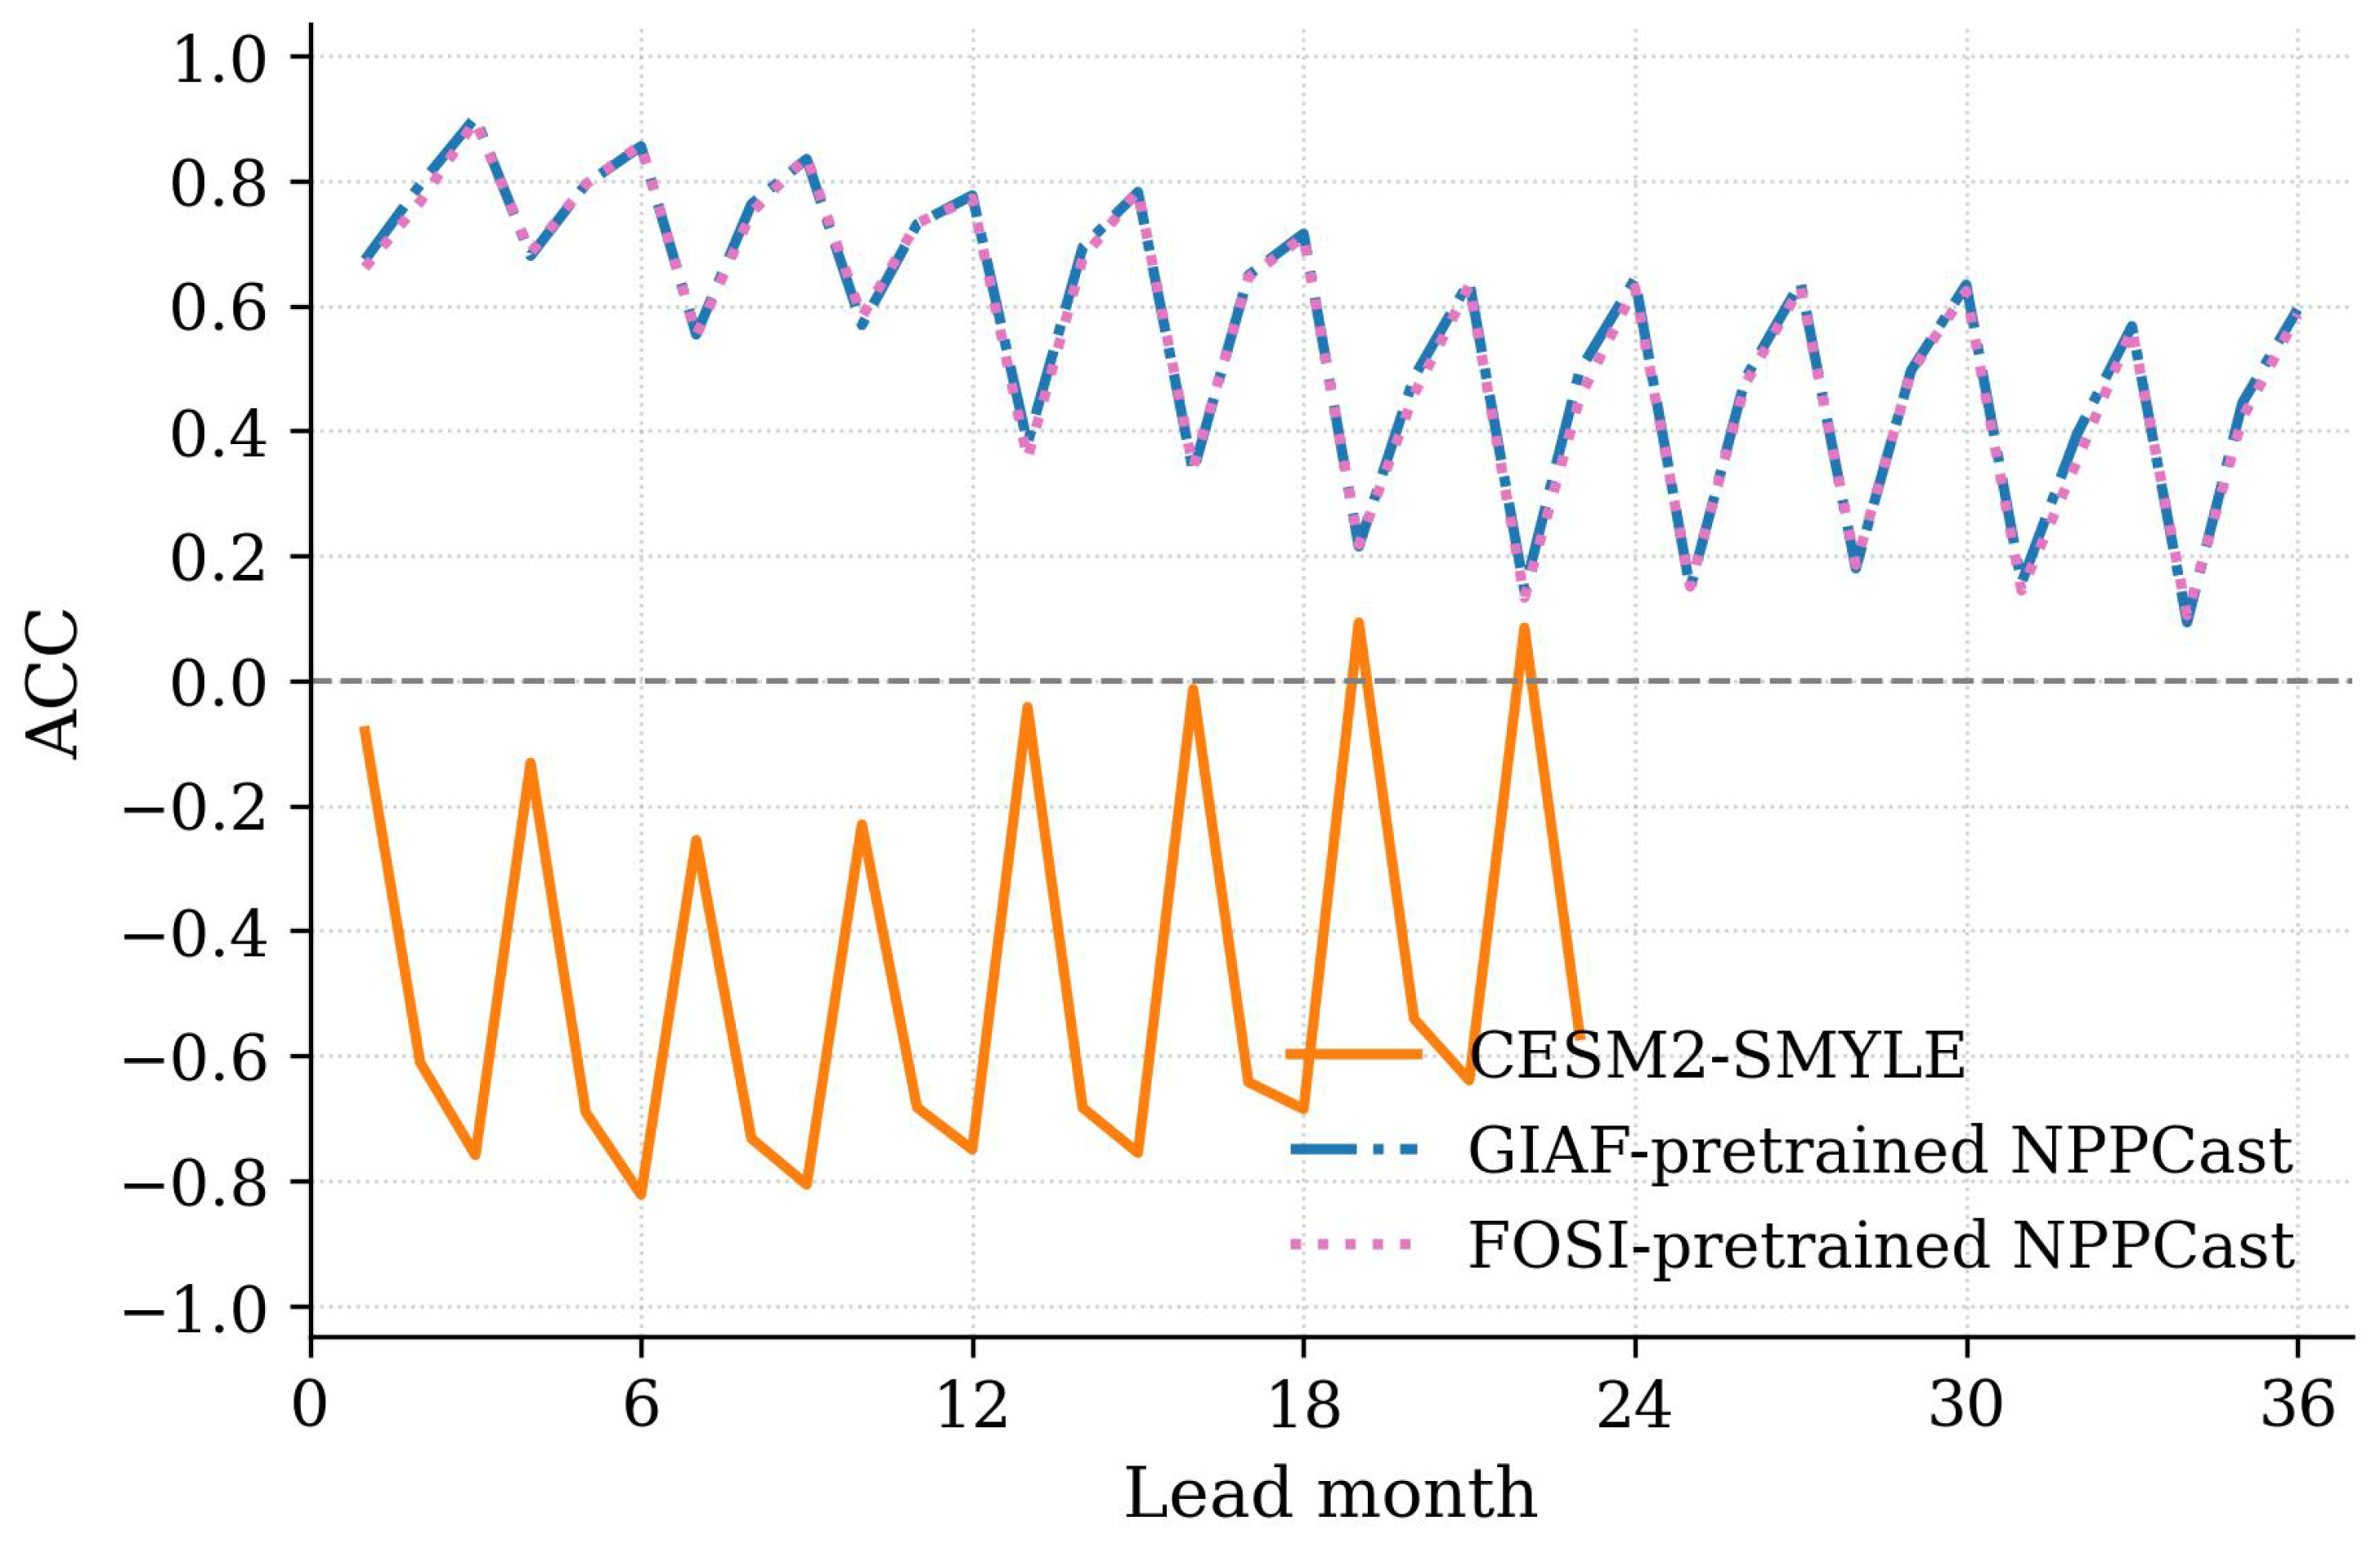
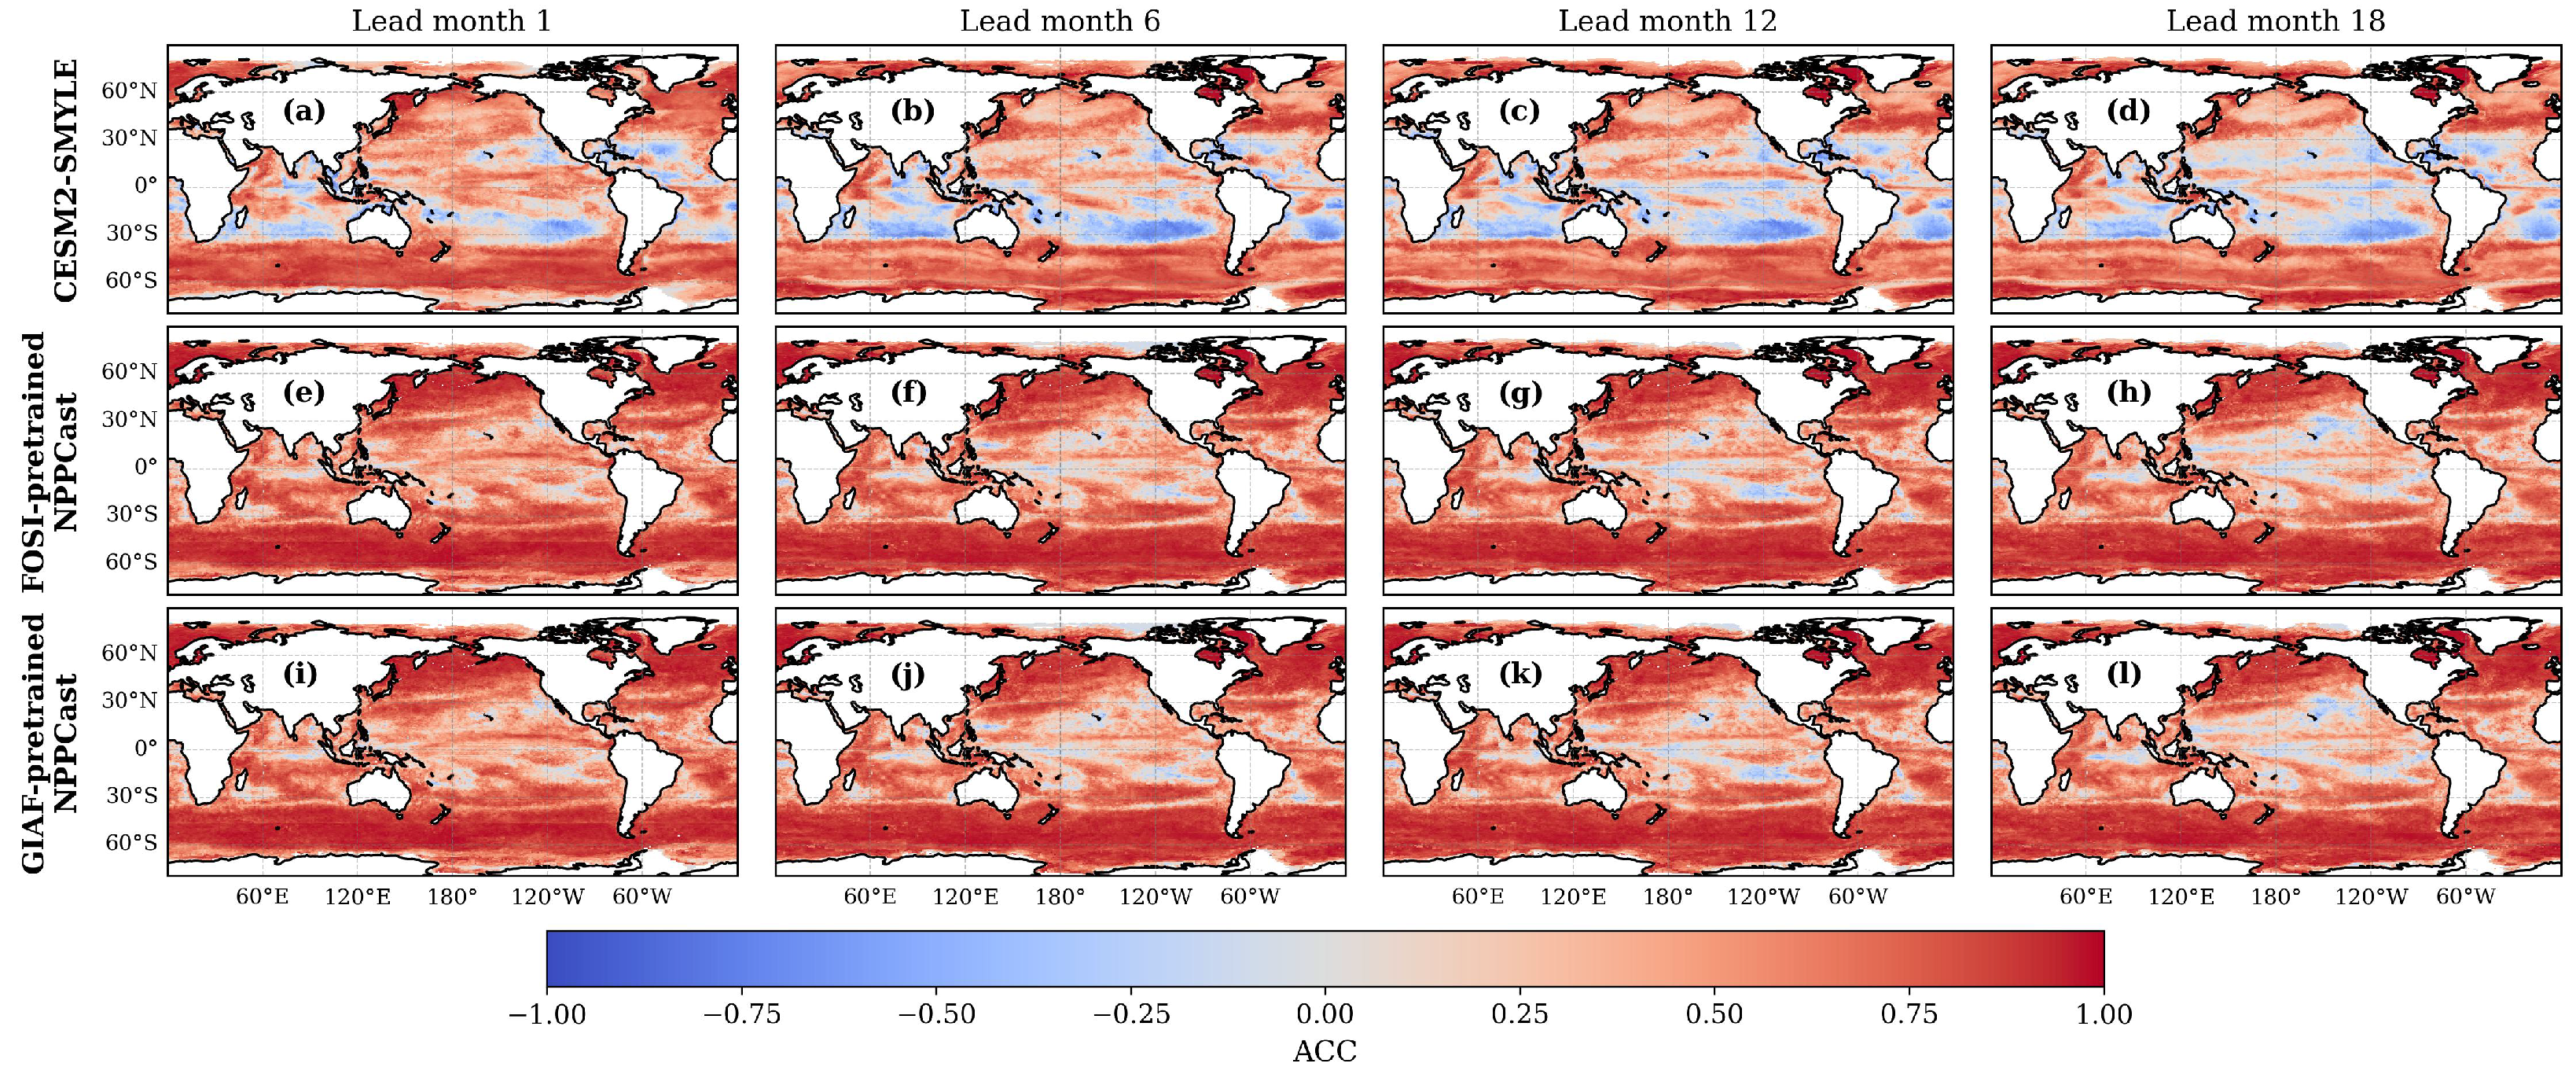
Appendix B. Comparison Between CESM2-SMYLE and NPPCast in Predicting NPP
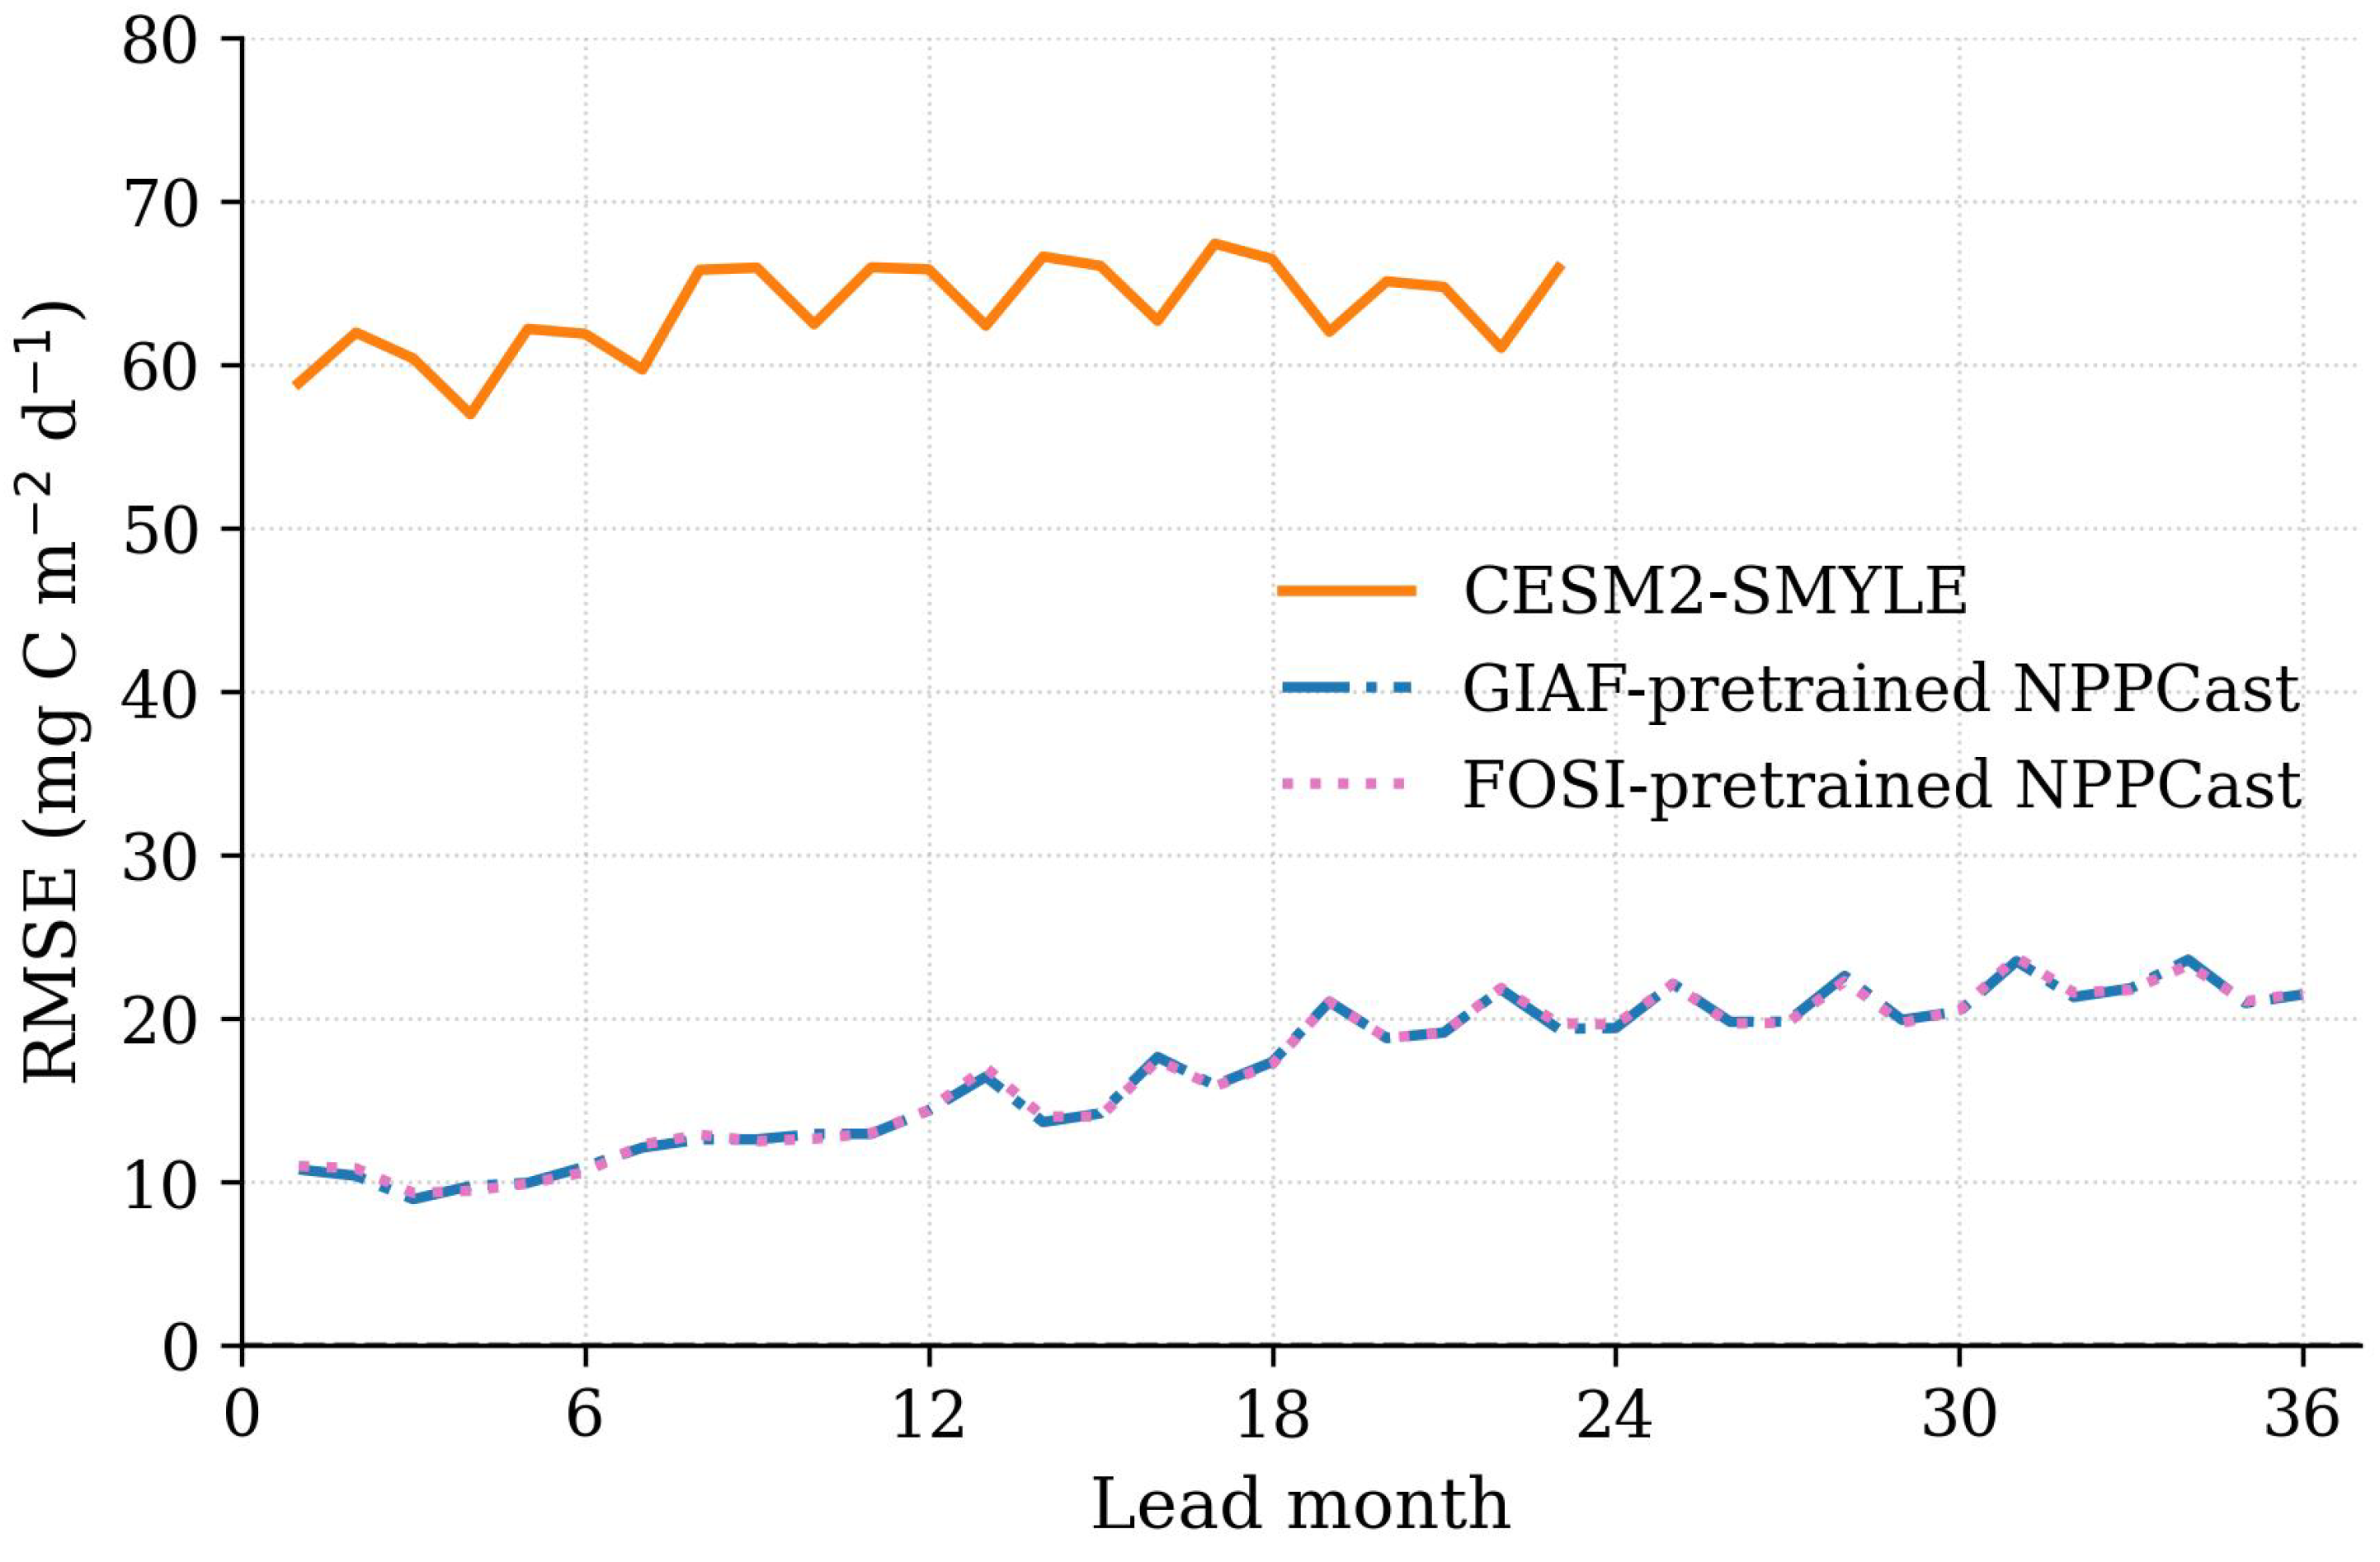
Appendix C. Attention-Gating Instability in Global Ocean NPP Forecasting
Appendix C.1. Phenomenology
Appendix C.2. Mechanistic Hypothesis: Attention-Gate Phase Locking
- Lead clustering: the failures concentrate near seasonal harmonics or offsets, a signature of phase misalignment rather than random noise.
- Zonal uniformity: at failure leads the RMSE band spans most latitudes, matching the global seasonal mode seen in the Hovmöller plots.
- Between–event behavior: AttUNet’s RMSE between dips is comparable to other UNets; the degradation is intermittent and gate-triggered, not a constant amplitude bias.
Appendix C.3. Evidence from AttUNet Outputs at Failure Leads
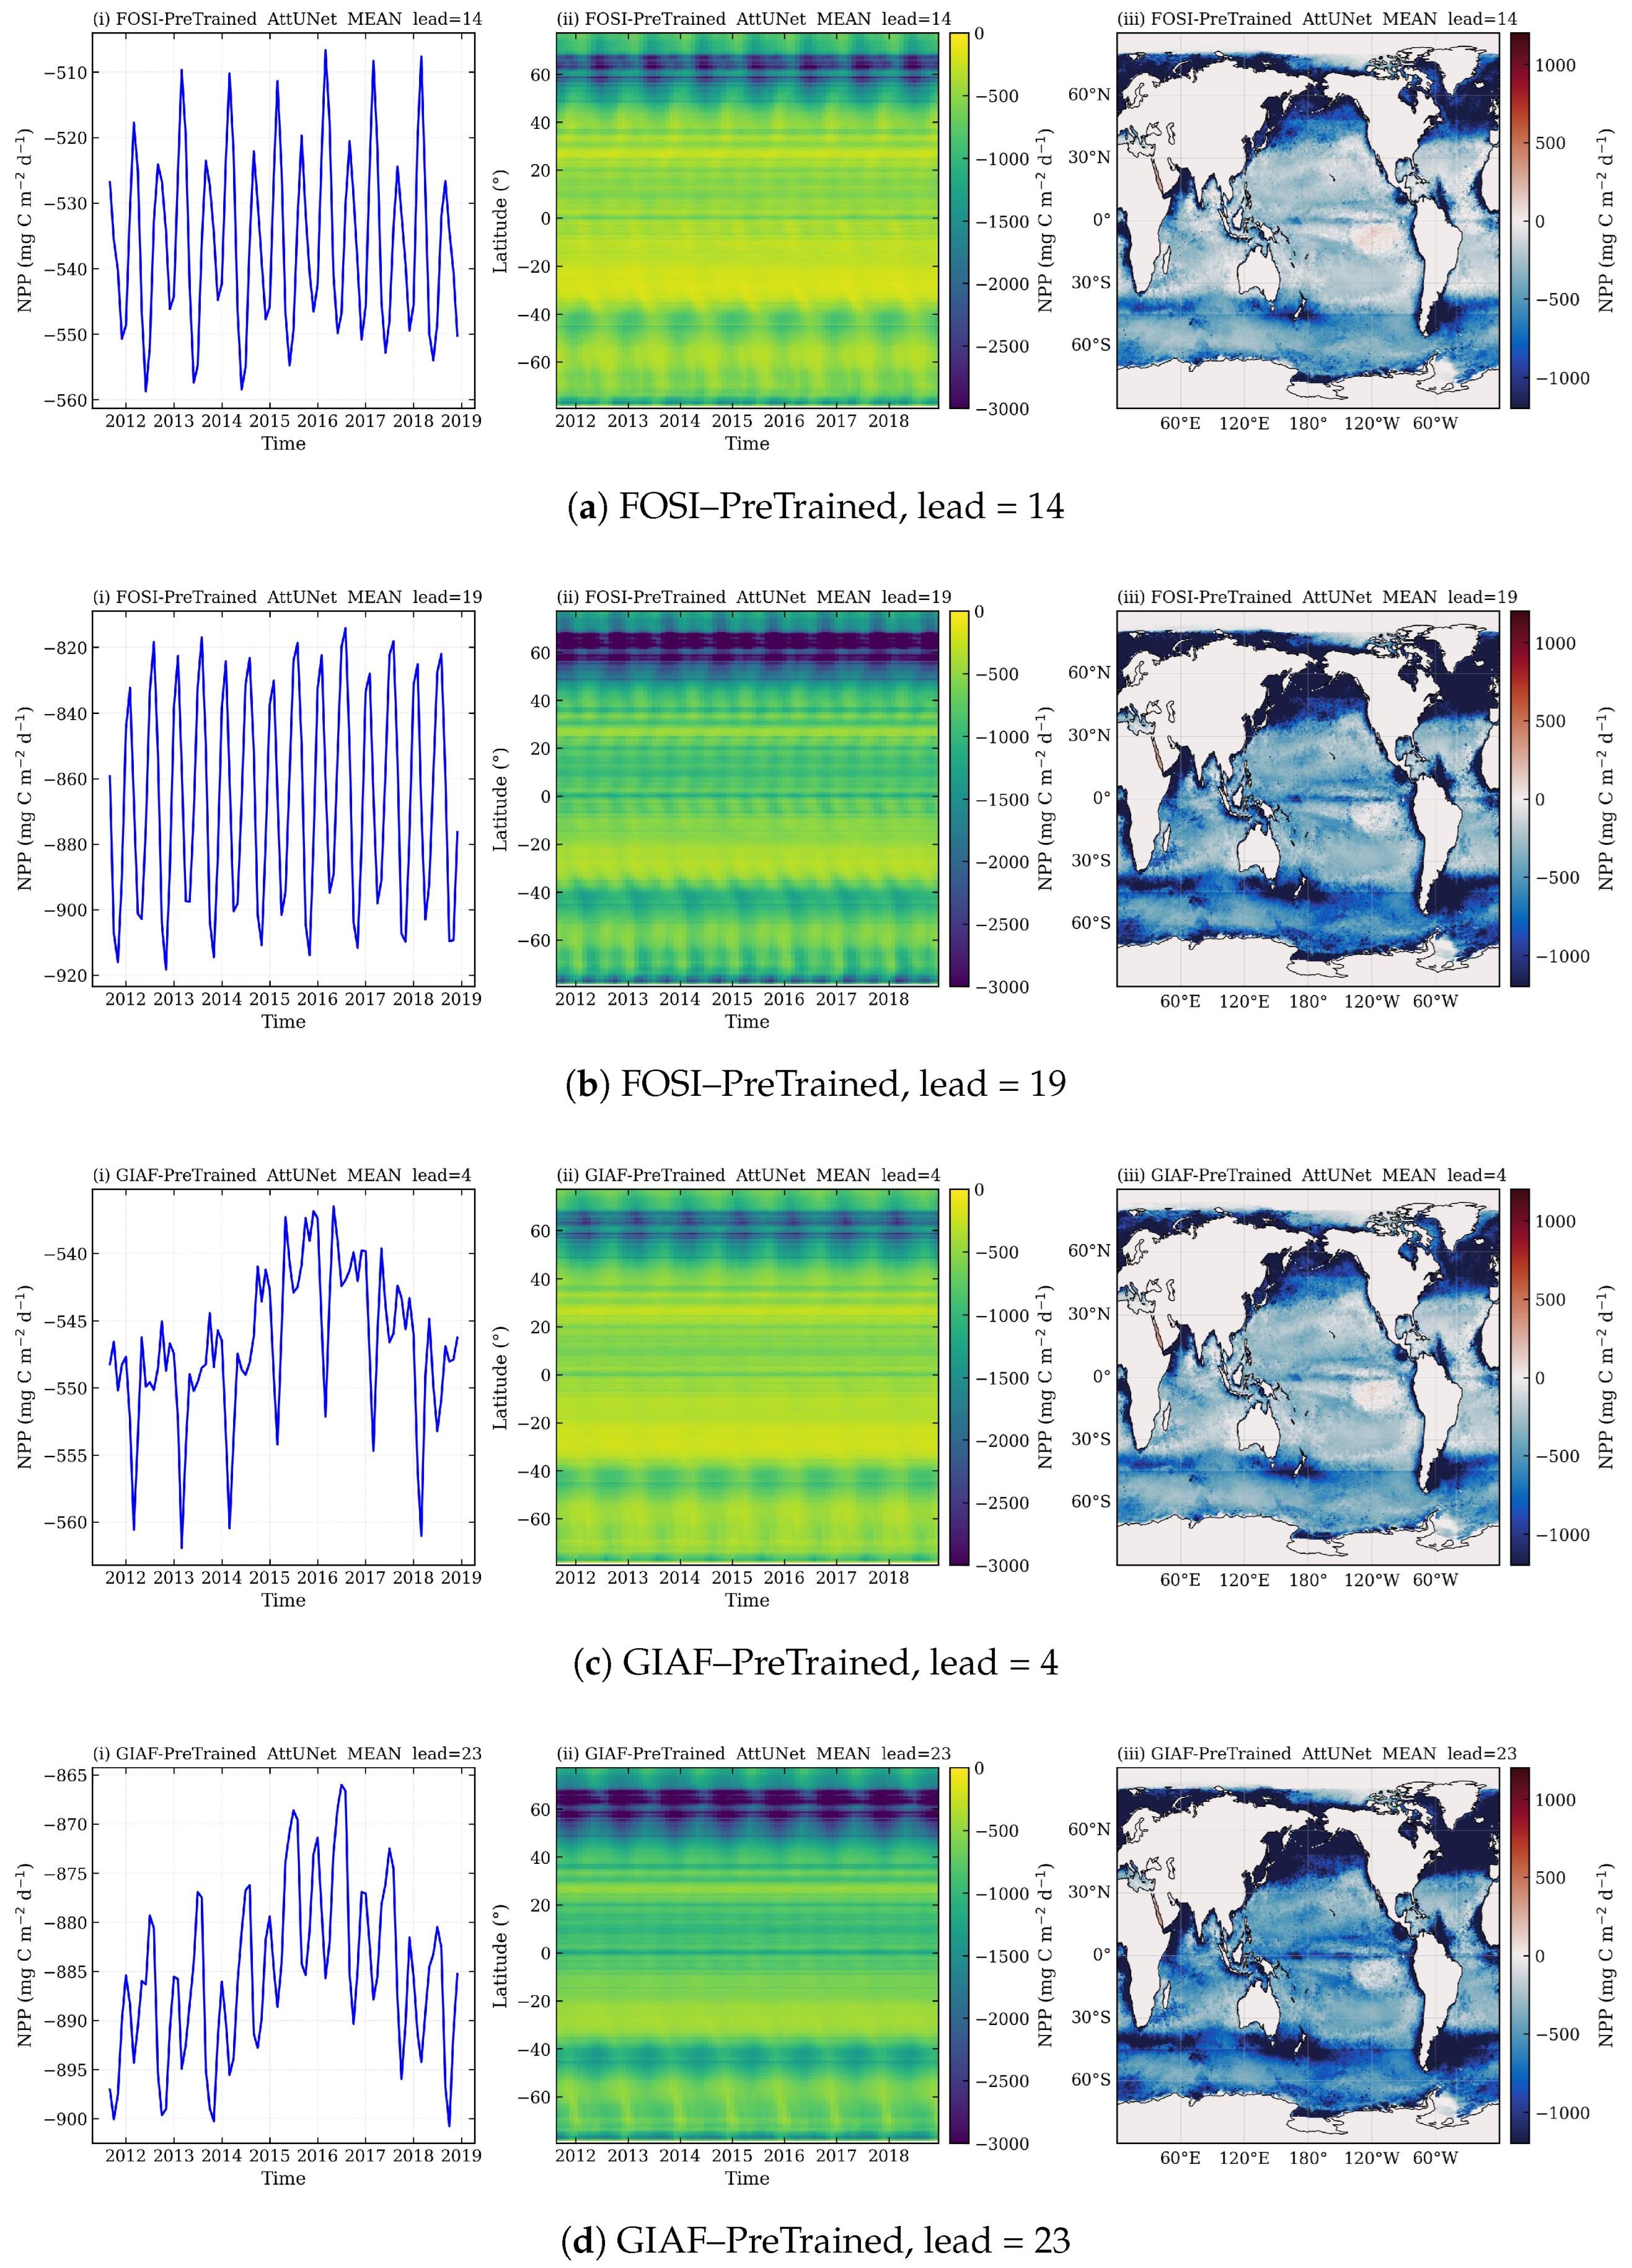

Appendix C.4. Why AttUNet Is Uniquely Vulnerable
Appendix D. Interpreting Negative R2 and a Positive-Only Sanity Check
Appendix D.1. Definition and Implication
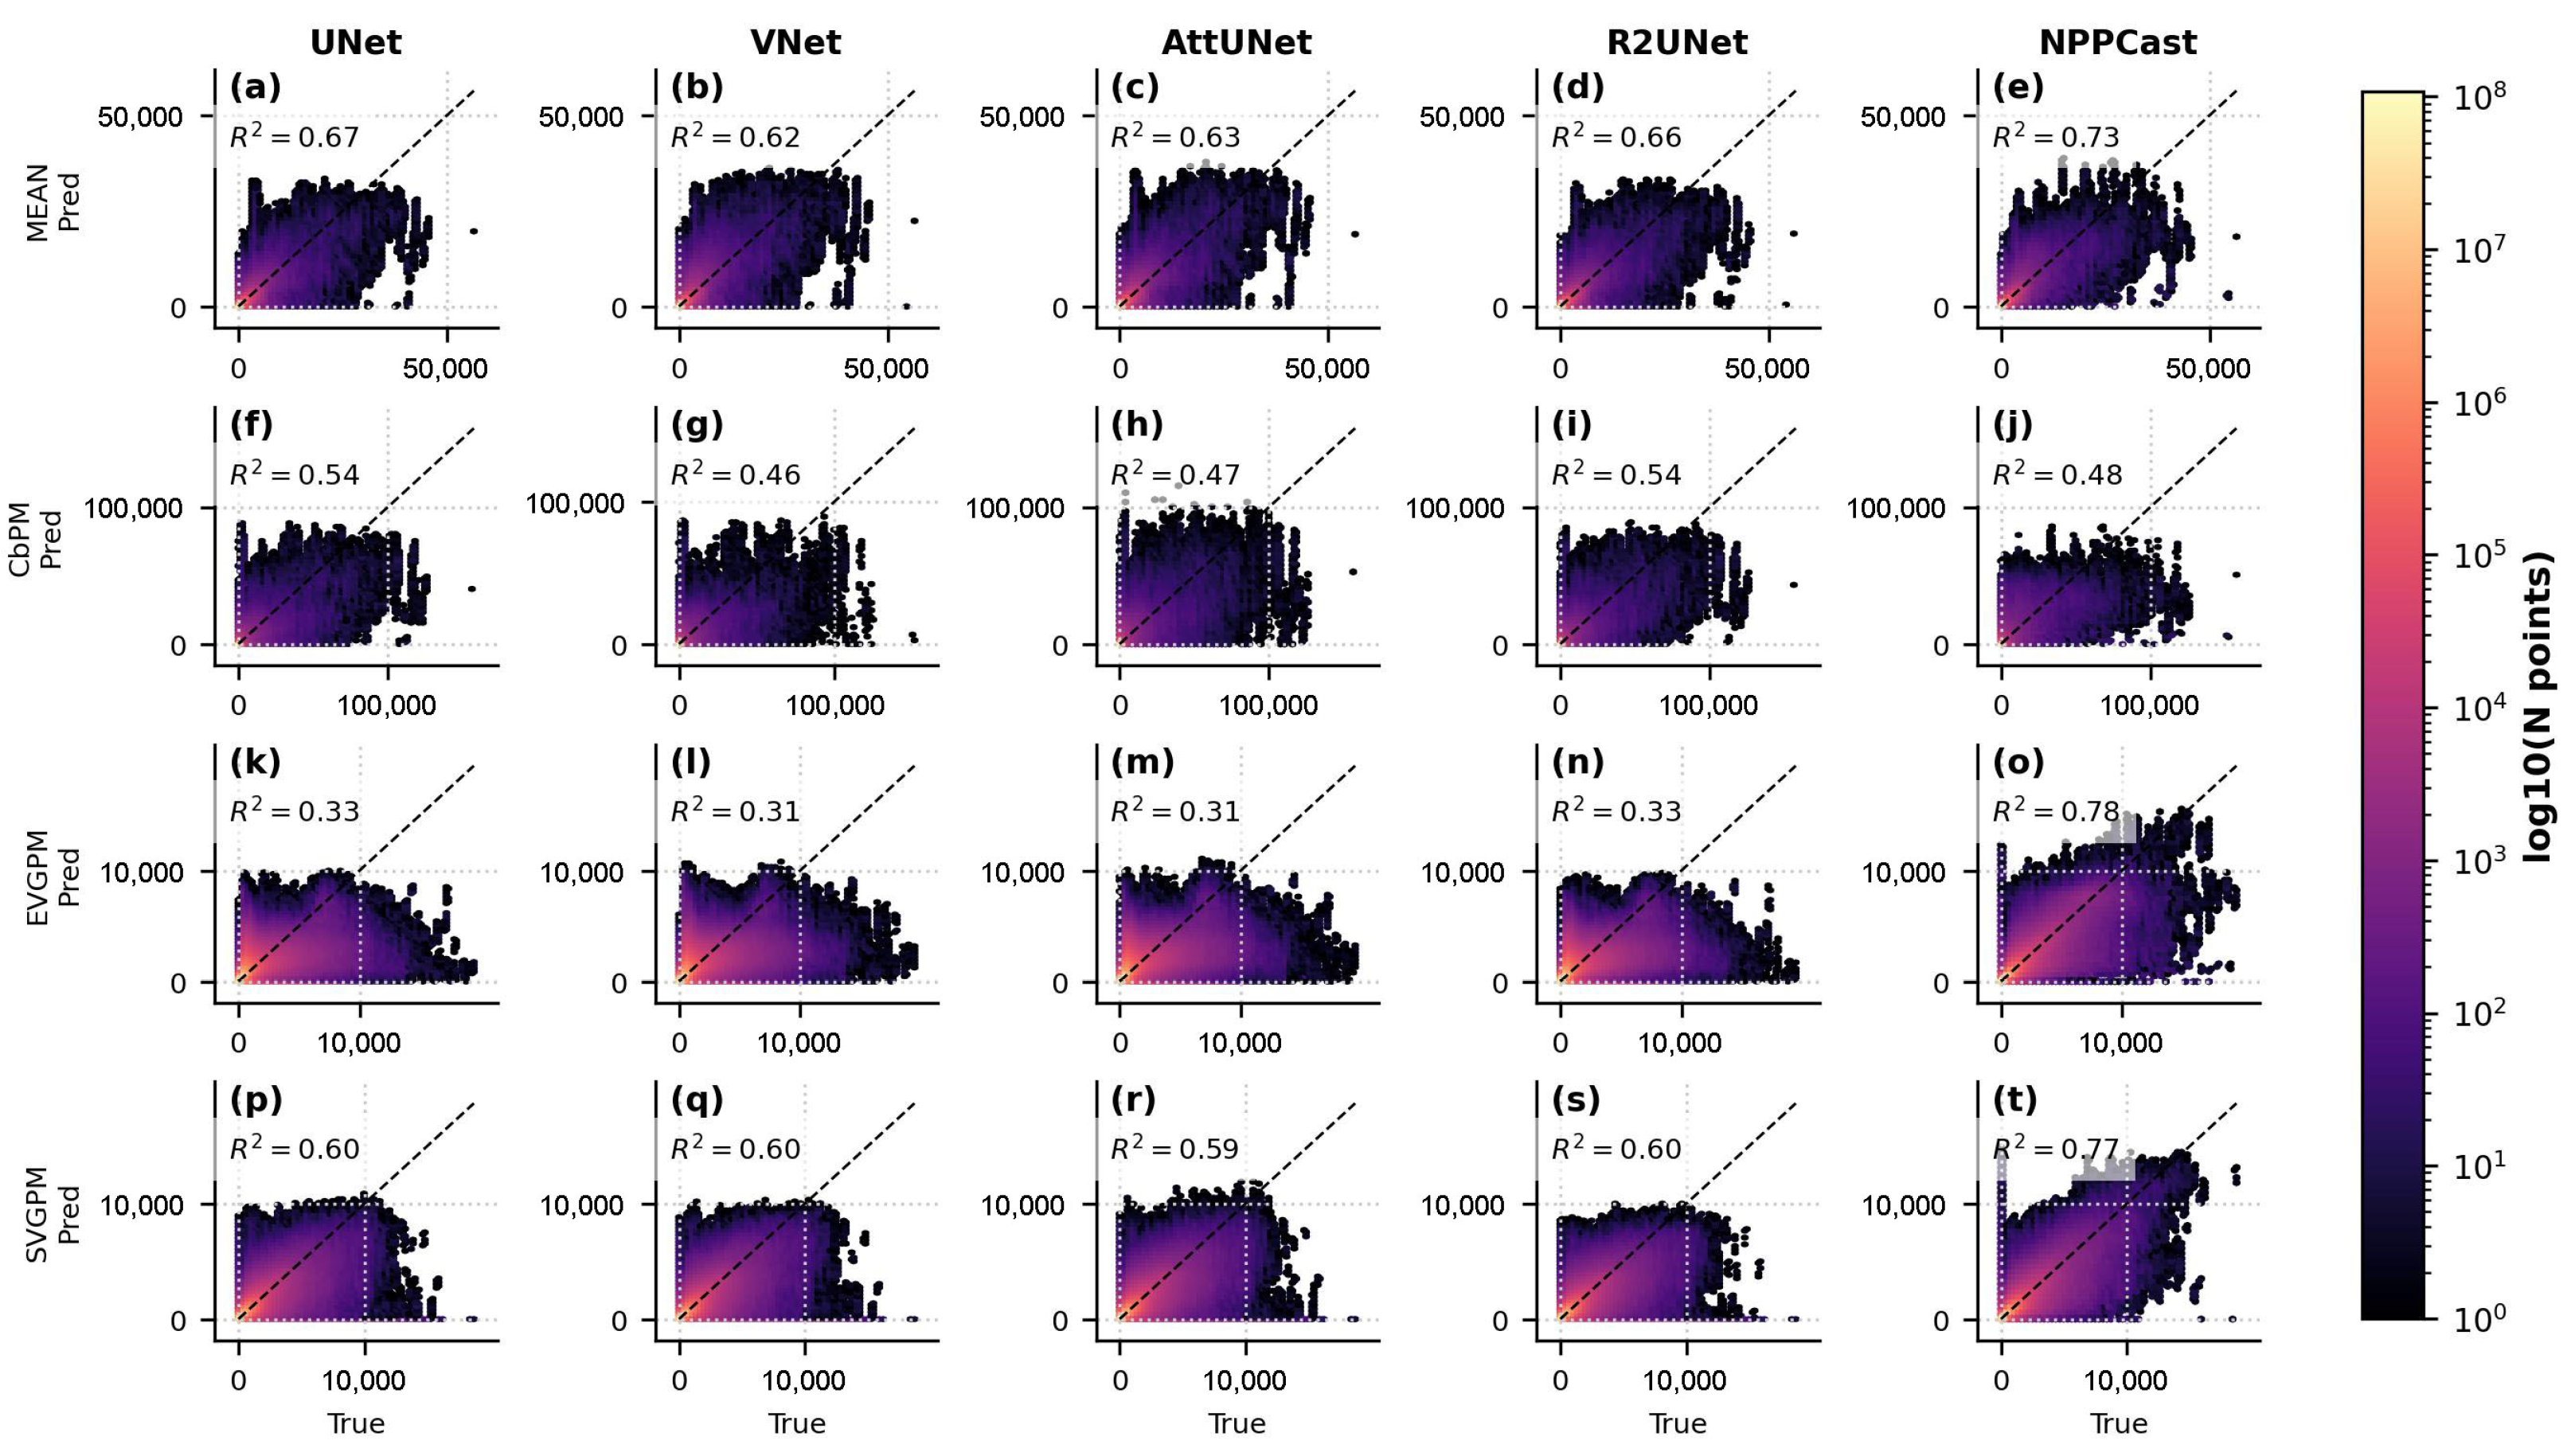
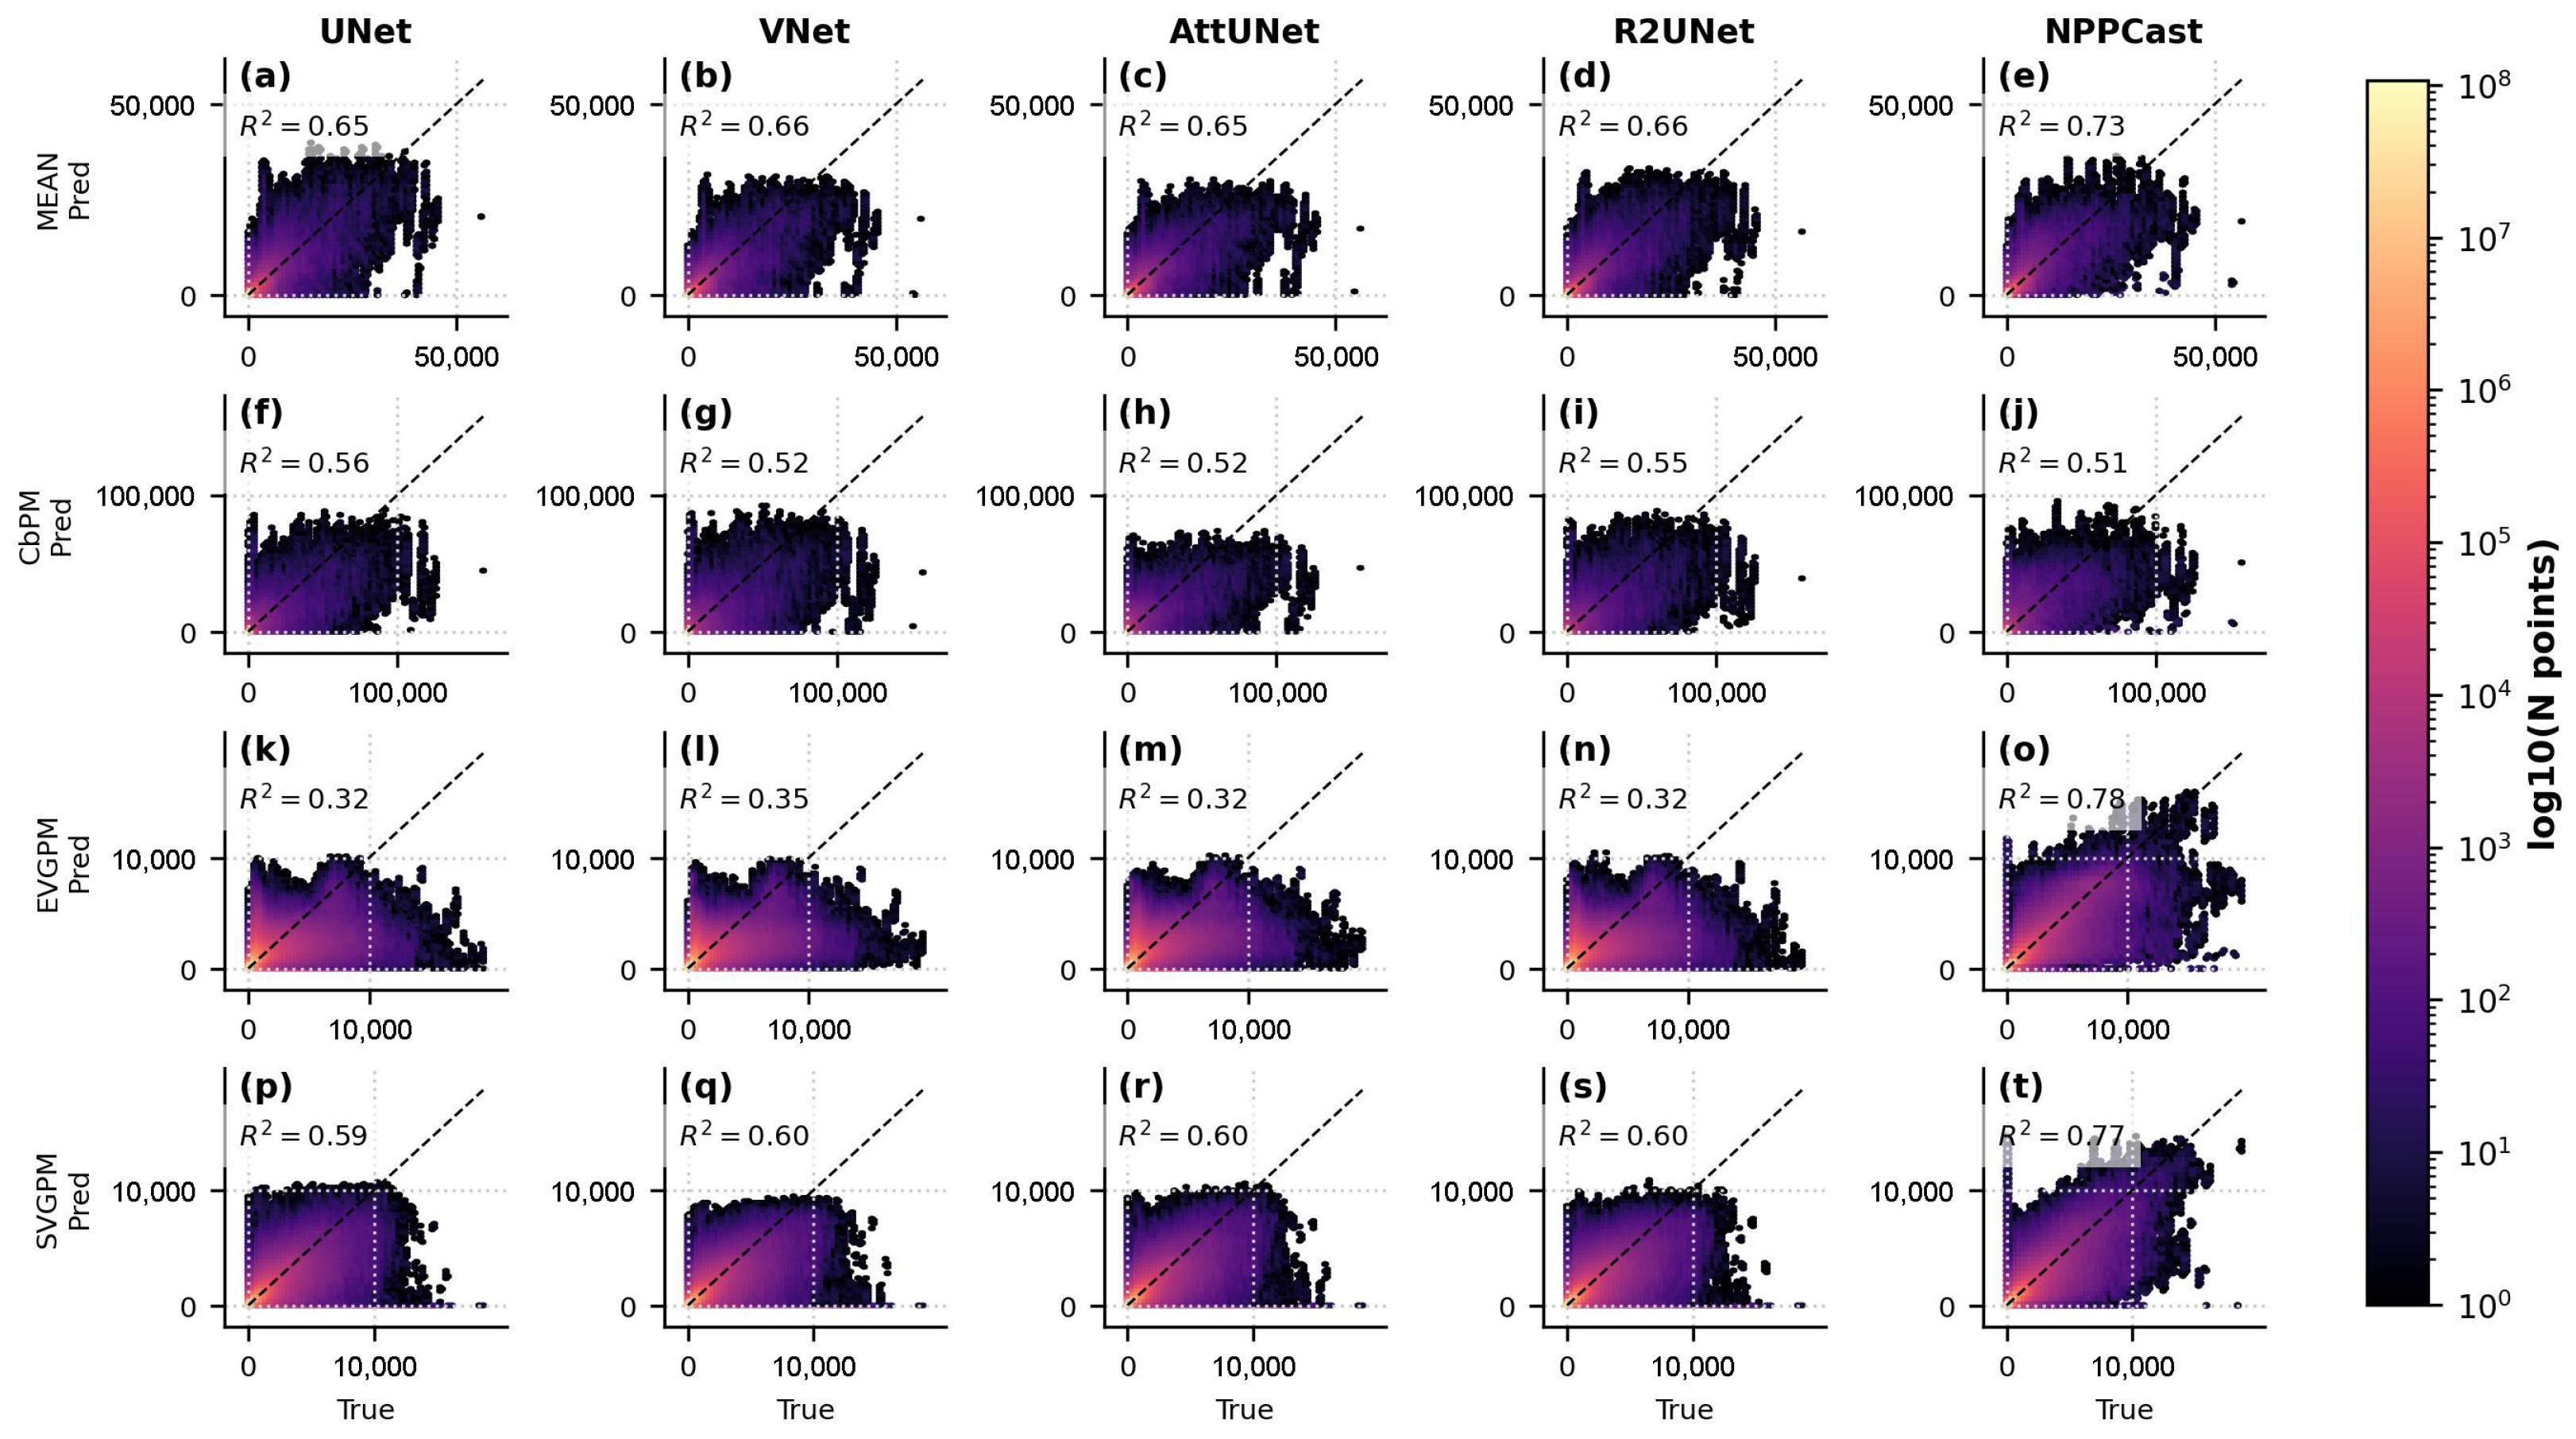
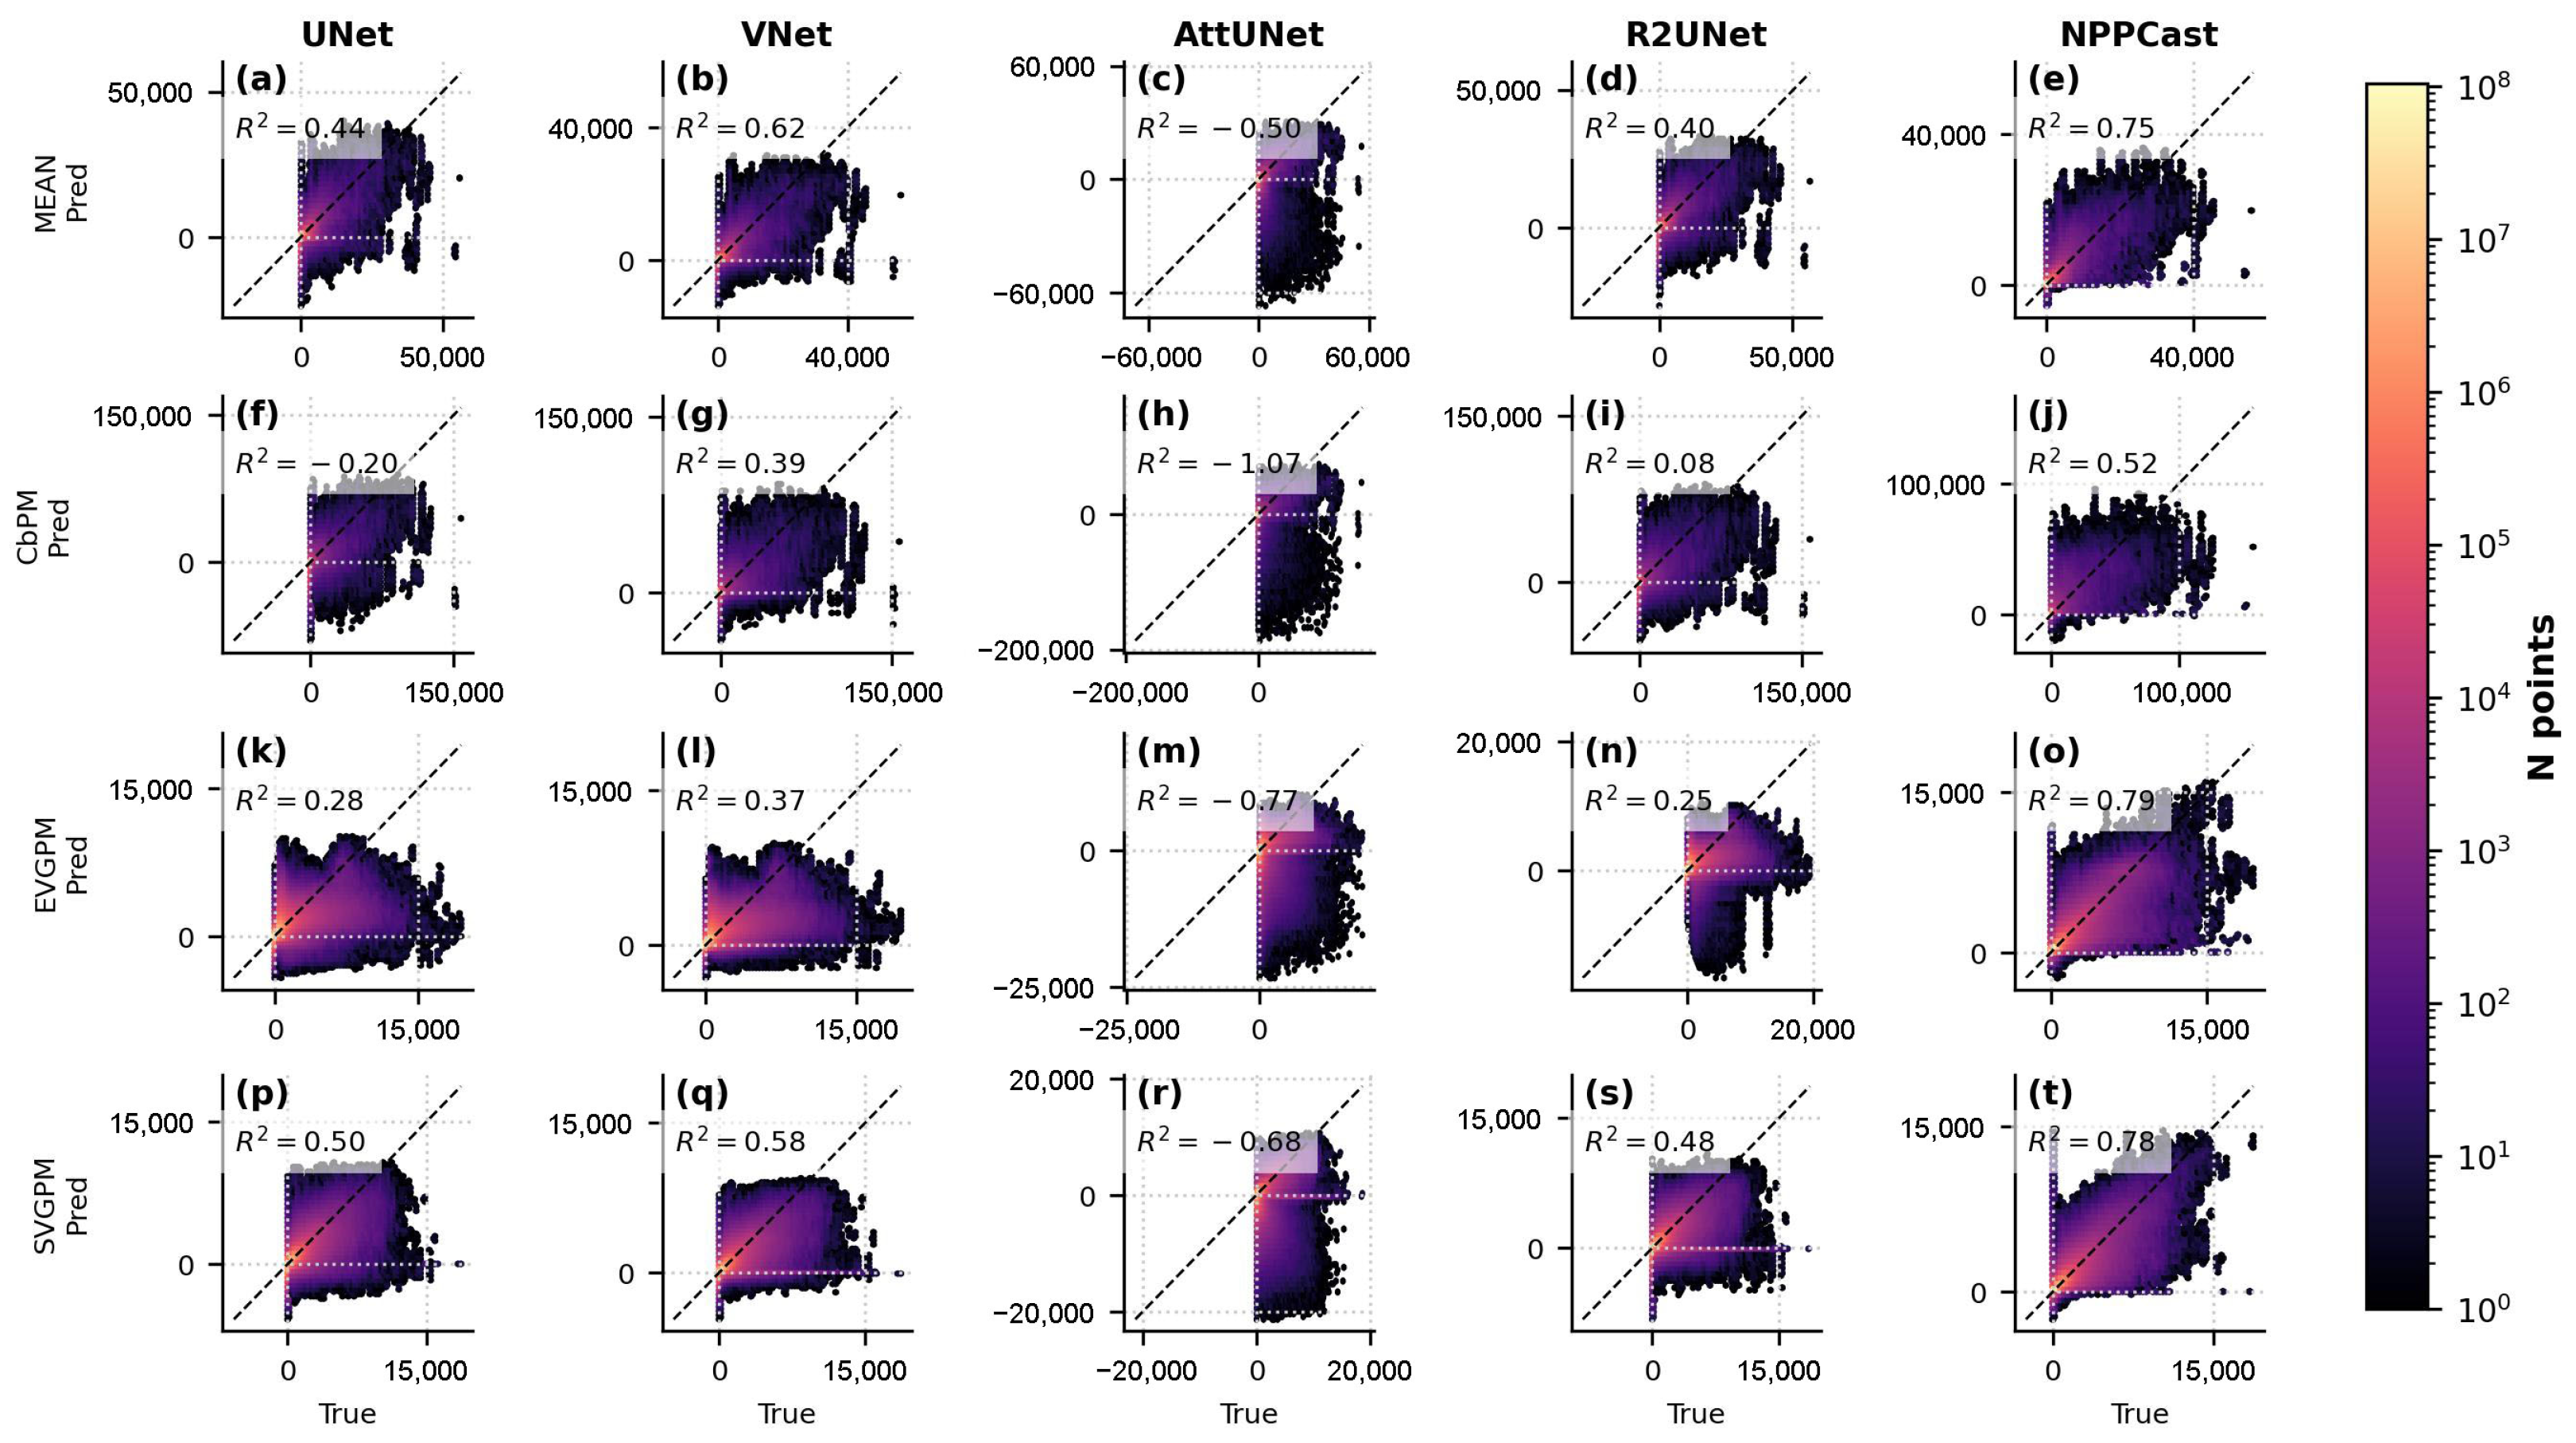
Appendix D.2. Visual Diagnosis from Scatter Plots
- UNet-family baselines (UNet, VNet, AttUNet, R2UNet) produce a non-trivial number of negative NPP predictions. These negatives inflate and directly explain the highly negative values (occasionally ) in the “keep-all” panels.
- NPPCast rarely yields negative outputs; removing negatives changes its only marginally. This stability aligns with the higher, positive reported across products.
Appendix E. Spatial Partitioning in NPPCast—Definition, Rationale, and G-Invariance
Appendix E.1. Setup and Notation
Appendix E.2. Partitioning Operator and Regional Construction
Appendix E.3. Objective and Loss Decomposition
Appendix E.4. Two Assumptions
- Channel-separable temporal core with permutation-equivariant mixing.
- Permutation invariance across channels: Re-indexing or re-grouping channels leaves the function class unchanged; the network receives the same set of per-pixel sequences regardless of how they are grouped during batching.
- Direct-sum structure: The global mapping can be written as a direct sum of identical local operators applied at all pixels. Partitioning the channels into different contiguous segments (changing G) does not alter this direct-sum operator; it only changes the data-loading bookkeeping.
- B.
- Local neighborhood rule independent of G.
Appendix E.5. Practical Implications and Choice of G in This Study
References
- Field, C.B.; Behrenfeld, M.J.; Randerson, J.T.; Falkowski, P. Primary production of the biosphere: Integrating terrestrial and oceanic components. Science 1998, 281, 237–240. [Google Scholar] [CrossRef]
- Kwon, E.Y.; Primeau, F.; Sarmiento, J.L. The impact of remineralization depth on the air–sea carbon balance. Nat. Geosci. 2009, 2, 630–635. [Google Scholar] [CrossRef]
- Stock, C.A.; John, J.G.; Rykaczewski, R.R.; Asch, R.G.; Cheung, W.W.; Dunne, J.P.; Friedland, K.D.; Lam, V.W.; Sarmiento, J.L.; Watson, R.A. Reconciling fisheries catch and ocean productivity. Proc. Natl. Acad. Sci. USA 2017, 114, E1441–E1449. [Google Scholar] [CrossRef]
- Behrenfeld, M.J.; Falkowski, P.G. Photosynthetic rates derived from satellite-based chlorophyll concentration. Limnol. Oceanogr. 1997, 42, 1–20. [Google Scholar] [CrossRef]
- Behrenfeld, M.J.; Boss, E.; Siegel, D.A.; Shea, D.M. Carbon-based ocean productivity and phytoplankton physiology from space. Glob. Biogeochem. Cycles 2005, 19, GB1006. [Google Scholar] [CrossRef]
- Westberry, T.; Behrenfeld, M.; Siegel, D.; Boss, E. Carbon-based primary productivity modeling with vertically resolved photoacclimation. Glob. Biogeochem. Cycles 2008, 22, GB2024. [Google Scholar] [CrossRef]
- Lee, Z.; Carder, K.; Marra, J.; Steward, R.; Perry, M. Estimating primary production at depth from remote sensing. Appl. Opt. 1996, 35, 463–474. [Google Scholar] [CrossRef]
- Behrenfeld, M.J.; O’Malley, R.T.; Siegel, D.A.; McClain, C.R.; Sarmiento, J.L.; Feldman, G.C.; Milligan, A.J.; Falkowski, P.G.; Letelier, R.M.; Boss, E.S. Climate-driven trends in contemporary ocean productivity. Nature 2006, 444, 752–755. [Google Scholar] [CrossRef]
- Laufkötter, C.; Vogt, M.; Gruber, N.; Aita-Noguchi, M.; Aumont, O.; Bopp, L.; Buitenhuis, E.; Doney, S.C.; Dunne, J.; Hashioka, T.; et al. Drivers and uncertainties of future global marine primary production in marine ecosystem models. Biogeosciences 2015, 12, 6955–6984. [Google Scholar] [CrossRef]
- Moore, C.; Mills, M.; Arrigo, K.; Berman-Frank, I.; Bopp, L.; Boyd, P.; Galbraith, E.; Geider, R.; Guieu, C.; Jaccard, S.; et al. Processes and patterns of oceanic nutrient limitation. Nat. Geosci. 2013, 6, 701–710. [Google Scholar] [CrossRef]
- Séférian, R.; Bopp, L.; Gehlen, M.; Swingedouw, D.; Mignot, J.; Guilyardi, E.; Servonnat, J. Multiyear predictability of tropical marine productivity. Proc. Natl. Acad. Sci. USA 2014, 111, 11646–11651. [Google Scholar] [CrossRef]
- Krumhardt, K.M.; Lovenduski, N.S.; Long, M.C.; Luo, J.; Lindsay, K.; Yeager, S.; Harrison, C. Potential predictability of net primary production in the ocean. Glob. Biogeochem. Cycles 2020, 34, e2020GB006531. [Google Scholar] [CrossRef]
- Frölicher, T.L.; Ramseyer, L.; Raible, C.C.; Rodgers, K.B.; Dunne, J. Potential predictability of marine ecosystem drivers. Biogeosciences 2020, 17, 2061–2083. [Google Scholar] [CrossRef]
- Park, J.Y.; Stock, C.A.; Dunne, J.P.; Yang, X.; Rosati, A. Seasonal to multiannual marine ecosystem prediction with a global Earth system model. Science 2019, 365, 284–288. [Google Scholar] [CrossRef]
- Tagliabue, A.; Kwiatkowski, L.; Bopp, L.; Butenschön, M.; Cheung, W.; Lengaigne, M.; Vialard, J. Persistent uncertainties in ocean net primary production climate change projections at regional scales raise challenges for assessing impacts on ecosystem services. Front. Clim. 2021, 3, 738224. [Google Scholar] [CrossRef]
- Wu, X.; Yeager, S.G.; Deser, C.; Rosenbloom, N.; Meehl, G.A. Volcanic forcing degrades multiyear-to-decadal prediction skill in the tropical Pacific. Sci. Adv. 2023, 9, eadd9364. [Google Scholar] [CrossRef]
- Ford, D.; Edwards, K.; Lea, D.; Barciela, R.; Martin, M.; Demaria, J. Assimilating GlobColour ocean colour data into a pre-operational physical-biogeochemical model. Ocean. Sci. 2012, 8, 751–771. [Google Scholar] [CrossRef]
- Yeager, S.; Danabasoglu, G.; Rosenbloom, N.; Strand, W.; Bates, S.; Meehl, G.; Karspeck, A.; Lindsay, K.; Long, M.; Teng, H.; et al. Predicting near-term changes in the earth system: A large ensemble of initialized decadal prediction simulations using the community earth system model. Bull. Am. Meteorol. Soc. 2018, 99, 1867–1886. [Google Scholar] [CrossRef]
- Webster, P.J.; Yang, S. Monsoon and ENSO: Selectively interactive systems. Q. J. R. Meteorol. Soc. 1992, 118, 877–926. [Google Scholar] [CrossRef]
- Levine, A.F.; McPhaden, M.J. The annual cycle in ENSO growth rate as a cause of the spring predictability barrier. Geophys. Res. Lett. 2015, 42, 5034–5041. [Google Scholar] [CrossRef]
- Qi, Q.; Duan, W.; Xu, H. The most sensitive initial error modes modulating intensities of CP-and EP-El Niño events. Dyn. Atmos. Ocean. 2021, 96, 101257. [Google Scholar] [CrossRef]
- Boschetti, F.; Feng, M.; Hartog, J.R.; Hobday, A.J.; Zhang, X. Sea surface temperature predictability assessment with an ensemble machine learning method using climate model simulations. Deep. Sea Res. Part II Top. Stud. Oceanogr. 2023, 210, 105308. [Google Scholar] [CrossRef]
- Reichstein, M.; Camps-Valls, G.; Stevens, B.; Jung, M.; Denzler, J.; Carvalhais, N.; Prabhat, F. Deep learning and process understanding for data-driven Earth system science. Nature 2019, 566, 195–204. [Google Scholar] [CrossRef]
- Shen, Z.; Sun, Q.; Lu, X.; Ling, F.; Li, Y.; Wu, J.; Luo, J.J.; Yuan, C. Current Progress in Subseasonal-to-Decadal Prediction based on Machine Learning. Appl. Comput. Geosci. 2024, 24, 100201. [Google Scholar] [CrossRef]
- Ren, J.; Wang, C.; Sun, L.; Huang, B.; Zhang, D.; Mu, J.; Wu, J. Prediction of sea surface temperature using U-Net based model. Remote Sens. 2024, 16, 1205. [Google Scholar] [CrossRef]
- Ji, X.; Song, X.; Guo, A.; Liu, K.; Cao, H.; Feng, T. Oceanic Precipitation Nowcasting Using a UNet-Based Residual and Attention Network and Real-Time Himawari-8 Images. Remote Sens. 2024, 16, 2871. [Google Scholar] [CrossRef]
- Mohammed, A. ResAttUNet: Detecting marine debris using an attention activated residual UNet. arXiv 2022, arXiv:2210.08506. [Google Scholar] [CrossRef]
- Jamali, A.; Roy, S.K.; Beni, L.H.; Pradhan, B.; Li, J.; Ghamisi, P. Residual wave vision U-Net for flood mapping using dual polarization Sentinel-1 SAR imagery. Int. J. Appl. Earth Obs. Geoinf. 2024, 127, 103662. [Google Scholar] [CrossRef]
- Putra, D.P.; Hsu, P.C. Leveraging Transfer Learning and U-Nets Method for Improved Gap Filling in Himawari Sea Surface Temperature Data Adjacent to Taiwan. ISPRS Int. J.-Geo-Inf. 2024, 13, 162. [Google Scholar] [CrossRef]
- Wang, Y.; Zhang, Y.; Wang, G. Impact of physical and attention mechanisms on U-Net for SST forecasting. Intell. Mar. Technol. Syst. 2024, 2, 11. [Google Scholar] [CrossRef]
- Tsujino, H.; Urakawa, S.; Nakano, H.; Small, R.J.; Kim, W.M.; Yeager, S.G.; Danabasoglu, G.; Suzuki, T.; Bamber, J.L.; Bentsen, M.; et al. JRA-55 based surface dataset for driving ocean–sea-ice models (JRA55-do). Ocean. Model. 2018, 130, 79–139. [Google Scholar] [CrossRef]
- Yeager, S.G.; Rosenbloom, N.; Glanville, A.A.; Wu, X.; Simpson, I.; Li, H.; Molina, M.J.; Krumhardt, K.; Mogen, S.; Lindsay, K.; et al. The seasonal-to-multiyear large ensemble (SMYLE) prediction system using the Community Earth System Model version 2. Geosci. Model Dev. 2022, 15, 6451–6493. [Google Scholar] [CrossRef]
- Eppley, R.W. Temperature and phytoplankton growth in the sea. Fish. Bull. 1971, 70, 1063. [Google Scholar]
- Morel, A. Light and marine photosynthesis: A spectral model with geochemical and climatological implications. Prog. Oceanogr. 1991, 26, 263–306. [Google Scholar] [CrossRef]
- Wu, H.; Hu, T.; Liu, Y.; Zhou, H.; Wang, J.; Long, M. Timesnet: Temporal 2d-variation modeling for general time series analysis. arXiv 2022, arXiv:2210.02186. [Google Scholar] [CrossRef]
- Jeon, W.; Park, J.Y.; Stock, C.A.; Dunne, J.P.; Yang, X.; Rosati, A. Mechanisms driving ESM-based marine ecosystem predictive skill on the east African coast. Environ. Res. Lett. 2022, 17, 084004. [Google Scholar] [CrossRef]
- Racault, M.F.; Le Quéré, C.; Buitenhuis, E.; Sathyendranath, S.; Platt, T. Phytoplankton phenology in the global ocean. Ecol. Indic. 2012, 14, 152–163. [Google Scholar] [CrossRef]
- Li, Z.; Wu, B.; Yin, Z.; Chen, R.; Wang, S. Analysis Code and Dataset for “Beyond UNets: A Compact Architecture Outperforms Encoder–Decoder CNNs in Global Ocean NPP Forecasts”; Zenodo: Geneva, Switzerland, 2025. [Google Scholar] [CrossRef]
- Chicco, D.; Warrens, M.J.; Jurman, G. The coefficient of determination R-squared is more informative than SMAPE, MAE, MAPE, MSE and RMSE in regression analysis evaluation. Peerj Comput. Sci. 2021, 7, e623. [Google Scholar] [CrossRef]

| Dataset | Source | Period | Grid | Purpose |
|---|---|---|---|---|
| CESM2-FOSI | CESM2 BGC initialization | 1958–2020 | 384 × 320 | Pre-training |
| CESM2-GIAF | CESM2 BGC initialization | 1958–2018 | 384 × 320 | Pre-training |
| CESM2-SMYLE | CESM2 BGC output | 1970–2019 | 384 × 320 | Comparison |
| CbPM | SeaWiFS + MODIS | 1998–2021 | 384 × 320 | Fine-tune/test |
| EVGPM | SeaWiFS + MODIS | 1998–2021 | 384 × 320 | Fine-tune/test |
| SVGPM | SeaWiFS + MODIS | 1998–2021 | 384 × 320 | Fine-tune/test |
| MEAN | (CbPM + EVGPM + SVGPM)/3 | 1998–2021 | 384 × 320 | Fine-tune/test |
| Metric | Formula | Description |
|---|---|---|
| RMSE (Root Mean Square Error) | Lower values indicate better overall accuracy. | |
| MAE (Mean Absolute Error) | Lower values indicate better accuracy. | |
| ACC (Anomaly Correlation Coefficient) | Higher values (closer to 1) indicate stronger correlation with observations. | |
| NSE (Nash–Sutcliffe Efficiency) | Values closer to 1 indicate better predictive performance. | |
| SSIM (Structural Similarity Index) | Higher values (up to 1) indicate greater structural similarity. |
| Product | Model | FOSI-PreTrained | GIAF-PreTrained | ||||||||
|---|---|---|---|---|---|---|---|---|---|---|---|
| RMSE | MAE | ACC | NSE | SSIM | RMSE | MAE | ACC | NSE | SSIM | ||
| MEAN | UNet | 24.71 | 19.99 | 0.18 | −0.53 | 0.97 | 27.14 | 21.98 | 0.15 | −0.86 | 0.95 |
| VNet | 24.79 | 19.99 | 0.09 | −0.54 | 0.97 | 30.25 | 24.7 | 0.26 | −1.31 | 0.98 | |
| AttUNet | 84.31 | 80.04 | 0.19 | −164.77 | 0.90 | 101.78 | 97.39 | 0.24 | −213.73 | 0.86 | |
| R2UNet | 28.36 | 23.05 | 0.18 | −1.02 | 0.97 | 34.32 | 28.23 | 0.16 | −2.03 | 0.94 | |
| NPPCast | 17.22 | 14.10 | 0.57 | 0.27 | 1.00 | 17.22 | 14.17 | 0.58 | 0.27 | 1.00 | |
| CbPM | UNet | 34.10 | 25.86 | −0.05 | −0.54 | 0.98 | 46.91 | 37.32 | −0.10 | −2.17 | 0.96 |
| VNet | 65.70 | 58.90 | 0.19 | −7.18 | 0.97 | 38.38 | 29.68 | −0.06 | −1.16 | 0.98 | |
| AttUNet | 115.08 | 107.78 | −0.01 | −151.14 | 0.90 | 147.99 | 140.03 | −0.12 | −259.50 | 0.87 | |
| R2UNet | 43.96 | 34.56 | −0.16 | −1.79 | 0.98 | 52.88 | 42.28 | −0.12 | −3.17 | 0.97 | |
| NPPCast | 36.31 | 31.38 | 0.19 | −0.66 | 1.00 | 37.10 | 32.11 | 0.20 | −0.74 | 1.00 | |
| EVGPM | UNet | 41.95 | 37.65 | 0.19 | −4.19 | 0.89 | 33.61 | 29.10 | 0.13 | −2.35 | 0.84 |
| VNet | 31.62 | 26.44 | 0.34 | −2.02 | 0.87 | 31.84 | 27.53 | 0.25 | −1.89 | 0.89 | |
| AttUNet | 105.42 | 101.59 | 0.22 | −180.48 | 0.80 | 118.26 | 114.11 | 0.29 | −260.71 | 0.77 | |
| R2UNet | 43.85 | 38.97 | 0.05 | −4.47 | 0.88 | 39.73 | 34.88 | 0.03 | −3.58 | 0.84 | |
| NPPCast | 14.05 | 11.57 | 0.79 | 0.45 | 0.99 | 14.06 | 11.52 | 0.78 | 0.44 | 0.99 | |
| SVGPM | UNet | 24.97 | 20.26 | 0.46 | −0.33 | 0.95 | 35.57 | 30.21 | 0.45 | −1.76 | 0.90 |
| VNet | 30.13 | 24.47 | 0.39 | −0.95 | 0.93 | 32.25 | 27.03 | 0.48 | −1.27 | 0.95 | |
| AttUNet | 85.64 | 81.34 | 0.43 | −144.65 | 0.87 | 114.99 | 110.37 | 0.43 | −214.69 | 0.81 | |
| R2UNet | 31.94 | 26.41 | 0.43 | −1.23 | 0.93 | 35.28 | 29.51 | 0.44 | −1.70 | 0.90 | |
| NPPCast | 15.23 | 12.14 | 0.81 | 0.50 | 0.99 | 15.25 | 12.10 | 0.81 | 0.49 | 0.99 | |
| Product | FOSI-PreTrained | GIAF-PreTrained | ||
|---|---|---|---|---|
| ACC | RMSE (%) | ACC | RMSE (%) | |
| MEAN | 0.38 | 30.33 | 0.32 | 36.55 |
| CbPM | 0.00 | −6.49 | 0.26 | 3.33 |
| EVGPM | 0.44 | 55.57 | 0.49 | 55.84 |
| SVGPM | 0.35 | 39.00 | 0.33 | 52.70 |
| Product | Model | ACC | RMSE | MAE | NSE | SSIM |
|---|---|---|---|---|---|---|
| MEAN | UNet | −13.59 | 9.83 | 9.96 | 62.19 | −2.34 |
| VNet | 193.14 | 22.03 | 23.56 | 142.68 | 0.30 | |
| AttUNet | 27.01 | 20.72 | 21.68 | 29.72 | −3.64 | |
| R2UNet | −6.58 | 21.01 | 22.50 | 99.27 | −2.42 | |
| NPPCast | 1.75 | 0.02 | 0.52 | −0.13 | 0.00 | |
| CbPM | UNet | 88.84 | 37.57 | 44.33 | 299.20 | −2.11 |
| VNet | −131.48 | −41.59 | −49.61 | −83.89 | 1.85 | |
| AttUNet | 843.79 | 28.60 | 29.92 | 71.69 | −2.99 | |
| R2UNet | −21.86 | 20.31 | 22.32 | 77.44 | −1.15 | |
| NPPCast | 4.17 | 2.17 | 2.33 | 11.75 | 0.00 | |
| EVGPM | UNet | −29.80 | −19.87 | −22.73 | −43.99 | −4.89 |
| VNet | −25.64 | 0.68 | 4.14 | −6.16 | 2.41 | |
| AttUNet | 32.86 | 12.18 | 12.32 | 44.46 | −4.72 | |
| R2UNet | −47.87 | −9.38 | −10.49 | −19.91 | −3.91 | |
| NPPCast | −0.31 | 0.08 | −0.41 | −0.15 | 0.01 | |
| SVGPM | UNet | −2.88 | 42.48 | 49.16 | 430.85 | −5.72 |
| VNet | 23.59 | 7.04 | 10.44 | 34.01 | 1.88 | |
| AttUNet | 1.89 | 34.27 | 35.69 | 48.42 | −6.26 | |
| R2UNet | 3.10 | 10.44 | 11.75 | 37.31 | −3.42 | |
| NPPCast | 0.66 | 0.16 | −0.40 | −0.20 | 0.01 |
Disclaimer/Publisher’s Note: The statements, opinions and data contained in all publications are solely those of the individual author(s) and contributor(s) and not of MDPI and/or the editor(s). MDPI and/or the editor(s) disclaim responsibility for any injury to people or property resulting from any ideas, methods, instructions or products referred to in the content. |
© 2025 by the authors. Licensee MDPI, Basel, Switzerland. This article is an open access article distributed under the terms and conditions of the Creative Commons Attribution (CC BY) license (https://creativecommons.org/licenses/by/4.0/).
Share and Cite
Li, Z.; Wu, B.; Yin, Z.; Chen, R.; Wang, S. NPPCast: A Compact CNN Integrating Satellite Data for Global Ocean Net Primary Production Forecasts. Remote Sens. 2025, 17, 3806. https://doi.org/10.3390/rs17233806
Li Z, Wu B, Yin Z, Chen R, Wang S. NPPCast: A Compact CNN Integrating Satellite Data for Global Ocean Net Primary Production Forecasts. Remote Sensing. 2025; 17(23):3806. https://doi.org/10.3390/rs17233806
Chicago/Turabian StyleLi, Zeming, Bizhi Wu, Ziqi Yin, Ruiying Chen, and Shanlin Wang. 2025. "NPPCast: A Compact CNN Integrating Satellite Data for Global Ocean Net Primary Production Forecasts" Remote Sensing 17, no. 23: 3806. https://doi.org/10.3390/rs17233806
APA StyleLi, Z., Wu, B., Yin, Z., Chen, R., & Wang, S. (2025). NPPCast: A Compact CNN Integrating Satellite Data for Global Ocean Net Primary Production Forecasts. Remote Sensing, 17(23), 3806. https://doi.org/10.3390/rs17233806


