1. Introduction
Mineral dust aerosols are one of the dominant components of the global aerosol system and have important impacts on the Earth’s climate. By scattering and absorbing solar and terrestrial radiation, mineral dust exerts a direct radiative effect that can cause either atmospheric cooling or warming, depending on its size distribution, composition, and vertical profile. In addition, dust serves as ice nucleating particles (INPs) and cloud condensation nuclei (CCN), influencing cloud formation, lifetime, and precipitation processes [
1,
2,
3,
4]. However, large uncertainties remain in current climate simulations, primarily because the scattering properties of dust depend on its particle size, shape, and complex refractive index (CRI). Sensitivity analyses have shown that uncertainties in describing the coarse particle fraction or in specifying the absorption characteristics of dust can lead to significant deviations in the simulated direct radiative forcing, particularly under strong dust loading conditions [
5,
6].
Polarization lidar has become one of the most powerful techniques for detecting and characterizing mineral dust in the atmosphere. By measuring the polarization state of backscattered light, polarization lidar can directly reveal the nonsphericity of dust particles and thus distinguish them from nearly spherical aerosols such as sulfate, sea salt, or pollution [
7,
8,
9]. The particle linear depolarization ratio (PLDR), defined as the ratio of the cross-polarized to co-polarized component of the backscattered signal, is widely used to identify and classify nonspherical aerosol types.
Field campaigns employing advanced multi-wavelength polarization lidars have revealed that pure mineral dust typically exhibits high PLDR, typically around 0.25–0.35 at 532 nm [
10,
11]. Multi-wavelength polarization lidar systems further enhance this capability by simultaneously measuring depolarization at 355, 532, and 1064 nm, allowing the spectral dependence of PLDR to be analyzed [
12,
13]. These multi-wavelength observations provide additional constraints on particle microphysical properties, as shorter wavelengths are more sensitive to fine mode particles, while longer wavelengths emphasize the coarse fraction [
14]. Consequently, the spectral variation of PLDR serves as an effective indicator of the size distribution and shape diversity of dust particles, which is essential for improving optical modeling and validating theoretical simulations. To interpret these polarization observations and link them to the microphysical properties of dust, accurate optical modeling is required.
Accurate modeling of the optical and polarization properties of mineral dust is essential for interpreting lidar observations and quantifying its radiative effects. Because the scattering behavior of dust strongly depends on particle shape and orientation, various nonspherical models have been developed to represent the morphology of natural dust aerosols. Early modeling efforts mainly focused on simplified geometric representations capable of reproducing major optical features within feasible computational limits [
15]. Among these, the spheroid model marked a key milestone by providing a physically consistent yet efficient description of particle nonsphericity.
The spheroid model was first systematically introduced by Mishchenko et al. [
16,
17] through the T-matrix framework for randomly oriented particles. Later, Dubovik et al. [
18] incorporated spheroids into the AERONET inversion algorithm, which greatly improved the retrieval accuracy of dust optical and microphysical properties and established spheroids as the standard geometry in global aerosol remote sensing. With the development of advanced light scattering algorithms such as the Invariant Imbedding T-Matrix (II-TM) method and the Improved Geometric Optics Method (IGOM), it has become possible to efficiently and accurately simulate the scattering of complex shaped particles over a wide size range [
19].
To better capture the geometric complexity of natural aerosols, the super-ellipsoid model was proposed by Bi et al. [
20] to represent aerosol particles through two key parameters: the axis ratio (α) and a roundness parameter (e), which jointly control particle elongation and edge curvature. This model extends the spheroidal geometry to more realistic convex and concave forms, allowing a continuous transition between nearly spherical and irregular shapes [
21].
In parallel, Saito et al. [
22] developed the irregular hexahedral model, in which particle shape is represented by an ensemble of 20 randomly distorted polyhedra. Each hexahedron’s faces are randomly tilted to introduce surface roughness and angular irregularity, and the ensemble’s statistical sphericity is characterized by its aspect ratio and degree of sphericity distributions. The irregular-hexahedral model effectively mimics the morphology of mineral dust and volcanic ash particles and has been used to construct the TAMUdust2020 optical property database. More recently, this model was adopted by Chang et al. [
23] in the multi-wavelength lidar aerosol retrieval algorithm, confirming its potential for representing nonspherical aerosol populations. Collectively, these models have been widely used to represent the morphological diversity of mineral dust and to interpret multi-wavelength polarization signatures observed by lidar systems.
This study systematically compares the spheroid, super-ellipsoid, and irregular-hexagonal models in reproducing dust scattering and polarization properties at three lidar wavelengths (355, 532, and 1064 nm). The simulations incorporate wavelength-dependent refractive indices and realistic size distributions representative of atmospheric dust. Furthermore, the study investigates the optimal shape mixing proportions for the irregular-hexagonal and super-ellipsoid models and examines the performance of all three models under different levels of systematic detection errors to assess their robustness and applicability in polarization lidar retrievals.
2. Models and Methods
Light scattering theory and the physical principles of polarization lidar have been extensively described in previous studies. Here, we briefly give the key theoretical background relevant to this work and outline the configurations used.
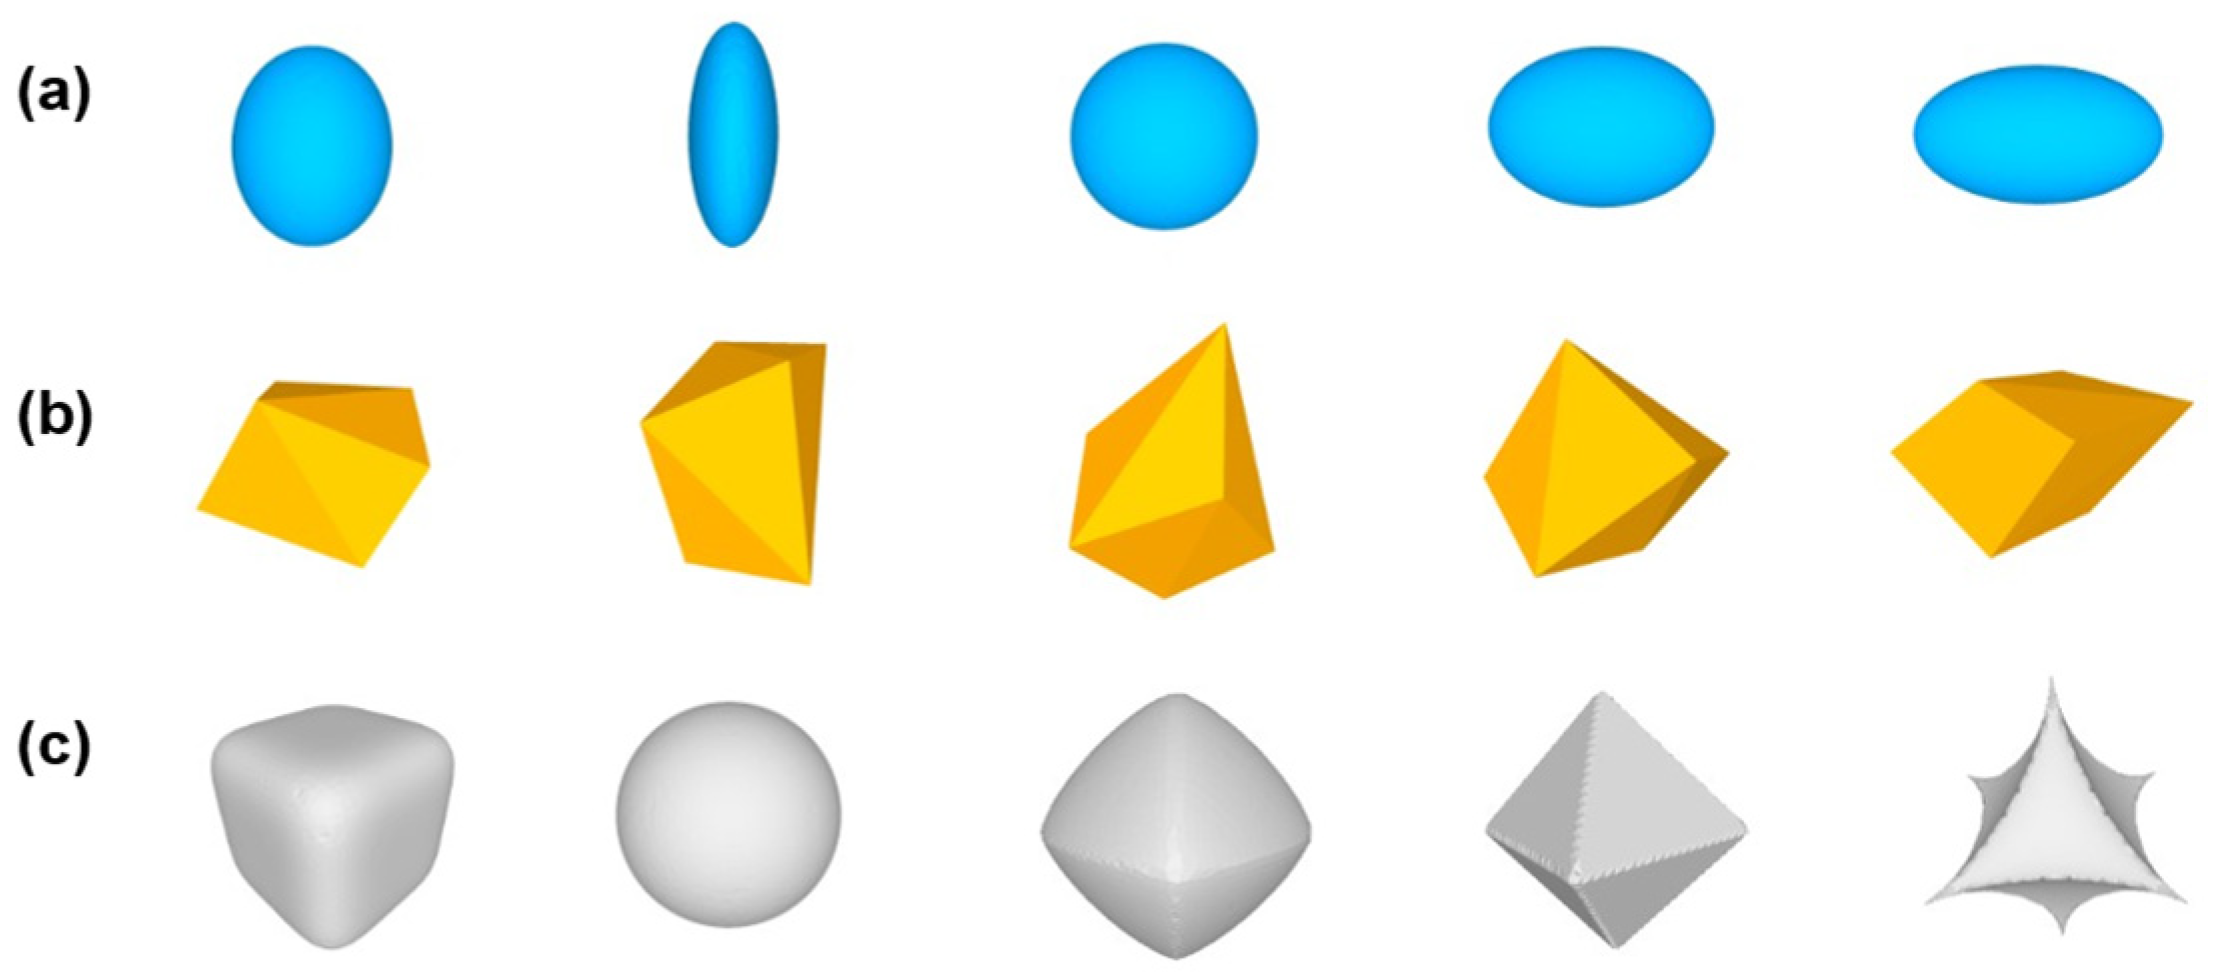
Figure 1 illustrates the three particle models considered: spheroid, irregular-hexahedral, and super-ellipsoid. The spheroid is defined as follows:
where
,
, and
are the semi-axes along the
,
, and
directions, respectively. Assuming rotational symmetry around the
-axis (
), the particle shape is fully defined by the aspect ratio
, distinguishing between prolate (
) and oblate (
) spheroids. Dubovik et al. [
18] modeled dust ensembles using fixed aspect ratio distributions, and by adjusting the fraction of spherical particles, this approach captures the variability in real atmospheric aerosols. It has been successfully adopted in the AERONET algorithm for retrieving dust optical properties.
In the irregular-hexahedral model, particle shape is represented by an ensemble of 20 randomly distorted polyhedra, and its morphology is quantified by the sphericity parameter
:
where
and
are the particle volume and surface area, respectively. In the TAMUdust2020 database developed by Saito et al. [
22], six irregular-hexahedral ensembles with
values from 0.695 to 0.785 represent particles with different aspect ratios and surface roughness. Smaller
corresponds to more irregular or elongated shapes. This model has been shown to reproduce the depolarization characteristics of mineral dust and volcanic ash.
The super-ellipsoid is defined by
where
,
,
are semi axes, and e, n are the roundness parameters controlling the curvature and edge sharpness. To simplify, it is typically assumed that
and
, so the particle shape is determined by the aspect ratio
and the roundness parameter e. In this simplified form, the geometry is also referred to as a super-spheroid. Bi et al. [
24] showed that when e ranges from 2.0 to 2.8, the simulated lidar and depolarization ratios agree well with polarization lidar observations of dust, confirming the suitability of this model for nonspherical aerosols.
As described by Gimmestad [
25], the PLDR can be expressed in terms of the elements of the normalized 4 × 4 Mueller scattering matrix:
In the backscattering direction, the elements and of the Mueller matrix are generally close to zero for randomly oriented and mirror symmetric particles. Therefore, to simplify the expression of the PLDR, only the ratio of to is considered in the calculation of PLDR.
For an ensemble of randomly oriented particles with a range of sizes, the size distribution is commonly described by a lognormal function, expressed as
where
is the total particle number concentration,
is the median radius, and
is the geometric standard deviation. This distribution has been widely shown to represent the particle size spectra of mineral dust and other atmospheric aerosols accurately [
4,
20,
22].
The bulk scattering matrix elements
can be obtained by integrating the single particle matrix elements
weighted by the particle number distribution and the corresponding scattering cross section
:
Here, denotes the i,j-th element of the single particle scattering matrix at wavelength λ, and is the corresponding scattering cross section.
For incident linearly polarized light, the PLDR at 180° backscattering is expressed as
The bulk backscatter coefficient
is expressed as
Similarly, the bulk extinction coefficient is expressed as
Here,
denotes the single particle extinction cross section. Consequently, the lidar ratio (LR, extinction-to-backscatter ratio) can be written as
The LR is an intensive optical parameter that links particle extinction to backscattering, providing insights into aerosol type and absorption characteristics. High LR values, such as those exceeding 80 sr in biomass-burning smoke, indicate strong absorption or enhanced multiple scattering by irregular particles. In contrast, low LR values below about 30 sr, as commonly observed for sea salt or sulfate aerosols, are characteristic of weakly absorbing and nearly spherical particles [
26].
Building on this theoretical framework, numerical simulations were conducted to investigate the multi-wavelength optical properties of dust ensembles. The simulations covered effective radii (
Reff) from 0.1 to 3.0 μm, following Saito et al. [
22], as long-range transported dust typically falls within this range. The particle size distributions were modeled using lognormal functions with different
values, each with a fixed
of 2.0, consistent with Reid et al. [
27], as shown in
Figure 2.
The computations were performed at three representative lidar wavelengths—355, 532, and 1064 nm—corresponding to standard polarization-sensitive lidar channels. Multi-wavelength observations enhance the characterization of dust optical properties because the spectral variation of depolarization reflects changes in particle size, shape, and composition. As shown by Tesche et al. [
28,
29], such measurements improve the retrieval of microphysical properties of nonspherical aerosols by better constraining size-dependent scattering and reducing uncertainties in particle shape and refractive index. The CRI of mineral dust varies with wavelength due to differences in composition and iron content. Based on the global dust dataset of Di Biagio et al. [
30], we adopted real parts of 1.50, 1.53, and 1.55, and imaginary parts of 0.003, 0.002, and 0.001 for 355, 532, and 1064 nm, respectively, representing typical shortwave absorption characteristics of natural dust.
Table 1 summarizes the parameter settings used for the three dust shape models.
For the irregular-hexahedral and super-ellipsoid models, the simulations employed the shape parameter ranges identified in their respective publications as most representative of natural mineral dust. It should be noted that the optical properties of the spheroid and irregular-hexahedral models were obtained from the publicly available spheroid-package and TAMUdust2020 databases, respectively, and the super-ellipsoid database was kindly provided by Prof. Lei Bi. The super-ellipsoid database is limited to a maximum size parameter of 50; therefore, for the 355 nm and 532 nm cases, the Reff range was truncated to ensure computational validity. Additionally, the following assumptions were adopted in the subsequent analysis: 1. the particle size distribution follows a Gaussian function with a specified standard deviation; 2. the complex refractive index of dust varies within a constrained range; 3. the lidar ratio retrieval was limited to a predefined interval.
3. Results
This section presents the numerical results of the LR and PLDR for mineral dust aerosols, simulated using three representative nonspherical particle models: the spheroid, irregular-hexahedral, and super-ellipsoid models. Simulations were conducted at 355, 532, and 1064 nm, corresponding to the standard operating wavelengths of polarization-sensitive lidar systems.
The results include model comparisons of LR and PLDR, validation against representative dust observation cases, analyses of shape mixing effects for the irregular-hexahedral and super-ellipsoid ensembles, and sensitivity tests assessing the influence of measurement uncertainties. Through these analyses, the primary objective is to evaluate the capability of each model in reproducing observed dust optical characteristics and to identify the most suitable model framework for multi-wavelength polarization lidar applications.
3.1. Comparison of Lidar Ratios and Depolarization Ratios Among Different Shape Models
For single particles, their scattering characteristics have been extensively discussed in previous studies; therefore, this work focuses on the bulk optical properties of dust ensembles.
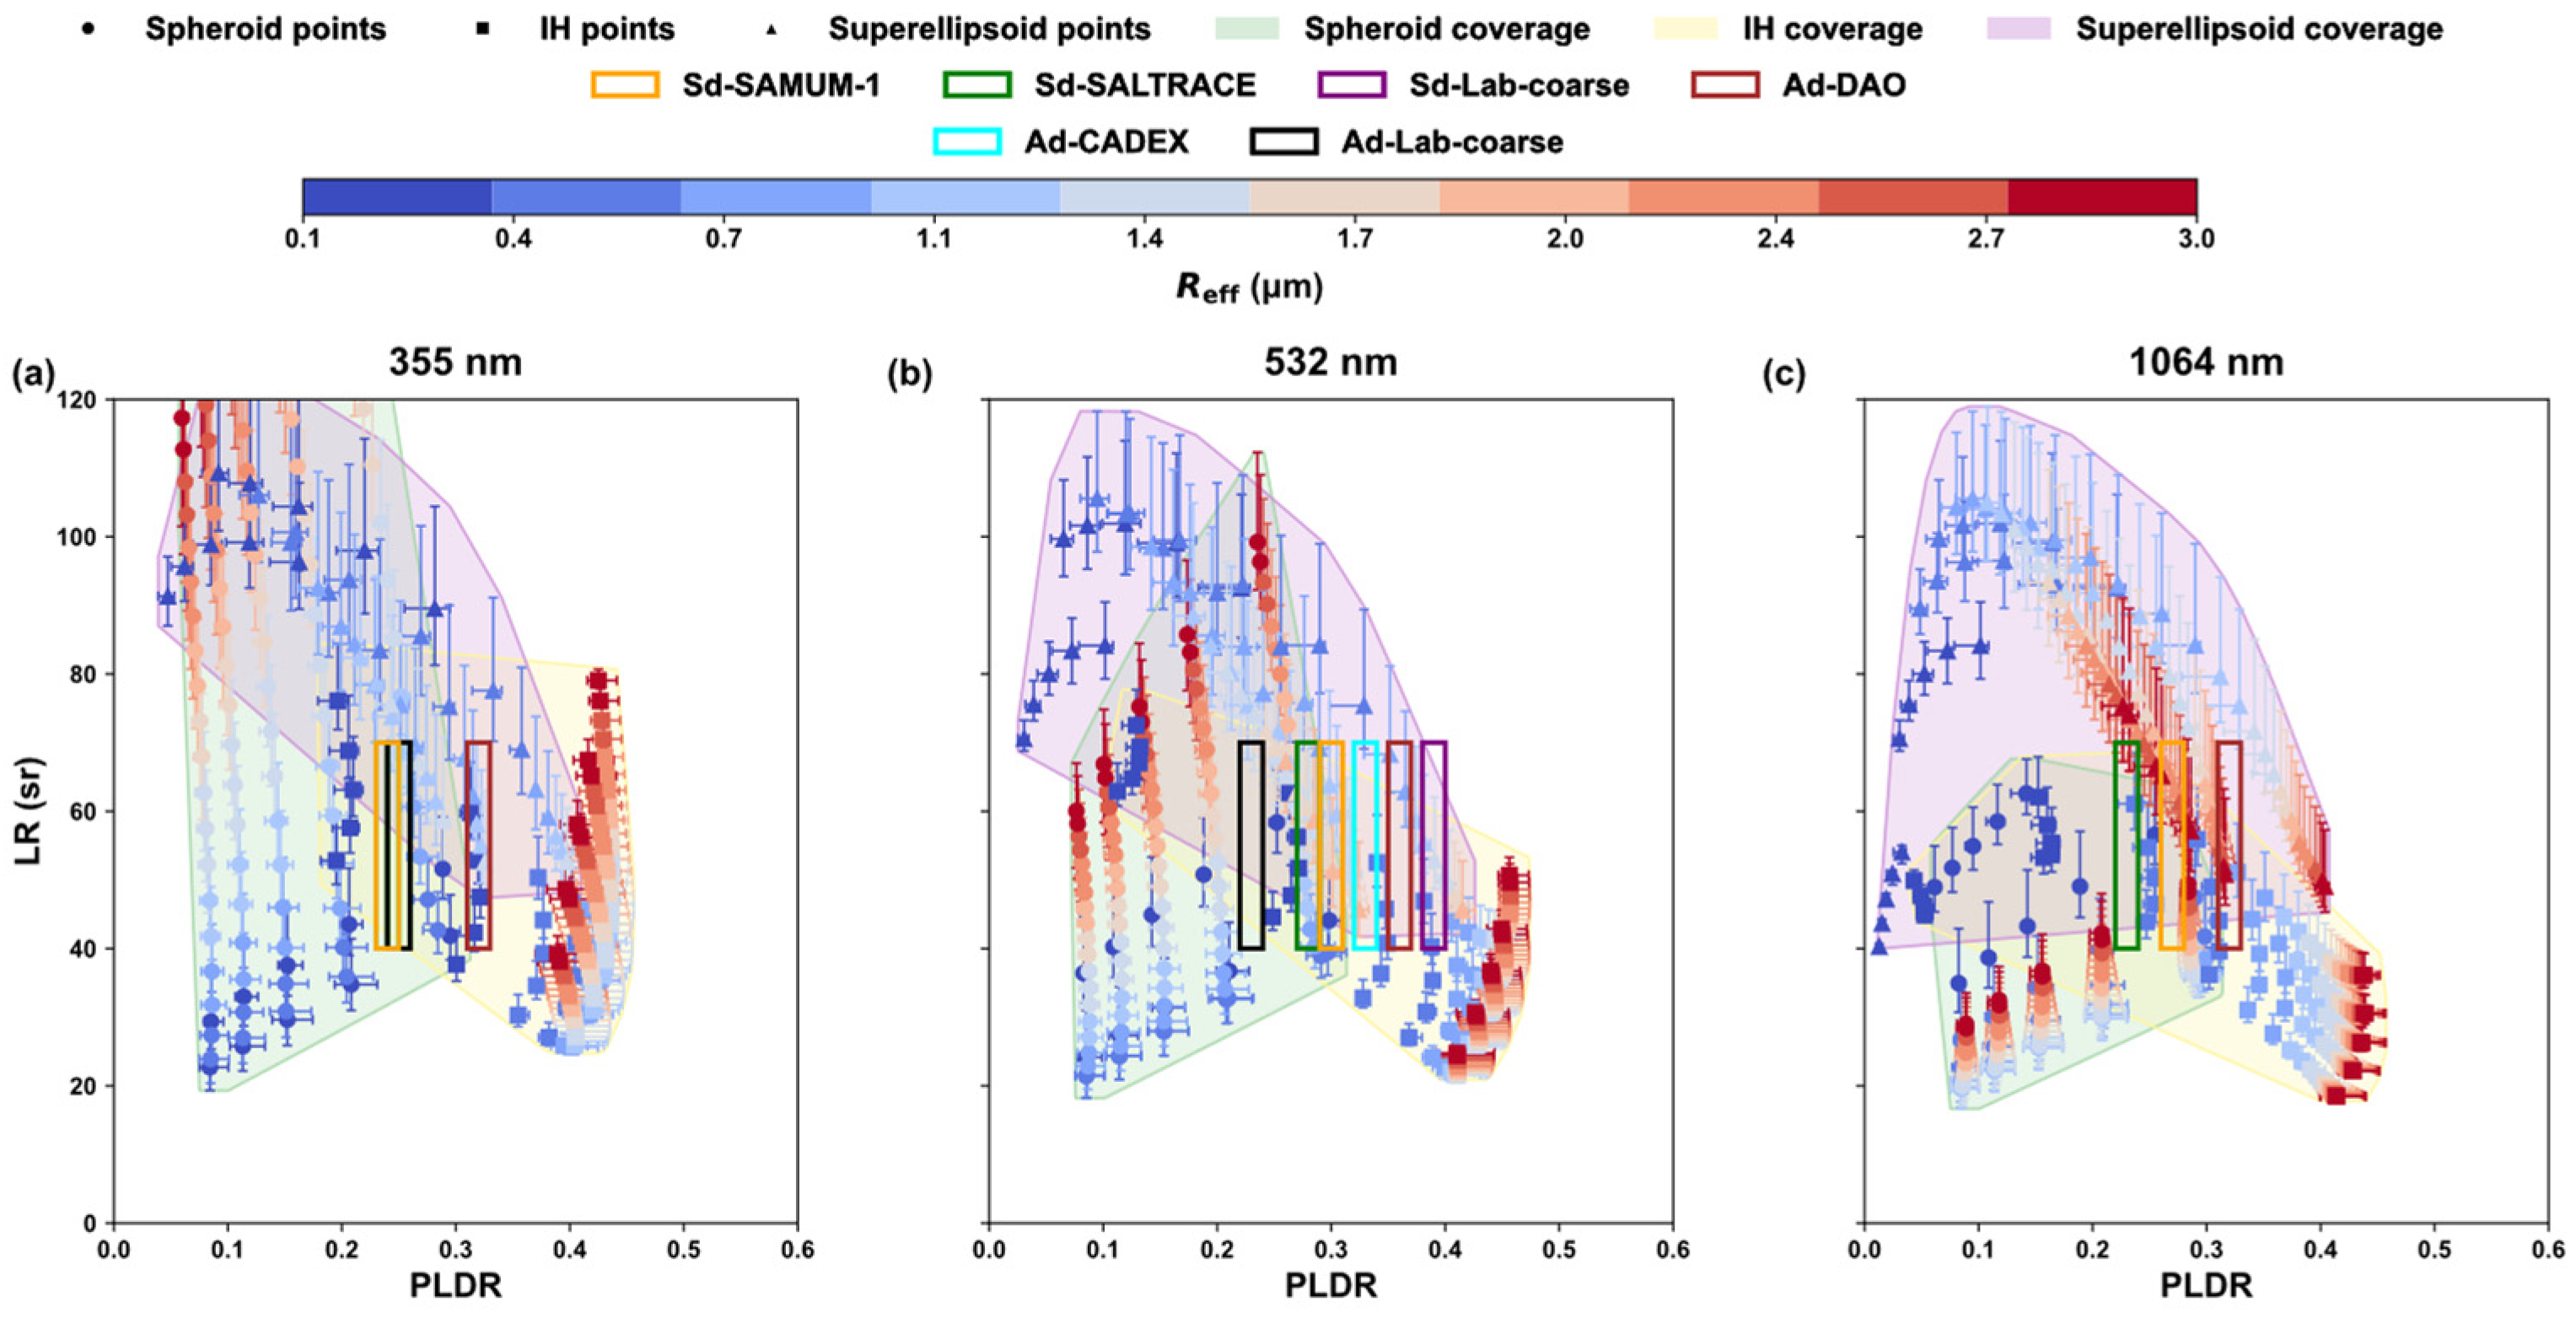
Figure 3 presents the simulated PLDR and LR at three wavelengths (355, 532, and 1064 nm) for the spheroid, irregular-hexahedral, and super-ellipsoid models, respectively. The differences among the three shape models are evident across the entire size range.
For the spheroid model, the PLDR remains relatively low (<0.3) throughout the simulated Reff range, while the LR increases rapidly with increasing Reff. As the spherical fraction increases, both PLDR and LR decrease accordingly, consistent with Mie-scattering predictions for more spherical particles.
The irregular-hexahedral and super-ellipsoid models show broadly similar PLDR–LR relationships, with PLDR values spanning 0.1–0.35, a typical range for atmospheric dust. The irregular-hexahedral model produces slightly higher depolarization ratios (up to 0.4) with only minor variations across different sphericity parameters, indicating strong robustness against morphological perturbations. In the super-ellipsoid ensemble, increasing the roundness parameter () results in higher LR and lower PLDR values. As Reff exceeds about 2 µm, the PLDR tends to stabilize and approaches a plateau in three models, suggesting that in the coarse mode regime, larger particles dominate the depolarization response.
A clear wavelength dependence is observed across all three models. In the fine mode regime dominated by smaller particles, the PLDR follows the spectral order PLDR
(355) > PLDR
(532) > PLDR
(1064). With increasing
Reff, however, the PLDR of the irregular-hexahedral model shows an evident crossover among the three wavelengths. The error bars in
Figure 3 represent the variability caused by different real parts of the CRI. Across all three models, LR is more sensitive to refractive index changes than PLDR, particularly at shorter wavelengths. Notably, the PLDR curves of all three models exhibit distinct peaks around an
Reff of ~1 µm, marking the transition between fine and coarse mode regimes. Overall, the results indicate that particle shape exerts a strong influence on the polarization and extinction characteristics of dust. Compared with the regular spheroid model, the irregular-hexahedral and super-ellipsoid models better reproduce the observed PLDR and LR features, demonstrating higher physical realism. The irregular-hexahedral model is relatively insensitive to parameter variations, while the super-ellipsoid model shows a stronger dependence on its shape parameter.
3.2. Comparison with Observational Dust Cases
To evaluate the realism of the modeled lidar parameters, we compared the simulated PLDR and LR values of the three dust shape models with multi-wavelength observations from several representative field campaigns and laboratory experiments. The details are shown in
Table 2. The selected cases include both near source and long range transported Saharan dust, as well as Asian dust events. In addition, laboratory measurements of controlled dust samples are introduced for further comparison with the modeled results.
As shown in
Figure 4, the results of the three models exhibit overlapping regions, indicating that all of them can reasonably reproduce the observed PLDR–LR relationships of dust. In general, the coverage of all models decreases with increasing wavelength, suggesting that larger particles dominate the optical scattering properties of dust ensembles at longer wavelengths. It is noteworthy that only a very small fraction of simulations with
Reff greater than 1.5 μm fall within the observed ranges, further indicates that long range transported dust ensembles generally have smaller
Reff.
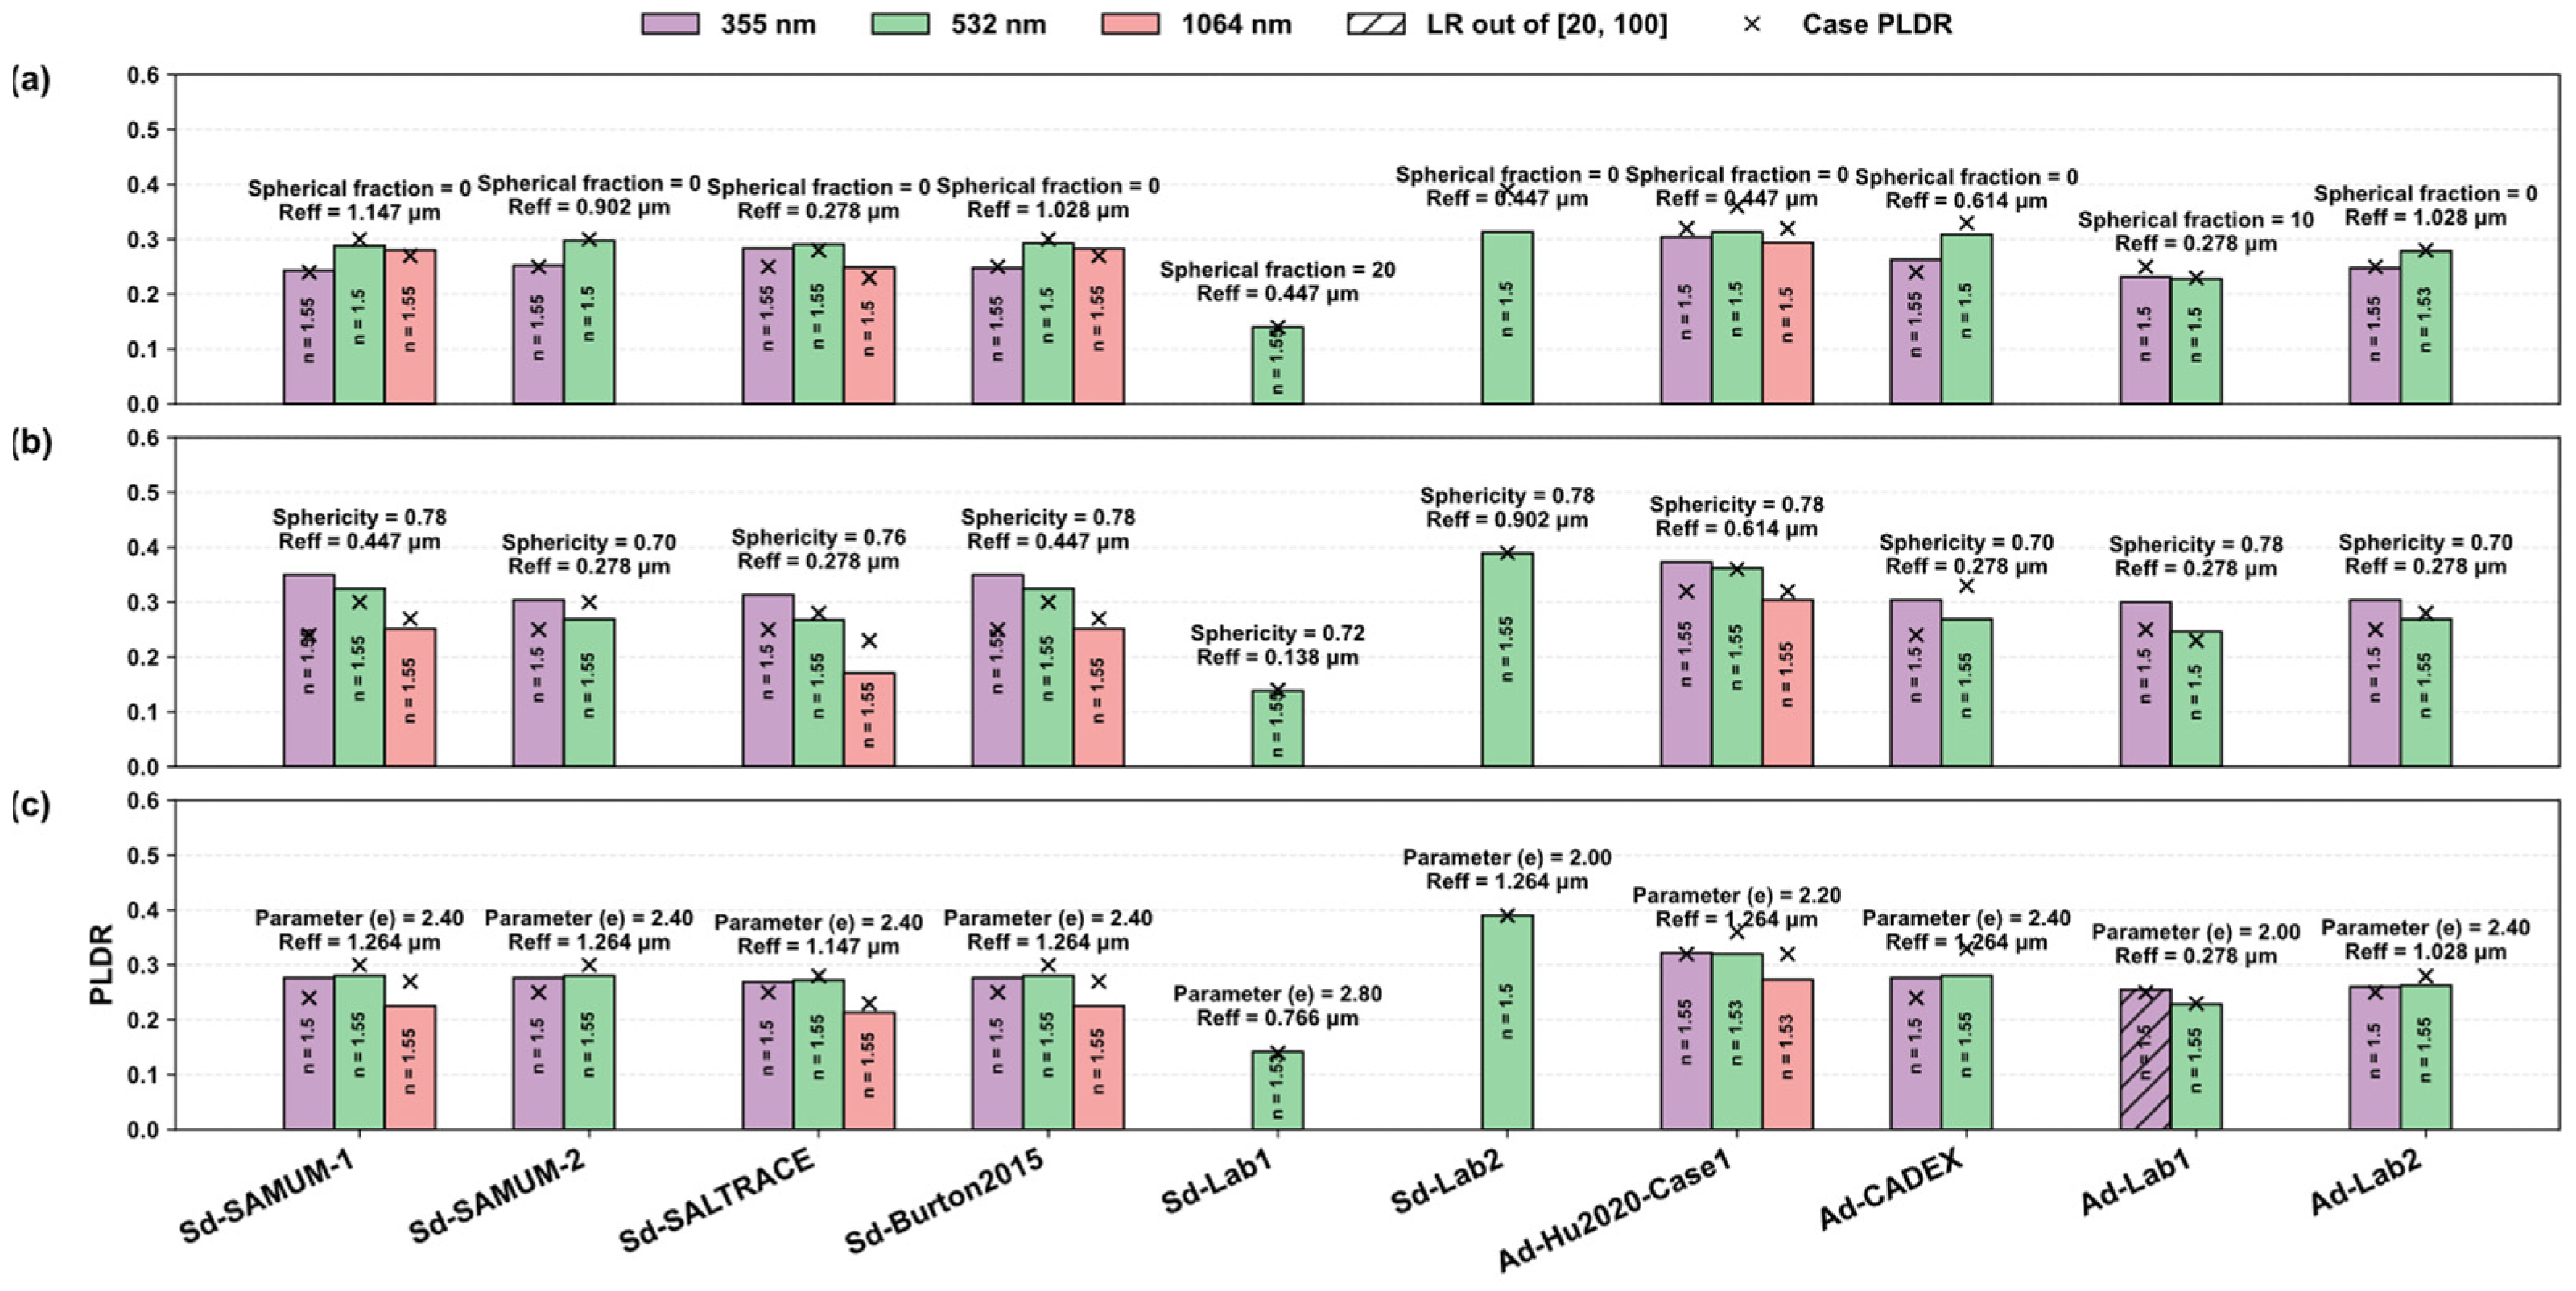
Figure 5 presents the comparison between the simulated results of different models and the observational dust cases. The matching procedure is based on a lookup-table approach using the sum of squared errors (SSE) criterion. For each observational case, the shape parameter yielding the minimum SSE was selected from each model, followed by the retrieval of the CRI that best matches the observations. Each case was processed independently. Considering the regional variability in the mineral composition of dust, the LR range was broadened to 20–100 to account for possible variations caused by strong or weak absorption.
As shown in
Figure 5, the spheroid and super-ellipsoid models exhibit the best agreement with the observations. However, for cases with PLDR values exceeding 0.3, the spheroid model shows a larger deviation from the measurements, likely because a fixed-axis-ratio spheroid cannot reproduce high depolarization characteristics. For laboratory observations (e.g., Sd-Lab1 and Sd-Lab2, corresponding to fine and coarse mode samples), the spheroid model yields nearly identical
Reff, which is inconsistent with expectations, whereas the super-ellipsoid model performs best by effectively distinguishing between fine and coarse modes. In terms of shape selection, the spheroid model predominantly favors a spherical fraction of 0% across most observational cases, the irregular-hexahedral model adopts varying sphericity values depending on the case, and the super-ellipsoid model generally provides the best match when
= 2.4.
Additionally, the Reff retrieved from the irregular-hexahedral model is the smallest among the three models, as this model can produce high depolarization ratios at relatively small particle sizes. Furthermore, the Reff differences among the models indicate that additional size distribution or spectral observations are required to further validate the model accuracy.
3.3. Influence of Shape Mixing in the Irregular-Hexahedral and Super-Ellipsoid Models
Following the concept proposed by Dubovik et al. [
18], who represented dust shape diversity by mixing spheroids with different aspect ratios, we applied a similar approach within each model framework to account for morphological variability. For the super-ellipsoid model, particles with various roundness parameters (
= 2.0–2.8) were combined to construct an ensemble representing a more realistic distribution of particle shapes. Likewise, for the irregular-hexahedral model, multiple sphericity values (
= 0.7–0.78) were mixed to capture the natural spread of irregular geometries observed in mineral dust samples. It is important to note that the mixing was performed within each model individually rather than between the two models. The aim was to investigate the influence of particle shape distribution on ensemble optical properties and to assess the potential capability of the mixing strategy to improve model–observation consistency.
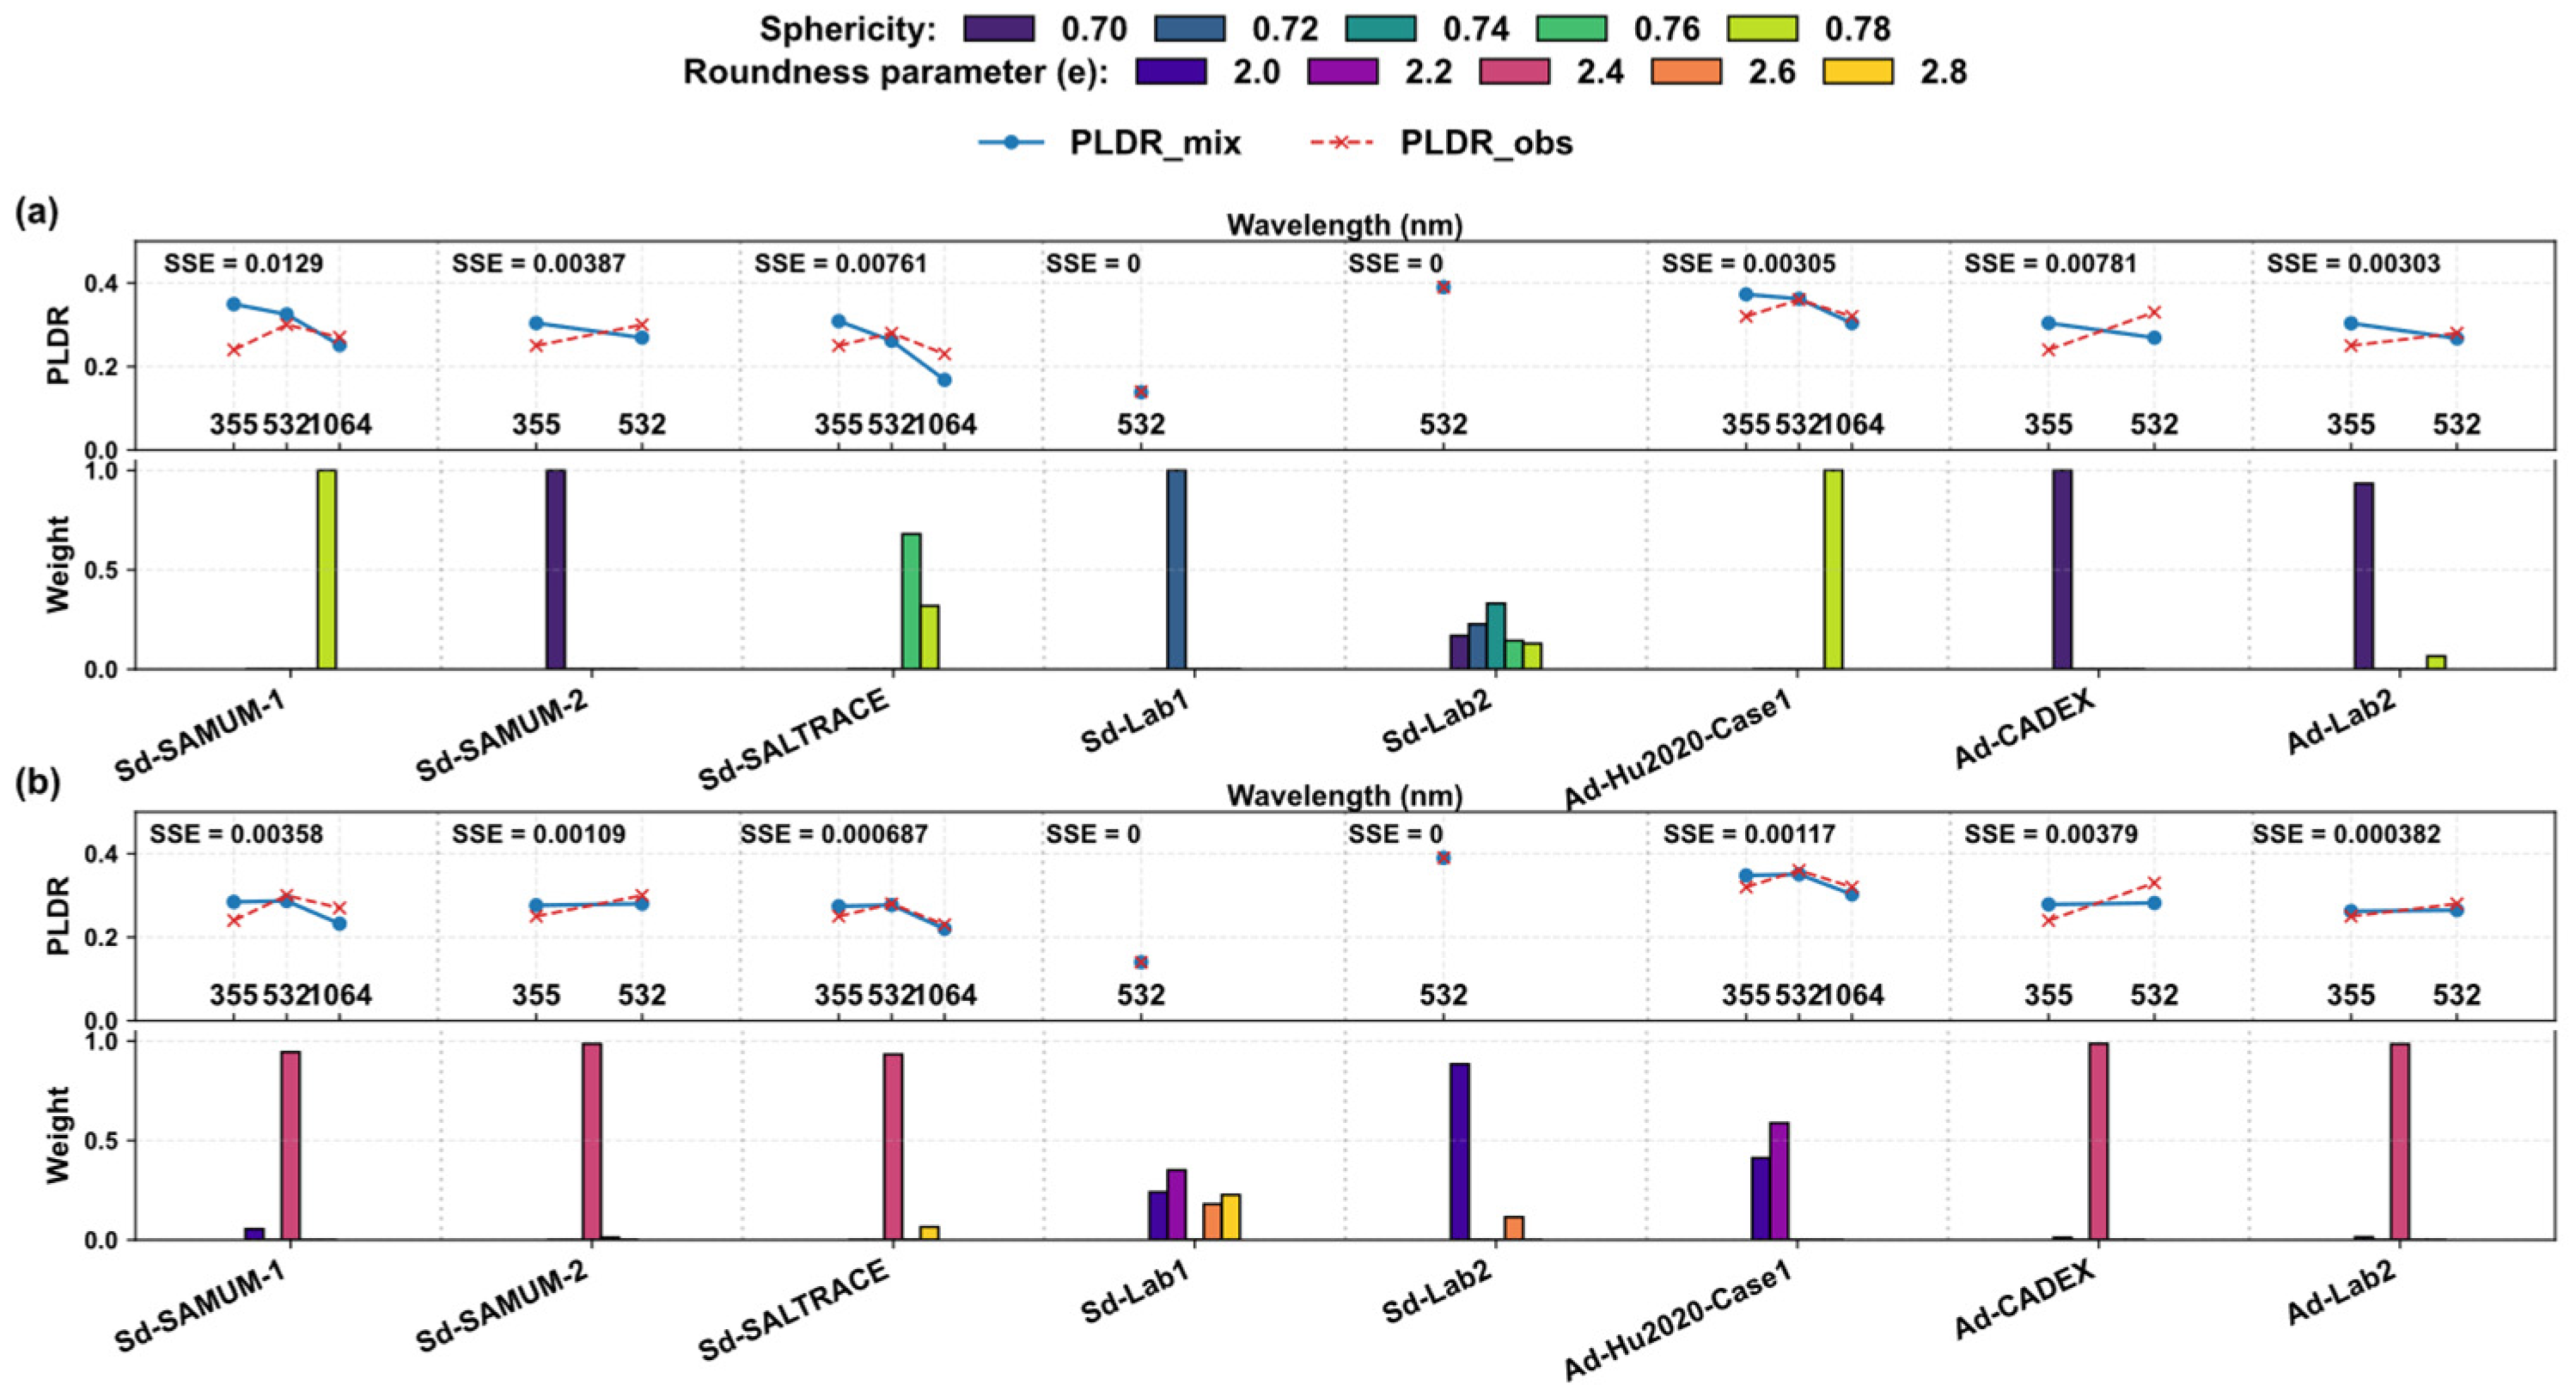
Figure 6 presents the optimal fitting results based on the shape mixing approach. For each model, a total of 300,000 shape combinations were uniformly sampled to explore the parameter space. The fitting was performed independently for each observational case, and the agreement between simulations and observations was quantified using SSE:
Here, denotes the number of wavelengths. The figure shows the best performing shape combination for each case. It can be seen that neither the irregular-hexahedral nor the super-ellipsoid model exhibits complex multi-shape mixtures; instead, the optimal solutions are typically dominated by a single shape.
In addition, a global optimal mixture was derived by fitting all dust cases simultaneously, assuming equal weighting among cases and using a single optimal mixture ratio to represent the entire ensemble.
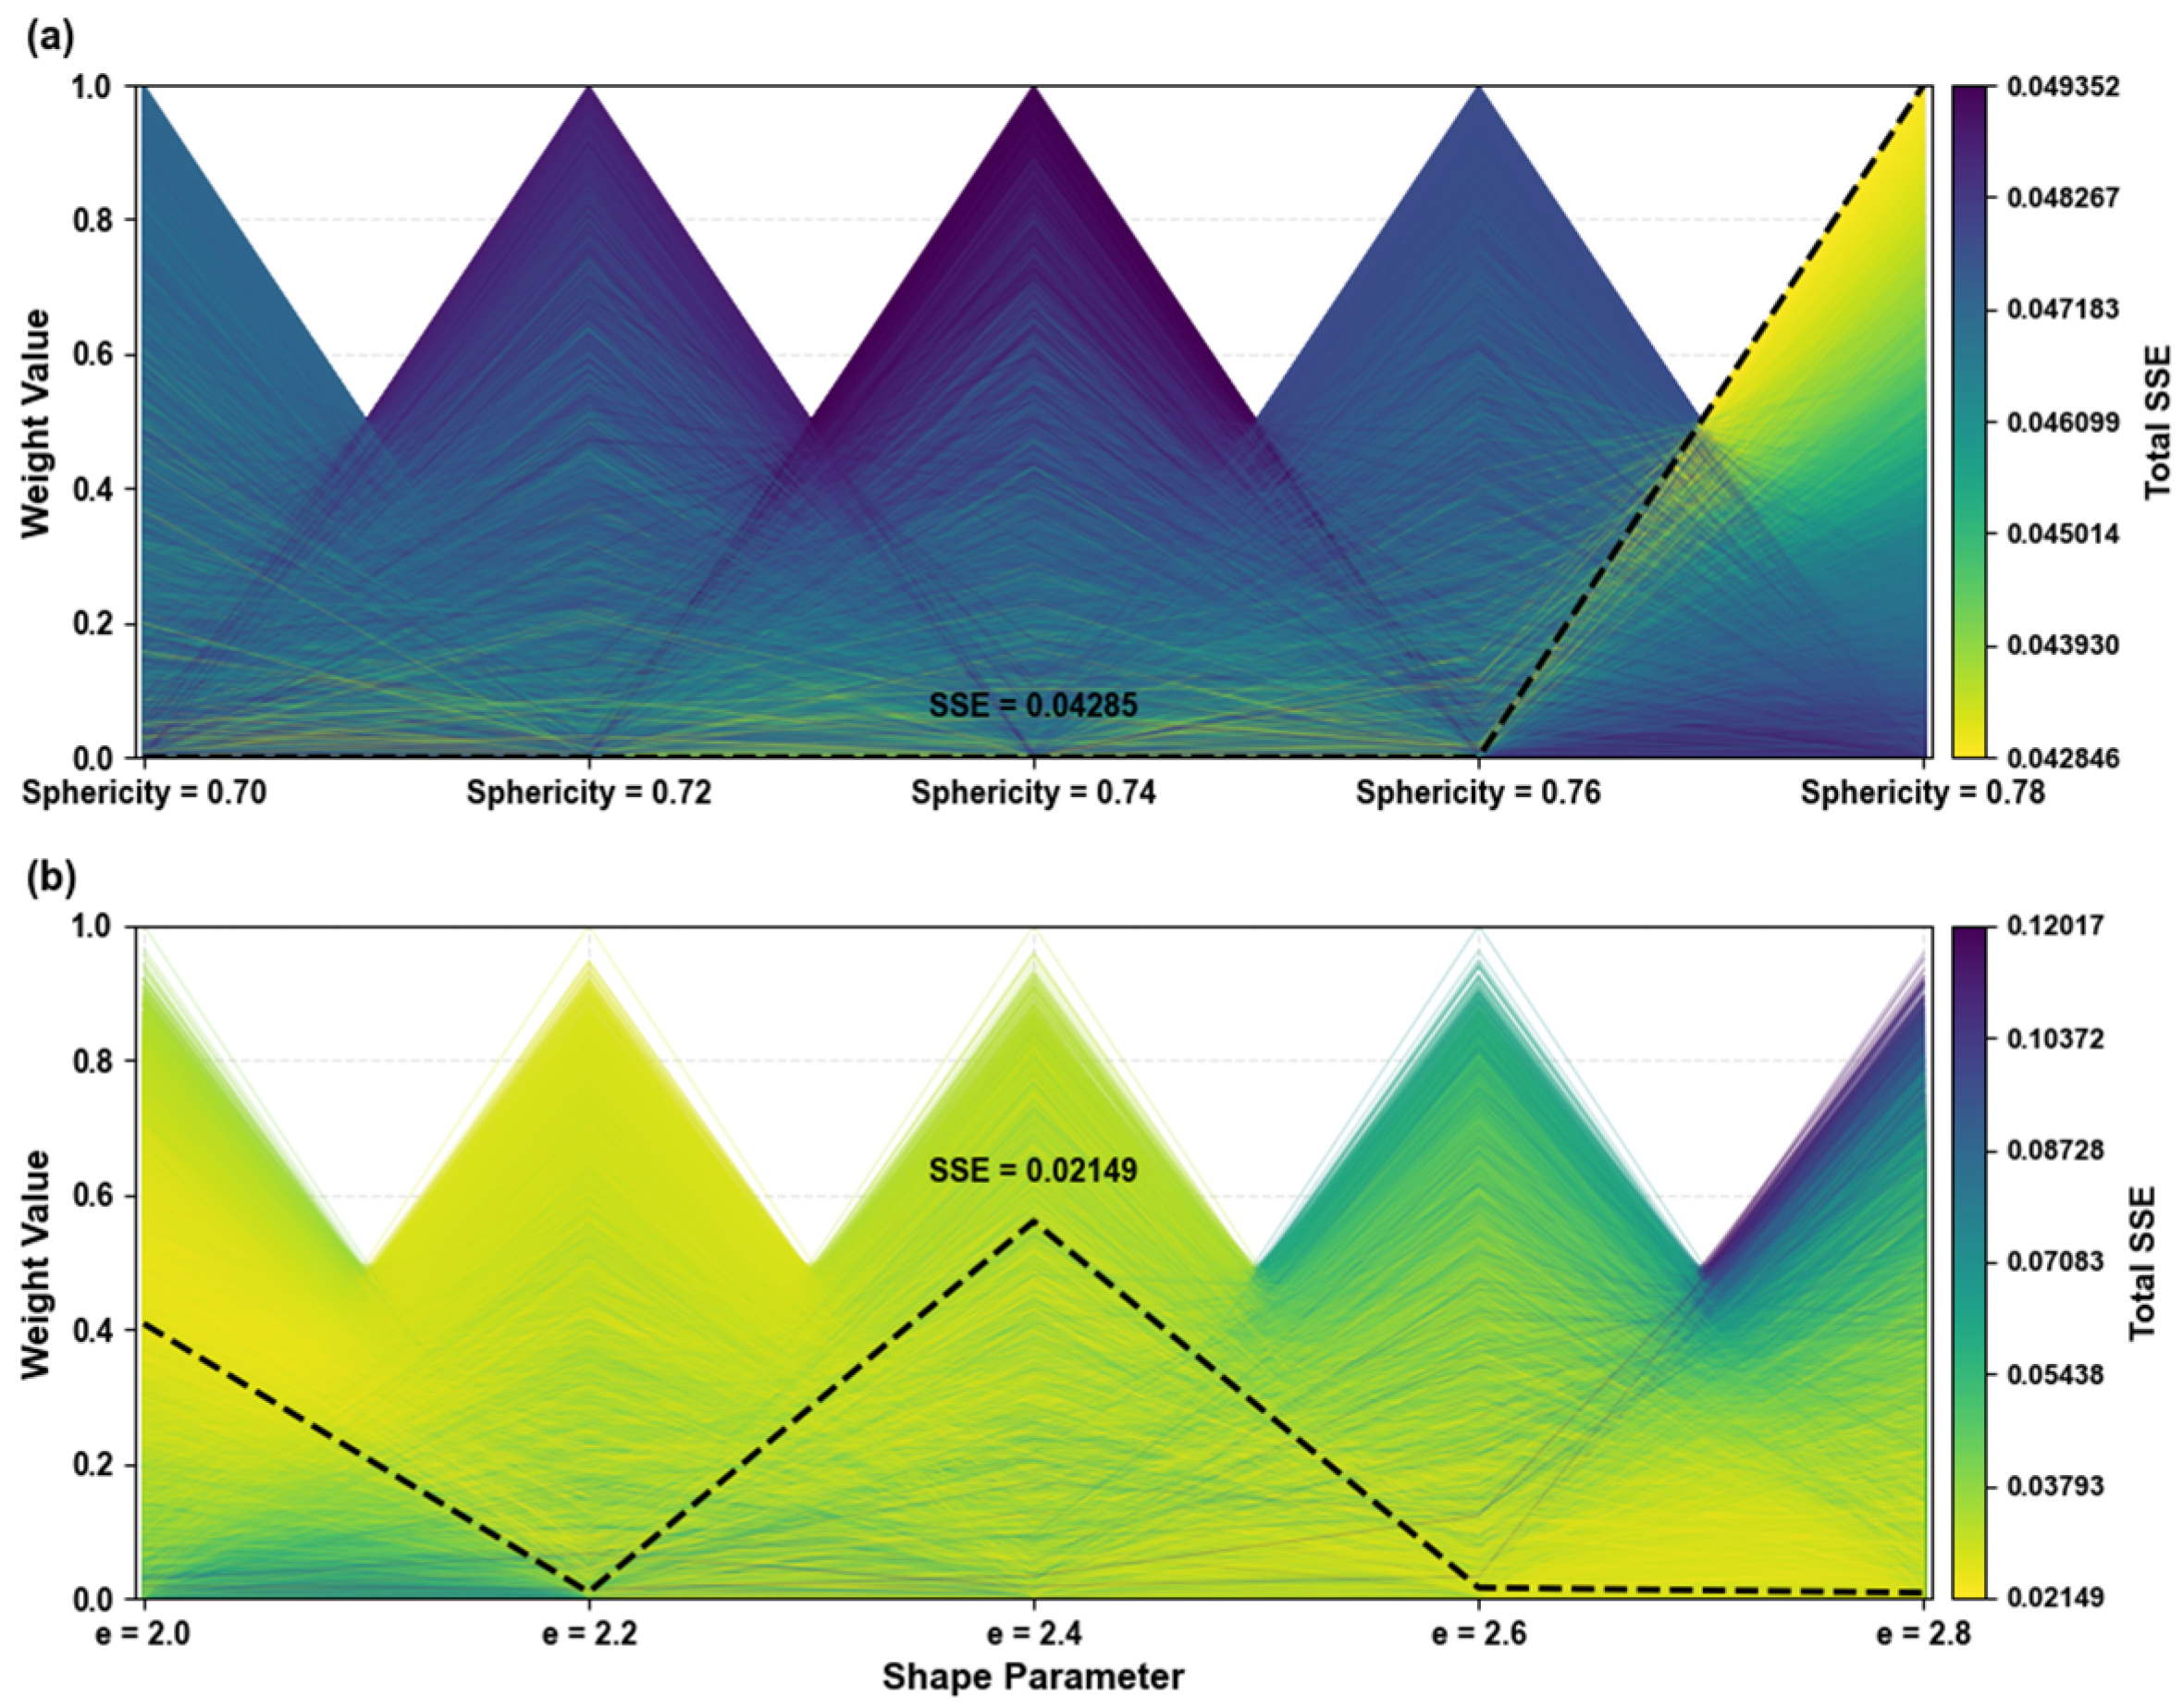
Figure 7 illustrates the variation of total SSE with different shape mixture ratios. For the irregular-hexahedral model, shape mixing has little impact on the overall fitting error, with SSE values ranging from 0.042 to 0.049, indicating high model stability. This stability likely arises from the similar optical behavior of particles with different sphericities. In contrast, the super-ellipsoid model shows more pronounced differences among mixtures. The black dashed line denotes the optimal mixture and its corresponding minimum SSE, suggesting that under mixed shape conditions, the super-ellipsoid model achieves slightly better agreement with the observed dust cases than the irregular-hexahedral model.
3.4. Sensitivity of Modeled Results to Measurement Uncertainties
In practical polarization lidar observations, the system performance is inevitably affected by the characteristics and calibration errors of optical components such as polarizing beam splitters, wave plates, and photodetectors, which may alter the polarization state of the backscattered signal and thus influence the system detection accuracy [
37]. As a result, the observed PLDR inherently contain measurement uncertainties.
To assess the influence of such uncertainties on model applicability, the sensitivity of the simulated–observed agreement was analyzed under varying detection error conditions. In this study, measurement uncertainties of 10%, 30%, and 50% were introduced to the observed values of each dust case to evaluate the impact of detection errors on the stability of the shape model retrievals.
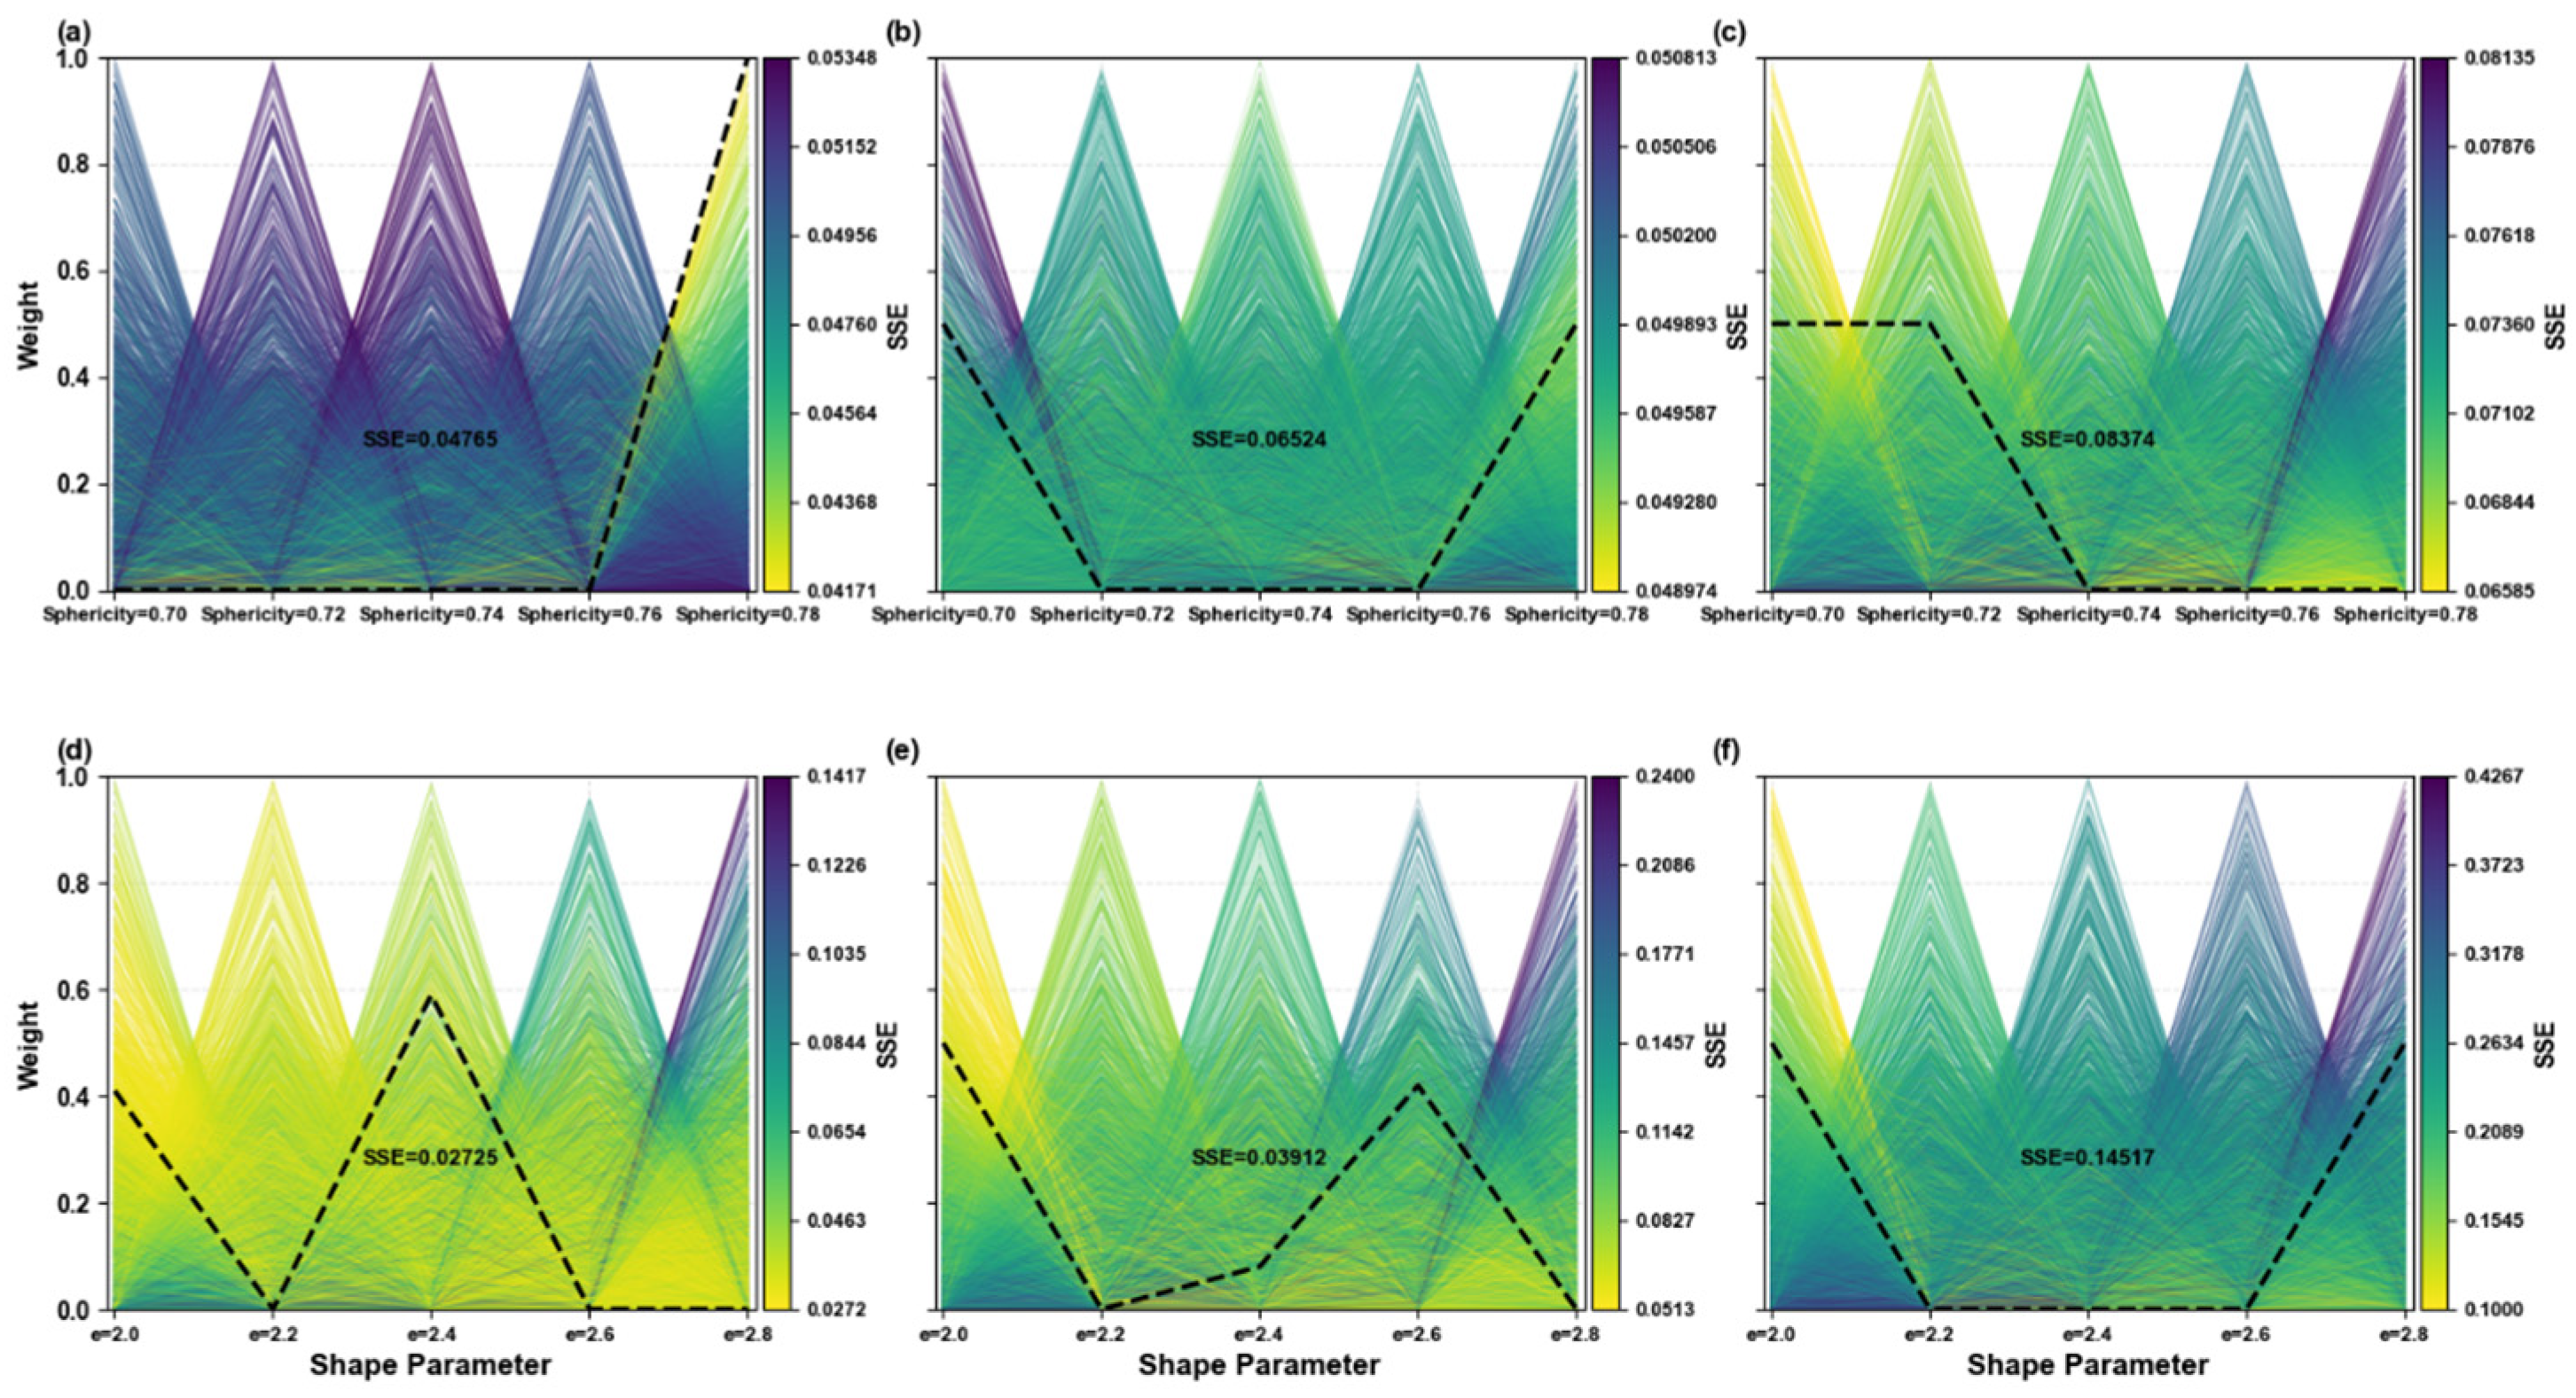
Figure 8 shows the optimal shape mixtures and corresponding SSE values for the irregular-hexahedral and super-ellipsoid models under different measurement uncertainty conditions. Under a 10% error level, both models exhibit only minor variations in their optimal mixtures, indicating a degree of robustness to small perturbations. As the error increases, the optimal mixture ratios change with varying magnitudes, suggesting that each model adjusts its shape composition to accommodate the altered PLDR spectral trends. Overall, the irregular-hexahedral model demonstrates better stability under larger uncertainties, likely because it provides a broader PLDR range and maintains relatively stable optical characteristics across different sphericity combinations. In contrast, the fitting performance of the super-ellipsoid model decreases markedly with increasing uncertainty, indicating a higher sensitivity to variations in detection errors.
Figure 9 further presents the variation of total SSE for the two models under increasing detection uncertainties. As the error increases, the super-ellipsoid model exhibits a more scattered error surface with a narrower optimal region, whereas the irregular-hexahedral model shows relatively smooth variations in its error distribution.
4. Discussion
According to the results presented above, both the irregular-hexahedral and super-ellipsoid models reproduce the PLDR–LR characteristics of atmospheric dust more realistically than the conventional spheroid model. Although the spheroid model performs well in fitting low PLDR observations, it fails to capture higher PLDR values, suggesting that it may not adequately represent the true optical behavior of dust particles. This conclusion is consistent with the findings of Tesche et al. [
28].
Figure 10 further illustrates the variation in SSE under different levels of detection uncertainty for the three particle-shape models. Overall, the irregular-hexahedral model exhibits the smallest increase in SSE with increasing uncertainty, demonstrating the highest stability among the three models. The super-ellipsoid model shows moderate sensitivity, whereas the conventional spheroid model experiences a rapid rise in SSE and is the most affected by detection errors. These differences primarily arise from the distinct ways in which each model responds to perturbations in particle shape.
The irregular-hexahedral model spans a broad PLDR range (0.04–0.48) and derives its geometry from an ensemble of distorted polyhedra, which reduces sensitivity to any single geometric parameter. As a result, it maintains strong robustness across a wide range of detection uncertainties (0–50%). In contrast, although the super-ellipsoid model flexibly describes particle roundness, variations in the roundness parameter correspond to substantially different particle geometries. This makes the model more responsive to perturbations, and therefore its performance is optimal only under low-noise, well-calibrated conditions where uncertainties remain below 10%.
The spheroid model, dominated by quasi-spherical shapes and constrained by a narrower PLDR range (0.06–0.32), is highly sensitive to deviations in particle morphology. Consequently, its SSE increases most rapidly with rising uncertainty, reflecting its limited robustness. These results collectively indicate that the geometric flexibility and ability to represent shape diversity play a critical role in determining the stability of scattering models under varying detection conditions.
These results indicate that incorporating more physically realistic particle mixing models is essential for polarization lidar retrievals and dust optical simulations. Under low-detection-error conditions, the super-ellipsoid model provides the best agreement with observations, followed by the spheroid and irregular-hexahedral models. When the system is affected by larger detection errors, the irregular-hexahedral model, owing to its superior stability, becomes the most reliable choice for retrieving dust optical properties.
5. Conclusions
This study comprehensively evaluated three representative nonspherical particle models—spheroid, irregular-hexahedral, and super-ellipsoid—to assess their ability to reproduce the PLDR–LR characteristics of mineral dust under multi-wavelength polarization observations. Comparisons with field and laboratory measurements show that both the irregular-hexahedral and super-ellipsoid models provide a more physically realistic representation of dust scattering than the conventional spheroid model, particularly in reliably identifying coarse-mode particle size distributions.
An important finding is that for all three models, small variations in the real part of the CRI noticeably affect the LR range, whereas the impact on PLDR is minimal. This highlights the need for multi-wavelength LR observations, together with atmospheric temperature and humidity profiles, to better constrain the refractive-index range of dust particles.
The shape-mixing analyses further demonstrate the strong influence of particle morphology on ensemble optical properties. Incorporating shape variability significantly improves agreement between simulations and observations. Under detection uncertainties of 0–50%, the irregular-hexahedral model shows higher robustness, making it more suitable for operational applications, while the super-ellipsoid model performs best under well-calibrated, low-noise conditions (uncertainties below 10%). Future work should include multi-wavelength and multi-mode laboratory measurements of dust backscattering to further validate and refine the applicability of particle optical models.
