


Highlights
What are the main findings?
- A normalization-calibration approach based on the Beer–Lambert law and regression models effectively reduced biases and improved consistency among multi-source FPAR observations.
- FPARLAI-NOS is highly correlated and consistent with FPARFPARnet. FPARLAI-2200 and FPARDHP also correlate strongly with FPARLAI-NOS. In contrast, FPARLAINet shows a much lower correlation with FPARFPARnet.
What is the implication of the main finding?
- This study established a normalization-calibration model for multi-source ground-based FPAR observations, which overcomes the limited representativeness of single instruments and enhances spatial sampling. It thereby provides a more reliable ground reference for validating large-scale FPAR remote sensing products.
- The findings offer practical guidance for field experiments, including the selection of sensor types, optimization of deployment locations, and design of measurement protocols for different forest ecosystems.
Abstract
The fraction of absorbed photosynthetically active radiation (FPAR) is a key physiological variable for characterizing vegetation structure and associated matter and energy exchange processes. Accurate and effective monitoring of FPAR is essential for understanding ecosystem functioning. However, systematic biases among existing ground-based observation techniques hinder the effective integration of FPAR data, limiting its potential for spatial scaling. This study selected five ground-based observation techniques, FPARnet, LAI-NOS, LAINet, LAI-2200, and digital hemispherical photography (DHP), based on the existing FPAR and LAI observation techniques at Wanglang Station, to develop a PAIe-LAI-FPAR conversion model using the Beer–Lambert law. The correlation and consistency of FPAR derived from different observation techniques were comparatively analyzed. On this basis, a normalization-calibration model based on regression was developed for FPARLAI-NOS, FPARLAI-2200, and FPARDHP, using FPARFPARnet as the reference. Comparative analysis results show that FPARLAI-NOS and FPARFPARnet, as well as FPARLAI-2200 and FPARDHP with FPARLAI-NOS, exhibit good correlation and consistency (R ≥ 0.9, RMSEobs ≤ 0.08). However, FPARLAINet shows a relatively weak correlation with FPARFPARnet (R = 0.12). After normalization-calibration, the consistency among multi-source FPAR observations was significantly improved (R remains unchanged, and the average RMSEobs decreases by approximately 7.8%. The sample points are more closely aligned along the y = x line after calibration). This study provides a practical reference for the normalization-calibration of FPAR observations in mountainous forests based on multi-source ground-based observation techniques.
1. Introduction
The fraction of absorbed photosynthetically active radiation (FPAR) is a key parameter for characterizing vegetation physiological processes. FPAR is defined as the proportion of absorbed PAR (APAR) relative to incident PAR at the canopy top within the 400–700 nm spectral domain (unit: m2/m2) [1]. It reflects the efficiency of vegetation in absorbing PAR and is one of the fundamental biophysical parameters for quantifying photosynthetic capacity and growth status. In 2008, the Global Climate Observing System (GCOS) designated FPAR as one of the thirteen essential terrestrial climate variables, thereby underscoring its critical role in global change research [2]. Accurate and quantitative estimation of FPAR is of great significance for studies on terrestrial ecosystem carbon cycling, crop growth modeling, and the assessment of net primary productivity [3,4,5].
Currently, FPAR is primarily obtained through two approaches: remote sensing retrieval and ground-based measurements, the latter providing in situ validation samples for the former. Ground-based observations involve the deployment of specialized instruments in the field to quantitatively assess canopy FPAR, which mainly includes the following three methods [6]: (1) Four-Component PAR Method Based on Radiative Balance. This method estimates FPAR by measuring incident PAR above the canopy, reflected PAR above the canopy, transmitted PAR below the canopy, and soil-reflected PAR below the canopy using a radiometer or quantum sensor, and then applying the radiative balance equation. Commonly used instruments include AccuPAR [7] and SunScan [8], but these devices are suitable mainly for low-stature canopies. For tall canopies, such as forests, direct measurements of incident and reflected PAR above the canopy are difficult. In such cases, researchers typically deploy sensors on flux towers or unmanned aerial vehicles (UAVs) to measure canopy-top radiation. For incident PAR above the canopy, downward PAR observations in nearby open areas can also be used as approximate estimates. For example, Baldocchi et al. measured incident and reflected radiation above the canopy using a radiometer mounted on a triangular tower [9], while Zhao et al. measured canopy-top upwelling PAR by deploying quantum sensors on an unmanned aerial vehicle (UAV) [10]. Although this method is physically well-founded, it still faces significant gaps in forest ecosystems. Tower construction is costly [11], and single or few tower-based measurements cannot fully capture the spatial heterogeneity of complex terrain, which limits the method’s spatial representativeness [12]. (2) Simplified Model Based on Instantaneous Radiation Interception. This method is based on the strong absorption of PAR by chlorophyll and the generally low background reflectance observed in well-developed canopies [13]. Building on this basis, assuming leaves are opaque, FPAR can be estimated using the simplified model FPAR = 1 − (PARt/PARi), where PARi and PARt represent the incident PAR above the canopy and the transmitted PAR below the canopy, respectively. This method is computationally simple. Its theoretical assumptions are idealized. The validity of the model is affected by actual canopy reflectance and soil background reflectance [14]. It is therefore more suitable for vegetation with relatively homogeneous canopies and low background reflectance. Its estimates remain uncertain in areas with complex canopies or strong soil background reflectance. (3) Indirect Estimation Method Based on Leaf Area Index (LAI, m2/m2). The canopy is considered homogeneous. LAI is first calculated based on the gap fraction. FPAR is then estimated using the Beer–Lambert law [15]. This law was first applied to vegetation canopy radiation transfer studies by Monsi and Saeki (1953) [16]. It provides a quantitative relationship between LAI and radiation interception. It allows LAI measurements to be converted into FPAR estimates. This method is applicable to a variety of measurement instruments, including LAI-2200 [17], Digital Hemispherical Photography (DHP) [14], TRAC [18], LAI-NOS [19], and LAINet [20]. It should be noted that the method assumes a homogeneous canopy. This may limit its accuracy in structurally complex canopies.
However, among the three ground-based FPAR methods, differences in measurement principles, sensor sensitivity, and data processing procedures are inherent among the instruments [21]. In addition, the complex topography and canopy structure of mountainous forests lead to substantial variations in light conditions across positions [22,23]. These factors together result in notable inconsistencies in the comparability of FPAR data obtained using different methods [2,24,25]. Previous studies have assessed the accuracy of different instruments using cross-validation and comparative analyses [14,26], and Nestola et al. found a strong correlation (R2 = 0.84) between FPAR estimates derived from Apogee and PASTIS instruments [27]. However, a unified framework for normalizing observations across multi-source ground-based observation techniques is still lacking. Establishing a unified normalization framework not only facilitates the integration of multi-source ground-based observation samples, significantly expanding the available dataset, but also enhances the spatial representativeness of FPAR data, thereby improving the reliability of remote sensing product validation. Although existing studies emphasize the necessity of using multiple samples in forest ecosystems, in practice, only a limited number of sensors are typically deployed [28]. For instance, Tao et al. relied solely on PAR sensor data from a single position at each observation site for satellite product validation, which restricts the representativeness and comprehensiveness of the validation results [29].
This study was conducted at the Wanglang Mountain Remote Sensing Field Observation and Research Station of Sichuan Province (hereafter referred to as the Wanglang Station), China. Five ground-based observation instruments (FPARnet, LAI-NOS, LAINet, LAI-2200, and DHP) were selected, with FPARFPARnet serving as the reference to develop a normalization-calibration model for mountainous forest FPAR observations. This study overcomes the spatial limitations imposed by single observation techniques in forest FPAR measurements within mountainous terrain. It provides an efficient and scalable technical solution for ground-based FPAR observations in highly heterogeneous, topographically complex mountain forest ecosystems. This approach significantly enhances the spatial coverage of ground observation data while also offering reference for the selection of optimal measurement instruments.
2. Materials and Methods
2.1. Study Area
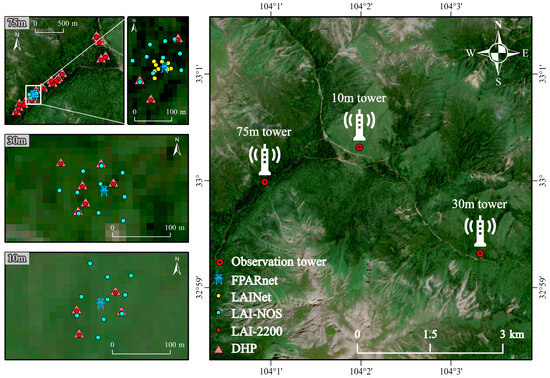
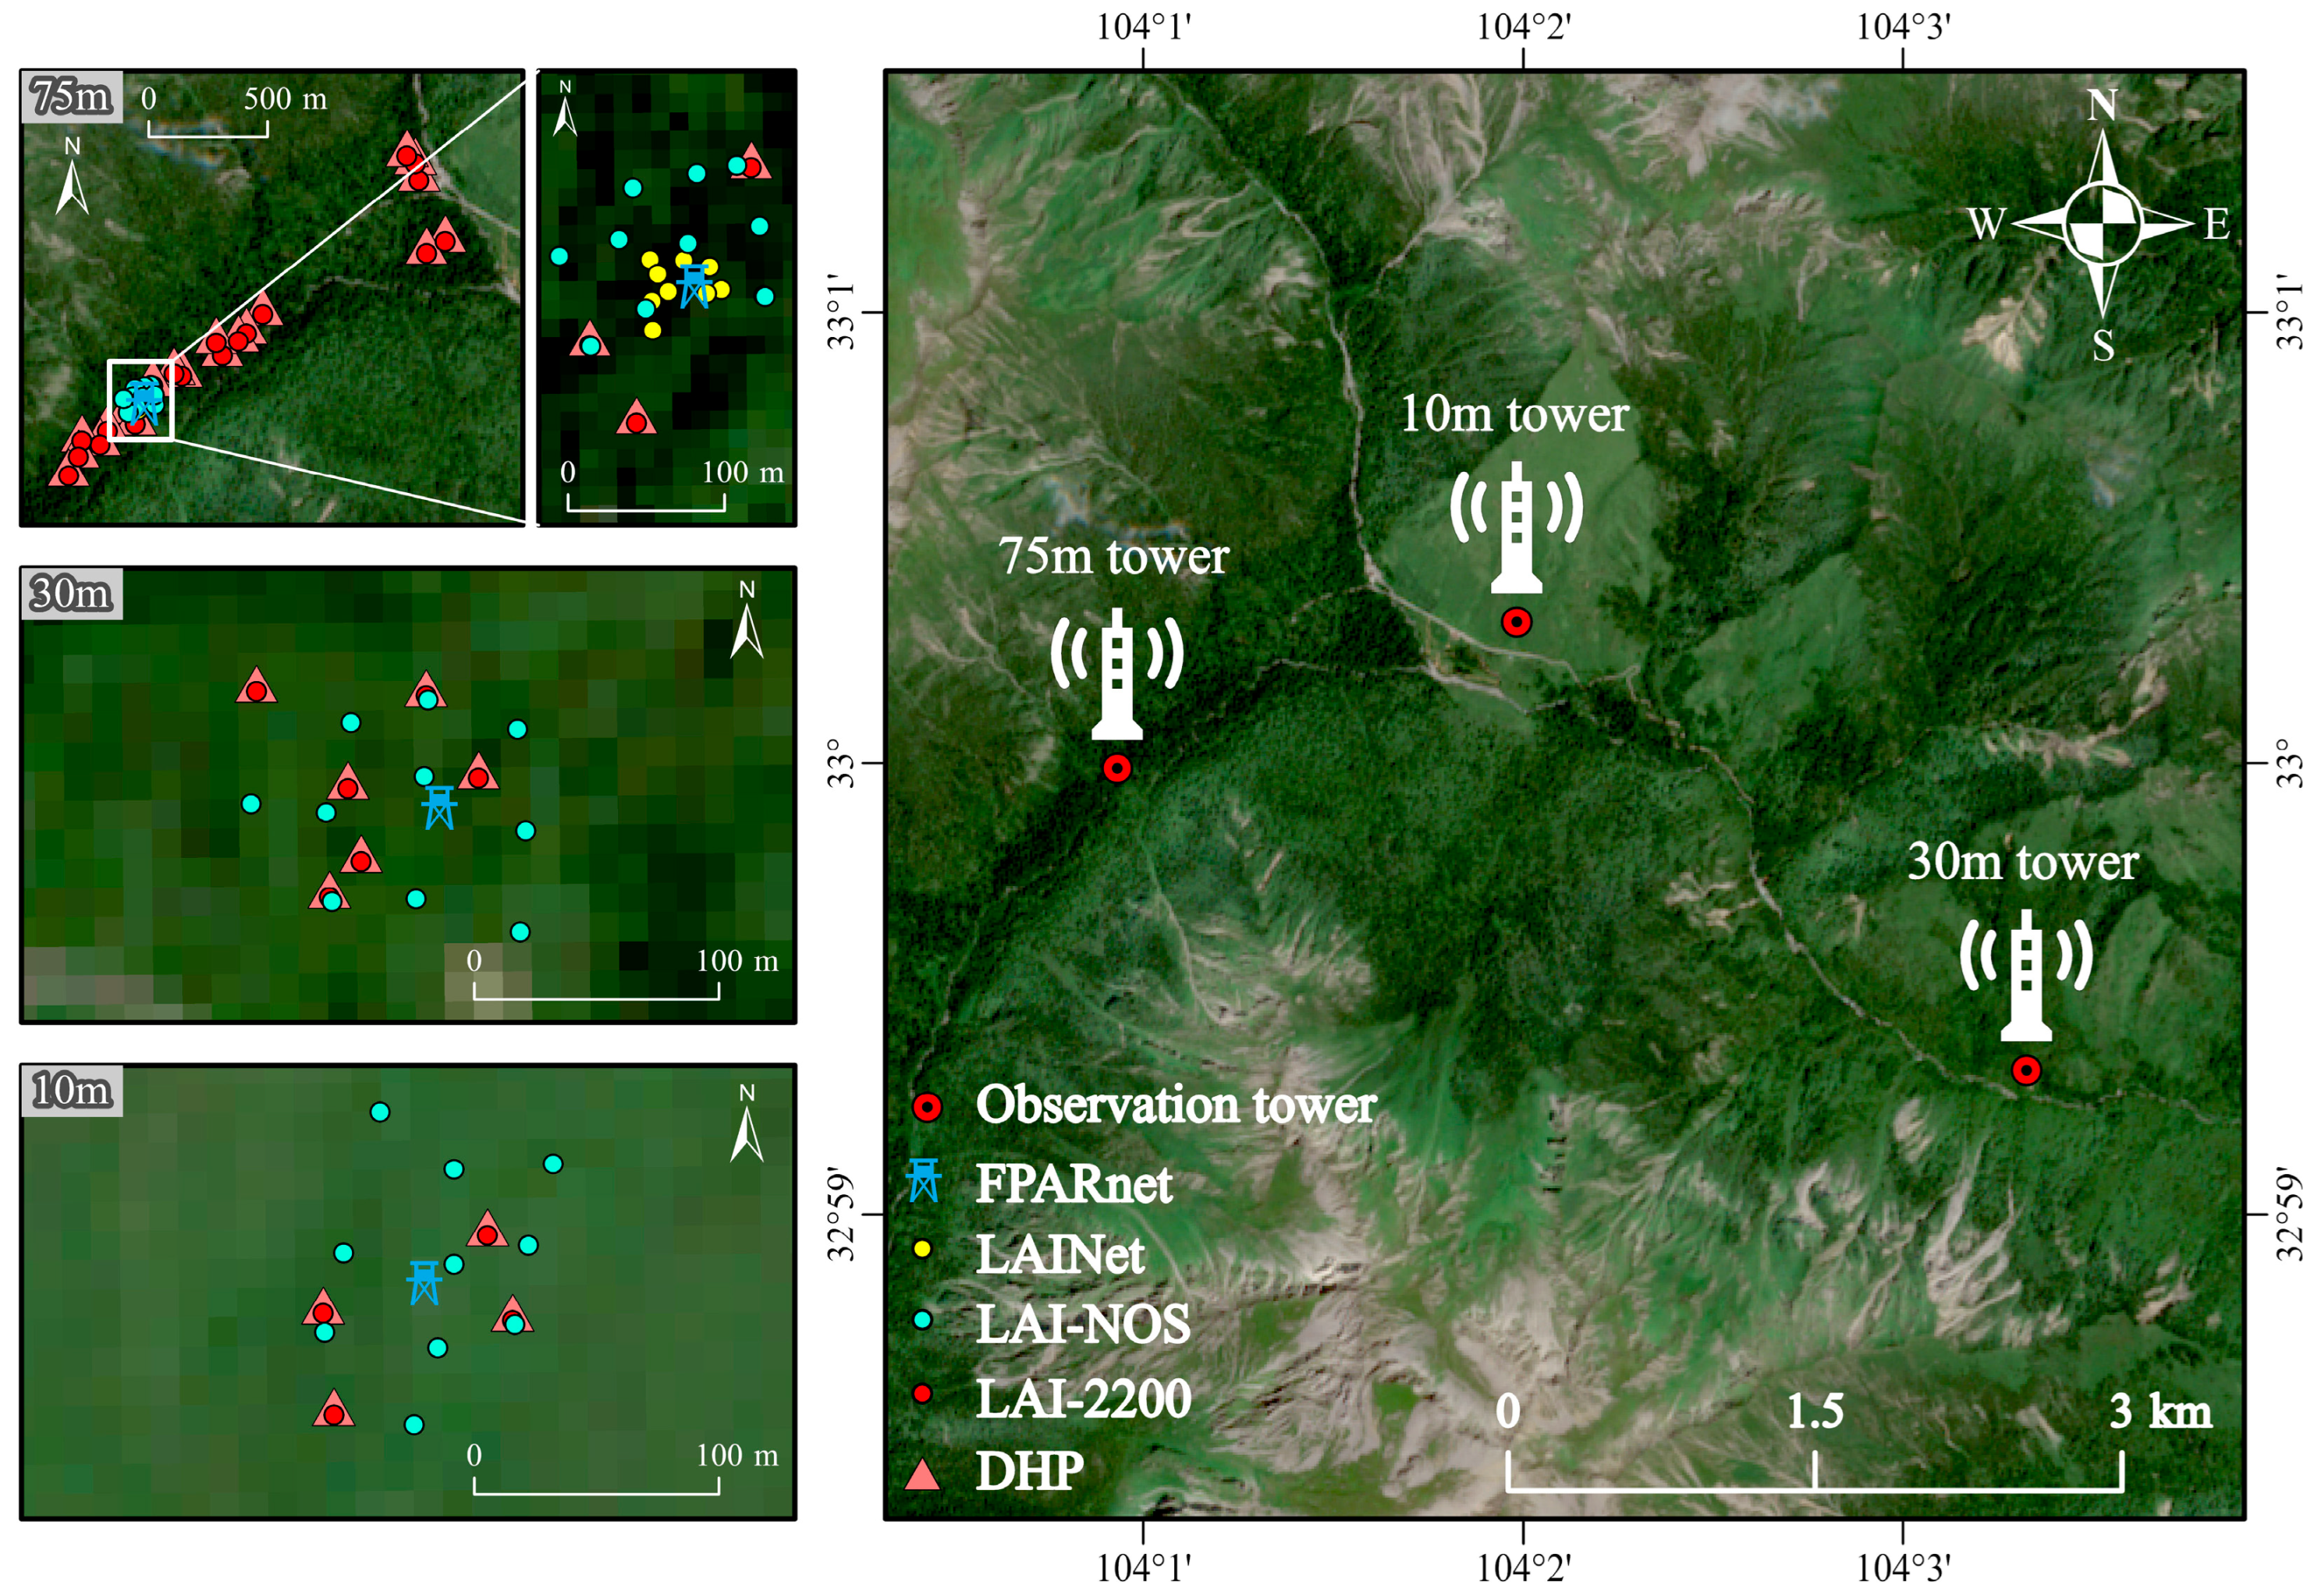
The research area is located in Pingwu County, Mianyang City, Sichuan Province, southwestern China. It is situated within the Wanglang Station (104°00′~104°04′E, 32°58′N~33°02′N). The area lies in the alpine canyon region on the northern margin of the Hengduan Mountains, within the core area of the Minshan range, at the junction between the Qinghai–Tibet Plateau and the Sichuan Basin. The elevation ranges from approximately 2300 to 4980 m [19]. The vegetation exhibits rich diversity, displaying a vertical zonation with increasing altitude: deciduous broadleaf forests (DBF; e.g., Betula platyphylla Sukaczev and Betula albosinensis Burkill), evergreen needleleaf forest (ENF; e.g., Abies faxoniana and Picea purpurea), and deciduous shrubland (DSH; e.g., Salix cupularis). This represents a typical mountainous forest ecosystem. Within the area, three observation towers have been established in the DBF, ENF, and DSH zones, with tower heights of 30 m, 75 m, and 10 m, respectively. Based on observational data requirements and field conditions, automated IoT-based measurement devices, including FPARnet, LAI-NOS, and LAINet, were systematically and strategically deployed. In addition, fixed plots were established around each observation tower to facilitate manual measurements using non-IoT instruments, such as LAI-2200 and DHP. The spatial distribution of the observation points in the study area is shown in Figure 1.
Figure 1.
Spatial distribution of observation points in the study area.
2.2. Experimental Design and Data Preprocessing
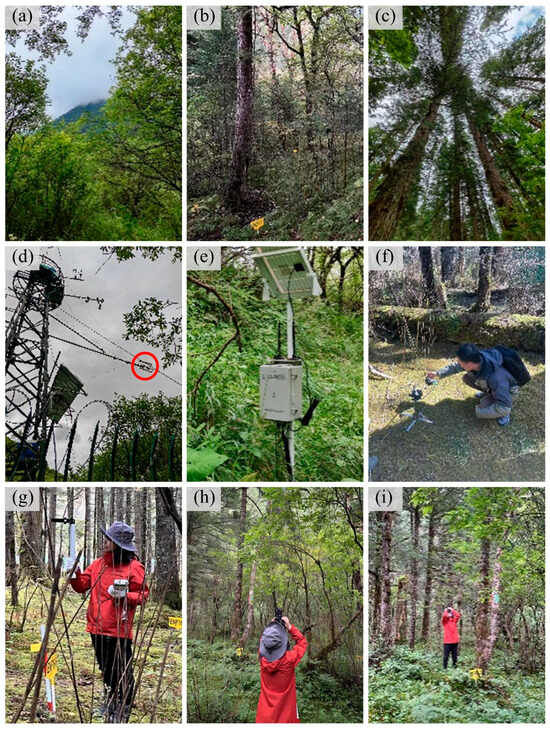
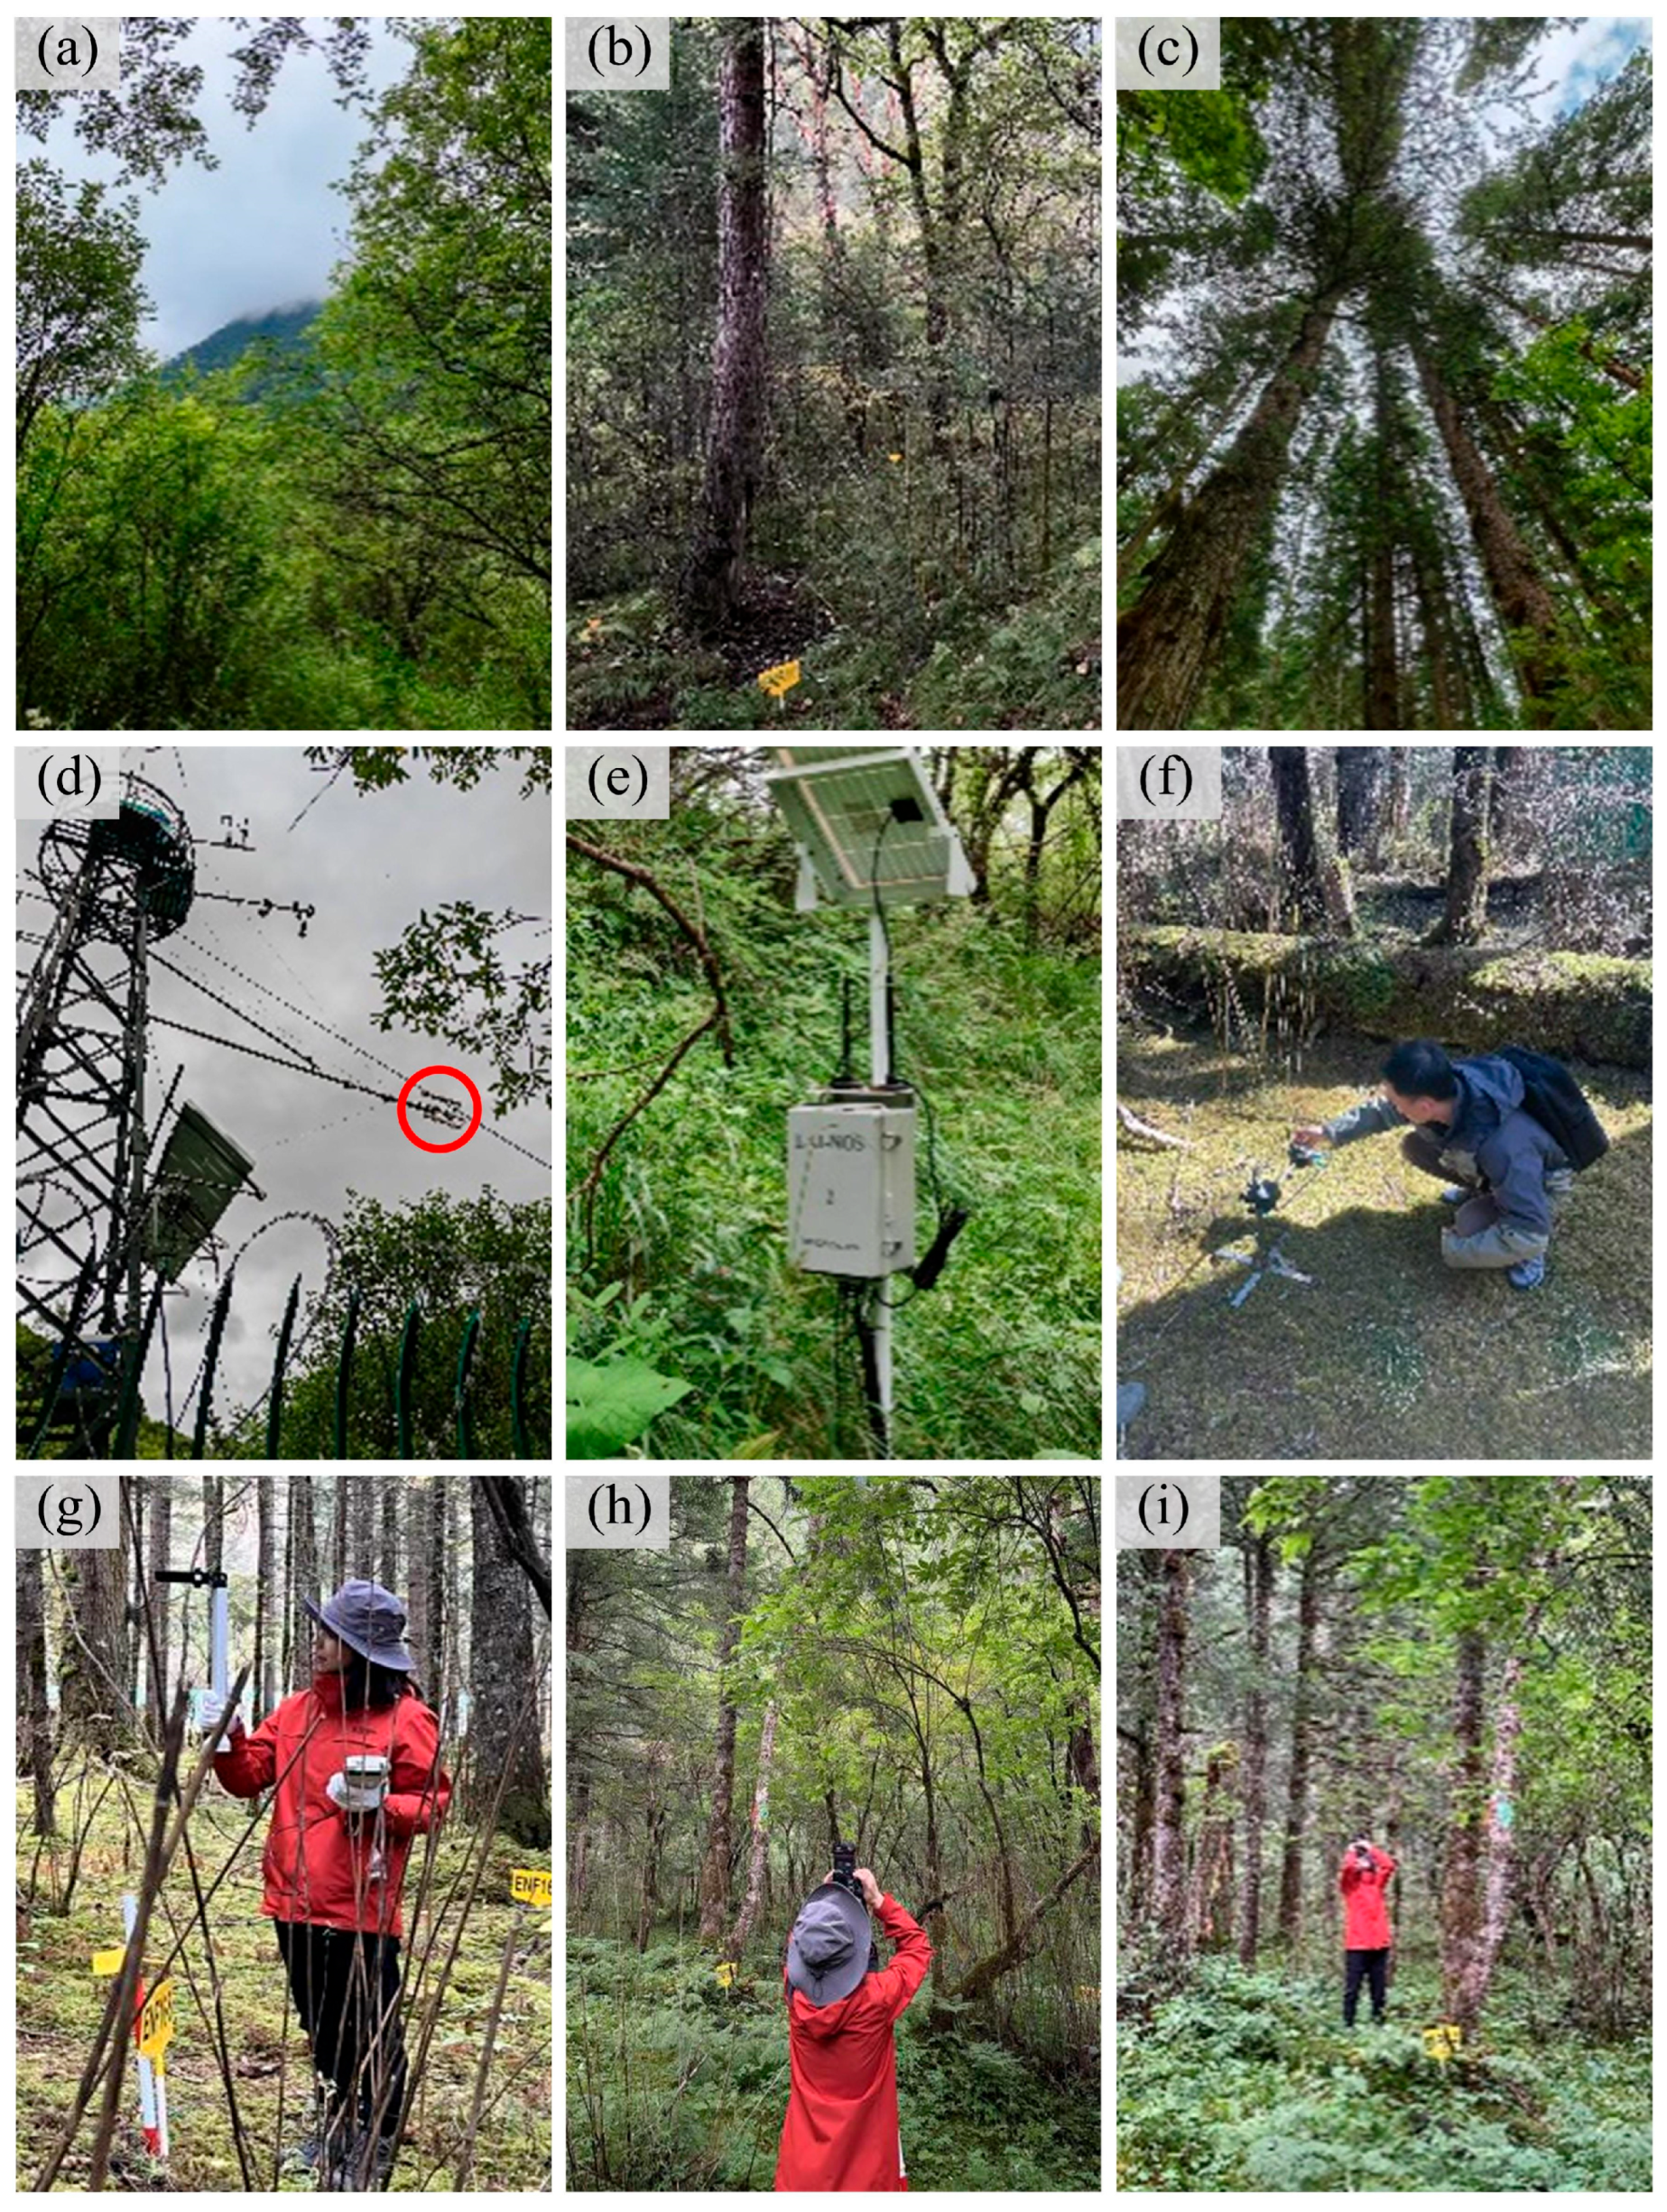
The basic information of the five observation instruments used in this study (FPARnet, LAI-NOS, LAINet, LAI-2200, and DHP) is provided in Table 1, and the field views of the experimental area is shown in Figure 2. It should be noted that, due to certain limitations in data acquisition with the LAI-2200, there are relatively few valid time points within the same month that can be matched with LAI-NOS. Therefore, multiple sampling periods were integrated in the analysis to increase both the sample size and representativeness.
Table 1.
Basic information of observation instruments.
Figure 2.
Field views of the experimental area. (a–c) show the actual landscapes of the DSH, DBF, and ENF regions, respectively. (d–f) show the instrument installation setups for FPARnet, LAI-NOS, and LAINet, respectively, with the red circle in (d) highlighting the FPARnet instrument. (g–i) show the field measurement scenes using the LAI-2200 and DHP instruments, respectively.
2.2.1. FPARnet
The FPARnet fully automated photosynthetically active radiation (PAR) instrument is a wireless networked observational system based on an array of quantum sensors. It calculates FPAR using the radiation balance equation by simultaneously measuring incident PAR above the canopy, reflected PAR above the canopy, transmitted PAR below the canopy, and soil-reflected PAR below the canopy. Observation nodes were installed both above and below each tower. In DSH, two nodes were installed above the tower at approximately 10 m, and two nodes were installed below the tower at an average distance of 5 m from the tower center, with a height of 1 m. In DBF, one node was installed above the tower at approximately 28 m, and three nodes were installed below the tower at an average distance of 11 m from the tower center, at a height of 1 m. In ENF, two nodes were installed above the tower at 45 m, and two nodes were installed below the tower at an average distance of 11 m from the tower center, at a height of 1 m. FPAR was calculated for each tower using paired sensors from above and below the tower. For data preprocessing, node pairs with a daily missing rate greater than 40% were first removed; subsequently, dates with fewer than two remaining node pairs were excluded from further analysis, resulting in reliable daily FPAR values, denoted as FPARFPARnet.
2.2.2. LAI-NOS
The LAI-NOS system is an automated LAI observation system based on digital hemispherical photography. It captures canopy images through a fisheye lens and estimates LAI by analyzing canopy gap fraction using image processing algorithms grounded in radiation transfer theory [30]. Gao et al. demonstrated that LAI calculated using a multi-angle approach is more stable than that obtained from a single-angle measurement [19]. Therefore, this study adopts LAI derived from the multi-angle method of the LAI-NOS as the observational value. The nodes of the system are distributed around each observation tower within a defined radius, with 10 nodes per tower. The distribution radii around the 75 m, 30 m, and 10 m towers are 90 m, 80 m, and 75 m, respectively. For data preprocessing, node data with a confidence level below 0.6 were first excluded. Subsequently, dates with at least four remaining node measurements were retained, resulting in reliable daily LAI values. The confidence level was calculated based on the assumption that LAI values do not vary significantly within a single day, by comparing the differences in LAI between two time periods to assess data reliability [19]. Following the preprocessing steps, FPAR was calculated using the Beer–Lambert law and denoted as FPARLAI-NOS.
2.2.3. LAINet
LAINet is an automated instrument based on quantum sensors that estimates LAI by calculating the canopy’s transmittance of sunlight from different angles [31]. In the study area, this system was deployed only in the ENF. One node was installed on the tower to measure incident radiation above the canopy at a height of approximately 45 m, while 11 nodes were placed in the understory to measure transmitted radiation below the canopy. The understory nodes were distributed within a 45 m radius centered on the tower, with an installation height of approximately 0.5 m. For data preprocessing, a strict quality control procedure was applied, including checks for temporal completeness and spatial representativeness of nodes. Following the preprocessing steps, FPAR was calculated using the Beer–Lambert law and denoted as FPARLAINet.
2.2.4. LAI-2200
The LAI-2200 Plant Canopy Analyzer uses a fisheye optical sensor to simultaneously measure incident radiation above the canopy and transmitted radiation below it [32]. Canopy light interception data are collected at five zenith angles, and LAI is calculated based on radiative transfer theory. In this study, incident radiation above the canopy was measured automatically by placing the sensor rod in an open area, while transmitted radiation below the canopy was measured manually using a manual sensor rod. At LAI-NOS locations, LAI-2200 measurements were conducted synchronously, strictly maintaining the same measurement angles as LAI-NOS. For locations without LAI-NOS, a nine-point grid sampling scheme was implemented. Meanwhile, measurements were strictly carried out under suitable weather conditions: primarily on overcast days, at sunrise or sunset on sunny days, and were avoided during rain, fog, strong winds, or other adverse weather conditions. The collected data were processed using FV2200 software (v2.1.1) to calculate LAI based on rings 0–4. After discarding zero values, the instantaneous measurements for each day were averaged to obtain daily LAI, which was then used to calculate FPAR using the Beer–Lambert law and denoted as FPARLAI-2200.
2.2.5. DHP
DHP employs a fisheye camera (Canon EOS 600D with Canon EF 8–15 mm f/4L USM) to capture upward images of the canopy, providing a 180° field of view. In this study, DHP measurements were conducted upward at the LAI-NOS locations, maintaining the same measurement angles as LAI-NOS. For locations without LAI-NOS, a nine-point grid sampling scheme was implemented. Measurements were primarily conducted under overcast conditions, occasionally under partly cloudy skies, and were suspended during rain, fog, strong winds, or other adverse weather conditions. Subsequently, LAI was calculated using the CAN-EYE software with the “LAI-2200, 4 rings” method [33]. After excluding zero values, the instantaneous measurements for each day were averaged to obtain daily LAI, which was then used to calculate FPAR via the Beer–Lambert law, denoted as FPARDHP.
2.3. Methods
2.3.1. FPAR Calculating Based on the FPARnet Observation System
FPARnet is developed on the basis of radiative transfer theory and estimates FPAR by measuring the PAR components at positions above and beneath the canopy. This system utilizes the four-component PAR dynamic decomposition method (Equation (1)), which effectively removes soil background interference and ensures clear physical meaning, thereby achieving accurate estimation of canopy FPAR [13]:
where E0 is the incident PAR above the canopy, E1 is the reflected PAR above the canopy, E2 is the transmitted PAR below the canopy, and E3 is the soil-reflected PAR below the canopy.
2.3.2. A PAIe-LAI-FPAR Conversion Model Based on the LAI Observation System
- (1)
- Model Development
The LAI-NOS, LAINet, LAI-2200, and DHP observation systems usually consider all canopy elements within their field of view, including woody and non-woody components. This causes a large gap between the measured LAI and the true LAI. In addition, the clumping effect of leaves within the canopy can also influence the estimation of LAI. To this end, the study employs the effective Plant Area Index (PAIe) as the output from the instruments and calibrates LAI by correcting for both the woody-to-total area ratio and the leaf clumping parameter. The calibration model is expressed as follows [34,35,36,37,38]:
where α is the woody-to-total area ratio, γe represents the ratio of leaf area to shoot area within a shoot, and Ωe accounts for foliage clumping at scales larger than individual shoots, and is referred to as the element clumping index.
Subsequently, LAI was converted to FPAR using Beer–Lambert law [15]:
where k is the light extinction coefficient, describing the attenuation of light through different media or surfaces, and LAI is leaf area per ground area (m2 m−2).
Accordingly, by combining Equations (2) and (3), the PAIe-LAI-FPAR conversion model can be expressed as follows:
For the light extinction coefficient k, its value was approximated based on Beer–Lambert law [39], allowing the derivation of daily dynamic k values:
where E2 represents the transmitted PAR below the canopy, E0 represents the incident PAR above the canopy, and PAIe is the effective plant area index measured by the optical instruments.
However, since substituting Equation (5) into Equation (4) would eliminate PAIe, monthly mean k was used in the calculation. Meanwhile, k calculated from PAIe derived using LAI-NOS was adopted as the standard annual value for the manual instruments.
- (2)
- Parameter Sensitivity Analysis
To quantify the influence of different input parameters on model outputs, the parameter sensitivity analysis was conducted for the PAIe-LAI-FPAR conversion model, providing a basis for optimizing parameter values. First, the ranges of all parameters were determined based on literature review and prior experiments, with k ∈ (0, 1.4] [40,41,42], Ωe ∈ (0, 1] [43,44], α ∈ (0, 0.6] [45,46,47], and γe ∈ [1, 1.8] [34,46]. On this basis, the Sobol global sensitivity analysis method was used to obtain the first order (S1) and total order (ST) sensitivity indices [48]. The first order sensitivity index indicates the independent effect of a parameter, while the total order sensitivity index represents the global effect of the parameter, including both its independent contribution and all interaction effects [49].
2.3.3. Comparative Analysis of Multi-Source Ground-Based Observations
There are differences in the spatial distribution of sampling points among the observation techniques (Figure 1). To address this, differentiated comparative analysis was applied, including correlation and consistency analyses. For LAI-NOS and LAINet, the nodes were distributed around each observation tower. Therefore, the measurements from all nodes around each tower were averaged to obtain a representative value at the tower center, which was then compared with FPARFPARnet. For LAI-2200 and DHP, the sampling points were not spatially distributed around FPARnet. However, simultaneous measurements were conducted at each LAI-NOS point. Therefore, FPARLAI-2200 and FPARDHP were compared with FPARLAI-NOS. In this way, LAI-NOS sites served as the link for comparing the five observation techniques. In addition, to ensure data comparability, the daily FPAR values from each instrument were strictly matched in time during the comparative analysis.
For the correlation analysis, linear correlation was applied. The evaluation metrics included R and RMSEobs. For the consistency analysis, the Bland–Altman plot was used. The mean FPAR of the two instruments was plotted on the x-axis, and the difference on the y-axis. The evaluation metrics included systematic error (Bias) and Limits of Agreement (LoA) [50]. Their calculation formulas are shown in Equations (6)–(9):
where n is the total number of sampling points. represents the FPAR measured by the reference instrument, and represents the FPAR measured by the non-reference instrument. di is the difference between the FPAR values calculated from the two instruments. Bias is the mean of the differences, SDd is the standard deviation of the differences, and LoA denotes the limits of agreement.
2.3.4. Normalization-Calibration Modeling of FPAR Obtained from Multi-Source Ground-Based Observations
To reduce differences among FPAR obtained from different observation techniques, normalization-calibration modeling was applied. FPAR from each observation technique was calibrated using this approach. FPARLAI-NOS and FPARLAINet could be directly modeled against FPARFPARnet. For FPARLAI-2200 and FPARDHP, FPARLAI-NOS was used as an intermediate variable to establish the model indirectly. The method was as follows. FPARFPARnet was used as the dependent variable, and FPAR obtained from other instruments was used as the independent variable. Regression models were established for each case. Model parameters were tested using the t-test. Model performance was evaluated using R2 and RMSEpred, and further validated through leave-one-out cross-validation (LOOCV) to assess the model’s generalization ability (R2CV, RMSECV). On this basis, the regression model is applied to normalize FPAR from different observation techniques. The data before and after calibration are then compared with FPARFPARnet to assess the accuracy and effectiveness of this model.
3. Results and Analysis
3.1. Observation Stability of FPARnet
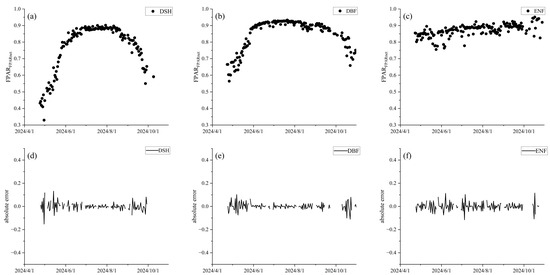
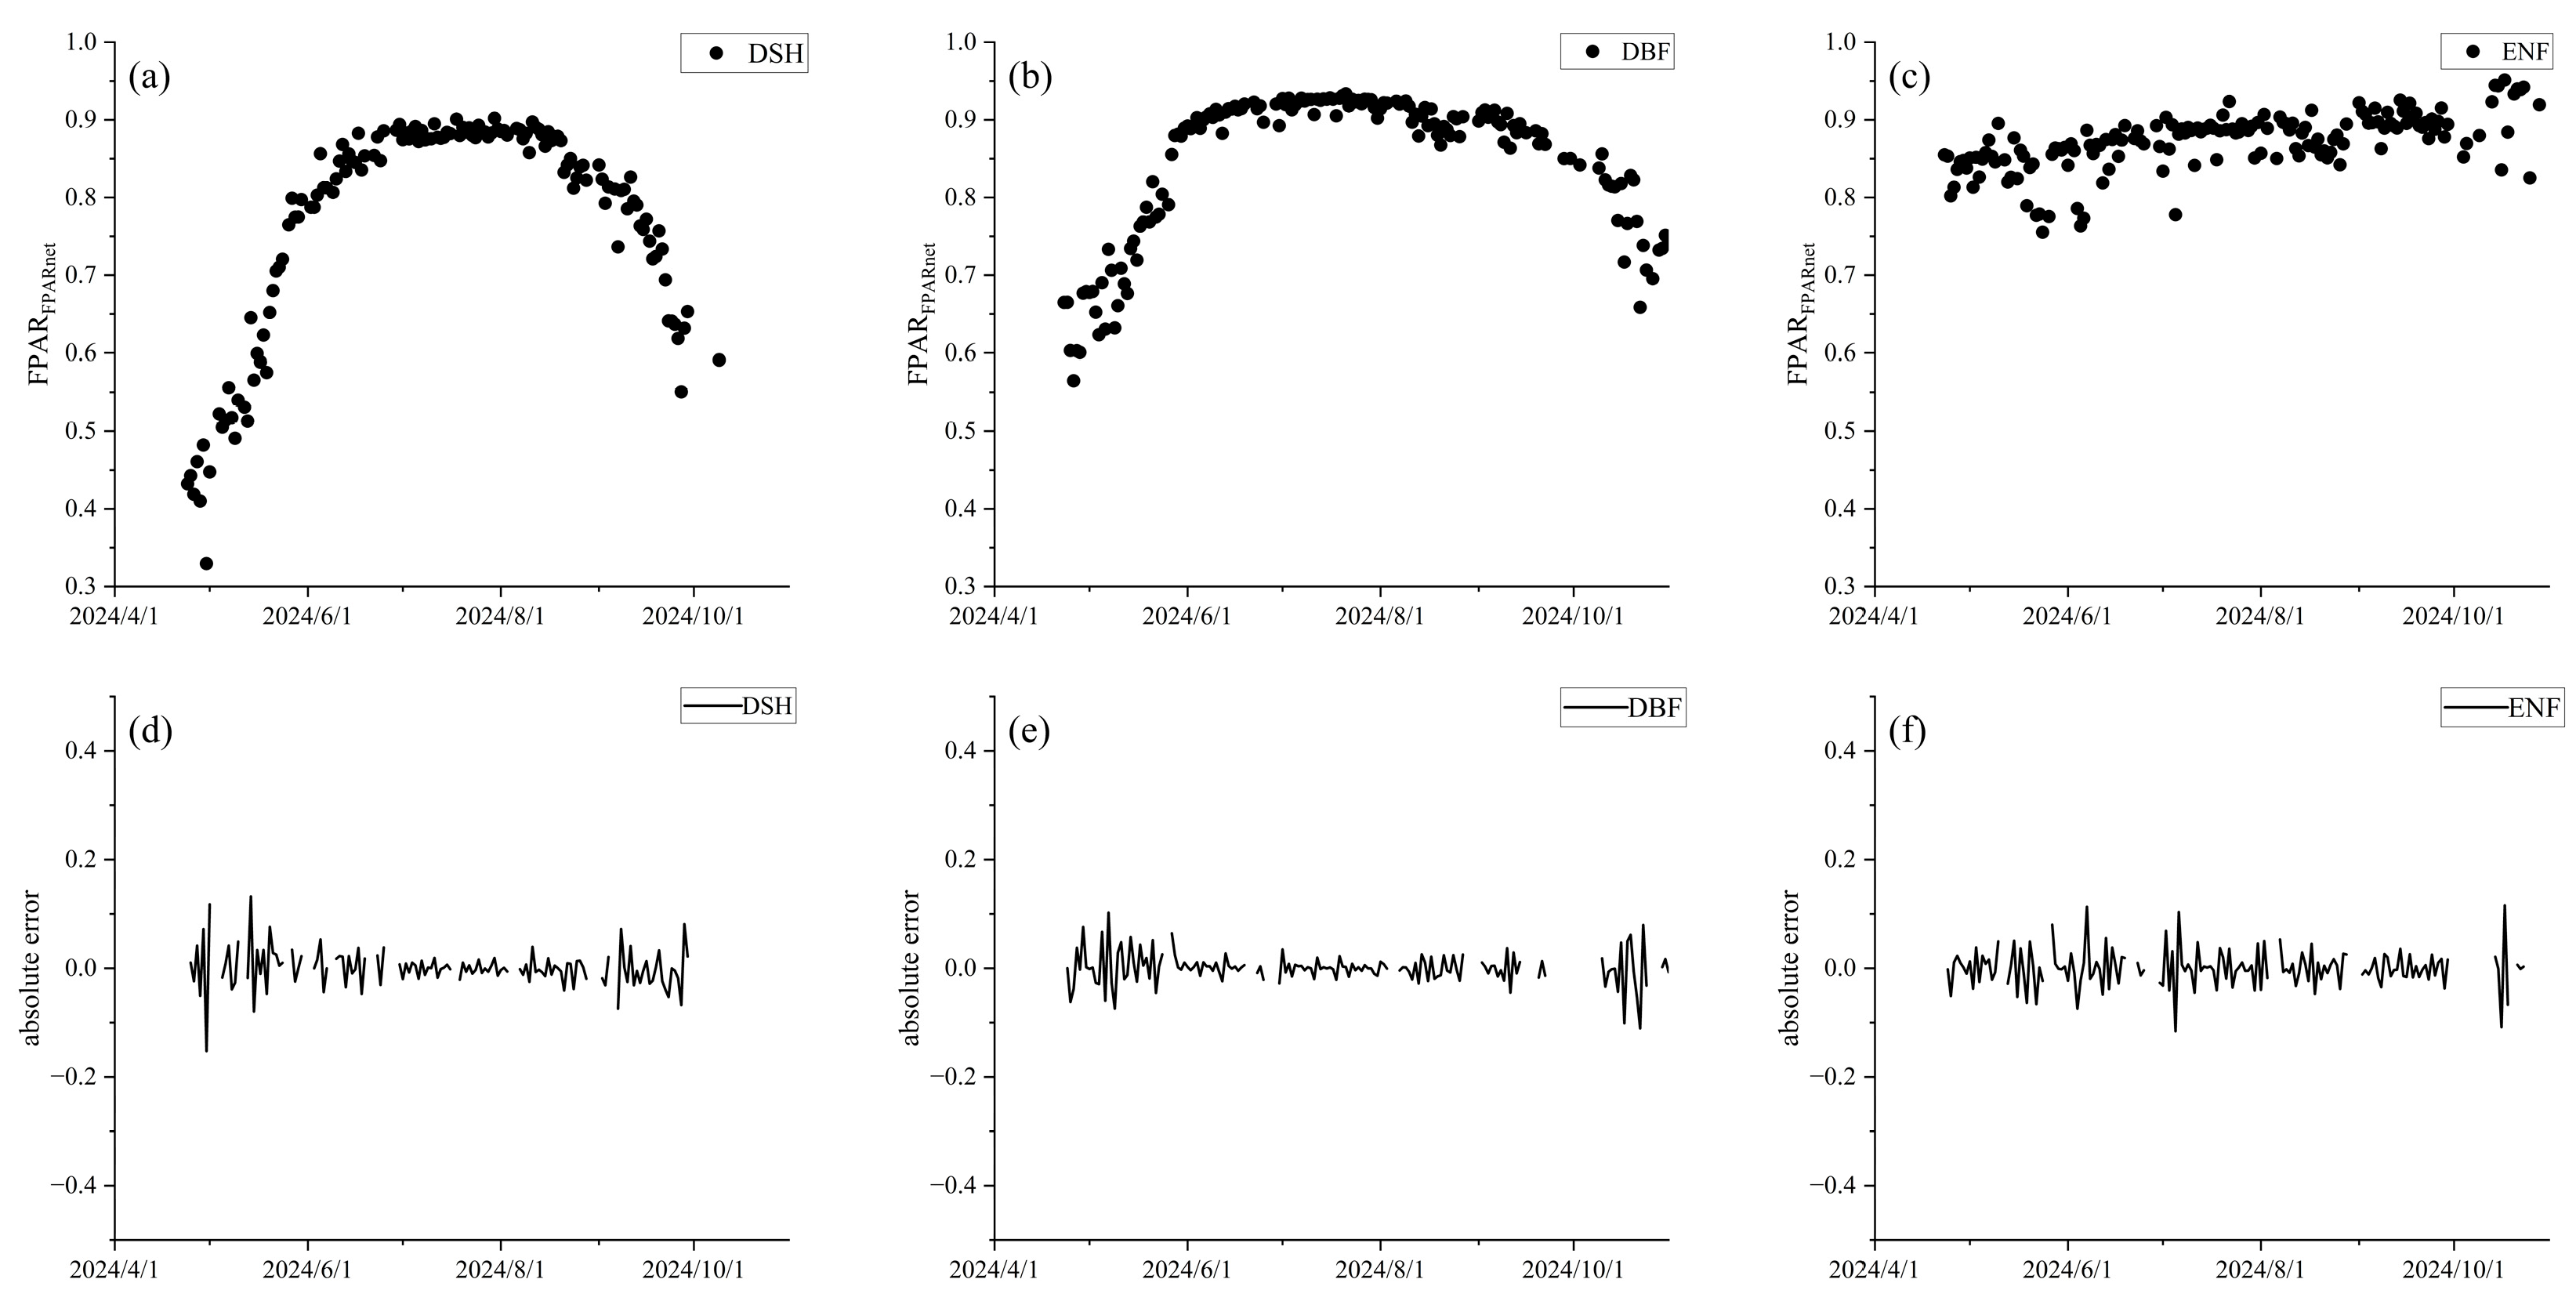
As shown in Figure 3, FPARnet accurately captures the seasonal dynamics of DSH, DBF, and ENF. The errors between consecutive days are small. This indicates that the instrument performs well and remains stable for long-term observations of these three vegetation types. Figure 3a–c shows the annual FPAR dynamics for the three vegetation types. FPAR of DSH and DBF exhibits typical seasonal fluctuations, first increasing and then decreasing. The peak of DBF occurs earlier than that of DSH, and it reaches a higher value and lasts longer. In contrast, FPAR of ENF remains relatively stable throughout the growing season, staying around 0.85. Generally, FPAR is expected to remain relatively stable between consecutive days. Therefore, absolute error (i.e., Second measurement−First measurement) is used to evaluate its daily variability. As shown in Figure 3d–f, errors for the three vegetation types are mostly concentrated around zero, with only a few dates showing larger errors. This indicates that FPARnet exhibits high measurement consistency at the daily scale.
Figure 3.
Observation stability of FPARnet, (a–c) show the FPAR time series for DSH, DBF, and ENF vegetation types, respectively. (d–f) show their corresponding absolute errors.
3.2. Parameter Sensitivity of the PAIe-LAI-FPAR Conversion Model
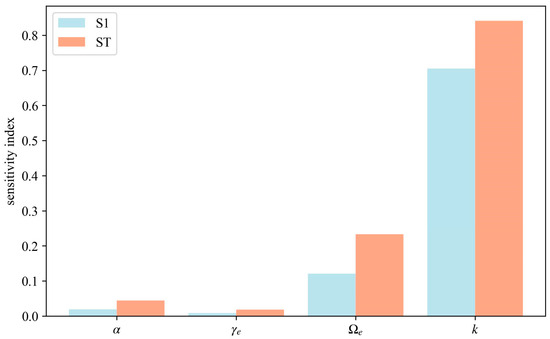
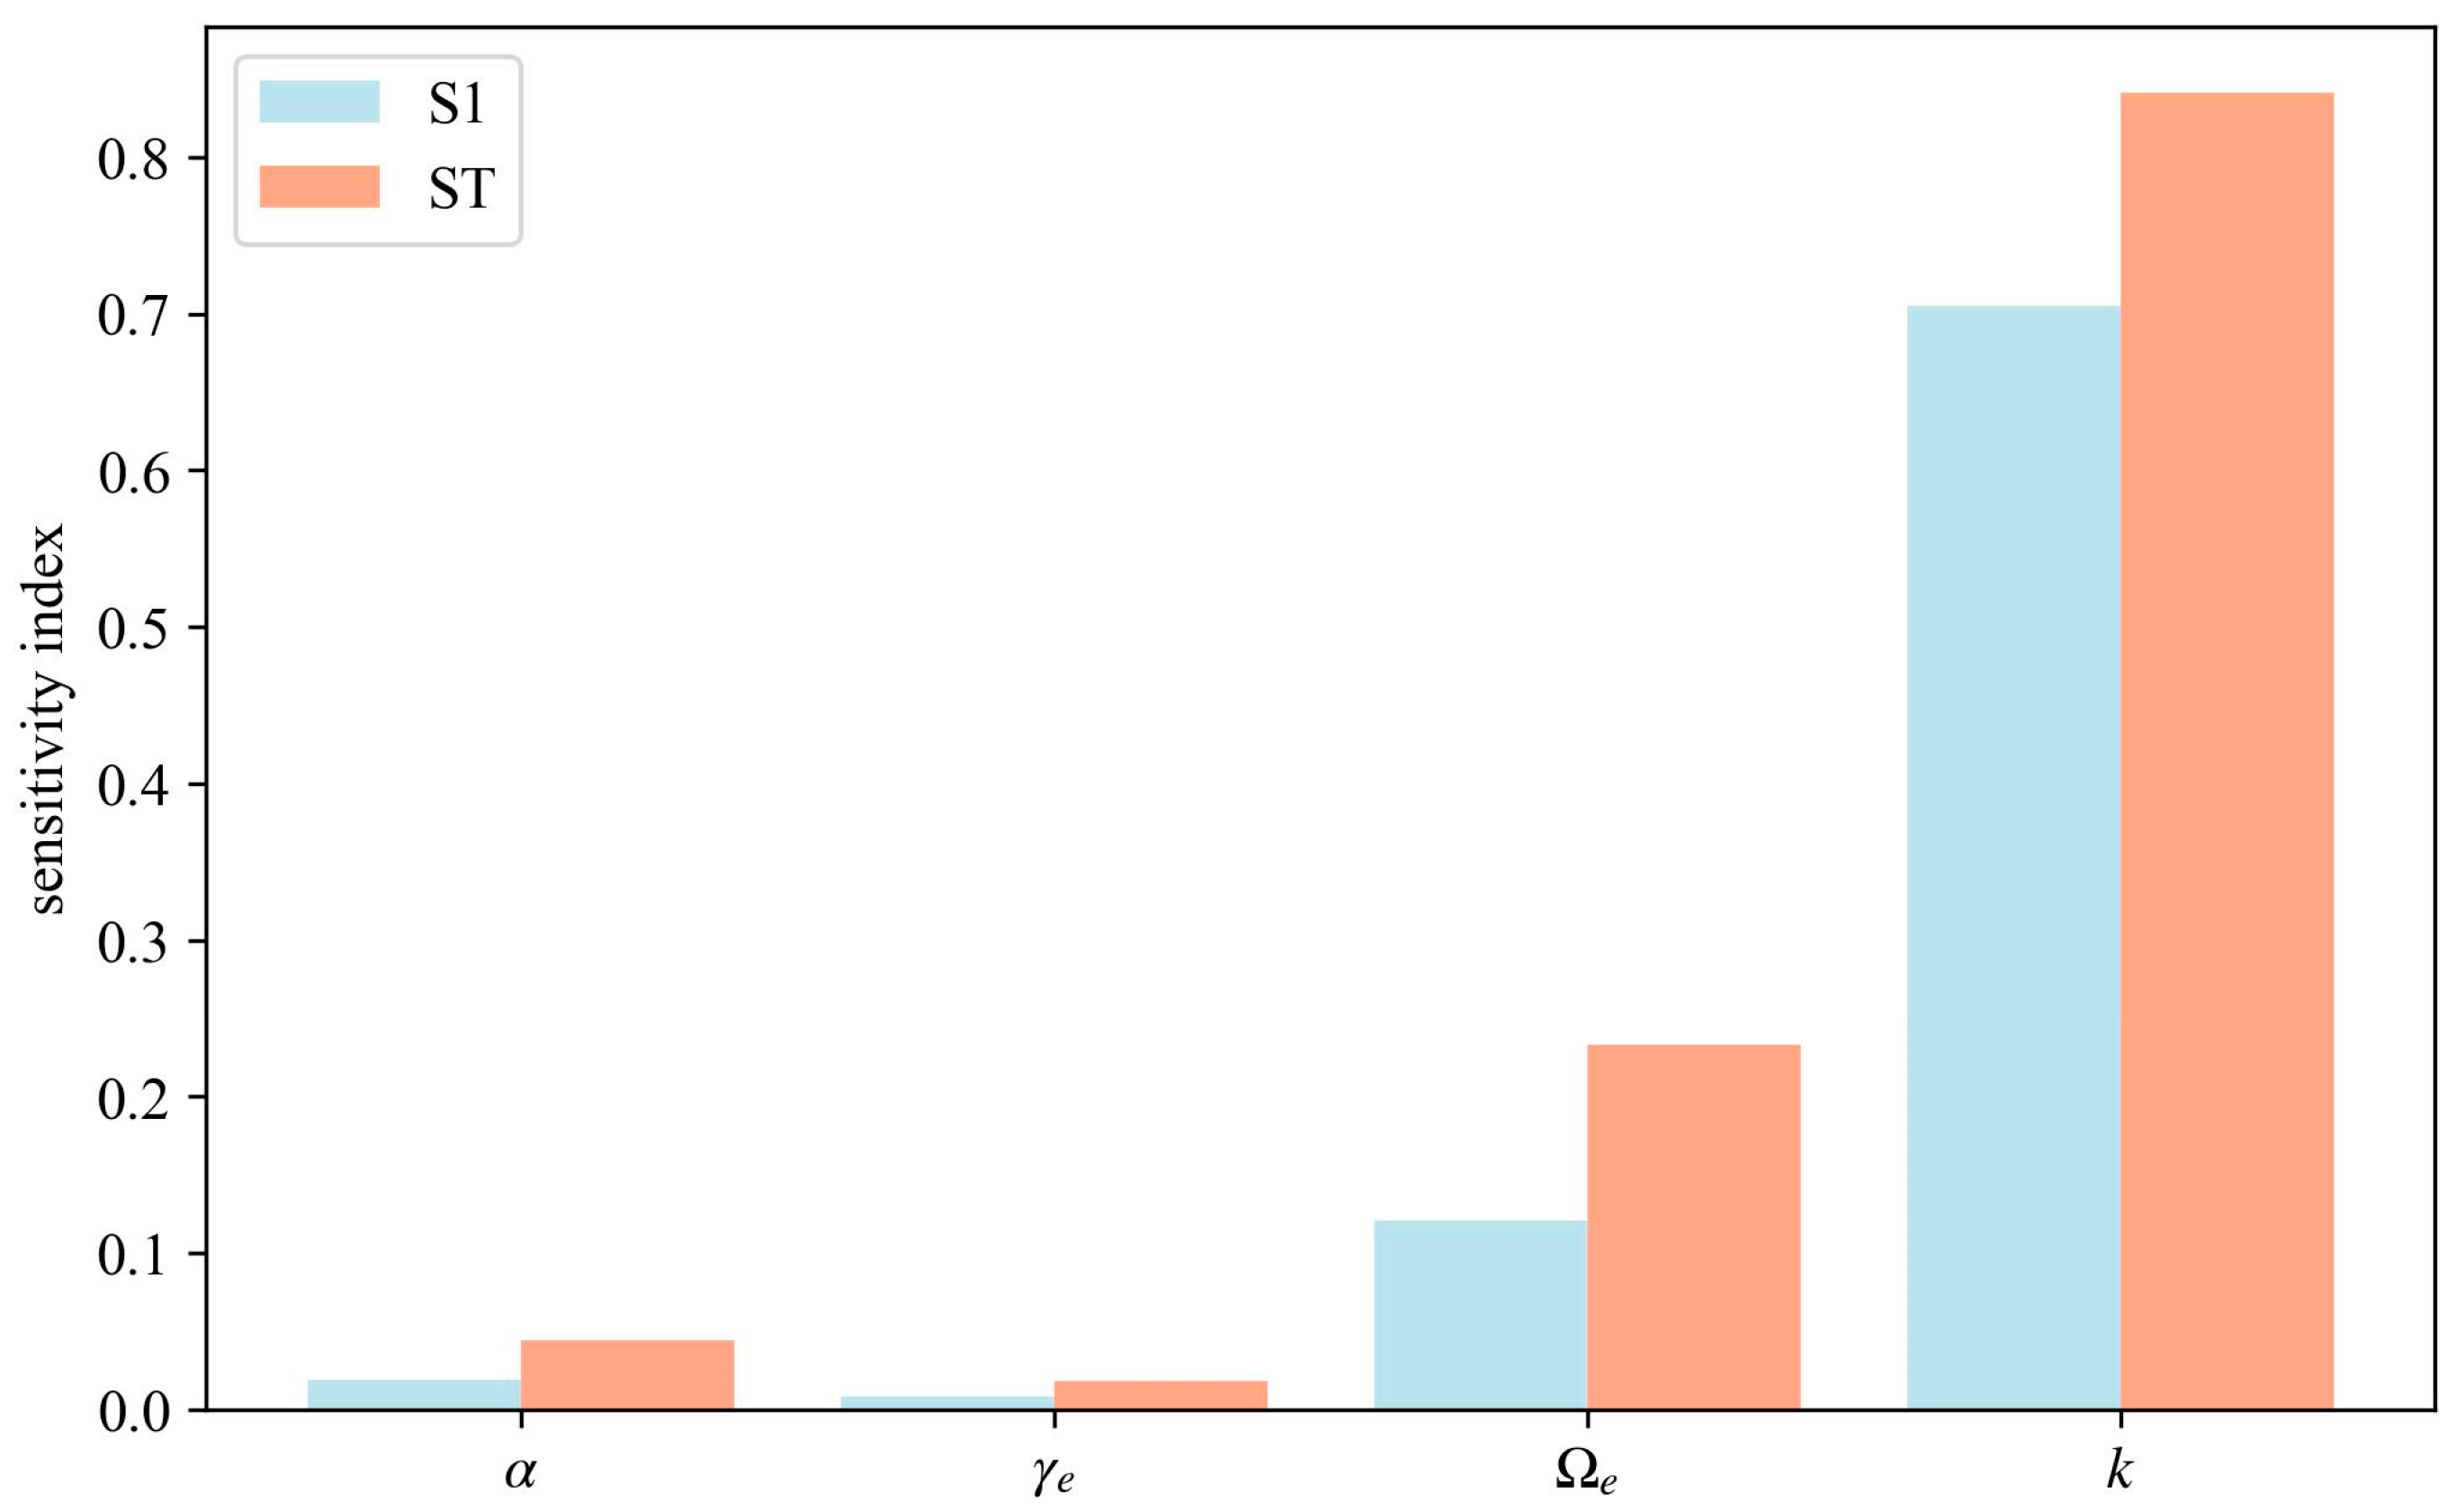
As shown in Figure 4, the parameter k exhibits significant sensitivity. Its first order sensitivity index is much higher than those of the other parameters, indicating that k has the strongest independent effect on FPAR. Meanwhile, k also has the highest total order sensitivity index, further confirming its dominant role in controlling FPAR variability among all parameters. Next, the sensitivity indices of the parameter Ωe are lower than those of k but still show a certain influence. It not only contributes directly to FPAR variability but also enhances its effect through interactions with other parameters. In contrast, the first-order and total order sensitivity indices of γe and α are both low. This indicates that they have weak independent effects on FPAR and, at the same time, the interactions with other parameters are also limited.
Figure 4.
Comparison of sensitivity indices S1 and ST for each parameter of the PAIe–LAI–FPAR conversion model.
Based on the above analysis, k and Ωe exhibit high sensitivity in the PAIe-LAI-FPAR conversion model. Therefore, accurately specifying k and Ωe can improve the model’s accuracy. In contrast, γe and α exhibit low sensitivity in the model. Their precision requirements are relatively low, allowing for appropriate simplification. In this study, the parameter k was dynamically calculated daily using Beer–Lambert law, and its monthly mean was used for subsequent analyses. Ωe was obtained from the daily dynamic clumping index automatically measured by LAI-NOS. The parameters γe and α were determined based on literature review and prior experimental data [35,45,46,51,52,53,54]. Their specific values are listed in Table 2.
Table 2.
Values of parameters α and γe.
3.3. Comparative Analysis of Mountainous Forest FPAR Derived from Multi-Source Ground-Based Observations
3.3.1. Comparison of FPARLAI-NOS and FPARLAINet with FPARFPARnet
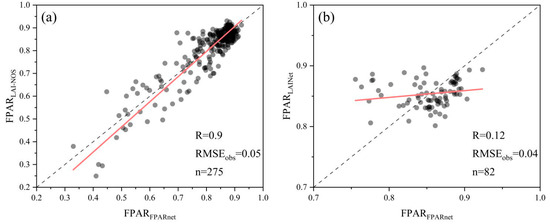
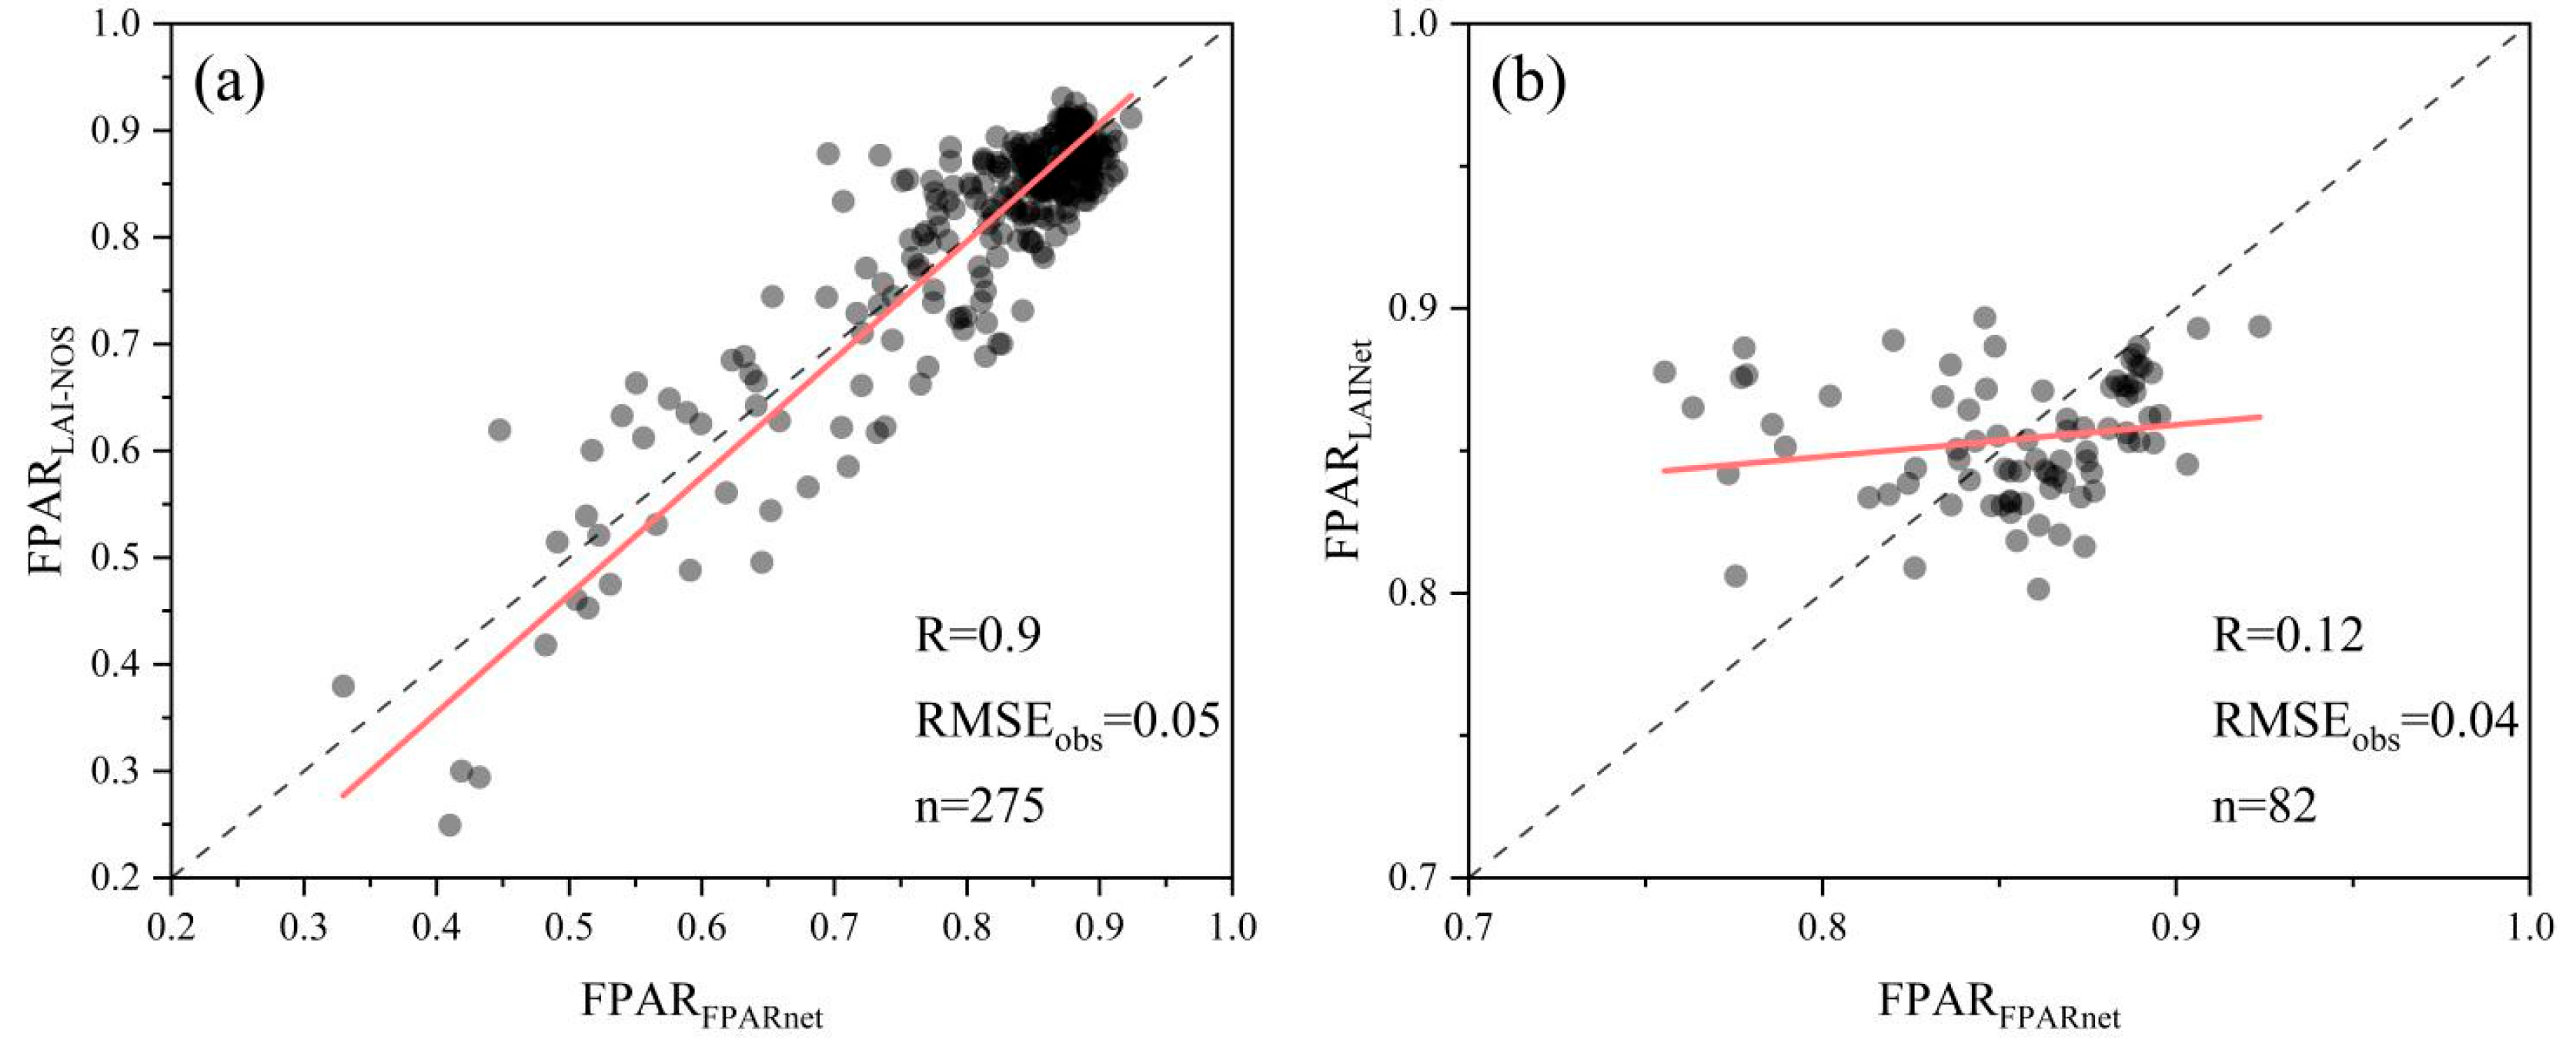
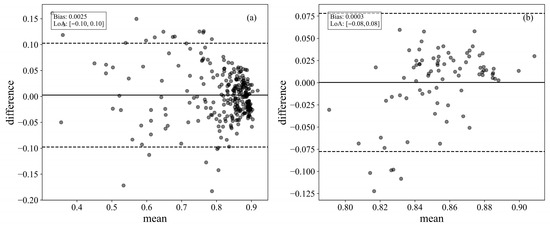
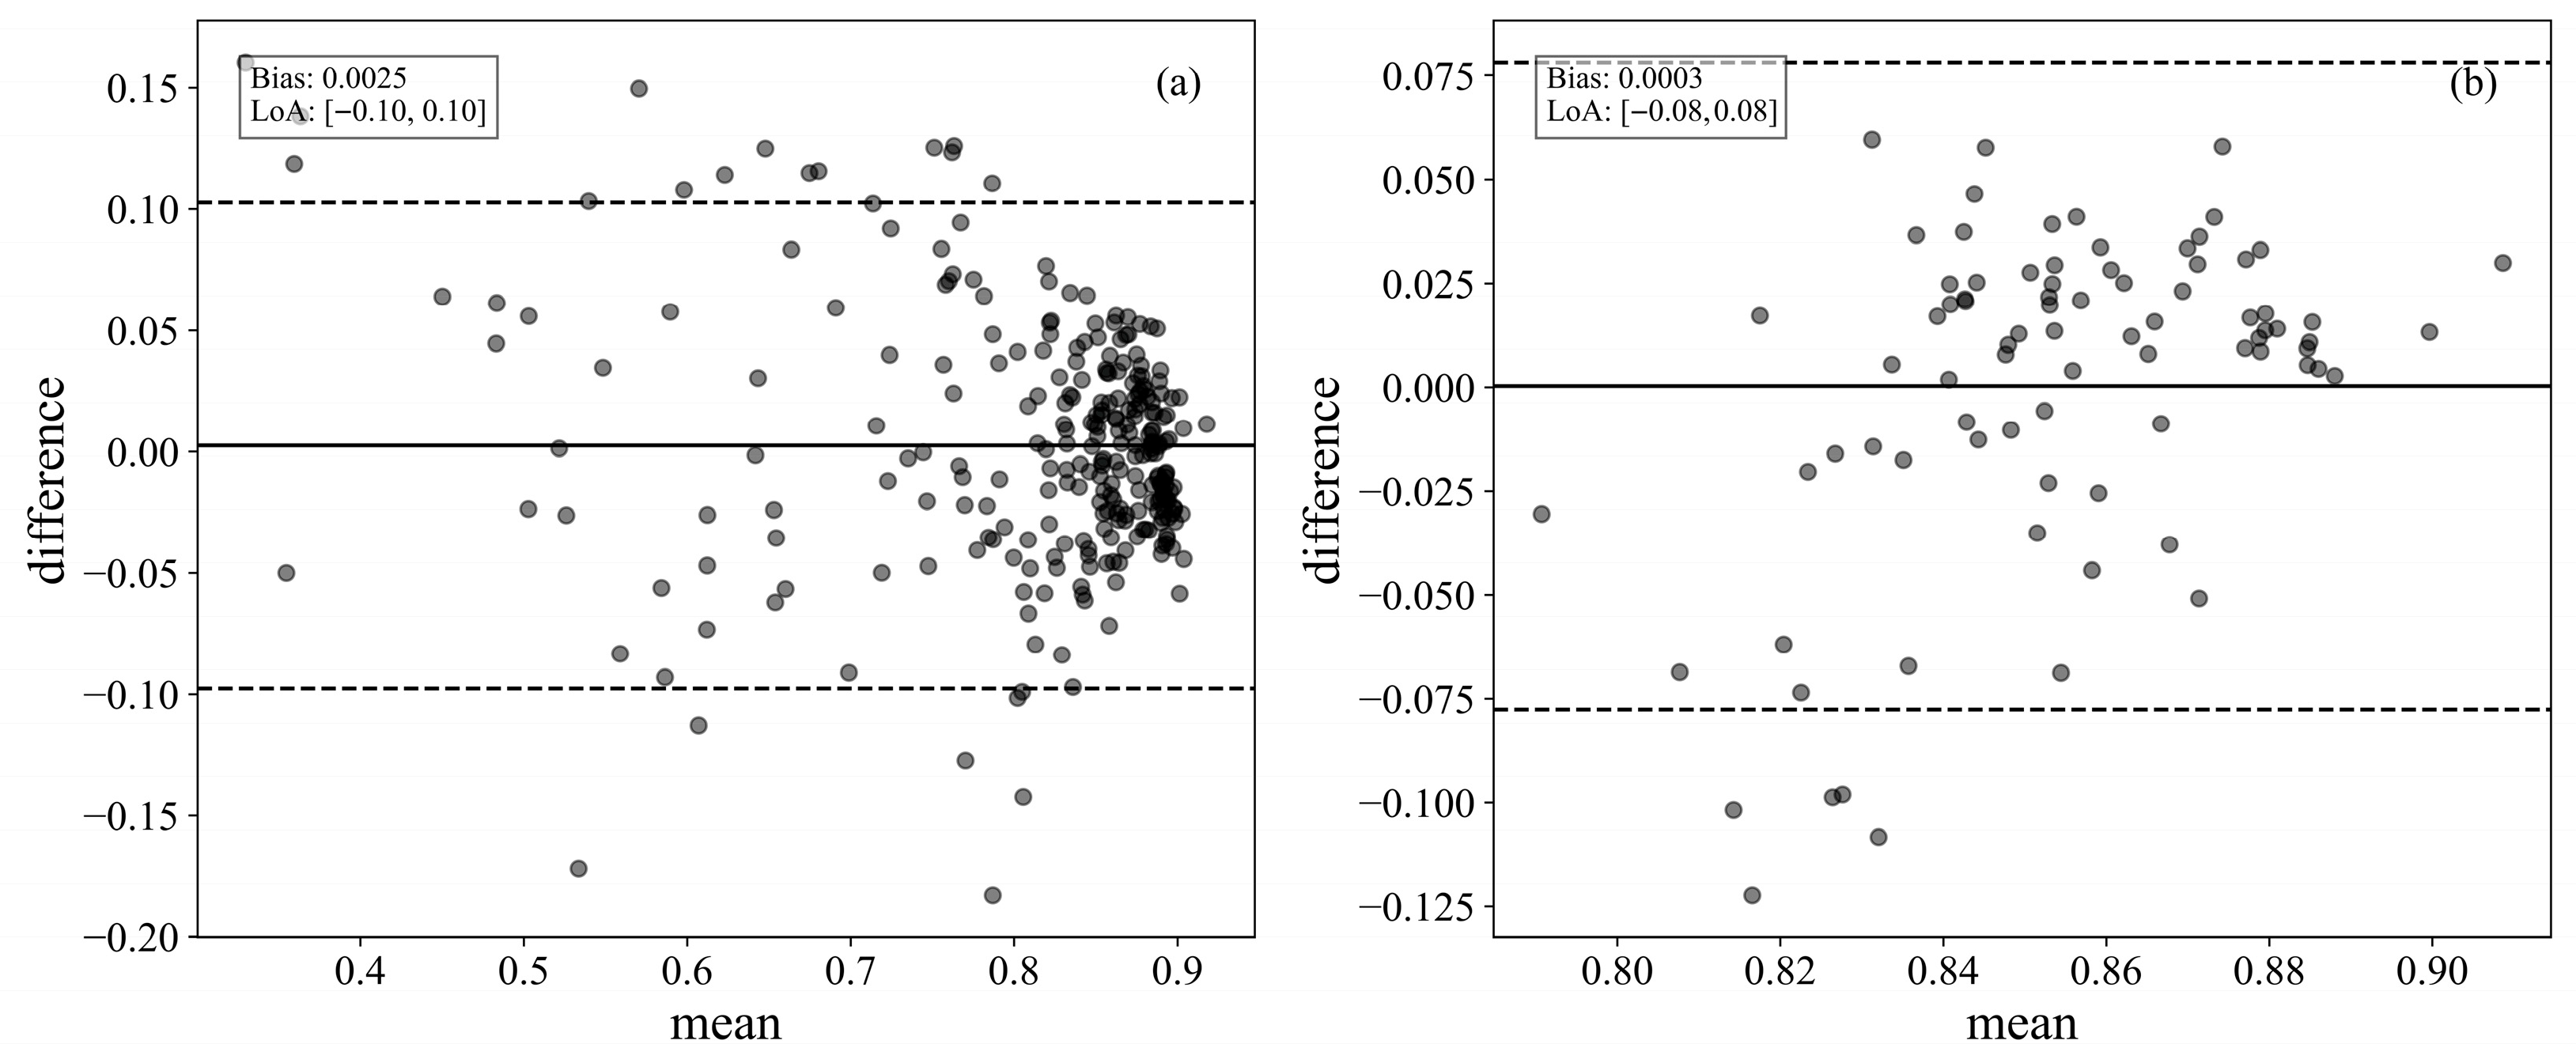
As shown in Figure 5, FPARLAI-NOS exhibits a strong positive correlation with FPARFPARnet, with R reaching 0.9 and RMSEobs equal to 0.05. In contrast, FPARLAINet exhibits a weaker correlation with FPARFPARnet, with R equal to 0.12. To further investigate, Bland–Altman plots are used to evaluate the consistency of each with FPARFPARnet. As shown in Figure 6, the comparison between FPARLAI-NOS and FPARFPARnet results in a mean difference of 0.0025. The limits of consistency are [−0.1, 0.1]. Only 7.6% (21/275) of points fall outside the limits. For FPARLAINet, the comparison with FPARFPARnet results in a mean difference of 0.0003. The limits of consistency are [−0.08, 0.08]. About 6.1% (5/82) of points exceed the limits.
Figure 5.
Comparison of correlation among FPAR obtained from different instruments. (a) correlation between FPARLAI-NOS and FPARFPARnet; (b) correlation between FPARLAINet and FPARFPARnet. The black dots represent individual sample points, the red line denotes the fitted regression line, and the dotted line indicates the 1:1 reference line.
Figure 6.
Comparison of consistency among FPAR obtained from different instruments. (a) consistency between FPARLAI-NOS and FPARFPARnet; (b) consistency between FPARLAINet and FPARFPARnet. The black dots represent individual sample points, the solid line represents the Bias, and the dotted lines indicate the LoA.
3.3.2. Comparison of FPARLAI-2200 and FPARDHP with FPARLAI-NOS
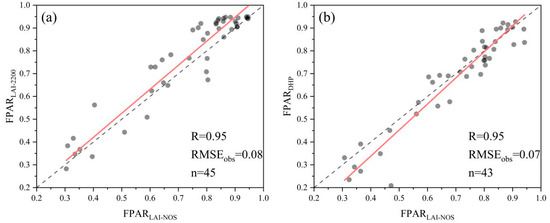
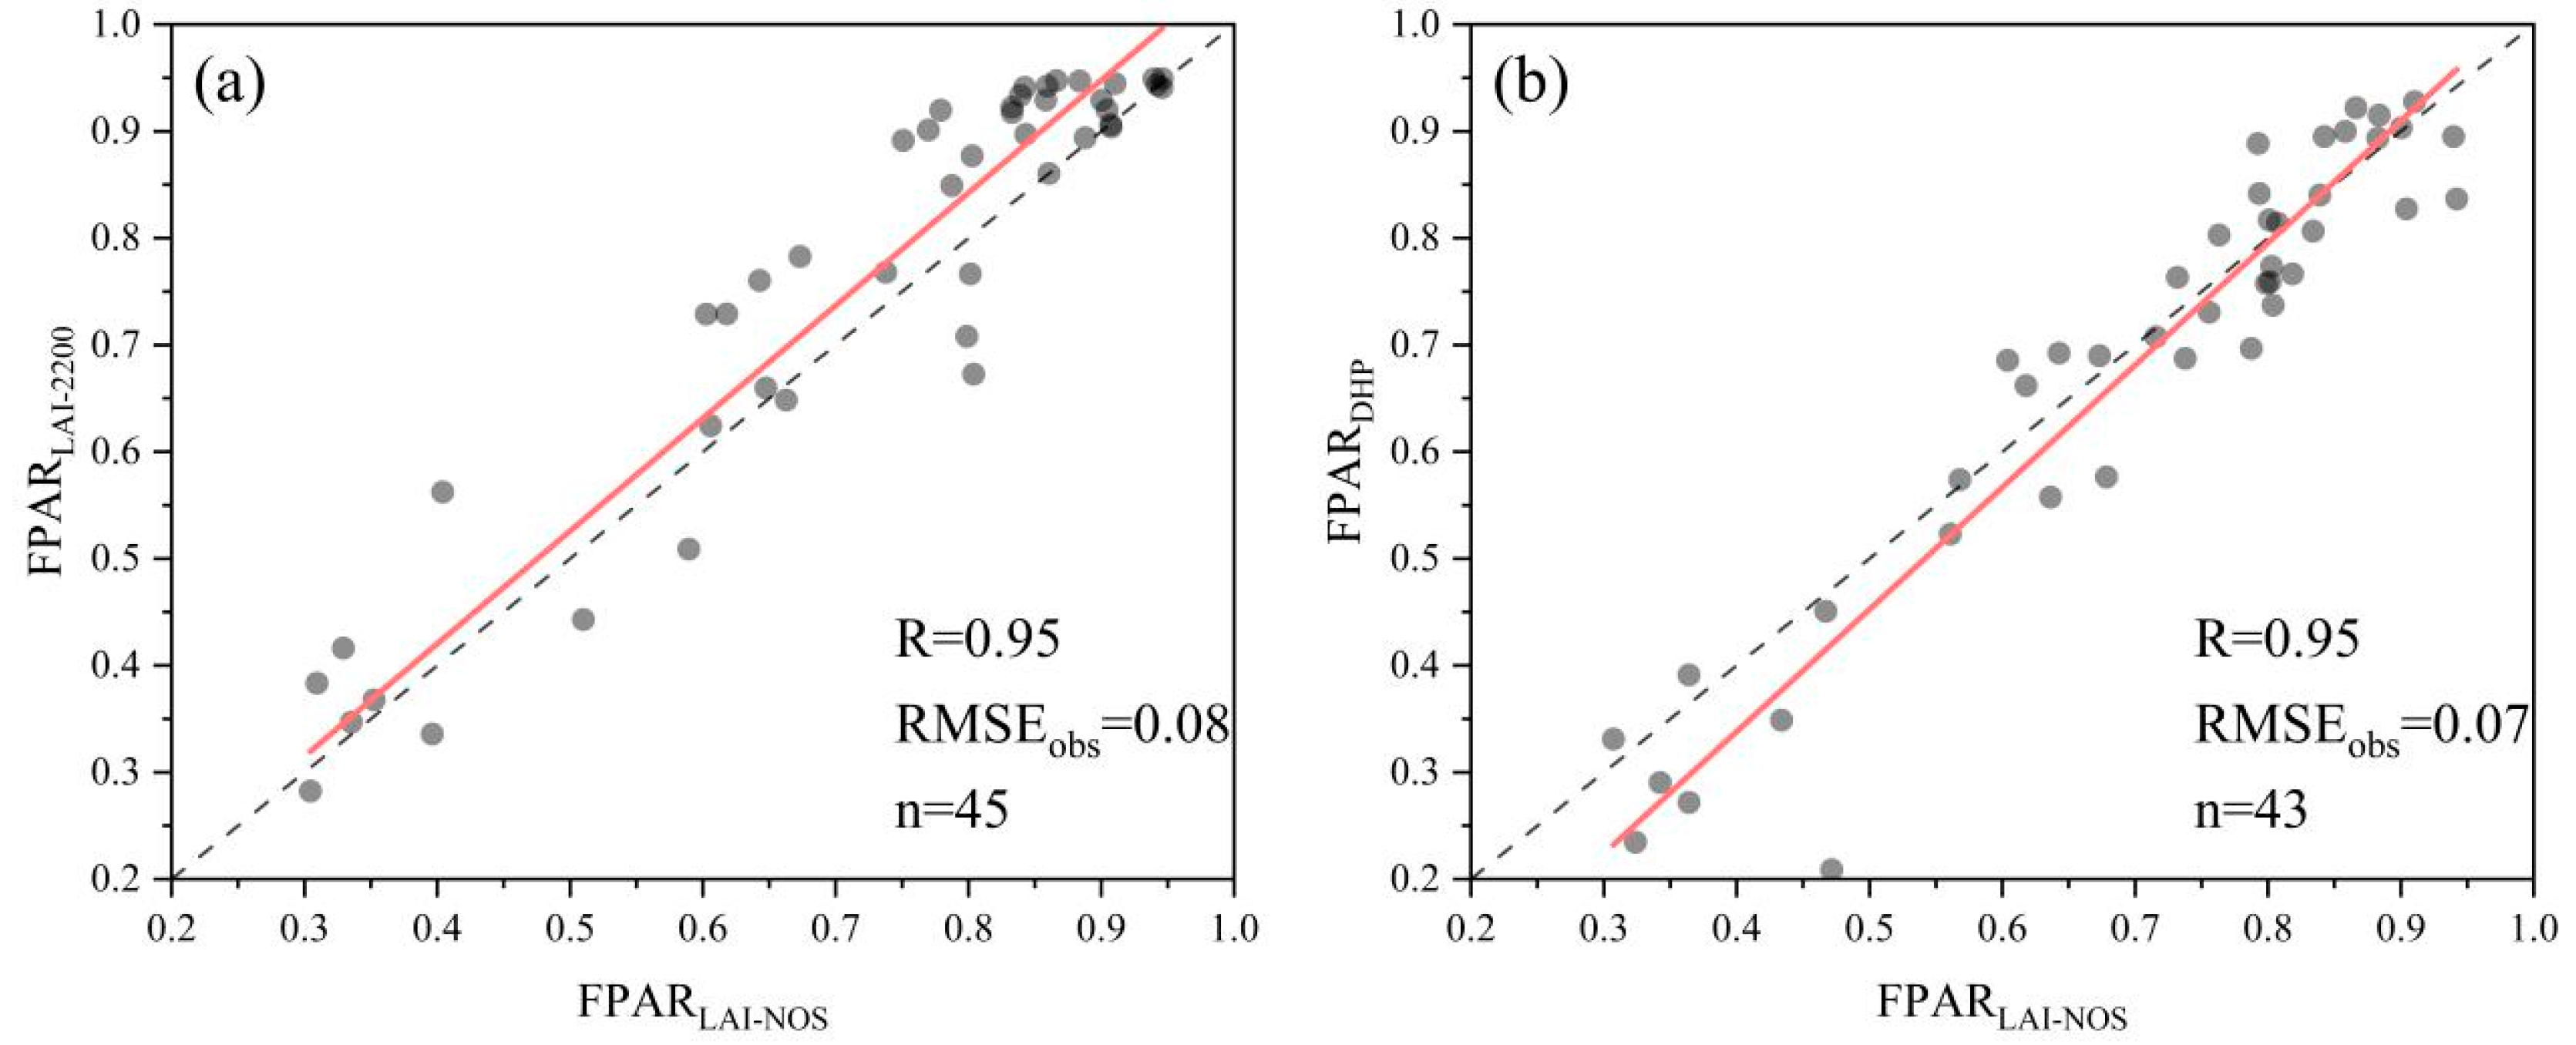
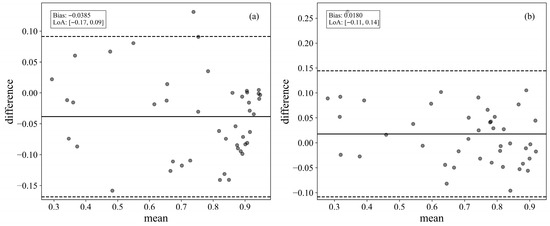
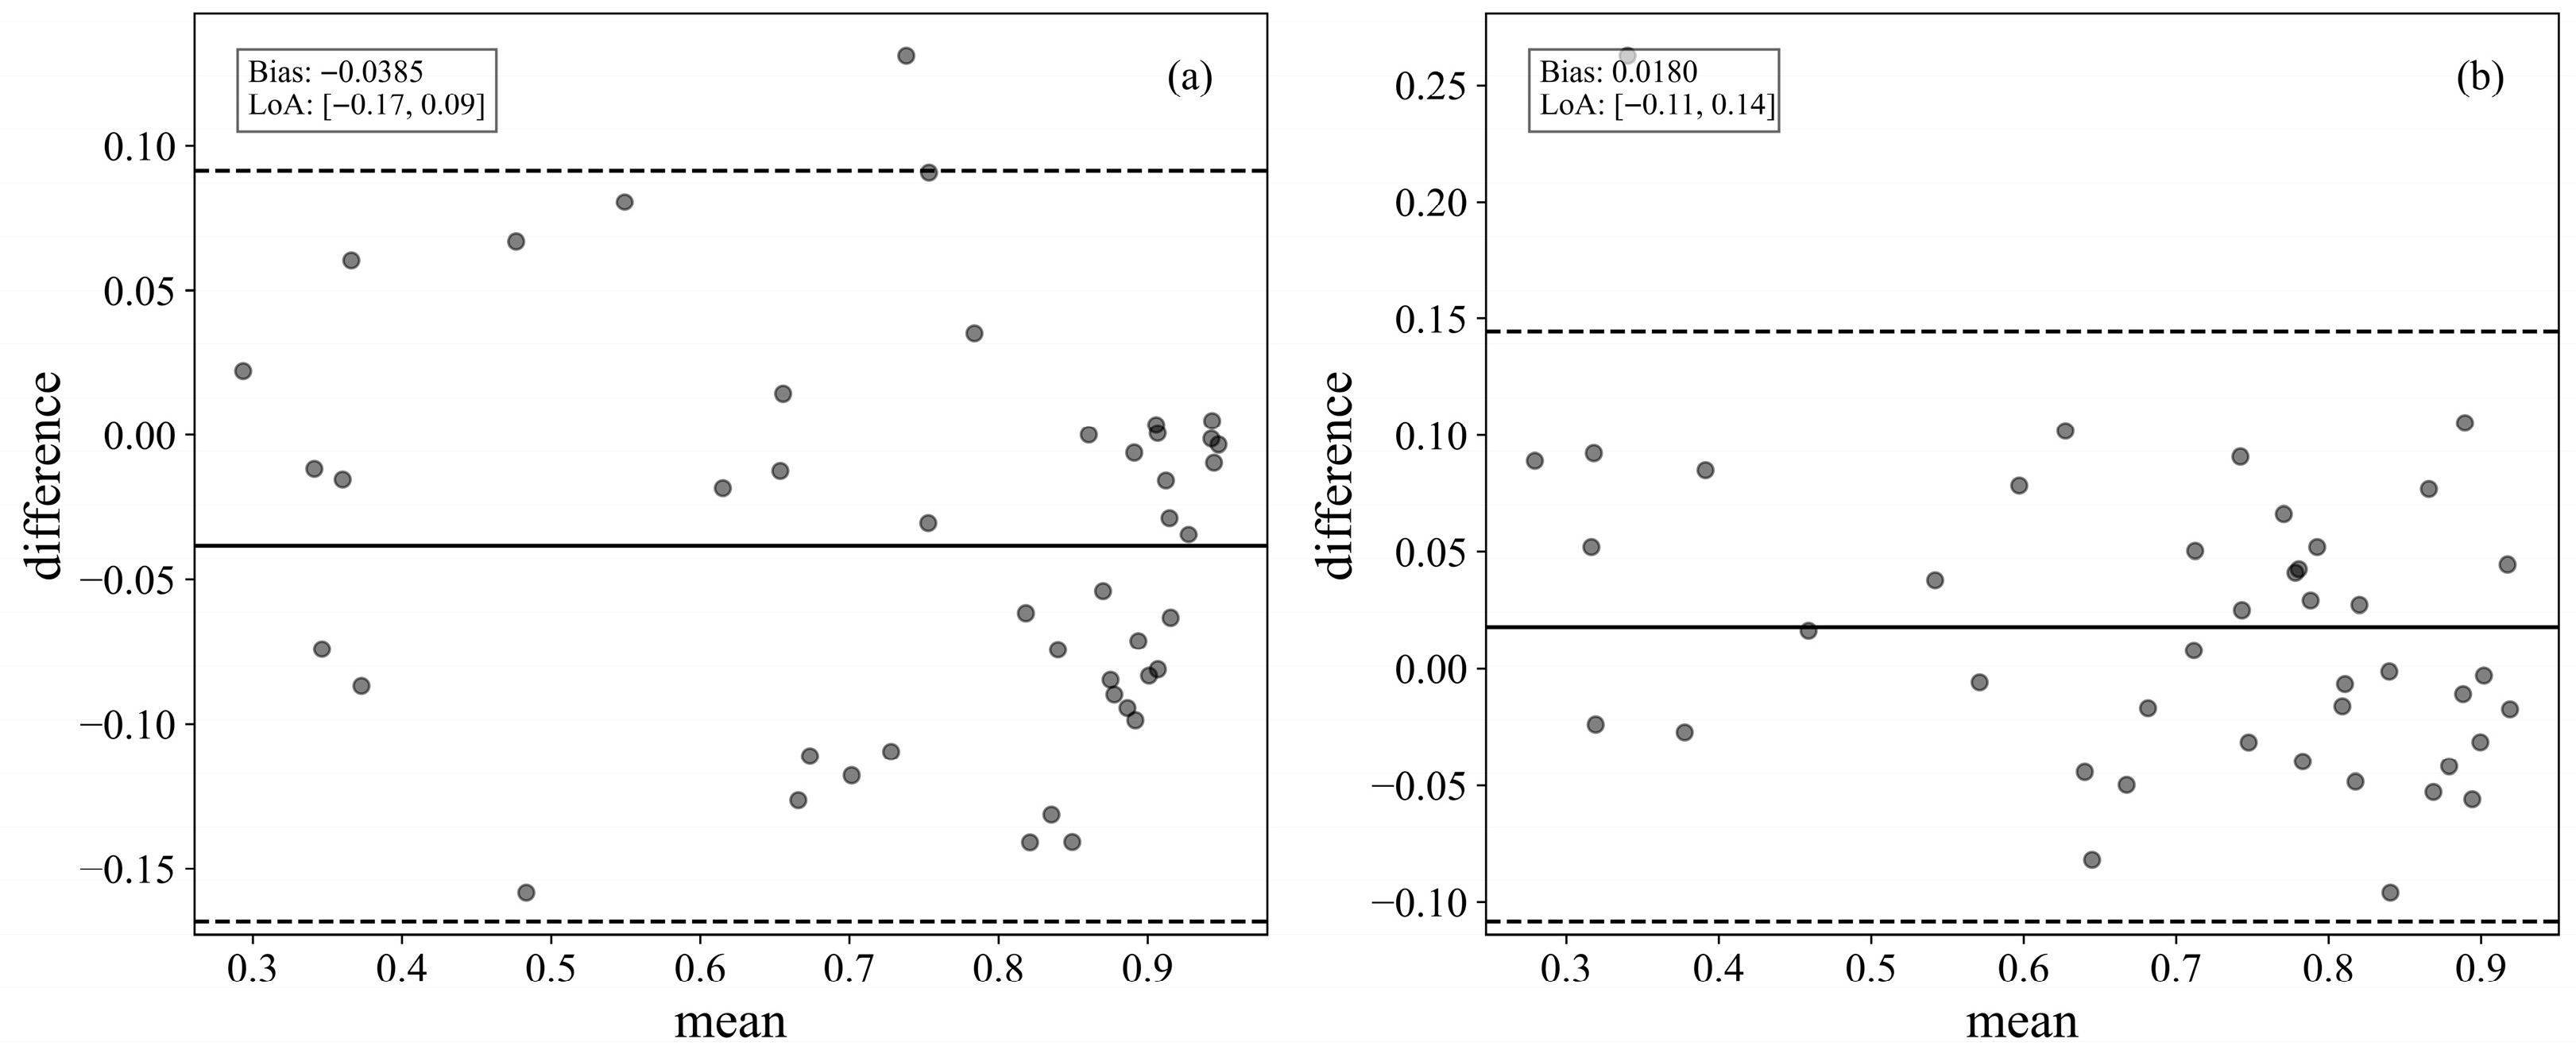
As shown in Figure 7, FPARLAI-2200, FPARDHP with FPARLAI-NOS all exhibit very strong correlations. The correlation coefficient R is 0.95 for all, and RMSEobs values are 0.08 and 0.07, respectively. To further investigate, Bland–Altman plots are used to evaluate the consistency of each with FPARLAI-NOS. As shown in Figure 8, the comparison between FPARLAI-2200 and FPARLAI-NOS results in a mean difference of −0.0385. The limits of consistency are [−0.17, 0.09]. Only 2.2% (1/45) of points fall outside the limits. For FPARDHP, the comparison with FPARLAI-NOS results in a mean difference of 0.018. The limits of consistency are [−0.11, 0.14]. Only 2.3% (1/43) of points fall outside the limits.
Figure 7.
Comparison of correlation among FPAR obtained from different instruments. (a) correlation between FPARLAI-2200 and FPARLAI-NOS; (b) correlation between FPARDHP and FPARLAI-NOS. The black dots represent individual sample points, the red line denotes the fitted regression line, and the dotted line indicates the 1:1 reference line.
Figure 8.
Comparison of consistency among FPAR obtained from different instruments. (a) consistency between FPARLAI-2200 and FPARLAI-NOS; (b) consistency between FPARDHP and FPARLAI-NOS. The black dots represent individual sample points, the solid line represents the Bias, and the dotted lines indicate the LoA.
3.4. Normalization-Calibration Model for Multi-Source Ground-Based Observations
Based on the results of the comparative analysis, FPARLAINet is not used for normalization-calibration with FPARFPARnet due to its weak correlation. Therefore, three simple linear calibration models were established: FPARLAI-NOS with FPARFPARnet, FPARLAI-2200 with FPARLAI-NOS, and FPARDHP with FPARLAI-NOS. The statistical parameters are listed in Table 3. All three models passed the significance test. The R2 values are 0.81, 0.9, and 0.91, and the RMSEpred values are 0.05, 0.06, and 0.06, respectively. This indicates good calibration performance. Furthermore, LOOCV was conducted, and the R2CV and RMSECV values are close to R2 and RMSEpred, indicating that the calibration models are robust within the current dataset.
Table 3.
Parameter Values of each model.
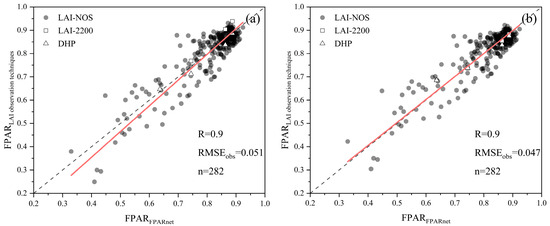
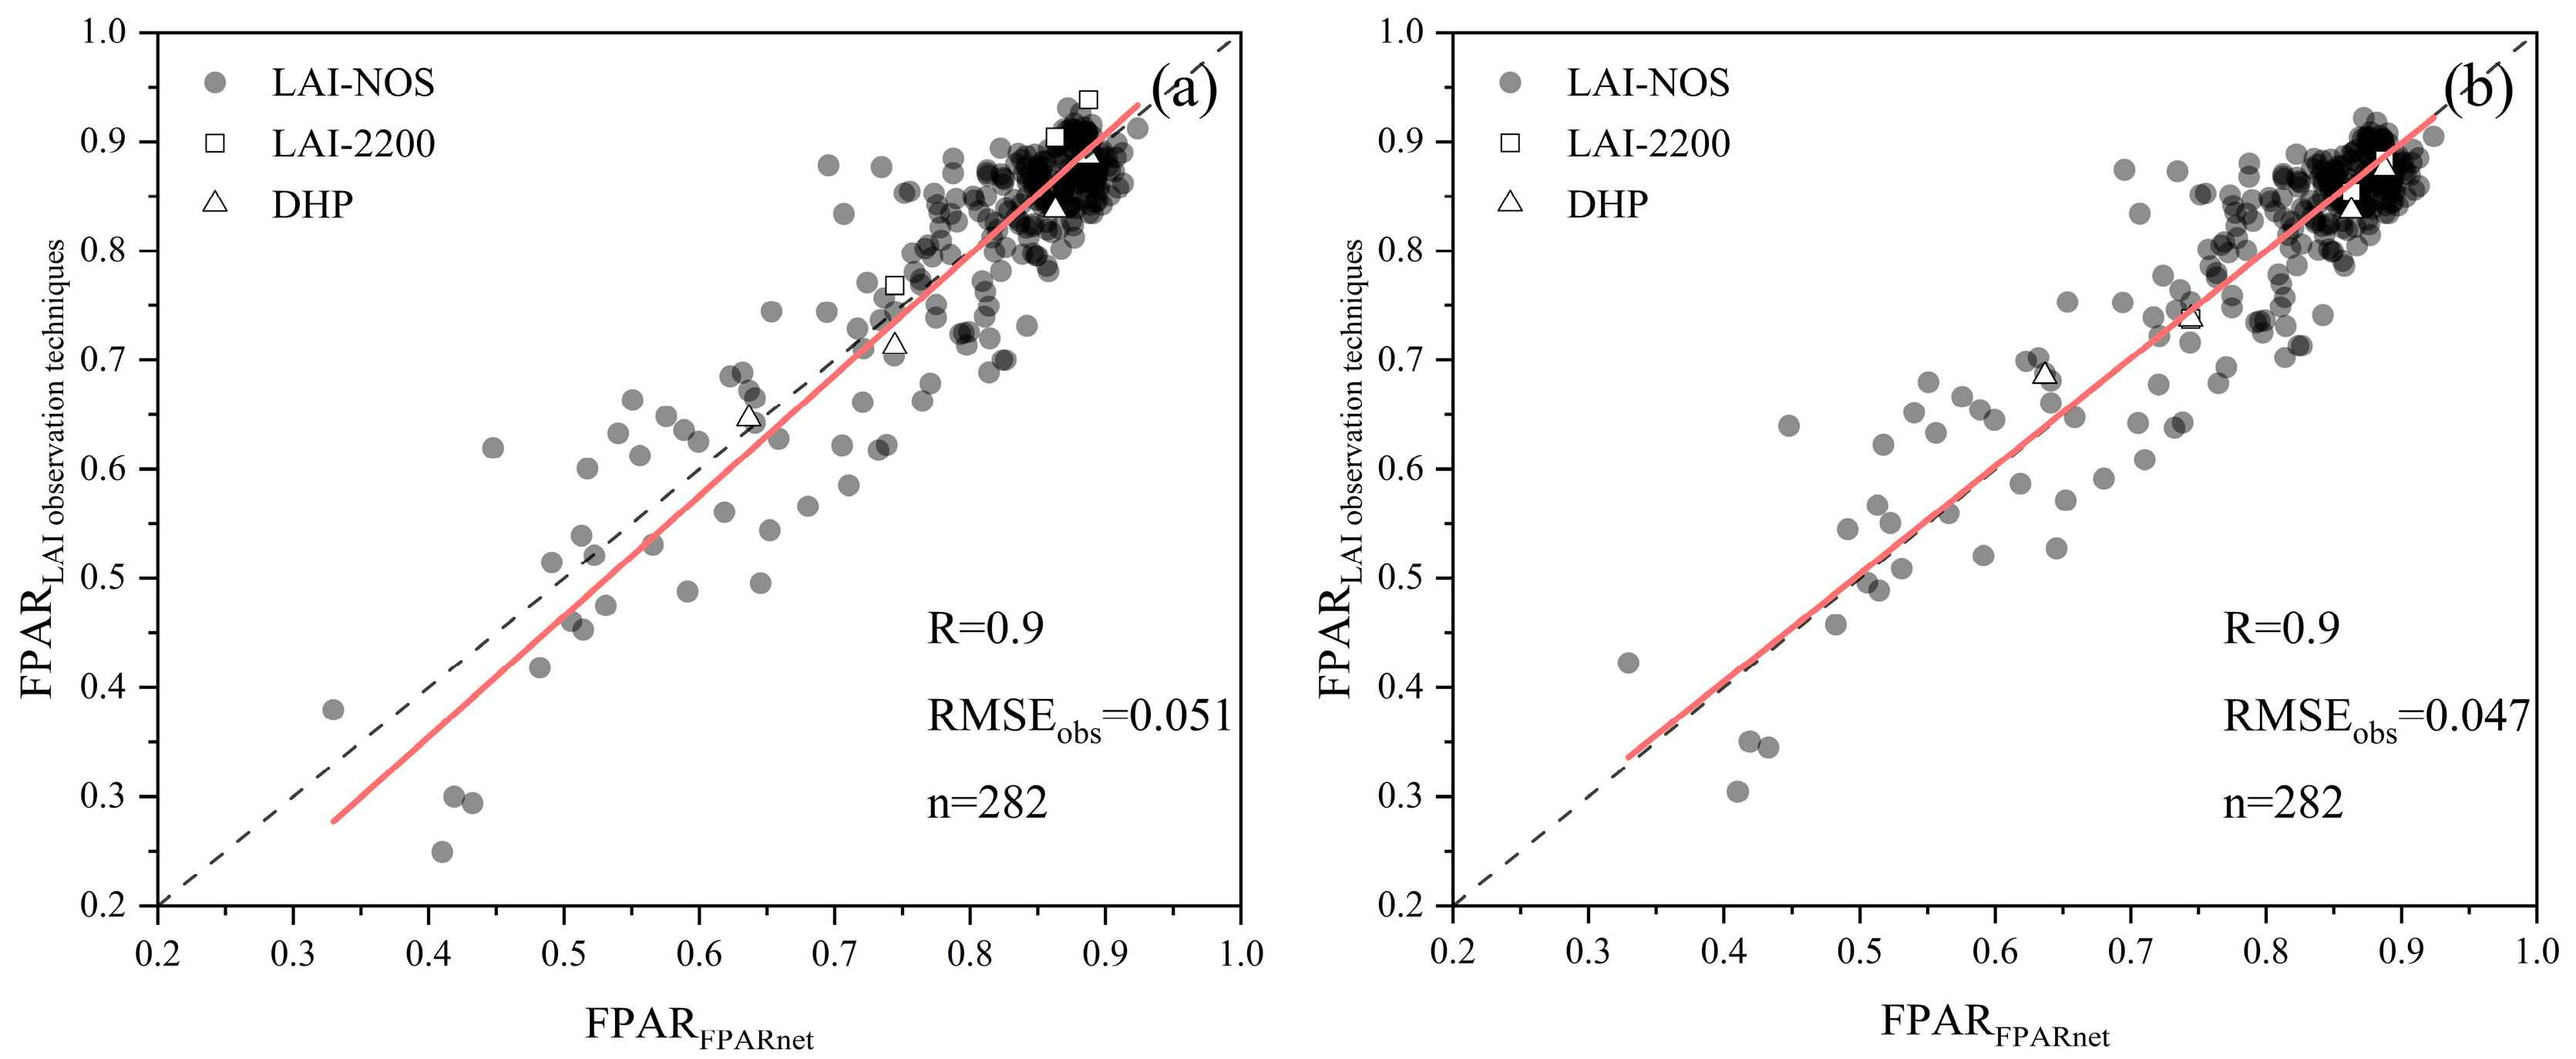
Finally, using FPARLAI-NOS as a bridge, this study established univariate regression calibration models for FPARLAI-2200 and FPARDHP relative to FPARFPARnet. This thus enabled the normalization-calibration of FPARLAI-NOS, FPARLAI-2200 and FPARDHP to the FPARFPARnet reference. As shown in Figure 9, the calibration results indicate that R remains unchanged, while RMSEobs decreases by an average of 7.8%. After calibration, the sample points align more closely along the 1:1 line, demonstrating that the normalization-calibration models effectively reduce errors between FPAR obtained from multi-source ground-based LAI observation techniques and FPARFPARnet.
Figure 9.
Comparison of daily average values of multi-source ground-based FPAR observations before and after normalization-calibration. (a) before normalization-calibration: scatter plot of FPARFPARnet versus original multi-source FPAR data. (b) after normalization-calibration: scatter plot of FPARFPARnet versus normalized-calibrated multi-source FPAR data. The red line denotes the fitted regression line, and the dotted line indicates the 1:1 reference line.
4. Discussion
4.1. Normalization-Calibration Framework for Multi-Source Ground-Based FPAR Observations and Its Contribution
This study established a normalization-calibration framework for multi-source ground-based FPAR observations. Tower-based FPARFPARnet was used as the reference, integrating FPARLAI-NOS, FPARLAI-2200, FPARDHP based on regression models. The applicability of regression models across different forest types and structural characteristics remains uncertain [55]. However, Li et al. indicated that differences among measurement systems mainly arise from systematic errors [14]. Therefore, a linear relationship between them can be assumed. The results indicate that the model improved data consistency. At the same time, it preserved the characteristics of the original data. Before and after normalization, R remained unchanged, while RMSEobs decreased from 0.051 to 0.047, representing an average reduction of about 7.8%. In addition, data dispersion was significantly reduced, with sample points more closely aligned along the 1:1 line.
This study provides a reference calibration model for multi-source ground-based observations. It also offers a practical approach to address the limited representativeness of single instruments in complex vegetation environments. The study further revealed performance differences among measurement techniques in typical forest ecosystems, including DSH, DBF, and ENF. This provides practical guidance for selecting sensor types, optimizing deployment locations, and designing measurement protocols in field experiments. It also helps researchers develop optimal observation strategies for different forest types. By integrating multi-source ground-based data, this study also substantially increased the number of samples, adding 30 new points. This significantly enhanced the spatial representativeness of the reference dataset under heterogeneous surfaces. This framework differs from existing normalization-calibration methods. MODIS-PROBA-V performs pixel-to-pixel normalization-calibration between satellite products [56]. ECOSTRESS data are typically calibrated at the point-pixel scale using in situ measurements [57]. In contrast, this framework targets point-to-point normalization-calibration among ground-based systems. It addresses instrument differences and sample representativeness. Despite differences in scale and target, all approaches share the goal of improving data consistency. The framework provides high-quality, standardized ground FPAR. It meets CEOS LPV requirements for in situ reference data and provides a reliable ground reference for validating large-scale remote sensing products [58]. Although the normalization-calibration framework was developed for a specific mountainous forest site, the method is highly transferable. In a new study area, only the model parameters α, Ωe, γe and k need to be re-estimated to recalibrate for local canopy structures, enabling normalization across different observation systems. To assess robustness across forest types and environmental conditions, the normalized ground-based FPAR data from selected sites can be compared with international FluxNet observations for comparative analyses [59].
4.2. Evaluation of Multi-Source Ground-Based Observation Techniques
The experimental results show that FPARLAI-NOS is highly correlated and consistent with FPARFPARnet. FPARLAI-2200 and FPARDHP are also strongly correlated and consistent with FPARLAI-NOS, with R values exceeding 0.9; points outside the LoA remain below 8%. In contrast, FPARLAINet shows a much lower correlation with FPARFPARnet, with R only reaching 0.12. This difference is closely related to the measurement accuracy and deployment conditions of the instruments. LAI-NOS, based on hemispherical photography and image processing techniques, calculates LAI from multiple angles. It also provides confidence outputs, allowing users to filter out abnormal data. Gao et al. reported that, compared with manual instruments, LAI-NOS achieves higher measurement accuracy by selecting suitable measurement times [19]. LAI-2200 has a long usage history and a well-established theoretical basis [60], and its reliability has been widely verified. For example, Fang et al. found that LAI-2200 measurements closely match destructive sampling results, demonstrating good measurement precision [26]. To further reduce error, this study excluded the fifth ring, which is heavily affected by multiple scattering, and only used rings 0–4 for calculation [61]. DHP, similar to LAI-NOS, mainly relies on image processing. With proper equipment, correct shooting procedures, and efficient processing software, LAI measured by DHP also shows high accuracy. Previous studies demonstrated strong agreement between FPAR derived from DHP and FPAR measured by PAR sensors [27]. In contrast, LAINet, an automated system based on quantum sensors, shows lower correlation with FPARnet. The results are influenced by several factors, which mainly include: (1) species differences, which likely reduce the measurement accuracy of LAINet in the study area. Although Qu et al. reported good performance of LAINet in needleleaf forests dominated by Larix gmelinii [62]. The dominant species in the present study area are Abies faxoniana and Picea purpurea, which may limit the applicability of those findings. The canopy of Larix gmelinii is relatively sparse, with distinct branch layers and high light transmittance. In contrast, the canopies of Abies faxoniana and Picea purpurea are dense, with clustered needle arrangements and small branch gaps, resulting in a stronger clumping effect [46]. The understory light environment in these forests is highly heterogeneous, and the spatial distribution of PAR is uneven [63]. Consequently, the irradiance received by different sensor nodes varies greatly, which reduces the ability of the measurements to represent the canopy mean state. (2) The observational representativeness of FPARLAINet may differ from that of FPARFPARnet. In this study, the area covered by all LAINet nodes does not match the representative area of FPARnet. (3) The small sample size (n = 82) further amplifies the influence of local outliers, making the results more susceptible to random errors. (4) Differences in measurement timing and weather conditions may also affect the comparative results between the two instruments. Therefore, the application of LAINet in dense evergreen needleleaf forests requires optimization of node layout and observation strategies to improve measurement representativeness and accuracy.
4.3. Feasibility of the PAIe–LAI–FPAR Conversion Model
In this study, the PAIe–LAI–FPAR conversion model is used to transform PAIe measured by the LAI instrument into LAI. This process eliminates the effects of woody-to-total area ratio and clumping. FPAR is then further calculated based on the Beer–Lambert law. In the subsequent analysis, FPAR calculated using this model is compared with tower-based FPARFPARnet to evaluate their correlation and consistency. However, FPARFPARnet inherently includes the effects of woody-to-total area ratio and clumping. To improve comparability between FPAR derived from the LAI measurement system and tower-based FPARFPARnet, a measured extinction coefficient based on FPARFPARnet transmittance and PAIe is applied when using the Beer–Lambert law. This method retains the theoretical calculation framework based on LAI while using measured data to adjust the extinction coefficient. It makes the calculated results more accurate and closer to the observed levels of FPARFPARnet. The results show that FPARLAI-NOS and FPARFPARnet exhibit high correlation and consistency. This indicates that the model can effectively convert PAIe to FPAR at the tower-observed level.
However, the accuracy of the model is still limited by multiple factors. In the PAIe-LAI conversion stage, the accuracy of the model depends on the precision of the woody-to-total area ratio (α), element clumping index (Ωe), the ratio of leaf area to shoot area within a shoot (γe). These parameters vary across different times and vegetation types [44,64]. In this study, Ωe is effectively dynamic using LAI-NOS, which improves the model accuracy. However, the values of α and γe still rely on historical literature and lack a dynamic updating mechanism. Although sensitivity analysis shows that their impact on model accuracy is relatively small, fixed parameters cannot fully capture the optical properties of vegetation under dynamic conditions. This is especially true for vegetation types with significant seasonal variations when calculating FPAR. α is essentially a dynamic parameter that varies with season, growth stage, location, and leaf fall. In theory, it should be estimated during each LAI measurement [65]. The effect of γe is particularly pronounced in needleleaf forests. Needleleaf trees exhibit clumping at multiple levels, including shoots (a collection of needles), branches and tree crowns [35]. This causes the crown distribution to deviate from a random pattern, which directly affects the accuracy of LAI estimation in needleleaf forests. In the LAI-FPAR conversion stage, the accuracy of the model is limited by the applicability of the Beer–Lambert law. The law assumes a homogeneous canopy [66] and direct illumination [20]. These assumptions deviate from actual conditions, which affects the accuracy of FPAR calculation. In addition, the k value used in the model represents a monthly mean. This limits its ability to reflect daily variations in the canopy, reducing the model’s dynamic performance. Therefore, future studies could consider using a dynamic parameter estimation approach to improve the accuracy of the PAIe-LAI-FPAR conversion model. At the same time, the model may have limited generalizability when applied to other study areas. Without regional parameter calibration, the model may produce errors. Effective dynamic parameterization will facilitate the development of a more universal model.
4.4. Limitations and Future Improvements
The study area has complex terrain, including variations in slope, aspect, and elevation, which may affect FPAR observations. Previous studies have shown that terrain factors can influence FPAR values [10]. In this study, all instruments were deployed at the same sampling locations and measured simultaneously under identical terrain conditions. Nevertheless, terrain may still affect absolute FPAR values. Since the main objective is the normalization-calibration among multi-source ground-based FPAR observations, relative differences remain consistent, ensuring reliable calibration. However, terrain may introduce uncertainties in absolute FPAR. Future studies could systematically analyze slope, aspect, and elevation to improve FPAR estimation in complex mountainous areas.
Weather conditions can also influence FPAR observations. Manual instruments (LAI-2200 and DHP) were strictly operated under overcast conditions, while automated instruments (FPARnet, LAI-NOS, LAINet) lacked real-time weather monitoring. Although data quality was ensured through outlier removal and filtering, complex weather events such as fog, strong winds, or partial sunlight may still introduce uncertainties in absolute FPAR values. Moreover, observation frequencies differed among instruments, with manual measurements being much less frequent than automated observations. While daily FPAR values were matched for comparative analysis, the temporal mismatch remains a potential source of error. Future studies could incorporate real-time meteorological monitoring or all-sky imaging, and consider higher-frequency manual measurements or temporal interpolation to improve the robustness and comparability of multi-source FPAR observations.
Vegetation structural complexity can further affect FPAR observations. Canopies exhibit structural complexity, including canopy architecture, leaf angle distribution, vertical stratification, and other features. These factors influence light interception and scattering [67]. Even under identical observation conditions, canopy differences can lead to variations in absolute FPAR values. Future studies should consider including structural complexity metrics, such as leaf angle distribution and canopy height, in the normalization-calibration framework. This would help evaluate how vegetation structure affects instrument response and calibration consistency.
5. Conclusions
This study employed a PAIe-LAI-FPAR conversion model based on Beer–Lambert law to estimate FPAR from multi-source ground-based LAI observation techniques. By comparing of FPARLAI-NOS and FPARLAINet with FPARFPARnet, as well as FPARLAI-2200 and FPARDHP with FPARLAI-NOS, a normalization-calibration framework for multi-source ground-based optical observations was established using FPARnet as the reference. The comparative analysis shows that FPARLAI-NOS and FPARFPARnet exhibits strong correlation and consistency. Similarly, FPARLAI-2200 and FPARDHP, relative to FPARLAI-NOS, also show strong correlation and consistency. The correlation coefficients (R) are all above 0.9, and fewer than 8% of points fell outside the LoA. Building on these results, using FPARLAI-NOS as a bridge, this study successfully converted FPARLAI-2200 and FPARDHP to FPARFPARnet reference. Ultimately, a normalization-calibration model was established for FPARLAI-NOS, FPARLAI-2200 and FPARDHP, aligned with FPARFPARnet. After applying the model, the consistency of multi-source FPAR observations was improved, indicating that multi-source ground-based optical observation techniques can be converted under specific conditions in mountainous forests. This study reveals differences in correlation and consistency among multi-source ground-based observation techniques, providing experimental support for instrument selection. The results also support the normalization-calibration of FPAR measurements based on multi-source ground-based observational data. This approach extends the application potential of multi-source ground-based optical measurements and improves spatial coverage and data comparability, providing a reliable reference for the validation of large-scale remote sensing products. However, given the simplified parameterization in the current model, future studies could incorporate phenology-driven dynamic parameters. Machine-learning-based nonlinear optimization could also be applied. Both strategies would enhance the robustness and adaptability of the normalization-calibration model under diverse environmental conditions.
Author Contributions
Conceptualization, A.L.; methodology, Y.C.; software, Y.C.; validation, Y.C.; formal analysis, Y.C.; investigation, Y.C., Z.Z., L.C., X.L. and Y.D.; resources, A.L., J.B., Z.Z., X.N. and G.L.; data curation, Y.C.; writing—original draft preparation, Y.C.; writing—review and editing, Y.C., A.L., X.L. and Y.D.; visualization, Y.C.; supervision, A.L., J.B., Z.Z., X.N. and G.L.; project administration, A.L., J.B., Z.Z., X.N., G.L. and A.N.; funding acquisition, A.L. All authors have read and agreed to the published version of the manuscript.
Funding
This research was funded by the National Key Research and Development Program of China, grant number 2020YFA0608702; the National Natural Science Foundation project of China, grant number U23A2019.
Data Availability Statement
The data presented in this study are available from the corresponding author upon reasonable request.
Conflicts of Interest
The authors declare no conflicts of interest.
References
- Li, L.; Xin, X.Z.; Tang, Y.; Bai, J.H.; Du, Y.M.; Sun, L.; Wen, J.G.; Zhong, B.; Wu, S.; Zhang, H.L.; et al. Fraction of absorbed photosynthetically active radiation inversion algorithm of GF-1 data combining radiative transfer model simulation and deep learning. Natl. Remote Sens. Bull. 2023, 27, 700–710. [Google Scholar] [CrossRef] [Scilit]
- Majasalmi, T.; Rautiainen, M.; Stenberg, P. Modeled and measured fPAR in a boreal forest: Validation and application of a new model. Agric. For. Meteorol. 2014, 189, 118–124. [Google Scholar] [CrossRef] [Scilit]
- Fan, W.; Liu, Y.; Xu, X.; Chen, G.; Zhang, B. A New FAPAR Analytical Model Based on the Law of Energy Conservation: A Case Study in China. IEEE J. Sel. Top. Appl. Earth Observ. Remote Sens. 2014, 7, 3945–3955. [Google Scholar] [CrossRef] [Scilit]
- Dong, T.F.; Liu, J.G.; Shang, J.L.; Qian, B.D.; Huffman, T.; Zhang, Y.S.; Champagne, C.; Daneshfar, B. Assessing the Impact of Climate Variability on Cropland Productivity in the Canadian Prairies Using Time Series MODIS FAPAR. Remote Sens. 2016, 8, 281. [Google Scholar] [CrossRef] [Scilit]
- Dong, T.F.; Meng, J.H.; Shang, J.L.; Liu, J.G.; Wu, B.F. Evaluation of Chlorophyll-Related Vegetation Indices Using Simulated Sentinel-2 Data for Estimation of Crop Fraction of Absorbed Photosynthetically Active Radiation. IEEE J. Sel. Top. Appl. Earth Observ. Remote Sens. 2015, 8, 4049–4059. [Google Scholar] [CrossRef] [Scilit]
- Li, H.L.; Luo, Y.; Xue, X.P.; Zhao, Y.J.; Zhao, H.; Li, F. Assessment of approaches for estimating fraction of photosynthetically active radiation absorbed by winter wheat canopy. Trans. Chin. Soc. Agric. Eng. 2011, 27, 201–206. [Google Scholar]
- Jarocińska, A.M.; Kacprzyk, M.; Marcinkowska-Ochtyra, A.; Ochtyra, A.; Zagajewski, B.; Meuleman, K. The application of APEX images in the assessment of the state of non-forest vegetation in the Karkonosze Mountains. Misc. Geographica. Reg. Stud. Dev. 2016, 20, 21–27. [Google Scholar] [CrossRef] [Scilit]
- Zhang, C.; Cai, H.J.; Li, Z.J. Estimation of Fraction of Absorbed Photosynthetically Active Radiation for Winter Wheat Based on Hyperspectral Characteristic Parameters. Spectrosc. Spectr. Anal. 2015, 35, 2644–2649. [Google Scholar]
- Baldocchi, D.D.; Matt, D.R.; Hutchison, B.A.; McMillen, R.T. Solar radiation within an oak—Hickory forest: An evaluation of the extinction coefficients for several radiation components during fully-leafed and leafless periods. Agric. For. Meteorol. 1984, 32, 307–322. [Google Scholar] [CrossRef] [Scilit]
- Zhao, P.; Fan, W.J.; Liu, Y.; Mu, X.H.; Xu, X.R.; Peng, J.J. Study of the Remote Sensing Model of FAPAR over Rugged Terrains. Remote Sens. 2016, 8, 309. [Google Scholar] [CrossRef] [Scilit]
- Sanchez-Azofeifa, A.; Sharp, I.; Green, P.D.; Nightingale, J. Calibration of Co-Located Identical PAR Sensors Using Wireless Sensor Networks and Characterization of the In Situ fPAR Variability in a Tropical Dry Forest. Remote Sens. 2022, 14, 2752. [Google Scholar] [CrossRef] [Scilit]
- Fang, H.; Wu, Y.; Zhang, Y.; Wang, Y.; Li, S.; Ma, T.; Li, Y.; Guo, K. Seasonal variation of canopy vertical structural profiles measured at two temperate forests: Intercomparison of tower, mast, crane, and UAV measurements. Trees-Struct. Funct. 2025, 39, 9. [Google Scholar] [CrossRef] [Scilit]
- Gower, S.T.; Kucharik, C.J.; Norman, J.M. Direct and indirect estimation of leaf area index, fAPAR, and net primary production of terrestrial ecosystems. Remote Sens. Environ. 1999, 70, 29–51. [Google Scholar] [CrossRef] [Scilit]
- Li, W.J.; Fang, H.L.; Wei, S.S.; Weiss, M.; Baret, F. Critical analysis of methods to estimate the fraction of absorbed or intercepted photosynthetically active radiation from ground measurements: Application to rice crops. Agric. For. Meteorol. 2021, 297, 108273. [Google Scholar] [CrossRef] [Scilit]
- Ruimy, A.; Kergoat, L.; Bondeau, A.; The Participants of the Potsdam NpP Model Intercomparison. Model Intercomparison. Comparing global models of terrestrial net primary productivity (NPP): Analysis of differences in light absorption and light-use efficiency. Glob. Change Biol. 1999, 5, 56–64. [Google Scholar] [CrossRef] [Scilit]
- Zhang, X.Q.; Xu, D.Y.; Zhao, M.S. Review on Forest Canopy Structure, Radiation Transfer and Canopy Photosynthesis. For. Res. 1999, 12, 411–421. [Google Scholar]
- Zou, X.H.; Xie, Y.; Han, Q.F.; Shao, W.; Luo, F.Y. Adaptation Analysis of Measurement Techniques and Inversion Algorithms for Tea Tree LAI. IEEE J. Sel. Top. Appl. Earth Observ. Remote Sens. 2024, 17, 5517–5526. [Google Scholar] [CrossRef] [Scilit]
- Leblanc, S.G. Correction to the plant canopy gap-size analysis theory used by the Tracing Radiation and Architecture of Canopies instrument. Appl. Opt. 2002, 41, 7667–7670. [Google Scholar] [CrossRef] [Scilit]
- Gao, Z.T.; Chen, Y.P.; Zhang, Z.J.; Duan, T.X.; Chen, J.C.; Li, A.N. Continuous Leaf Area Index (LAI) Observation in Forests: Validation, Application, and Improvement of LAI-NOS. Forests 2024, 15, 868. [Google Scholar] [CrossRef] [Scilit]
- Qu, Y.H.; Zhu, Y.Q.; Han, W.C.; Wang, J.D.; Ma, M.G. Crop Leaf Area Index Observations With a Wireless Sensor Network and Its Potential for Validating Remote Sensing Products. IEEE J. Sel. Top. Appl. Earth Observ. Remote Sens. 2014, 7, 431–444. [Google Scholar] [CrossRef] [Scilit]
- Camacho, F.; Martinez-Sanchez, E.; Brown, L.A.; Morris, H.; Morrone, R.; Williams, O.; Dash, J.; Origo, N.; Sanchez-Zapero, J.; Boccia, V. Validation and Conformity Testing of Sentinel-3 Green Instantaneous FAPAR and Canopy Chlorophyll Content Products. Remote Sens. 2024, 16, 2698. [Google Scholar] [CrossRef] [Scilit]
- Lanconelli, C.; Cappucci, F.; Adams, J.S.; Gobron, N. Evaluation of In Situ FAPAR Measurement Protocols Using 3D Radiative Transfer Simulations. Remote Sens. 2024, 16, 4552. [Google Scholar] [CrossRef] [Scilit]
- Li, R.; Li, B.; Yuan, Y.; Liu, W.; Zhu, J.; Qi, J.; Liu, H.; Ma, G.; Jiang, Y.; Li, Y.; et al. Improvement of FAPAR Estimation Under the Presence of Non-Green Vegetation Considering Fractional Vegetation Coverage. Remote Sens. 2025, 17, 603. [Google Scholar] [CrossRef] [Scilit]
- Akitsu, T.K.; Nakaji, T.; Kobayashi, H.; Okano, T.; Honda, Y.; Bayarsaikhan, U.; Terigele; Hayashi, M.; Hiura, T.; Ide, R.; et al. Large-scale ecological field data for satellite validation in deciduous forests and grasslands. Ecol. Res. 2020, 35, 1009–1028. [Google Scholar] [CrossRef] [Scilit]
- Nath, B.; Ni-Meister, W. The Interplay between Canopy Structure and Topography and Its Impacts on Seasonal Variations in Surface Reflectance Patterns in the Boreal Region of Alaska—Implications for Surface Radiation Budget. Remote Sens. 2021, 13, 3108. [Google Scholar] [CrossRef] [Scilit]
- Fang, H.L.; Li, W.J.; Wei, S.S.; Jiang, C.Y. Seasonal variation of leaf area index (LAI) over paddy rice fields in NE China: Intercomparison of destructive sampling, LAI-2200, digital hemispherical photography (DHP), and AccuPAR methods. Agric. For. Meteorol. 2014, 198, 126–141. [Google Scholar] [CrossRef] [Scilit]
- Nestola, E.; Sánchez-Zapero, J.; Latorre, C.; Mazzenga, F.; Matteucci, G.; Calfapietra, C.; Camacho, F. Validation of PROBA-V GEOV1 and MODIS C5 & C6 fAPAR Products in a Deciduous Beech Forest Site in Italy. Remote Sens. 2017, 9, 126. [Google Scholar] [CrossRef] [Scilit]
- Widlowski, J.-L. On the bias of instantaneous FAPAR estimates in open-canopy forests. Agric. For. Meteorol. 2010, 150, 1501–1522. [Google Scholar] [CrossRef] [Scilit]
- Tao, X.; Liang, S.L.; Wang, D.D. Assessment of five global satellite products of fraction of absorbed photosynthetically active radiation: Intercomparison and direct validation against ground-based data. Remote Sens. Environ. 2015, 163, 270–285. [Google Scholar] [CrossRef] [Scilit]
- Liu, Z.; Sun, Y.; Jiao, S.F.; Cheng, Y.L.; Chen, Y.P. Design and application of LAI automatic network measurement system based on hemispherical photography. J. Chin. Agric. Mech. 2023, 44, 123–131. [Google Scholar]
- Qu, Y.H.; Wang, J.D.; Dong, J.; Jiang, F.B. Design and experiment of crop structural parameters automatic measurement system. Trans. Chin. Soc. Agric. Eng. 2012, 28, 160–165. [Google Scholar]
- Pearse, G.D.; Watt, M.S.; Morgenroth, J. Comparison of optical LAI measurements under diffuse and clear skies after correcting for scattered radiation. Agric. For. Meteorol. 2016, 221, 61–70. [Google Scholar] [CrossRef] [Scilit]
- Weiss, M.; Baret, F.; Smith, G.J.; Jonckheere, I. Methods for in situ leaf area index measurement, part II: From gap fraction to leaf area index: Retrieval methods and sampling strategies. Agric. For. Meteorol. 2004, 121, 17–53. [Google Scholar]
- Iio, A.; Hikosaka, K.; Anten, N.P.R.; Nakagawa, Y.; Ito, A. Global dependence of field-observed leaf area index in woody species on climate: A systematic review. Glob. Ecol. Biogeogr. 2014, 23, 274–285. [Google Scholar] [CrossRef] [Scilit]
- Chen, J.M. Optically-based methods for measuring seasonal variation of leaf area index in boreal conifer stands. Agric. For. Meteorol. 1996, 80, 135–163. [Google Scholar] [CrossRef] [Scilit]
- Chen, J.M.; Black, T.A. Foliage area and architecture of plant canopies from sunfleck size distributions. Agric. For. Meteorol. 1992, 60, 249–266. [Google Scholar] [CrossRef] [Scilit]
- Chen, J.M.; Cihlar, J. Plant canopy gap-size analysis theory for improving optical measurements of leaf-area index. Appl. Opt. 1995, 34, 6211–6222. [Google Scholar] [CrossRef] [Scilit]
- Chen, J.M.; Rich, P.M.; Gower, S.T.; Norman, J.M.; Plummer, S. Leaf area index of boreal forests: Theory, techniques, and measurements. J. Geophys. Res. Atmos. 1997, 102, 29429–29443. [Google Scholar] [CrossRef] [Scilit]
- Liu, X.D.; Zhu, C.Q.; Lei, J.P.; Ju, G.S.; Bai, R. The distribution of photosynthetic radiation in the canopy of poplar plantation. Sci. Silvae Sin. 2000, 36, 2–7. [Google Scholar]
- Zhang, L.X.; Hu, Z.M.; Fan, J.W.; Zhou, D.C.; Tang, F.P. A meta-analysis of the canopy light extinction coefficient in terrestrial ecosystems. Front. Earth Sci. 2014, 8, 599–609. [Google Scholar] [CrossRef] [Scilit]
- Bolstad, P.; Gower, S. Estimation of Leaf-Area Index in 14 Southern Wisconsin Forest Stands Using a Portable Radiometer. Tree Physiol. 1990, 7, 115–124. [Google Scholar] [CrossRef] [Scilit]
- Lai, G.Y.; Zeng, X.G.; Liu, Y.; Zhang, L.L.; Yi, F.Z.; Pan, R.X.; Sheng, Y.Y. Retrieving Leaf Area Index and Extinction Coefficient of Dominated Vegetation Canopy Cover in Meijiang Watershed of China Using Image-fusion and Landsat ETM Data. Remote Sens. Technol. Appl. 2013, 28, 697–706. [Google Scholar] [CrossRef]
- Wei, S.S.; Fang, H.L. Estimation of canopy clumping index from MISR and MODIS sensors using the normalized difference hotspot and darkspot (NDHD) method: The influence of BRDF models and solar zenith angle. Remote Sens. Environ. 2016, 187, 476–491. [Google Scholar] [CrossRef] [Scilit]
- Gao, G.; Jiao, Z.T.; Wang, C.X.; Yin, S.Y.; Guo, J.; Tong, Y.D.; Li, Z.L.; Tan, Z.Y.; Chen, S.Z. Long-term temporal characteristics of vegetation clumping index remote sensing products at mid/high latitudes in the Northern Hemisphere—A case study. J. Beijing Norm. Univ. 2024, 60, 386–396. [Google Scholar]
- Niu, X.T.; Fan, J.; Luo, R.H.; Fu, W.; Yuan, H.Y.; Du, M.G. Continuous estimation of leaf area index and the woody-to-total area ratio of two deciduous shrub canopies using fisheye webcams in a semiarid loessial region of China. Ecol. Indic. 2021, 125, 107549. [Google Scholar] [CrossRef] [Scilit]
- Fang, H.L. Canopy clumping index (CI): A review of methods, characteristics, and applications. Agric. For. Meteorol. 2021, 303, 108374. [Google Scholar] [CrossRef] [Scilit]
- Kucharik, C.J.; Norman, J.M.; Gower, S.T. Measurements of branch area and adjusting leaf area index indirect measurements. Agric. For. Meteorol. 1998, 91, 69–88. [Google Scholar] [CrossRef] [Scilit]
- Sobol′, I.M. Global sensitivity indices for nonlinear mathematical models and their Monte Carlo estimates. Math. Comput. Simul. 2001, 55, 271–280. [Google Scholar] [CrossRef] [Scilit]
- Wang, L.X.; Zhang, Y.; Li, Q.; Hu, Z.H.; Ren, J.Q.; Lu, Y.Y.; Wang, T. Current Status and Prospecets of Sensitivity Analysis of Crop Model Parameters. Meteorol. Sci. Technol. 2018, 46, 382–389. [Google Scholar]
- Jewan, S.Y.Y.; Pagay, V.; Billa, L.; Tyerman, S.D.; Gautam, D.; Sparkes, D.; Chai, H.H.; Singh, A. The feasibility of using a low-cost near-infrared, sensitive, consumer-grade digital camera mounted on a commercial UAV to assess Bambara groundnut yield. Int. J. Remote Sens. 2022, 43, 393–423. [Google Scholar] [CrossRef] [Scilit]
- Chen, J.M.; Cihlar, J. Retrieving leaf area index of boreal conifer forests using Landsat TM images. Remote Sens. Environ. 1996, 55, 153–162. [Google Scholar] [CrossRef] [Scilit]
- Pisek, J.; Chen, J.M.; Nilson, T. Estimation of vegetation clumping index using MODIS BRDF data. Int. J. Remote Sens. 2011, 32, 2645–2657. [Google Scholar] [CrossRef] [Scilit]
- Zhu, G.L.; Ju, W.M.; Fan, W.Y.; Zhou, Y.L.; Li, X.F.; Li, M.Z. Forest canopy leaf area index in Maoershan Mountain:Ground measurement and remote sensing retrieval. Chin. J. Appl. Ecol. 2010, 21, 2117–2124. [Google Scholar]
- Li, Z.; Strahler, A.; Schaaf, C.; Jupp, D.; Schaefer, M.; Olofsson, P. Seasonal change of leaf and woody area profiles in a midlatitude deciduous forest canopy from classified dual-wavelength terrestrial lidar point clouds. Agric. For. Meteorol. 2018, 262, 279–297. [Google Scholar] [CrossRef] [Scilit]
- Chasmer, L.; Hopkinson, C.; Treitz, P.; McCaughey, H.; Barr, A.; Black, A. A lidar-based hierarchical approach for assessing MODIS fPAR. Remote Sens. Environ. 2008, 112, 4344–4357. [Google Scholar] [CrossRef] [Scilit]
- Cammalleri, C.; Verger, A.; Lacaze, R.; Vogt, J.V. Harmonization of GEOV2 fAPAR time series through MODIS data for global drought monitoring. Int. J. Appl. Earth Obs. Geoinf. 2019, 80, 1–12. [Google Scholar] [CrossRef] [Scilit]
- Weidberg, N.; López Chiquillo, L.K.; Román, S.; Román, M.; Vázquez, E.; Olabarria, C.; Woodin, S.A.; Wethey, D.S. Assessing high resolution thermal monitoring of complex intertidal environments from space: The case of ECOSTRESS at Rias Baixas, NW Iberia. Remote Sens. Appl. Soc. Environ. 2023, 32, 101055. [Google Scholar] [CrossRef] [Scilit]
- Malenovský, Z.; Homolová, L.; Lukeš, P.; Buddenbaum, H.; Verrelst, J.; Alonso, L.; Schaepman, M.E.; Lauret, N.; Gastellu-Etchegorry, J.-P. Variability and Uncertainty Challenges in Scaling Imaging Spectroscopy Retrievals and Validations from Leaves Up to Vegetation Canopies. Surv. Geophys. 2019, 40, 631–656. [Google Scholar] [CrossRef] [Scilit]
- Papale, D. Ideas and perspectives: Enhancing the impact of the FLUXNET network of eddy covariance sites. Biogeosciences 2020, 17, 5587–5598. [Google Scholar] [CrossRef] [Scilit]
- Welles, J.M.; Norman, J.M. Instrument for Indirect Measurement of Canopy Architecture. Agron. J. 1991, 83, 818–825. [Google Scholar] [CrossRef] [Scilit]
- Chen, J.M.; Govind, A.; Sonnentag, O.; Zhang, Y.; Barr, A.; Amiro, B. Leaf area index measurements at Fluxnet-Canada forest sites. Agric. For. Meteorol. 2006, 140, 257–268. [Google Scholar] [CrossRef] [Scilit]
- Qu, Y.; Han, W.; Fu, L.; Li, C.; Song, J.; Zhou, H.; Bo, Y.; Wang, J. LAINet—A wireless sensor network for coniferous forest leaf area index measurement: Design, algorithm and validation. Comput. Electron. Agric. 2014, 108, 200–208. [Google Scholar] [CrossRef] [Scilit]
- Montgomery, R.A.; Chazdon, R.L. Forest Structure, Canopy Architecture, and Light Transmittance in Tropical Wet Forests. Ecology 2001, 82, 2707–2718. [Google Scholar] [CrossRef]
- Sieling, K.; Böttcher, U.; Kage, H. Canopy traits in rye, triticale and wheat under varying N supply. Agron. Res. 2016, 14, 1467–1485. [Google Scholar]
- Zou, J.; Yan, G.J.; Zhu, L.; Zhang, W.M. Woody-to-total area ratio determination with a multispectral canopy imager. Tree Physiol. 2009, 29, 1069–1080. [Google Scholar] [CrossRef] [Scilit] [PubMed]
- Campbell, G.S.; Norman, J.M. An Introduction to Environmental Biophysics, 2nd ed.; Springer Science: New York, NY, USA; Business Media: New York, NY, USA, 1998. [Google Scholar]
- Sarlikioti, V.; de Visser, P.H.B.; Marcelis, L.F.M. Exploring the spatial distribution of light interception and photosynthesis of canopies by means of a functional–structural plant model. Ann. Bot. 2011, 107, 875–883. [Google Scholar] [CrossRef] [Scilit]

Disclaimer/Publisher’s Note: The statements, opinions and data contained in all publications are solely those of the individual author(s) and contributor(s) and not of MDPI and/or the editor(s). MDPI and/or the editor(s) disclaim responsibility for any injury to people or property resulting from any ideas, methods, instructions or products referred to in the content. |
© 2025 by the authors. Licensee MDPI, Basel, Switzerland. This article is an open access article distributed under the terms and conditions of the Creative Commons Attribution (CC BY) license (https://creativecommons.org/licenses/by/4.0/).