Article

Enhanced Resolution of Martian Polar Stratigraphy via Structure Enhancement Denoising and Sparse Deterministic Deconvolution of SHARAD Data

1
Research Center for Deep Earth Technology and Equipment, Key Laboratory of Deep Petroleum Intelligent Exploration and Development, Institute of Geology and Geophysics, Chinese Academy of Sciences, Beijing 100029, China
2
Key Laboratory of Planetary Science and Frontier Technology, Chinese Academy of Sciences, Beijing 100029, China
*
Author to whom correspondence should be addressed.
Remote Sens. 2025, 17(23), 3783; https://doi.org/10.3390/rs17233783
Submission received: 24 October 2025 / Revised: 18 November 2025 / Accepted: 20 November 2025 / Published: 21 November 2025
(This article belongs to the Section Remote Sensing in Geology, Geomorphology and Hydrology)

Highlights

What are the main findings?
  • A two-stage workflow is proposed that synergistically combines Structure Enhancement Denoising (SED) as a pre-processing step with Sparse Deterministic Deconvolution (SDD). This method is shown to be highly effective at suppressing noise while preserving geological structures in SHARAD data.
  • A novel method is introduced to determine the optimal regularization parameter (λ) for deconvolution. This is achieved by using the ratio of reflectors extracted from the original noisy radargram versus the structure-enhanced radargram, which provides a robust a priori constraint that outperforms standard L-curve methods on noisy data.
What are the implications of the main findings?
  • The workflow provides significantly enhanced vertical resolution of Martian polar stratigraphy, allowing for the resolution of finer-scale layers that were previously obscured by noise or the radar wavelet. This enables the extraction of a more complete and higher-fidelity record of Mars’s past climate history from the North Polar Layered Deposits (NPLD).
  • The method is a powerful and broadly applicable tool for improving data from other noisy planetary radar sounders, such as MARSIS on Mars Express or the upcoming RIME instrument on JUICE. Application to the NPLD reveals highly continuous, laterally homogeneous reflectors, reinforcing the “layer cake” depositional model for the region.

Abstract

The Martian North Polar Layered Deposits (NPLD) are a thick sequence of ice and dust layers that serve as a primary archive of the planet’s recent climate history. The Shallow radar (SHARAD) sounder provides critical data for probing this stratigraphy, but its resolution is limited by the radar wavelet and the signal-to-noise ratio (SNR). Deconvolution aims to overcome the resolution limitation, with recent techniques like sparse deterministic deconvolution (SDD) showing promise. However, the performance of these methods is fundamentally constrained by noise, which can obscure weak reflectors from deep or subtle layers and introduce artifacts into the results. This study proposes a two-stage workflow that directly addresses the noise problem by applying structure enhancement denoising (SED) to improve the SNR and reflector echo power of SHARAD radargrams prior to deconvolution, thereby enhancing the overall fidelity of the results. The efficacy of this integrated SED-SDD workflow is validated first on synthetic radargrams, demonstrating a marked reduction in reflectivity error and superior preservation of structural detail compared to the baseline SDD method, especially under low-SNR conditions. Subsequently, the workflow is applied to a real SHARAD observation of the NPLD, revealing enhanced lateral continuity of subtle reflectors and a significant reduction in noise-induced artifacts. The results demonstrate that this synergistic approach provides a powerful tool for extracting higher-resolution stratigraphic information from noisy planetary orbital radar data, thereby advancing our ability to interpret the sedimentary history of Mars.

1. Introduction

The Martian NPLD is home to extensive and approximately 3 km thick domes of layered water ice and dust, representing one of the most significant water ice reservoirs on the planet [1,2,3,4]. These deposits are widely recognized as a crucial and high-fidelity archive of Martian climate variations over the last several million years, analogous to the ice sheets of Greenland and Antarctica on Earth [1,5,6]. The formation of the NPLD’s distinct stratigraphy is believed to be a direct consequence of quasi-periodic variations in Mars’s orbital parameters, particularly its obliquity and eccentricity, which are known as Milankovitch cycles [4,7,8].
The tantalizing prospect of deciphering this readable stratigraphic record to reconstruct a detailed history of Martian paleoclimate has been a primary driver of polar science on Mars for decades. A key parameter encoded within these layers is the dust-to-ice ratio, which serves as a proxy for the atmospheric and depositional conditions at the time of their formation [1,3,4,6,8,9]. Variations in radar reflectivity, as measured by orbiting sounders, have been shown to correlate directly with this dust content, providing a quantitative means to probe the detailed stratifications formed during climate changes [10,11].
The Shallow Radar (SHARAD) onboard Mars Reconnaissance Orbiter (MRO) is a principal tool for the non-invasive investigation of the NPLD’s internal structure [12,13]. It transmits a chirped radio signal that penetrates the Martian subsurface, with a center frequency of 20 MHz and a 10 MHz bandwidth [12,13]. The instrument then records the echoes reflected from dielectric discontinuities, which typically correspond to interfaces between layers of differing composition, density, or dust content. These consecutive echoes are processed and assembled into a two-dimensional image, or radargram, that depicts the subsurface stratigraphy along the spacecraft’s ground track [14].
With a theoretical vertical resolution in pure water ice of ~8.4 m, SHARAD is important in revealing the intricate and extensive layering within the NPLD [14]. However, extracting precise quantitative information about the subsurface reflectivity is a non-trivial challenge. Traditional methods for calculating reflectivity involve identifying individual reflectors in the radargram, measuring their echo power, and applying physical models based on the Fresnel reflection equations to invert for the dielectric properties of the interface [10,11,15,16]. However, the stratigraphy of NPLD is often composed of numerous fine layers, some of which may be thinner than the radar’s vertical resolution. In such cases, the echoes from adjacent layers could interfere with one another, making it difficult to isolate the response of a single layer and leading to inaccuracies in the derived reflectivity.
A recent study using sparse deterministic deconvolution (SDD) frames the inversion of reflectivity as an l2l1 optimization problem and has shown improved stratigraphic resolution in SHARAD data [17]. However, the theoretical performance of the deconvolution algorithm is fundamentally limited by the signal-to-noise ratio (SNR). SHARAD radargrams are contaminated by noise from a variety of sources, such as thermal noise, electromagnetic interference from other systems on the MRO spacecraft, and variations in system gain due to the spacecraft’s orientation [18]. The mathematical SDD inversion for the presence of noise is an ill-posed problem. For low-amplitude signals, the echo power can be on the same order as the noise floor, making their reliable recovery extremely difficult. Synthetic aperture radar systems such as SHARAD are inherently affected by speckle noise, which arises from the coherent nature of radar backscattering. This type of noise is multiplicative and highly correlated, making it difficult to suppress effectively using conventional denoising approaches. While standard techniques like incoherent summing (averaging adjacent traces) can increase the SNR [19], they come at the cost of spatial resolution and can blur or distort dipping reflectors, thereby losing valuable structural information. This trade-off motivates the need for a more sophisticated denoising strategy that can suppress this particular speckle noise while preserving the integrity of the underlying geological structures.
Recently, structure enhancement denoising (SED) based on the progressive image denoising (PID) filtering framework has been proposed to specifically address this issue [20]. The SED has been shown to be highly effective for removing complex noise patterns while preserving sharp edges and fine textures [20], yielding markedly improved results. This study proposes and validates a workflow designed to overcome the challenge of noise for a robust SHARAD data deconvolution. The core is the integration of the state-of-the-art SED method [20,21], as a dedicated pre-processing step before the application of the SDD method. We first applied 2D structure-enhancement denoising method [20] to a SHARAD radargram; the SNR can be substantially improved and noise-related artifacts suppressed without introducing the blurring effect. This enhanced radargram then serves as a high-fidelity input for the 1D SDD algorithm. Meanwhile, we determine the number of reflectors using a method that combines phase congruency theory with the wavelet transform [22] as a prior for the deconvolution parameters, although we note that numerous reflector extraction methods have been proposed [22,23,24,25]. This synergistic process creates a better-posed inversion problem. The deconvolution algorithm can therefore converge to a more accurate and robust solution. This enhancement is pronounced for the recovery of weak and deep reflectors that are easily corrupted by noise but critical for extending our understanding of Mars’s climate history. This paper details the theoretical basis of this integrated SED-SDD workflow, validates its performance rigorously on synthetic data, and demonstrates its practical utility on real SHARAD observations of the NPLD.

2. Data and Method

2.1. Structure Enhancement Denoising (SED) as a Pre-Processing Filter

The SED algorithm is based on recursive denoising based on PID and compensates for denoised signals at each iteration [20], where PID is an advanced algorithm that addresses the problem of noise removal from a fundamentally different perspective than traditional filtering [21]. The PID models denoising as a physical process that progressively reduces noise through a powerful heuristic optimization technique called deterministic annealing. The core of the PID process is an iterative update, where an estimated noise differential is subtracted from the image at each step [21]:
x i + 1 = x i α n i ,
where x i is the image at iteration i, n i is the estimated noise differential at iteration i, and α is a scale factor that controls the step size. The crucial part of the process is accurately estimating the noise differential, n i , at each iteration. This is done using robust estimators in both the spatial and frequency domains. A bilateral kernel, k, is used to assign weights based on spatial distance and intensity difference (range) [21]:
k = exp d 2 T exp s 2 X ,
where d is the difference in intensity between a pixel and its neighbors, s is the spatial distance between pixels, and T and X are the scale parameters for range and space, respectively, which are controlled by the annealing schedule. The noise estimate n is then calculated in the frequency domain [21]:
n = ∑∑ D K n u m e l K ,
where D is the 2D Fourier transform of the weighted intensity differences from the spatial domain, K is a frequency domain kernel defined as
K = exp D 2 / V ,
where V is a scale parameter related to the known noise variance σ2:
V = σ 2 k 2 .
The “progressive” nature of the denoising comes from a deterministic annealing schedule, which systematically adjusts the spatial and range parameters (T and X) over the iterations. The range parameter T shrinks over time, making the filter more sensitive to smaller intensity differences in later iterations. The spatial parameter X increases over time, allowing the filter to consider a wider spatial context as the image becomes cleaner [21].
However, the PID algorithm tends to blur weak signals when their amplitudes are close to the background noise level, leading to reduced resolution and broadened reflections. To address this limitation and preserve structural details, we adopt the SED algorithm, which compensates for weak signals that the PID algorithm has over-denoised and restores their reflectivity contrast [20]. The SED algorithm requires only two parameters for each enhancement iteration: the structure-enhancement scale c and the noise variance σ2 [20]. In this study, we adopt a uniform parameter configuration with c = 0.02 and σ2 = {10, 30, 60}.

2.2. Sparse Deterministic Deconvolution (SDD)

The SDD method provides a robust framework for inverting the convolution model to recover the sparse reflectivity series [17,26,27,28]. This method addresses the inversion problem as an l1-regularized least-squares optimization. The objective is to find an estimated reflectivity series r e s t that minimizes a cost function composed of two competing terms [17]:
r e s t = arg min r W r s 2 2 + λ r 1 ,
The first term is the data fidelity or data misfit term. The second term is the regularization term. The l1-norm r 1 = i r i is a convex function that promotes sparsity in the solution vector r. The positive regularization parameter λ controls the trade-off between data fidelity and the sparsity of the solution. A small value of λ will result in a solution that fits the data very closely but may be less sparse and contain noise. A large value of λ will enforce strong sparsity, producing a result with very few, sharp reflectors, but may risk suppressing genuine, weaker geological features or deviating significantly from the observed data. The optimal value of λ is typically determined empirically, for example, using the L-curve method, which plots data misfit against solution sparsity [17]. However, noise present in the original radargram often biases the L-curve toward a smaller λ o , which is suboptimal for recovering weak reflectivity. To address this issue, we compare the number of reflectors in both the original and structure-enhanced radargrams ( N O and N S , respectively). The ratio of these two quantities is then used to adjust the small λ value obtained from the L-curve, thereby improving the deconvolution performance when using the structure-enhanced radargrams as input:
λ = λ o N S N O
To solve the convex optimization problem, the SDD method employs the alternating direction method of multipliers [29], which is an efficient algorithm that decomposes the original problem into a sequence of smaller, easier-to-solve subproblems. It works by splitting the variable r into two copies and then iteratively solving for each copy while enforcing that they remain equal. This iterative process consists of a ridge regression step and a soft-thresholding step, which can be solved efficiently, allowing the algorithm to converge to the optimal sparse solution.
The complete integrated workflow is a sequential, two-stage process designed to decouple the challenges of noise removal and signal inversion. The input is a standard 2D SHARAD radargram as a matrix of echo power. This entire matrix is processed by the SE algorithm, and the output is a structure-enhanced radargram with a greatly improved SNR, largely free of unstructured noise and artifacts. A wavelet-based reflector extraction method is then applied to estimate the number of reflectors for both the original and structure-enhanced radargrams to determine the deconvolution parameter λ. Finally, each column signal is processed with the 1D SDD algorithm, which inverts the convolution model and transforms the band-limited echo profile into a sparse series of reflectivity spikes. The whole workflow is illustrated in Figure 1.

3. Results

To validate the effectiveness of our proposed workflow (Figure 1), we performed a series of tests on synthetic radar data. The synthetic radargrams were generated based on our developed open-source 1D electromagnetic wave forward-modeling software PPMSim, which is publicly available at https://github.com/raypenper/PPMSim.git (accessed on 20 October 2025). The synthetic radargrams and the reflectivity models are from previous studies [22]. We tested three distinct scenarios corresponding to low (−30 dB), moderate (−20 dB), and high (−10 dB) noise levels to assess the robustness of the method.

3.1. Synthetic Model

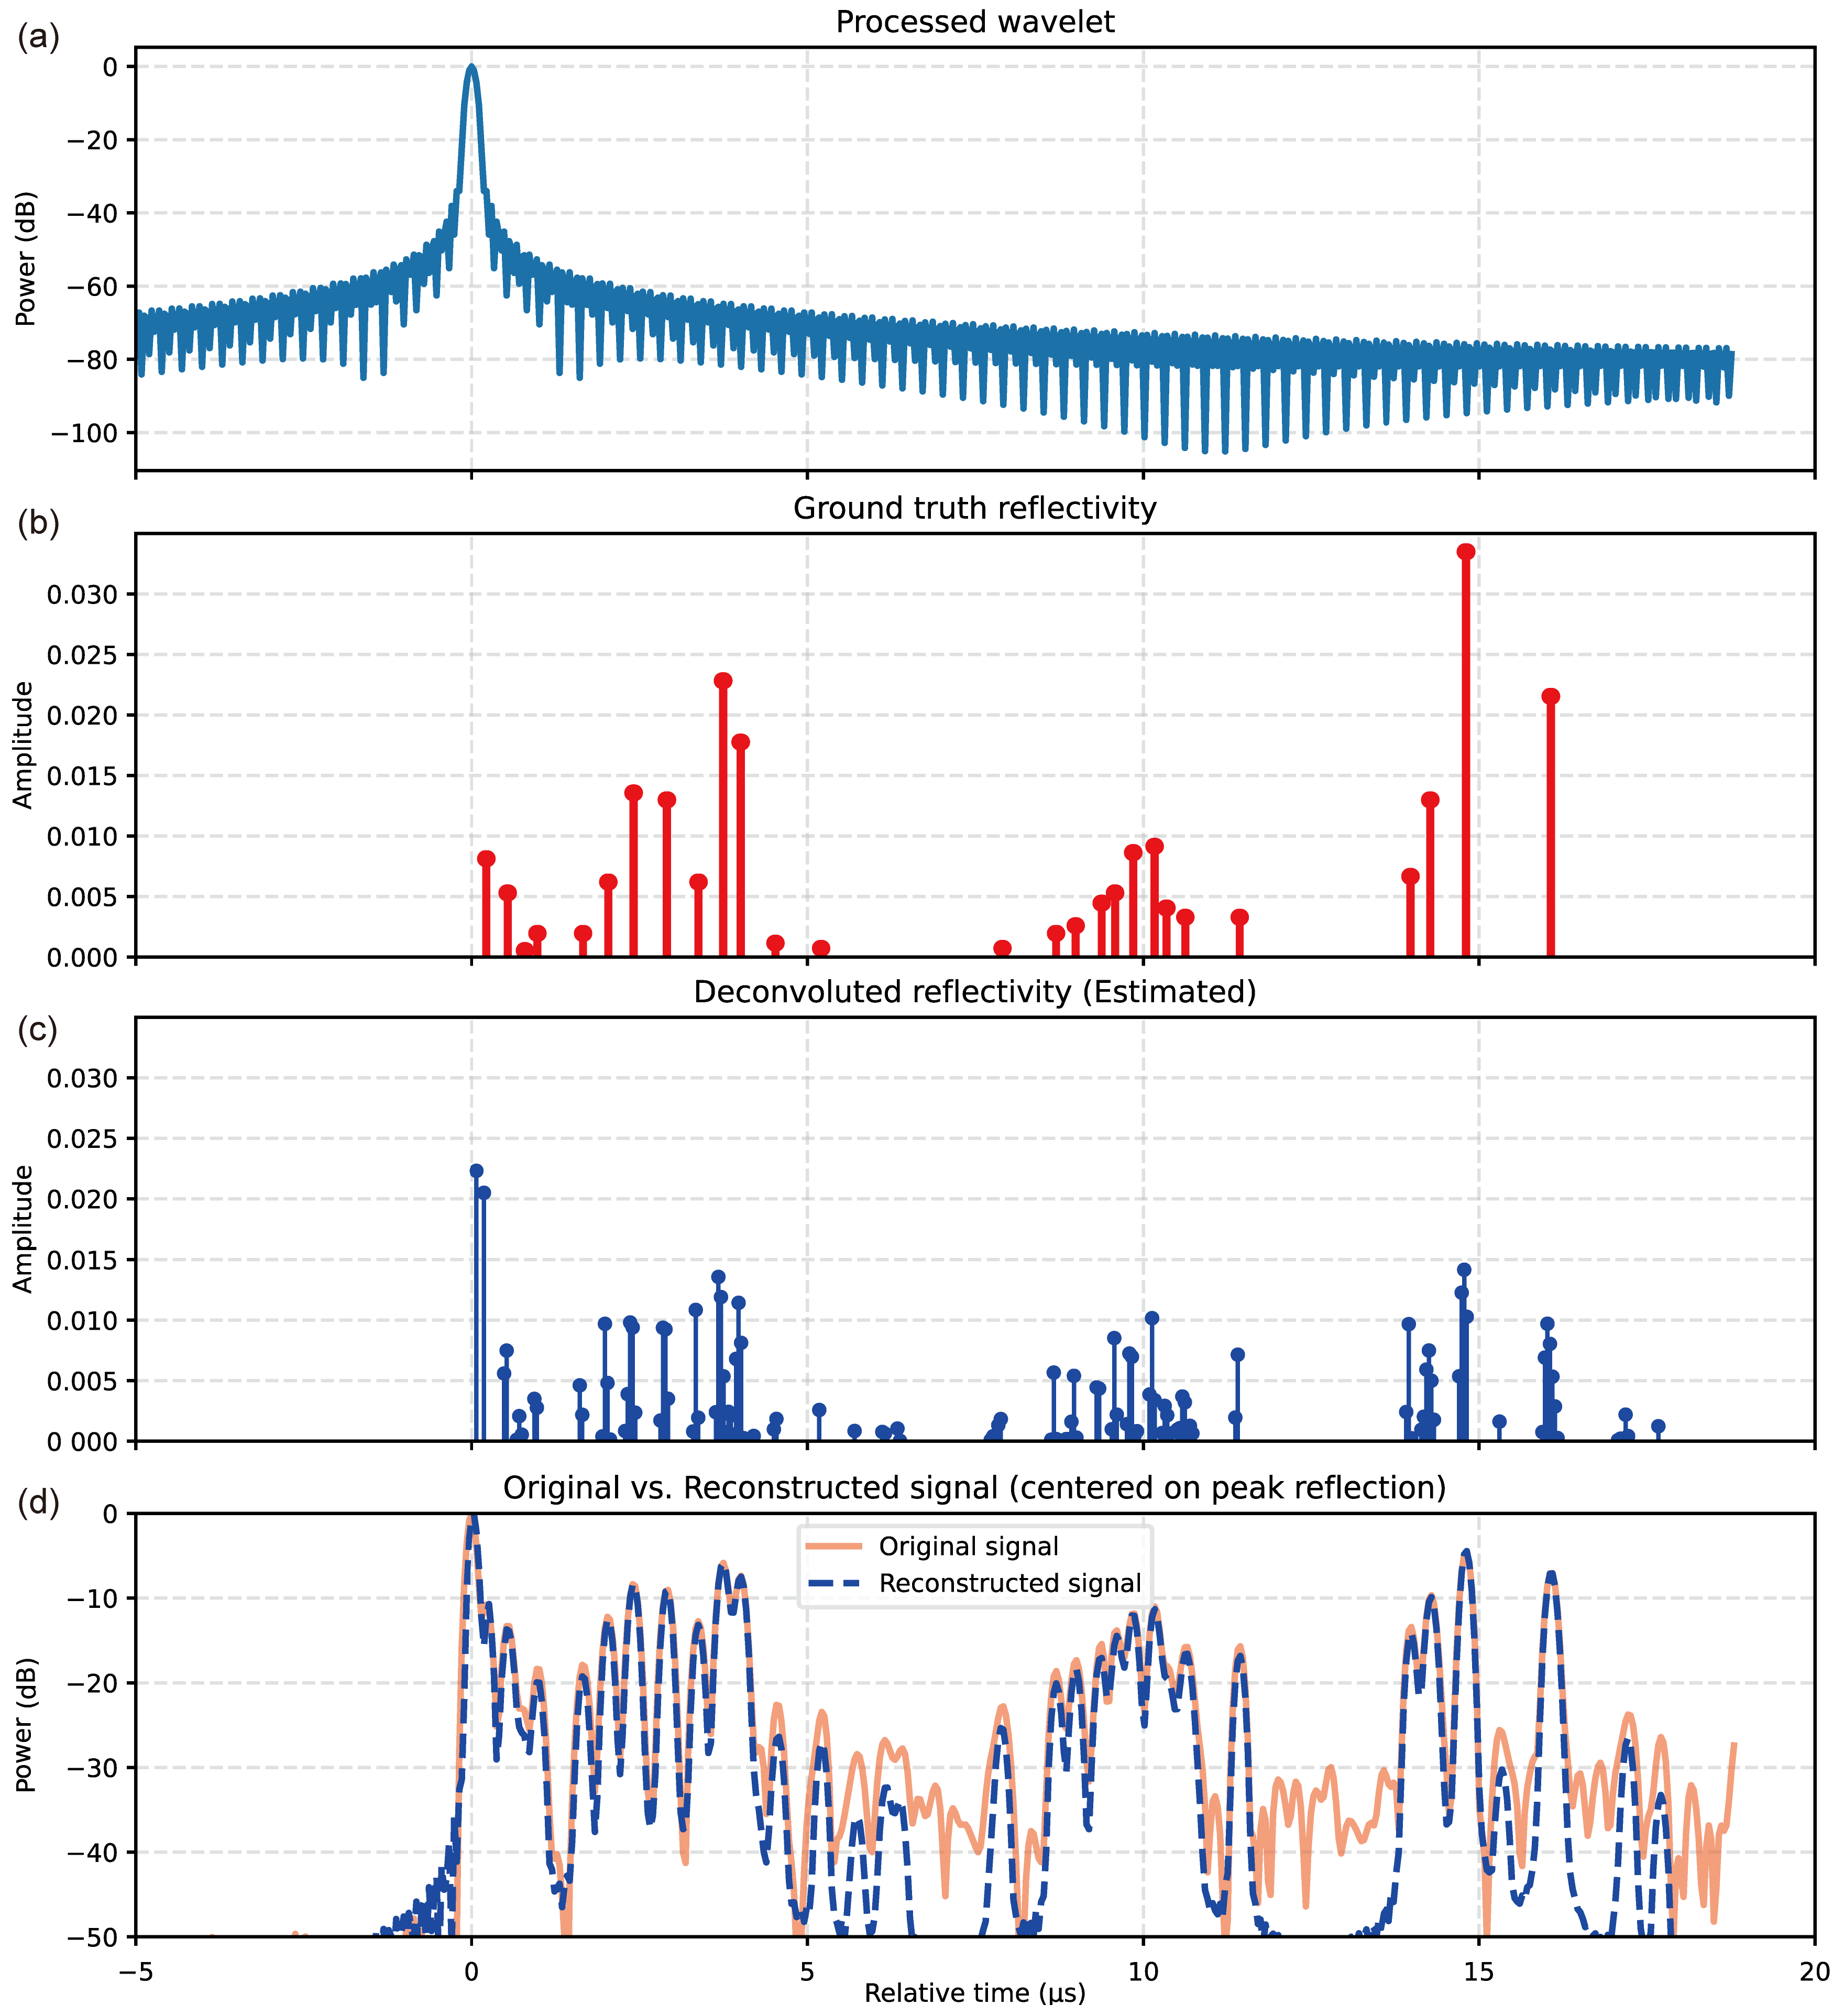
We first illustrate the performance and a common challenge of deconvolution on a single, low-noise synthetic trace, as shown in Figure 2. We applied a standard deconvolution algorithm, with the regularization parameter λ determined using the L-curve criterion. While the algorithm successfully identifies the correct locations of the reflectors, a notable artifact is present: single, sharp reflectors in the true series are often represented as a cluster of several smaller, adjacent spikes (Figure 2c). This phenomenon is a well-known issue in discrete sparse deconvolution [29]. It arises because the inverse problem is ill-posed, and there is often a basis mismatch between the continuous nature of a true reflection and its discrete representation in the model [29,30]. The regularization term, which is essential for stabilizing the inversion, must compromise between fitting the data and enforcing sparsity, sometimes resulting in the distribution of a single reflection’s energy across multiple adjacent sample points. Despite this, the reconstructed waveform shown in Figure 2d accurately matches the original, confirming a mathematically valid inversion.
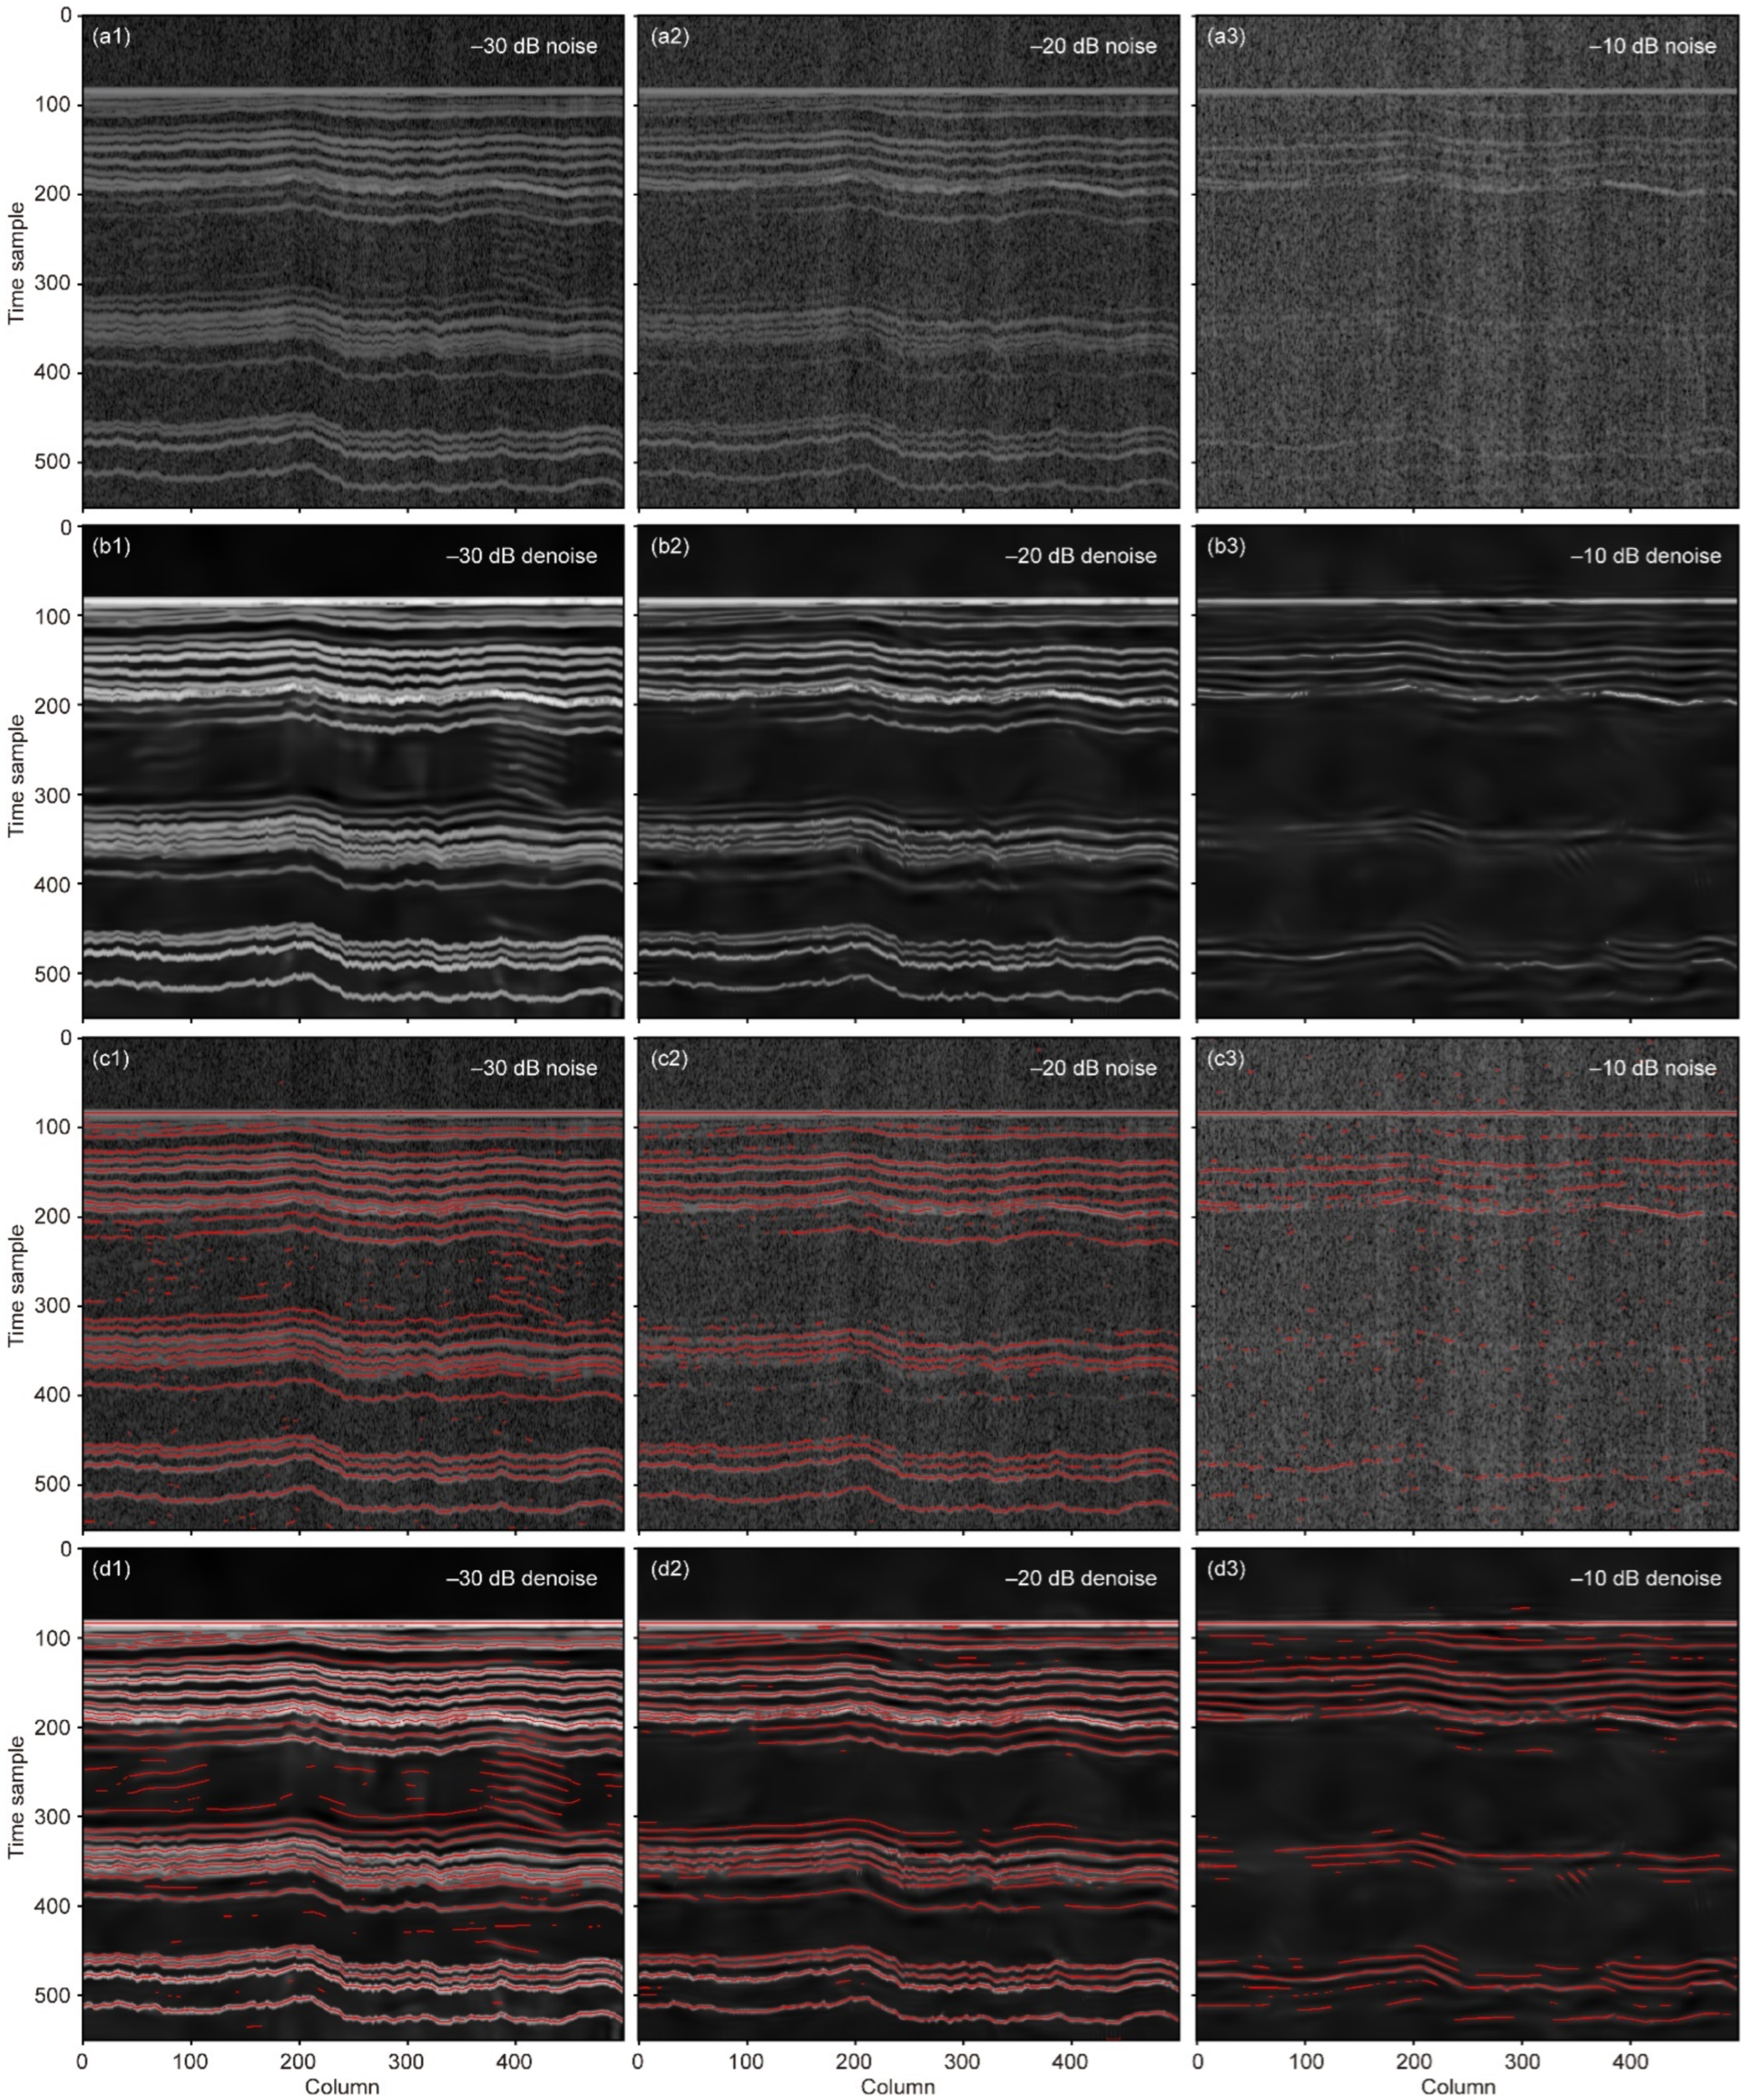
We then expanded the test to full 2D radargrams, generating data with low (−30 dB), moderate (−20 dB), and high (−10 dB) noise levels (Figure 3(a1–a3)). We applied an automated reflector extraction algorithm to these noisy datasets. As illustrated by the red lines, the number of coherent reflectors detected decreases significantly as the noise level increases. Next, we applied SED to these three radargrams (Figure 3(b1–b3)). The reflectors in the structure-enhanced radargrams are significantly more continuous and coherent, allowing the extraction algorithm to identify most of the true structures, even in the high-noise case (cf. Figure 3(d2,d3)). This step provides the crucial a priori information for our proposed method. We observed that the ratio of the number of reflectors extracted from the original radargrams to the number extracted from the denoised radargrams is approximately 0.8 for all three noise levels. This consistent ratio serves as a robust prior estimate, linking the data quality to the reflector sparsity, which we will use to guide the deconvolution.
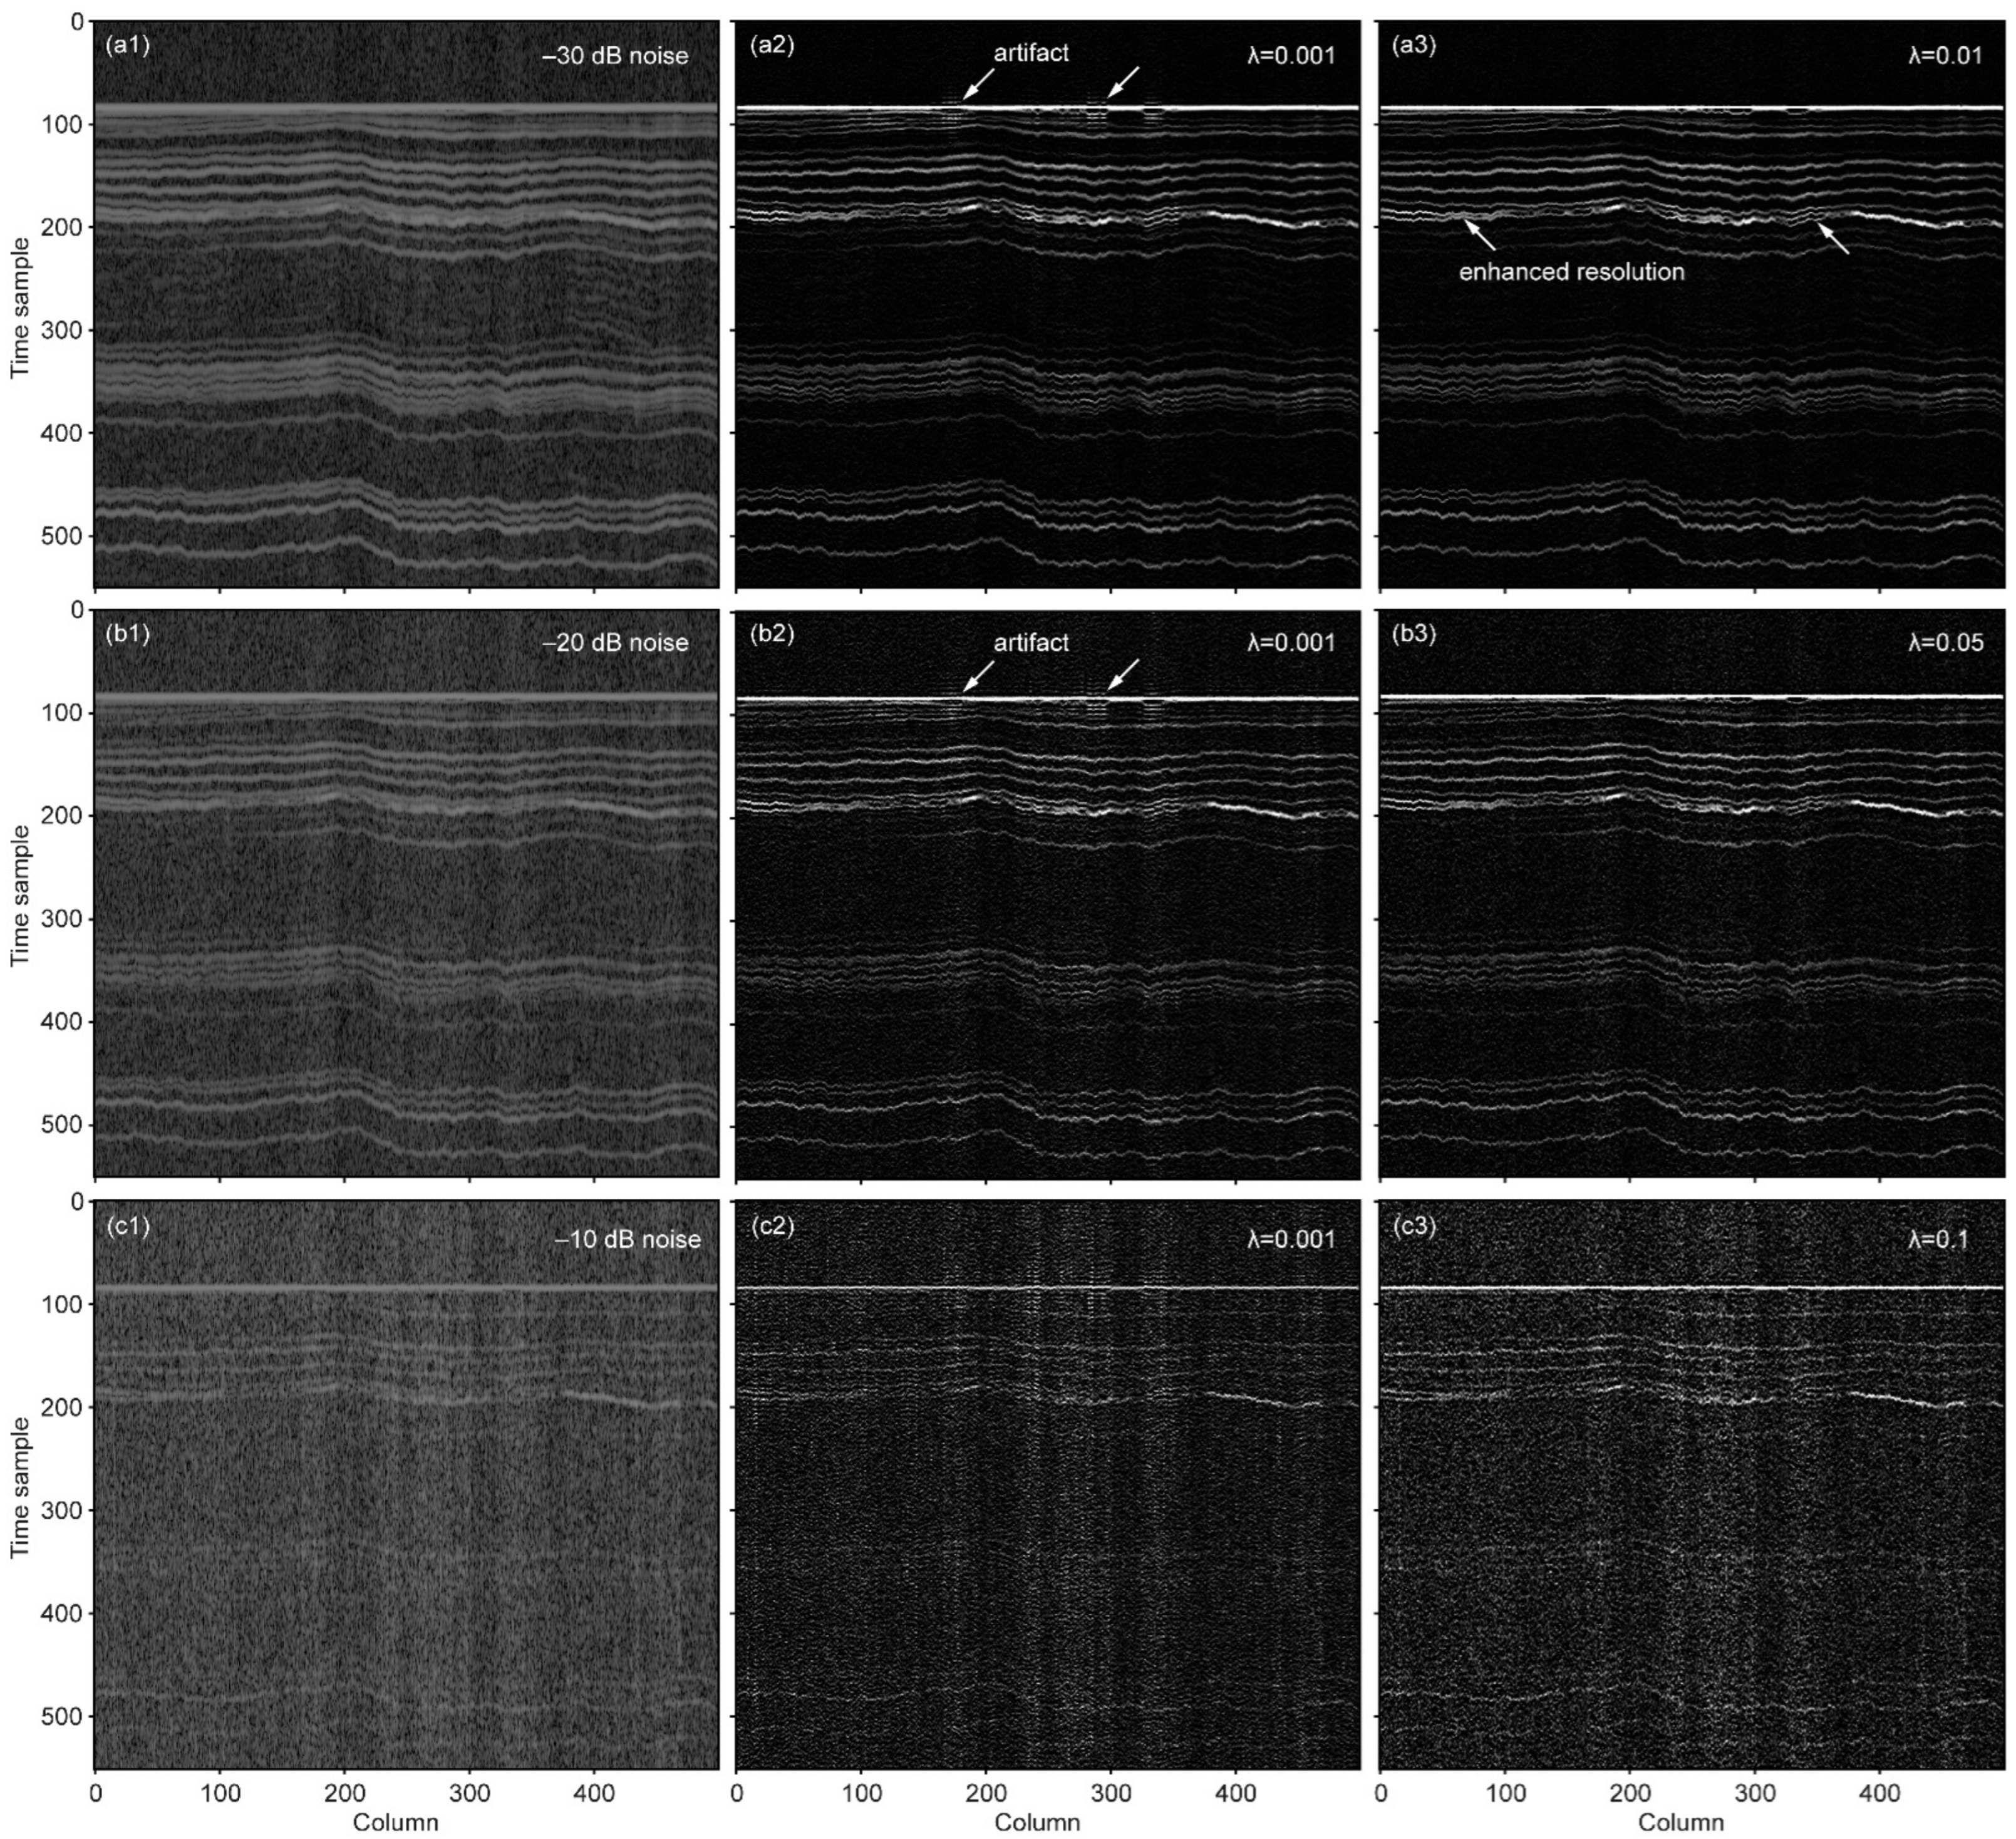
We then compared the performance of the deconvolution using two different strategies for selecting the regularization parameter λ. First, we applied the deconvolution directly to the original noisy radargrams. Using a pre-selected small λ (under-regularization) results in an unstable solution, introducing significant artifacts (ringing), as indicated by the downward arrows in Figure 4(a2,b2). Using the λ determined by the standard L-curve method (Figure 4(a3,b3,c3)) produces a stable result free of these artifacts. In the low-noise case (Figure 4(a3)), it successfully enhances the resolution (upward arrows). However, as the noise level increases, the performance of the L-curve method degrades. The resulting deconvolution (Figure 4(b3,c3)) becomes overly smoothed, and significant structural detail is lost. This demonstrates that the standard L-curve method is insufficient for noisy data.
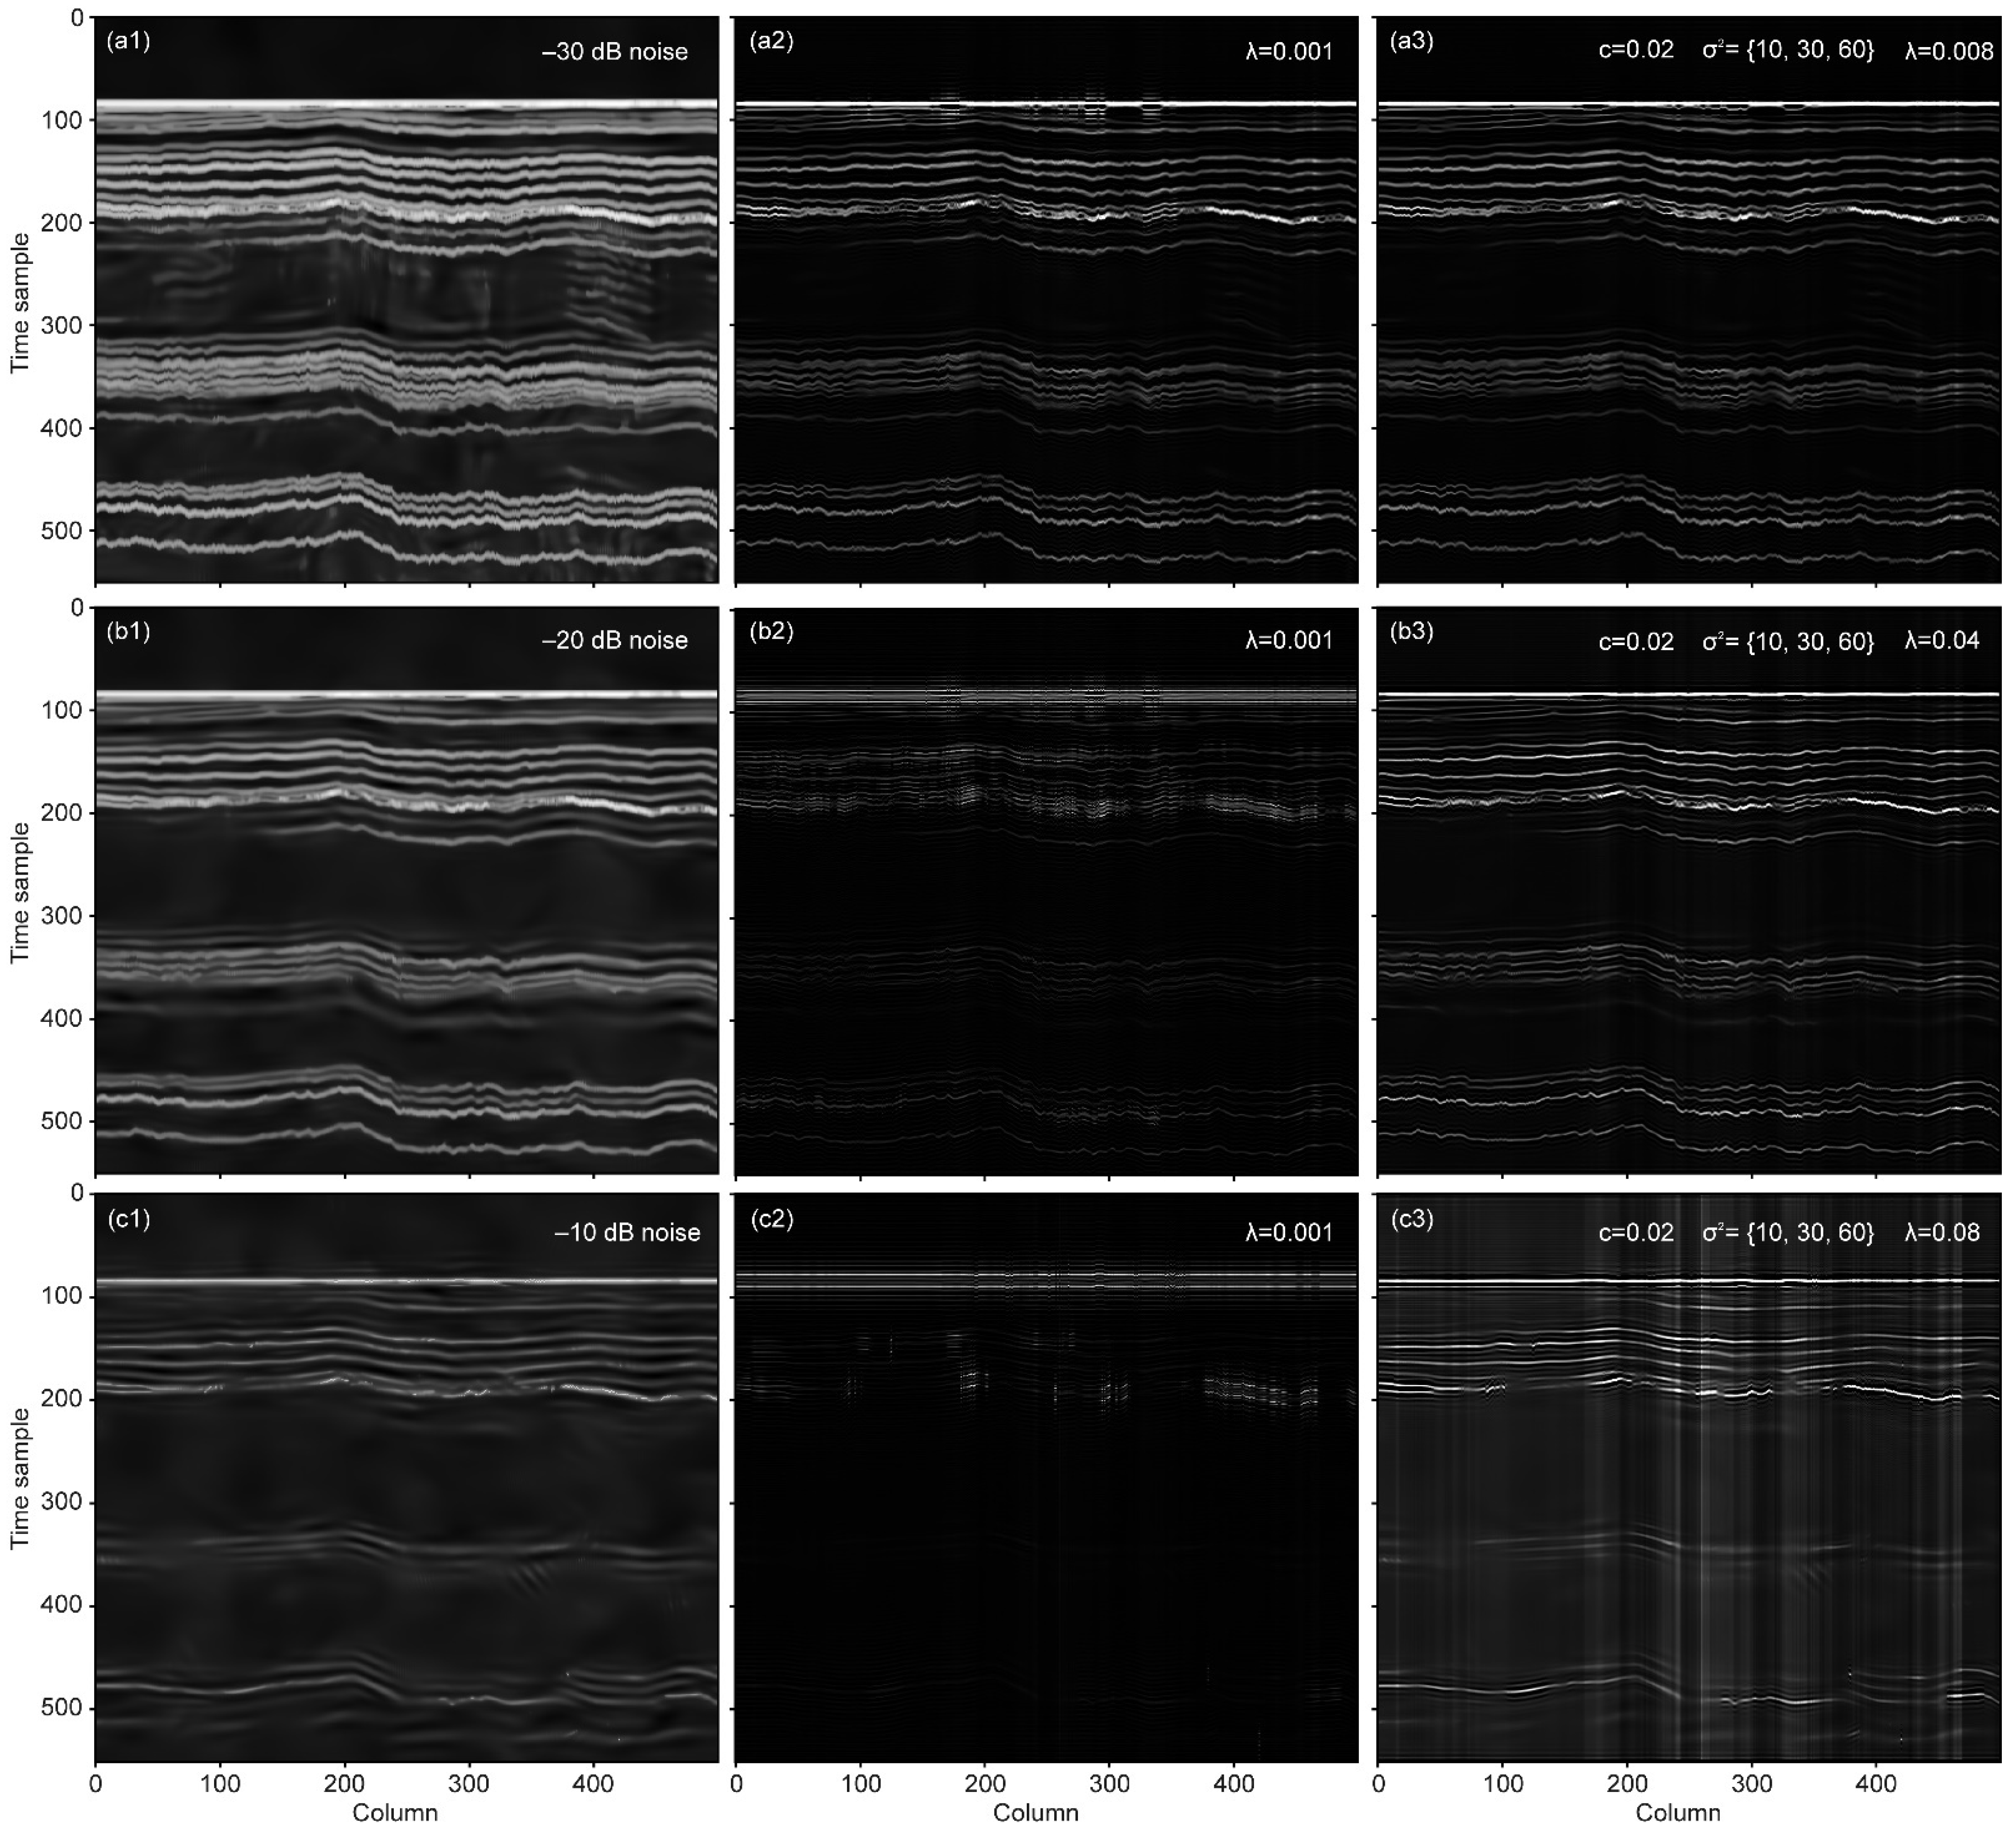
Finally, we performed the deconvolution on the structure-enhanced (denoised) radargrams, again comparing two λ selection strategies. If we again use the standard L-curve method (Figure 5(a3,b3,c3)), we find that it performs poorly. The denoising process makes the data “cleaner,” and the L-curve method selects a λ that over-smooths the result, leading to an evident loss of structural details, especially at high noise levels (Figure 5(c3)). In contrast, when we use our proposed a priori λ—derived by scaling the L-curve value by the 0.8 reflector ratio as defined in Equation (7)—the results are superior (Figure 5(a2,b2,c2)).
By comparing the results, the benefit of our approach is clear. While the standard L-curve method on the denoised data (Figure 5(c3)) loses significant details, our proposed method (Figure 5(c2)) leverages the prior information gained from the reflector extraction, successfully preserving the fine structural details of the reflectors, even under high-noise conditions. This test confirms our central hypothesis: denoising the data not only improves clarity but also provides vital a priori information that can be used to constrain the deconvolution parameters, leading to a more robust and high-resolution result.

3.2. SHARAD Radargrams

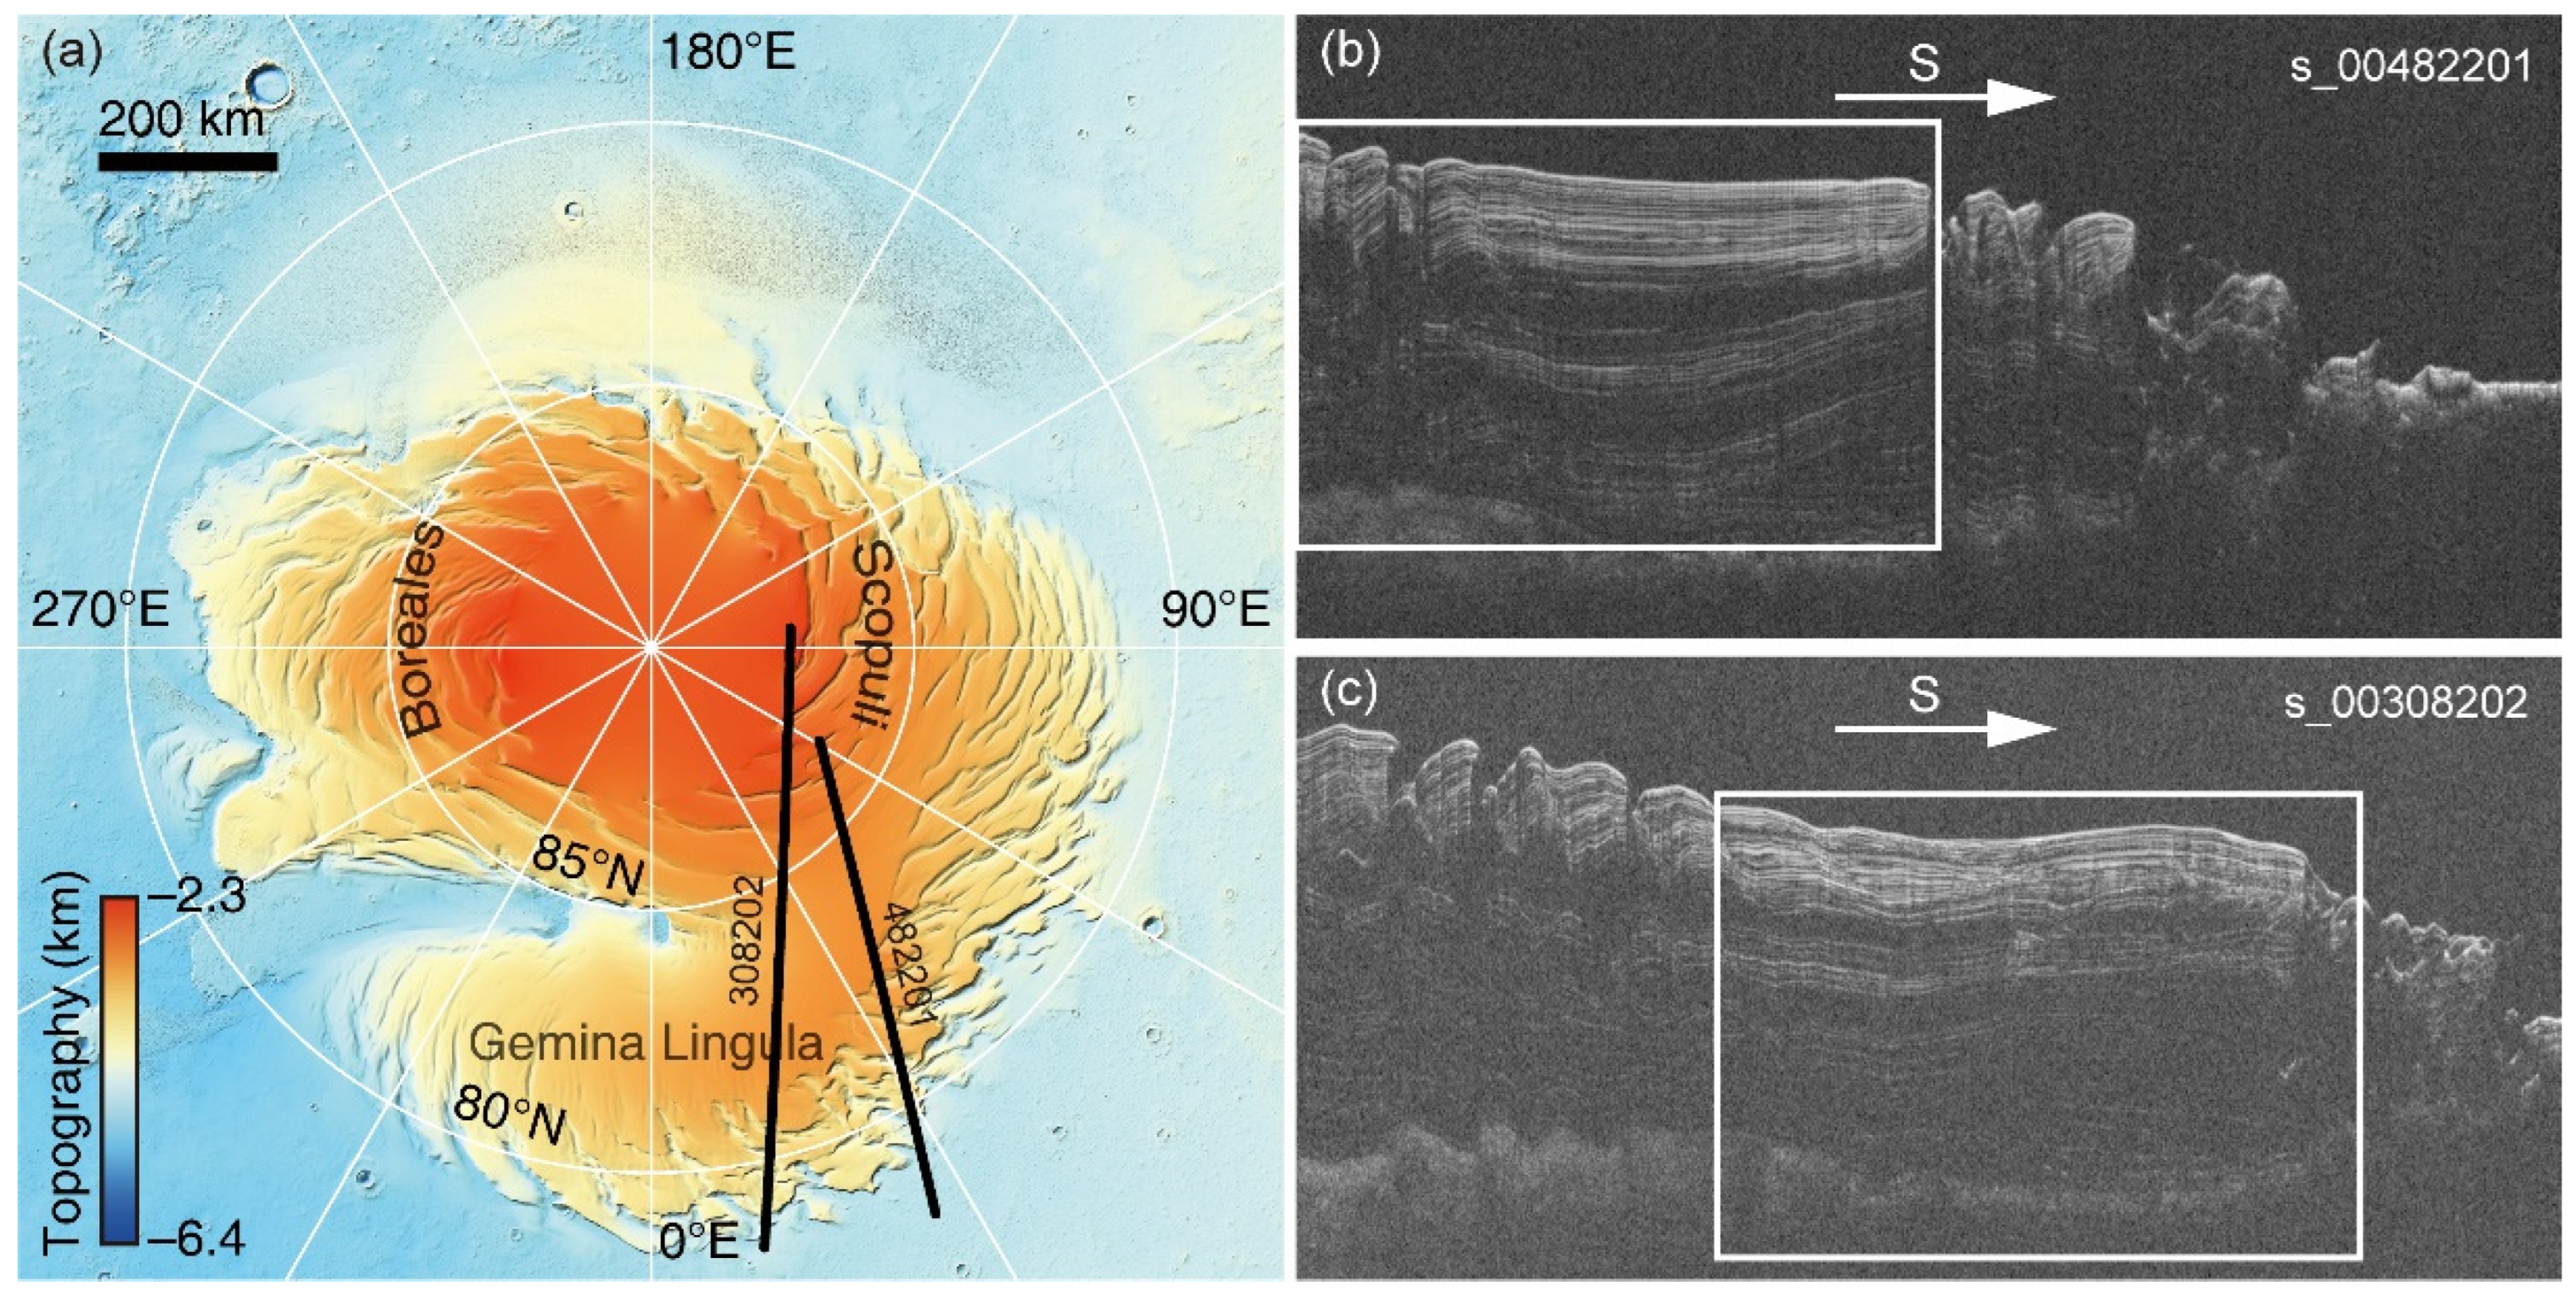
The NPLD is a massive, layered sequence of water ice and dust, kilometers thick, that preserves a high-resolution record of Mars’ recent climate history. Resolving these fine-scale layers is a primary objective for understanding past depositional and erosional cycles. We selected two SHARAD observations, s_00308202 and s_00482201, which traverse the main NPLD lobe and a portion of Gemina Lingula, as shown in Figure 6. While SHARAD provides excellent vertical resolution (∼15 m in free space), its data are often contaminated by surface clutter and noise, which can obscure subtle or deep reflectors.
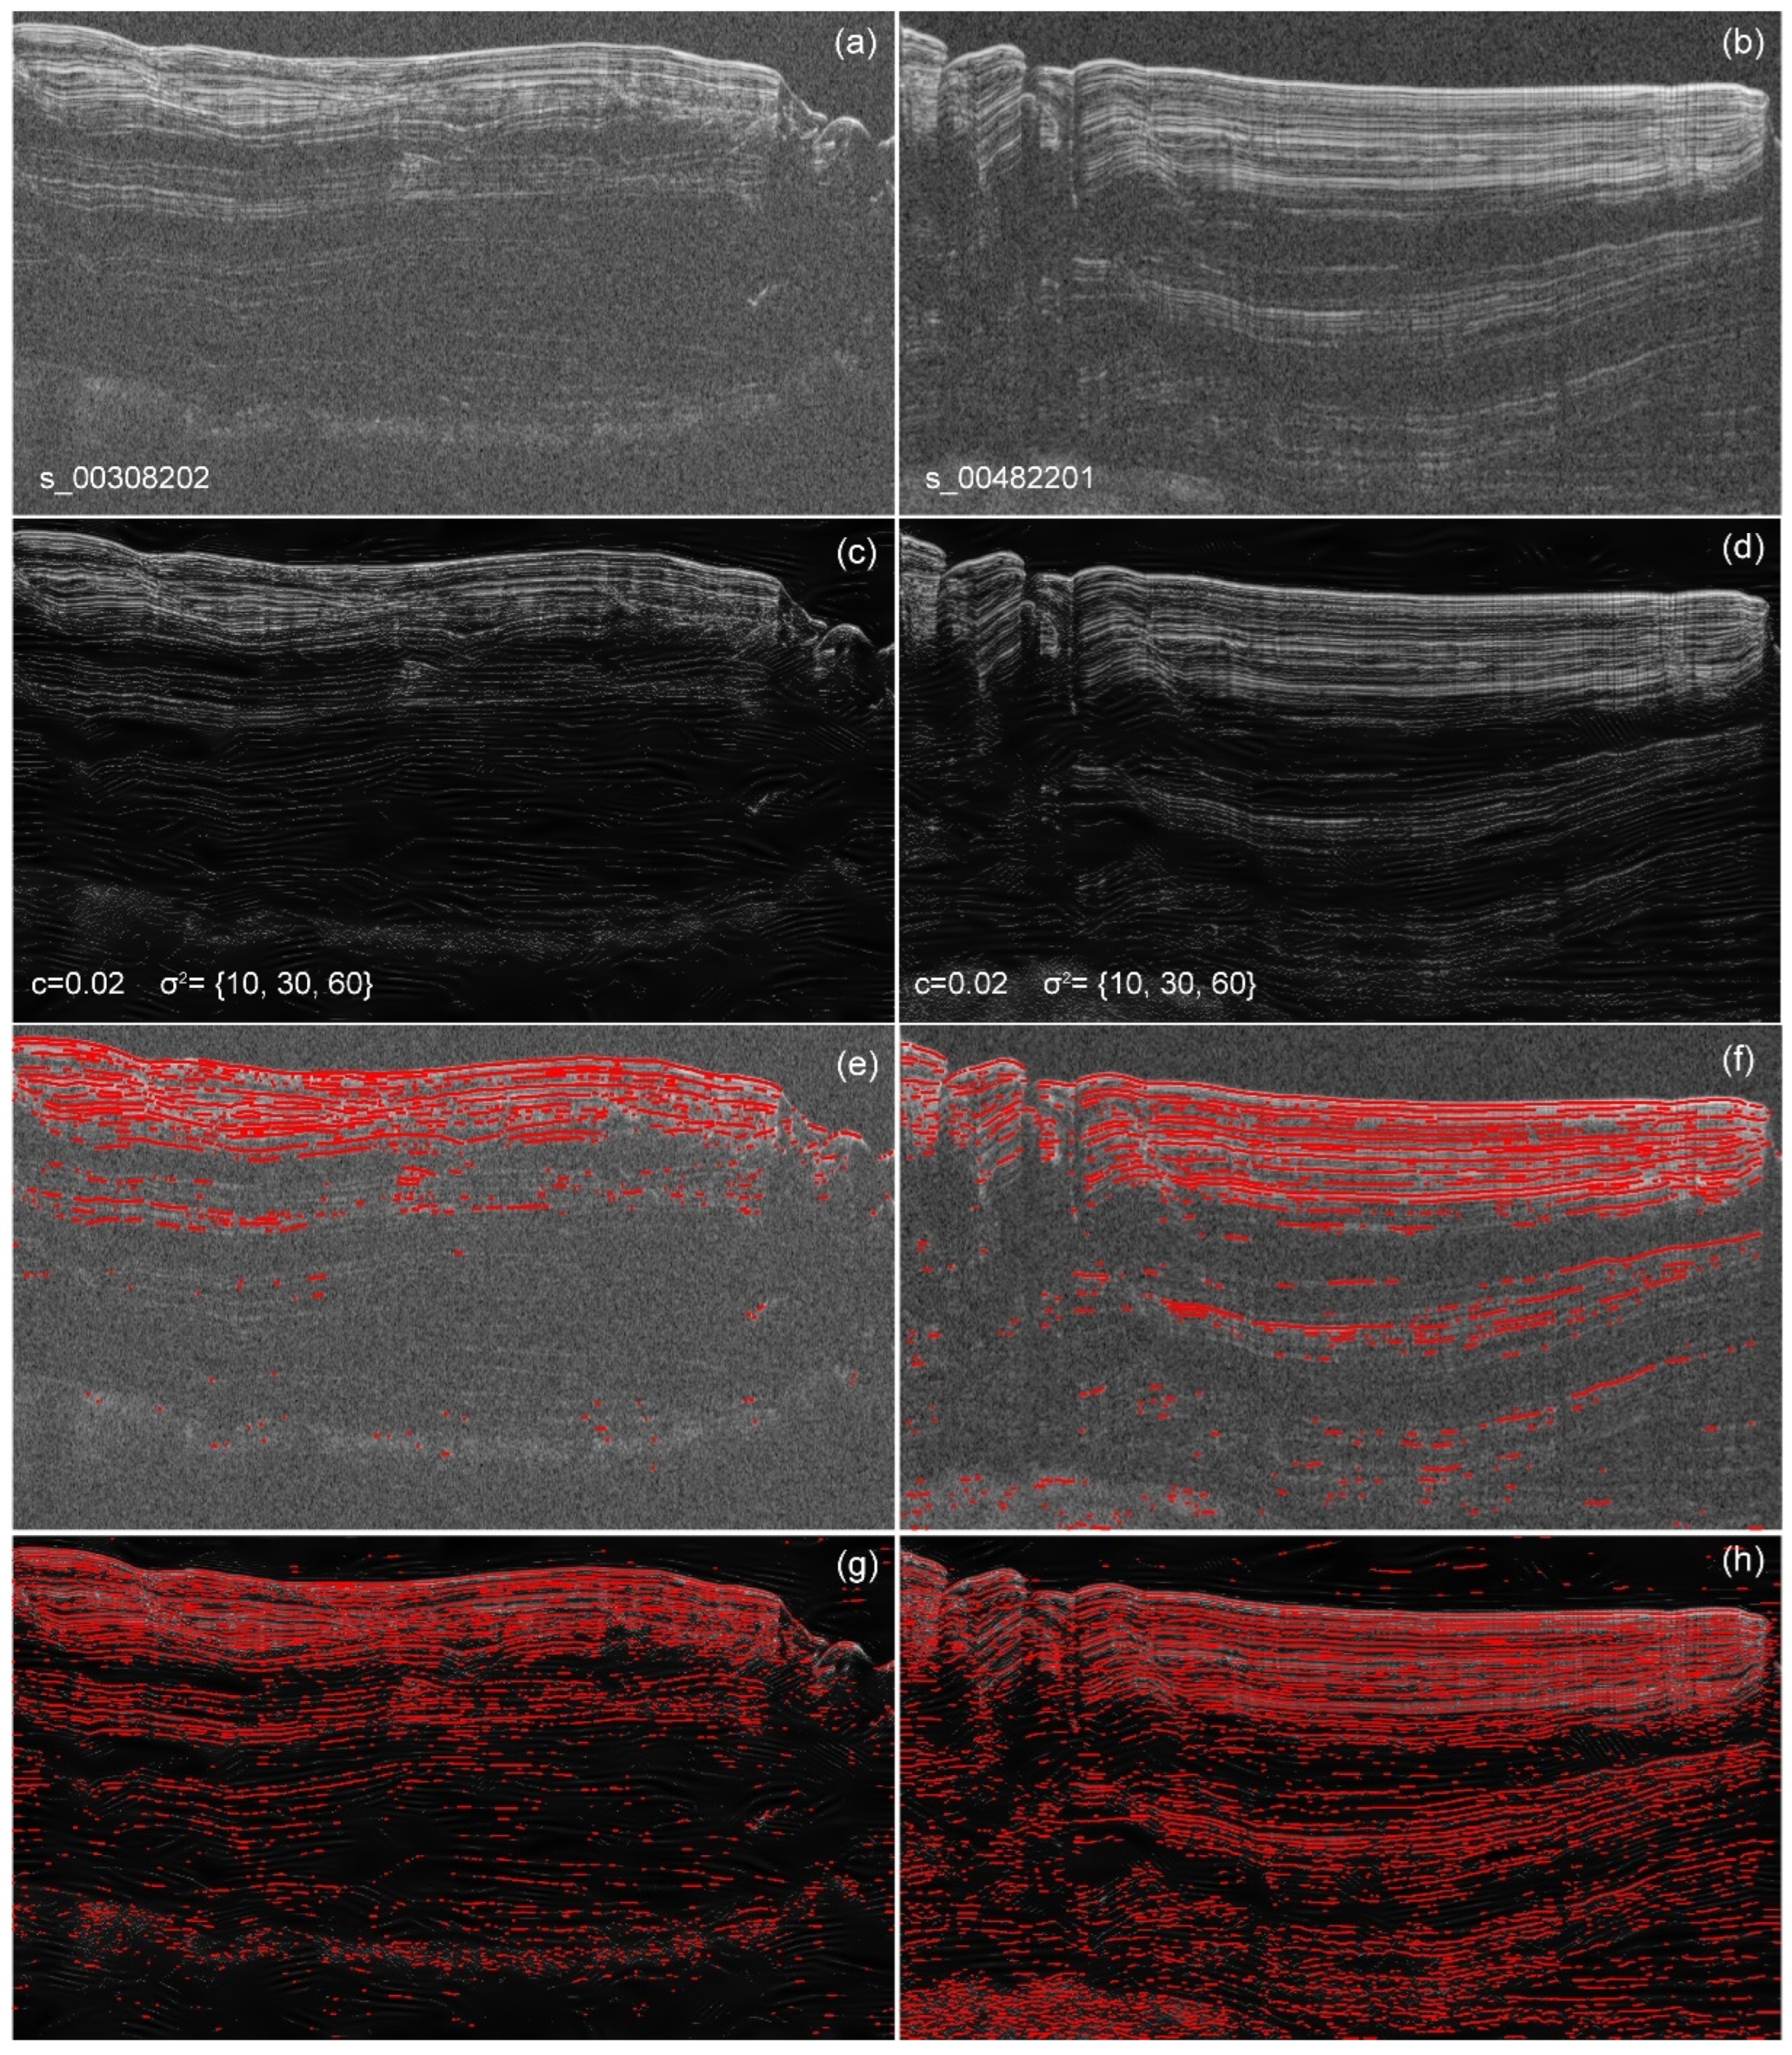
Figure 7a,b show segments of the original SHARAD radargrams. These data were first processed using SED, with the results shown in Figure 7c,d. The impact of the denoising is immediately apparent: the SNR is significantly improved, and internal reflectors—especially weak, deep layers—become more coherent and continuous. We further applied the automated reflector extraction algorithm to both the original (Figure 7e,g) and the structure-enhanced radargrams (Figure 7f,h). As with the synthetic data, the enhanced radargrams yielded a much higher number of detected reflectors. This step was crucial for determining the a priori regularization parameter. We calculated the ratio of the number of reflectors in the original radargrams to that in the SE radargrams, obtaining scaling factors of approximately 0.4 for radargram s_00308202 and 0.5 for radargram s_00482201. However, as seen most prominently in the upper section near the shallow subsurface (Figure 7c,d,g,h), the structure enhancement processing introduces minor vertical striping and high-amplitude artifacts. These features are characteristic of residual side-lobe energy or noise that concentrates near the strong surface return, where the deconvolution process struggles to perfectly model the complex near-field response. While these artifacts are confined to the upper few tens of meters and do not obscure the deeper stratigraphy that is the primary focus of this study, their presence should be noted when interpreting the near-surface reflectors.
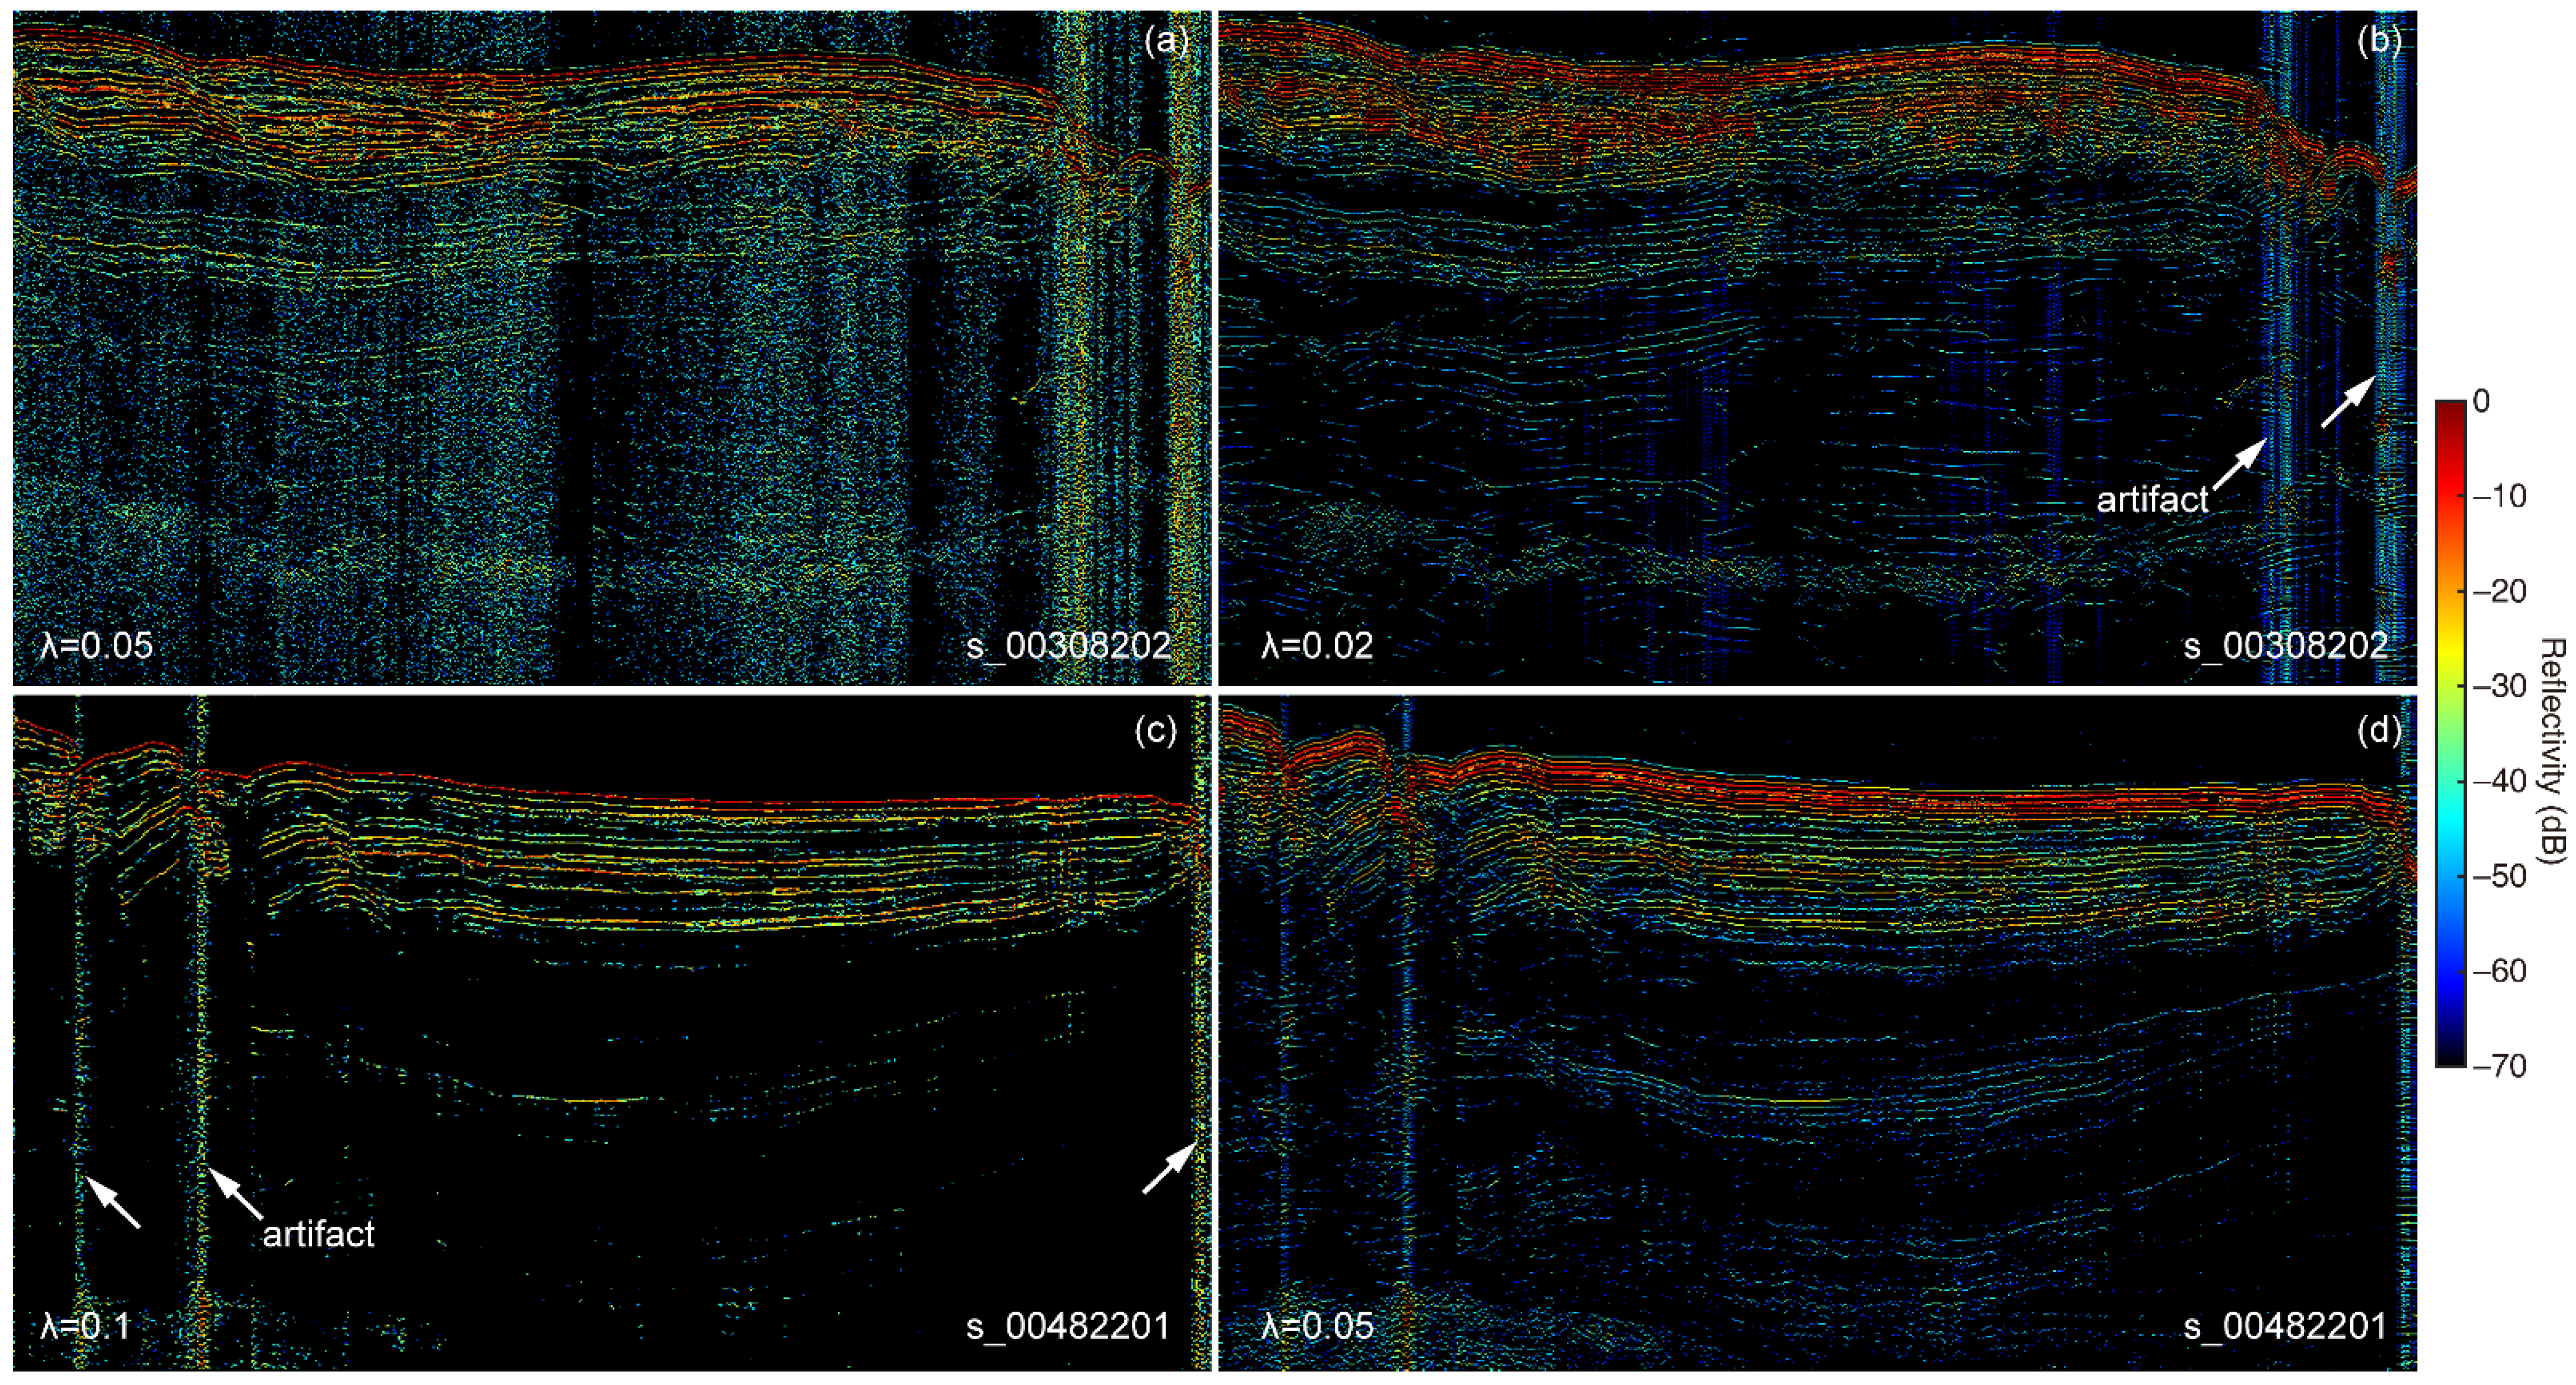
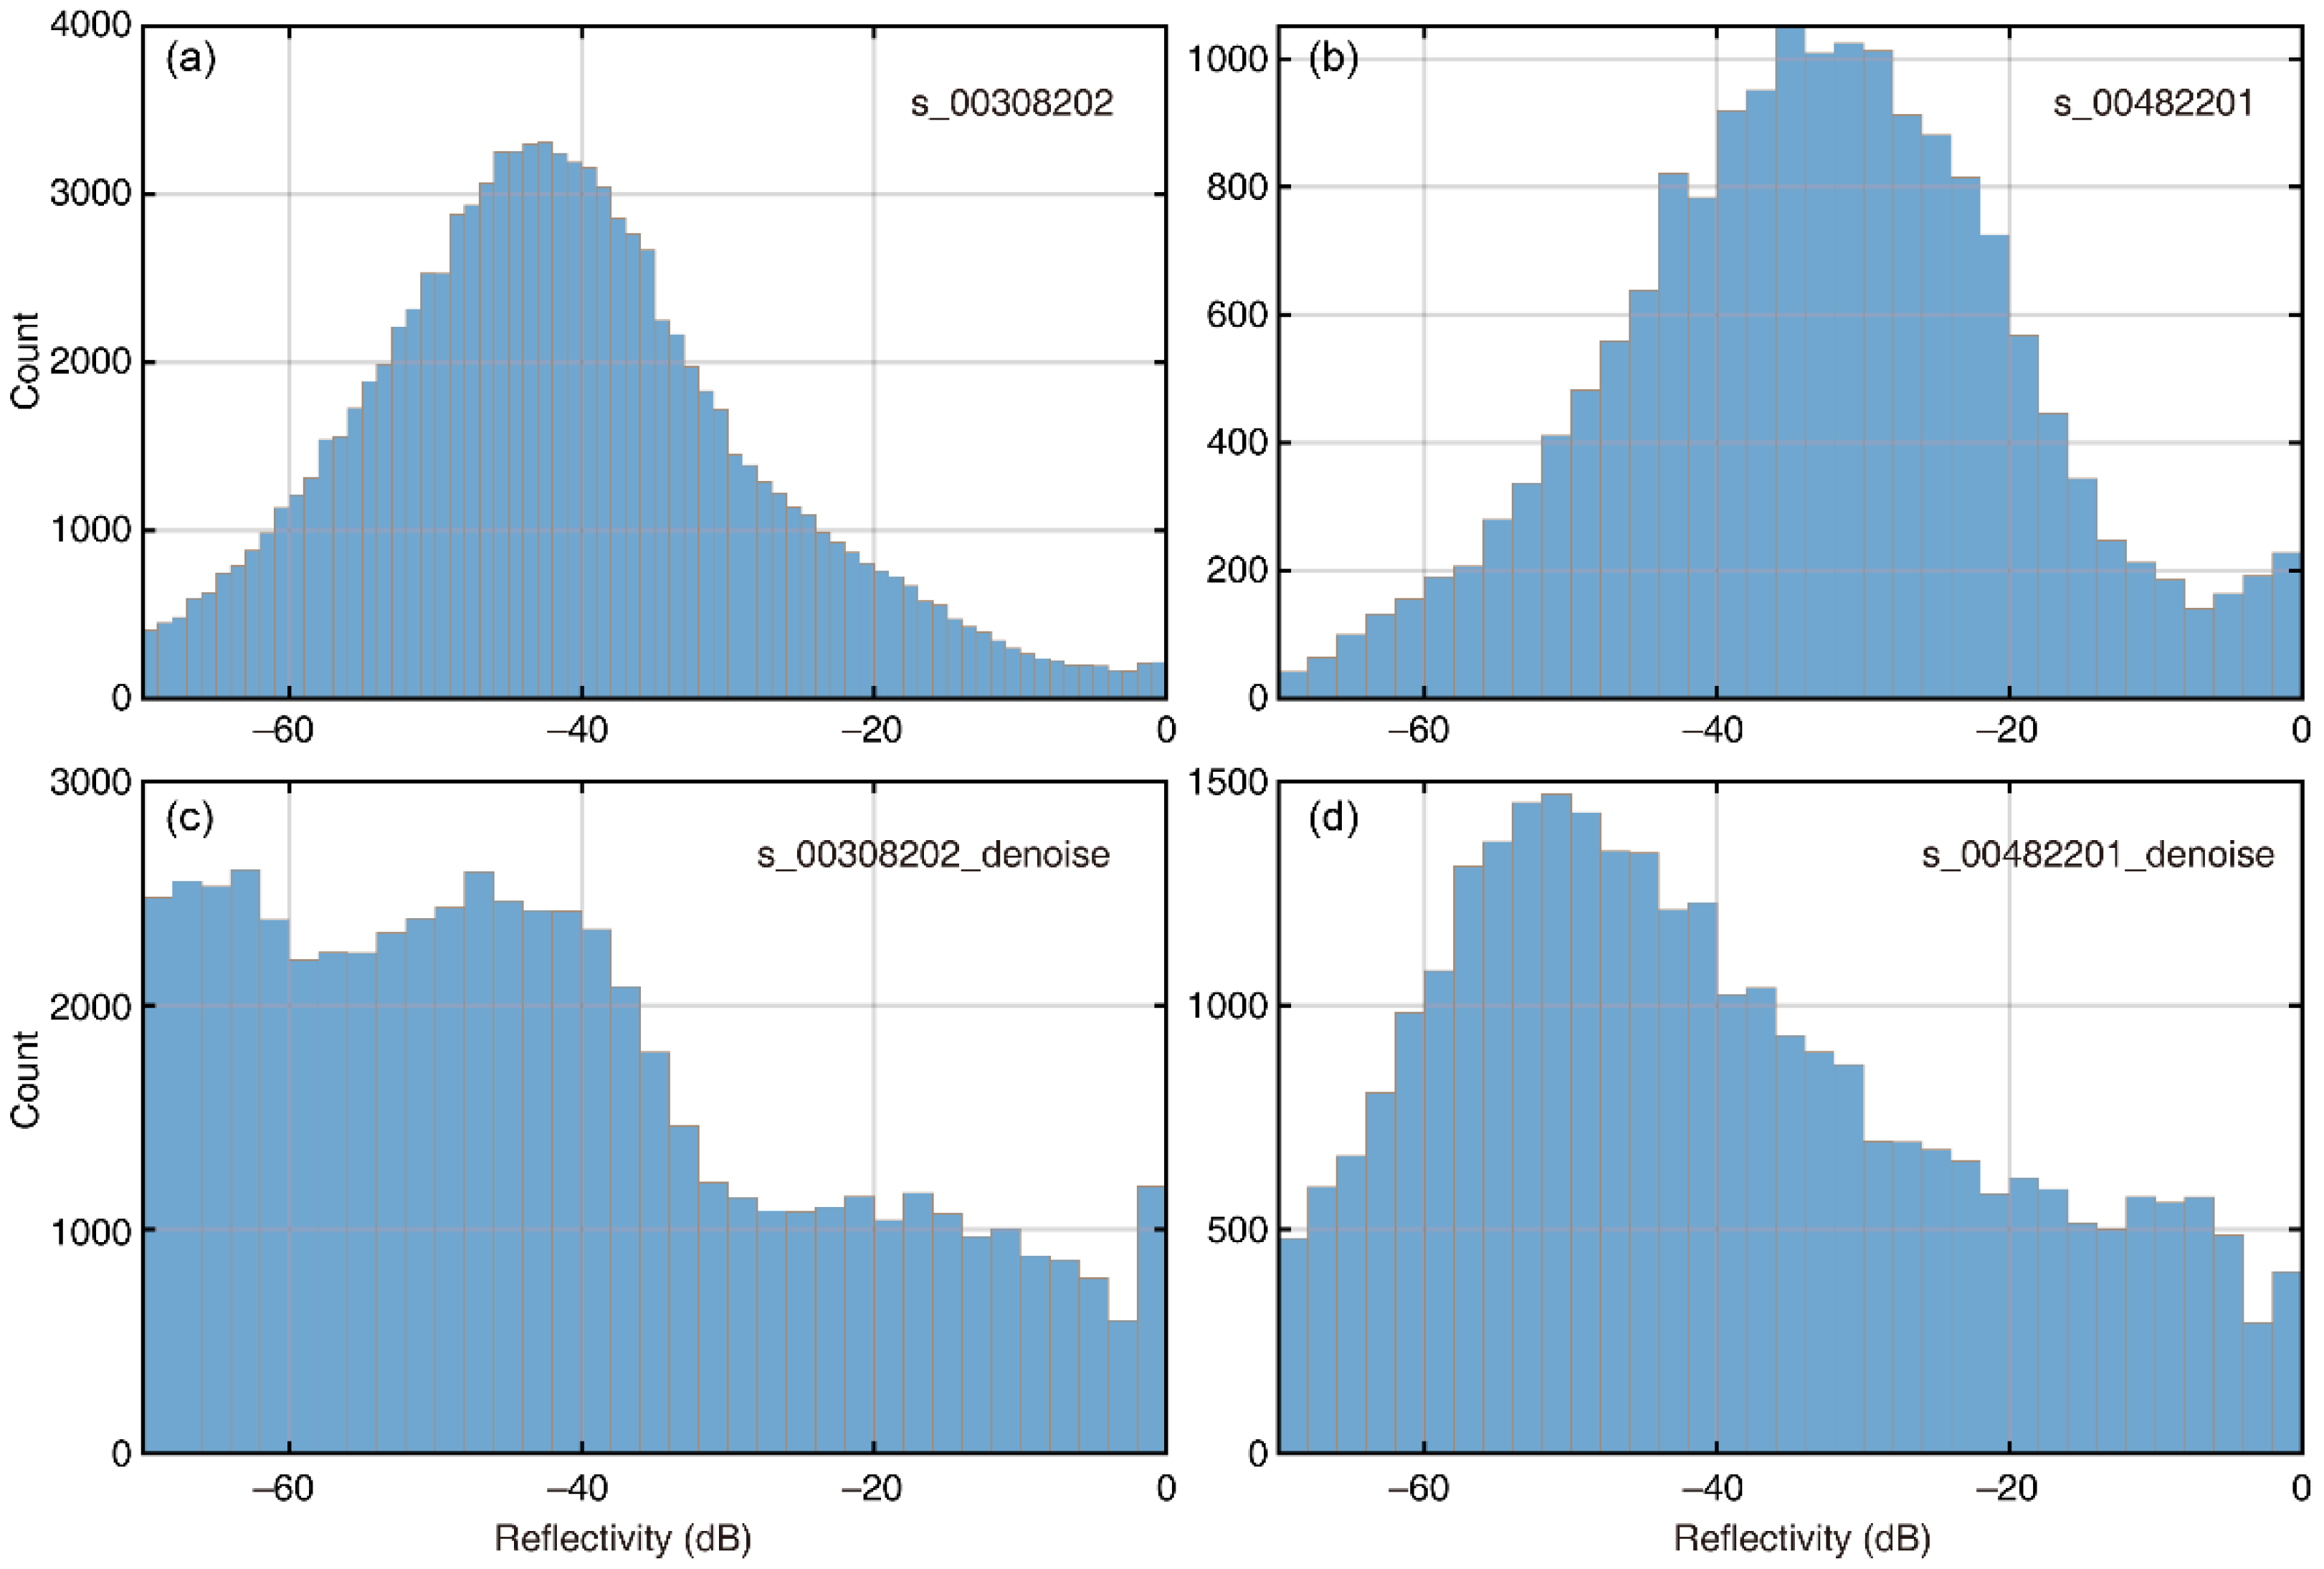
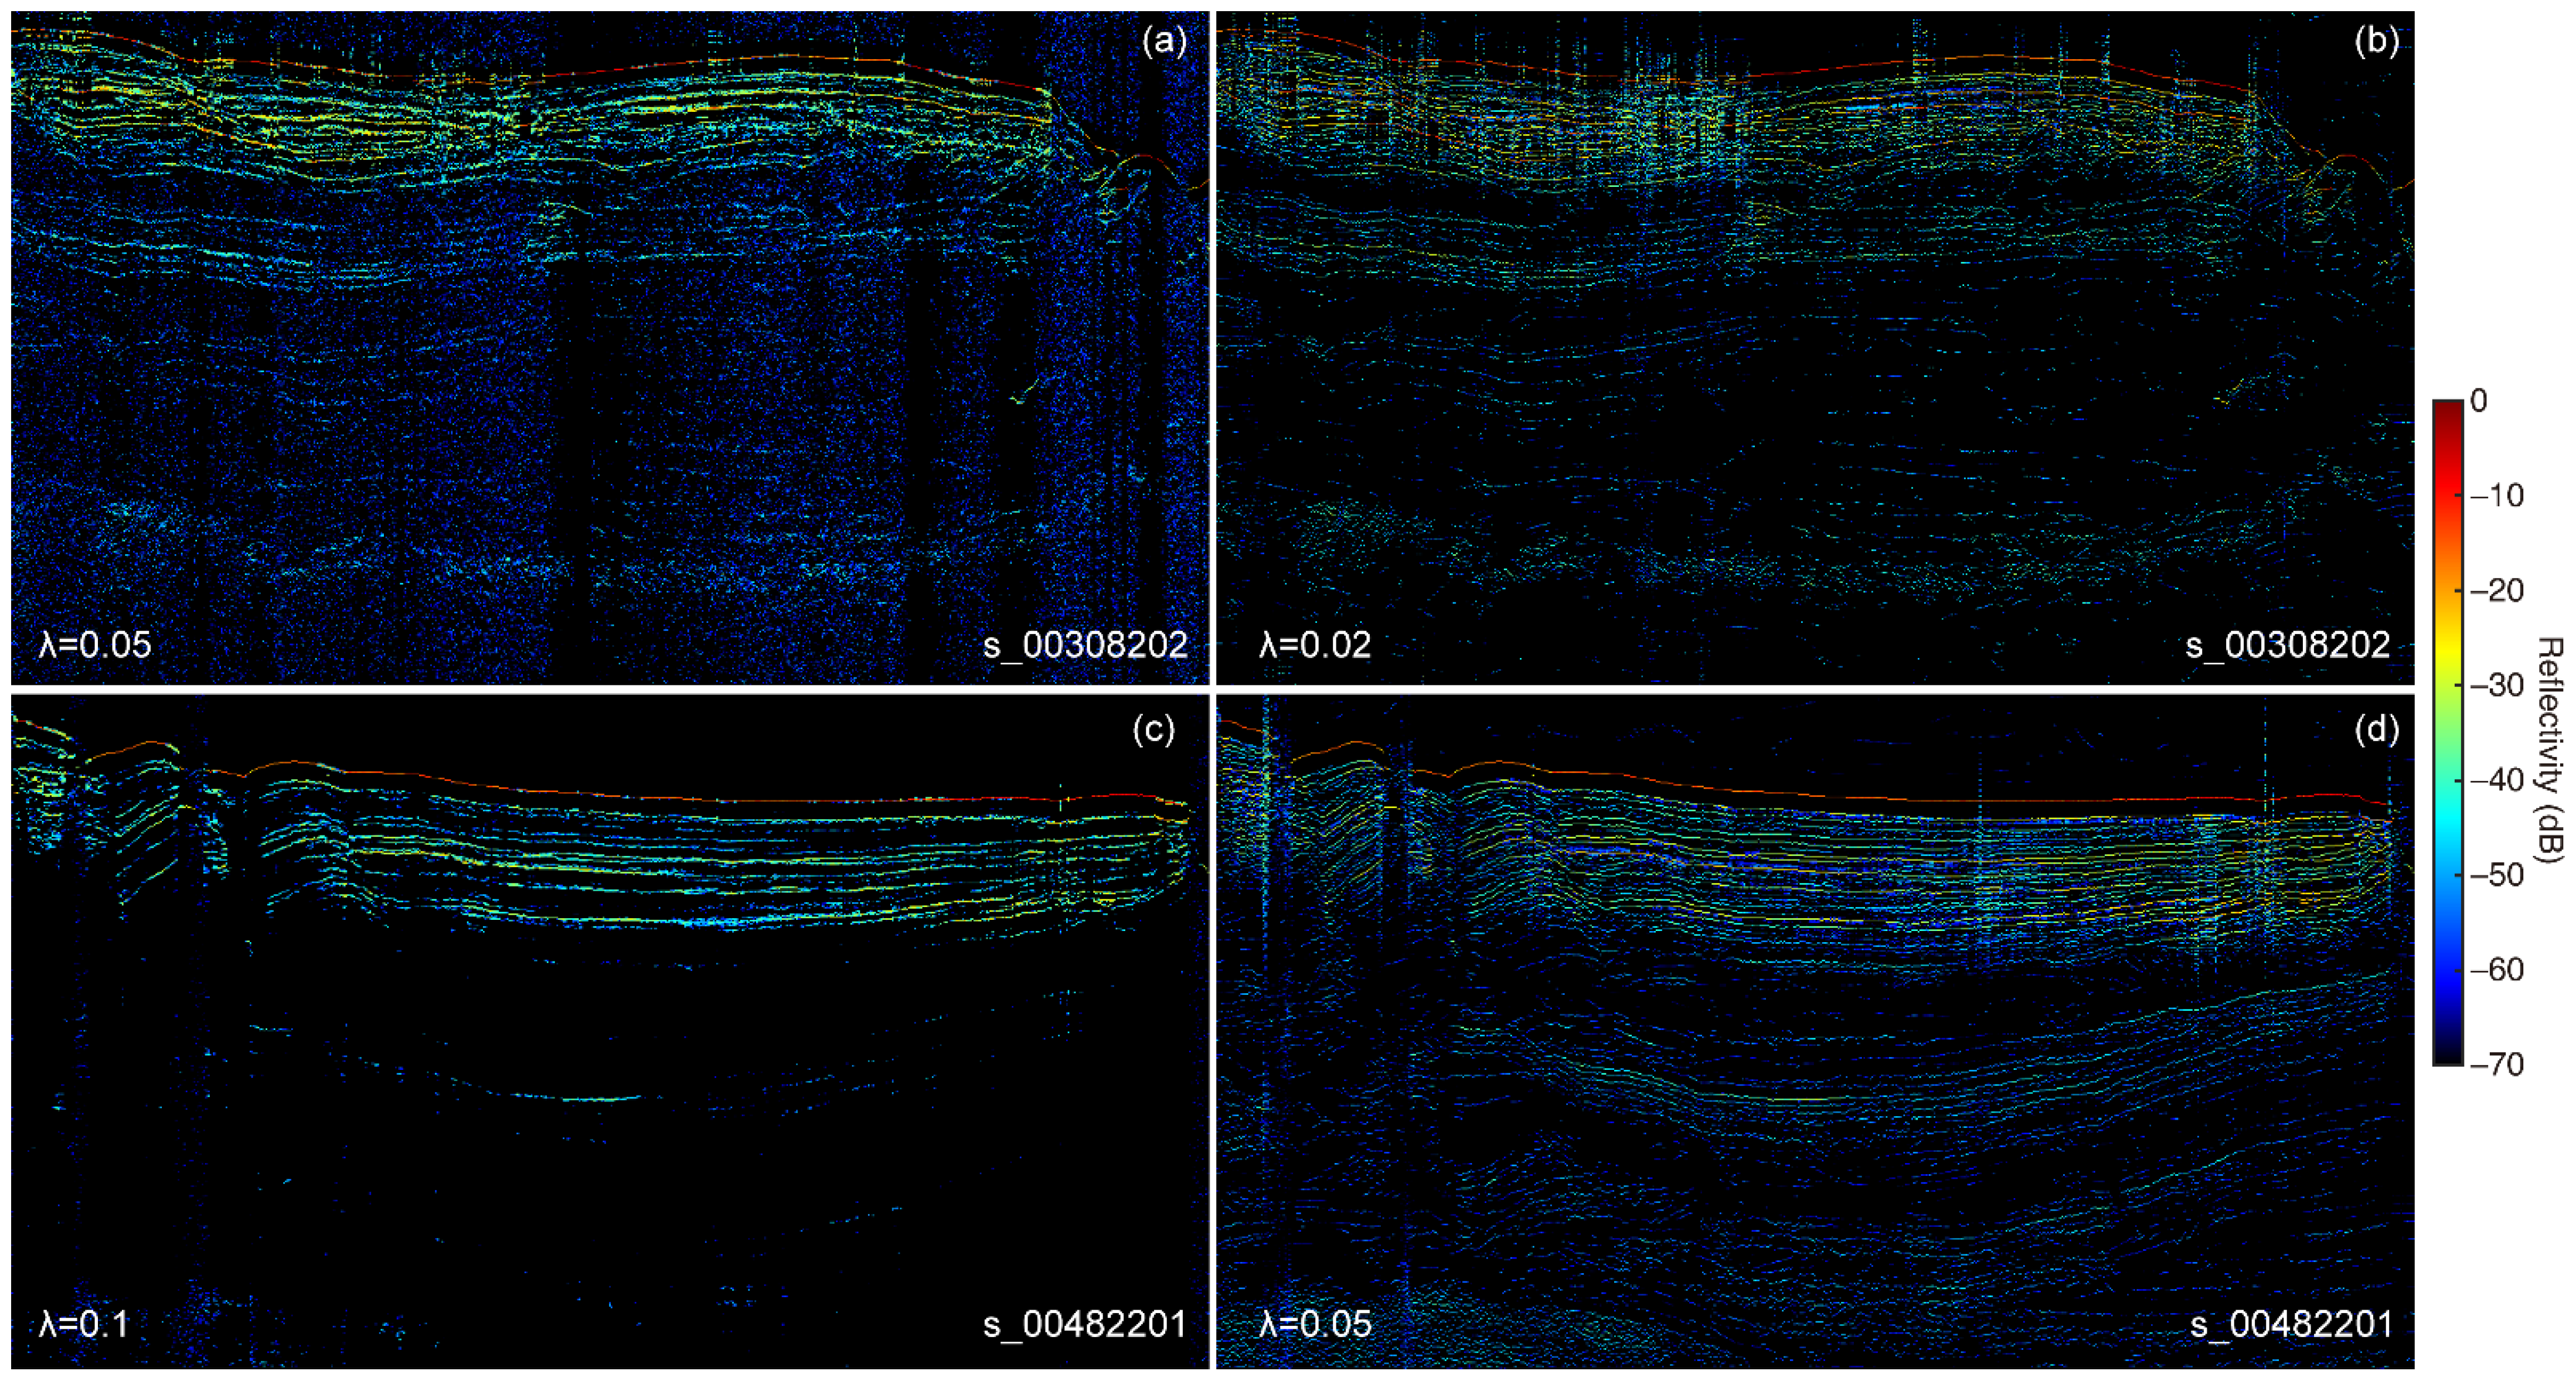
We performed two sets of deconvolutions (Figure 8) to compare the standard method with our proposed approach. The original, noisy radargrams were deconvolved using the λ parameter determined automatically by the L-curve method. The structure-enhanced radargrams were deconvolved using a λ value obtained by scaling the L-curve-derived value by the a priori ratios (0.4 and 0.5, respectively), as defined in Equation (7). The comparison reveals the clear superiority of the proposed method. The deconvolution results for the structure-enhanced radargrams exhibit markedly improved vertical resolution. Fine-scale layers, which were previously smeared or grouped as a single reflection, are now clearly resolved. Most importantly, the method reveals more detailed structural information within the deeper reflectors, which are often the weakest and most challenging to interpret. Figure 9 demonstrates that the deconvolved reflectivity from the structure-enhanced radargrams s_00308202 exhibits a markedly flatter distribution compared with the original data, whose histograms show a pronounced Gaussian-like shape driven by noise at ~−40 dB (Figure 9a). This contrast indicates that the structural enhancement step effectively suppresses noise-dominated fluctuations and broadens the reflectivity range, thereby improving the visibility of true reflectivity variations and enhancing the fidelity of subsequent deconvolution.
This real-data test confirms the findings from our numerical examples: (1) SED can effectively suppress noise and enhance coherent reflections, and (2) leveraging the reflector-extraction ratio as a prior for the regularization parameter allows the deconvolution to achieve a higher-resolution result without amplifying noise or losing crucial structural details.

4. Discussion

4.1. Mechanisms of Performance Improvement

The significant performance gains demonstrated in both synthetic and real-data applications stem from a powerful synergy between the two stages of the proposed workflow. The SED is not merely a generic “denoiser”; its underlying principles make it a particularly effective pre-conditioner for the specific mathematical problem of sparse deconvolution. The core of the SDD method is the solution of an l2l1 optimization problem, which seeks a sparse solution that fits the observed data. The quality of this solution is highly dependent on the fidelity of the input signal. When the signal is corrupted by significant noise, the l2-norm fidelity term forces the optimization to find a solution r that partially explains the noise, leading to two undesirable outcomes: the generation of spurious, weak reflectors (fitting the noise) and the suppression of true, weak reflectors that are penalized by the l1-norm sparsity term to compensate.
The SED directly addresses this issue. Its iterative, multi-scale process, guided by the PID algorithm, is exceptionally adept at separating the structured, coherent signal of the radar reflectors from the unstructured, random character of the noise. Unlike simple linear filters that might blur the sharp onsets of reflectors, or trace-averaging methods that fail on dipping structures, SED preserves the essential structural information of the radargram while effectively suppressing the noise. It produces results that are “numerically and visually excellent” and avoids the artifacts common in other state-of-the-art methods [21]. Additionally, its dual-domain nature—operating in both the spatial and frequency domains—combines the edge preservation of spatial filters with the detail preservation of transform-domain methods. Techniques like wavelet shrinkage [31,32], which are conceptually similar to PID’s frequency-domain step, are known to preserve the signal’s phase while attenuating noise amplitudes, a crucial property for maintaining the integrity of the wavelet shape.
By providing the SED-SDD algorithm with a high-SNR, artifact-free input, the nature of the optimization problem is fundamentally changed. The inversion is no longer a struggle to distinguish signal from noise; it is focused purely on finding the sparsest set of reflectors that can reconstruct the cleaned signal. This allows for a more confident and potentially more aggressive selection of the regularization parameter λ, leading to a sparser, cleaner, and more accurate final reflectivity profile. In essence, the workflow decouples the two difficult tasks of denoising and inversion, allowing each specialized algorithm to perform optimally on a well-defined problem.

4.2. Potential for Identifying Thinner Beds

The demonstrated ability to resolve closely spaced reflectors, particularly in the complex synthetic model, suggests that the proposed SED-SDD method can effectively enhance the vertical resolution beyond the nominal ~8.5 m limit of the SHARAD instrument. This capability is crucial for identifying finer-scale layering within the NPLD. Martian climate is driven by multiple orbital cycles with different periodicities. While thicker layer packets may correspond to the dominant obliquity cycle (~120,000 years), the ability to resolve thinner beds could potentially reveal the influence of higher-frequency cycles, such as precession (~51,000 years), which were previously unresolvable in the radar data. A more complete and higher-resolution stratigraphic column allows for a more detailed correlation between the geologic record and the calculated orbital solutions, a key goal of Martian paleoclimatology.
The reflectivity profile was illustrated as a proxy for the dust content of the ice layers [10,11]. By providing more accurate reflectivity amplitudes (as demonstrated by the lower MAPE on synthetic data) and, critically, by reliably detecting more of the weak reflectors from deep within the deposits, the SED-SDD method yields a more complete and higher-fidelity record of dust content versus depth. This improved dataset can in turn provide tighter constraints for models of ice and dust accumulation rates over time. Understanding how these rates have varied in the past is essential for building and validating general circulation models that simulate the Martian climate. The ability to confidently trace deeper reflectors extends the reliable timeline of the climate record further back into Martian history, providing a longer baseline for understanding planetary climate evolution.

4.3. Methodological Considerations, Limitations, and Future Research

We observed that in columns where the surface is steep and the reflector echo power is low, the deconvolution often yields non-sparse, spurious reflectivity (Figure 8). This behavior arises because steep dips violate the 1D convolutional assumption, as the recorded trace represents a mixture of signals from rapidly varying reflector geometries. Consequently, the single-wavelet, single-reflectivity-per-sample model provides only an approximation. Additionally, when reflector echo power is close to the noise floor, the inverse problem becomes ill-conditioned and regularized solvers (especially those tuned to promote sparsity) can overfit noise or create oscillatory solutions [29,30]. To reduce these artifacts, we could improve the local wavelet estimation, for instance, by extracting the wavelet directly from the local surface reflector [33]. This locally adaptive wavelet better represents the true system response under varying geometric and scattering conditions, compensating for phase distortions and amplitude loss that occur over steep surfaces. Consequently, the deconvolution becomes more stable and yields reflectivity sections that are spatially coherent and free of artificial, non-sparse patterns, as shown in Figure 10.
A critical consideration for any pre-processing workflow is the potential for the filtering step to introduce artifacts or distort the underlying signal in a way that compromises the subsequent inversion. Any filtering process carries a risk of altering the signal, and SED is no exception. However, the algorithm is specifically designed to mitigate these risks and maintain high signal fidelity. The process primarily amplifies all effective reflectors by roughly an order of magnitude, while maintaining their intrinsic reflectivity relationships. This characteristic makes the enhanced data particularly suitable for stable and accurate deconvolution. Second, SED is engineered to be asymptotically unbiased and to excel at preserving fine details that other methods might blur. Finally, the impact on deconvolution depends on what aspects of the signal are preserved. Deconvolution is highly sensitive to the gross characteristics of the wavelet (e.g., the shape and size of its main lobe) but is much less sensitive to the fine details, such as high-frequency noise that contaminates the sidelobes. A well-tuned structure enhancement process is designed precisely to remove this high-frequency, unstructured noise while preserving the sharp, coherent structure of the echo’s main lobe. Therefore, rather than distorting the wavelet in a harmful way, the structure enhancement process is more likely to present a cleaner, more stable version of the wavelet to the deconvolution algorithm, improving the fidelity of the inversion.
Beyond the question of signal fidelity, the current methodology does not explicitly account for the presence of multiple, which can be misinterpreted as true primary reflectors. While denoising may suppress some incoherent noise associated with complex multiple paths, a dedicated algorithm for predicting and removing multiples would be a valuable addition to the processing chain. Furthermore, the SED itself has user-defined parameters, most notably the annealing schedule, which must be carefully selected. While the method is robust, a systematic study to optimize these parameters for SHARAD data could yield further improvements.
The fundamental principle—sophisticated denoising prior to sparse inversion—is broadly applicable to other planetary radar sounder datasets. Instruments like MARSIS on Mars Express, which operate at lower frequencies and often have a relatively lower SNR, could benefit greatly from this approach. Similarly, future radar missions, such as the RIME instrument on JUICE, destined for the icy moons of Jupiter, will face similar challenges of probing deep into noisy environments [34], and this workflow could be essential for maximizing their scientific return.

4.4. Geological Implications for the NPLD

A notable characteristic of these deconvolved results is the high degree of consistency in the derived reflectivity along individual reflectors (Figure 8 and Figure 10). This suggests that the internal layers of the NPLD, at least within the surveyed region, are remarkably coherent and laterally homogeneous. This observation aligns with the prevailing “layer cake” model of the NPLD [35,36], where individual strata, representing changes in ice purity and dust content, are thought to be deposited uniformly over vast areas, preserving a continuous climate record.
This apparent homogeneity in the NPLD provides a stark contrast to radar-based findings from the south PLD. Previous studies of the SPLD have identified numerous “shadow zones”—regions where the radar signal is abruptly and severely attenuated [37]. These zones are widely interpreted as evidence of strong lateral heterogeneity, possibly arising from localized changes in composition, ice crystal structure, or density. The absence of prominent shadow zones and the presence of continuous, well-defined reflectivity even at depth (Figure 8 and Figure 10) indicate that the depositional and post-depositional evolution of the NPLD may be inherently more uniform than that of the southern polar layered deposits. This dichotomy strongly suggests different geological histories, likely stemming from a combination of depositional environment and post-depositional modification. The NPLD is composed almost entirely of water ice and dust [8,38]. The SPLD, however, is a more complex mixture of water ice, dust, and massive, buried deposits of CO2 ice [8,39]. The different rheological properties and, critically, the volatile nature of CO2 ice, likely contribute to a less uniform depositional and structural history in the south. The NPLD’s “layer-cake” stratigraphy suggests a much more stable history. While the NPLD is incised by the large Chasma Boreale, the layers themselves remain largely flat and parallel. This implies a depositional history dominated by accumulation, with less post-depositional structural modification. The absence of a massive, mobile CO2 ice component in the NPLD may be the key factor in preserving this remarkable lateral continuity. Therefore, the homogeneity of the NPLD reflectors likely reflects a more stable depositional environment dominated by H2O ice, whereas the SPLD’s “shadow zones” are a clear geophysical expression of a more complex geological history, likely driven by the dynamic interplay between H2O ice, dust, and massive, structurally disruptive CO2 ice deposits.

5. Conclusions

This study proposes a two-stage workflow for the high-resolution inversion of radar reflectivity from noisy planetary sounder data. The method synergistically combines structure-enhancement denoising as pre-processing for sparse deterministic deconvolution. By first applying the physically motivated, deterministic annealing-based SED to the 2D radargram, the random/spackle noise is effectively suppressed while preserving the structural integrity of geological features. This produces a high-fidelity input for the subsequent 1D SDD algorithm, which can then solve the sparse inversion problem with significantly greater accuracy and robustness. Rigorous tests on synthetic data confirmed that the SED-SDD workflow substantially outperforms the baseline SDD method, particularly under the low-SNR conditions characteristic of real data, leading to lower amplitude errors, better structural preservation, and a more reliable detection of weak reflectors. We demonstrated that a sophisticated, physically motivated denoising stage is not merely an optional refinement but a critical step for unlocking the full potential of deconvolution techniques on real-world planetary radar data. By enabling the recovery of a more complete and higher-fidelity stratigraphic record, the SED-SDD method provides a new tool to unravel the fine structure of Martian polar layered deposits.

Author Contributions

Conceptualization, P.F. and J.Z.; methodology, P.F. and J.Z.; software, P.F. and J.Z.; validation, P.F. and J.Z.; formal analysis, P.F. and J.Z.; investigation, P.F. and J.Z.; writing—original draft preparation, P.F.; writing—review and editing, J.Z.; visualization, P.F. and J.Z.; supervision, J.Z.; project administration, J.Z.; funding acquisition, J.Z. All authors have read and agreed to the published version of the manuscript.

Funding

This research was supported by National Key R&D Program of China (Grant 2022YFF0503203).

Data Availability Statement

SHARAD data used in this study are part of the Reduced Data Records (RDRs) produced by the US SHARAD Science Team and are available on the Planetary Data System (http://pds-geosciences.wustl.edu/missions/mro/SHARAD.htm) (accessed on 20 October 2025). PPMSim 1D forward simulation code is available at https://github.com/raypenper/PPMSim.git (accessed on 20 October 2025).

Acknowledgments

We thank the SHARAD team for the radargram products. We thank the Supercomputing Laboratory of Institute of Geology and Geophysics, Chinese Academy of Sciences (IGGCAS) for providing computing resources. The reviews by three anonymous reviewers greatly improved the manuscript.

Conflicts of Interest

The researcher claims no conflicts of interest.

References

  1. Becerra, P.; Byrne, S.; Sori, M.M.; Sutton, S.; Herkenhoff, K.E. Stratigraphy of the north polar layered deposits of Mars from high-resolution topography. J. Geophys. Res. Planets 2016, 121, 1445–1471. [Google Scholar] [CrossRef]
  2. Fishbaugh, K.E.; Hvidberg, C.S. Martian north polar layered deposits stratigraphy: Implications for accumulation rates and flow. J. Geophys. Res. Planets 2006, 111, E06012. [Google Scholar] [CrossRef]
  3. Milkovich, S.M.; Head, J.W. North polar cap of Mars: Polar layered deposit characterization and identification of a fundamental climate signal. J. Geophys. Res. Planets 2005, 110, E01005. [Google Scholar] [CrossRef]
  4. Phillips, R.J.; Zuber, M.T.; Smrekar, S.E.; Mellon, M.T.; Head, J.W.; Tanaka, K.L.; Putzig, N.E.; Milkovich, S.M.; Campbell, B.A.; Plaut, J.J.; et al. Mars north polar deposits: Stratigraphy, age, and geodynamical response. Science 2008, 320, 1182–1185. [Google Scholar] [CrossRef] [PubMed]
  5. Byrne, S. The polar deposits of Mars. Annu. Rev. Earth Planet. Sci. 2009, 37, 535–560. [Google Scholar] [CrossRef]
  6. Smith, I.B.; Hayne, P.O.; Byrne, S.; Becerra, P.; Kahre, M.; Calvin, W.; Hvidberg, C.; Milkovich, S.; Buhler, P.; Landis, M.; et al. The Holy Grail: A road map for unlocking the climate record stored within Mars’ polar layered deposits. Planet. Space Sci. 2020, 184, 104841. [Google Scholar] [CrossRef]
  7. Head, J.W.; Mustard, J.F.; Kreslavsky, M.A.; Milliken, R.E.; Marchant, D.R. Recent ice ages on Mars. Nature 2003, 426, 797–802. [Google Scholar] [CrossRef]
  8. Smith, I.B. A retrospective on Mars polar ice and climate. In Oxford Research Encyclopedia of Planetary Science; Oxford University Press: Oxford, UK, 2022. [Google Scholar]
  9. Plaut, J.J.; Picardi, G.; Safaeinili, A.; Ivanov, A.B.; Milkovich, S.M.; Cicchetti, A.; Kofman, W.; Mouginot, J.; Farrell, W.M.; Phillips, R.J.; et al. Subsurface radar sounding of the south polar layered deposits of Mars. Science 2007, 316, 92–95. [Google Scholar] [CrossRef] [PubMed]
  10. Lalich, D.E.; Holt, J.W. New Martian climate constraints from radar reflectivity within the north polar layered deposits. Geophys. Res. Lett. 2017, 44, 657–664. [Google Scholar] [CrossRef]
  11. Lalich, D.E.; Holt, J.W.; Smith, I.B. Radar reflectivity as a proxy for the dust content of individual layers in the Martian north polar layered deposits. J. Geophys. Res. Planets 2019, 124, 1690–1703. [Google Scholar] [CrossRef]
  12. Seu, R.; Phillips, R.J.; Biccari, D.; Orosei, R.; Masdea, A.; Picardi, G.; Safaeinili, A.; Campbell, B.A.; Plaut, J.J.; Marinangeli, L.; et al. SHARAD sounding radar on the Mars Reconnaissance Orbiter. J. Geophys. Res. Planets 2007, 112, E05S05. [Google Scholar] [CrossRef]
  13. Croci, R.; Seu, R.; Flamini, E.; Russo, E. The SHAllow RADar (SHARAD) onboard the NASA MRO mission. Proc. IEEE 2011, 99, 794–807. [Google Scholar] [CrossRef]
  14. Campbell, B.; Phillips, R. Mars Reconnaissance Orbiter Shallow Radar Radargram Data; MRO-M-SHARAD-5-RADARGRAM-V1.0; NASA Planetary Data System: Washington, DC, USA, 2014. [Google Scholar] [CrossRef]
  15. Campbell, B.A.; Watters, T.R.; Morgan, G.A. Dielectric properties of the Medusae Fossae Formation and implications for ice content. J. Geophys. Res. Planets 2021, 126, e2020JE006601. [Google Scholar] [CrossRef]
  16. Lauro, S.E.; Mattei, E.; Soldovieri, F.; Pettinelli, E.; Orosei, R.; Vannaroni, G. Dielectric constant estimation of the uppermost Basal Unit layer in the martian Boreales Scopuli region. Icarus 2012, 219, 458–467. [Google Scholar] [CrossRef]
  17. Fang, P.; Miao, Z.; Zhang, J. Sparse deterministic deconvolution of Mars SHARAD data. IEEE T Geosci. Remote 2024, 62, 5102313. [Google Scholar] [CrossRef]
  18. Campbell, B.A.; Morgan, G.A.; Bernardini, F.; Putzig, N.E.; Nunes, D.C.; Plaut, J.J. Calibration of Mars Reconnaissance Orbiter Shallow Radar (SHARAD) data for subsurface probing and surface reflectivity studies. Icarus 2021, 360, 114358. [Google Scholar] [CrossRef]
  19. Whitten, J.L.; Campbell, B.A. Lateral continuity of layering in the Mars South Polar Layered Deposits from SHARAD sounding data. J. Geophys. Res. Planets 2018, 123, 1541–1554. [Google Scholar] [CrossRef]
  20. Fang, P.; Zhang, J. Recursive enhancement of weak subsurface boundaries and its application to SHARAD data. Remote Sens. 2022, 14, 1525. [Google Scholar] [CrossRef]
  21. Knaus, C.; Zwicker, M. Progressive image denoising. IEEE Trans. Image Process 2014, 23, 3114–3125. [Google Scholar] [CrossRef]
  22. Fang, P.; Zhang, J. Phase-congruency reflector detection of orbital radar data via shearlet transform on Shannon-Gabor wavelet. IEEE Trans. Geosci. Remote Sens. 2024, 62, 5110413. [Google Scholar] [CrossRef]
  23. Xiong, S.; Muller, J.P. Automated reconstruction of subsurface interfaces in Promethei Lingula near the Martian south pole by using SHARAD data. Planet. Space Sci. 2019, 166, 59–69. [Google Scholar] [CrossRef]
  24. Liu, X.F.; Fa, W.Z. A fully automatic algorithm for reflector detection in radargrams based on continuous wavelet transform and minimum spanning tree. IEEE Trans. Geosci. Remote Sens. 2022, 60, 4601620. [Google Scholar] [CrossRef]
  25. Ferro, A.; Bruzzone, L. Automatic extraction and analysis of ice layering in radar sounder data. IEEE Trans. Geosci. Remote Sens. 2013, 51, 1622–1634. [Google Scholar] [CrossRef]
  26. Wang, L.; Zhao, Q.; Gao, J.; Xu, Z.; Fehler, M.; Jiang, X. Seismic sparse-spike deconvolution via Toeplitz-sparse matrix factorization. Geophysics 2016, 81, V169–V182. [Google Scholar] [CrossRef]
  27. Turner, G. Subsurface radar propagation deconvolution. Geophysics 1994, 59, 215–223. [Google Scholar] [CrossRef]
  28. Schmelzbach, C.; Huber, E. Efficient deconvolution of ground-penetrating radar data. IEEE Trans. Geosci. Remote Sens. 2015, 53, 5209–5217. [Google Scholar] [CrossRef]
  29. Boyd, S.; Boyd, S.P.; Vandenberghe, L. Convex Optimization; Cambridge University Press: Cambridge, UK, 2004. [Google Scholar]
  30. Boyd, S.; Parikh, N.; Chu, E.; Peleato, B.; Eckstein, J.J.F. Distributed optimization and statistical learning via the alternating direction method of multipliers. Found. Trends Mach. Learn. 2011, 3, 1–122. [Google Scholar] [CrossRef]
  31. Fodor, I.K. Denoising through wavelet shrinkage: An empirical study. J. Electron. Imaging 2003, 12, 151–160. [Google Scholar] [CrossRef]
  32. Chen, G.; Qian, S.-E. Denoising of hyperspectral imagery using principal component analysis and wavelet shrinkage. IEEE Trans. Geosci. Remote Sens. 2011, 49, 973–980. [Google Scholar] [CrossRef]
  33. Fang, P.; Zhang, J. Unveiling subtle structures of Martian north polar layered deposits by efficient deconvolution of SHARAD sounder data. In Proceedings of the 55th Lunar and Planetary Science Conference, The Woodlands, TX, USA, 11–15 March 2024; Volume 3040, p. 1125. [Google Scholar]
  34. Bruzzone, L.; Plaut, J.J.; Alberti, G.; Blankenship, D.D.; Bovolo, F.; Campbell, B.A.; Ferro, A.; Gim, Y.; Kofman, W.; Komatsu, G. RIME: Radar for icy moon exploration. In Proceedings of the 2013 IEEE International Geoscience and Remote Sensing Symposium-IGARSS, Melbourne, Australia, 21–26 July 2013; pp. 3907–3910. [Google Scholar]
  35. Kolb, E. Geologic history of the polar regions of Mars based on Mars Global Surveyor data II. Amazonian Period. Icarus 2001, 154, 22–39. [Google Scholar] [CrossRef]
  36. Milkovich, S.M.; Plaut, J.J. Martian south polar layered deposit stratigraphy and implications for accumulation history. J. Geophys. Res. Planets 2008, 113, E6. [Google Scholar] [CrossRef]
  37. Fang, P.; Zhang, J. New insights into composition variation of Mars south polar layered deposits from SHARAD radar sounder. J. Geophys. Res. 2023, 128, e2023JE007812. [Google Scholar] [CrossRef]
  38. Grima, C.; Kofman, W.; Mouginot, J.; Phillips, R.J.; Herique, A.; Biccari, D.; Seu, R.; Cutigni, M. North polar deposits of Mars: Extreme purity of the water ice. Geophys. Res. Lett. 2009, 36, L03203. [Google Scholar] [CrossRef]
  39. Phillips, R.J.; Davis, B.J.; Tanaka, K.L.; Byrne, S.; Mellon, M.T.; Putzig, N.E.; Haberle, R.M.; Kahre, M.A.; Campbell, B.A.; Carter, L.M.; et al. Massive CO2 ice deposits sequestered in the south polar layered deposits of Mars. Science 2011, 332, 838–841. [Google Scholar] [CrossRef] [PubMed]
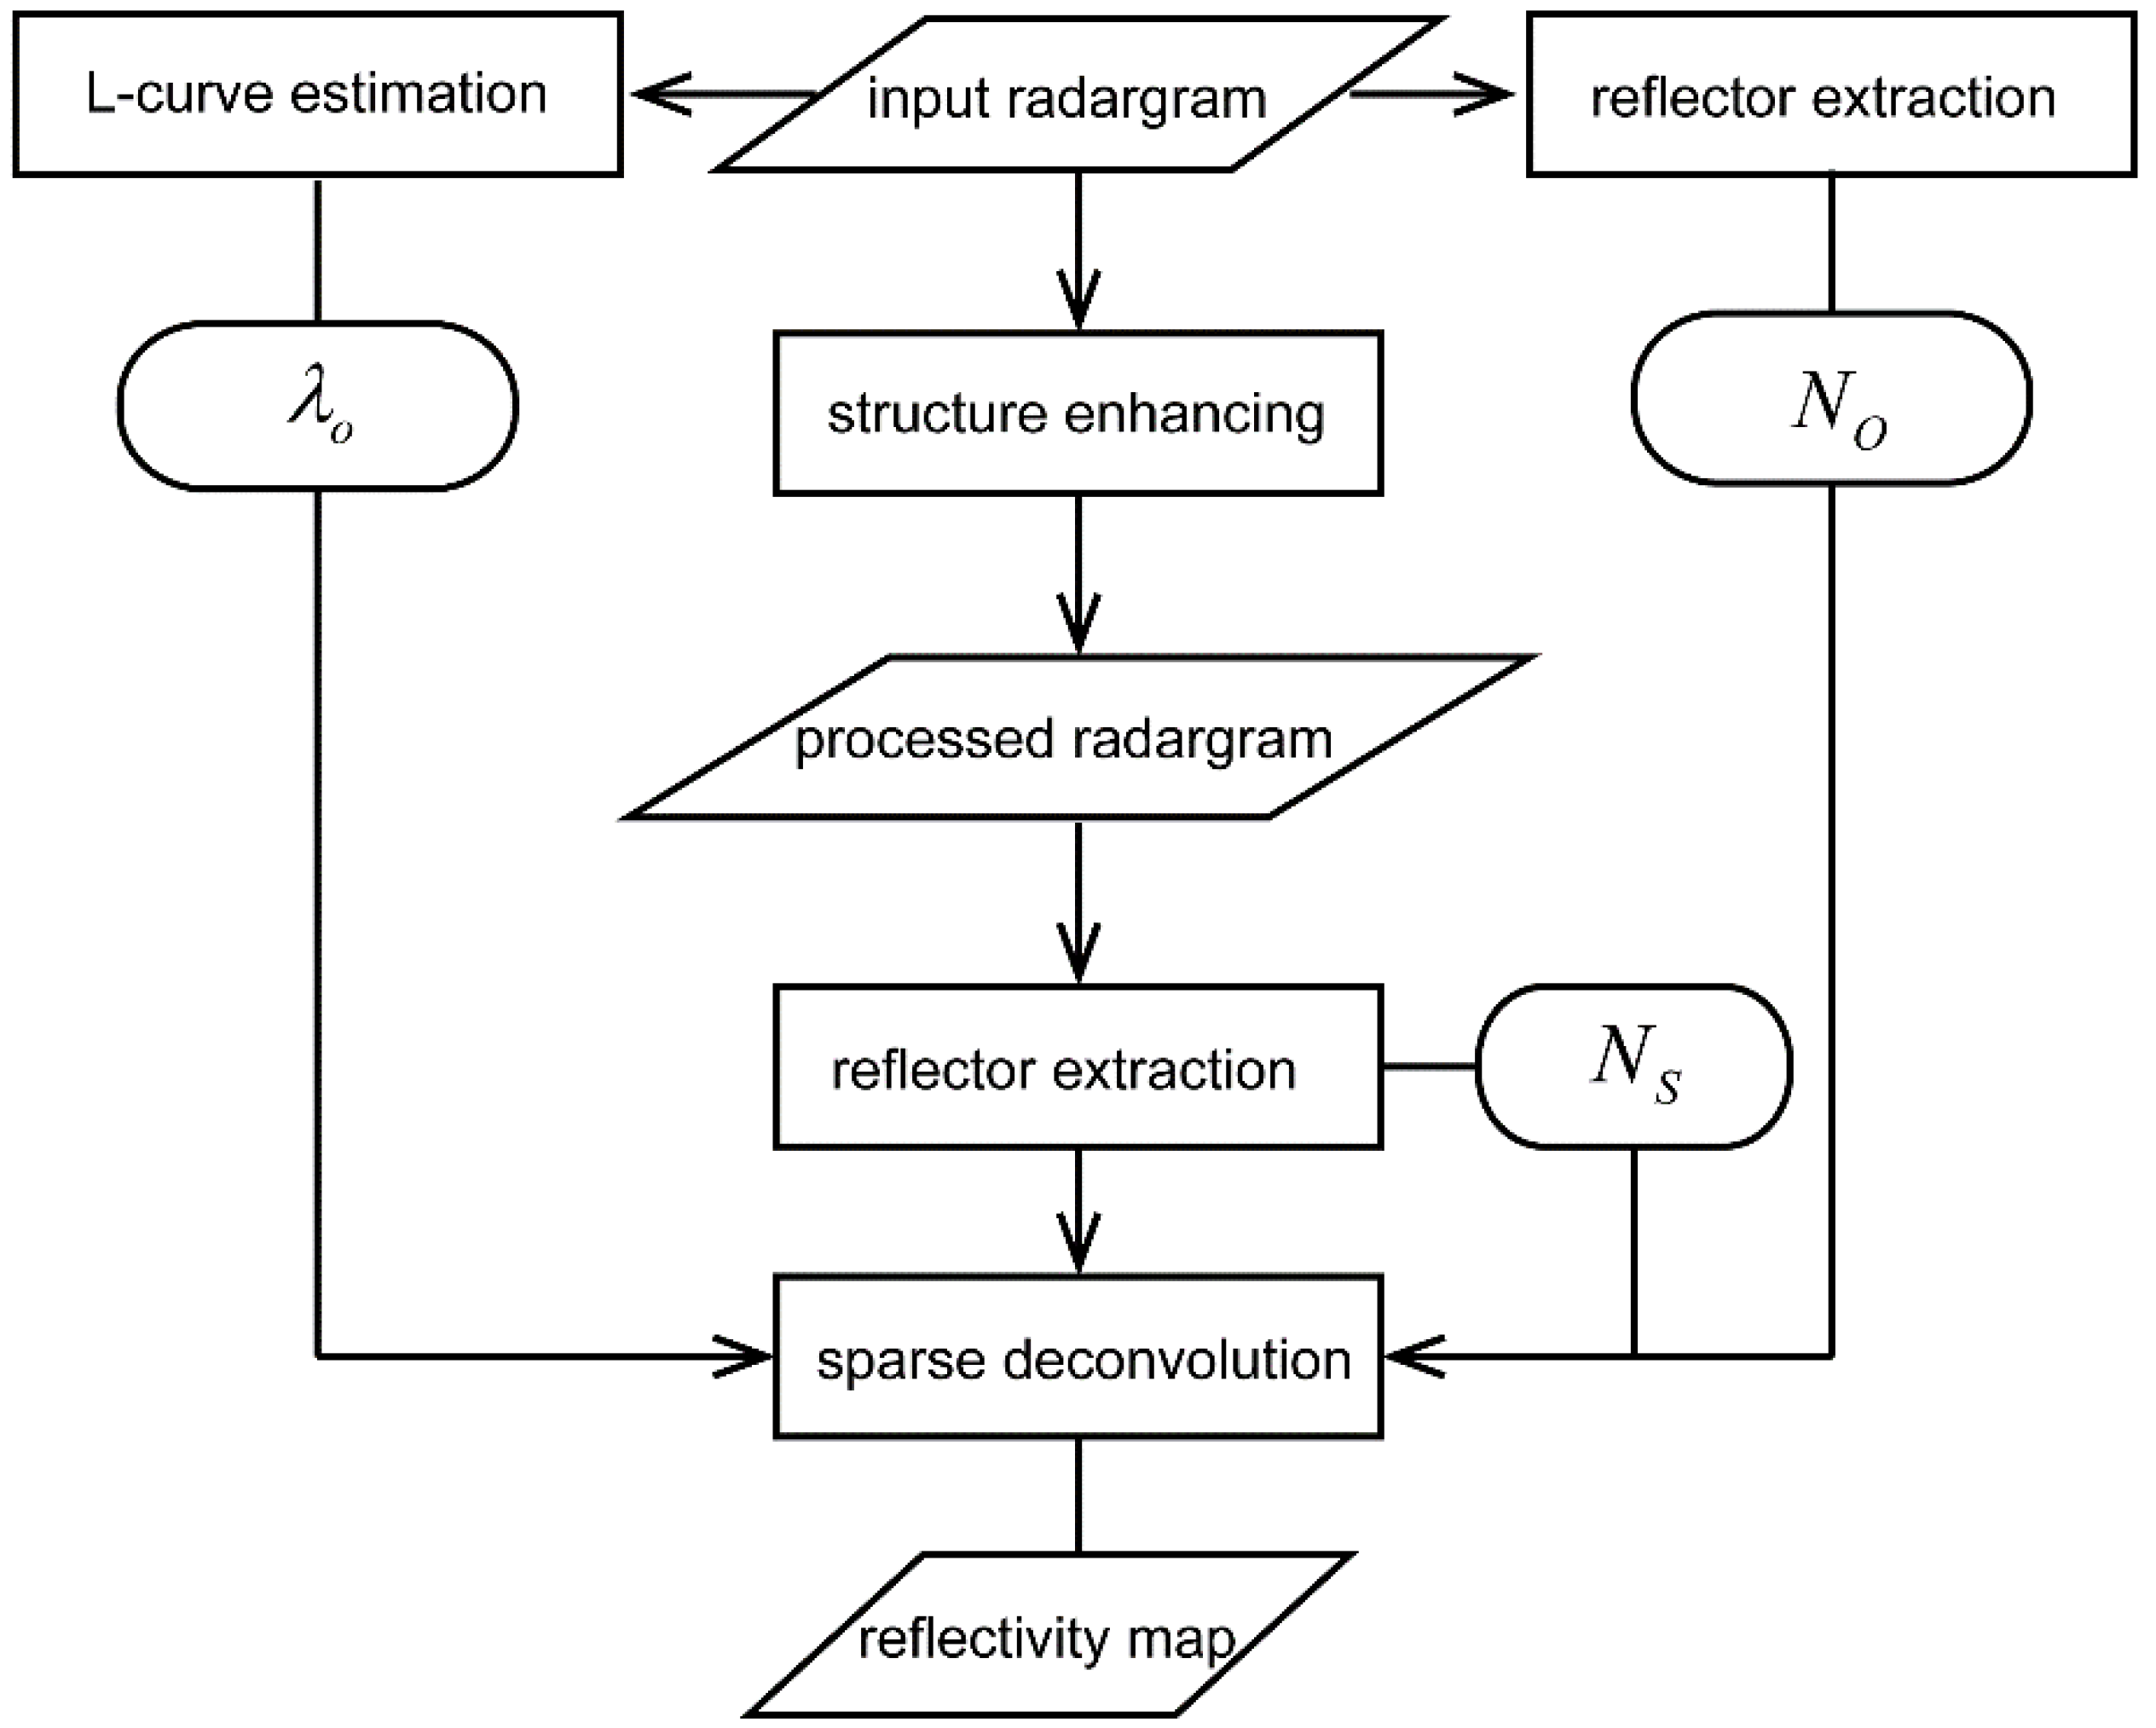
Figure 1. The proposed SED-SDD work flow. Mathematical symbols have the same meaning as those in Equation (7).
Remotesensing 17 03783 g001
Figure 2. Example of deconvolution using a synthetic trace with low noise level (−30 dB). (a) Klauder wavelet. (b) True reflectivity series. (c) Deconvolved reflectivity series with λ = 0.1 determined from the L-curve. The deconvoluted reflectivities are generally accurate in true locations, while for a single reflectivity, the deconvoluted results tend to be many small reflectivities. (d) Comparison of the original reflection waveform and the reconstructed waveform obtained by convolving the wavelet with the deconvolved reflectivities.
Remotesensing 17 03783 g002
Figure 3. (a1a3) Synthetic radargrams with low, moderate, and high noise levels (b1b3) Structure-enhanced radargrams for those in (a1a3). (c1c3) Extracted reflectors (shown in red) of synthetic radargrams shown in (a1a3). (d1d3) Extracted reflectors (shown in red) of structure-enhanced radargrams shown in (b1b3). With the increasing noise level, the number of extracted reflectors decreases; therefore, a higher λ value is needed to mitigate artifacts in the deconvolution results. Note the high SNR and more extracted reflectors for structure-enhanced radargrams. The ratio of the number of extracted reflectors in the original noisy radargrams to that in the structure-enhanced radargrams is approximately 0.8 for all noise level cases.
Remotesensing 17 03783 g003
Figure 4. Comparison of deconvolution results under different λ parameters using synthetic radargram with different noise levels. (a1a3) Synthetic radargram with low noise level (−30 dB) and the corresponding deconvolved reflectivities obtained using λ value with a given small value and the one obtained from L-curve method. (b1b3) Results for moderate noise level (−20 dB). (c1c3) Results for high noise level (−10 dB). The deconvolution results using a small λ value exhibit artifacts (indicated by downward arrows in (a2,b2)), whereas those obtained using the L-curve method are free of such artifacts but are affected by increasing noise level. In the low-level noise condition, the enhanced resolution of reflectors is obvious as indicated by upward errors (a3). The impact of noise on deconvolution performance increases with noise level.
Remotesensing 17 03783 g004
Figure 5. Comparison of deconvolution results under different λ parameters using structure-enhanced radargrams. (a1a3) Enhanced radargram with a low noise level (−30 dB) and the corresponding deconvolved reflectivities obtained using the given small λ value and the λ value derived from the L-curve method (see Figure 4(a3,b3,c3)), scaled by 0.8 as defined in Equation (7). (b1b3) Results for moderate noise level (−20 dB). (c1c3) Results for high noise level (−10 dB). Compared with the undenoised results (see Figure 4), the deconvolution results obtained using the L-curve method tend to lose structural details as noise increases. In contrast, the deconvolution results using the λ parameter derived from the prior information exhibit improved performance, preserving more structural details even under high noise conditions (c3). c is the structure enhancement parameter and σ2 is the noise variance.
Remotesensing 17 03783 g005
Figure 6. SHARAD ground track across the NPLD and the corresponding radargrams. (a) The topography of NPLD with two tracks across the main part of the NPLD and portion of Gemina Lingula. (b,c) The two SHARAD radargrams with ground tracks denoted in (a). White boxes outline the deconvolution data range in Figure 7 associated with the relatively smooth surface. Arrows denote the south direction.
Remotesensing 17 03783 g006
Figure 7. Portion of the two SHARAD radargrams (a,b) shown in Figure 6 and their structure-enhanced radargrams (c,d). The structurally enhanced SHARAD radargram has obviously enhanced SNR, especially for deeper weak reflectors. (eh) show the extracted reflectors of both original and structure-enhanced radargrams. The ratio of the number of extracted reflectors in the original radargrams to that in the structure-enhanced radargrams is approximately 0.4 and 0.5 for s_00308202 and s_00482201.
Remotesensing 17 03783 g007
Figure 8. Deconvolution results of the original (a,c) and structure-enhanced (b,d) radargrams shown in Figure 7. The λ values used for the original radargrams are determined using the L-curve method, while those for the structure-enhanced radargrams are obtained by scaling the L-curve-derived values by 0.4 and 0.5, respectively, as defined in Equation (7). The deconvolution results of the structure-enhanced radargrams exhibit markedly improved resolution and reveal more detailed information about the deeper reflectors. White arrows denote the artifacts of unstable solution of deconvolution caused by steep slope surface with low reflector echo power.
Remotesensing 17 03783 g008
Figure 9. Histograms of the deconvolved reflectivity for the original (a,b) and structure-enhanced (c,d) radargrams shown in Figure 8. The structure-enhanced results (c) exhibit a noticeably flatter distribution, whereas the original radargrams (a) display a more Gaussian-like distribution dominated by noise at approximately −40 dB.
Remotesensing 17 03783 g009
Figure 10. Deconvolution results of the original (a,c) and structure-enhanced (b,d) radargrams using surface reflections as wavelet [33]. Note the absence of artifacts caused by steep surface slopes, which are evident in Figure 8.
Remotesensing 17 03783 g010
Disclaimer/Publisher’s Note: The statements, opinions and data contained in all publications are solely those of the individual author(s) and contributor(s) and not of MDPI and/or the editor(s). MDPI and/or the editor(s) disclaim responsibility for any injury to people or property resulting from any ideas, methods, instructions or products referred to in the content.