Highlights
What are the main findings?
- By 2025, the treeline had retreated 385 m downslope and 186 m in elevation by a severe double-pest infestation, with extreme weather conditions further exacerbating the retreat.
- UAV imagery was employed to monitor the increase of young trees from 60 in 2019 to 119 in 2025.
What is the implication of the main finding?
- Long-term UAV-based monitoring provides reliable high resolution quantitative data on die-back and regeneration dynamics in mountainous areas with limited access.
- These insights support forest recovery assessment and inform long-term management strategies after bark beetle outbreaks.
Abstract
Understanding how forests recover after severe disturbances is essential for developing effective management strategies that promote stable forest regeneration. Disturbances are particularly significant in transition zones such as treelines, which are highly sensitive to climate change. In the subalpine treeline ecotone of Zao Mountains (northeastern Japan), a severe double-pest infestation devastated the Abies mariesii forest, triggering a treeline retreat of nearly 400 m. Prior to the infestation, the stand density was estimated at 3135 (based on the sum of standing living and dead standing trees and fallen trees detected in the orthomosaics generated for the year 2019). Of these, 3023 were standing trees (of which 2787 were dead). By 2025, the number of standing trees had declined to 2472 (18.2% reduction), a significant development for Abies seedlings, which appeared to establish in decaying fallen logs. In order to evaluate whether this disturbance has permanent or temporary effects, high-resolution unmanned aerial vehicle (UAV) imagery was collected annually over the study area, resulting in six orthomosaics from 2019 to 2025 (2020 data unavailable) for continuous and precise forest monitoring. Analysis of the monitored area revealed that in the 6.9 ha study site, entirely covered by 1.2–1.3 m tall sasa vegetation (Sasa kurilensis), the number of new young trees increased from 60 (2019) to 119 in 2025. These younger trees were mainly located near surviving mature trees. Sasa vegetation did not exert a negative effect on regeneration but instead appeared to function as a strong wind protection, facilitating Abies seedling growth. In conclusion, fallen logs and sasa vegetation appeared to have a positive effect on fir regeneration as suggested by the increasing number of young trees observed over time. The bark beetle outbreak functioned as a forest stand-replacing disturbance, where the subalpine fir forest at the treeline is expected to regenerate naturally within the coming decades.
1. Introduction
Accurate simulations of forest regeneration in combination with die-back effects under climate change remain elusive, as they are strongly related to regeneration, mortality rates, and future climate scenarios [1,2,3]. Tree regeneration models often rely on strong assumptions and, thus, realistic representations of forest regeneration need to be correlated with high-resolution temporal data. Field-based data collection faces several limitations. In particular, in subalpine areas of Japan, obtaining a comprehensive view of the entire study area is challenging due to rugged terrain and dense understory vegetation, which obstructs observation and data acquisition [4,5]. Moreover, when applied to larger study areas, field surveys are time- and labor-consuming. While satellite imagery can cover larger areas, its spatial resolution is insufficient to detect individual trees, with seedlings and young trees being particularly difficult to detect, thereby limiting its applicability for fine-scale regeneration studies [6,7]. Increasing the ecological data is required to understand forest dynamics and to improve the accuracy of forest regeneration models that can contribute to better forest management practices [8]. However, studies that utilize remote sensing techniques to investigate and quantify forest regeneration and die-back remain limited [9]. Landsat 8 and Sentinel-2 can cover long temporal spans when assessing post-disturbance forest dynamics; however, the relatively coarse spatial resolution of these images often overlooks fine-scale regeneration [10,11]. Even high-resolution satellite products remain insufficient to resolve the level of detail attainable with unmanned aerial vehicle imagery (UAV) [12].
In recent years, the use of UAV imagery in forest research has increased substantially, becoming an important tool for collecting high-resolution spatial and temporal data [13,14,15]. In the context of bark beetle-affected forests, UAV applications have primarily focused on detecting ongoing infestations using multispectral imagery, either to map affected forest areas [16,17] or to assess the damage status of individual trees [18]. However, studies that specifically evaluate forest die-back and regeneration following large-scale bark beetle disturbances using UAV technology remain relatively scarce. While UAV-based analyses provide high precision at the individual-tree scale, they have predominantly focused on short-term observations, limiting their ability to capture long-term temporal dynamics in forest recovery [19,20,21,22,23,24,25]. In addition, LiDAR data, which offer even greater precision but at considerably higher cost, have been predominantly applied to studies of forest recovery in post-logging sites or areas affected by wildfire [26,27,28,29].
In this study, high-resolution UAV imagery was collected annually over seven years to assess die-back and regeneration of Abies mariesii forests affected by a bark beetle outbreak in the treeline ecotone, which began in 2013 and had reached 92% mortality by 2016 [30]. The combination of high spatial precision with continuous temporal monitoring enables detailed analysis of post-disturbance forest recovery patterns across both space and time, highlighting the unique contribution of long-term UAV-based observations. To understand the state of forest recovery, it is essential not only to assess the number and condition of young trees, but also to recognize the important role that dead trees play in the regeneration process [31,32,33]. Thus, assessing die-back is a crucial component in understanding forest recovery dynamics, since the stand development begins with a disturbance that provides conditions for the establishment of a new dominant tree cohort [34]. Fir forests in the Zao Mountains are natural ecosystems that are regenerated by natural disturbances. The tree age of the forests affected ranged between 43 to 103 years old, with an average age of 72 years old [30]. Therefore, it is possible to assume that the preceding stand of several decades ago could have also been replaced as a result of a severe disturbance, which was probably related to bark beetle outbreaks, if not a double pest infestation as the one that occurred in the years 2013–2016 [35,36].
The area with the highest rate of mortality was observed in the treeline of Zao Mountains, where none of the soil organic matter was removed and dead remnants (standing dead trees) and logs were scattered around. Treelines worldwide are generally expected to shift upward as climate warming creates more favorable conditions for tree growth at higher elevations, depending on their structure and taxonomic composition [37,38]. A global meta-analysis of treeline dynamics over the past century found that 52% of treelines studied advanced upward, 47% remained stable, and only 1% exhibited signs of recession [39]. In the rare cases of recession, natural disturbances such as fire, windthrow, and earthquakes were identified as primary drivers, while the reduction of anthropogenic activities—such as grazing, agriculture, and prescribed burning—were some of the drivers promoting treeline expansion [40]. These global patterns provide a useful context for the Zao Mountains, where the treeline has been heavily affected by bark beetle-induced die-back mortality. Examining how regeneration occurs at fine spatial and temporal scales in this area is essential to understand the local dynamics of forest recovery.
In this region of Japan, fir trees are not only of ecological value but they are also a tourist attraction of great economic value in winter, since fir trees become fully covered by ice and shaped by strong western winds creating living structures called ‘Snow Monsters’ [41]. Thus, there is an urgency in supporting regeneration by the local government. Previous studies have generally suggested that dwarf bamboo (Sasa kurilensis) negatively affects seedling establishment due to competition for light and soil nutrients [42,43,44]. However, in the Zao Mountains, seedlings planted after complete removal of sasa showed stunted growth, whereas naturally regenerated seedlings were able to grow through the existing sasa cover.
Therefore, the objectives of this study are (1) to assess the long-term impact of the 2013 bark beetle outbreak on tree mortality and die-back between 2019 and 2025 in Zao Mountains, and (2) to analyze the spatial and temporal patterns of young fir tree regeneration based on UAV-derived imagery and field validation.
Based on these objectives, this study addressed the following research question: What is the current recovery status of the fir forest severely affected by bark beetle outbreak, and if it will eventually regenerate into a fir-dominated forest again? We hypothesize that the forest is undergoing a slow but steady natural recovery and will ultimately reestablish as a fir forest.
2. Materials and Methods
2.1. Study Area
Zao mountains are located in the central area of Tohoku region, on the border between Yamagata and Miyagi Prefectures, northeastern Japan (38.14°N, 140.44°E; Figure 1); the maximum altitude reached is 1841 m. They form a complex group of exposed volcanic mountains [41]. Zao Mountains are known for the ice-covered fir trees in winter, known as Snow Monsters [45]. This unique scenery has made Mt. Zao an attractive winter destination, and according to figures from the Miyagi Prefectural Government, in 2023, Mt. Zao had 3.73 million visitors, accounting for 5.5% of all visitors to Miyagi Prefecture [46]. The average annual temperature in Zao area is +3 °C, and the average annual wind speed is around [47]. July to September are the hottest months, and January, February, and December are the coldest months (Japan Meteorological Agency) [48]. Besides the dominant fir trees, other shrubs observed included Pinus pumila, Acer tschonoskii, Taxus cuspidata, Alnus maximowiczii, Sorbus commixta, llex crenata, Cerasus nipponica [20]. Although these shrubs were also observed in the study area, their coverage is relatively small, and the dominant ground cover remains sasa vegetation. In 2013, an outbreak of Epitonia picea followed by a severe infestation of bark beetles (Polygraphus proximus) occurred in these mountains, that by 2016 had caused severe tree mortality in the treeline [30,49]. Based on data collected in this study, the treeline experienced a retreat of approximately 400 m following the large-scale infestation. The study site covers an area of 6.9 hectares and extends in an elevation range of 1479–1697 m and has a total of 3023 fir trees, of which 2787 were dead (mortality rate, 90%) by 2019.
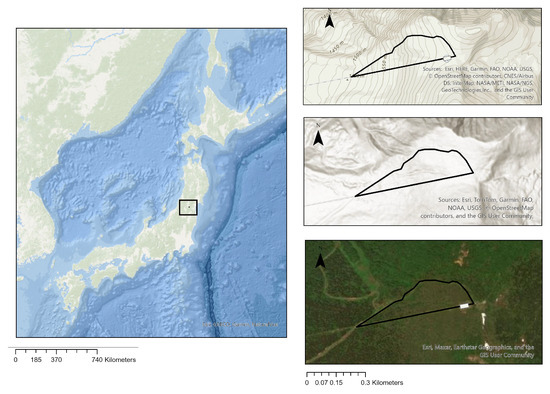
Figure 1.
Location of the study area.
2.2. UAV Image Collection and Pre-Processing
UAV imagery was acquired between August 2019 and July 2025 using three different platforms (all manufactured by SZ DJI Technology Co., Ltd., Shenzhen, China): DJI Mavic 2 Pro (2019–2022), DJI Phantom 4 RTK (2022–2024), and DJI Mavic 3 Multispectral (2024–2025). The DJI Mavic 2 Pro, equipped with a Hasselblad L1D-20c camera (Hasselblad, Gothenburg, Sweden), carries a 1-inch CMOS sensor with 20 megapixels, 10 mm focal length equivalent, and 77° field of view. The DJI Phantom 4 is equipped with a 1/2.3-inch CMOS sensor (12.4 MP, 24 mm focal length equivalent). The DJI Mavic 3 Multispectral (Mavic 3 MS) includes a 4/3-inch CMOS RGB camera (20 MP, 24 mm equivalent focal length, mechanical shutter) and four 1/2.8-inch CMOS multispectral sensors (5 MP each) capturing Green (560 ± 16 nm), Red (650 ± 16 nm), Red Edge (730 ± 16 nm), and NIR (860 ± 26 nm) bands. The Mavic 2 Pro, lacking RTK positioning, provided imagery with lower georeferencing accuracy, whereas the Phantom 4 RTK and Mavic 3 MS, both equipped with RTK, achieved higher positional precision. No ground control points (GCPs) were used during data collection. Flights were conducted at a height of 90 m with 85% front and side overlap. Image acquisition was carried out under stable weather conditions with shutter-priority settings (ISO-100 shutter speeds typically 1/120–1/1000 s) to minimize motion blur. Although the Mavic 3 MS also provided multispectral imagery, only RGB imagery was analyzed in this study, as it offered sufficient resolution for individual-tree annotation.
All imagery was processed in Agisoft Metashape Professional (v1.7.4; Agisoft LLC, Saint Petersburg, Russia) to generate orthomosaics. A total of 12 orthomosaics were produced in TIFF format, with a ground sampling distance ranging from 0.014 m to 0.021 m, using the Tokyo UTM Zone 54N coordinate system. Orthomosaics were obtained for 2019 (1: June), 2022 (4: May, August, October), 2023 (3: June, August, October), 2024 (1: July), and 2025 (1: June), primarily covering the summer to autumn seasons. For each flight, about 870 images were obtained. For consistency in temporal analysis, only the clearest orthomosaic from each year was selected for annotation and further analysis. In total, 6 orthomosaics (27 June 2019, 10 October 2021, 12 October 2022, 12 October 2023, 5 July 2024, 28 June 2025) were used; due to technical issues, images of 2020 were not obtained (Figure 2).
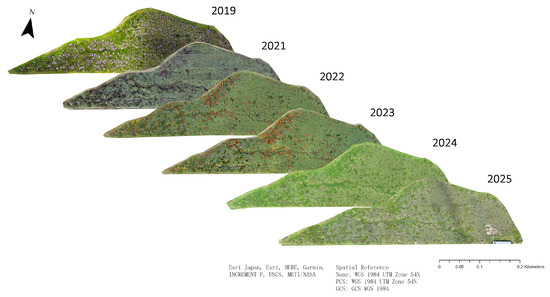
Figure 2.
Consecutive orthomosaics of the study area covering the study period 2019 to 2025 (except for the year 2020).
2.3. Young Tree Definition
In a study conducted in Zao Mountains, Abies mariesii trees were classified according to their height as follows: seedlings (<30 cm), saplings (30–130 cm), and young trees (>130 cm) [30]. In the present study area, the height of the dominant shrub layer is approximately 1.2–1.3 m. Therefore, Abies mariesii individuals visible in the UAV imagery are those that have overcome the height of the sasa layer, corresponding to young trees taller than 130 cm. Therefore, all subjects in this study are classified as young trees. In this area, the average height of surviving mature trees is approximately 7 m. According to studies of the same species (Abies mariesii) in other regions of Japan at similar elevations, cone and seed production typically begins when tree height exceeds 3 m [50]. Additionally, given that the average height of the ground vegetation is about 1.3 m, trees in this area were classified as young trees when their height was between 1.3 and 3.0 m.
2.4. Annotations
Annotations in this study were divided into four groups: standing living trees (healthy and damaged), standing dead trees, fallen dead trees, and young trees. In the orthomosaics, the living trees (healthy and damaged) were identified by their green pixels and partially green/white pixels, respectively. The higher the level of damage, the greater the area of white pixels within the canopy. Standing dead trees are identified by their fully white, exposed branches, whereas fallen trees were identified as logs (Figure 3). The polygon function in ArcGIS Pro 3.4.2 was used to draw polygons around the canopies of all trees.
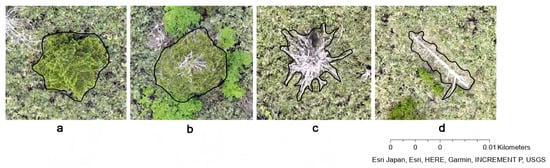
Figure 3.
Representative UAV images of Abies mariesii under three different health conditions and fallen. (a) Healthy. (b) Damaged. (c) Dead. (d) Fallen.
The annotation process was conducted systematically in ArcGIS Pro 3.4.2 to track tree mortality and regeneration over time. First, for the 2019 orthomosaic, all trees were annotated, including standing dead trees, fallen dead trees, and their respective states, and a unique ID was assigned to each tree. Young trees were then annotated by manually delineating polygons around the canopies of all surviving trees, assigning also each a unique ID, recording their condition (healthy or damaged), and automatically calculating polygon area. Based on the canopy area thresholds defined for this study, the target young trees were selected. The resulting shapefile was then transferred to the 2021 orthomosaic, where each tree was compared to its 2019 record to determine the changes in their status. For standing dead trees, if a tree recorded as standing dead in 2019 had fallen by 2021, its status was updated to fallen. For young trees, polygons were redrawn for 2021, areas recalculated, and changes in health status—including damage, mortality, or fall—were recorded. Newly observed young trees not visible in 2019 were also annotated with unique IDs, polygons, areas, and status in subsequent orthomosaics. During this process, cross-comparison between the 2019 and 2021 orthomosaics was performed to minimize errors due to shadows, lighting, or missed observations. This procedure was repeated sequentially from 2022 to 2025. At each step, previous annotations were checked and corrected if inconsistencies were detected. Vegetation that could not be confidently identified as young fir trees after comparison across all six orthomosaics was flagged for verification during fieldwork. This systematic approach ensured accuracy of tree IDs, accurate tracking of status changes, and robust quantification of tree canopy areas over time. All annotated young trees found in the orthomosaic of 2019 were tracked in the orthomosaics of 2021, 2022, 2023, 2024, and 2025, and the appearance of newly detected young trees was further annotated (Figure 4).
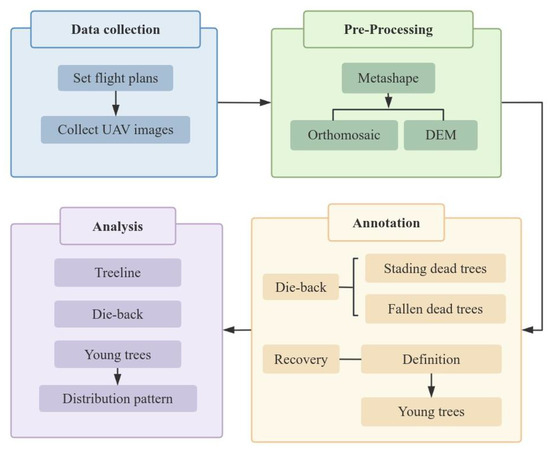
Figure 4.
Study workflow, from data collection to analysis.
2.5. Field Survey
After completing the annotation of all young trees in ArcGIS Pro 3.4.2 , we conducted a field survey to validate the annotation results. During this process, we verified young fir trees that were not clearly visible because they were partially covered by shrubs, and the annotations were corrected accordingly. In June 2025, field validation was conducted for 43 individuals whose status remained uncertain after comparing all orthomosaics across the 7-year period.
2.6. Data Analysis
The data analysis includes an assessment of the current status of the treeline and the spatial quantification of its decline. To reconstruct the treeline prior to the bark beetle outbreak, the present study used currently living and standing dead trees as indicators of the pre-disturbance upper tree limit, defined here as the highest elevation at which trees can grow. The mean elevation of the highest-elevation living or standing dead trees visible on the 2019 map was calculated to represent the treeline position in 2013 (before the outbreak). For 2025, the distribution of surviving mature trees was mapped. Although a few living individuals still remained at the highest elevations, almost all trees in the central part of the site had died. Therefore, when estimating the 2025 treeline, those isolated high-elevation surviving trees were excluded, and the mean elevation of trees located along the upper edge of the main surviving population was used to represent the current treeline position. Specifically, in the 2019 orthomosaic, points were created within the crowns of the highest-elevation trees (including both living and standing dead trees) located along the upper edge of the study area. Elevation values from the digital elevation model (DEM) were extracted from these points, and the mean DEM value of all points was calculated to represent the treeline elevation for 2013 (prior to the bark beetle outbreak). In the 2025 orthomosaic, the distribution of living mature trees was delineated from the lowest-elevation surviving clusters upward toward higher elevations until no apparent mature living trees were observed. The mean DEM value of the highest-elevation surviving trees within this distribution was then calculated to represent the treeline elevation for 2025.
To assess the die-back phenomenon within the study area, annual UAV imagery from 2019 to 2025 was used to identify and record dead and fallen trees. For each year, the total number of dead and fallen trees as well as the number of newly detected dead or fallen individuals were recorded. To estimate the die-back rate during the study period, the number of fallen trees observed in 2019 was compared to the total number of dead trees every year, using the following formula:
For young trees, a detailed analysis of their temporal dynamics was conducted. All young trees visible in 2019 were individually labeled and tracked annually from 2021 to 2025. Each year, the total number of visible young trees was recorded, including newly identified individuals not observed in previous years. The health status transitions (i.e., healthy, damaged, standing dead, and fallen) for all detected young trees were also recorded, and changes in canopy area were quantified to assess growth over time. This approach allowed for temporal tracking of all individual trees.
3. Results
3.1. Treeline Dynamics
In the 2019 orthomosaic, remnants of standing dead trees were visible, providing an opportunity to reconstruct the pre-disturbance forest structure. Based on the spatial pattern of these dead trees, the former treeline prior to the bark beetle outbreak in 2013 is estimated to have been located at approximately 1680.7 m above sea level (in our study site). This historical treeline was characterized by clustered stands of mature Abies mariesii forming a relatively abrupt boundary with the alpine zone. During the period 2019 to 2025, the previously continuous treeline degraded into a fragmented and structurally heterogeneous ecotone. The current treeline structure consists of four spatial zones along an elevational gradient: (1) patches of surviving mature trees in the lower zone, (2) scattered remnant individuals and young trees in the middle zone, (3) isolated young trees and standing dead trees at higher elevations, and (4) a sparse outer margin dominated by shrubs and ground vegetation. This shift reflects a transition from a stable forest edge to a diffuse, disturbance-driven ecotone. Spatial analysis revealed that the treeline had retreated downslope by approximately 385 m, corresponding to an elevational decline of over 186 m (down from 1680.7 m.a.s.l. to 1563.4 m.a.s.l.). The upper side of the image (our study site) and the bottom side showed different treeline shift downward due to their topographic characteristics (Figure 5). These metrics indicate that the 2012–2013 bark beetle outbreak triggered one of the most substantial treeline contractions reported in Japan.
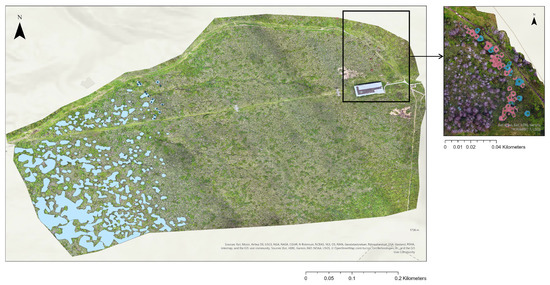
Figure 5.
Left: Distribution patterns of surviving trees in the study area and adjacent regions in 2025. Right: The treeline estimation in 2019 (blue polygons: living mature trees; red polygons: standing dead trees; green points: the upmost standing trees).
3.2. Die-Back
Due to the extremely high tree mortality rate caused by the 2013 bark beetle outbreak, the current forest structure in the study area is dominated by deadwood, with very few remaining healthy or damaged mature trees. The dynamics of standing and fallen dead trees between 2019 and 2025 reflect the gradual degradation of structural elements and the interaction between decomposition, environmental disturbances, and vegetation cover. The number of standing dead trees showed a consistent decline during the observation period, as they gradually fell down. The number of fallen trees fluctuated annually because some of the fallen trees visible one year ’disappeared’ from the orthomosaic the following year as they were covered by sasa vegetation. Thus, a decrease in fallen trees was observed between 2019 to 2021, while a gradual increase was observed from 2022 to 2025. By 2025, the number of visible fallen trees reached its peak at 346 individuals, of which 263 corresponded to trees fallen during the winter 2024–2025. Overall, the total number of visible dead trees (standing + fallen) decreased steadily, indicating that both structural degradation and vegetation masking contributed to the apparent loss of detectable logs (Table 1).

Table 1.
Visible standing dead trees, visible fallen trees, total number, and annual change rate from 2019 to 2025.
Standing dead and fallen trees visible in 2019 are assumed to have died shortly after the outbreak. In addition to dead individuals, 236 living trees were also recorded in 2019. These remaining individuals represent the remnants of a forest that originally hosted at least 3023 mature trees. The die-back rate for the period 2016–2019 was 3.9%, based on the number of fallen and standing dead trees detected in 2019. However, this value could be an underestimation as some fallen trees during this period were not visible in the orthomosaic of 2019. Tracking the annual condition of each identified tree allowed for a detailed assessment of year-to-year transitions, such as their health condition (from healthy/damaged to dead), their fall, and their disappearance (covered by sasa vegetation or over-time decomposition) during the period 2019–2025. Between 2019 and 2025, a total of 529 standing dead trees fell, corresponding to a cumulative die-back rate of 17.5%. The number of fallen trees was highest in 2025, and lowest in 2021. During the same period, 22 living standing trees fell, accounting for 9.3% of all living trees identified in 2019 (Table 2).
Table 2.
ST (Standing Trees), refers to all standing trees, including standing living and dead trees; DFT (Dead Fallen Trees), trees fallen that were standing dead trees; LFT (Living Fallen Trees), trees fallen that were standing living trees; CUT (Cut Trees), trees that were cut down.
In addition to the typical cases of standing trees falling, there were also instances where standing dead trees fell and were immediately covered by sasa vegetation, as they became invisible (IND) in the orthomosaic of the next year anymore. Therefore, this new tree category was also recorded. During the study period, of the 368 trees that were covered by sasa vegetation (disappeared in the orthomosaic), 156 were recorded as invisble fallen trees (INF) and 212 were standing dead trees (FSDT); thus, 12.7% of all dead trees disappeared. This suggests that the number of fallen trees visible in the orthomosaics in 2019 did not represent the full extent of fallen trees at that time. During the same period, only 17 trees transitioned from healthy/damaged to dead standing trees (ND). The new fallen trees (NF) visible in the orthomosaic every year amounted to a total of 339 trees during the 7 years, of which 317 were standing dead trees (FSDT) and 22 were standing living/damaged trees (LFT) (Table 3).
Table 3.
Number of pre-existing (2019) and newly detected standing and fallen dead trees by year. VF: Visible Fallen Trees; NF (Newly Detected Fallen Tree), fallen trees that were detected in the current year; INF (Invisible Fallen Trees), trees that were recorded as fallen the previous year but are not visible anymore; FSDT (Fallen Standing Dead Trees), SDT that fell down during the current year; CUT: SDT that were manually cut down; ND (Newly Detected Standing Dead Trees), trees that transition from healthy/damaged to dead; IND (Invisible Standing Dead Trees), SDT that were visible the previous year and cannot be detected, not even as fallen; VD (Visible Standing Dead Trees).
Based on the spatial reconstruction of dead trees in 2019, Abies mariesii individuals were historically more densely distributed in the higher-elevation area of the study site. Mortality expanded downward, resulting in an elevational mortality gradient consistent with the presumed dispersal pattern of the bark beetles and topographic exposure (Figure 6).
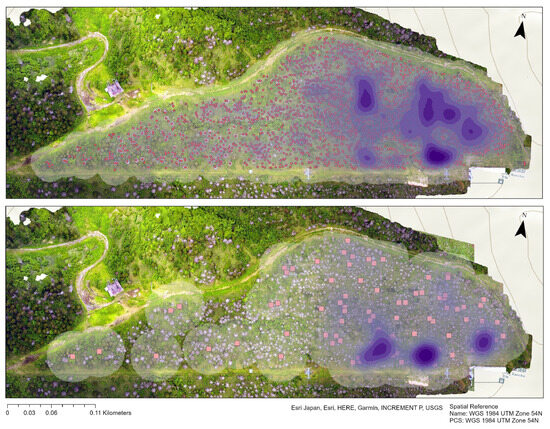
Figure 6.
Top: Distribution and density of standing dead trees in 2019, red points represent the standing dead trees. Bottom: Distribution and density of fallen trees in 2019, red squares represent the fallen dead trees. Purple shading represents distribution density, with darker colors indicating higher density.
New fallen trees were predominantly located in areas with high concentrations of standing dead trees. In 2025, although no additional standing dead trees were identified, the number of fallen trees increased significantly, particularly in the higher-elevation area, from 31 in 2024 to 212 in 2025 (Figure 7).
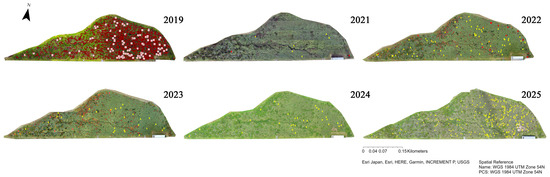
Figure 7.
Distribution of standing dead trees (red circles); fallen trees (red squares); newly standing dead trees (red diamonds); and newly detected fallen trees (yellow diamonds).
Several standing and fallen dead trees gradually disappeared from the orthomosaics. In many cases, disappearance was attributed to progressive branch loss or vegetation overgrowth after falling, particularly by sasa. For standing trees, the gradual loss of branches made them increasingly difficult to detect, especially when only the vertical trunk remained. Fallen trees, particularly those located in the central open area, were not visible in the orthomosaic within 2–3 years (Figure 8).
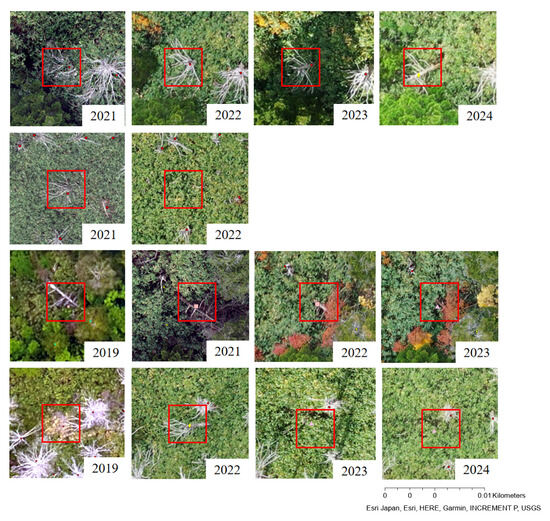
Figure 8.
Examples of different tree trajectories. Top: Standing dead tree gradually losing branches and falling (2021–2024). Second: Tree disappearing directly within one year (2021–2022). Third: Fallen tree covered by vegetation over time (2019–2023). Bottom: Tree that fell in 2022 and disappeared completely within two years (2019–2024).
By 2022, a notable shift occurred: newly fallen trees were increasingly observed in the lower-elevation zones, where surviving mature trees remained densely distributed. Several trees classified as damaged or even healthy in prior years fell down because of strong winter winds (Figure 9), which saw a sharp increase in fallen trees in 2025 with reported winds in winter of approximately 25 m s−1 as reported by the meteorological station in Zao Mountains, in 2020.
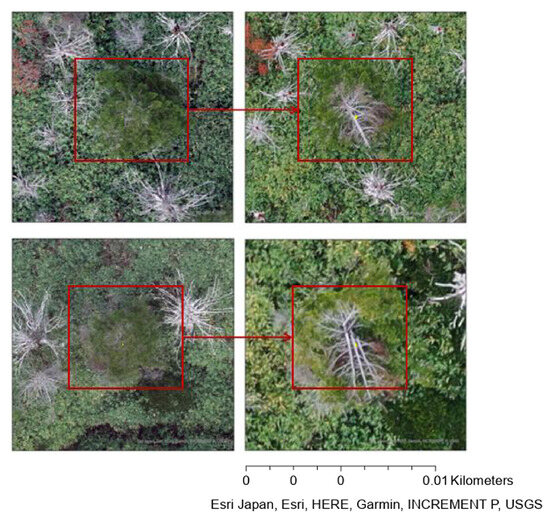
Figure 9.
Examples of damaged trees that fell within a one-year interval (e.g., 2021–2022).
3.3. Regeneration
Among the 43 young fir trees validated during the field survey, one case initially annotated as a damaged young tree was instead confirmed to be a fallen branch from a neighboring mature fir tree. Two other cases were found to be shrubs rather than young fir trees. In addition, three overlooked young trees were confirmed, which had been partially covered by surrounding vegetation and only a small portion of their crowns was visible in the orthomosaics; these were subsequently added to the annotations. After measuring the canopy area of all healthy trees in 2019 and incorporating field survey observations of tree height, we found that the average canopy area of mature trees in the study area was approximately 12.7 m2. These mature trees were around 7 m in height, based on field measurements. According to the earlier definition, trees with heights between 1.3 and 3 m were categorized as young trees. Based on this definition, young trees were defined as individuals with canopy areas smaller than 3 m2. In the field survey, we measured the height of several young trees, and the results were generally consistent with this classification. Following the large-scale mortality caused by the bark beetle outbreak, young trees began to emerge and establish across the study area. UAV orthomosaics enabled tracking of these young trees from 2019 to 2025 based on canopy visibility, spatial location, and tree status. In 2019, a total of 60 young trees with a height less than 3 m were recorded; 58 young trees were generally in healthy condition, showing no obvious signs of damage, while 2 of them showed signs of damage. After assigning identification numbers to all young trees detected in 2019, their status was tracked from 2021 to 2025, and newly detected young trees in successive orthomosaics during this period were also recorded. Within the study area, the number of detected young trees showed an increasing trend. The highest number of newly detected young trees was recorded in 2021 (36 individuals), followed by 2024 (17 individuals), while all other years five or fewer young trees were detected. Throughout the study period, only one healthy young tree per year was found to transition into a damaged state, except for 2022 when no such cases were observed. Additionally, except for one tree fallen in 2022, no other fallen young tree was detected. In 2023, three young trees that were no longer visible in the UAV images were considered dead (Table 4).
Table 4.
Annual counts of visible young trees and their status (dead, damaged, fallen, disappeared, and newly detected young trees) from 2019 to 2025.
In 2021, three young trees that died had all been in a healthy condition in 2019. The tree that fell in 2022 had been in a damaged condition from 2021, indicating a direct transition from damaged condition to fallen within one year. Regarding the three trees that disappeared in 2023, one was in a healthy state, one was standing dead, and one had already fallen after death in 2022. These disappeared fallen young trees were healthy in 2019 with no visible white branches in the UAV imagery. However, in 2021, all of them showed clear signs of damage (Table 4).
From 2019 to 2025, only one young tree was observed fallen, corresponding to a windthrow rate of 1.6%. During the same period, four young trees were recorded as dead, resulting in a mortality rate of 6.7% based on the initial sixty individuals observed in 2019. Four young trees did not show any signs of damage in the preceding year. After accounting for this overlap of 60 young trees present in 2019, 6 were lost due to either physiological damage or wind–snow driven fall, yielding a combined loss rate of 10% over the seven-year period (Figure 10).
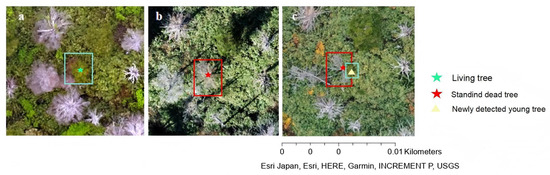
Figure 10.
Example of young tree annotations over time. (a) A young tree detected in 2019. (b) The same tree found dead in 2021. (c) A new young tree detected adjacent to the dead tree in 2022. Red boxes: dead young trees. Green boxes: living young trees.
For the period 2019 to 2025, the number of young trees increased by approximately 103.3%, with 62 new individuals observed in addition to the 60 recorded in 2019. After analyzing the canopy area of 60 young trees from 2019 in the year 2025, 3 young trees were found to have either fallen or become not visible by 2025. In 2025, among the remaining 57 young trees, 53 showed an increase in canopy area, accounting for 93%, while 4 exhibited a decrease; for the 53 young trees with increased canopy area, the average increase was 1.84 m2, with an average percentage increase of 126.8%. In 2019, the total canopy area of the 60 young trees was 95.2 m2. However, by 2025, the total canopy area of all visible young trees, including newly identified individuals, had increased to 298.1 m2, representing a total increase of approximately 231.1%. The spatial distribution of young trees changed over time, showing active regeneration near remaining mature trees, remnant clusters, and areas with historically lower mortality. Most individuals were located near the upper boundary of the study area (Figure 11).
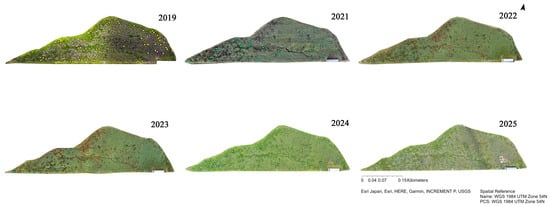
Figure 11.
Distribution of young trees in 2019 (60), yellow dots: young trees in 2019. Distribution of newly observed young trees in each year from 2021 to 2025, blue dots: newly observed young trees.
Few young trees were found in the central open areas with high sasa cover and no remnant tree structures. Young trees that were detected in 2019 were primarily concentrated in areas where remnant living trees remained—specifically near the historical treeline at higher elevation and in lower elevation zones with relatively lower mortality rates. In 2021, the highest number of newly discovered young trees was recorded, and they were similarly distributed in these two areas. The same pattern was also found in 2024.
4. Discussion
In this study, high-resolution UAV imagery was employed to monitor post-disturbance recovery processes in an Abies mariesii subalpine forest in northeastern Japan. Temporal analysis of canopy dynamics, young tree emergence, and die-back phenomenon over a seven-year period highlights both the potential and limitations of UAV-based ecological monitoring, while also informing forest management strategies on regenerating landscapes.
4.1. Image Quality, Detection Limitations, and Interpretation Uncertainty
The effectiveness of UAV imagery in forest recovery assessment is significantly influenced by image resolution and consistency, and image quality, such as cloudiness and brightness. In instances of suboptimal image clarity—resulting from flight altitude, motion blur, or inadequate lighting—young trees may not be clearly visible, compromising accurate detection. These findings emphasize the importance of standardized UAV data acquisition protocols, including consistency in spatial, temporal, and radiometric parameters [51,52], as well as the need for high-temporal resolution in image collection to ensure the availability of good quality images [25].
The detectability of seedlings was influenced by the presence of taller shrubs and dense sasa vegetation, since many seedlings remained undetected in aerial imagery, as confirmed by field surveys. They were visible when they became taller than 1.2–1.3 m, when they were finally detected in the UAV imagery. This provides evidence that seedling recruitment is underway and it is just a matter of time for the number of 119 young trees found by 2025 to increase sharply as they start providing seeds [50]. This was evidenced by the increase of 103% of young trees during the 7-year UAV monitoring. Thus, the results of our study accurately account for the visible young trees in the study area but for physical reasons (seedlings under sasa cover) underestimate the total number of seedlings present. Field validation is thus indispensable for accurate interpretation of remotely sensed data obtained using RGB sensors, particularly in complex forest environments [53].
4.2. Disturbance Dynamics: Die-Back, and Tree Fall Patterns
In 2022, a UAV survey on the east-facing slope of the same mountain as our study site revealed that of 3849 trees in an area of 13.5 ha, 72%, 24%, and 4% were healthy, damaged, and dead, respectively, with no signs of treeline retreat. This comparison indicates that the treeline retreat and elevated mortality observed in our experimental site are influenced not only by bark beetle infestation but also by local conditions. Differences in slope aspect at similar elevations suggest that microclimatic conditions associated with terrain play a significant role. While the typical progression from healthy to damaged to standing dead tree and subsequently to fallen log is gradual, several trees were observed transitioning directly from a healthy or damaged state to fallen within a one-year interval.
Meteorological records from the Zao Mountains show considerable interannual variation in snow depth and wind intensity from 2018 to 2025. Maximum snow depths were 165 cm in 2018–2019, 120 cm in 2019–2020, 180 cm in 2020–2021, 260 cm in 2021–2022, 200 cm in 2022–2023, 185 cm in 2023–2024, and 250 cm in 2024–2025. Maximum wind speeds recorded by Yamagata City were 15.0 m/s, 16.6 m/s, 20.9 m/s, 15.6 m/s, 15.7 m/s, 16.6 m/s, and 15.3 m/s, respectively, with the number of days exceeding 10 m/s being 16, 23, 27, 17, 20, 16, and 21, respectively [54,55]. Thus, the widespread treefall observed after the winters of 2021–2022 and 2024–2025 was most likely caused by the combined effects of heavy snowfall and strong winds, which may have ultimately brought many weakened trees down. In previous studies, it has been shown that fallen healthy trees become the ideal host trees for bark beetle colonization, increasing their population. These data suggest that, in addition to bark beetle infestation, the synergistic influence of snow and wind—modulated by local topography—played a critical role in triggering episodic tree mortality. These observations reinforce the importance of UAV monitoring in capturing short-term disturbance events and its integration with ecological and meteorological datasets when interpreting tree mortality trends [56]. With the use of UAVs, this task is more accurate since it leads the field survey directly to areas where seedlings appear to be present, unlike satellite images, where this seedling location accuracy would have been impossible, although in the future they can be coupled [57].
In addition, the gradual shedding of branches from standing dead trees until its final fall, which constitutes the die-back process, contributes to understory light availability, and from the point of view of precise remote sensing, the uncovering of existing young trees. These changes result in the apparent emergence or canopy expansion of individuals that were previously covered. Although such crown area increases do not necessarily indicate growth, they reflect a dynamic process wherein the forest actively removes senescent individuals and facilitates the exposure of regenerating cohorts to their surrounding environment and light availability [58]. In this context, UAV-detected increases in young tree cover are still ecologically meaningful, as they denote the continuation of natural recovery processes [59].
4.3. Natural Regeneration, Sasa Interactions, and Biotic Protection
Field surveys indicate that seedling establishment is occurring under dense sasa vegetation cover. This seedling recruitment pattern is not in agreement with the results of previous studies that found the negative effect of sasa vegetation on forest regeneration [60,61]. According to these studies, the presence of sasa limits light availability and competes for water and nutrients, which in turn can hinder seedling establishment. Experiments showed that fir seeds sown in sasa-removed area failed to produce seedlings, with only 0.5% of success, which was attributed to inadequate seeds [62]. However, in successive experiments where seedlings were planted in and sasa clearings, seedlings showed stunted growth, as observed during field surveys in Zao Mountains. These results are remarkably different from the 1.6% mortality rate of the seedlings that became the visible new young trees observed by UAVs in our study site. Thus, sasa vegetation cover may not necessarily act as a limiting factor for seedling recruitment. On the contrary, dense understory vegetation might help protect seedlings from herbivory and frost damage and contribute to higher humidity levels [63,64,65]. One more important function, which has not been considered until now, is the protection that sasa might provide to Abies seedlings against strong winds in the subalpine treeline ecotones. Furthermore, when sasa vegetation cover exceeds 40%, Abies seedlings occur in fallen logs, indicating their adaptation despite the presence of sasa and the importance of the continued die-back process for Abies seedling recruitment [66]. It is also necessary to take into consideration that the regeneration taking place in Zao is at present occurring under a global warming scenario, which could be an enhancing factor for seedling establishment [67,68].
As it is shown in our study, transition from seedling to sapling to young tree is proceeding in many areas, with a generally positive trend in canopy expansion and individual health, reflecting the forest ecosystem’s inherent capacity of long-term resilience. Furthermore, the spatial pattern of young trees suggests a bidirectional trajectory of forest recovery. Recruitment appears to be advancing downslope from upper elevations and upslope from lower-elevation areas, which were less affected by the pest outbreaks. The middle-elevation zone, which experienced the most extensive tree mortality, is likely to serve as a convergence point from both regeneration fronts. This spatial regeneration trajectory captures the heterogeneous regeneration dynamics and forecasts future full forest recovery as young trees start reaching maturity [69].
4.4. Forest Landscape Transformation and Socioecological Implications
Prior to the insect outbreak, the study area was characterized by a closed-canopy subalpine forest situated below the climatic treeline. In winter, this dense forest structure played a key role in the formation of “snow monsters” (Juhyo). However, the widespread mortality (of healthy trees falling) and tree die-back, especially during the winter 2024–2025, have substantially reduced the number of trees capable of forming these structures. This decline may pose economic challenges to local tourism, thus the urgency for a speedy forest recovery. However, the poor results of seedling plantations have shown that natural regeneration is a better alternative to create a more stable forest stand; understanding this process can contribute to better forest management that can enhance regeneration. Nevertheless, as natural regeneration progresses and young trees mature, the potential for snow monster formation—and by extension, winter tourism—may gradually be a reality again. However, the time scale for its recovery will follow the natural time scale needed for a forest to recover. It will also follow the timing of seed production of newly mature trees and masting years when the production of good quality Abies seeds is boosted. In a study of Abies cephalonica in Greece [70], it was found that during masting years a single fir tree had in average 40.8 cones, while in non-masting years the number was only 5.9 cones per tree. Therefore, in the future, the increase of seedlings (shown by young trees in our study), will not be a linear increase but more an increase determined by the annual production of seedlings, being protected by sasa vegetation and burst of seed production during the masting years. The broader significance of forest recovery beyond ecological metrics calls for integrated approaches that link ecological restoration with cultural ecosystem services.
4.5. Comparative Perspectives on Bark Beetle Impacts and Forest Recovery
Bark beetle outbreaks have caused extensive forest die-back in Europe and North America, leading to diverse approaches for monitoring, interpretation, and management. Kautz introduced a correction for time-lag bias in aerial-surveyed infestation data, improving the temporal precision in assessing beetle impacts [71]. Trautwein et al. analyzed the outer appearance of bark beetle-infested Norway spruce stands in the Harz Mountains and described progressive bark loss, fungal colonization, and structural decay, which together reflect post-disturbance dynamics [72]. Fernandez-Carrillo et al. integrated multi-temporal satellite imagery with field validation to accurately map beetle damage across Central Europe [6], while Schiller et al. employed deep learning-based reconstructions of irregular Sentinel-2 time series to enable early detection of bark beetle infestations [73]. Rodman et al. demonstrated that Rocky Mountain forests can recover following bark beetle outbreaks, although species composition and canopy structure often change substantially [74]. In addition, FOREST EUROPE summarized management strategies in response to widespread bark beetle damage, including sanitary felling, preventive thinning, mixed-species replanting, and the selective protection of naturally regenerating areas [75]. Together, these studies highlight a spectrum of scientific and management approaches—from precise monitoring and early detection to active intervention and adaptive restoration planning—that have guided forest recovery under bark beetle disturbance across temperate regions.
In contrast, the Abies mariesii forests in the Zao Mountains represent a case of spontaneous natural regeneration without human intervention. Despite the slow growth of young trees and the presence of dense sasa cover, our results indicate that regeneration is proceeding actively and that the forest is likely to recover into a fir-dominated community. Although no artificial removal of infected standing dead trees has been conducted, the rate of natural treefall has been remarkably rapid, possibly influenced by the mountain’s unique microclimatic conditions such as strong seasonal winds and snow accumulation. Processes, such as, accelerated decomposition, active regeneration under dense understory, and stable recruitment near surviving trees, together suggest a resilient recovery trajectory. Compared with Central European forests, where management often involves salvage logging or replanting to accelerate recovery and reduce economic losses, Zao Mountain forests are recovering through natural processes. This contrast emphasizes that under suitable environmental and microclimatic conditions, passive recovery can serve as an effective pathway for post-disturbance forest restoration, offering valuable ecological insights complementary to the management-oriented approaches documented elsewhere.
4.6. Implications for Forest Management and Remote Sensing Integration
The presence of a robust seedling population and consistent recruitment into young tree stages raises important considerations for restoration strategies. In many areas, passive regeneration appears to be sufficient, while active reforestation efforts may not be warranted. Previous studies have emphasized that passive approaches often lead to structurally diverse and resilient forest systems over time, particularly in ecosystems with intact seed sources [76,77].
However, regeneration success is spatially heterogeneous. Certain areas exhibit slower recovery, potentially due to legacy effects of past disturbances, microclimatic stressors, or excessive understory density. In such cases, selective and spatially targeted interventions may be considered, such as trimming of sasa, without clear cutting all sasa around [78]. UAV imagery enables the identification of low-regeneration zones and supports prioritization in management planning. The broader utility of UAV monitoring lies in its capacity to guide precision forest management [20]. High-resolution imagery enables the mapping of regeneration dynamics, the detection of mortality clusters, and the assessment of intervention outcomes. This spatially explicit information facilitates the shift from generalized management strategies to site-specific, adaptive approaches aligned with ecological processes.
While LiDAR provides detailed three-dimensional forest structure, its application in our study site is limited by the dense sasa understory and the extremely small size of newly emerged fir trees, which often only slightly exceed the ground vegetation. Under these conditions, LiDAR point clouds may not reliably distinguish young fir trees, whereas high-resolution UAV imagery captured from above allows clear identification based on crown and branch structure. Nevertheless, LiDAR remains valuable in forests with lower understory density or shorter ground vegetation, and future studies could integrate UAV-RGB and LiDAR data to combine the strengths of both approaches. Incorporation of machine learning techniques may further enhance detection accuracy and monitoring efficiency [79].
UAV-based monitoring thus represents not only a powerful tool for post-disturbance ecological assessment, but also a practical foundation for designing informed, efficient, and ecologically sensitive management interventions in regenerating forest landscapes.
5. Conclusions
This study assessed the regeneration dynamics of an Abies mariesii subalpine forest ecosystem more than a decade after a severe bark beetle outbreak in Zao Mountains, northeastern Japan. Despite an initial mortality rate exceeding 90% and a treeline retreat of nearly 400 m, UAV-based monitoring revealed a steady increase in young tree emergence and canopy expansion between 2019 and 2025.
The spatial patterns of regeneration indicate that young trees are primarily emerging near remnant mature individuals and in areas with lower mortality. Canopy growth trends among surviving individuals further demonstrate the ongoing recovery. Although environmental disturbances such as heavy snowfall and strong winds contributed to additional mortality and treefall events, the overall rate of new mortality has declined, and the number of young trees has increased by more than 100% over six years.
Field investigations revealed the presence of seedlings beneath the dense sasa vegetation, indicating that natural regeneration processes are occurring even in areas where UAV detection is limited. These findings suggest that passive regeneration may be sufficient for large areas of Zao Mountains. From a management perspective, our findings suggest that large-scale artificial replanting is not required, as natural regeneration of Abies mariesii is actively progressing even under dense sasa cover. However, moderate removal of sasa in areas where young fir trees are already established may further support their growth. Continuous UAV-based monitoring is recommended to track regeneration and detect possible setbacks caused by future disturbances. These insights provide practical guidance for developing cost-effective and ecologically sustainable forest recovery strategies in subalpine regions of Japan.
Overall, the disturbed treeline ecotone is gradually transitioning into a structurally heterogeneous but recovering forest. With continued monitoring and minimal intervention, this ecosystem has the potential to recover in a self-sustaining and ecologically meaningful way.
Author Contributions
Conceptualization, P.W.; methodology, P.W.; software, P.W. and N.L.T.; validation, P.W. and M.L.L.C.; formal analysis, P.W.; investigation, P.W.; resources, P.W., H.S., V.V.G., and N.L.T.; data curation, P.W.; writing—original draft preparation, P.W.; writing—review and editing, P.W. and M.L.L.C.; visualization, P.W.; supervision, M.L.L.C., H.Z., and C.-Y.T. All authors have read and agreed to the published version of the manuscript.
Funding
This research received no external funding.
Data Availability Statement
The data that support the findings of this study are not publicly available because they are being used in ongoing research by the authors.
Acknowledgments
I would like to thank all members of the Smart Forest research group for their daily support, especially my advisor Lopez. I also appreciate the staff at Mount Zao for their assistance with our data collection, and I want to thank my parents and my dog as well.
Conflicts of Interest
The authors declare no conflicts of interest.
Abbreviations
The following abbreviations are used in this manuscript:
| ST | Standing Trees |
| DFT | Dead Fallen Trees |
| LFT | Living Fallen Trees |
| VF | Visible Fallen Trees |
| NF | Newly Detected Fallen Tree |
| INF | Invisible Fallen Trees |
| FSDT | Fallen Standing Dead Trees |
| ND | Newly Detected Standing Dead Trees |
| IND | Invisible Standing Dead Trees |
| VD | Visible Standing Dead Trees |
References
- Bogdziewicz, M.; Hacket-Pain, A.; Kelly, D.; Thomas, P.A.; Lageard, J.; Tanentzap, A.J. Climate warming causes mast seeding to break down by reducing sensitivity to weather cues. Glob. Change Biol. 2021, 27, 1952–1961. [Google Scholar] [CrossRef]
- König, L.; Mohren, G.; Schelhaas, M.J.; Bugmann, H.; Nabuurs, G.J. Tree regeneration in models of forest dynamics—Suitability to assess climate change impacts on European forests. For. Ecol. Manag. 2022, 520, 120390. [Google Scholar] [CrossRef]
- Díaz-Yáñez, O.; Käber, Y.; Anders, T.; Bohn, F.; Braziunas, K.H.; Brǔna, J.; Fischer, R.; Fischer, S.M.; Hetzer, J.; Hickler, T.; et al. Tree regeneration in models of forest dynamics: A key priority for further research. Ecosphere 2024, 15, e4807. [Google Scholar] [CrossRef]
- Berdanier, A.B.; Clark, J.S. Divergent reproductive allocation trade-offs with canopy exposure across tree species in temperate forests. Ecosphere 2016, 7, e01313. [Google Scholar] [CrossRef]
- Käber, Y.; Meyer, P.; Stillhard, J.; De Lombaerde, E.; Zell, J.; Stadelmann, G.; Bugmann, H.; Bigler, C. Tree recruitment is determined by stand structure and shade tolerance with uncertain role of climate and water relations. Ecol. Evol. 2021, 11, 12182–12203. [Google Scholar] [CrossRef] [PubMed]
- Fernandez-Carrillo, A.; Patočka, Z.; Dobrovolnỳ, L.; Franco-Nieto, A.; Revilla-Romero, B. Monitoring bark beetle forest damage in Central Europe. A remote sensing approach validated with field data. Remote Sens. 2020, 12, 3634. [Google Scholar] [CrossRef]
- Jayathunga, S.; Pearse, G.D.; Watt, M.S. Unsupervised methodology for large-scale tree seedling mapping in diverse forestry settings using UAV-based RGB imagery. Remote Sens. 2023, 15, 5276. [Google Scholar] [CrossRef]
- Pommerening, A.; Szmyt, J.; Duchiron, M.S. Revisiting silvicultural systems: Towards a systematic and generic design of tree regeneration methods. Trees For. People 2024, 17, 100597. [Google Scholar] [CrossRef]
- Witzmann, S.; Gollob, C.; Kraßnitzer, R.; Ritter, T.; Tockner, A.; Moik, L.; Sarkleti, V.; Ofner-Graff, T.; Schume, H.; Nothdurft, A. Quantification of Forest Regeneration on Forest Inventory Sample Plots Using Point Clouds from Personal Laser Scanning. Remote Sens. 2025, 17, 269. [Google Scholar] [CrossRef]
- Genç, Ç.Ö.; Altunel, A.O. Monitoring the operational changes in surface reflectances after logging, based on popular indices over Sentinel-2, Landsat-8, and ASTER imageries. Environ. Monit. Assess. 2025, 197, 120. [Google Scholar] [CrossRef]
- El Badri, A.; El Qryefy, M. Assessment of post-fire regeneration in the Mesguina forest (Morocco) using remote sensing and geographic information systems. Ecol. Eng. Environ. Technol. 2025. [Google Scholar]
- Wu, D.; Lu, D.; Zhu, C.; Ge, X.; Lin, L.; Gao, T.; Zhu, J. Long-term gap regeneration processes in a primary temperate forest of Northeast China: Evidence from integrated multi-temporal remote sensing and field surveys. For. Ecol. Manag. 2025, 593, 122902. [Google Scholar] [CrossRef]
- Torresan, C.; Berton, A.; Carotenuto, F.; Di Gennaro, S.F.; Gioli, B.; Matese, A.; Miglietta, F.; Vagnoli, C.; Zaldei, A.; Wallace, L. Forestry applications of UAVs in Europe: A review. Int. J. Remote Sens. 2017, 38, 2427–2447. [Google Scholar] [CrossRef]
- Guimarães, N.; Pádua, L.; Marques, P.; Silva, N.; Peres, E.; Sousa, J.J. Forestry remote sensing from unmanned aerial vehicles: A review focusing on the data, processing and potentialities. Remote Sens. 2020, 12, 1046. [Google Scholar] [CrossRef]
- Fassnacht, F.E.; White, J.C.; Wulder, M.A.; Næsset, E. Remote sensing in forestry: Current challenges, considerations and directions. For. Int. J. For. Res. 2024, 97, 11–37. [Google Scholar] [CrossRef]
- Vindiš, P.; Kelc, D.; Berk, P. Detection of bark beetle infestations by drone and image analysis in spruce forests. Šumarski List 2025, 149, 127–135. [Google Scholar] [CrossRef]
- Bozzini, A.; Huo, L.; Brugnaro, S.; Morgante, G.; Persson, H.J.; Finozzi, V.; Battisti, A.; Faccoli, M. Multispectral drone images for the early detection of bark beetle infestations: Assessment over large forest areas in the Italian South-Eastern Alps. Front. For. Glob. Chang. 2025, 8, 1532954. [Google Scholar] [CrossRef]
- Huo, L.; Matsiakh, I.; Bohlin, J.; Cleary, M. Estimation of Tree Vitality Reduced by Pine Needle Disease Using Multispectral Drone Images. Remote Sens. 2025, 17, 271. [Google Scholar] [CrossRef]
- Leidemer, T.; Gonroudobou, O.B.H.; Nguyen, H.T.; Ferracini, C.; Burkhard, B.; Diez, Y.; Lopez Caceres, M.L. Classifying the degree of bark beetle-induced damage on fir (Abies mariesii) forests, from UAV-acquired RGB images. Computation 2022, 10, 63. [Google Scholar] [CrossRef]
- Tran, T.C.N.; Lopez Caceres, M.L.; Riera, S.G.i.; Conciatori, M.; Kuwabara, Y.; Tsou, C.Y.; Diez, Y. Using UAV RGB Images for Assessing Tree Species Diversity in Elevation Gradient of Zao Mountains. Remote Sens. 2024, 16, 3831. [Google Scholar] [CrossRef]
- Mierkalne, K.S.; Bergmanis, I. Evaluating forest regeneration success after selective logging using unmanned aerial vehicles and remote sensing. In Proceedings of the 20th International Scientific Conference Students on Their Way to Science (Undergraduate, Graduate, Post-Graduate Students) Collection of Abstracts, Jelgava, Latvia, 25 April 2025; p. 75. [Google Scholar]
- Conciatori, M.; Tran, N.T.C.; Diez, Y.; Valletta, A.; Segalini, A.; Lopez Caceres, M.L. Plant species classification and biodiversity estimation from UAV images with deep learning. Remote Sens. 2024, 16, 3654. [Google Scholar] [CrossRef]
- Hao, Z.; Yao, S.; Post, C.J.; Mikhailova, E.A.; Lin, L. Comparative performance of convolutional neural networks for detecting and mapping a young Casuarina equisetifolia L. forest from unmanned aerial vehicle (UAV) imagery. New For. 2025, 56, 40. [Google Scholar] [CrossRef]
- Ecke, S.; Stehr, F.; Dempewolf, J.; Frey, J.; Klemmt, H.J.; Seifert, T.; Tiede, D. Species-specific machine learning models for UAV-based forest health monitoring: Revealing the importance of the BNDVI. Int. J. Appl. Earth Obs. Geoinf. 2024, 135, 104257. [Google Scholar] [CrossRef]
- Leidemer, T.; Lopez Caceres, M.L.; Diez, Y.; Ferracini, C.; Tsou, C.Y.; Katahira, M. Evaluation of Temporal Trends in Forest Health Status Using Precise Remote Sensing. Drones 2025, 9, 337. [Google Scholar] [CrossRef]
- Velasco Pereira, E.A.; Navarro-Cerrillo, R.M. Post-fire regeneration dynamics of heterogeneous Mediterranean ecosystems using Landsat and ALS data. Sci. Total Environ. 2025, 1001, 180435. [Google Scholar] [CrossRef] [PubMed]
- Pinto, R.C.; Gorgens, E.B.; de Almeida, D.R.A.; Peña-Claros, M.; Schwartz, G.; Vidal, E. Natural regeneration responses of tree species at the end of the first timber harvesting cycle in the Eastern Amazon. For. Ecol. Manag. 2025, 594, 122947. [Google Scholar] [CrossRef]
- Fuqua, J.K. Postfire Conifer Regeneration: Optimal Microsite Factors and the Potential for UAS in Forest Monitoring. Master’s Thesis, Oregon State University, Corvallis, OR, USA, 2025. [Google Scholar]
- So, K.; Chau, J.; Rudd, S.; Robinson, D.T.; Chen, J.; Cyr, D.; Gonsamo, A. Direct Estimation of Forest Aboveground Biomass from UAV LiDAR and RGB Observations in Forest Stands with Various Tree Densities. Remote Sens. 2025, 17, 2091. [Google Scholar] [CrossRef]
- Chiba, S.; Kawatsu, S.; Hayashida, M. Large-area mapping of the mass mortality and subsequent regeneration of Abies mariesii forests in the Zao Mountains in Northern Japan. J. Jpn. For. Soc. 2020, 102, 108–114. [Google Scholar] [CrossRef]
- Kirkpatrick, J.; Bridle, K. The role of fallen logs in the regeneration of tree species in Tasmanian mixed forest. For. Ecol. Manag. 1999, 114, 265–277. [Google Scholar] [CrossRef]
- Jezek, J.; Bezdek, M.; Kolek, J.; Hrivnak, M.; Zamecnik, J. Effect of coarse woody debris on seedling establishment in boreal forest gaps. For. Ecol. Manag. 2004, 203, 179–187. [Google Scholar]
- Iijima, H.; Nakashizuka, T. Effects of coarse woody debris on seedling growth of Abies mariesii in subalpine forests. J. For. Res. 2010, 15, 123–130. [Google Scholar]
- Seidl, R.; Potterf, M.; Müller, J.; Turner, M.G.; Rammer, W. Patterns of early post-disturbance reorganization in Central European forests. Proc. R. Soc. B Biol. Sci. 2024, 291, 20240625. [Google Scholar] [CrossRef]
- Zeppenfeld, T.; Svoboda, M.; DeRose, R.J.; Heurich, M.; Müller, J.; Čížková, P.; Starý, M.; Bače, R.; Donato, D.C. Response of mountain Picea abies forests to stand-replacing bark beetle outbreaks: Neighbourhood effects lead to self-replacement. J. Appl. Ecol. 2015, 52, 1402–1411. [Google Scholar] [CrossRef]
- Davis, T.S.; Rhoades, P.R.; Mann, A.J.; Griswold, T. Bark beetle outbreak enhances biodiversity and foraging habitat of native bees in alpine landscapes of the southern Rocky Mountains. Sci. Rep. 2020, 10, 16400. [Google Scholar] [CrossRef] [PubMed]
- Körner, C. Mountain biodiversity, climate change and elevation shift of alpine treelines. Ecol. Stud. 2004, 167, 1–21. [Google Scholar]
- Hansson, A.; Dargusch, P.; Shulmeister, J. A review of modern treeline migration, the factors controlling it and the implications for carbon storage. J. Mt. Sci. 2021, 18, 291–306. [Google Scholar] [CrossRef]
- Harsch, M.A.; Hulme, P.E.; McGlone, M.S.; Duncan, R.P. Are treelines advancing? A global meta-analysis of treeline response to climate warming. Ecography 2009, 32, 1–13. [Google Scholar] [CrossRef]
- Garbarino, M.; Morresi, D.; Anselmetto, N.; Weisberg, P.J. Treeline dynamics under natural and anthropogenic influences: A global perspective. Glob. Ecol. Biogeogr. 2023, 32, 1975–1989. [Google Scholar] [CrossRef]
- Podolskiy, E.A.; Nygaard, B.E.K.; Nishimura, K.; Makkonen, L.; Lozowski, E.P. Study of unusual atmospheric icing at Mount Zao, Japan, using the Weather Research and Forecasting model. J. Geophys. Res. Atmos. 2012, 117, D12. [Google Scholar] [CrossRef]
- Takahashi, K.; Uemura, S.; Suzuki, J.-I.; Hara, T. Effects of understory dwarf bamboo on soil water and the growth of overstory trees in a dense secondary *Betula ermanii* forest, northern Japan. Ecol. Res. 2003, 18, 767–774. [Google Scholar] [CrossRef]
- Tripathi, S.K.; Sumida, A.; Shibata, H.; Uemura, S.; Ono, K.; Hara, T. Growth and substrate quality of fine root and soil nitrogen availability in a young *Betula ermanii* forest of northern Japan: Effects of the removal of understory dwarf bamboo (*Sasa kurilensis*). For. Ecol. Manag. 2005, 212, 278–290. [Google Scholar] [CrossRef]
- Abe, M.; Miguchi, H.; Honda, A.; Makita, A.; Nakashizuka, T. Short-term changes affecting regeneration of *Fagus crenata* after the simultaneous death of *Sasa kurilensis*. J. Veg. Sci. 2005, 16, 49–56. [Google Scholar] [CrossRef]
- Yano, K. Ice monster (Jyuhyo) in Mt. Zao. J. Snow Eng. Jpn. 1989, 5, 23–32. [Google Scholar] [CrossRef]
- Miyagi Prefectural Government. Tourism Statistics Overview. 2023. Available online: https://www.pref.miyagi.jp/soshiki/kankou/statistical.html (accessed on 28 September 2025). (In Japanese).
- Yano, K. Meteorological observations at Zao, Yamagata prefecture (1). Snow Life Tohoku 1994, 9, 75. [Google Scholar]
- Japan Meteorological Agency (JMA). Monthly Mean Air Temperature, Sendai (Station ID: 47590). 2025. Available online: https://www.jma.go.jp/jma/indexe.html (accessed on 28 September 2025).
- Moritake, K.; Cabezas, M.; Nhung, T.T.C.; Caceres, M.L.L.; Diez, Y. Sub-alpine shrub classification using UAV images: Performance of human observers vs DL classifiers. Ecol. Informatics 2024, 80, 1–16. [Google Scholar] [CrossRef]
- Sakai, A.; Matsui, K.; Kabeya, D.; Sakai, S. Altitudinal Variation in Lifetime Growth Trajectory and Reproductive Schedule of a Sub-Alpine Conifer Abies Mariesii. Ph.D. Thesis, Tohoku University, Sendai, Japan, 2003. [Google Scholar]
- Dandois, J.P.; Ellis, E.C. High spatial resolution three-dimensional mapping of vegetation spectral dynamics using computer vision. Remote Sens. Environ. 2013, 136, 259–276. [Google Scholar] [CrossRef]
- Wallace, L.; Lucieer, A.; Watson, C. Assessing the feasibility of UAV-based LiDAR for high resolution forest change detection. Int. Arch. Photogramm. Remote Sens. Spat. Inf. Sci. 2012, 39, 499–504. [Google Scholar] [CrossRef]
- Bréda, N.J. Ground-based measurements of leaf area index: A review of methods, instruments and current controversies. J. Exp. Bot. 2003, 54, 2403–2417. [Google Scholar] [CrossRef]
- SnowJapan. Zao Onsen Ski Area Snow Data. 2025. Available online: https://www.snowjapan.com/japan-ski-resorts/yamagata/yamagata/zao-onsen/snow-data?utm_source=chatgpt.com (accessed on 9 October 2025).
- Japan Meteorological Agency (JMA). Daily Meteorological Data for Yamagata City, Japan, 2025. Data Downloaded from JMA Website (J), Daily Records from December 2018 to February 2025. Available online: https://www.data.jma.go.jp/stats/etrn/view/daily_s1.php?prec_no=35&block_no=47588&year=2018&month=12&day=&view=p1 (accessed on 9 October 2025).
- Senf, C.; Pflugmacher, D.; Zhiqiang, Y.; Sebald, J.; Knorn, J.; Neumann, M.; Hostert, P.; Seidl, R. Canopy mortality has doubled in Europe’s temperate forests over the last three decades. Nat. Commun. 2018, 9, 4978. [Google Scholar] [CrossRef]
- Delavarpour, N.; Koparan, C.; Nowatzki, J.; Bajwa, S.; Sun, X. A technical study on UAV characteristics for precision agriculture applications and associated practical challenges. Remote Sens. 2021, 13, 1204. [Google Scholar] [CrossRef]
- Whitmore, T.C. A review of some aspects of tropical rain forest seedling ecology with suggestions for further enquiry. Man Biosph. Ser. 1996, 17, 3–40. [Google Scholar]
- Franklin, J.F.; Spies, T.A.; Van Pelt, R.; Carey, A.B.; Thornburgh, D.A.; Berg, D.R.; Lindenmayer, D.B.; Harmon, M.E.; Keeton, W.S.; Shaw, D.C.; et al. Disturbances and structural development of natural forest ecosystems with silvicultural implications, using Douglas-fir forests as an example. For. Ecol. Manag. 2002, 155, 399–423. [Google Scholar] [CrossRef]
- Nakashizuka, T. Regeneration of beech (Fagus crenata) after the simultaneous death of undergrowing dwarf bamboo (Sasa kurilensis). Ecol. Res. 1988, 3, 21–35. [Google Scholar] [CrossRef]
- Yamamoto, S.I. Gap characteristics and gap regeneration in subalpine old-growth coniferous forests, central Japan. Ecol. Res. 1995, 10, 31–39. [Google Scholar] [CrossRef]
- Tohoku Forest Management Bureau (MAFF). Status and Response to Abies mariesii Dieback in the Zao Region (Yamagata Prefecture Side); Official Report. Ministry of Agriculture, Forestry and Fisheries: Japan, 2024. Available online: https://yamagatayama.com/jyuhyo/wp-content/uploads/2024/01/%E8%94%B5%E7%8E%8B%E5%9C%B0%E5%9F%9F%EF%BC%88%E5%B1%B1%E5%BD%A2%E7%9C%8C%E5%81%B4%EF%BC%89%E3%81%AB%E3%81%8A%E3%81%91%E3%82%8B%E3%82%AA%E3%82%AA%E3%82%B7%E3%83%A9%E3%83%93%E3%82%BD%E3%81%AE%E6%9E%AF%E6%90%8D%E5%AE%9F%E6%85%8B%E3%81%A8%E5%AF%BE%E5%BF%9C%E7%8A%B6%E6%B3%81%EF%BC%88%E6%9D%B1%E5%8C%97%E6%A3%AE%E6%9E%97%E7%AE%A1%E7%90%86%E5%B1%80%EF%BC%89.pdf (accessed on 9 October 2025).
- Barbosa, P.; Hines, J.; Kaplan, I.; Martinson, H.; Szczepaniec, A.; Szendrei, Z. Associational resistance and associational susceptibility: Having right or wrong neighbors. Annu. Rev. Ecol. Evol. Syst. 2009, 40, 1–20. [Google Scholar] [CrossRef]
- Jensen, A.M.; Götmark, F.; Löf, M. Shrubs protect oak seedlings against ungulate browsing in temperate broadleaved forests of conservation interest: A field experiment. For. Ecol. Manag. 2012, 266, 187–193. [Google Scholar] [CrossRef]
- Deng, J.; Fang, S.; Fang, X.; Jin, Y.; Kuang, Y.; Lin, F.; Liu, J.; Ma, J.; Nie, Y.; Ouyang, S.; et al. Forest understory vegetation study: Current status and future trends. For. Res. 2023, 3, 6. [Google Scholar] [CrossRef]
- Narukawa, Y.; Yamamoto, S. Effects of dwarf bamboo (Sasa sp.) and forest floor microsites on conifer seedling recruitment in a subalpine forest, Japan. For. Ecol. Manag. 2002, 163, 61–70. [Google Scholar] [CrossRef]
- Walck, J.L.; Hidayati, S.N.; Dixon, K.W.; Thompson, K.; Poschlod, P. Climate change and plant regeneration from seed. Glob. Change Biol. 2011, 17, 2145–2161. [Google Scholar] [CrossRef]
- Johnson, A.C.; Yeakley, J.A. Microsites and climate zones: Seedling regeneration in the alpine treeline ecotone worldwide. Forests 2019, 10, 864. [Google Scholar] [CrossRef]
- Seki, T.; Ohta, S.; Fujiwara, T.; Nakashizuka, T. Growth allocation between height and stem diameter in nonsuppressed reproducing Abies mariesii trees. Plant Species Biol. 2013, 28, 146–155. [Google Scholar] [CrossRef]
- Daskalakou, E.N.; Koutsovoulou, K.; Ioannidis, K.; Koulelis, P.P.; Ganatsas, P.; Thanos, C.A. Masting and regeneration dynamics of Abies cephalonica, the Greek endemic silver fir. Seed Sci. Res. 2019, 29, 227–237. [Google Scholar] [CrossRef]
- Kautz, M. On correcting the time-lag bias in aerial-surveyed bark beetle infestation data. For. Ecol. Manag. 2014, 322, 78–88. [Google Scholar] [CrossRef]
- Trautwein, J.F.; Rohde, L.R.; Militz, H.; Brischke, C. Outer appearance of bark-beetle-infested stands of Norway spruce after different standing storage durations: A case study in the Harz Mountains, Germany. Eur. J. For. Res. 2025, 36, 1–17. [Google Scholar] [CrossRef]
- Schiller, A.; Udelhoven, J.; Götte, P.; Förster, F.M.; Köhler, I.; Thiel, C. Early detection of bark beetle infestations in Central Europe using deep learning-based reconstructions of irregular Sentinel-2 time series. Remote Sens. Environ. 2025, 321, 114226. [Google Scholar] [CrossRef]
- Rodman, K.C.; Andrus, R.A.; Carlson, A.R.; Carter, T.A.; Chapman, T.B.; Coop, J.D.; Fornwalt, P.J.; Gill, N.S.; Harvey, B.J.; Hoffman, A.E.; et al. Rocky Mountain forests are poised to recover following bark beetle outbreaks but with altered composition. J. Ecol. 2022, 110, 1851–1865. [Google Scholar] [CrossRef]
- FOREST EUROPE. Managing Bark Beetle Outbreaks in the 21st Century: Policy Brief. 2023. Available online: https://foresteurope.org/wp-content/uploads/2023/07/Policy-brief-Managing-bark-beetle-outbreaks-in-the-21st-century.pdf (accessed on 9 October 2025).
- Holl, K.D.; Aide, T.M. When and where to actively restore ecosystems? For. Ecol. Manag. 2011, 261, 1558–1563. [Google Scholar] [CrossRef]
- Chazdon, R.L. Beyond deforestation: Restoring forests and ecosystem services on degraded lands. Science 2008, 320, 1458–1460. [Google Scholar] [CrossRef]
- Kudo, G.; Kawai, Y.; Amagai, Y.; Winkler, D.E. Degradation and recovery of an alpine plant community: Experimental removal of an encroaching dwarf bamboo. Alp. Bot. 2017, 127, 75–83. [Google Scholar] [CrossRef]
- Goodbody, T.R.; Coops, N.C.; Senf, C.; Seidl, R. Airborne laser scanning to optimize the sampling efficiency of a forest management inventory in south-eastern Germany. Ecol. Indic. 2023, 157, 111281. [Google Scholar] [CrossRef]
Disclaimer/Publisher’s Note: The statements, opinions and data contained in all publications are solely those of the individual author(s) and contributor(s) and not of MDPI and/or the editor(s). MDPI and/or the editor(s) disclaim responsibility for any injury to people or property resulting from any ideas, methods, instructions or products referred to in the content. |
© 2025 by the authors. Licensee MDPI, Basel, Switzerland. This article is an open access article distributed under the terms and conditions of the Creative Commons Attribution (CC BY) license (https://creativecommons.org/licenses/by/4.0/).