Highlights
What are the main findings?
- SIFT + LightGlue outperforms traditional methods in terms of the number and spatial distribution of tiepoints/triplets in UAV images.
- SIFT + LightGlue maintains reprojection accuracy while achieving greater robustness of TIN mosaics.
What are the implications of the main findings?
- SIFT + LightGlue enables fast TIN-based mosaicking even in low-texture regions, producing continuous triangulations with fewer voids.
- Adopting SIFT + LightGlue reduces or removes TIN post-processing (e.g., pseudo-tiepoints), enabling faster, more reliable mosaics.
Abstract
Recent advances in UAV (Unmanned Aerial Vehicle)-based remote sensing have significantly enhanced the efficiency of monitoring and managing agricultural and forested areas. However, the low-altitude and narrow-field-of-view characteristics of UAVs make robust image mosaicking essential for generating large-area composites. A TIN (triangulated irregular network)-based mosaicking framework is herein proposed to address this challenge. A TIN-based mosaicking method constructs a TIN from extracted tiepoints and the sparse point clouds generated by bundle adjustment, enabling rapid mosaic generation. Its performance strongly depends on the quality of tiepoint extraction. Traditional matching combinations, such as SIFT with Brute-Force and SIFT with FLANN, have been widely used due to their robustness in texture-rich areas, yet they often struggle in homogeneous or repetitive-pattern regions, leading to insufficient tiepoints and reduced mosaic quality. More recently, deep learning-based methods such as LightGlue have emerged, offering strong matching capabilities, but their robustness under UAV conditions involving large rotational variations remains insufficiently validated. In this study, we applied the publicly available LightGlue matcher to a TIN-based UAV mosaicking pipeline and compared its performance with traditional approaches to determine the most effective tiepoint extraction strategy. The evaluation encompassed three major stages—tiepoint extraction, bundle adjustment, and mosaic generation—using UAV datasets acquired over diverse terrains, including agricultural fields and forested areas. Both qualitative and quantitative assessments were conducted to analyze tiepoint distribution, geometric adjustment accuracy, and mosaic completeness. The experimental results demonstrated that the hybrid combination of SIFT and LightGlue consistently achieved stable and reliable performance across all datasets. Compared with traditional matching methods, this combination detected a greater number of tiepoints with a more uniform spatial distribution while maintaining competitive reprojection accuracy. It also improved the continuity of the TIN structure in low-texture regions and reduced mosaic voids, effectively mitigating the limitations of conventional approaches. These results demonstrate that the integration of LightGlue enhances the robustness of TIN-based UAV mosaicking without compromising geometric accuracy. Furthermore, this study provides a practical improvement to the photogrammetric TIN-based UAV mosaicking pipeline by incorporating a LightGlue matching technique, enabling more stable and continuous mosaicking even in challenging low-texture environments.
1. Introduction
Recently, remote sensing using aircraft, satellites, and unmanned aerial vehicles (UAVs) has been actively utilized for monitoring and managing agricultural and forested areas. Among these platforms, UAVs are widely used due to their cost-effectiveness and operational flexibility. UAV-based monitoring facilitates rapid detection of crop anomalies and wildfires and enables timely interventions. However, due to their low-altitude flight characteristics, UAV images have a limited coverage area. To address this limitation, many UAV mosaicking techniques have been developed [1,2,3]. They can generate composite images over a large area. However, they require an external elevation dataset or large computation to produce one internally.
In our previous work, we developed a technique for rapid mosaic generation without an external elevation dataset [4,5]. We eliminated the need to produce an internal elevation dataset by forming a triangulated irregular network (TIN) of adjusted tiepoints. Initial tiepoints were generated through feature matching. They were adjusted through a rigorous bundle adjustment process [6], and their 3D ground coordinates were obtained. The adjusted tiepoints with 3D ground coordinates were used to form a TIN. Each triangular facet within the TIN was used for image stitching and mapping to a mosaic plane.
This technique enables very fast mosaic generation without requiring external elevation data. However, its performance depends on having a sufficient number of evenly distributed tiepoints. Since the TIN-based mosaicking method relies on traditional feature-matching techniques, it is often affected by their limitations in low-texture or repetitive-pattern environments, where extracting adequate tiepoints is challenging [7].
To address this limitation, this study evaluates the applicability of LightGlue-based matching combinations [8] within a photogrammetric TIN-based UAV mosaicking framework. These combinations use the publicly available LightGlue matcher exactly as provided, without any modification.
The evaluation systematically examines how these LightGlue-based matching combinations perform throughout the TIN-based UAV mosaicking pipeline. We assess their strengths at each stage—tiepoint extraction, bundle adjustment, TIN construction, and final mosaic generation—by comparing them with traditional matching methods. In addition, we evaluate whether these combinations can reduce the need for additional post-processing, which is often required in traditional TIN-based mosaicking workflows.
Overall, this study makes two primary contributions to the literature. First, it provides a comprehensive comparative evaluation of LightGlue-based matching combinations within a photogrammetry-based UAV TIN mosaicking pipeline, assessing their behavior under UAV-specific challenging conditions such as low-texture regions and large rotational variations.
Second, it examines whether these matching combinations can alleviate tiepoint sparsity and TIN discontinuities commonly observed with traditional methods, thereby providing practical insight into their potential to improve the stability and reliability of TIN-based mosaic generation.
2. Related Work
2.1. Traditional Tiepoint Extraction Method
In TIN-based image mosaicking, the accurate extraction of tiepoints is a critical factor that determines the geometric consistency and completeness of the resulting mosaic. These tiepoints are typically obtained through the combination of feature detectors and matching algorithms. Traditional feature-matching approaches commonly rely on local feature descriptors such as SIFT, SURF, and ORB [9,10,11], combined with nearest-neighbor (NN) search strategies implemented through Brute-Force or FLANN-based matchers [12].
Among these methods, SIFT is widely recognized for its robustness to scale changes, rotation, illumination variations, noise, and affine distortions. In prior research, SIFT-based matching has been shown to provide superior or competitive performance under a wide range of imaging conditions [13].
Despite these advantages, the combination of SIFT and nearest-neighbor matching has been repeatedly reported to perform poorly in low-texture or repetitive-pattern environments [14,15,16]. This issue becomes particularly pronounced in UAV imagery of forested areas, where the visual appearance between overlapping images is highly similar, making stable correspondence identification difficult [7].
These limitations result in uneven tiepoint distribution within the TIN construction process of UAV mosaicking. Such irregular distribution may enlarge triangular facets or leave void regions within the TIN, ultimately increasing the need for post-processing or causing mosaic gaps in the final output [5].
2.2. LightGlue-Based Tiepoint Extraction Method
Recent advances in deep learning-based matching algorithms have introduced new approaches to overcome the limitations of traditional methods. SuperGlue, for example, leverages a graph neural network (GNN) to model spatial and contextual relationships between features [17]. The combination of SuperPoint and SuperGlue [18] has been proposed as an alternative to the traditional tiepoint extraction method and has also been applied to UAV image stitching tasks [19].
LightGlue was introduced as a successor to SuperGlue [8]. By employing a transformer-based architecture and an adaptive early-termination strategy driven by match confidence, LightGlue achieves both high accuracy and computational efficiency.
It has therefore been widely recognized as a state-of-the-art matcher in the image feature matching domain. The original LightGlue paper reported that, among various evaluated detector–matcher configurations, the SuperPoint and LightGlue combination yielded the best matching performance. However, despite LightGlue’s architectural flexibility allowing integration with various feature detectors, its performance when paired with detectors other than SuperPoint has not been thoroughly analyzed.
Recent studies have also shown that LightGlue can produce more valid correspondences and achieve higher matching success rates than SIFT-based traditional methods under challenging conditions such as wide baselines, strong illumination changes, and high-resolution imagery [20,21]. Furthermore, LightGlue-based pipelines have been applied to practical image stitching tasks, demonstrating matching robustness [22].
Nevertheless, the performance of LightGlue-based combinations has not yet been systematically evaluated in photogrammetric UAV mosaicking pipelines, such as TIN-based mosaicking. Moreover, it remains unclear how LightGlue behaves in UAV-specific challenging environments, such as low-texture regions (forests and agricultural fields) or severe rotational variations. It is also not well demonstrated how these conditions influence tiepoint distribution, TIN stability, and the final mosaic quality.
3. Materials
In this study, experiments were conducted using images captured by Phantom 4 (DJI, Shenzhen, China) and senseFly eBee UAVs (senseFly, Cheseaux-sur-Lausanne, Switzerland). Table 1 summarizes the specifications of the datasets employed. All datasets were acquired at flight altitudes ranging from 100 m to 200 m, with forward and side overlaps of approximately 70–80%. The images were natural color composite (Red, Green, Blue) products, and each dataset was accompanied by initial exterior orientation parameters (EOPs) and interior orientation parameters (IOPs).

Table 1.
Descriptions of the datasets.
Three experimental datasets were designed to evaluate the performance of tiepoint extraction algorithms in low-texture environments. Among them, one dataset contains texture-rich areas, while the other two include challenging low-texture terrains. The datasets were acquired over Incheon, Gimje, and Anbandegi in the Republic of Korea. Representative images and enlarged sub-regions that illustrate the texture characteristics of each dataset are presented in Figure 1.
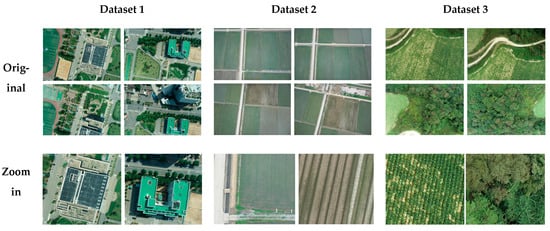
Figure 1.
Images from datasets.
Dataset 1 contains buildings and terrain features, providing favorable conditions for feature-based algorithms. Dataset 2 consists of agricultural images. As illustrated in Figure 1, aside from linear boundaries such as ridges between rice paddies, the central regions of the fields exhibit very limited texture. This characteristic indicates that agricultural imagery is dominated by large uniform and repetitive patterns with low distinctiveness. Dataset 3 includes mostly by mountainous areas. Mountainous regions may present features with fine textures such as leaves. However, the inconsistency of texture patterns around features between different images appear as noise. This issue is further worsened in temporally displaced images, where non-rigid leaf motion caused by wind and terrain-induced displacements degrades the consistency.
4. Method
An overall flowchart of the UAV TIN based image mosaicking method used in this study is illustrated in Figure 2. The mosaic image processing workflow consists of three main stages.
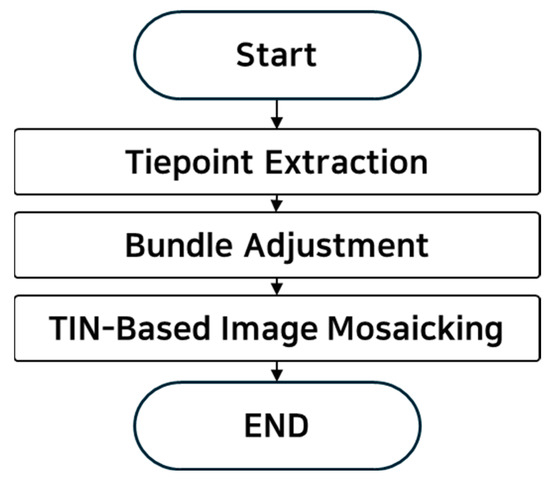
Figure 2.
Flowchart of UAV image mosaicking pipeline.
In the first step, feature points are detected across all images in the dataset using a feature extraction algorithm. Then, tiepoints are extracted by performing feature matching on sets of image pairs. We use traditional and deep learning-based feature extractors and matchers and compare their performances on tiepoint extraction and overall image mosaicking.
In the second step, the extracted tiepoints and the initial EOPs provided by UAV platforms are jointly optimized to refine the camera parameters and recover the 3D coordinates of tiepoints through a rigorous bundle adjustment process. The adjustment is performed under the coplanarity condition, minimizing the reprojection error between observed image points and their corresponding projections from the reconstructed 3D geometry [6].
In the final step, a TIN is constructed from the adjusted tiepoints with the 3D coordinates. Each TIN facet is used to stitch an image patch from original images, and the image patch is mapped to a mosaic plane. Details of each step are explained in the following subsections.
4.1. Tiepoint Extraction
Tiepoints are common feature points observed in overlapping regions of two or more images. To determine the geometric relationships between UAV images, it is crucial to extract tiepoints that are both accurate and robust, with an even spatial distribution. Therefore, selecting an appropriate tiepoint extraction algorithm is a key step in the mosaicking process. As illustrated in Figure 3, the tiepoint extraction workflow in this study consists of three main stages: (1) feature point detection, (2) image pair selection, and (3) feature matching. In this study, to identify the most suitable tiepoint extraction algorithm for TIN-based image mosaicking, we design different combinations of feature detection and matching methods.
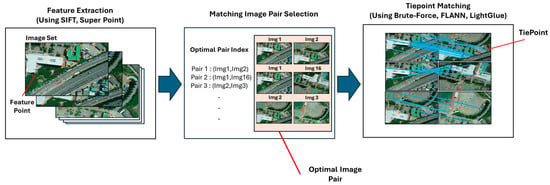
Figure 3.
Tiepoint extraction process.
For feature detection, two representative approaches are employed. First, the SIFT detector extracts keypoints by identifying local extrema in a multi-scale Difference-of-Gaussians pyramid. The descriptors are generated from local gradient orientations. This process ensures robustness to scale and rotation variations. Second, SuperPoint is a deep learning-based method that uses convolutional neural networks to simultaneously detect keypoints and generate descriptors. It provides higher adaptability to diverse image conditions.
For feature matching, we adopt three representative approaches. First, a Brute-Force matching approach compares all feature descriptors using distance metrics such as Euclidean distance. It provides simple and reliable results but becomes computationally intensive for large datasets. Second, a constrained matching approach, fast library for approximate nearest neighbors (FLANN) [12], improves the efficiency of matching by employing constraints, such as advanced indexing and approximation, for matching. As a result, it is favorable to large-scale imagery. Third, for the deep learning-based matching approach, LightGlue is used without any additional training or modification. It is employed as a pre-trained model that predicts correspondences through a transformer-based attention mechanism. LightGlue has demonstrated high matching accuracy and robustness under challenging conditions such as viewpoint or illumination changes [8].
To evaluate different tiepoint extraction strategies, matching algorithms are paired with each feature detector to form the combinations shown in Table 2: (1) SIFT with Brute-Force, (2) SIFT with FLANN, (3) SuperPoint with LightGlue, and (4) SIFT with LightGlue. Combinations (1) and (2) are included as widely used traditional baseline tiepoint extractors in UAV image matching. Combination (3) represents a recent AI-based detector–matcher pair that has been reported to achieve state-of-the-art performance in several studies [8,23]. Finally, combination (4) is designed as a hybrid approach. It combines the reliable keypoint detection and description capability of a traditional feature detector with the adaptive matching capability of a deep learning-based method.

Table 2.
Tiepoint Extraction Algorithm in Test.
The performance of each combination is then evaluated in terms of the number of tiepoints, their spatial distribution, their geometric accuracy, and their robustness to rotation. The number of tiepoints between two images and the number of triplet points observed in three or more images are evaluated to assess the performance of tiepoint matching algorithms [24]. Secondly, the spatial distribution of tiepoints is employed as an evaluation metric. As illustrated in Figure 4, each image is partitioned into uniform-sized cells. A cell is defined as “occupied” if it contained at least one tiepoint. The coverage ratio is then calculated as the proportion of occupied cells to the total number of cells.
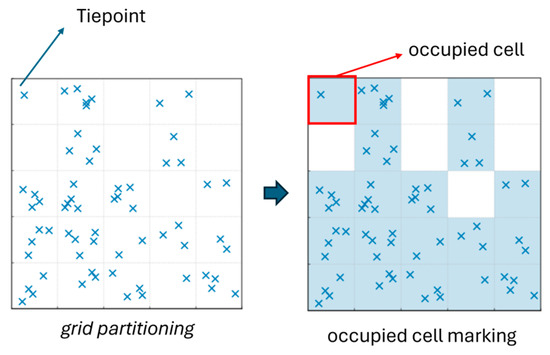
Figure 4.
Figure of coverage area calculation.
The third evaluation metric is the geometric accuracy of tiepoints. Geometric accuracy is quantified using the epipolar error. This error is defined as the distance of the image locations of tiepoints to their corresponding epipolar lines.
Finally, the last evaluation metric is robustness to image rotation. Due to the flight path of UAVs, the imagery is typically acquired by multiple strips with opposite orientations. As illustrated in Figure 5, adjacent strips may exhibit nearly 180° rotation differences around the z-axis. Tiepoints between different strips are essential because they serve as bridging constraints that establish the geometric relationship between strips. It is crucial to evaluate tiepoint extraction performance under rotational variations. To this end, intra-strip pairs (image pairs within the same strip) and inter-strip pairs (image pairs from adjacent strips) are chosen. The matching performance under each condition is then assessed quantitatively by comparing the number of detected matches and qualitatively by visually analyzing the matching results.
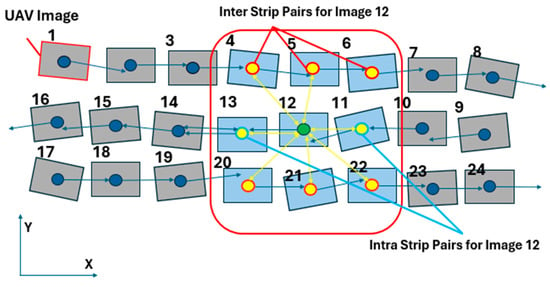
Figure 5.
Examples of image pair type (intra-strip, inter-strip) for Image 12.
4.2. Bundle Adjustment
Bundle adjustment is a process that refines both the EOPs of images and the 3D coordinates of tiepoints by minimizing geometric residuals. The georeferenced tiepoints obtained from this process directly influence the subsequent mosaic generation. In this study, coplanarity constraints are incorporated into the least-squares-based EOP estimation.
Based on this geometric constraint, the EOPs are iteratively refined using the least squares method. The adjustment system is constructed using the following linearized form (Equation (1)),
where denotes the weighting matrix for the coplanarity observation residuals, denotes the weighting matrix for the pseudo-observation constraints imposed on the EOP corrections, denotes the matrix of first-order partial derivatives of the coplanarity equation with respect to the EOPs, is the identity matrix, represents the residual of the coplanarity condition computed at the current estimates, denotes the constraint for the exterior orientation parameters (set to the zero vector in this study), and is the unknown correction vector to be estimated [6].
The unknown correction vector is initialized to zero and refined iteratively using a least-squares solution [25]. In this study, contains only the increments of the exterior orientation parameters (EOPs). These corrections are applied to update the EOPs, while the ground coordinates of tiepoints are simultaneously estimated [6]. In this study, bundle adjustment is performed using tiepoints generated from various combinations of tiepoint extraction algorithms.
The bundle adjustment performance of each tiepoint extraction algorithm is evaluated based on the number of georeferenced tiepoints, the spatial distribution of georeferenced tiepoints (coverage ratio), the reprojection error, and the Y-parallax. The number of georeferenced tiepoints is defined as the tiepoints with a reprojection error of less than 6 pixels, calculated using the refined EOPs and ground coordinates after bundle adjustment.
The spatial distribution of 3D points is assessed by defining a 20 × 20 grid based on the minimum and maximum X–Y coordinates of the ground area projected using the refined EOPs. Among these grid cells, only those located within the ROI, which corresponds to the area projected from the EOPs, are considered valid. The coverage ratio is then computed as the proportion of the ROI cells that contain at least one georeferenced tiepoint.
The reprojection error is defined as the difference between the observed tiepoint location and the reprojected position of the georeferenced tiepoint on the image plane. The Y-parallax was evaluated as the RMS values of the Y-parallax values of all pairwise tiepoints. This calculation was performed after each image pair was rectified to satisfy epipolar geometry.
4.3. TIN-Based Image Mosaicking
In this study, the TIN-based mosaicking method developed by Yoon and Kim [4,5] is employed. This approach connects irregularly distributed georeferenced tiepoints into facets using a Delaunay triangulation to represent the terrain, offering faster processing compared to conventional DEM-based mosaicking techniques. Specifically, the georeferenced points extracted in the previous step are used to construct a TIN surface model, and the original images are projected onto this model using an affine transformation, as illustrated in Figure 6.
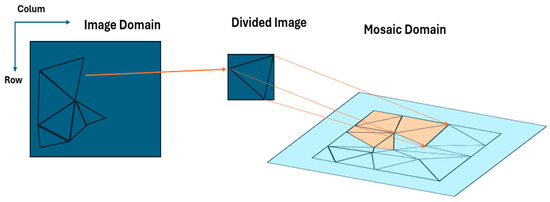
Figure 6.
Affine transformation-based mosaicking on TIN.
However, the accuracy of this method is highly dependent on the quality of the georeferenced tiepoints. If their accuracy is insufficient, misalignments or discrepancies may occur during image projection and the quality of the mosaic may be degraded. When the triangular facets of the TIN become excessively large, they may extend beyond the reference image coverage and create voids in the mosaic. Therefore, the uniformity and density of the triangular network are critical factors in determining the completeness of the final mosaic. To examine these issues, this study analyzes both the number and configuration of the generated triangles, with particular attention paid to misalignments along seamline boundaries where images are joined.
4.4. Experimental Setup and Parameter Configuration
All experiments were conducted on a workstation equipped with an Intel Core i7-11700 CPU, 32 GB RAM, and an NVIDIA RTX 3080 GPU running Windows 11. The implementation was developed in Python 3.10 using OpenCV 4.9.0 and PyTorch 2.2.0. SuperPoint and LightGlue were used with their official pretrained weights without any modification to ensure full reproducibility.
Prior to feature matching, all UAV images were resized to 2048 × 2048 pixels to improve computational efficiency while preserving sufficient spatial detail for reliable keypoint extraction.
SIFT was executed using the default OpenCV 4.9.0 configuration. To ensure dense keypoint coverage in high-resolution UAV images, the maximum number of features was set to 25,000. FLANN was configured with a KD-tree index (trees = 5) and a search parameter of 50 checks. The Brute-Force matcher used the L2 distance metric.
For geometric verification, outlier filtering was performed using RANSAC with the fundamental matrix. The RANSAC inlier threshold was set to 3 pixels.
5. Results
5.1. Tiepoint Extraction Result
The performance of tiepoint extraction algorithms directly affects the accuracy of im-age mosaicking, and insufficient tiepoints can lead to geometric distortions in the final output. As introduced in the methodology, four matching combinations were evaluated. The first two were traditional methods: SIFT with Brute-Force, which performs exhaustive descriptor matching, and SIFT with FLANN, which provides a faster approximate near-est-neighbor search. The third was SuperPoint with LightGlue, representing an AI-based approach. Finally, we examined a hybrid strategy that combines SIFT feature detection with LightGlue matching.
These combinations were assessed based on the four key metrics: the number of tiepoints, the coverage ratio, the epipolar error, and the rotation invariance. Dataset 1 (texture-rich areas) and Datasets 2 and 3 (low-texture agricultural and forested areas) were used to compare differences in tiepoint extraction performance under varying texture conditions. Figure 7 provides a qualitative assessment by visualizing the tiepoint distribution for each dataset, while the quantitative evaluation results are summarized in Table 3 (excluding rotation invariance) and Figure 8 (rotation invariance).
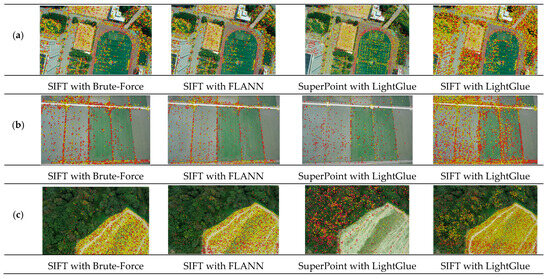
Figure 7.
Tiepoint results in images—(a): Dataset 1, (b): Dataset 2, (c): Dataset 3. Red points: tiepoints matched in only two images; yellow points: tiepoints matched in three or more images (triplets).

Table 3.
Tiepoint extraction experiment results.
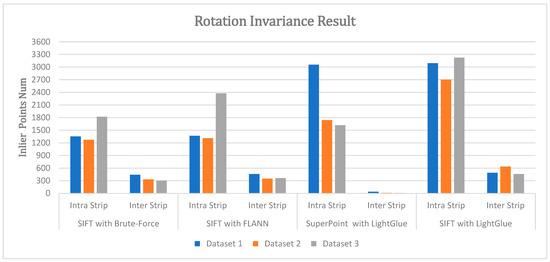
Figure 8.
Average number of tiepoints from intra-strip and inter-strip pairs.
First, the analysis was conducted by considering both the number of tiepoints and their spatial distribution. In Dataset 1, SuperPoint with LightGlue and SIFT with LightGlue extracted more tiepoints and triplets than traditional methods. In particular, SIFT with LightGlue extracted the largest number of tiepoints and triplets. The tiepoint coverage ratio exhibited a consistent pattern, in which SuperPoint with LightGlue and SIFT with LightGlue achieved over 90% and 80% coverage for tiepoints and triplets, respectively, whereas the traditional methods remained around 80% and 70%. This difference in coverage can be attributed to the distribution characteristics described below. As illustrated in Figure 7a, LightGlue-based methods exhibited a more uniform distribution than the traditional methods, even in low-texture regions such as flowerbeds or playgrounds.
In Dataset 2, which consists of agricultural fields, the performance differences became more pronounced. In terms of both the number of tiepoints and triplets, SuperPoint with LightGlue underperformed compared with traditional methods. By contrast, SIFT with LightGlue achieved the best performance. Notably, the number of triplets was more than two times that of the traditional methods. This increase enabled the extraction of a larger number of reliable correspondences.
The coverage ratio of tiepoints and triplets for the traditional methods dropped sharply by about 20 percentage points from those observed in Dataset 1, while simultaneously showing low performance of around 60% and 50%, respectively. In contrast, SIFT with LightGlue showed a relatively small decrease, approximately 10 percentage points, and successfully maintained over 80% and 70% coverage, confirming its robustness across the dataset. This difference in coverage is closely related to the distribution characteristics described below. As shown in Figure 7b, the traditional methods detected points mainly along linear boundaries such as field ridges, and although some points were extracted in the central areas of the farmland, their amount was negligible. In contrast, SIFT with LightGlue extracted points more uniformly, not only along the ridges but also throughout the central regions of the fields.
In Dataset 3, which consists of forested and mountainous terrain, results similar to those of Dataset 2 were observed. Likewise, SuperPoint with LightGlue extracted fewer tiepoints than the traditional methods, but it exhibited superior performance in terms of spatial distribution. SIFT with LightGlue extracted the largest number of tiepoints and triplets and also achieved the highest coverage ratio among the compared methods.
Compared to Dataset 1, the traditional methods exhibited relatively low performance, achieving tiepoint and triplet coverage ratios of around 60% and 50%, respectively. In contrast, SIFT with LightGlue showed a relatively slight decrease (about 6 percentage points) yet maintained over 80% tiepoints coverage and over 70% triplet coverage, demonstrating consistent performance. This difference appears to be due to the more uniform distribution achieved by LightGlue-based methods across mountainous terrain, as illustrated in Figure 7c.
The analysis of epipolar errors showed that the traditional methods consistently produced lower errors than the LightGlue-based methods across all datasets. SuperPoint with LightGlue exhibited errors 0.5–0.7 pixels larger than those of the traditional methods and showed the lowest geometric accuracy among the compared algorithms. In contrast, for Datasets 1 and 2, the difference between SIFT with LightGlue and the traditional methods was less than 0.1 pixels, indicating an essentially equivalent level of accuracy. In the case of Dataset 3, the difference increased slightly to within 0.2 pixels. This can be attributed to the characteristics of mountainous terrain, where multi-view geometric accuracy is inherently lower. While the traditional methods extracted few tiepoints in such areas, SIFT with LightGlue detected a large number of points, including some with relatively lower geometric accuracy.
These results reaffirm previous findings that LightGlue-based matching tends to yield slightly higher geometric errors compared to traditional approaches [26,27]. At the same time, they demonstrate that SIFT with LightGlue minimizes this difference and maintains a high level of geometric reliability.
Figure 8 presents the average number of inlier tiepoints from intra-strip and inter-strip pairs for each tiepoint extraction algorithm. As shown in Figure 8, traditional algorithms consistently secured around 300 matches in both the intra-strip and inter-strip groups, demonstrating robust performance even under extreme rotational conditions. In contrast, SuperPoint with LightGlue detected a large number of matches in the intra-strip group but only a very limited number in the inter-strip group, clearly revealing its vulnerability to rotational changes.
By comparison, SIFT with LightGlue achieved the highest number of matches in the intra-strip group, and although it showed some decrease in the inter-strip group, it still maintained more than 400 stable matches across all datasets. This difference is also evident in the visualizations of Figure 9. While SuperPoint with LightGlue showed almost no distribution of tiepoints in the inter-strip areas, SIFT with LightGlue exhibited uniform tiepoint distributions across both groups. These results indicate that SIFT with LightGlue provides the most consistent and robust matching performance under rotational variations in UAV imagery.
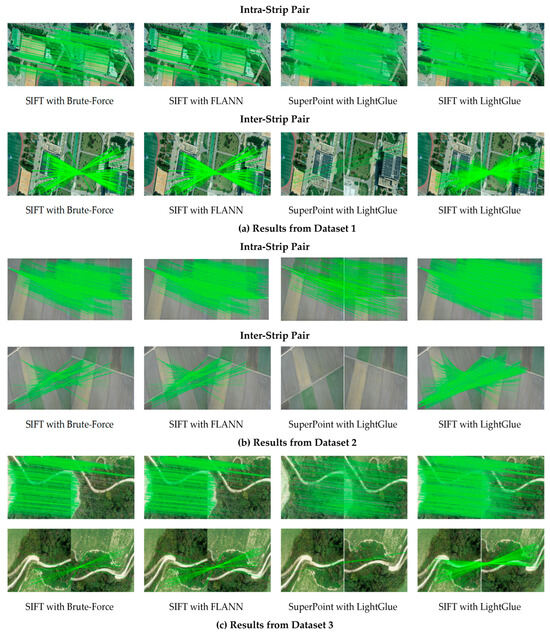
Figure 9.
Matching results in rotation invariance.
The combination of SIFT and LightGlue achieved the highest tiepoint counts and proved to be the most robust across both extreme rotational conditions and low-texture environments. In addition, it ensured a more uniform spatial distribution of tiepoints compared to the traditional methods, reducing gaps in coverage. Although its geometric accuracy was slightly lower than that of traditional methods, it still maintained a comparable level of performance under challenging imaging scenarios.
5.2. Bundle Adjustment Result
Bundle adjustment is a process that directly reveals how the quality of extracted tie-points influences the accuracy of geometric modeling and mosaicking. In this study, the tiepoints extracted in the previous step and the initial EOPs were used as inputs to perform bundle adjustment.
Table 4 presents the results of bundle adjustment obtained using tiepoints extracted with the four tiepoint extraction algorithms. After bundle adjustment, tiepoints whose reprojection errors exceeded a threshold were removed from further processing. Remaining tiepoints were georeferenced using the 3D ground coordinates obtained through bundle adjustment. To evaluate the uniformity of tiepoints after adjustment, the number and spatial distribution of georeferenced tiepoints were quantitatively analyzed. Their distribution patterns and densities were visualized in Figure 10, Figure 11 and Figure 12. In addition, reprojection error and Y-parallax of georeferenced tiepoints on stereo image pairs were measured to assess adjustment accuracy.

Table 4.
Results of bundle adjustment.
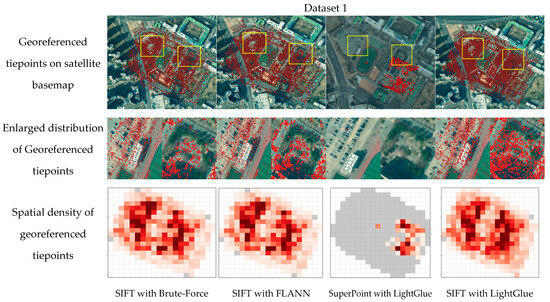
Figure 10.
Georeferenced tiepoints on satellite basemap and spatial density of georeferenced tiepoints for Dataset 1. Yellow frames indicate the enlarged areas; dark red indicates higher density, light red indicates lower density, and gray indicates areas without georeferenced tiepoints.
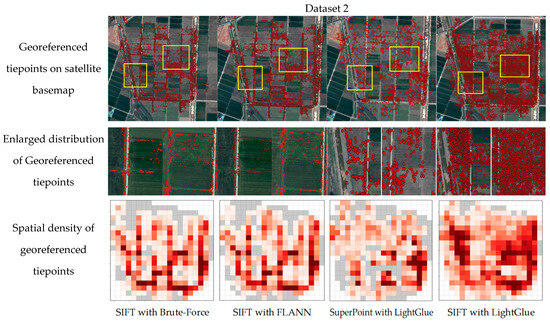
Figure 11.
Georeferenced tiepoints on satellite basemap and spatial density of georeferenced tiepoints for Dataset 2. Yellow frames indicate the enlarged areas; dark red indicates higher density, light red indicates lower density, and gray indicates areas without georeferenced tiepoints.
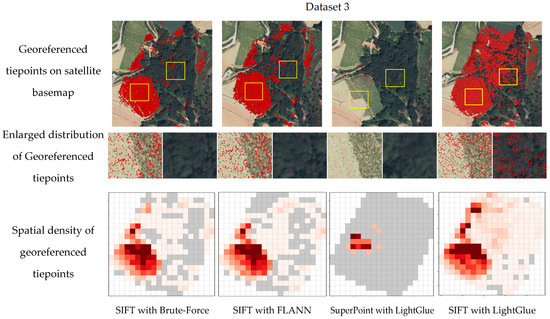
Figure 12.
Georeferenced tiepoints on satellite basemap and spatial density of georeferenced tiepoints for Dataset 3. Yellow frames indicate the enlarged areas; dark red indicates higher density, light red indicates lower density, and gray indicates areas without georeferenced tiepoints.
In Dataset 1 (buildings and flowerbeds), the traditional algorithms achieved a coverage ratio of approximately 80%, which was a relatively high value. The georeferenced tiepoints were extracted fairly uniformly across most regions. However, in low-texture areas such as flowerbeds, several gaps appeared where few matching points were generated (Figure 10). This tendency was consistent with the tendency of tiepoint extraction explained earlier.
In contrast, SIFT with LightGlue extracted about 2 times more georeferenced tiepoints than the traditional algorithms. This method achieved the best performance among the tested methods with a coverage ratio of 84%. More importantly, this method was able to secure tiepoints even in low-texture regions such as flowerbeds, where the traditional methods often failed (Figure 10). Such uniformity was preserved after bundle adjustment, resulting in georeferenced tiepoints that were evenly distributed across the entire scene. Consequently, this dataset contained relatively texture-rich regions where the traditional methods performed stably. However, SIFT with LightGlue successfully generated georeferenced points even in areas where traditional matching failed. As a result, the spatial bias was mitigated, and the point density became globally uniform.
In Dataset 2, the traditional algorithms produced tiepoints that were concentrated along edge regions such as ridges and field boundaries (Figure 11). Although some tiepoints were also extracted in the central areas characterized by repetitive patterns and low texture, large vacant zones were still observed. This limitation was also reflected in the distribution of georeferenced tiepoints after bundle adjustment, where large blank regions appeared in the central parts. Consequently, the coverage ratio dropped sharply to about 70–71%, and the visualization revealed substantial gaps across the farmland.
In contrast, SIFT with LightGlue was able to reliably secure a sufficient number of tiepoints not only along ridges but also across central farmland regions. This advantage was retained in the distribution of georeferenced tiepoints after bundle adjustment, maintaining a coverage ratio above 80% with consistent performance. The density distribution was also relatively uniform, with only a few sparse patches in some farmland areas and no completely blank regions.
Dataset 3 represents a mixed area of farmland and mountainous terrain. In the farmland regions where crops were clearly visible, the traditional algorithms successfully generated abundant tiepoints. This result is illustrated in Figure 12. After bundle adjustment, these tiepoints were preserved, resulting in a high density of georeferenced points in agricultural areas. However, in the mountainous regions, the traditional methods extracted only sparse tiepoints. After adjustment, the georeferenced distribution remained limited. Consequently, large portions of the terrain were insufficiently covered.
In contrast, SIFT with LightGlue extracted tiepoints more uniformly across both farmland and mountainous terrain. This advantage carried over after bundle adjustment, achieving a coverage ratio exceeding 80%. The density heatmap further confirmed this improvement. It showed a globally consistent distribution of points, with only a few sparse zones remaining along the outer boundaries of the mountainous a reas.
SuperPoint with LightGlue consistently exhibited a lack of robustness to rotation across all datasets. This weakness led to unstable georeferenced tiepoints. Consequently, the bundle adjustment could not be performed reliably.
In addition to spatial distribution, bundle adjustment accuracy was also assessed by analyzing reprojection error and Y-parallax. In Datasets 1 and 2, the traditional methods performed slightly better than SIFT with LightGlue, but the differences remained below 0.1 pixels. However, in the mountainous terrain dataset, SIFT with LightGlue achieved about 0.2 pixels higher accuracy than the traditional methods. This improvement can be attributed to the limitations of the traditional algorithms. The tiepoints they produced were clustered only in a few localized regions. As a result, the formation of a reliable geometric model was restricted. In contrast, the SuperPoint with LightGlue algorithm consistently yielded the lowest accuracy in terms of both reprojection error and Y-parallax.
Overall, these results demonstrate that SIFT with LightGlue provided comparable bundle adjustment accuracy to the traditional methods, while achieving greater robustness and uniformity in tiepoint distribution, particularly in texture-poor regions. In contrast, SuperPoint with LightGlue consistently showed poor robustness to rotation, resulting in unstable tiepoints and clear limitations in bundle adjustment.
5.3. Mosaic Results
Building upon the adjusted georeferenced tiepoints, we evaluated their contribution to the quality of the final mosaics. The georeferenced tiepoints were used to generate mosaics based on a Delaunay TIN. In this section, the performance of each method was compared by the number of triangles constructed from the georeferenced tiepoints, the total processing time, and the visual quality of seamline boundaries. The results are summarized in Table 5. Figure 13, Figure 14 and Figure 15 present the TINs constructed from the georeferenced tiepoints prior to mosaic generation. These figures allowed assessment of triangle distribution, large-triangle formation, and spatial patterns of unconstructed regions. Figure 16, Figure 17 and Figure 18 illustrate the final mosaics. Visual inspection of misregistration and distortion was performed along seamline boundaries, with enlarged views provided for representative terrain types such as developed areas, farmland, and forest.

Table 5.
Results of mosaic process.
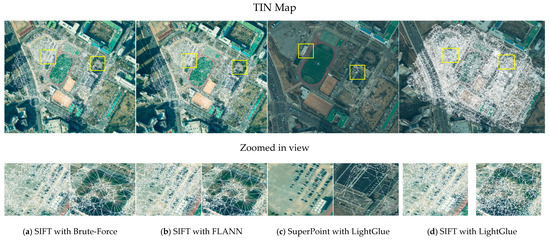
Figure 13.
TIN results for Dataset 1.
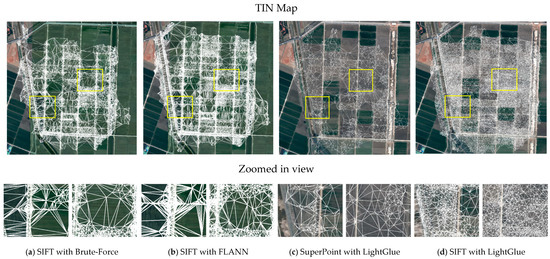
Figure 14.
TIN results for Dataset 2.
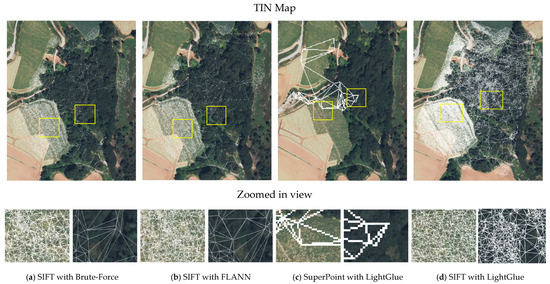
Figure 15.
TIN results for Dataset 3.
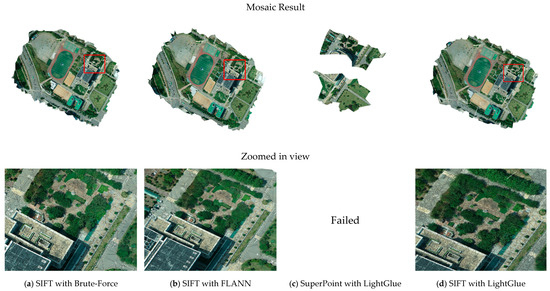
Figure 16.
Mosaic results for Dataset 1.
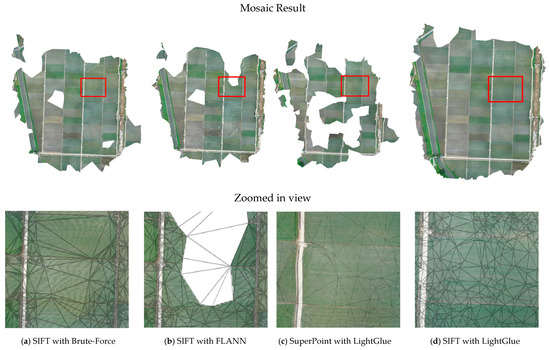
Figure 17.
Mosaic results for Dataset 2.
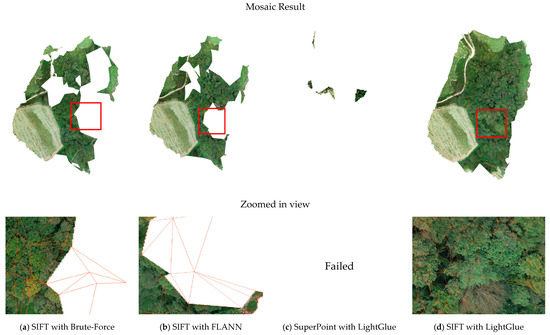
Figure 18.
Mosaic results for Dataset 3.
Dataset 1 contained abundant artificial structures and linear boundaries. In this dataset, both the traditional matching method and SIFT with LightGlue produced dense Delaunay triangulations across the entire area (Figure 13). Although the traditional method tended to generate slightly larger triangles in low-texture regions, the final mosaics from both methods were stably generated without voids (Figure 16). No noticeable misregistration or distortion was observed along the seamline boundaries.
In Dataset 2, which mainly consisted of low-texture farmland, the differences between the two methods became more pronounced. With the traditional methods, georeferenced tiepoints were mainly concentrated along ridges and boundaries. As a result, many areas in the central parts of the farmland were not covered by the triangulations (Figure 14). This led to the formation of large and sparse triangles across the dataset, which was primarily composed of paddy fields. This discontinuity in the TIN directly led to voids in the final mosaic (Figure 17).
In contrast, SIFT with LightGlue secured a more uniform distribution of points in both Areas (Figure 14, SIFT with LightGlue), which significantly increased the number of triangles and allowed the TIN to continuously cover the entire paddy blocks. As a result, the mosaic was generated without voids (Figure 17, SIFT with LightGlue). Visual inspection of the seamline boundaries revealed no evident distortions in both approaches.
In Dataset 3, a tendency consistent with the results from Dataset 2 was observed. SIFT with LightGlue yielded the highest number of Delaunay triangles, whereas the traditional matching methods produced only about half as many. In farmland with clearly identifiable crop patterns (Figure 15a,b), both approaches without SuperPoint with LightGlue achieved relatively dense triangulations. However, in forested and mountainous slopes, the terrain posed serious challenges. Under these conditions, the traditional methods frequently failed to establish continuous TIN structures. Instead, they produced large and discontinuous triangles. This deficiency was attributed to the insufficient density and non-uniform distribution of georeferenced tiepoints in mountainous terrain. Consequently, discontinuities in the TIN led to localized voids in the final mosaic (Figure 18a,b).
In contrast, SIFT with LightGlue maintained a stable and uniformly distributed set of georeferenced tiepoints, even in forested regions (Figure 15d). This allowed the construction of a continuous and dense TIN. Consequently, the final mosaic was generated without voids (Figure 18d). This demonstrated improved robustness under challenging terrain conditions.
SuperPoint combined with LightGlue exhibited insufficient robustness to rotation and showed reduced point accuracy. As a result, the method produced extremely sparse distributions of georeferenced tiepoints across all datasets. Consequently, the TIN was only partially constructed or consisted of large, widely spaced triangles. The final mosaic showed limited coverage. In particular, for Datasets 1 and 3, TIN construction and mosaicking failed. Within the scope of this study, this combination could not be regarded as a reliable method for stable mosaic generation.
In summary, SIFT with LightGlue produced the largest number of Delaunay triangles across all three datasets. It maintained the continuity and uniformity of the TIN even in low-texture areas such as farmland and forested regions. As a result, the method effectively reduced voids in the mosaics. Visual inspection of seamline boundaries in each dataset revealed no noticeable distortions for either method, and the differences between them primarily originated from coverage (presence or absence of voids) and TIN continuity.
6. Discussion
In this study, TIN mosaics were generated using LightGlue-based tiepoint extraction methods and traditional tiepoint extraction methods. Each method was then subjected to a step-by-step comparative analysis throughout the TIN mosaic generation process.
SIFT with LightGlue demonstrated consistent tiepoint extraction performance, securing uniformly distributed points even in low-texture regions such as farmland and forested slopes. This may be attributed to LightGlue’s transformer-based matching mechanism, which enhances correspondence reliability in environments where overlapping UAV images exhibit highly repetitive patterns and homogeneous textures.
In terms of bundle adjustment accuracy, the traditional method showed a slight advantage. However, the difference was limited to below 0.1 pixels. SIFT with LightGlue preserved spatial uniformity and multi-view consistency. This ensured stable distributions of georeferenced tiepoints even after adjustment.
These advantages translated into clear differences at the mosaicking stage. The traditional method produced discontinuous TIN structures and visible voids. However, SIFT with LightGlue generated continuous triangulations that effectively suppressed voids in the final mosaics. Although SIFT with LightGlue required somewhat more computation than the traditional method, the overall results were nearly identical. This additional cost was justified by its reduced coverage loss and improved TIN continuity.
Overall, the comparative analysis demonstrated that SIFT with LightGlue provides the most balanced and reliable performance for TIN-based UAV mosaicking. It consistently achieved uniformly distributed tiepoints across all datasets, maintained stable multi-view geometry after bundle adjustment, and produced continuous TIN structures with fewer voids in the final mosaics.
These results highlight how improvements in tiepoint uniformity and TIN continuity directly contribute to reducing voids and stabilizing the overall mosaicking process, especially in low-texture environments where traditional methods often struggle.
7. Conclusions
This study systematically evaluated LightGlue-based and traditional tiepoint extraction methods within a TIN-based UAV mosaicking framework. The results show that SIFT with LightGlue achieves superior tiepoint distribution and stronger TIN continuity compared with conventional matching methods. It also maintains bundle adjustment accuracy within a comparable range.
These improvements led to reduced mosaic voids and more reliable TIN-based mosaics, indicating that SIFT–LightGlue is a highly effective matching strategy for UAV mosaicking, particularly in low-texture environments.
In this study, we observed that the SuperPoint–LightGlue pipeline underperforms in UAV scenes with substantial in-plane rotation, which is consistent with prior work reporting the rotation sensitivity of SuperPoint [28]. However, we did not fine-tune SuperPoint for this domain or apply rotation-aware preprocessing, so there is room for improvement with appropriate fine-tuning and preprocessing. Accordingly, in future work we will systematically evaluate domain-specific fine-tuning and preprocessing strategies such as rotation augmentation.
Future research should also assess the performance of SIFT with LightGlue on very dense urban environments with high-rise structures and large elevation variations.
Author Contributions
Conceptualization, S.K. and T.K.; methodology, S.K.; software, S.K. and T.K.; validation, S.K.; formal analysis, S.K.; investigation, S.K. and T.K.; data curation, S.K. and H.K.; supervision, T.K.; writing—original draft preparation, S.K.; writing—review and editing, S.B. and T.K. All authors have read and agreed to the published version of the manuscript.
Funding
This work was carried out with the support of “Cooperative Research Program for Agriculture Science and Technology Development (Project No. RS-2021-RD009566)” Rural Development Administration, Republic of Korea, and was also supported by the Korea Agency for Infrastructure Technology Advancement (KAIA) grant funded by the Ministry of Land, Infrastructure and Transport (Grant RS-2022-00155763).
Data Availability Statement
The data is contained within the article.
Conflicts of Interest
The authors declare no conflicts of interest.
References
- Xing, C.; Wang, J.; Xu, Y. A method for building a mosaic with UAV images. Int. J. Inf. Eng. Electron. Bus. 2010, 2, 9–15. [Google Scholar] [CrossRef]
- Turner, D.; Lucieer, A.; Watson, C. An automated technique for generating georectified mosaics from ultra-high resolution unmanned aerial vehicle (UAV) imagery, based on structure from motion (SfM) point clouds. Remote Sens. 2012, 4, 1392–1410. [Google Scholar] [CrossRef]
- Zhao, J.; Zhang, X.; Gao, C.; Qiu, X.; Tian, Y.; Zhu, Y.; Cao, W. Rapid mosaicking of unmanned aerial vehicle (UAV) images for crop growth monitoring using the SIFT algorithm. Remote Sens. 2019, 11, 1226. [Google Scholar] [CrossRef]
- Yoon, S.-J.; Kim, T. Seamline optimization based on triangulated irregular network of tiepoints for fast UAV image mosaicking. Remote Sens. 2024, 16, 1738. [Google Scholar] [CrossRef]
- Yoon, S.-J.; Kim, T. Fast UAV image mosaicking by a triangulated irregular network of bucketed tiepoints. Remote Sens. 2023, 15, 5782. [Google Scholar] [CrossRef]
- McGlone, J.C. Manual of Photogrammetry; American Society for Photogrammetry and Remote Sensing: Bethesda, MD, USA, 2013. [Google Scholar]
- Wu, T.; Hung, I.-K.; Xu, H.; Yang, L.; Wang, Y.; Fang, L.; Lou, X. An Optimized SIFT-OCT Algorithm for Stitching Aerial Images of a Loblolly Pine Plantation. Forests 2022, 13, 1475. [Google Scholar] [CrossRef]
- Lindenberger, P.; Sarlin, P.-E.; Pollefeys, M. Lightglue: Local feature matching at light speed. In Proceedings of the IEEE/CVF International Conference on Computer Vision, Paris, France, 2–6 October 2023; pp. 17627–17638. [Google Scholar]
- Bay, H.; Ess, A.; Tuytelaars, T.; Van Gool, L. Speeded-up robust features (SURF). Comput. Vis. Image Underst. 2008, 110, 346–359. [Google Scholar] [CrossRef]
- Rublee, E.; Rabaud, V.; Konolige, K.; Bradski, G. ORB: An efficient alternative to SIFT or SURF. In Proceedings of the 2011 International Conference on Computer Vision, Barcelona, Spain, 6–13 November 2011; pp. 2564–2571. [Google Scholar]
- Lowe, D.G. Distinctive image features from scale-invariant keypoints. Int. J. Comput. Vis. 2004, 60, 91–110. [Google Scholar] [CrossRef]
- Muja, M.; Lowe, D.G. Fast approximate nearest neighbors with automatic algorithm configuration. VISAPP 2009, 2, 2. [Google Scholar]
- Mikolajczyk, K.; Schmid, C. A performance evaluation of local descriptors. IEEE Trans. Pattern Anal. Mach. Intell. 2005, 27, 1615–1630. [Google Scholar] [CrossRef] [PubMed]
- Lingua, A.; Marenchino, D.; Nex, F. Performance analysis of the SIFT operator for automatic feature extraction and matching in photogrammetric applications. Sensors 2009, 9, 3745–3766. [Google Scholar] [CrossRef] [PubMed]
- Sur, F.; Noury, N.; Berger, M.-O. Image Point Correspondences and Repeated Patterns; INRIA: Le Chesnay-Rocquencourt, France, 2011. [Google Scholar]
- Zhang, W.; Li, X.; Yu, J.; Kumar, M.; Mao, Y. Remote sensing image mosaic technology based on SURF algorithm in agriculture. EURASIP J. Image Video Process. 2018, 2018, 85. [Google Scholar] [CrossRef]
- Sarlin, P.-E.; DeTone, D.; Malisiewicz, T.; Rabinovich, A. Superglue: Learning feature matching with graph neural networks. In Proceedings of the IEEE/CVF Conference on Computer Vision and Pattern Recognition, Seattle, WA, USA, 13–19 June 2020; pp. 4938–4947. [Google Scholar]
- DeTone, D.; Malisiewicz, T.; Rabinovich, A. Superpoint: Self-supervised interest point detection and description. In Proceedings of the IEEE Conference on Computer Vision and Pattern Recognition Workshops, Salt Lake City, UT, USA, 18–22 June 2018; pp. 224–236. [Google Scholar]
- Mo, Y.; Kang, X.; Duan, P.; Li, S. A robust UAV hyperspectral image stitching method based on deep feature matching. IEEE Trans. Geosci. Remote Sens. 2021, 60, 1–14. [Google Scholar] [CrossRef]
- Song, S.; Morelli, L.; Wu, X.; Qin, R.; Albanwan, H.; Remondino, F. Deep Learning Meets Satellite Images–An Evaluation on Handcrafted and Learning-Based Features for Multi-date Satellite Stereo Images. In Proceedings of the European Conference on Computer Vision, Milan, Italy, 29 September–4 October 2024; pp. 50–67. [Google Scholar]
- Morelli, L.; Ioli, F.; Maiwald, F.; Mazzacca, G.; Menna, F.; Remondino, F. Deep-image-matching: A toolbox for multiview image matching of complex scenarios. Int. Arch. Photogramm. Remote Sens. Spat. Inf. Sci. 2024, 48, 309–316. [Google Scholar] [CrossRef]
- Feng, Y.; Zhang, F.; Li, X.; Xiao, X.; Wang, L.; Xiang, X. Research on Image Stitching Based on an Improved LightGlue Algorithm. Processes 2025, 13, 1687. [Google Scholar] [CrossRef]
- Vultaggio, F.; Fanta-Jende, P.; Schörghuber, M.; Kern, A.; Gerke, M. Investigating Visual Localization Using Geospatial Meshes. Int. Arch. Photogramm. Remote Sens. Spat. Inf. Sci. 2024, 48, 447–454. [Google Scholar] [CrossRef]
- Mousavi, V.; Varshosaz, M.; Remondino, F. Evaluating tie points distribution, multiplicity and number on the accuracy of uav photogrammetry blocks. Int. Arch. Photogramm. Remote Sens. Spat. Inf. Sci. 2021, 43, 39–46. [Google Scholar] [CrossRef]
- Bergström, P.; Edlund, O. Robust registration of point sets using iteratively reweighted least squares. Comput. Optim. Appl. 2014, 58, 543–561. [Google Scholar] [CrossRef]
- Luo, Q.; Zhang, J.; Xie, Y.; Huang, X.; Han, T. Comparative Analysis of Advanced Feature Matching Algorithms in Challenging High Spatial Resolution Optical Satellite Stereo Scenarios. In Proceedings of the IGARSS 2024-2024 IEEE International Geoscience and Remote Sensing Symposium, Athens, Greece, 7–12 July 2024; pp. 2645–2649. [Google Scholar]
- Cueto Zumaya, C.R.; Catalano, I.; Queralta, J.P. Building Better Models: Benchmarking Feature Extraction and Matching for Structure from Motion at Construction Sites. Remote Sens. 2024, 16, 2974. [Google Scholar] [CrossRef]
- Liu, C.; Song, K.; Wang, W.; Zhang, W.; Yang, Y.; Sun, J.; Wang, L. A vision-inertial interaction-based autonomous UAV positioning algorithm. Meas. Sci. Technol. 2025, 36, 026304. [Google Scholar] [CrossRef]
Disclaimer/Publisher’s Note: The statements, opinions and data contained in all publications are solely those of the individual author(s) and contributor(s) and not of MDPI and/or the editor(s). MDPI and/or the editor(s) disclaim responsibility for any injury to people or property resulting from any ideas, methods, instructions or products referred to in the content. |
© 2025 by the authors. Licensee MDPI, Basel, Switzerland. This article is an open access article distributed under the terms and conditions of the Creative Commons Attribution (CC BY) license (https://creativecommons.org/licenses/by/4.0/).