Highlights
What are the main findings?
- A novel Dilated Spatio-Temporal U-Net (DST-UNet) model successfully downscales low-resolution satellite thermal imagery to airborne-quality thermal maps by capturing multiscale urban thermal patterns and demonstrates effective generalization across diverse urban environments.
What are the implications of the main findings?
- Municipalities can conduct continuous high-resolution urban thermal monitoring from open-source satellite data at significantly reduced costs, overcoming temporal limitations of airborne campaigns and the resolution gap between optical and thermal sensors.
- This scalable framework enables more frequent urban heat island assessments, supporting improved climate resilience strategies and public health interventions against heat-related threats.
Abstract
Urban heat island pose a significant threat to public health and urban livability. UHI maps are created using satellite thermal data, a crucial source for earth monitoring and for delivering mitigation strategies. Nowadays there is still a resolution gap between high-resolution optical data and low-resolution satellite thermal imagery. This study introduces a novel deep learning approach—named Dilated Spatio-Temporal U-Net (DST-UNet)—to bridge this gap. DST-UNET is a modified U-Net architecture which incorporates dilated convolutions to address the multiscale nature of urban thermal patterns. The model is trained to generate high-resolution, airborne-like thermal maps from available, low-resolution satellite imagery and ancillary data. Our results demonstrate that the DST-UNet can effectively generalise across different urban environments, enabling municipalities to generate detailed thermal maps with a frequency far exceeding that of traditional airborne campaigns. This framework leverages open-source data from missions like Landsat to provide a cost-effective and scalable solution for continuous, high-resolution urban thermal monitoring, empowering more effective climate resilience and public health initiatives.
1. Introduction
Climate change adaptation is key for the sustainability of urban areas and the well-being of their inhabitants. From flash-floods caused by heavy rains to urban heat island (UHI) intensification during heat waves, cities are called to implement local and urban planning solutions that mitigate risks and make the city more resilient to extreme weather events [1,2,3].
The monitoring of these events and the realisation of mitigation interventions—both at different temporal and spatial scales—are paramount. The monitoring in time allows for assessing the effects of the adopted local policies [4,5]; meanwhile, the high spatial resolution of the monitoring allows to understand the efficacy of local measures at street/square scale [6,7,8]. European cities are characterised by a tight and dense city centre. Within a city centre, public and private green spaces of small dimension are generally present, being the main source for UHI mitigation together with blue infrastructures [9]. Besides punctual, ground-sensing location (i.e., weather stations), remotely sensed data are essential to describe, investigate, and monitor the urban environment, its changes, and effects like UHIs. Satellite and airborne remote sensing data become complementary in developing monitoring solutions that fit medium-sized cities, amongst which thermal sensors mounted on these platforms allow the retrieval of land surface temperature (LST), an essential variable in studying UHI and mitigation interventions [10]. Optical sensors can nowadays collect very high resolution images from both satellite [9,11] and airborne platforms [12], allowing for distinguishing small geometric details in the images (0.1–1 m ground sample distance—GSD). On the other hand, thermal sensors are generally bulky by construction, requiring high technological advances to reach similar resolution [13,14]. Private high-resolution (e.g., 3.5 m) satellites are also becoming available in the thermal domain (e.g., SatVu [15]), but the decennial continuous data acquired by Sentinel-3 and Landsat missions are difficult to match due to the on-demand scene acquisition of private satellites behind the costs to access such images. Nevertheless, airborne-based thermal acquisitions can significantly improve the radiometric and geometric resolution of images aiming for submeter GSD. High-resolution aerial thermal images [16] are the most suitable source of data to recover LST values on an entire city for a detailed analysis at street level. One drawback of airborne acquisition is the on-demand characteristic of the service, due to the costs and required knowledge, which is performed by specialised companies. Table 1 reports some thermal sensors mounted on satellite and airborne platforms together with their respective specifications.

Table 1.
Some of the sensors with thermal imaging capabilities at different scales and revisit times.
The aim of this work is to take advantage of the high geometric and radiometric resolution of the airborne-based products and the high revisit time of satellite sensors, presenting and validating a super-resolution procedure to improve the geometric resolution of satellite thermal data. This method allows the retrieval of airborne-like thermal products for every cloudless revisit scene of a thermal satellite and the derivation of high-resolution urban heat islands or urban vulnerability indexes. The novelty and uniqueness of the work lie in the exploitation of high-resolution airborne thermal imagery over urban areas to improve the resolution of thermal images acquired by satellite sensors via deep learning techniques. The proposed procedure could enable medium-sized cities to fully exploit the richness of information contained in airborne thermal acquisition beyond the date of acquisition by extrapolating the city’s thermal structure to newly acquired satellite scenes. The code of the proposed method is released at https://github.com/3DOM-FBK/Thermal_SR, accessed on 26 September 2025.
2. Related Works
Improving the quality of images from low-resolution to higher resolution is a well-known topic in computer vision and image processing, and it is generally known as Super-Resolution (SR). The first methods are based on a 2D linear or a non-linear interpolation of each pixel with its neighbourhood. Bilinear interpolation [23] is the most famous method in this category: it performs a linear interpolation on a 2 × 2 window, first in one direction and then in the other. Bicubic image interpolation [24], in contrast, considers a 4 × 4 window, which makes the result smoother but also more time-consuming. It can be performed using either Lagrange polynomials, cubic splines, or cubic convolution algorithms. Nearest neighbour interpolation [25] is considered the simplest approach in this category of methods: it simply locates the “nearest” neighbouring pixel and selects the intensity value of it without considering the values of other neighbouring points at all. Lanczos resampling method [26] maps each pixel of the given image to a translated and scaled copy of the Lanczos kernel, which is a Sinc function windowed by the central lobe of a second one (a longer Sinc function). The sum of these two kernels is then evaluated at the desired points. Those standard methods are widely used on different applications and libraries due to their simplicity and efficiency.
In recent years, many works have focused on developing resampling methods based on deep learning (DL). Ref. [27] proposed a super-resolution generative adversarial network (SRGAN) that uses a deep residual network (ResNet) with skip-connection. They define a novel perceptual loss function which consists of an adversarial loss and a content loss. In [28], an enhanced deep super-resolution network (EDSR) was developed. The model was trained with an appropriate loss function, and unnecessary modules in conventional residual networks were carefully removed upon training. In [29], a new deep learning model (WDSR) was proposed based on the hypothesis that the non-linear ReLUs impeded information flow from the shallow layers to the deeper ones. Authors demonstrated that without additional parameters (and, by consequence, computation) and by simply expanding features before ReLU activation led to significant improvements for single-image super-resolution. A method for blind denoising of images was presented in [30], where a novel network architecture design and a novel training data synthesis were used. They used a swin-conv block network architecture [31] combined with a UNet architecture [32] to incorporate the local modelling ability of a residual convolutional layer and the non-local modelling ability of the swin transformer block. For the training data synthesis, they designed a model for noise degradation that could take into consideration different varieties of noise and resizing. Generally, several high frequency information was lost in low-resolution images; therefore, to deal with this problem, a very deep Residual channel attention networks (RCAN) was proposed in [33]. It consisted of many residual groups with long skip connections while each residual group contained some residual blocks with short skip connections. This strategy allowed large low-frequency information to be by-passed through multiple skip connections and kept the main network focused on learning high-frequency information.
Most existing methods of SR based on DL require a huge number of parameters, and this implies heavy computational loads. To solve this problem, Ref. [34] proposed the deep Laplacian Pyramid Super-Resolution Network for fast and accurate image super-resolution. Their network has the particularity to progressively reconstruct the sub-band residuals of high-resolution images at multiple pyramid levels. To avoid high computational loads, the proposed method directly extracts features from the low-resolution input space. In [35], a very deep convolutional network for a single-image super-resolution with 20 weight layers was presented. To avoid problems of slow convergence rate, they used residual learning and extremely high learning rates to optimise a very deep network.
In recent years, SR methods have been applied to airborne-derived products, particularly on digital elevation models (DEMs). A GAN-based model, which was inspired by single-image super-resolution methods, was presented in [36]. Their objective was to increase the spatial resolution of a DEM up to four times without any additional information. On the other hand, a deep convolutional neural network (DCNN) for single-image super-resolution applied to unmanned aircraft system (UAS) images was reported in [37]. The proposed DCNN was also based on a GAN architecture and trained on a set of LR UAS images virtually generated by downsampling the original HR image set by a factor ×4.
Similarly, Ref. [38] presented a new single-image super-resolution network to recover an HR DEM. The developed network was composed of three sub-networks; the objective of the first one was to extract feature maps, while the second one was to infer the high-frequency details. The last subnetwork refines the result by combining the LR input with the details obtained from the second subnetwork. Jiao et al. [39] proposed a deep neural network model that was composed of 30 convolutional layers to learn the feature mapping relationship between the LR and the HR DEM. Residual learning was introduced in order to avoid the problem of degradation of the network caused by the high number of convolutional layers. Zhang et al. [40] proposed recursive sub-pixel convolutional neural networks (RSPCN) to generate HR DEMs from LR DEMs. This network is an improved version of the efficient sub-pixel convolutional neural networks (ESPCN) [41] based on recursion theory.
The above-mentioned methods were applied to DEMs of resolution of a few tens of metres up to four times upscaling (except for [40], which is 16 times), representing non-urban areas. Our objective was to apply our method to thermal images in urban areas, which requires images of high resolution for monitoring purposes. SR of thermal images was more commonly performed amongst optical and thermal satellite products [42,43,44,45,46] or amongst thermal images of high and low resolution produced by different thermal satellite sensors [47,48]. Few studies, mainly due to the lack of data availability, investigated the use of airborne thermal imaging coupled with satellite sensors.
3. Methodology
The proposed methodology was tested and validated using data over two medium-sized cities (i.e., Ferrara in Italy and Graz in Austria) where both satellite and airborne images are available [49]. Specifications of these data are reported in Table 2 together with ancillary data useful for the development and validation procedure. More details can be found in [49], two LWIR DigiTHERM-1024 (https://www.igi-systems.com/files/IGI/Brochures/DigiTHERM/DigiTHERM.pdf, accessed on 26 September 2025) sensors by IGI results in an effective total strip width of 2048 pixels across the direction of flight.
Table 2.
Satellite and airborne raw data [49] and derived products used in the study.
3.1. Super Resolution Model Definition
The proposed architecture for the SR of satellite thermal imagery, DST-UNET (Figure 1), was based on the U-NET network [32]. The architecture of DST-UNET was composed of 2 symmetric paths: an encoding/contracting path to capture context and a decoding/expanding path that enables precise localisation and accurate output values. The 2 paths together form the U-shaped architecture. The architecture of the contracting part (left side of the network) is composed of 5 groups, where each group consists of 4 convolutional blocks, which are merged and followed by a 2 × 2 max pooling operation with a stride of 2 for downsampling. Each convolutional block involves a convolutional layer followed by a batch normalisation and a rectified linear unit (ReLu). The number of filters of layers of the first group is equal to 16 and is doubled at each of the next 3 groups, while the number of filters of the 5th group is kept the same as the previous ones. In the expanding part (right side), each group consists of an upsampling of the feature map followed by a 2 × 2 convolution (“up-convolution”). Unlike the fully convolutional approach, feature maps after each upsampling are concatenated with their corresponding feature maps from the contracting path (Skip-connections) to enhance the precision and detail of outputs.
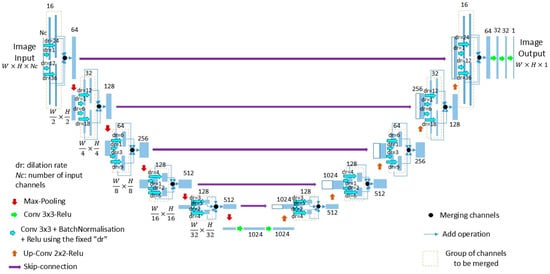
Figure 1.
DST-UNET architecture. Each blue box corresponds to a multi-channel feature map. The number of channels is denoted on top or below the box. White boxes represent copied feature maps.
The novelty of the proposed neural network is the introduction of the dilated convolution concept, also known as ‘atrous’ convolution, to deal with the multiscale context [52]. It is based on expanding the window size without increasing the number of weights, which allows keeping the stride constant but with a larger field-of-view without increasing the number of parameters or the amount of computation (Figure 2).
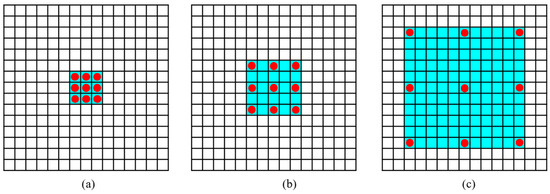
Figure 2.
Principle of dilated convolution: l = 1: each output element has a receptive field of 3 × 3 (a). l = 2: each output element has a receptive field of 5 × 5 (b). l = 5: each output element has a receptive field of 11 × 11 (c).
From a mathematical point of view, let F: Z → R be a discrete function. Let Ωr = [−r,r]2 ∩ Z2 and let k: Ωr → R be a discrete filter of size (2r + 1)2. The discrete convolution operator * can be defined as [52]:
The previous formula can be generalised by introducing the dilatation factor l. The new discrete convolution operator *l can be defined as:
3.2. Data Pre-Processing
Some pre-processing on the raw datasets was performed to prepare the data for the proposed DST-UNET model, including:
- the orthophoto was resampled by median from 0.1 to 0.5 m for each of the RGBI channels;
- the radiance measured at the airborne sensor was corrected to the actual LST on the ground [51];
- the raw Landsat scenes were corrected following Ermida et al. (2020) [50] procedure;
- land cover classification map was retrieved from hyperspectral images following Valentin (2019) [53] on a pixel-based random forest classification method.
Emissivity of the surfaces was a fundamental parameter in LST retrieval, serving dual roles in the radiative transfer equation: it scaled both the emitted thermal radiation from the surface and the reflected incident radiation from the environment. Accurate surface emissivity determination became fundamental to high-quality land surface temperature (LST) retrievals. Satellite-based approaches explicitly incorporated emissivity deriving values from the ASTER Global Emissivity Database with NDVI-based dynamic corrections that accounted for vegetation variability, yielding emissivities ranging from 0.878 for water/glass to 0.97 for vegetation and bare soil [50]. Airborne methodologies further emphasised emissivity’s complexity in heterogeneous urban environments by integrating hyperspectral classification across 23 surface classes and incorporating surface roughness parameters that determined how the (1 − ε) fraction of incident radiation—comprising downwelling atmospheric radiation from multiple angular sky segments, thermal emission from surrounding structures, and contributions from vegetation—was reflected toward the sensor [51,54]. An emissivity uncertainty of 0.01 can introduce LST errors of 0.5–1.5 K, which is particularly problematic for low-emissivity materials like metals (ε ≈ 0.75) where reflected radiation dominates the thermal signal, demonstrating that accurate emissivity characterisation is essential for separating true surface temperature from complex radiative interactions in heterogeneous urban environments.
3.3. Parameter Settings
The DST-UNET model was trained on a custom dataset. In order to create the dataset, each of the LST products and the orthophoto covering the city were divided into three areas: 70% for the training set, 10% for the validation set, and 20% for the testing set (Figure 3). Each set was composed of several tiles that were cropped from their respective set. We created 3072 tiles for the training set, half of which were generated using augmentation techniques based on image rotation and flipping, while the validation and testing sets were composed of 64 and 128 tiles, respectively. With a resolution of 0.5 m, the size of the tiles (i.e., 256 m) is big enough to contain the maximum details that the trained model will learn from. In our case, the tile size was 512 × 512 pixels.
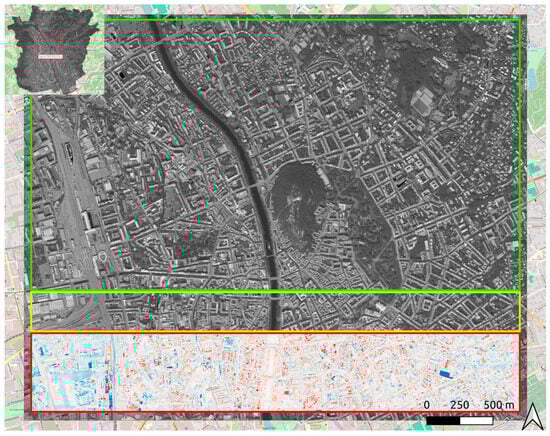
Figure 3.
Training (green), validation (yellow), and testing (red) sets over the Graz use case.
The DST-UNET was trained with a maximum of 100 epochs with batch size and initial learning rate fixed to 16 and 1 × 10⁻⁴, respectively. The ADAM method [55] was adopted to optimise the model. The mean absolute error MAE between the predicted (y) and its corresponding ground truth (x) images was adopted as the loss function of the network. It is defined as follows:
where N is the total number of pixels.
To perform a quantitative comparison, the following measures were used:
- Root mean square error (RMSE): it calculates the square root of the average squared difference between the predicted and the reference image:
- Peak signal-to-noise ratio (PSNR): it is an expression for the ratio between the maximum possible value of a signal and the power of distorting noise that affects the quality of its representation:
- Structural similarity index measure (SSIM): SSIM [56] is a method that measures the similarity between two images:
3.4. Model Comparison with Existing Super Resolution Deep Learning Models
For a comparative evaluation, the proposed DST-UNET model was compared with two established super-resolution methods from the literature: the Enhanced Deep Residual Networks for Single Image Super-Resolution (EDSR) [28] and the very deep super-resolution network (VDSR) [35]. To ensure a fair comparison, all benchmark models were retrained on the same dataset as the proposed model. We evaluated two distinct implementations of VDSR: the original architecture (VDSR) [57], which was a deep network with 18 hidden layers and 3 × 3 kernels, and a modified version designed for Digital Surface Models (VDSR4DEM) [58], which employed a shallower network (8 hidden layers) with larger 9 × 9 kernels. For the model in [21], EDSR in short, it was retrained as is. The performance comparison of DST-UNET against EDSR, VDSR, and VDSR4DEM on the Graz and Ferrara testing sets is presented in Section 4.4. (Table 3).
Table 3.
DST-UNET model performance for the two pilot cities. The linear regression model, VDSR, VDSR4DEM and EDSR are reported as reference. Legend: Best, Second Best, Third Best.
3.5. Model Refinement
Encouraged by the promising results obtained with the use of the orthophoto to guide the model in learning the city geometry but still missing the radiometric precision of the inferred thermal images, the emissivity of the surface was introduced as a covariate variable into the training of the model. This refinement was justified by the procedure used to retrieve the ground LST from the measured values at the sensor, whether airborne or satellite-mounted. The emissivity map was derived from the high-resolution land cover maps by means of a look-up table [59]. The emissivity values were included as one of the channels of the multi-channel feature map in input to the model. Results are shown in Section 4.3.
3.6. Model Cross-Validation and Re-Training
The initial cross-validation of the model applied in Ferrara and in Graz was performed on each of the two cities, inferring the temperature using the trained model in the other city without additional re-training. After observing the poor radiometric performances of the cross-validation, the training sets of the two cities and re-training the model were mixed, leading to better prediction. The results of cross-validation and retraining of the model are reported in Section 4.4.
4. Results
A comparison of the LST product from airborne and satellite platforms is first presented (Section 4.1). SR results with the proposed DST-UNET model are then shown (Section 4.2), followed by model improvement (Section 4.3) and cross-validation which are subsequently reported together with state-of-the-art comparison (Section 4.4).
4.1. Airborne and Satellite Thermal Imaging Comparison
Figure 4 represents the LST retrieved from airborne and satellite sensors over the city of Graz. From a visual comparison, it appears clear how the detailed thermal signature of the city was well identified with the airborne sensor data; meanwhile, the satellite sensor was capable of capturing the macroscopic distribution of temperature across the city, identifying the vegetation, the river that divides the city as well as some hot spots at the rail freight yard and at the industrial district.
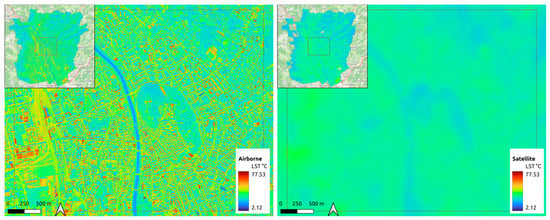
Figure 4.
Land surface temperature (LST) over Graz from the airborne sensor at 0.5 m resolution on the 9 September 2021 (left) and from Landsat 8 scene at 30 m resolution on the 12 September 2021 (right).
Figure 5 presents a detailed view of the airborne-satellite LST difference over an AOI in the centre of Graz. Figure 5a, with 30 m pixel size, clearly shows the difficulty at satellite resolution to resolve single houses, squares or neighbourhoods as well due to its low resolution. Figure 5b, with 0.5 m pixel size, exemplifies the quality of airborne-derived LST in the urban context; the vegetated areas appear to be in more agreement with the satellite measurements (i.e., white pixels with near-zero values) compared to some building’s rooftops. This can be explained by both the higher resolution of the sensor itself (i.e., reducing the pixel mixing effect) as well as the detailed emissivity map used to recover the LST at ground level from the airborne sensor.
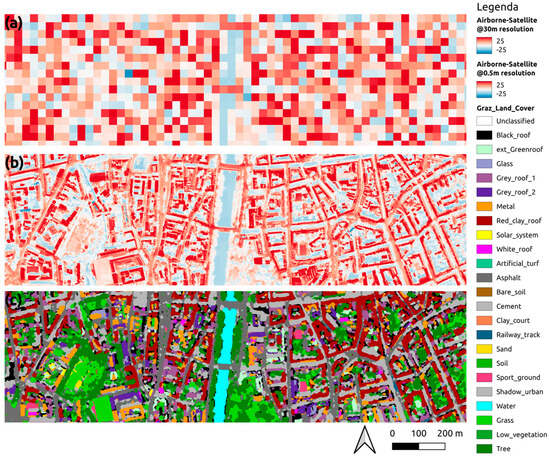
Figure 5.
Airborne-Satellite LST difference detailed view over an AOI in Graz. The difference is calculated at the 30 m resolution of the satellite (a) and at the 0.5 m resolution of the airborne thermal flight (b). Land cover classes from hyperspectral data (c).
To quantify the temperature difference between the satellite and airborne sensors, a resampling of the satellite LST was performed via nearest-neighbour, then Airborne-Satellite LST pixel-wise differences was aggregated over continuous and homogeneous land cover classes (Figure 5c), as reported in Figure 6. Besides the difference in magnitude between the two sensors, higher temperatures were measured from the aeroplane thanks to the higher resolution that sharply reduced the pixel mixing. The difference was smaller in vegetated areas (the last 3 classes). This was confirmed pixel-wise as shown in Figure 5b, as well as for the entire city area of Graz due to the presence of large, vegetated areas both within and at the outskirts of the city (Figure 4 and Figure 6).
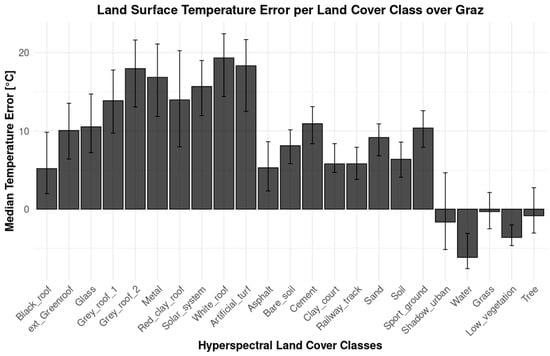
Figure 6.
Airborne-satellite LST difference median aggregated over continuous and homogeneous land cover classes.
4.2. DST-UNET Model Applied to Thermal Imaging
The deployment performance of the DST-UNET model over the testing set in the city of Graz is reported in Figure 7, which shows the satellite LST covering the testing set (Figure 7a), the airborne LST (Figure 7b) and the inferred LST from the DST-UNET model (Figure 7c). Overall, there was a good agreement between the airborne LST, here taken as reference ground truth and the inference output of the model trained over Graz. For example, the thermal signature of the bridges over the river was barely visible in the satellite LST; meanwhile, the model output clearly defined its extents as visible in the zoom of Figure 7f. Figure 7d shows the pixel-wise difference between the Airborne retrieved LST (Figure 7b) and the DST-UNET model inference (Figure 7c). The pixel-wise error was a Gaussian centred on zero (Figure 11). Even if most of the errors were small, there was a correlation between the land cover class and the error magnitude.
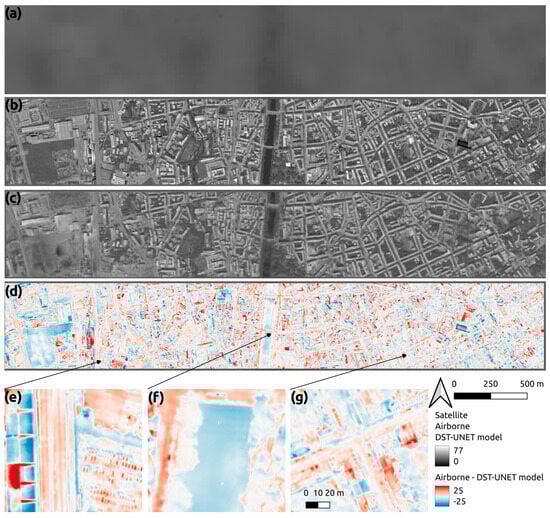
Figure 7.
Super resolution (SR) model inference on the testing area over Graz: satellite LST (a); airborne thermal image (b); DST-UNET model inference (c); LST error, i.e., airborne vs. inference (d); detailed view over railway and parking lot (e) river and bridge (f) and city suburbs (g).
Figure 8 shows the LST difference—aggregated for each land cover class—of the Airborne-DST-UNET model. Besides two classes (i.e., Artificial Turf and Water), the error median is within ±5 °C range. The performances of the model are considered satisfactory given the large changes in surface cover in the study area, with absolute temperature ranging from 10 to 77 degrees for the water and metal surfaces, respectively.
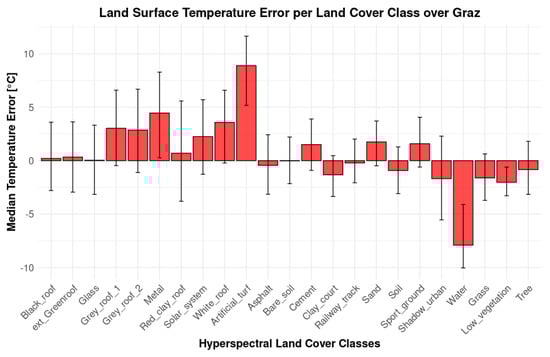
Figure 8.
Airborne-DST-UNET model LST difference aggregated for each land cover class over Graz testing subset.
4.3. DST-UNET Model Refinement with Emissivity Maps
The original model performances have been boosted using the emissivity map as ancillary information. Figure 9 reports the LST difference between the inferred data and the airborne ground truth: at first glance, most pixels have a smaller error compared to the base model presented in the previous section (Figure 7d).
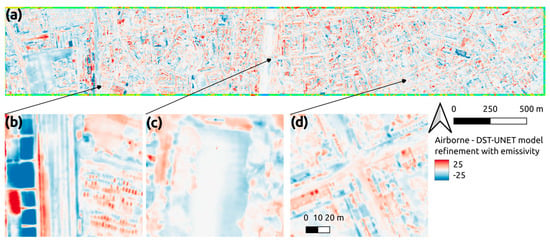
Figure 9.
LST error of the DST-UNET model refined with the emissivity map (a). Detailed view over the railway and parking lot (b), in the river and bridge areas (c), and over typical urban neighbourhoods (d).
Figure 10 shows the median LST difference between the airborne and DST-UNET refined model aggregated for each land cover class over the Graz testing set. After the proposed refinement, the median error range was within 2.5 degrees except for the two classes, Artificial Turf and Water. The main reason for the larger errors of the two classes was their underrepresented surfaces in the dataset (Figure 11). Figure 11 shows the histogram error distribution for each class of homogeneous and contiguous land cover areas. Unpacking the error distribution, the improvement of including the emissivity map in the training data becomes more evident in reducing the occurrences of larger errors (red line versus blue line in Figure 11), in particular for the underestimation of the LST of Metal surfaces and overestimation of Low_vegetation.
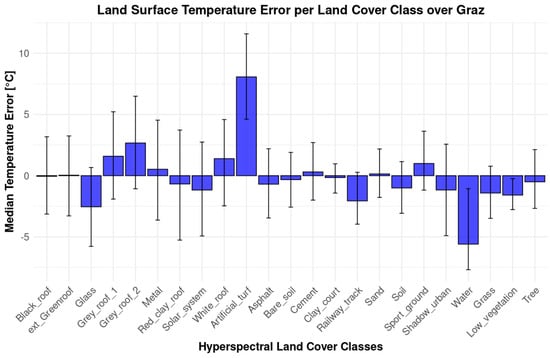
Figure 10.
LST difference in the airborne-DST-UNET refined model aggregated for each land cover class over the Graz testing subset.
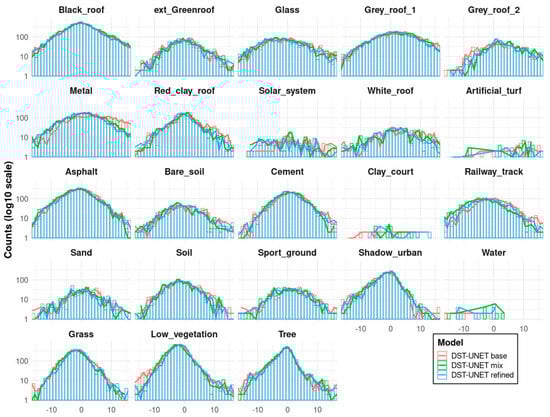
Figure 11.
LST error histograms for each land cover class over Graz testing subset.
4.4. DST-UNET Model Cross-Validation Results and Re-Training
In order to test the robustness and generalisation capabilities of the proposed DST-UNET trained network, the refined model was cross-validated over two cities. Table 3 reports the metric performance of the cross-validation over each city testing set. The model trained separately over the two use cases did not perform satisfactorily, showing a lack of generalisation. To overcome this issue, the model was retrained by combining the two cities’ training sets. The retraining results were fully aligned with the specific model for each city, as visible in Table 3 and Figure 12, Figure 13 and Figure 14. In Figure 12, the performances of the re-trained model were detailed per land cover class and compared with the base model (leveraging only the orthophoto) and the refined model (using the emissivity map). Figure 13 visually compares the performances over the Graz testing set; similarly, Figure 14 reports the results over the Ferrara testing set.
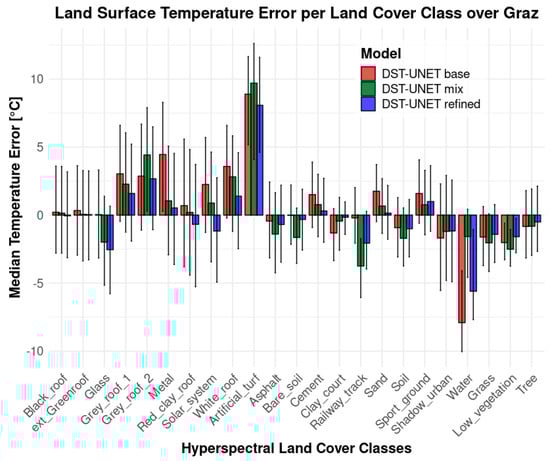
Figure 12.
LST median error for each land cover class over the Graz testing set.
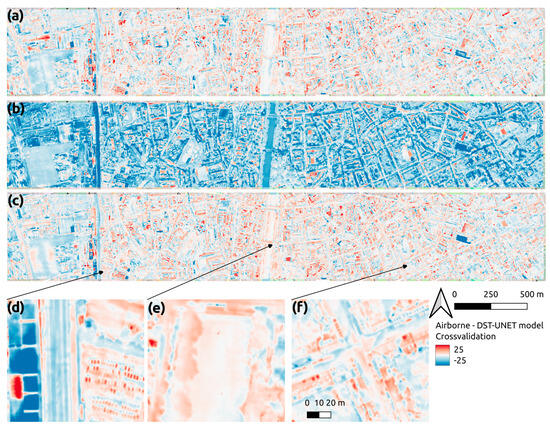
Figure 13.
Cross-validation and retraining of the DST-UNET model over the Graz testing set. LST error of the DST-UNET refined model trained over Graz (a). LST error of the DST-UNET refined model trained over Ferrara (b). LST error of the DST-UNET refined model re-trained over Graz and Ferrara—referenced as mix model (c). Detailed view over railway and parking lots (d), river and bridge (e), and built-up area (f).
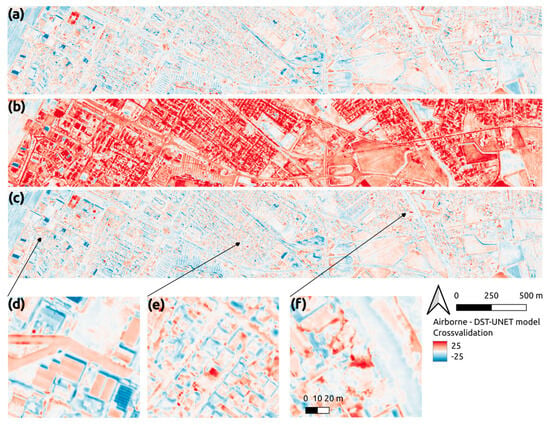
Figure 14.
Cross-validation and retraining of the DST-UNET model over the Ferrara testing set. LST error of the DST-UNET refined model trained over Ferrara (a). LST error of the DST-UNET refined model trained over Graz (b). LST error of the DST-UNET refined model re-trained over Graz and Ferrara—referenced as mix model (c). Detailed view over industrial settings (d), residential area (e), and built-up area near water channel (f).
Finally, Figure 15 shows the results of the re-trained model (Section 3.5 and Section 3.6) deployed over two cities (Ferrara and Graz): the inference of the proposed DST-UNET resulted in good details and urban features. No metrics are available as there is no ground truth data for the acquisition dates.
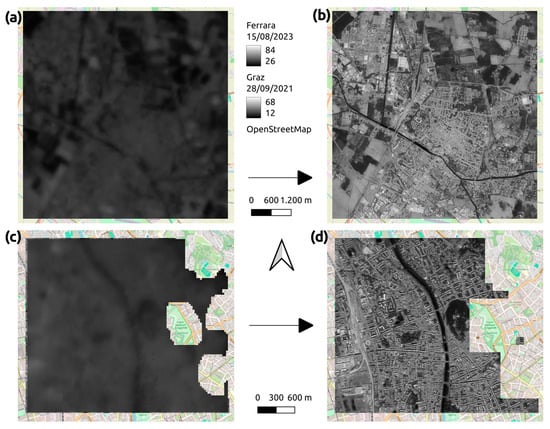
Figure 15.
DST-UNET model deployment on new scenes: Ferrara satellite scene acquired on 15 August 2023 (a) and SR output over Ferrara based on the 15 August 2023 scene (b); Graz Satellite scene acquired on 28 September 2021 (c) and SR output (d).
5. Discussion
The proposed DST-UNET methodology represents a significant advancement in bridging the gap between high-resolution airborne thermal imagery and satellite thermal monitoring capabilities. However, several important considerations emerge from this research that merit careful examination regarding the practical implementation, limitations, and future development of this approach.
5.1. Methodological Limitations and Constraints
The most immediate operational constraint of the proposed methodology stems from its fundamental dependence on cloud-free satellite thermal imagery. As demonstrated in Figure 15c, areas obscured by cloud cover cannot be processed through the DST-UNET network, creating spatial gaps in the enhanced thermal products. This limitation is particularly challenging for urban monitoring applications where continuous spatial coverage is essential for comprehensive heat island analysis and policy assessment. In regions with frequent cloud cover, such as northern European cities or areas with maritime climates, this constraint could significantly reduce the practical utility of the method, potentially limiting thermal monitoring to only seasonal windows of clear weather conditions. A critical consideration for the practical implementation of this methodology is the temporal validity of the training relationship between airborne and satellite thermal data. Urban environments are inherently dynamic systems where land cover, building density, vegetation coverage, and infrastructure continuously evolve. The effectiveness of the DST-UNET model inherently depends on the assumption that the spatial relationships and thermal characteristics learned from the initial airborne-satellite data pairing remain valid over time.
Our analysis suggests that significant changes in urban morphology, such as new construction projects, infrastructure development or changes in vegetation coverage, can degrade the model’s performance. Based on typical urban development patterns and the rate of change observed in medium-sized European cities, we recommend updating the airborne thermal campaign at least every five years to maintain model accuracy. However, this timeframe may need to be adjusted based on the specific development dynamics of individual cities, with rapidly developing urban areas potentially requiring more frequent updates. The model weights dependence (but not the methodology) on specific sensor characteristics and data quality parameters presents additional scalability challenges. Variations in satellite sensor calibration, atmospheric correction procedures, and geometric registration accuracy between different Landsat acquisitions or alternative satellite platforms could affect model performance. The approach’s compatibility with emerging high-resolution thermal satellites, such as the HotSat-1 constellation, requires evaluation to ensure future viability. New thermal satellite missions, such as Copernicus LSTM [60], CNES-ISRO TRISHNA [61] and NASA-ASI SBG-TIR [62], aim at reducing the revisit time and providing higher resolution daily thermal satellite data. This would boost the monitoring capabilities of the proposed network.
5.2. Implications for Urban Climate Monitoring
Despite these limitations, the proposed methodology offers significant potential for enhancing urban climate monitoring capabilities in ways that directly support policy development and implementation assessment. The ability to generate high-resolution thermal products at regular intervals enables more detailed tracking of urban heat island mitigation interventions, such as green roof installations, urban park development, or street-level cooling strategies. The enhanced temporal resolution provided by combining airborne detail with satellite frequency could enable more responsive policy adjustments and a better understanding of intervention effectiveness. Municipal planners could use these products to identify thermal hot spots, assess the effectiveness of cooling interventions, and prioritise areas for future climate adaptation investments.
The methodology aligns well with broader smart city initiatives that emphasise data-driven decision-making and continuous monitoring. Integration with existing urban sensor networks, weather monitoring systems, and building management technologies could provide a comprehensive thermal monitoring framework that supports multiple urban management objectives. The thermal products generated through this approach could serve as valuable inputs for urban climate models, energy consumption optimisation, public health monitoring during heat waves, and infrastructure resilience planning. This multi-purpose utility enhances the cost-effectiveness of the investment in airborne thermal campaigns and technical infrastructure.
Future work should focus on reducing the technical barriers to implementation through the development of automated processing pipelines, cloud-based processing solutions, and user-friendly interfaces. The creation of standardised workflows and quality assessment tools could facilitate broader adoption and ensure consistent implementation across different municipalities.
The investigation of alternative training strategies, such as transfer learning approaches that require less local airborne data or unsupervised domain adaptation techniques, could reduce the cost and complexity of initial model deployment. These developments would be particularly valuable for smaller municipalities with limited resources.
6. Conclusions
This paper presented a Deep Learning Neural Network capable of generating airborne-like thermal images starting from satellite imagery and ancillary information. A U-NET like architecture, named DST-UNET, was created with the introduction of the dilated convolution concept to deal with the multiscale problem. The network was trained on two quite different urban areas and, after cross-training, demonstrated a generalisation capability across diverse urban environments.
The DST-UNET methodology represents a promising approach to enhancing urban thermal monitoring capabilities by combining the strengths of airborne and satellite thermal sensors. After the acquisition of a thermal flight or by revitalising an older flight campaign, a municipality can exploit the proposed DST-UNET model to extend the lifetime of the airborne thermal acquisition using open data provided every 8 days by the Landsat mission. This approach might stimulate cities to invest in environmental monitoring (i.e., airborne sensor campaigns) thanks to the greater return on investment that an extended lifetime of the on-demand product provides.
A detailed thermal footprint at 1 or 0.5 m resolution available every eight days can promote new interventions within the city via green and blue infrastructures, enabling more responsive and evidence-based urban climate adaptation strategies. The enhanced temporal resolution facilitates continuous monitoring of urban heat island mitigation measures and supports data-driven policy decisions for sustainable urban development. The code of the proposed method will be released upon paper acceptance.
While significant limitations exist regarding cloud dependency, temporal validity, and technical implementation requirements, the potential benefits for urban climate monitoring and policy support justify continued development and refinement of the approach. The methodology offers substantial value for municipalities seeking to optimise their climate adaptation investments and monitor intervention effectiveness at unprecedented spatial and temporal resolutions.
Author Contributions
Conceptualisation, F.R., R.B. and S.M.; methodology, R.B. and S.M.; software, R.B. and S.M.; investigation, R.B., S.M. and F.R.; resources, F.R.; data curation, R.B. and S.M.; writing—original draft preparation, R.B. and S.M.; writing—review and editing, R.B. and F.R.; visualisation, R.B. and S.M.; supervision, F.R. All authors have read and agreed to the published version of the manuscript.
Funding
This work is partly funded by the EU project USAGE—Urban Data Space for Green Deal (https://www.usage-project.eu/), which has received funding from the European Union’s Horizon Europe Framework Programme for Research and Innovation under the Grant Agreement no 101059950-call HORIZONCL6-2021-GOVERNANCE-01-17 (IA).
Data Availability Statement
The code presented in this study will be uploaded and made openly available on GitHub at https://github.com/3DOM-FBK/Thermal_SR (accessed on 30 September 2025).
Conflicts of Interest
The authors declare no conflicts of interest.
References
- Milesi, C.; Churkina, G. Measuring and Monitoring Urban Impacts on Climate Change from Space. Remote Sens. 2020, 12, 3494. [Google Scholar] [CrossRef]
- Kasniza Jumari, N.A.S.; Ahmed, A.N.; Huang, Y.F.; Ng, J.L.; Koo, C.H.; Chong, K.L.; Sherif, M.; Elshafie, A. Analysis of Urban Heat Islands with Landsat Satellite Images and GIS in Kuala Lumpur Metropolitan City. Heliyon 2023, 9, e18424. [Google Scholar] [CrossRef]
- Guo, J.; Hong, D.; Zhu, X.X. High-Resolution Satellite Images Reveal the Prevalent Positive Indirect Impact of Urbanization on Urban Tree Canopy Coverage in South America. Landsc. Urban Plan. 2024, 247, 105076. [Google Scholar] [CrossRef]
- Amado, M.P.; Poggi, F. Sustainable Energy Transition for Cities; Elsevier: Amsterdam, The Netherlands, 2022; ISBN 978-0-12-824277-3. [Google Scholar]
- David, M.G.; Dietrich, M.; Raczko, N.; Denvil, S.; Santoro, M.; Chatzikyriakou, C.; Borejko, W. Towards the European Green Deal Data Space. In Proceedings of the EGU General Assembly 2023, Vienna, Austria, 24–28 April 2023. [Google Scholar]
- Deng, J.S.; Wang, K.; Hong, Y.; Qi, J.G. Spatio-Temporal Dynamics and Evolution of Land Use Change and Landscape Pattern in Response to Rapid Urbanization. Landsc. Urban Plan. 2009, 92, 187–198. [Google Scholar] [CrossRef]
- Li, L.; Zhao, K.; Wang, X.; Zhao, S.; Liu, X.; Li, W. Spatio-Temporal Evolution and Driving Mechanism of Urbanization in Small Cities: Case Study from Guangxi. Land 2022, 11, 415. [Google Scholar] [CrossRef]
- Liu, Y.; Yusof, M.J.M.; Rehan, B.M.; Kasim, J.A. Assessment of the Spatio-Temporal Dynamics in Urban Green Space via Intensity Analysis and Landscape Pattern Indices: A Case Study of Taiyuan, China. Sustainability 2024, 16, 8363. [Google Scholar] [CrossRef]
- Kumar, P.; Debele, S.E.; Khalili, S.; Halios, C.H.; Sahani, J.; Aghamohammadi, N.; Andrade, M.D.F.; Athanassiadou, M.; Bhui, K.; Calvillo, N.; et al. Urban Heat Mitigation by Green and Blue Infrastructure: Drivers, Effectiveness, and Future Needs. Innovation 2024, 5, 100588. [Google Scholar] [CrossRef]
- Ma, J.; Zhou, J.; Zhang, T.; Tang, W.; Wang, Y. A Comprehensive Validation Scheme for Satellite-Derived Land Surface Temperature Dataset. IEEE Trans. Geosci. Remote Sens. 2024, 62, 1–12. [Google Scholar] [CrossRef]
- Sheehan, A.; Beddows, A.; Gulliver, J.; Green, D.C.; Beevers, S. Estimating Road Vehicle Speed from High-Resolution Satellite Imagery for Environmental Applications: A Case Study of Barcelona. Remote Sens. Appl. Soc. Environ. 2025, 37, 101507. [Google Scholar] [CrossRef]
- Gerke, M.; Nex, F.; Remondino, F.; Jacobsen, K.; Kremer, J.; Karel, W.; Hu, H.; Ostrowski, W. Orientation of Oblique Airborne Image Sets—Experiences from the ISPRS/EUROSDR Benchmark on Multi-Platform Photogrammetry. Int. Arch. Photogramm. Remote Sens. Spat. Inf. Sci. 2016, 41, 185–191. [Google Scholar] [CrossRef]
- Sobrino, J.A.; Del Frate, F.; Drusch, M.; Jimenez-Munoz, J.C.; Manunta, P.; Regan, A. Review of Thermal Infrared Applications and Requirements for Future High-Resolution Sensors. IEEE Trans. Geosci. Remote Sens. 2016, 54, 2963–2972. [Google Scholar] [CrossRef]
- Wang, Y.; Li, J.; Sun, H.; Li, X. A Review on the Developments and Space Applications of Mid- and Long-Wavelength Infrared Detection Technologies. Front. Inf. Technol. Electron. Eng. 2024, 25, 1031–1056. [Google Scholar] [CrossRef]
- SatVu. Thermal Imagery. Available online: https://www.satellitevu.com/products/thermal-imagery (accessed on 26 September 2025).
- Yang, J.; Shi, Q.; Menenti, M.; Wong, M.S.; Wu, Z.; Zhao, Q.; Abbas, S.; Xu, Y. Observing the Impact of Urban Morphology and Building Geometry on Thermal Environment by High Spatial Resolution Thermal Images. Urban Clim. 2021, 39, 100937. [Google Scholar] [CrossRef]
- ESA. Sentinel-3 SLSTR. Available online: https://sentiwiki.copernicus.eu/__attachments/1672112/OMPC.ACR.HBK.002%20-%20Sentinel%203%20SLSTR%20Land%20Handbook%202024%20-%201.4.pdf?inst-v=96021aea-734a-44d2-9ca8-2228c7de7290 (accessed on 26 September 2025).
- NASA MODIS—Moderate Resolution Imaging Spectroradiometer. Available online: https://www.earthdata.nasa.gov/data/instruments/modis (accessed on 26 September 2025).
- USGS Landsat 8 (L8) Data Users Handbook. Available online: https://d9-wret.s3.us-west-2.amazonaws.com/assets/palladium/production/s3fs-public/atoms/files/LSDS-1574_L8_Data_Users_Handbook-v5.0.pdf (accessed on 26 September 2025).
- NASA. ECOSTRESS. Available online: https://ecostress.jpl.nasa.gov/mission (accessed on 26 September 2025).
- IGI Dual-DigiTHERM. Available online: https://www.igi-systems.com/dual-digitherm.html (accessed on 26 September 2025).
- Kapil, R.; Castilla, G.; Marvasti-Zadeh, S.M.; Goodsman, D.; Erbilgin, N.; Ray, N. Orthomosaicking Thermal Drone Images of Forests via Simultaneously Acquired RGB Images. Remote Sens. 2023, 15, 2653. [Google Scholar] [CrossRef]
- Amidror, I. Scattered Data Interpolation Methods for Electronic Imaging Systems: A Survey. J. Electron. Imaging 2002, 11, 157. [Google Scholar] [CrossRef]
- Keys, R. Cubic Convolution Interpolation for Digital Image Processing. IEEE Trans. Acoust. Speech Signal Process. 1981, 29, 1153–1160. [Google Scholar] [CrossRef]
- Bovik, A.C. The Essential Guide to Image Processing; Elsevier: Amsterdam, The Netherlands, 2009; ISBN 978-0-12-374457-9. [Google Scholar]
- Duchon, C.E. Lanczos Filtering in One and Two Dimensions. J. Appl. Meteorol. 1979, 18, 1016–1022. [Google Scholar] [CrossRef]
- Ledig, C.; Theis, L.; Huszar, F.; Caballero, J.; Cunningham, A.; Acosta, A.; Aitken, A.; Tejani, A.; Totz, J.; Wang, Z.; et al. Photo-Realistic Single Image Super-Resolution Using a Generative Adversarial Network. In Proceedings of the IEEE Conference on Computer Vision and Pattern Recognition, Honolulu, HI, USA, 21–26 July 2017. [Google Scholar]
- Lim, B.; Son, S.; Kim, H.; Nah, S.; Lee, K.M. Enhanced Deep Residual Networks for Single Image Super-Resolution. In Proceedings of the IEEE Conference on Computer Vision and Pattern Recognition Workshops, Honolulu, HI, USA, 21–26 July 2017. [Google Scholar]
- Yu, J.; Fan, Y.; Yang, J.; Xu, N.; Wang, Z.; Wang, X.; Huang, T. Wide Activation for Efficient and Accurate Image Super-Resolution. arXiv 2018, arXiv:1808.08718. [Google Scholar] [CrossRef]
- Zhang, K.; Li, Y.; Liang, J.; Cao, J.; Zhang, Y.; Tang, H.; Fan, D.-P.; Timofte, R.; Gool, L.V. Practical Blind Image Denoising via Swin-Conv-UNet and Data Synthesis. Mach. Intell. Res. 2023, 20, 822–836. [Google Scholar] [CrossRef]
- Liu, Z.; Lin, Y.; Cao, Y.; Hu, H.; Wei, Y.; Zhang, Z.; Lin, S.; Guo, B. Swin Transformer: Hierarchical Vision Transformer Using Shifted Windows. In Proceedings of the IEEE/CVF International Conference on Computer Vision, Montreal, QC, Canada, 10–17 October 2021. [Google Scholar]
- Ronneberger, O.; Fischer, P.; Brox, T. U-Net: Convolutional Networks for Biomedical Image Segmentation. In Medical Image Computing and Computer-Assisted Intervention—MICCAI 2015; Navab, N., Hornegger, J., Wells, W.M., Frangi, A.F., Eds.; Springer International Publishing: Cham, Switzerland, 2015; Volume 9351, pp. 234–241. ISBN 978-3-319-24573-7. [Google Scholar]
- Zhang, Y.; Li, K.; Li, K.; Wang, L.; Zhong, B.; Fu, Y. Image Super-Resolution Using Very Deep Residual Channel Attention Networks. In Proceedings of the European Conference on Computer Vision (ECCV), Munich, Germany, 8–14 September 2018. [Google Scholar]
- Lai, W.-S.; Huang, J.-B.; Ahuja, N.; Yang, M.-H. Deep Laplacian Pyramid Networks for Fast and Accurate Super-Resolution. In Proceedings of the IEEE Conference on Computer Vision and Pattern Recognition, Honolulu, HI, USA, 21–26 July 2017. [Google Scholar]
- Kim, J.; Lee, J.K.; Lee, K.M. Accurate Image Super-Resolution Using Very Deep Convolutional Networks. In Proceedings of the 2016 IEEE Conference on Computer Vision and Pattern Recognition (CVPR), Las Vegas, NV, USA, 27–30 June 2016; pp. 1646–1654. [Google Scholar]
- Demiray, B.Z.; Sit, M.; Demir, I. D-SRGAN: DEM Super-Resolution with Generative Adversarial Networks. arXiv 2020, arXiv:2004.04788. [Google Scholar] [CrossRef]
- Pashaei, M.; Starek, M.J.; Kamangir, H.; Berryhill, J. Deep Learning-Based Single Image Super-Resolution: An Investigation for Dense Scene Reconstruction with UAS Photogrammetry. Remote Sens. 2020, 12, 1757. [Google Scholar] [CrossRef]
- Shin, D.; Spittle, S. LoGSRN: Deep Super Resolution Network for Digital Elevation Model. In Proceedings of the 2019 IEEE International Conference on Systems, Man and Cybernetics (SMC), Bari, Italy, 6–9 October 2019; pp. 3060–3065. [Google Scholar]
- Jiao, D.; Wang, D.; Lv, H.; Peng, Y. Super-Resolution Reconstruction of a Digital Elevation Model Based on a Deep Residual Network. Open Geosci. 2020, 12, 1369–1382. [Google Scholar] [CrossRef]
- Zhang, R.; Bian, S.; Li, H. RSPCN: Super-Resolution of Digital Elevation Model Based on Recursive Sub-Pixel Convolutional Neural Networks. ISPRS Int. J. Geo-Inf. 2021, 10, 501. [Google Scholar] [CrossRef]
- Shi, W.; Caballero, J.; Huszár, F.; Totz, J.; Aitken, A.P.; Bishop, R.; Rueckert, D.; Wang, Z. Real-Time Single Image and Video Super-Resolution Using an Efficient Sub-Pixel Convolutional Neural Network. In Proceedings of the IEEE Conference on Computer Vision and Pattern Recognition, Las Vegas, NV, USA, 27–30 June 2016. [Google Scholar]
- Huryna, H.; Cohen, Y.; Karnieli, A.; Panov, N.; Kustas, W.; Agam, N. Evaluation of TsHARP Utility for Thermal Sharpening of Sentinel-3 Satellite Images Using Sentinel-2 Visual Imagery. Remote Sens. 2019, 11, 2304. [Google Scholar] [CrossRef]
- Lacerda, L.N.; Cohen, Y.; Snider, J.; Huryna, H.; Liakos, V.; Vellidis, G. Field Scale Assessment of the TsHARP Technique for Thermal Sharpening of MODIS Satellite Images Using VENµS and Sentinel-2-Derived NDVI. Remote Sens. 2021, 13, 1155. [Google Scholar] [CrossRef]
- Onačillová, K.; Gallay, M.; Paluba, D.; Péliová, A.; Tokarčík, O.; Laubertová, D. Combining Landsat 8 and Sentinel-2 Data in Google Earth Engine to Derive Higher Resolution Land Surface Temperature Maps in Urban Environment. Remote Sens. 2022, 14, 4076. [Google Scholar] [CrossRef]
- Jaafar, H.; Mourad, R.; Schull, M. A Global 30-m ET Model (HSEB) Using Harmonized Landsat and Sentinel-2, MODIS and VIIRS: Comparison to ECOSTRESS ET and LST. Remote Sens. Environ. 2022, 274, 112995. [Google Scholar] [CrossRef]
- Bahi, H.; Bounoua, L.; Sabri, A.; Bannari, A.; Malah, A.; Rhinane, H. A New Thermal Fusion Method to Downscale Land Surface Temperature to Finer Spatial Resolution Using Sentinel-MSI and Landsat-OLI/TIRS Imagery. Remote Sens. Appl. Soc. Environ. 2025, 37, 101519. [Google Scholar] [CrossRef]
- Xue, J.; Anderson, M.C.; Gao, F.; Hain, C.; Sun, L.; Yang, Y.; Knipper, K.R.; Kustas, W.P.; Torres-Rua, A.; Schull, M. Sharpening ECOSTRESS and VIIRS Land Surface Temperature Using Harmonized Landsat-Sentinel Surface Reflectances. Remote Sens. Environ. 2020, 251, 112055. [Google Scholar] [CrossRef]
- Hurduc, A.; Ermida, S.L.; DaCamara, C.C. A Multi-Layer Perceptron Approach to Downscaling Geostationary Land Surface Temperature in Urban Areas. Remote Sens. 2024, 17, 45. [Google Scholar] [CrossRef]
- Beber, R.; Perda, G.; Takhtkeshha, N.; Remondino, F.; Maffei, T.; Poli, D.; Moe, K.; Cipriano, P.; Ciliberti, M. Multi-Modal Geospatial and Thematic Data to Foster Green Deal Applications. Int. Arch. Photogramm. Remote Sens. Spat. Inf. Sci. 2023, 48, 9–16. [Google Scholar] [CrossRef]
- Ermida, S.L.; Soares, P.; Mantas, V.; Göttsche, F.-M.; Trigo, I.F. Google Earth Engine Open-Source Code for Land Surface Temperature Estimation from the Landsat Series. Remote Sens. 2020, 12, 1471. [Google Scholar] [CrossRef]
- Rüdisser, D.; Posch, T.; Sulzer, W. The GRAZ Method—Determination of Urban Surface Temperatures from Aerial Thermography Based on a Three-Dimensional Sampling Algorithm. Remote Sens. 2024, 16, 3949. [Google Scholar] [CrossRef]
- Yu, F.; Koltun, V. Multi-Scale Context Aggregation by Dilated Convolutions. arXiv 2015, arXiv:1511.07122. [Google Scholar]
- Valentin, Ș. Exercise with Pixel Based Supervised Classification of Sentinel-2 Multispectral Images in R. Comparing Random Forests, SVM and Neural Networks. Zenodo 2019. [Google Scholar] [CrossRef]
- Beber, R.; Maffei, T.; Malek, S.; Poli, D.; Remondino, F. Fusion of Airborne and Spaceborne Thermal Imagery for Temperature Monitoring in Urban Areas. In Geographic Approaches to Climate Change and Mitigation: Urban and Rural Perspectives, Proceedings of the International Conference on Geographic Perspectives on Climate Change Mitigation in Urban and Rural Environments, Roma, Italy, 25–27 November 2025; Mohammad, P., Shahfahad, Comino, J.R., Matamanda, A.R., Eds.; Springer Nature: Cham, Switzerland, 2025; Volume 1, pp. 73–81. [Google Scholar] [CrossRef]
- Kingma, D.P.; Ba, J. Adam: A Method for Stochastic Optimization. arXiv 2014. [Google Scholar] [CrossRef]
- Wang, Z.; Bovik, A.C.; Sheikh, H.R.; Simoncelli, E.P. Image Quality Assessment: From Error Visibility to Structural Similarity. IEEE Trans. Image Process. 2004, 13, 600–612. [Google Scholar] [CrossRef]
- GitHub VDSR-PyTorch. Available online: https://github.com/Lornatang/VDSR-PyTorch (accessed on 26 September 2025).
- GitHub VDSR4DEM. Available online: https://github.com/OpenDEM/VDSR4DEM (accessed on 26 September 2025).
- Pir Mohammad, S.; Comino, J.R.; Matamanda, A.R. Geographic Approaches to Climate Change and Mitigation: Urban and Rural.; Springer International PU: Berlin/Heidelberg, Germany, 2025; ISBN 978-3-031-92118-6. [Google Scholar]
- ESA Copernicus LSTM. Available online: https://sentinels.copernicus.eu/copernicus/lstm (accessed on 26 September 2025).
- CNES-ISRO TRISHNA. Available online: https://cnes.fr/en/projects/trishna (accessed on 26 September 2025).
- NASA-ASI SBG-TIR. Available online: https://database.eohandbook.com/database/missionsummary.aspx?missionID=975 (accessed on 26 September 2025).
Disclaimer/Publisher’s Note: The statements, opinions and data contained in all publications are solely those of the individual author(s) and contributor(s) and not of MDPI and/or the editor(s). MDPI and/or the editor(s) disclaim responsibility for any injury to people or property resulting from any ideas, methods, instructions or products referred to in the content. |
© 2025 by the authors. Licensee MDPI, Basel, Switzerland. This article is an open access article distributed under the terms and conditions of the Creative Commons Attribution (CC BY) license (https://creativecommons.org/licenses/by/4.0/).