Highlights
What are the main findings?
- A unified multi-feature framework is proposed by integrating knowledge-driven and data-driven features for wetland mapping.
- The proposed framework achieves the highest classification accuracy among all compared methods and demonstrates stable performance across different study areas.
What are the implications of the main findings?
- Data-driven features play a dominant role in wetland mapping, while knowledge-driven features remain indispensable for introducing physical interpretability.
- Employing Random Forest improves the handling of high-dimensional features and achieves better performance under limited training data.
Abstract
Accurate extraction of land cover information and effective classification strategies are crucial for reliable wetland mapping. Data-driven approaches, such as convolutional neural networks (CNNs), demonstrate strong capability in modeling complex nonlinear relationships and learning hierarchical feature representations. However, these methods typically require large labeled datasets, are prone to overfitting and often lack interpretability. In contrast, knowledge-driven approaches based on physical models and expert-defined indices are characterized by interpretable and stable features, but their dependence on predefined formulations restricts flexibility and limits adaptability in heterogeneous environments. To address these limitations, this paper proposes an integrated framework that combines knowledge-driven and data-driven features from multi-source imagery to form a complementary feature set for wetland mapping. All extracted features are incorporated into a Random Forest (RF) classifier, enabling effective utilization of the high-dimensional and heterogeneous feature set. In addition, knowledge-driven and data-driven features are visualized and their importance is analyzed to verify their roles in classification and improve model interpretability. The Yellow River Delta and the Qilihai Wetland, representing study areas with different scales and data conditions, are selected to assess the robustness of the proposed method. The experimental results demonstrate that the proposed approach achieved the best classification performance among all comparative experiments. In the Yellow River Delta and Qilihai Wetland study areas, the Overall Accuracy (OA), Kappa coefficient, and F1-score reached 90.91%, 0.8898, 0.9136 and 91.31%, 0.8893, 0.9308, respectively. In addition, the integration of knowledge-driven and data-driven features effectively proves effective in enhancing classification robustness and improves the interpretability of feature representations.
1. Introduction
Wetlands, serving as transitional zones between terrestrial and aquatic ecosystems, play an essential role in biodiversity conservation, climate regulation, water purification, and flood mitigation [1]. Among them, coastal wetlands located at the land–sea interface are widely recognized for their crucial ecological functions [2]. Acting as natural buffers against storm surges and sea-level rise, they contribute to shoreline stabilization and safeguard ecological security in densely populated coastal regions [3]. Nevertheless, these ecosystems are increasingly threatened by human activities including urban expansion, land reclamation, and industrial pollution, as well as by climate-driven stressors including sea-level rise and extreme weather events [4]. Therefore, accurate and efficient monitoring of coastal wetlands is vital for conservation, sustainable management, and ecological restoration [5].
With its capability for large-scale observation, remote sensing has been widely applied in wetland mapping, offering valuable insights for conservation [6,7]. The model typically employed for this mapping is categorized into two main types: knowledge-driven approaches and data-driven approaches [8]. Data-driven methods refer to approaches that rely on the statistical patterns within data itself, typically employing machine learning or deep learning algorithms to learn feature representations directly from training samples [9,10]. In recent years, data-driven methods, particularly convolutional neural networks (CNNs), have demonstrated strong capability in automatically learning complex spectral, textural, and spatial feature representations for wetland mapping and classification [11,12]. Xu et al. demonstrated that CNNs could extract more sufficient and stable spectral features with higher class separability [13]. Mahdianpari et al. found that deep CNNs significantly improve classification in complex environments by automatically learning hierarchical features [14]. Zhang et al. developed an object-based CNN that excels in extracting texture and structural information, thereby improving the discrimination [15]. Rezaee et al. demonstrated that CNN outperformed traditional machine learning models such as Random Forest (RF) in spatial feature extraction for complex wetland mapping scenarios, even when utilizing a smaller number of input features (e.g., three features for CNN versus a larger set for RF [16]. Similarly, DeLancey et al. found that CNN-based deep learning algorithms are more effective in delineating ecologically meaningful boundaries and better captured the inherent complexity of land cover classes such as wetlands [17]. Data-driven methods can automatically learn complex features and improve classification accuracy, but they often rely on large amounts of training data and lack interpretability [18,19]. Knowledge-driven methods refer to approaches that rely on physical models, expert knowledge, or empirical rules to extract or classify features from remote sensing data [20]. Benefiting from their strong physical interpretability, they have been widely applied in remote sensing classification task [21,22]. Yu et al. demonstrated the effectiveness of combining spectral, textural, and structural features from Sentinel-2 images to accurately represent wetland characteristics, especially for smaller wetland patches [23]. Han et al. utilized the Sentinel-1/2 with five national wetland reserves in China and find that the incorporation of spectral, texture, shape, topographic, and geographic features from multi-source data contributed to differentiating wetland categories [24]. Tu et al. demonstrated that polarimetric and texture features extracted from PolSAR imagery provide unique spatial information that effectively complements hyperspectral data, thereby enhancing the fine classification of land cover in the Yellow River Delta [25]. However, such knowledge-driven features often rely on predefined formulations, making them less adaptable and less discriminative when applied to heterogeneous or rapidly changing wetland environments [26]. By integrating knowledge-driven physical priors with data-driven approaches, the model can enhance interpretability and maintain high classification accuracy and reliability under limited training samples [27,28].
Besides feature extraction, the effectiveness of the classifier is also critical for wetland mapping [29,30]. CNN-based classifiers, such as the commonly used softmax layer, have limited capacity in handling complex class boundaries and often lack robustness in heterogeneous environments [31]. Moreover, deep learning methods typically require large amounts of high-quality training data, which are difficult to obtain in wetlands due to complex land cover composition and the challenges of field sampling [32]. In contrast, traditional machine learning classifiers, such as RF, EXtreme Gradient Boosting (XGBoost) and Support Vector Machine (SVM), show greater robustness under limited samples [33]. However, these classifiers rely on physical models or expert knowledge, making it difficult to fully capture the complex spectral and spatial patterns of wetlands [34].
Considering the aforementioned challenges, this paper proposes a novel hybrid feature framework that integrates knowledge-driven and data-driven features from synthetic aperture radar (SAR) and optical imagery. In this framework, knowledge-driven features are extracted using the PIE platform, while CNNs are employed to capture hierarchical data-driven features that characterize complex nonlinear spatial–textural patterns. These two complementary feature sets are fused to form a unified multi-source feature set. Subsequently, a RF classifier is applied for wetland mapping, taking advantage of its ability to handle high-dimensional heterogeneous data and to perform feature importance analysis. SVM, XGBoost, and CNN (based on the Softmax function) are employed as comparative experiments to verify the effectiveness of the proposed method. The main contributions of this study are as follows:
- (1)
- A unified multi-feature framework is developed by systematically integrating knowledge-driven and data-driven features. This integration enables the joint utilization of physically interpretable and abstract representations, resulting in a more comprehensive and balanced characterization of diverse wetland land cover categories.
- (2)
- A RF classifier is applied to the integrated multi-source feature set to manage high-dimensional, multi-source features while providing robustness and quantitative interpretability through feature importance analysis.
- (3)
- A systematic feature importance and visualization analysis is conducted to quantify and interpret the complementary roles of different feature types, validating their respective contributions to accurate and physically consistent wetland mapping.
2. Methods
The overall framework of the proposed methodology is shown in Figure 1 and consists of three key modules. First, knowledge-driven features are extracted from preprocessed SAR and optical imagery on the PIE software (7.0) platform, including vegetation index, texture features, and polarimetric features, which together form the knowledge-driven feature set. Then, data-driven features are obtained by constructing multi-source image patches and applying a pre-trained CNN model to extract deep representations from the wetland dataset. Finally, the integrated feature set, combining knowledge-driven and data-driven representations, is input into an RF classifier for wetland mapping, and both classification accuracy and feature effectiveness are systematically analyzed to evaluate the robustness of the proposed framework.
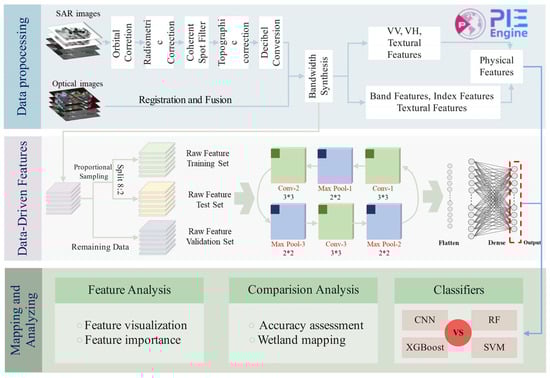
Figure 1.
Overall flow chart.
2.1. Knowledge-Driven Model Feature Extraction
PIE-Engine Studio is a geospatial data analysis and computing platform built on cloud computing. By combining massive satellite remote sensing images and geographic element data, it provides free, flexible and elastic computing services for large-scale geographic data analysis and scientific research [35]. In this paper, PIE-Engine is mainly used for the preprocessing of Sentinel-2 optical imagery, including cloud screening, cloud removal, radiometric correction, and band feature extraction, as well as for the calculation of various spectral indices.
PIE-SAR, as a radar image data processing software, supports the processing of various SAR images [36]. In this study, PIE-SAR is employed to process Sentinel-1 and Gaofen-3 (GF-3) imagery, including speckle filtering, multi-look processing, geocoding, and polarization decomposition. Specifically, C2 and T2 matrices are extracted from Sentinel-1 dual-polarized data, while C3 and T3 matrices are derived from GF-3 fully polarized images. A series of polarization decomposition features are then calculated to characterize the scattering mechanisms of wetland surfaces under different observation conditions.
The knowledge-driven features extracted in this paper based on Sentinel-2 images, Sentinel-1 and GF3 images are shown in the following Table 1. The detailed definitions and formulas of these indices are provided in Table A1 in the Appendix A to ensure transparency and reproducibility.

Table 1.
Knowledge-driven feature list.
In addition to the knowledge-driven features, original features are also extracted for comparison. These include backscatter coefficients derived from GF-3 and Sentinel-1, as well as band features from Sentinel-2.
2.2. Data-Driven Feature Extraction
Owing to their strong capability of automatically learning hierarchical and discriminative representations, Convolutional Neural Networks (CNNs) are employed for feature extraction in wetland classification [37]. We adopt a three-layer convolution–pooling CNN followed by a fully connected layer to extract high-level data-driven features, in this study, a 3 × 3 convolution kernel is used to perform feature extraction, leveraging its advantages in capturing spatial details and maintaining computational efficiency.
Given input feature maps Hl−1, the k-th output feature map of the l-th convolutional layer is defined as:
where is the k-th feature map at layer l, are the weight vector and bias, is the activation function, is the convolutional operation; The activation function ReLU in this paper is shown as follows:
The pooling layer is used to compress the feature maps obtained by the convolutional layer, reducing network complexity, preventing overfitting, and improving generalization. The calculation is expressed as:
where is the pooling function.
Finally, the fully connected layer outputs are computed as:
2.3. Parameter Settings
In the experiments, we employed the following algorithms for the wetland land-cover classification: RE, SVM, XGB, CNN (based on softmax) and the proposed method. The implementation of these algorithms is mainly based on the Python programming language, version 3.9.2. To achieve an optimal classification performance, we optimized the parameters for these classifiers. Table 2 details the optimized parameter settings for each classifier. Through these optimized settings, we aimed to improve the classification ability of the models, improving classification accuracy and ensuring the reliability and effectiveness of the experimental outcomes.
Table 2.
Optimization of the machine learning classifiers for wetland mapping.
3. Study Area and Data
3.1. Study Area
To verify the effectiveness of our method across different polarimetric data and scenarios, experiments are conducted in two coastal wetlands that differ in scale, landcover types, and data conditions. The locations of the study areas are illustrated in Figure 2. The first study area is the Qilihai Wetland (Figure 2b), located in the Ninghe District of Tianjin City near Bohai Bay. It is a semi-enclosed coastal system that functions as a transition zone between terrestrial and marine environments [38]. With a relatively small spatial extent and diverse land cover types such as buildings, bare soil, water bodies, roads, and wetlands, Qilihai exhibits fragmented and locally clustered land cover patterns. The second study area is the Yellow River Delta (Figure 2d), located at the estuary of the Yellow River in northeastern China. It is a typical river-dominated coastal wetland shaped by sediment deposition and marine dynamics, and is regarded as one of the most representative coastal ecosystems in East Asia [39]. The region covers a vast area with diverse wetland types, including tidal flats, salt marshes, mudflats, reed wetlands, and aquaculture ponds, while also being subject to intensive human activities and climate-related pressures. In contrast to the localized and fragmented Qilihai Wetland, the Yellow River Delta is characterized by large spatial extent, high landcover diversity.
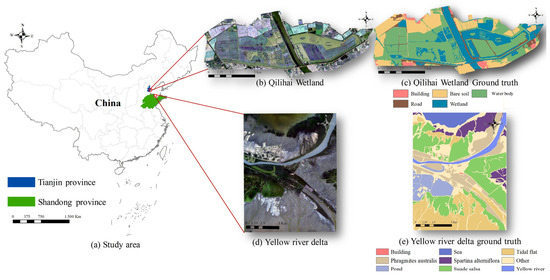
Figure 2.
Location of the study area.
3.2. Data Preparation
As shown in Table 3, Sentinel-1, Sentinel-2 and GF-3 images are employed in this study. Sentinel-1 is a C-band SAR mission with dual-polarization modes. Sentinel-2 [38] carries a multispectral instrument acquiring imagery in 13 bands from visible to shortwave infrared, among which four representative bands are selected in this study. The GF-3 satellite [39], China’s first C-band multi-polarization SAR mission, provides high-resolution observations with diverse polarization modes and wide-swath imaging capability, offering detailed ground information and rich scattering characteristics that are valuable for wetland feature identification.
Table 3.
Data source summary.
In addition to satellite imagery, ground truth data are collected to support classification and accuracy assessment. Sentinel-2 optical images are first manually interpreted based on object-based classification principles and expert knowledge to provide reliable reference information. To further refine the labeling, high-resolution UAV imagery acquired during the study period is incorporated, offering detailed land cover information in areas with complex wetland structures. Field investigations are also conducted to verify specific sites and improve sample reliability.
4. Results and Analysis
In this paper, a spatially stratified point-based sampling strategy is used, and approximately 0.1% of the available labeled samples are randomly selected. To mitigate the effects of class imbalance caused by variations in sample numbers among different land cover types, the sample sizes are manually adjusted and class weights are incorporated during model training. The detailed sample distribution for each land cover class is presented in Table 4 and Table 5. Among these, the labeled samples are randomly divided into training and testing sets in an 8:2 ratio using a spatially stratified sampling strategy to ensure representative coverage of different land cover types. The remaining 99.9% of the labeled samples are reserved for independent validation. To ensure reproducibility, a fixed random seed is applied, and this data split remains consistent across all experiments involving different data sources and classification models. A variety of multiclassification evaluation metrics, including Overall Accuracy (OA), Kappa coefficient metrics and F1-score, are calculated by analyzing the confusion matrix to assess the overall classification accuracy. The experiments are conducted in the Yellow River Delta and Qilihai Wetlands to evaluate the performance of different classifiers and feature combinations, and the detailed results are presented in the following sections.
Table 4.
Distribution of ground truth samples across land cover classes for training of Qilihai wetland.
Table 5.
Distribution of ground truth samples across land cover classes for training of yellow river delta.
4.1. Experimental Results in Yellow River Delta
4.1.1. Comparison of the Performance Between Classifiers
As shown in Figure 3, all methods achieve satisfactory performance in distinguishing major water bodies such as the Yellow River and sea. However, clear discrepancies emerge in transitional zones and vegetation-dominated regions. The Sentinel-2-based classification demonstrates superior performance in differentiating Suaeda salsa, tidal flats, and Phragmites australis, attributed to its enhanced spectral sensitivity that captures subtle reflectance differences among vegetation types. By contrast, the GF-3-based classification exhibits stronger textural and structural discrimination, proving advantageous in detecting buildings, Spartina alterniflora, and other heterogeneous surfaces. The fusion of GF-3 and Sentinel-2 data further improves classification consistency, where the complementary scattering and spectral information effectively reduces confusion between spectrally similar classes, such as Spartina alterniflora, Phragmites australis and ponds–sea surfaces, resulting in clearer and more coherent class boundaries.
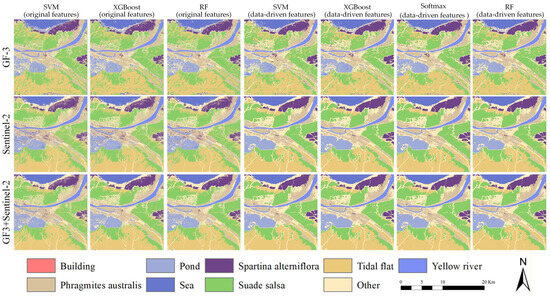
Figure 3.
Classification results of different feature–classifier combinations in the Yellow River Delta.
Regarding classifier performance, SVM shows limited robustness when applied to GF-3 data, suggesting difficulties in modeling complex scattering distributions with linear decision boundaries. RF and XGBoost yield more stable results overall but still exhibit misclassifications between water and vegetation, reflecting the limitations of using original features alone. After introducing data-driven features, all classifiers demonstrate notable performance gains. The improvement is most pronounced for SVM, as the discriminative data-driven features enhance its hyperplane construction and inter-class separability. RF achieves the highest overall accuracy, particularly excelling in challenging categories such as ponds, tidal flats, and the Yellow River, while also delineating clearer boundaries between Phragmites australis, Spartina alterniflora, and Suaeda salsa. These results highlight the capability of RF to effectively exploit high-dimensional data-driven features, providing robust and accurate classification in heterogeneous wetland environments. It is also worth noting that, despite the limited number of building samples, this category is successfully identified by the proposed method, further demonstrating its stability and effectiveness under class imbalance conditions.
As shown in Table 6, the classification accuracies vary significantly across different data sources. For the GF-3 dataset, traditional machine learning classifiers based on original features achieve relatively low accuracies, with OA values below 50%. In contrast, the Sentinel-2 dataset yields substantially higher accuracies due to its richer spectral information. When integrating GF-3 and Sentinel-2 data, all methods benefit from the complementary characteristics of spectral and scattering information, leading to overall performance improvement. Notably, the multi-source fusion further enhances classification stability, with the F1-score increasing compared with the single-source scenario, indicating that the integration effectively reduces performance fluctuations across different classes.
Table 6.
Accuracy assessment results obtained by different feature–classifier combinations in the Yellow River Delta.
From the perspective of classifier performance, SVM exhibits the weakest results, achieving only 32.87% OA on the GF-3 dataset and 57.20% on the Sentinel-2 dataset when using original features. However, after introducing data-driven features, its performance improves markedly, with OA increasing by 31.69% and 28.31% on the GF-3 and Sentinel-2 datasets, respectively. This enhancement indicates that data-driven features provide more discriminative representations, effectively alleviating the limitations of SVM in forming robust decision boundaries under complex conditions. The CNN demonstrates relatively stable performance, achieving an OA of 61.94% on GF-3 and 84.18% on Sentinel-2, outperforming most traditional classifiers. Nevertheless, its overall accuracy remains lower than that of machine learning classifiers combined with data-driven features. This is mainly attributed to the inherent limitation of the softmax layer, which relies on linear decision boundaries and struggles to fully exploit complex patterns in high-dimensional feature spaces, particularly when class boundaries are intricate or training samples are imbalanced. Among all methods, RF achieves the best performance. It not only yields significant accuracy gains in single-source datasets but also achieves the highest accuracy on the fused dataset (OA = 90.03%, Kappa = 0.8822). Owing to its ensemble learning mechanism, RF performs hierarchical partitioning of features through multiple decision trees, effectively leveraging the deep representations extracted by CNN. This enables RF to model nonlinear relationships and inter-class variability more robustly, resulting in stable and accurate classification outcomes across complex wetland environments.
4.1.2. Comparison of the Performance Between Feature Set
As shown in Figure 4, from the perspective of data sources, Sentinel-2 demonstrates superior capability in distinguishing vegetation types, effectively separating Suaeda salsa, Phragmites australis, and Spartina alterniflora. In contrast, GF-3 performs more reliably in identifying water bodies, tidal flats, and built-up areas. However, each single-source dataset still exhibits certain limitations. After fusing GF-3 and Sentinel-2 data, their respective advantages are effectively complemented. Among all feature combinations, the “knowledge-driven + data-driven” integration achieves the best overall performance, producing sharp class boundaries and spatial distributions that are highly consistent with ground truth conditions.
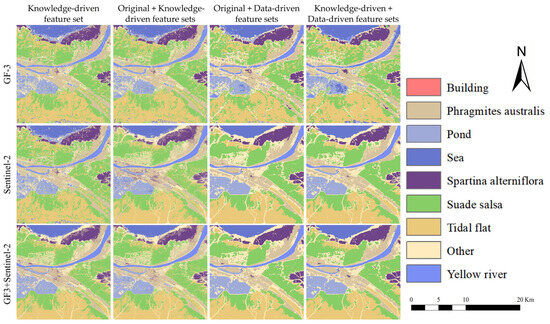
Figure 4.
Classification results in the Yellow River Delta using different feature set.
Knowledge-driven features significantly improve classification accuracy compared with original features. Original features are often affected by imaging conditions, resulting in blurred class boundaries and noticeable local noise. By incorporating knowledge-driven features—such as indices and polarimetric parameters derived from physical principles—the inter-class separability is enhanced, yielding clearer boundaries and more realistic distributions of water and vegetation classes.
Furthermore, the inclusion of knowledge-driven features on top of data-driven representations also improves classification performance. Data-driven features effectively capture complex nonlinear and spatial patterns but can be sensitive to local variations in observation conditions, occasionally causing misclassification. The introduction of knowledge-driven features provides physical priors that constrain deep representations. As shown in Figure 4, this combination not only preserves sharp class boundaries but also improves spatial consistency across the classified map.
As shown in Table 7, the classification accuracy consistently improves with the expansion of the feature set, as reflected by the steady increases in both OA and Kappa coefficient. When combining “original + knowledge-driven” features or “original + data-driven” features, classification performance shows notable improvement compared with using a single feature type.
Table 7.
Accuracy assessment results obtained by different feature set in yellow river delta.
For the GF-3 dataset, OA increases to 70.67% and 74.06%, respectively, while for Sentinel-2, the corresponding values rise to 75.35% and 89.42%. The improvement achieved by the “original + knowledge-driven” combination mainly stems from the integration of physical mechanisms. Knowledge-driven features—such as vegetation indices, polarimetric decomposition parameters, and texture descriptors—enhance the separability among water, tidal flat, and vegetation classes, thereby mitigating fluctuations in original features caused by variations in incidence angle or environmental conditions. However, since the original features remain the primary input, the overall accuracy gain is relatively limited.
In contrast, the “original + data-driven” combination highlights the advantages of data-driven features. CNN-derived representations effectively capture complex spatial patterns and reduce local noise, yielding higher accuracy than the “original + knowledge-driven” combination. Nevertheless, the inherent instability of the original features may still lead to class confusion when combined with deep representations, constraining further improvement.
Among all combinations, the “knowledge-driven + data-driven” feature set achieves the best performance. By embedding scattering and spectral mechanisms into the feature space, knowledge-driven features provide physical priors that guide the convergence of deep representations toward more physically consistent patterns, thereby strengthening inter-class separability. For instance, in the multi-source dataset, this combination achieves an OA of 90.91% and a Kappa coefficient of 0.8898, demonstrating a substantial improvement compared with the “original + knowledge-driven” scheme. In addition to the increase in OA and Kappa, the F1-score also shows a notable enhancement, improving by approximately 0.01 over the data-driven-only features. This further indicates that the proposed fusion effectively balances class-level performance and enhances the generalization capability of the model across different SAR scenes.
4.2. Experimental Results in Qilihai Wetland
To further verify the robustness capability of the proposed method, experiments are conducted in the Qilihai Wetland using Sentinel-1 dual-polarization SAR imagery and Sentinel-2 optical data. Unlike the large-scale Yellow River Delta, which benefits from full-polarization observations, Qilihai is a relatively small and fragmented coastal wetland. Its complex class boundaries and limited polarimetric information pose additional challenges for accurate classification. This supplementary experiment helps evaluate the adaptability of the proposed framework under varying ecological environments and sensor configurations.
As shown in Figure 5 and Table 8, the classification results derived from Sentinel-2 imagery clearly distinguish wetlands, bare land, and buildings, owing to the strong spectral contrast between the red and near-infrared bands. The fusion of optical and SAR data further enhances boundary continuity and improves class discrimination in transitional zones. Comparing different classifiers, SVM, RF, and XGBoost show limited performance on dual-polarization SAR data, often leading to inaccurate boundary delineation. After introducing CNN-derived data-driven features, fragmentation is reduced and spatial consistency is improved. Among all models, CNN_RF achieves the best performance across datasets. The CNN effectively extracts multi-scale texture and spatial structural features, while RF provides flexible non-parametric decision boundaries in high-dimensional feature space. This combination effectively suppresses overfitting and improves stability under limited training data conditions.
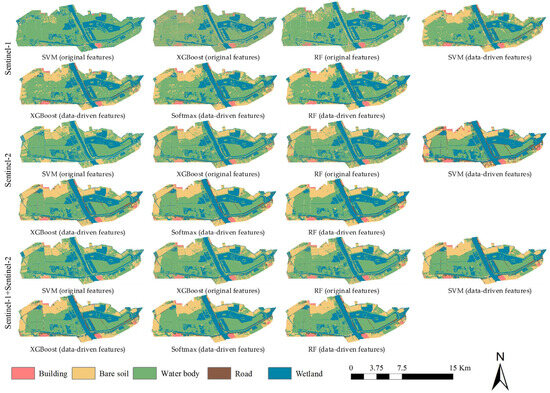
Figure 5.
Classification results in the Qilihai wetland using different classifiers.
Table 8.
Accuracy assessment results obtained by classifiers in Qilihai delta.
Figure 6 and Table 9 compare the classification performance across different feature sets. The results indicate that using only original features yields suboptimal performance, while knowledge-driven features enhance the recognition of water and vegetation. Data-driven features improve spatial consistency and noise suppression. Although the visual and numerical differences among feature sets appear small, the integrated “original + knowledge-driven + data-driven” feature set consistently achieves the highest values across multiple evaluation metrics, including OA, Kappa, and F1-score. The improvement is particularly evident in transitional and mixed classes, such as Phragmites australis and Spartina alterniflora, where feature fusion effectively reduces boundary confusion and enhances spatial coherence. Moreover, the combination of knowledge-driven and data-driven features provides greater model stability and interpretability by embedding physical priors and learned hierarchical representations within a unified framework. These results collectively support the conclusion that feature integration yields the most reliable and generalizable performance.
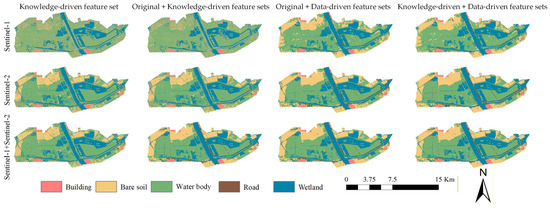
Figure 6.
Classification results in the Qilihai wetland using different feature set.
Table 9.
Accuracy assessment results obtained by different feature set.
In summary, even under dual-polarization SAR conditions, combining knowledge-driven and data-driven features with the RF classifier yields stable performance on heterogeneous, high-dimensional inputs, further demonstrating the effectiveness of the proposed framework. The consistent improvement in F1-score across both study areas further confirms the robustness of the model under class imbalance conditions. The results from the Qilihai Wetland are consistent with those of the Yellow River Delta, reaffirming the robustness and transferability of the proposed approach.
5. Discussion
Building upon the classification results presented in the previous chapter, this section further investigates the contributions of different feature types and their combinations to wetland mapping. The Yellow River Delta is selected as the study area, where fully polarimetric GF-3 SAR data provide comprehensive polarization information that facilitates an in-depth evaluation of different feature sets under complex wetland conditions. Based on this study area, the importance and effectiveness of original, knowledge-driven, and data-driven features are systematically assessed. Furthermore, the classification performance and class discrimination capabilities of different feature combinations are compared using both the RF and Softmax classifiers.
5.1. Analysis of the Feature Importance
A comprehensive understanding of feature importance is essential for interpreting model behavior and optimizing classification strategies in wetland mapping. In the Yellow River Delta, a quantitative assessment of feature contributions is conducted by analyzing the top 50 most important variables, as visualized in Figure 7.
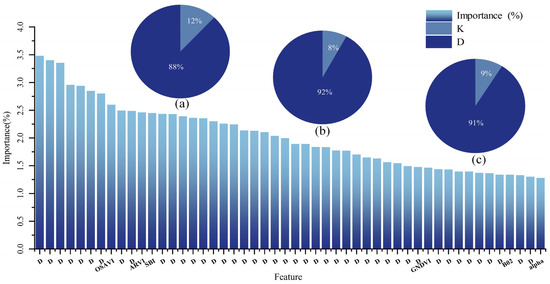
Figure 7.
Importance and percentage of features. Note: K: Knowledge-driven model features, D: Data-driven features, (a) Distribution of features in the top 50 features, (b) Distribution of features in the top 100 features, (c) Distribution of features in the top 200 features.
The results indicate that data-driven features dominate the importance ranking, accounting for 88% of the top 50 and occupying all of the top five positions. This highlights the central role of CNN-extracted data-driven features in wetland classification, as their hierarchical representation capability enables the automatic capture of complex spectral and spatial patterns, thereby improving the separability of different land-cover types. As the proportion increases, knowledge-driven features continue to dominate the overall feature composition, but data-driven features remain essential for capturing complex nonlinear patterns and improving model generalization.
Although less numerous, knowledge-driven features remain indispensable to the classification framework. Among the top 50 features, indices such as OSAVI, ARVI, SBI, GNDVI, the B2 band, and the polarimetric α parameter provide critical complementary information.
In summary, CNN-derived data-driven features form the core foundation for high-accuracy wetland classification in the Yellow River Delta, while knowledge-driven features offer essential physical interpretability. Their integration not only substantially improves classification accuracy but also strengthens model stability, underscoring the importance of multi-feature fusion in wetland mapping.
5.2. Analysis of Feature Effectiveness
Further, the performance of original features, knowledge-driven features, and data-driven features in reflecting wetland information is explored in depth through visualization, as shown in Figure 8. Overall, optical imagery provides clearer spectral distinctions, particularly in vegetation-dominated areas, where the high reflectance contrast in NIR and red bands enhances the separability of species such as Spartina alterniflora and Suaeda salsa. Conversely, SAR features, leveraging differences in backscatter intensity, are more effective in delineating water bodies and built-up areas due to their sensitivity to surface roughness and dielectric properties. Water bodies exhibit consistently low backscatter in SAR data, making them more distinguishable compared to optical imagery, which can be affected by spectral similarity with certain land cover types. These differences highlight the complementary advantages of optical and SAR data in wetland classification, where optical features excel in capturing spectral variations of vegetation, while SAR features provide crucial structural and moisture-related information.
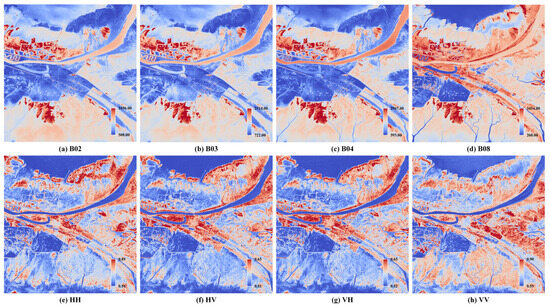
Figure 8.
Visualization of the original features.
Subsequently, high-ranking knowledge-driven features identified through feature importance analysis are visualized as presented in Figure 9. The OSAVI index demonstrates strong capacity for distinguishing water bodies, primarily due to its sensitivity to vegetation cover and its ability to suppress soil background effects, thereby reducing spectral interference in aquatic environments. ARVI effectively highlights Spartina alterniflora and Phragmites australis, benefiting from its atmospheric correction capability, which enhances vegetation contrast under varying illumination and atmospheric conditions. SBI proves effective in delineating tidal flats but exhibits limited discriminatory power for other land cover types, leading to more ambiguous classification outcomes in non-tidal regions. GNDVI contributes to improved clarity at class boundaries, indicating its usefulness in refining transitional zones between vegetation types. In contrast, the α parameter from the H/A/α polarimetric decomposition shows lower overall clarity, although a faint separation between vegetated and non-vegetated areas remains perceptible. Overall, the results indicate that different knowledge-driven features exhibit variable sensitivities to specific land-cover types. While no single feature excels in all scenarios, the combination of multiple indices provides complementary insights that enhance the robustness and interpretability of wetland classification frameworks.
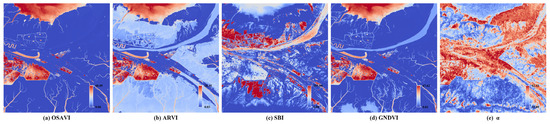
Figure 9.
Visualization of the knowledge-driven features.
To further validate the visualization results of knowledge-driven features, boxplots are generated to illustrate their distribution across different land cover categories, as shown in Figure 10. The observed distribution patterns are generally consistent with the visual analysis results. OSAVI exhibits the highest values for Sea and Pond, followed by the “Other” class, while other land cover types present lower values. This pattern supports its effectiveness in identifying aquatic features and minimizing background interference. ARVI shows strong performance in distinguishing Spartina alterniflora and Phragmites australis, both of which display significantly lower values, whereas other categories maintain higher spectral responses, enhancing vegetation class separability. SBI facilitates clear differentiation between Buildings and Tidal flats, with Buildings showing the highest values and Tidal flats the lowest, providing a strong basis for separation. GNDVI reveals a pronounced contrast between the “Other” class and all remaining categories, reinforcing its role in improving boundary delineation and enhancing classification transitions. The GNDVI and OSAVI values exhibit similar patterns because both indices are derived from the reflectance contrast between the near-infrared (NIR) and visible bands, making them similarly sensitive to chlorophyll content and vegetation vigor. Specifically, GNDVI uses the NIR and green bands, while OSAVI employs the NIR and red bands with a small soil adjustment factor (0.16). However, noticeable differences are observed in the mudflat areas, where sparse vegetation cover and strong soil background effects enhance the influence of the soil adjustment term in OSAVI, leading to greater sensitivity to surface moisture and substrate variations. The α parameter derived from H/A/α polarimetric decomposition displays substantial overlap among classes, limiting its overall discriminatory capability. Nevertheless, Buildings tend to exhibit relatively higher α values, making them marginally more distinguishable compared to other categories. Overall, the results confirm the complementary strengths of the knowledge-driven features. While each index contributes differently depending on the class context, their combined use significantly enhances the interpretability and effectiveness of wetland classification.
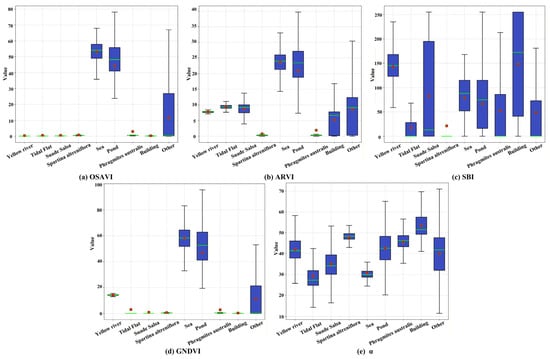
Figure 10.
Box-and-whisker diagrams of the knowledge-driven features, the Y-axis denotes the index values, the green horizontal line represents the mean, and the red square represents the median.
The data-driven features extracted through CNN are further analyzed in combination with the visualization results. Unlike predefined spectral indices or physically based features, the CNN performs hierarchical representation learning through multiple convolutional and nonlinear mapping layers. This process enables the network to automatically capture complex spatial and spectral patterns, thereby reducing dependence on manually designed features and enhancing the flexibility of feature representation. As illustrated in Figure 11, data-driven features significantly enhance the separability among different land-cover types. In Figure 11a, the Yellow River is prominently delineated, reflecting the model’s capacity to emphasize large-scale hydrological structures that are often difficult to separate using spectral features alone. Figure 11b the Spartina alterniflora area is prominently highlighted, suggesting that the CNN automatically learns species-specific texture and spatial structure patterns, consistent with the responses observed in knowledge-driven features such as ARVI. Figure 11c presents an enhanced representation of the Sea category, reflecting the CNN’s ability to identify broad and homogeneous surfaces. In Figure 11d, water bodies are distinctly segmented, further confirming the CNN’s capability to model moisture-related characteristics, in agreement with the patterns observed in SAR backscatter analysis. Moreover, Figure 11e shows clear isolation of the “Other” category, suggesting that CNN can integrate information from multiple sources to represent complex or ambiguous land cover classes. Compared to traditional feature extraction approaches, CNN-derived data-driven features exhibit stronger category-specific differentiation. This hierarchical learning ability not only enhances classification accuracy but also validates the potential of deep learning in capturing subtle spectral–spatial patterns in wetland environments.
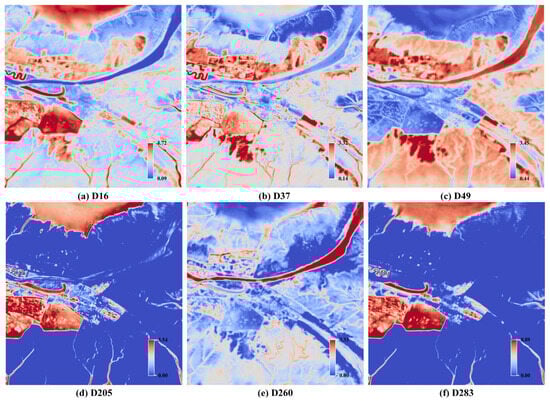
Figure 11.
Visualization of the data-driven features. Note: D: Data-driven features, the number indicates the index of the convolutional layer.
As shown in Figure 12, the statistical distributions of CNN features are consistent with the patterns observed in previous visual analyses. For example, in Figure 12a, the Yellow River region shows markedly lower feature values, consistent with its low backscattering and reflectance characteristics as a water body. Figure 12b shows clear separation of Spartina alterniflora, reflecting the network’s ability to model species-specific spectral–textural traits. Figure 12c illustrates that the Spartina alterniflora and pond regions show relatively similar feature distributions, indicating potential confusion caused by their spectral–textural similarity. By contrast, Figure 12d indicates overlap between Phragmites australis and the “Other” category, suggesting that individual deep features may sometimes lack sufficient discriminative power. Figure 12e presents the statistical distribution of CNN features for different wetland categories. The Sea and Spartina alterniflora regions exhibit distinct and relatively high feature values, indicating that the network effectively captures their strong textural and backscattering differences. However, Figure 12f demonstrates stronger divergence between these same classes when multiple features are considered jointly, underscoring the value of CNN in learning both complementary and class-specific representations. Notably, these statistical feature distributions are generally consistent with the spatial and spectral variation patterns observed in the previous imagery analyses, with some results further revealing deeper feature-level relationships. Overall, the boxplot analysis demonstrates that CNN-based features effectively characterize intra- and inter-class differences and, through multi-scale feature fusion, enhance class separability and wetland mapping accuracy.
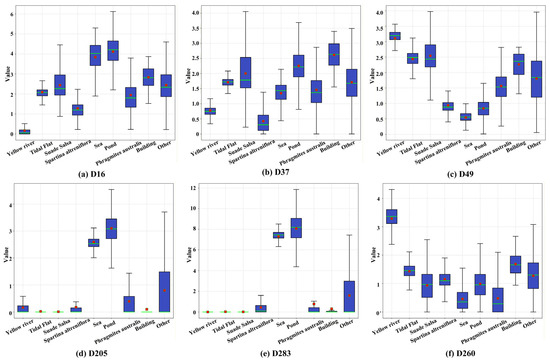
Figure 12.
Box-and-whisker diagrams of the data-driven feature. Note: D: Data-driven features, the number indicates the index of the convolutional layer, the Y-axis denotes the index values, the green horizontal line represents the mean, and the red square represents the median.
Overall, data-driven features dominate the overall mapping performance due to their ability to automatically learn complex nonlinear relationships. However, under certain conditions, knowledge-driven features remain indispensable. Spectral indices and SAR polarimetric decomposition parameters, which are derived from spectral reflectance and electromagnetic scattering mechanisms, provide physically interpretable information that complements the abstract representations learned by deep networks. When the number of training samples is limited or their distribution is uneven, these physically grounded features act as important constraints, helping to stabilize mapping performance and enhance model reliability.
5.3. Performance Comparison Between RF and Softmax Classifiers
As shown in Figure 13, under different data sources, the RF combined with CNN-extracted features (green line) achieves the best performance across most land-cover categories, demonstrating its strong capability in modeling complex and multi-source feature distributions.
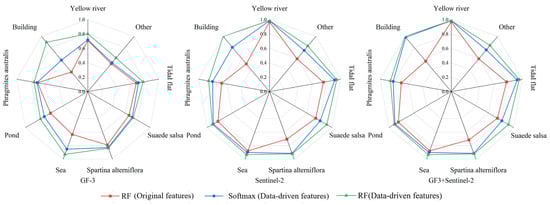
Figure 13.
User accuracy radar map of wetland categories in the Yellow River Delta.
In the GF-3 dataset, the accuracy improvements are most pronounced for the Building and Pond classes. Since SAR data mainly rely on surface roughness and dielectric properties, their spectral dimensionality is limited. As a result, the softmax classifier tends to produce misclassifications when dealing with nonlinear feature distributions or ambiguous class boundaries. Moreover, the Building class contains relatively few samples, and softmax is sensitive to class imbalance, often leading to biased predictions. In contrast, the RF classifier, which integrates multiple decision trees and performs random sampling across both features and samples, maintains high discriminative stability even under imbalanced training conditions. This mechanism substantially improves the separation between Buildings and other land-cover types such as Tidal Flats and Water Bodies.
In the Sentinel-2 dataset, the superiority of RF with CNN-derived features is most evident for Buildings, Phragmites australis, and Spartina alterniflora. The multispectral nature of Sentinel-2 enables CNN to capture subtle spectral differences, yet softmax tends to form unstable linear boundaries when classes have similar reflectance patterns or limited training samples (e.g., Phragmites vs. Spartina). RF, benefiting from its non-parametric feature partitioning, can fully exploit CNN-derived representations to build nonlinear decision boundaries, thereby improving the separability of spectrally similar vegetation classes.
When applied to the fused GF-3 and Sentinel-2 dataset, the RF model based on data-driven features achieves the highest overall accuracy. The integration of SAR and optical features improves class separability and spatial consistency, particularly for Phragmites australis, Spartina alterniflora, and the “Other” category. However, compared with the CNN model, the improvement is less pronounced than when using single-source image alone. When the feature information becomes highly abundant, the need for RF to extract additional high-dimensional information decreases, and both CNN and RF models based on data-driven features perform well. Despite the smaller improvement, RF still maintains competitive overall accuracy and strong stability across heterogeneous datasets.
Overall, CNN-derived data-driven features provide structured, multi-scale, and high-level representations for classification, while RF’s random sampling and nonlinear modeling mechanisms effectively unlock the discriminative potential of these features. In comparison, the softmax classifier shows clear limitations under conditions of limited training data, uneven feature distributions, or weak class separability, failing to fully exploit the expressive power of data-driven features.
6. Conclusions
This paper proposes a multi-feature framework for wetland classification by integrating knowledge-driven, and CNN-extracted data-driven features from multi-source imagery. A comprehensive multi-source feature set is constructed and subsequently applied to a RF classifier for land cover classification. The effectiveness of these features, along with their importance rankings, is analyzed. The following conclusions can be drawn: (1) The integration of knowledge-driven and data-driven features enables the model to capture both the spectral–structural characteristics of wetlands and their complex spatial patterns, resulting in a more comprehensive and reliable representation of wetland land cover categories. (2) Employing RF as the final classifier effectively handles heterogeneous and high-dimensional features, mitigates overfitting under limited training data, and ensures robust performance across different wetland environments. (3) Data-driven features play a dominant role in wetland classification importance, while knowledge-driven features remain indispensable for introducing physical interpretability. In summary, the proposed framework achieves stable and accurate performance under different data conditions, demonstrating strong robustness and adaptability. It provides a practical and scalable solution for ecological monitoring, wetland conservation, and sustainable management.
Author Contributions
L.Z.: methodology, formal analysis, writing—original draft preparation, writing—review and editing; Z.W.: software, investigation, writing—original draft preparation; J.W.: validation, resources, visualization; Q.H.: validation, investigation acquisition; Y.C.: supervision, funding acquisition; Z.L.: supervision, funding acquisition, project administration; J.Z.: Conceptualization, supervision, funding acquisition, writing—review and editing. All authors have read and agreed to the published version of the manuscript.
Funding
This work is supported by Open Fund of Key Laboratory of Mine Environmental Monitoring and Improving around Poyang Lake, Ministry of Natural Resources under grant No. MEMI-2023-03; in part by the Education and Industry Collaboration in Joint Training Programs under grant 230902313190244; in part by China Postdoctoral Science Foundation under Grant 2025M770250; in part by the Postgraduate Research & Practice Innovation Program of Jiangsu Province under KYCX25_3051; in part by the Graduate Innovation Program of China University of Mining and Technology under grant 2025WLJCRCZL213 and grant 2025WLJCRCZL221; in part by the Fundamental Research Funds for the Central Universities of China under the project under grant 2025-KJJC-A03.
Data Availability Statement
The original contributions presented in this study are included in the article. Further inquiries can be directed to the corresponding author.
Conflicts of Interest
The authors declare no conflicts of interest.
Appendix A
Table A1.
Characteristics and formula of index features.
Table A1.
Characteristics and formula of index features.
| Name | Formula |
|---|---|
| DVI (Difference Vegetation Index) | |
| NDVI (Normalized Difference Vegetation Index) | |
| GNDVI (Green Normalized Difference Vegetation Index) | |
| EVI (Enhanced Vegetation Index) | |
| OSAVI (Optimized Soil-Adjusted Vegetation Index) | |
| RVI (Ratio Vegetation Index) | |
| ARVI (Atmospherically Resistant Vegetation Index) | |
| HJVI (Hyperspectral Joint Vegetation Index) | |
| SI (Simple Index) | |
| SRI (Structure-Related Index) | |
| SBI (Spectral Band Index) | |
| NDSBI (Normalized Difference Snow-Brush Index) | |
| NDWI (Normalized Difference Water Index) | |
| NDSI (Normalized Difference Sand Index) |
Note: : Blue band reflectance, : Green band reflectance, : Red band reflectance, : Near-infrared (NIR) band reflectance.
References
- Salimi, S.; Almuktar, S.A.; Scholz, M. Impact of climate change on wetland ecosystems: A critical review of experimental wetlands. J. Environ. Manag. 2021, 286, 112160. [Google Scholar] [CrossRef] [PubMed]
- Liu, J.; Feng, Q.; Gong, J.; Zhou, J.; Li, Y. Land-cover classification of the Yellow River Delta wetland based on multiple end-member spectral mixture analysis and a Random Forest classifier. Int. J. Remote Sens. 2016, 37, 1845–1867. [Google Scholar] [CrossRef]
- Zhang, C.; Gong, Z.; Qiu, H.; Zhang, Y.; Zhou, D. Mapping typical salt-marsh species in the Yellow River Delta wetland supported by temporal-spatial-spectral multidimensional features. Sci. Total Environ. 2021, 783, 147061. [Google Scholar] [CrossRef] [PubMed]
- Wu, W.; Zhou, Y.; Tian, B. Coastal wetlands facing climate change and anthropogenic activities: A remote sensing analysis and modelling application. Ocean Coast. Manag. 2017, 138, 1–10. [Google Scholar] [CrossRef]
- Xing, H.; Niu, J.; Feng, Y.; Hou, D.; Wang, Y.; Wang, Z. A coastal wetland mapping approach of Yellow River Delta with a hierarchical classification and optimal feature selection framework. Catena 2023, 223, 106897. [Google Scholar] [CrossRef]
- Xiang, H.; Yu, F.; Bai, J.; Shi, X.; Wang, M.; Yan, H.; Xi, Y.; Wang, Z.; Mao, D. SHAP-DNN Approach Advances Remote Sensing Mapping of Forested Wetlands. IEEE J. Sel. Top. Appl. Earth Obs. Remote Sens. 2025, 18, 6859–6869. [Google Scholar] [CrossRef]
- Li, Y.; Yu, X.; Zhang, J.; Zhang, S.; Wang, X.; Kong, D.; Yao, L.; Lu, H. Improved Classification of Coastal Wetlands in Yellow River Delta of China Using ResNet Combined with Feature-Preferred Bands Based on Attention Mechanism. Remote Sens. 2024, 16, 1860. [Google Scholar] [CrossRef]
- Senan, C.P.P.C.; Ajin, R.S.; Devi, B.R.; Rajaneesh, A.; Nagar, J.K.; Sajinkumar, K.S. Comparative Flood Risk Mapping Using Knowledge-Driven, Data-Driven, and Ensemble Models in a Humid Tropical River Basin in India. Water Conserv. Sci. Eng. 2025, 10, 104. [Google Scholar] [CrossRef]
- Marinoni, A.; Gamba, P. Unsupervised data driven feature extraction by means of mutual information maximization. IEEE Trans. Comput. Imaging 2017, 3, 243–253. [Google Scholar] [CrossRef]
- Dong, M.; Liu, S.; Jiang, R.; Qi, J.; de Solan, B.; Comar, A.; Li, L.; Li, W.; Ding, Y.; Baret, F. Comparing and combining data-driven and model-driven approaches to monitor wheat green area index with high spatio-temporal resolution satellites. Remote Sens. Environ. 2024, 305, 114118. [Google Scholar] [CrossRef]
- Jamali, A.; Mahdianpari, M.; Brisco, B.; Granger, J.; Mohammadimanesh, F.; Salehi, B. Wetland mapping using multi-spectral satellite imagery and deep convolutional neural networks: A case study in Newfoundland and Labrador, Canada. Can. J. Remote Sens. 2021, 47, 243–260. [Google Scholar] [CrossRef]
- Onojeghuo, A.O.; Onojeghuo, A.R. Wetlands mapping with deep ResU-Net CNN and open-access multisensor and multitemporal satellite data in Alberta’s Parkland and grassland region. Remote Sens. Earth Syst. Sci. 2023, 6, 22–37. [Google Scholar] [CrossRef]
- Xu, Z.; Su, C.; Wang, S.; Zhang, X. Local and Global Spectral Features for Hyperspectral Image Classification. Remote Sens. 2023, 15, 1803. [Google Scholar] [CrossRef]
- Mahdianpari, M.; Salehi, B.; Rezaee, M.; Mohammadimanesh, F.; Zhang, Y. Very deep convolutional neural networks for complex land cover mapping using multispectral remote sensing imagery. Remote Sens. 2018, 10, 1119. [Google Scholar] [CrossRef]
- Zhang, C.; Sargent, I.; Pan, X.; Li, H.; Gardiner, A.; Hare, J.; Atkinson, P.M. An object-based convolutional neural network (OCNN) for urban land use classification. Remote Sens. Environ. 2018, 216, 57–70. [Google Scholar] [CrossRef]
- Rezaee, M.; Mahdianpari, M.; Zhang, Y.; Salehi, B. Deep convolutional neural network for complex wetland classification using optical remote sensing imagery. IEEE J. Sel. Top. Appl. Earth Obs. Remote Sens. 2018, 11, 3030–3039. [Google Scholar] [CrossRef]
- DeLancey, E.R.; Simms, J.F.; Mahdianpari, M.; Brisco, B.; Mahoney, C.; Kariyeva, J. Comparing deep learning and shallow learning for large-scale wetland classification in Alberta, Canada. Remote Sens. 2019, 12, 2. [Google Scholar] [CrossRef]
- Alzubaidi, L.; Bai, J.; Al-Sabaawi, A.; Santamaría, J.; Albahri, A.S.; Al-Dabbagh, B.S.N.; Fadhel, M.A.; Manoufali, M.; Zhang, J.; Al-Timemy, A.H.; et al. A survey on deep learning tools dealing with data scarcity: Definitions, challenges, solutions, tips, and applications. J. Big Data 2023, 10, 46. [Google Scholar] [CrossRef]
- Ball, J.E.; Anderson, D.T.; Chan, C.S. Comprehensive survey of deep learning in remote sensing: Theories, tools, and challenges for the community. J. Appl. Remote Sens. 2017, 11, 042609. [Google Scholar] [CrossRef]
- Fan, X.R.; Kang, M.Z.; Heuvelink, E.; de Reffye, P.; Hu, B.-G. A knowledge-and-data-driven modeling approach for simulating plant growth: A case study on tomato growth. Ecol. Model. 2015, 312, 363–373. [Google Scholar] [CrossRef]
- Ge, Y.; Zhang, X.; Atkinson, P.M.; Stein, A.; Li, L. Geoscience-aware deep learning: A new paradigm for remote sensing. Sci. Remote Sens. 2022, 5, 100047. [Google Scholar] [CrossRef]
- Adamo, M.; Tomaselli, V.; Tarantino, C.; Vicario, S.; Veronico, G.; Lucas, R.; Blonda, P. Knowledge-based classification of grassland ecosystem based on multi-temporal WorldView-2 data and FAO-LCCS taxonomy. Remote Sens. 2020, 12, 1447. [Google Scholar] [CrossRef]
- Lin, Y.; Guo, J. Fuzzy geospatial objects—Based wetland remote sensing image Classification: A case study of Tianjin Binhai New area. Int. J. Appl. Earth Obs. Geoinf. 2024, 132, 104051. [Google Scholar] [CrossRef]
- Liu, H.; Liao, T.; Wang, Y.; Qian, X.; Liu, X.; Li, C.; Li, S.; Guan, Z.; Zhu, L.; Zhou, X.; et al. Fine-grained wetland classification for national wetland reserves using multi-source remote sensing data and Pixel Information Expert Engine (PIE-Engine). GIScience Remote Sens. 2023, 60, 2286746. [Google Scholar] [CrossRef]
- Tu, C.; Li, P.; Li, Z.; Wang, H.; Yin, S.; Li, D.; Zhu, Q.; Chang, M.; Liu, J.; Wang, G. Synergetic classification of coastal wetlands over the Yellow River Delta with GF-3 full-polarization SAR and Zhuhai-1 OHS hyperspectral remote sensing. Remote Sens. 2021, 13, 4444. [Google Scholar] [CrossRef]
- Wang, L.; Yan, J.; Mu, L.; Huang, L. Knowledge discovery from remote sensing images: A review. Wiley Interdiscip. Rev. Data Min. Knowl. Discov. 2020, 10, e1371. [Google Scholar] [CrossRef]
- Li, Y.; Zhang, Y. A new paradigm of remote sensing image interpretation by coupling knowledge graph and deep learning. Geomat. Inf. Sci. Wuhan Univ. 2022, 47, 1176–1190. [Google Scholar]
- Huang, Z.; Yao, X.; Liu, Y.; Dumitru, C.O.; Datcu, M.; Han, J. Physically explainable CNN for SAR image classification. ISPRS J. Photogramm. Remote Sens. 2022, 190, 25–37. [Google Scholar] [CrossRef]
- Belgiu, M.; Drăguţ, L. Random forest in remote sensing: A review of applications and future directions. ISPRS J. Photogramm. Remote Sens. 2016, 114, 24–31. [Google Scholar] [CrossRef]
- Maxwell, A.E.; Warner, T.A.; Fang, F. Implementation of machine-learning classification in remote sensing: An applied review. Int. J. Remote Sens. 2018, 39, 2784–2817. [Google Scholar] [CrossRef]
- Lee, K.; Lee, K.; Lee, H.; Shin, J. A simple unified framework for detecting out-of-distribution samples and adversarial attacks. Adv. Neural Inf. Process. Syst. 2018, 31, 7167–7177. [Google Scholar]
- Joshaghani, M.; Davari, A.; Hatamian, F.N.; Maier, A.; Riess, C. Bayesian convolutional neural networks for limited data hyperspectral remote sensing image classification. arXiv 2022, arXiv:2205.09250. [Google Scholar] [CrossRef]
- Tropea, M.; Fedele, G. Classifiers comparison for convolutional neural networks (CNNs) in image classification. In Proceedings of the 2019 IEEE/ACM 23rd International Symposium on Distributed Simulation and Real Time Applications (DS-RT), Cosenza, Italy, 7–9 October 2019; IEEE: Piscataway, NJ, USA, 2019; pp. 1–4. [Google Scholar]
- Zhu, X.X.; Tuia, D.; Mou, L.; Xia, G.-S.; Zhang, L.; Xu, F.; Fraundorfer, F. Deep learning in remote sensing: A comprehensive review and list of resources. IEEE Geosci. Remote Sens. Mag. 2017, 5, 8–36. [Google Scholar] [CrossRef]
- Cheng, W.; Qian, X.; Li, S.; Ma, H.; Liu, D.; Liu, F.; Liang, J.; Hu, J. Research and application of PIE-Engine Studio for spatiotemporal remote sensing cloud computing platform. Natl. Remote Sens. Bull. 2022, 26, 335–347. [Google Scholar]
- An, Y.; Yang, F.; Xu, J.; Ren, C.; Hu, J.; Luo, G. Analysis and prediction of temporal and spatial evolution of groundwater storage by combined SAR-GRACE satellite data. IEEE Access 2024, 12, 33671–33686. [Google Scholar] [CrossRef]
- Gui, S.; Song, S.; Qin, R.; Tang, Y. Remote sensing object detection in the deep learning era—A review. Remote Sens. 2024, 16, 327. [Google Scholar] [CrossRef]
- Shen, C.; Fang, Y.; Wang, S.; Liu, Z.; Cai, X.; Tian, L. Assessing wetland ecological quality and protection effectiveness in the Qilihai Wetland using long-term multi-source remote sensing data. Geo-Spat. Inf. Sci. 2025, 1–20. [Google Scholar] [CrossRef]
- Zhang, X.; Wang, G.; Xue, B.; Zhang, M.; Tan, Z. Dynamic landscapes and the driving forces in the Yellow River Delta wetland region in the past four decades. Sci. Total Environ. 2021, 787, 147644. [Google Scholar] [CrossRef]
Disclaimer/Publisher’s Note: The statements, opinions and data contained in all publications are solely those of the individual author(s) and contributor(s) and not of MDPI and/or the editor(s). MDPI and/or the editor(s) disclaim responsibility for any injury to people or property resulting from any ideas, methods, instructions or products referred to in the content. |
© 2025 by the authors. Licensee MDPI, Basel, Switzerland. This article is an open access article distributed under the terms and conditions of the Creative Commons Attribution (CC BY) license (https://creativecommons.org/licenses/by/4.0/).