Highlights
What are the main findings?
- We developed RALSD-YOLO, a YOLOv8-based deep learning framework with five structural modifications for maize tassel detection. The model was compared with six mainstream detection algorithms under small-target, occlusion, and blur conditions, tested on the MTDC dataset for generalization, and evaluated for computational efficiency, providing a method for field monitoring.
- RALSD-YOLO achieved a precision of 96.8%, a recall of 97.9%, an mAP50 of 98.9%, and an F1 score of 97.3%. The parameter count and computational cost are 59.47% and 54.32% of those of YOLOv8n, with an inference speed of 67 FPS. The model outperforms six comparison mainstream models in detecting small, overlapping, and blurred targets.
What is the implication of the main finding?
- The high-precision detection results from RALSD-YOLO provide a reliable data basis for the spatial distribution, number, and growth status of maize tassels in the field, supporting the analysis of crop growth patterns, assessments of plant health, and guidance for agricultural management.
- The model can accurately identify the morphology and location of maize tassels, supporting efficient field monitoring, and it can be used with consecutive images to in-directly observe crop growth dynamics, aiding decision making and management in precision agriculture.
Abstract
The acquisition of maize tassel phenotypic information is important for studying maize growth and improving yield. Unfortunately, tassel detection remains challenging due to complex field conditions, including image resolution, light variation, cultivar differences, and planting density. Existing models still have limitations in detecting small, overlapping, and blurred tassels in such environments, and their size and complexity restrict deployment on mobile devices. To address this, a lightweight model, RALSD-YOLO, is developed based on the YOLOv8n architecture. In this study, a lightweight module, C2f_RVB_EMA, is introduced to replace C2f in the backbone network, reducing shallow-layer noise and lowering the number of parameters. Adown and SPPF_LSKA are used to replace Conv and SPPF, respectively, mitigating feature loss during downsampling and enhancing feature extraction in complex environments. The neck incorporates GSConv combined with the VoVGSCSP module to form a streamlined structure, achieving model compression and a lightweight design. Finally, a lightweight shared convolution detection head, LiSCDetect, is developed with group normalization, shared convolutions, and DFL post-processing, enabling feature sharing across layers and improving the precision and efficiency of small object detection. To evaluate model performance, RALSD-YOLO was compared with Faster R-CNN, SSD, YOLOv3, YOLOv5n, YOLOv7-tiny, and YOLOv8 under the same conditions. RALSD-YOLO achieved a precision of 96.8%, a recall of 97.9%, an mAP50 of 98.9%, and an F1 score of 97.3%, representing improvements of 1.3%, 2.1%, 0.4%, and 1.7%, respectively, over YOLOv8n while reducing parameter count and computational cost to 59.47% and 54.32% of those of YOLOv8n. Furthermore, on the MTDC dataset, RALSD-YOLO achieved a precision of 92.7%, a recall of 87.9%, an mAP50 of 92.1%, and an F1 score of 90.24%. The model combines high precision with a small size, making it suitable for lightweight deployment and providing effective support for intelligent maize management and harvesting decisions.
1. Introduction
Maize is one of the three major cereal crops globally and the most widely cultivated and highest-yielding grain crop [1]. It is also an important source of feed for livestock and a raw material for processing industries, contributing to food security and supporting agricultural production [2]. The maize growth cycle is divided into vegetative and reproductive stages. The vegetative stage includes emergence and stem elongation, while the reproductive stage involves tasseling, flowering, grain filling, and maturity. During the reproductive stage, tassel development affects pollination and kernel formation, influencing yield. As a monoecious plant, maize develops tassels at the top, and their size, branching, and uniformity can affect pollination [3,4]. Therefore, accurate identification and monitoring of tassels are important for studying maize growth, guiding management practices, and estimating yield. Tassel emergence marks the beginning of the reproductive stage, where nutrient uptake impacts kernel formation. Identifying tassels at this stage supports growth monitoring, fertilization management, pest control, and yield estimation [5,6,7].
Traditional tassel monitoring relies on manual methods such as field observations and phenological surveys, which are labor-intensive, time-consuming, and prone to human error [8,9]. Although remote sensing techniques such as satellite imagery have been applied to maize phenology monitoring [10], their limited spatial resolution and revisit frequency make precise tassel monitoring difficult, failing to meet high-accuracy requirements. In contrast, UAV-based imaging provides higher resolution and greater flexibility; however, automated tassel detection still faces many challenges, especially in dealing with issues such as occlusion, overlap, and small tassel size. These challenges highlight significant limitations in current remote sensing and computer vision techniques, underscoring the need for more efficient and robust methods for automated tassel detection in field environments. For example, based on Landsat imagery, Niu et al. compiled a maize phenology dataset for 1985–2020 with a 30 m resolution [11]. Using 250 m MODIS data, Sakamoto et al. developed a two-step filtering (TSF) method to identify maize phenological stages [12]. However, limited satellite revisit periods and sensor resolutions make continuous high-resolution imagery costly and difficult for farmers [13]. UAVs offer a practical solution [14,15], being easier to deploy, allowing flexible timing of data acquisition [16], and providing adjustable spatial resolution with centimeter-level quality [17,18]. Recent UAV-based studies combined with deep learning have demonstrated accurate maize tassel detection. For instance, RESAM-YOLOv8n achieved an mAP50of 95.74% and reliable tassel counting (R2 = 0.976, RMSE = 1.56) [19], while CA-YOLO reached 96% average precision and effectively detected early-stage, leaf-obscured, and overlapping tassels [20]. These results indicate that UAV imaging combined with deep learning enables continuous, high-resolution monitoring of maize phenology and tassel development. Such advances have promoted UAV-based remote sensing applications in agriculture, including crop yield estimation [21], pest and disease detection [22], and phenology identification [23].
Domestic and foreign scholars have conducted considerable research on maize tassel detection. Researchers have employed mainstream object detection frameworks such as Faster R-CNN [24], SSD [25], and YOLO [26] to improve detection precision and efficiency. For example, ResNet [27] and VGGNet [28] have been evaluated as backbone feature extractors in Faster R-CNN for maize tassel detection, with ResNet achieving higher detection precision. In addition, anchor box sizes were adjusted based on the morphological characteristics of maize tassels to improve the matching between the model and the targets. However, these anchor box settings rely on manual experience, introducing subjectivity that may limit model generalization across datasets [29]. A U-Net-based semantic segmentation method has also been used to identify tassel regions. This approach relies on UAV imagery from a single acquisition and requires post-processing to obtain tassel counts, as segmentation alone does not directly produce them [30]. A lightweight SEYOLOX-tiny model was applied to detect maize tassels in UAV field images. While the model demonstrated strong detection performance with an mAP50 of 95.0%, some tassels were missed, and the limited dataset of eight time points restricts its application for continuous tasseling monitoring [31].
YOLO uses a modular architecture, typically consisting of a backbone for feature extraction, a neck for feature aggregation, and a head for classification and regression tasks. The backbone is composed of Conv, C2f, and SPPF modules, which extract multi-scale feature information. The C2f module enhances feature representation using convolutional and Bottleneck blocks, while the SPPF module captures features at different scales through max-pooling. The neck combines Path Aggregation Network (PAN) and Feature Pyramid Network (FPN) structures to fuse features at multiple levels. The head employs a decoupled, anchor-free design with three detection heads for classification and localization, producing target categories and bounding boxes. This structure allows flexible modification and lightweight adjustment, and it is widely used in agricultural computer vision applications. YOLO-based target detection algorithms perform effectively in complex natural scenarios but rely on high computational power and large storage resources, which limits the deployment and application of mature detection models on small mobile terminals [32]. To promote the practical application of detection algorithms, research on lightweight target detection networks has become a hotspot [33].
An improved YOLOv5x network was applied to blueberry ripeness detection, where the introduction of a lightweight Little-CBAM module enhanced feature extraction. The model achieved an average mAP of 78.3%, but the real-time inference speed was only 47 FPS [34]. A lightweight THYOLO model for tomato fruit detection and ripeness classification was developed, incorporating MobileNetV3 into the backbone and employing channel pruning in the neck. The resulting model achieved a 78% reduction in parameters, with a final size of 6.04 MB and a detection speed of 26.5 FPS, while performance for dense small-object detection remained limited [35]. A multi-scale feature adaptive fusion model (MFAF-YOLO) based on YOLOv5s was developed for complex agricultural environments. The model employed K-means++ clustering of citrus fruit morphological features to optimize anchor boxes and reduce redundant detections, decreasing the model size by 26.2% to 10.4 MB [36]. These cases indicate that improving detection accuracy may increase computational demands or reduce inference speed. While lightweight designs and feature fusion can lower model size and the number of parameters, practical use in resource-limited settings still requires balancing detection performance with computational cost.
YOLO-based algorithms have been applied in fruit and vegetable detection, showing relatively stable performance for specific crops and scenarios. However, due to the diversity and complexity of agricultural environments, existing models face difficulties in achieving effective cross-crop transfer. Transfer learning can provide favorable initial parameters and accelerate model convergence, but in practice, detection models often require task-specific design or fine-tuning to adapt to different crop types and field conditions [37]. In maize tassel detection, the use of YOLO remains limited. Current models face three main challenges: (1) limited generalization across different crop datasets, which constrains cross-crop transferability; (2) reduced robustness under field conditions, where leaf occlusion and tassel overlap frequently lead to false or missed detections; and (3) insufficient representation of small or partially occluded tassels due to texture similarity and dense distribution. These issues affect the accuracy and reliability of tassel detection in practical applications. Moreover, while YOLOv8 provides higher detection precision and faster inference compared with earlier versions, it still has limitations in detecting small and densely distributed tassels, maintaining robustness under complex field conditions, and balancing model size and efficiency for potential deployment in low-compute environments.
To address these challenges, this study proposes the RALSD-YOLO model, an improved detection model based on the YOLOv8 framework. The model integrates several structural improvements: (1) the C2f_RVB_EMA module enhances the extraction of small-object features under field conditions; (2) the Adown and SPPF_LSKA modules enable multi-scale feature fusion and reduce information loss; and (3) the SlimNeck and LiSCDetect modules balance model complexity and detection accuracy, improving the handling of occluded and overlapping tassels. Compared with existing YOLO models, these improvements are expected to increase detection accuracy for small and overlapping tassels, enhance generalization across field conditions, and accelerate inference, enabling more reliable maize tassel detection. “RALSD” represents the integration of C2f_RVB_EMA (R), Adown (A), SPPF_LSKA (L), SlimNeck (S), and LiSCDetect (D) into the YOLOv8 framework.
2. Materials and Methods
2.1. Datasets
The dataset used in this study is the Multi-regional Maize Tassels (MrMT) dataset [38], which covers diverse geographic environments, lighting conditions, and maize tassel developmental stages, enhancing the generalization ability of detection models in complex field scenarios. Images were captured automatically using fixed-position cameras deployed in three maize-growing regions in China, Tai’an (Shandong), Zhengzhou (Henan), and Gucheng (Hebei), providing representative and diverse data. During data collection, the imaging devices were set to capture one image per hour from 9:00 to 16:00 daily, ensuring coverage of field conditions under varying light intensities throughout the day. Each maize tassel in the dataset was manually annotated using bounding boxes with the open-source tool LabelImg, following a standardized protocol to ensure accuracy and consistency. The annotated dataset was then split into training, validation, and test sets in an 8:1:1 ratio, ensuring sufficient data for model training while retaining representative samples for validation and testing. The data acquisition period spanned the key developmental stages of maize, from tasseling to flowering, resulting in 12 independent image sequences corresponding to different regions and years, as shown in Table 1.

Table 1.
Multi-regional Maize Tassels (MrMT dataset).
A total of 1968 high-resolution field images were collected. The average tassel size, the number of annotations, and the range of illumination variation for each region are summarized in Table 2. The dataset is characterized by small target sizes, dense distribution, diverse morphology, and mutual occlusion, which not only pose considerable challenges for detection tasks but also reflect the complexity of real-world field conditions. The MrMT dataset further enriches existing maize tassel image resources by providing additional temporal coverage, as illustrated in Figure 1. It includes images of maize tassels across various scenarios, covering multiple time sequences from tasseling to flowering stages (Figure 1A–F), as well as representative images from different locations, including Hebei 2012, Hebei 2014, Shandong 2010_1, Shandong 2011_1, Henan 2010, and Henan 2012 (Figure 1G–J). These images demonstrate diverse acquisition conditions and growth stages across both time and space, thus providing a solid data foundation for subsequent studies on the generalization and robustness of detection models.
Table 2.
Statistical Characteristics of the MTDC Dataset.
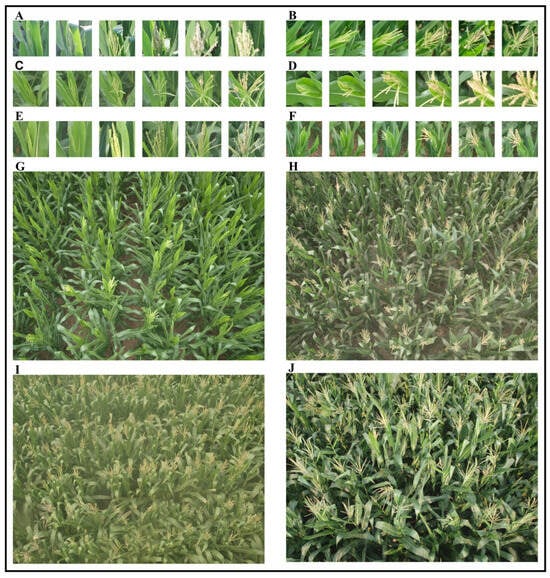
Figure 1.
Example of field imaging of maize tassels in the MrMT dataset. (A–F) present images of tassels from tasseling stage to flowering stage in multiple time sequences; (G–J) are example images in different scenarios, respectively, from Hebei2012, Shandong2011_1, Henan2010, and Henan2012.
2.2. Network Structure and Enhancements
Among the YOLOv8 series models (YOLOv8n, YOLOv8s, YOLOv8m, YOLOv8l, and YOLOv8x), YOLOv8n was selected as the base model in this study, considering a balance between detection precision and computational resource requirements. The model consists of three components: the backbone, neck, and detection head, as illustrated in Figure 2. The backbone is responsible for feature extraction and is composed of convolutional modules (Conv), the C2f module, and the SPPF module. The C2f module employs a lightweight design to maintain feature representation while alleviating gradient propagation issues, and the SPPF module uses multi-scale pooling to standardize feature map dimensions, supporting detection across different target scales. In the neck, a PANet architecture is adopted, integrating FPN and PAN pathways to achieve effective multi-scale feature aggregation and enhance contextual information interaction. The detection head employs a decoupled design, separating bounding box regression from classification tasks, which improves performance in each subtask.
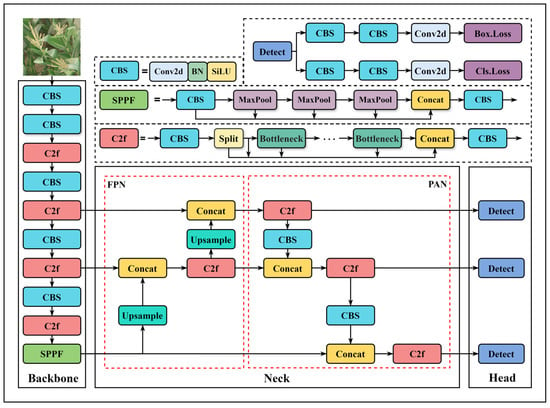
Figure 2.
Structure of the YOLOv8n model.
Training results indicate that the YOLOv8n model has certain limitations for maize tassel detection, as outlined below. First, maize tassels are small targets that can be easily overlooked in complex backgrounds, leading to missed detections for small objects. Second, tassels and leaves exhibit high similarity in morphology and texture, which can cause feature confusion and reduce recognition precision. Third, due to dense planting, tassels often occlude each other, making it difficult to fully capture target information and affecting detection performance. Considering applications with limited computational resources, such as mobile devices, it is necessary to achieve model lightweighting while maintaining detection performance. To address these issues, an improved lightweight object detection model, RALSD-YOLO, was designed based on YOLOv8n. Modifications were applied to the backbone, neck, and detection head, and the network structure is illustrated in Figure 3, with all improved modules highlighted by bold blue borders.

Figure 3.
Structure of the RALSD-YOLO model.
2.2.1. Backbone Optimization with RVB_EMA Module
To reduce the computational load of the backbone network for deployment, the bottleneck module in the C2f structure was replaced with a RepViT Block, resulting in the improved C2f_RVB module [39], as shown in Figure 4A,B, where c represents the number of channels, and w and h denote the image width and height, respectively. The RepViT Block, as the core component of the RepViT model, is a lightweight and efficient structure. As illustrated in Figure 5A, during training, this architecture integrates a multi-path topology by repositioning the 3 × 3 depthwise (DW) convolutions of the base MobileNetV3 module, which are then consolidated into a unified branch configuration during evaluation. This transformation enables the model to capture more diverse feature representations while reducing redundant computational overhead associated with multi-branch methods, including squeeze-and-excitation modules. Subsequently, 1 × 1 expansion convolutions (EConv) and 1 × 1 projection layers are applied for inter-channel interaction (channel mixing), further enhancing feature diversity and representational capacity.
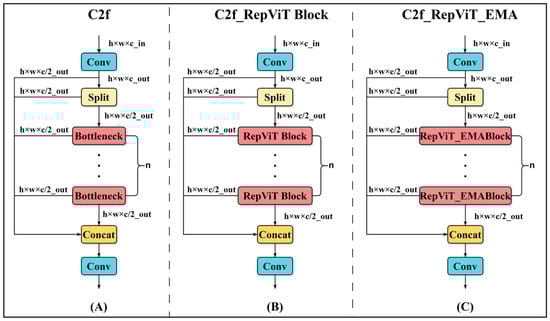
Figure 4.
Structure of the C2f_RepViT_EMA block. (A) C2f module. (B) C2f_RepViT Block(C2f_RVB) module. (C) C2f_RepViT_EMA Block (C2f_RVB_EMA) module.
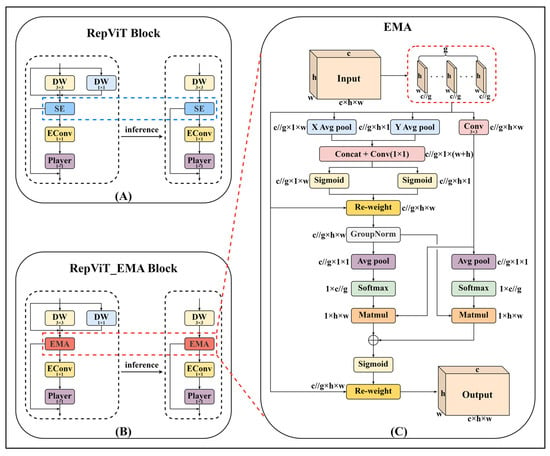
Figure 5.
Structure of the C2f_RepViT_EMA block. (A) RepViT Block (RVB) module. (B) RepViT_EMA Block (RVB_EMA) module. (C) EMA attention mechanism.
In addition, the EMA attention mechanism enhances the model’s robustness by applying an Exponential Moving Average (EMA) to historical data, effectively reducing the impact of noise or outliers and improving feature stability without directly affecting performance metrics. Its workflow is as follows: for any input X ∊ RC×H×W, EMA splits it along the channel dimension into G sub-features, i.e., X = [X0, X1, …, XG−1], where Xi ∊ RC//G×H×W to capture different semantic information. Then, EMA extracts attention weights from the grouped feature maps through three paths: the first two use 1 × 1 branches with 1 × 1 convolutions, and the third uses a 3 × 3 branch with 3 × 3 convolutions. In the 1 × 1 branch, two one-dimensional global average pooling operations along different directions are applied to encode the channels and enable cross-channel interaction. In the 3 × 3 branch, one-dimensional global average pooling and GroupNorm are omitted to obtain multi-scale features. Finally, two-dimensional global average pooling is applied to the outputs of both branches to encode global spatial information, which can be expressed mathematically as Equation (1).
Here, ZC represents the output value of the C-th channel after pooling; H and W denote the spatial dimensions of the input feature; C is the number of channels; and XC(i,j) represents the input at width i and height j of the C-th channel. The output feature maps within each group are obtained by aggregating the two generated spatial attention weights. Finally, a Sigmoid activation function is applied to capture pixel-level pairwise relationships, thereby obtaining global contextual information.
To leverage the EMA module for smoothing feature weight functions and minimizing noise interference, the SE attention in the RepViT Block was replaced with EMA attention, forming the RVB-EMA module, as illustrated in Figure 5B. This module retains the strong feature extraction and representation capabilities of the RepViT Block while adjusting the importance weights of feature maps through EMA attention, enabling the model to focus more accurately on key information. This design reduces noise interference while maintaining the model’s lightweight characteristics.
2.2.2. Adown
Conventional convolutional neural networks (CNNs) typically require a large number of parameters and FLOPs to achieve acceptable precision, primarily due to the significant redundancy in the intermediate feature maps generated by standard CNN architectures. In YOLOv8n, downsampling is performed using 3 × 3 convolutions with a stride of 2, which increases both the parameter count and computational load [40]. In this study, the Conv module of YOLOv8n was improved by incorporating the Adown module introduced in YOLOv9. This modification reduces model parameters and computational cost without affecting detection performance. The structure of the Adown module is shown in Figure 6.
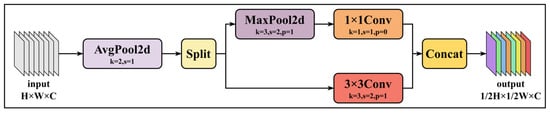
Figure 6.
Structure of the Adown Module.
The Adown module primarily consists of a 2D average pooling layer (AvgPool2d), a 2D max pooling layer (MaxPool2d), and convolutional layers (Conv). First, the 2D average pooling layer computes the mean of all values within the input feature map, smoothing the input and reducing local noise, which allows the model to capture basic image structures. The feature map is then evenly split into two groups along the channel dimension for separate downsampling. The first group passes through the 2D max pooling layer, which preserves local maximum features, reduces the spatial dimensions by half, and suppresses background noise. This is followed by a 1 × 1 convolution to fuse pixel features. The second group is downsampled using a 3 × 3 convolution with a stride of 2. Finally, the two groups are concatenated to restore the original number of channels [41].
The parameter count and computational complexity of the Adown module are mainly determined by the 3 × 3 and 1 × 1 convolutional layers. By dividing the feature map channels prior to downsampling, the module significantly reduces both parameter count and computational cost. Let the input feature map be of size h × w × c, and the downsampled feature map be of size h/2 × w/2 × c, where h and w denote height and width, and c represents the number of channels. The parameter counts Pa and computational complexity Fa of the Adown module, as well as those of the 3 × 3 convolution with stride 2 used for downsampling, can be mathematically expressed as Equations (2) and (3).
As indicated by the equations, the parameter count and computational complexity of a conventional stride-2 downsampling convolution are 3.6 times higher than those of the Adown module. By significantly reducing both parameters and computation compared to stride-2 downsampling convolutions, the Adown module enables the model to maintain performance while lowering computational cost.
2.2.3. Space Pyramid-Large Nucleus Attention SPPF_LSKA
To enhance maize tassel detection in complex environments, this study proposes an SPPF_LSKA fusion module integrated into the YOLOv8n backbone. Conventional large-kernel convolutions often involve a trade-off between modeling long-range dependencies and computational efficiency during multi-scale feature extraction, while fixed receptive field mechanisms are less adaptable to diverse scenarios such as dense leaf occlusion or background interference [42]. To address these limitations, we introduce a lightweight spatial large-kernel attention (LSKA) module, which reconstructs the standard large-kernel convolution as sequential horizontal (1 × 3) and vertical (3 × 1) separable convolutions. This design preserves long-range feature modeling capability while reducing computational cost. The LSKA module also incorporates an adjustable dilation mechanism to accommodate feature representation needs in different image regions. In densely populated target areas, such as regions with concentrated tassels, increasing the dilation rate allows the 3 × 3 convolutional kernel to achieve an effective receptive field comparable to a 5 × 5 kernel, enhancing the capture of partially occluded target edges. Conversely, in regions with complex background interference, reducing the dilation rate helps focus on local details and mitigates noise caused by leaf textures.
During feature fusion, the SPPF_LSKA module combines spatial pyramid pooling with the LSKA mechanism to perform weighted processing of multi-scale feature maps. By incorporating both original and pooled features at multiple scales and selectively fusing them using spatial attention maps, this structure differs from conventional SPPF modules, which rely solely on max pooling and static fusion and may lose fine-grained information. Under challenging conditions, such as illumination variations caused by reflections or shadows, the module maintains a balance between local feature extraction and contextual modeling, thereby improving adaptability to occluded regions. Experimental results indicate that this module enhances the detection of small maize tassels under dense occlusion while preserving the model’s overall lightweight characteristics. The module structure is illustrated in Figure 7.
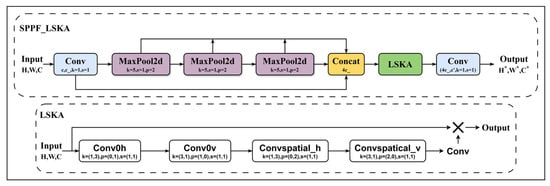
Figure 7.
Structure of the SPPF_LSKA Module.
2.2.4. SlimNeck Structure of Neck
In the original YOLOv8 architecture, the Neck employs standard convolution operations. As network depth increases, both computational cost and parameter count grow, potentially leading to structural redundancy and affecting deployment efficiency and inference speed in maize tassel detection tasks. Complex structures may also influence detection stability and the model’s adaptability across different scenarios. To address these issues, this study proposes a structural adjustment that reduces computational overhead while maintaining detection precision. Specifically, a hybrid convolution structure, GSConv (Generalized Sparse Convolution), is integrated with the VoVGSCSP module to construct a lightweight Neck, referred to as the SlimNeck.
As shown in Figure 8, the GSConv module consists of standard convolution (SC), depthwise separable convolution (DSC), and channel shuffle operations [43]. The structure first extracts deep features using SC, followed by shallow feature extraction with DSC. The resulting features are then concatenated and rearranged through the shuffle operation. By combining the characteristics of both convolution types, GSConv reduces computational cost while retaining essential feature extraction capability.
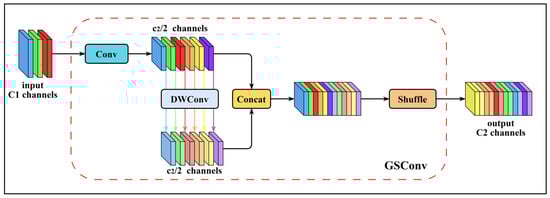
Figure 8.
Structure of the GSConv module.
As shown in Figure 9, the VoVGSCSP module is built upon the GS-Bottleneck structure, integrating GSConv with standard convolution and functioning as a cross-layer connection module. This module employs a single aggregation strategy to reduce redundant computations and simplify the design while maintaining detection performance under controlled parameters. The module features two feature extraction paths: the first directly extracts input features through convolution with a relatively simple structure, while the second applies convolution followed by further processing using the GS-Bottleneck constructed from GSConv. The outputs of both paths are finally concatenated along the channel dimension, combining information from different levels to enhance feature representation. By combining GSConv and GS-Bottleneck, the module balances network complexity and parameter count while improving feature integration, making it suitable for scenarios with limited computational resources and ensuring stable performance.
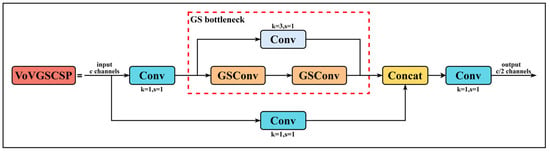
Figure 9.
Structure of the VoVGSCSP module.
In the RALSD-YOLO model, the SlimNeck structure embodies a lightweight design approach. It receives feature maps from multiple backbone layers (e.g., P3, P4, P5) that differ in resolution. To enable multi-scale feature fusion, upsampling and downsampling operations are applied as needed. For instance, the P3 feature map is upsampled to align with P4, while fusion with P5 may involve downsampling to ensure consistency in spatial dimensions and semantic information, thereby facilitating effective multi-scale feature integration.
The SlimNeck enhances feature propagation through hierarchical fusion and scale-alignment mechanisms. By combining GSConv’s dual-path convolution strategy with the aggregation approach of the VoVGSCSP module, it preserves multi-scale feature representation while reducing computational load, supporting efficient deployment and operation in tasks such as maize tassel detection.
2.2.5. Lightweight Shared Convolutional Detection Head
In the detection head, a novel LiSCDetect module was designed, representing a lightweight shared convolution detection head. This head improves feature extraction efficiency while reducing computational cost through shared convolution operations. Features are first processed using Conv_GN [44], then passed through a shared convolution network (share_conv) composed of two sequential Conv_GN layers. Subsequently, two separate convolution layers compute bounding box regression and classification probabilities, followed by post-processing using scale and DFL (Distributional Focal Loss). This design enables feature sharing across multiple detection layers, thereby enhancing both detection precision and efficiency.
Let the input feature map have a height of H1 and a width of W1, with the hidden layer containing Cidc channels. The parameter counts S1 and computational cost M1 of the shared convolution layer can be calculated as shown in Equation (4).
In a conventional detection head, the convolutional module consists of two 3 × 3 convolution layers and one 1 × 1 convolution layer. Let the input feature map have a height of H2 and a width of W2, with the first convolutional layer having Cc1 input channels and the second layer having Cc2 channels and let the maximum regression value be Rmax. The parameter counts M2 and computational cost S2 can be expressed as shown in Equation (5).
Comparing Equations (3) and (4), it can be observed that when the channel numbers are similar, the parameter count and computational cost of the shared convolution layer involve only a single squared term of the channel number. In contrast, conventional convolution layers include multiple channel multiplication operations and the maximum regression value, resulting in higher parameter and computational demands. Traditional detection heads process each feature map independently, whereas LiSCDetect improves feature extraction efficiency through shared convolutions. Additionally, LiSCDetect employs Distributional Focal Loss to enhance the precision of bounding box regression. Figure 10 illustrates the architecture of LiSCDetect.
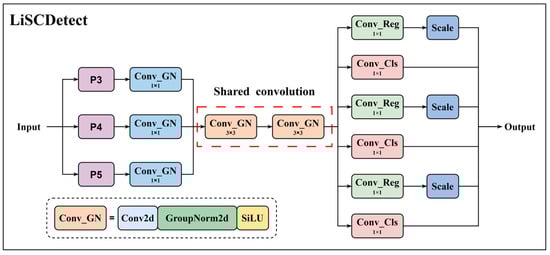
Figure 10.
Structure of the LiSCDetect detection head.
2.3. Experimental Platform and Model Initialization Configuration
To ensure fairness and consistency in the experiments, all models in this study were trained and tested on a unified experimental platform. The specific configuration is presented in Table 3.
Table 3.
Configuration list of experimental platform parameters.
To ensure a fair comparison in the experiments, data augmentation was limited to techniques shared by Faster R-CNN, SSD, and the YOLO series. The experimental training parameters for this study are presented in Table 4. The same configuration was used to train, validate, and test all experimental algorithms.
Table 4.
Experimental model initialization configuration.
2.4. Experimental Evaluation Metrics
To comprehensively evaluate the performance of RALSD-YOLO, a multi-dimensional assessment framework was established, incorporating precision (P), recall (R), mean average precision (mAP), F1 score, number of parameters, model size, floating-point operations (FLOPs), and frames per second (FPS). This evaluation considers both detection accuracy and computational efficiency, aiming to provide an objective assessment of the model across multiple aspects. Precision (P) quantifies the reliability of positive predictions by measuring the proportion of correctly detected targets among all predicted positives, defined by true positives (TP) and false positives (FP). Recall (R) evaluates the completeness of detection by measuring the proportion of correctly detected positives among all actual positives, defined by TP and false negatives (FN). The F1 score combines precision and recall through their harmonic mean, providing a balanced indicator of performance, particularly in cases of imbalanced sample distributions. The respective formulations for these metrics are presented below.
Average Precision (AP) provides a comprehensive evaluation of detection performance for individual object classes, calculated as the area under the precision–recall curve. Based on AP, overall performance is reported using mAP50, where the intersection over union (IoU) threshold is set to 0.5, and mAP50-95 where IoU thresholds range from 0.5 to 0.95. These metrics mitigate the influence of class imbalance and provide a more reliable reflection of model performance across different classes. The formulations of these metrics are provided below.
3. Results and Analysis
3.1. Ablation Experiments
3.1.1. Ablation Study of Individual Modules
To evaluate the optimization effect of the lightweight C2f_RVB_EMA module, this study employed a controlled experimental approach to compare the performance of the base model with and without the lightweight architecture. The results are summarized in Table 5.
Table 5.
Lightweight module ablation experiments.
The C2f_RVB_SE module is constructed based on the RepViTBlock from RepViT (CVPR 2024). In the C2f_RVB_EMA module, the conventional SE attention mechanism is replaced with the more expressive EMA mechanism, aiming to enhance the model’s sensitivity to key target regions and multi-scale features while further reducing model size without compromising precision. The spatial interaction capability of EMA guides the model to focus on critical defect features, resulting in overall superior performance of C2f_RVB_EMA compared to C2f_RVB_SE. This indicates that C2f_RVB_EMA demonstrates improved recognition ability, particularly in scenarios requiring high detection precision. Experimental results show that C2f_RVB_EMA achieves a clear balance between parameter efficiency and detection precision, enabling model lightweighting while maintaining detection performance.
Based on the analysis in Table 5, replacing the C2f module with C2f_Star or C2f_Faster can increase the model’s mAP50 while maintaining a lightweight design, although overall precision decreases by 0.3%, and mAP50-95 decreases by 1.1% and 1.3%, respectively. When using the C2f_ODConv module, both model size and parameter count are significantly reduced, but precision and recall decrease by 3% and 2.3%, and mAP50 and mAP50-95 both drop by 0.8%. With the C2f_RVB module, precision and recall decrease by 0.5% and 0.8%, while mAP50-95 increases by 0.5%. Using the C2f_RVB_SE module, precision and recall decrease by 0.3% and 0.2%, whereas mAP50 and mAP50-95 increase by 0.1% and 0.4%, respectively. By adopting the C2f_RVB_EMA module proposed in this study, precision and recall both increase by 0.1%, mAP50 and mAP50-95 improve by 0.2% and 0.5%, and model size and parameter count are reduced by 7.3% and 11.2%, respectively.
3.1.2. Ablation Study of Combined Modules
To evaluate the contribution of each improvement module, a series of ablation experiments were conducted. Two strategies were adopted: first, the modules were individually incorporated into the base model to examine their influence on performance; second, different modules were combined to assess their effectiveness when integrated. This experimental design enables a detailed analysis of each module and their combinations. The results of the ablation experiments are presented in Table 6, where “✓” indicates that the module is used, and the absence of “✓” indicates that the module is not used.
Table 6.
Ablation experiment for each modified module.
Among the two-module combinations, “SlimNeck+LiSCDetect” demonstrated relatively strong performance. Compared with YOLOv8n, precision and recall increased by 0.8% and 0.5%, respectively. However, this configuration resulted in a 2% increase in model parameters, which deviates from the study’s lightweight design objective. In contrast, “C2f_RVB_EMA+LiSCDetect” achieved the greatest parameter reduction, decreasing the model size by 30%. Under this configuration, precision decreased by 0.1%, while recall remained consistent with the baseline model.
In experiments involving three modifications, all combinations demonstrated improved performance compared with YOLOv8n. Among these, “C2f_RVB_EMA+SlimNeck+LiSCDetect” achieved a favorable balance between precision and model size, with both precision and recall increasing by 0.6%, and model parameters reduced by 41%. Although this configuration met the preset optimization objectives, further experiments indicated that even more effective combinations could be achieved.
In experiments involving combinations with more modules, the final configuration outperformed all previous schemes across all evaluation metrics. Compared with YOLOv8n, its precision and recall increased by 1.3% and 2.1%, respectively, and the number of parameters was reduced by 41%. The “C2f_RVB_EMA+Adown+SlimNeck+LiSCDetect” configuration achieved the greatest reduction in parameters, decreasing model size by 49.8%, although its performance improvements were lower than those of the former. Considering the importance of precision in object detection tasks, the final configuration was selected as the optimal scheme and designated RALSD-YOLO.
Heatmaps were also generated for YOLOv8n and RALSD-YOLO to visualize their performance, as shown in Figure 11. The bounding boxes in the figure indicate that RALSD-YOLO produces fewer false detections compared with YOLOv8n and demonstrates stronger feature extraction capability for maize tassels. However, the improved network still exhibits some missed detections. As shown in Figure 11, when the tassel color closely resembles the surrounding environment, the model may fail to detect the tassels, which may also be related to image quality.
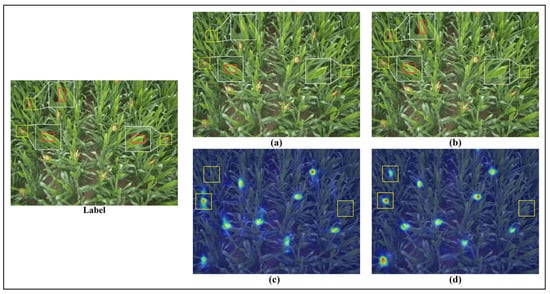
Figure 11.
Comparison of heatmap results. “Label” indicates the annotated image; (a) shows the detection results of YOLOv8n; (b) shows the detection results of RALSD-YOLO; (c) shows the heatmap results of YOLOv8n; (d) shows the heatmap results of RALSD-YOLO.
3.2. Experimental Results Comparison
3.2.1. Result Comparison with Other Networks
To demonstrate the advantages of RALSD-YOLO in maize tassel detection, a comprehensive comparison was conducted. Five advanced object detection networks—Faster R-CNN, SSD, YOLOv3, YOLOv5n, and YOLOv7-tiny—were selected and evaluated alongside the original YOLOv8n and the proposed RALSD-YOLO. The performance metrics of each network on the MrMT test dataset are summarized in Table 7.
Table 7.
Comparison of detection results on the test dataset.
As shown in Table 7, the RALSD-YOLO network achieved an mAP50 that was 0.4% higher than the best-performing YOLOv8n and 27.8% higher than the lowest-performing SSD. For mAP50-95, it exceeded the highest YOLOv5n by 0.9% and outperformed the lowest SSD by 43.4%. The recall rate of RALSD-YOLO was 2.1% higher than YOLOv8n and 46.2% higher than SSD. Among the seven compared models, it achieved the highest precision, surpassing the lowest SSD by 46.2%, with YOLOv8n showing the closest performance; the improved model exceeded YOLOv8n by 1.3% in precision. Regarding the F1 score, RALSD-YOLO improved by 1.7% over YOLOv8n, 2.8% over YOLOv5n, and 35% over SSD.
In the MrMT test dataset, three images from the maize tasseling stage were selected to visually compare the tassel detection performance of seven network models, as shown in Figure 12, Figure 13 and Figure 14. Each figure contains nine subplots: (a) represents the original test image, (b) shows the manually annotated complete and accurate tassels, and the remaining seven subplots correspond to the tassel detection results from each network model in the given scene. The early-stage tassel detection results of the seven models are presented in Figure 12. In these images, the maize tassels are very small. Three representative tassels were selected for comparative analysis, and the results indicate that only RALSD-YOLO successfully detected all three tassels.
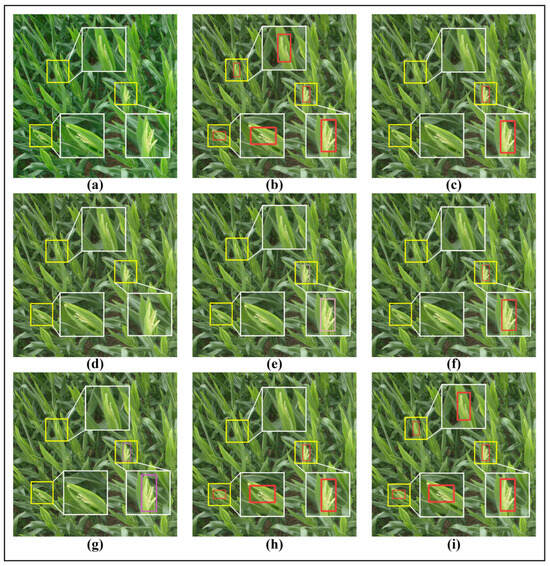
Figure 12.
Comparison of detection results at the early tasseling stage. (a) represent the original image; (b) represent the label image; (c) represent the detection result of Faster R-CNN; (d) represent the detection result of SSD; (e) represent the detection result of YOLOv3; (f) represent the detection result of YOLOv5n; (g) represent the detection result of YOLOv7-tiny; (h) represent the detection result of YOLOv8n; (i) represent the detection result of RALSD-YOLO.
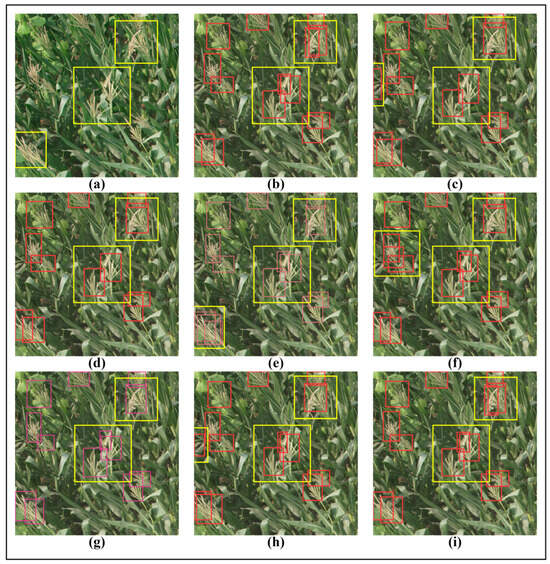
Figure 13.
Comparison of detection results of maize tassels under overlapping scene. (a) represent the original image; (b) represent the label image; (c) represent the detection result of Faster R-CNN; (d) represent the detection result of SSD; (e) represent the detection result of YOLOv3; (f) represent the detection result of YOLOv5n; (g) represent the detection result of YOLOv7-tiny; (h) represent the detection result of YOLOv8n; (i) represent the detection result of RALSD-YOLO.
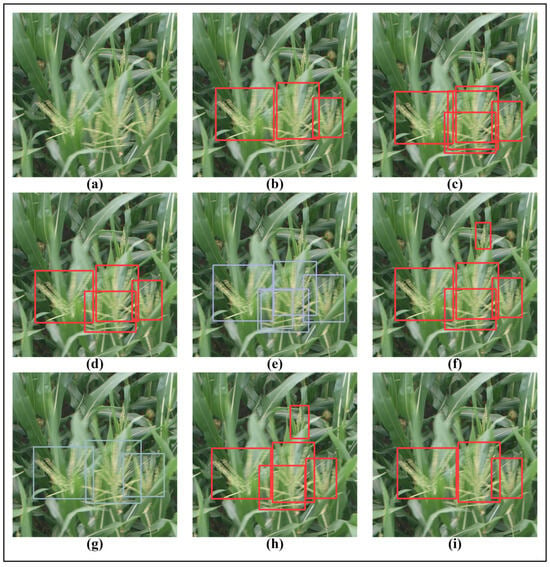
Figure 14.
Comparison of detection results of maize tassels under blurred scene. (a) represent the original image; (b) represent the label image; (c) represent the detection result of Faster R-CNN; (d) represent the detection result of SSD; (e) represent the detection result of YOLOv3; (f) represent the detection result of YOLOv5n; (g) represent the detection result of YOLOv7-tiny; (h) represent the detection result of YOLOv8n; (i) represent the detection result of RALSD-YOLO.
During the tasseling stage, the detection results of the seven network models under overlapping tassel conditions are shown in Figure 13. The results indicate that only the RALSD-YOLO network accurately identified the overlapping maize tassels, whereas the other models mistakenly detected them as single tassels.
Figure 14 presents the detection results in the late tasseling stage, where the tassels appear blurred in the images. The results show that only RALSD-YOLO and YOLOv7-tiny were able to accurately detect all three blurred tassels, while the remaining models exhibited both missed detections and false positives.
3.2.2. Network Comparison in Different Growth Stages
To evaluate the detection performance of different network models at various tasseling stages, the precision of the seven models was calculated separately on the test subsets corresponding to early, mid, and late tasseling periods. Notably, the proportion of each stage in the test subsets was kept consistent with that in the full dataset to ensure the objectivity and comparability of the results. The performance of each model at different stages is summarized in Table 8.
Table 8.
Comparison of detection results in different periods on the test dataset.
From the results, it can be observed that the mAP50 and mAP50-95 values for the proposed model at various tasseling stages are the highest. The mAP50 values for the early, mid, and late stages are 90.9%, 96.8%, and 98.9%, respectively, with the best detection performance observed in the late stage. All models exhibit the pattern that detection performance is highest in the late tasseling stage, followed by the mid-stage, and lowest in the early stage.
3.3. Verification of Generalization Capabilities on MTDC
The Maize Tassels Detection and Counting (MTDC) [45] dataset is widely used in studies related to maize tassel detection. This dataset was collected from four experimental fields in China between 2010 and 2015 and includes six different maize varieties, as summarized in Table 9. It provides a total of 186 training images and 175 testing images. The testing images are drawn from image sequences different from those in the training set, resulting in a certain distributional discrepancy. This division allows for evaluating the model’s adaptability and generalization capability under varying data distributions.
Table 9.
Maize tassels detection and counting dataset (MTDC dataset).
To evaluate the generalization capability of the RALSD-YOLO model on heterogeneous data, the MTDC dataset was used as an external test set. Compared with the MrMT dataset, the MTDC dataset differs in image acquisition devices, shooting conditions, image style, and annotation standards, providing an opportunity to assess the model’s adaptability to non-homogeneous data. To examine the performance of RALSD-YOLO under different data distribution conditions, a comparative analysis was conducted on the MTDC dataset, as summarized in Table 10.
Table 10.
Performance comparison of MTDC datasets in RALSD-YOLO model.
Comparative experiments of the RALSD-YOLO model were conducted on the MrMT and MTDC datasets to evaluate its generalization capability. The model exhibited distinct performance characteristics across the two datasets: on the MTDC dataset, it achieved high precision but relatively lower recall, indicating a more conservative target identification with notable missed detections and limited overall coverage; on the MrMT dataset, precision increased to 96.8% and recall to 97.9%, demonstrating that the model effectively reduces false positives while enhancing detection of true targets, achieving a balance between precision and completeness. The F1 scores across both datasets exceeded 90%, confirming the effectiveness of the model improvements and its stability under varying conditions, as shown in Table 10. Additionally, heatmaps were generated for YOLOv8n and RALSD-YOLO to visualize performance differences, as illustrated in Figure 15.
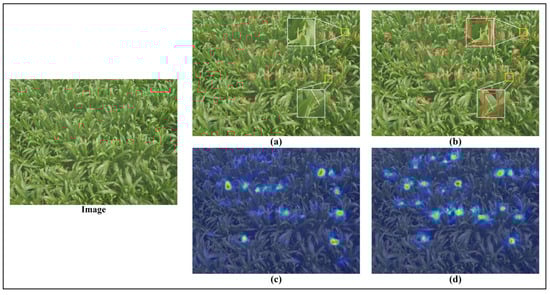
Figure 15.
Comparison of detection results on the MTDC dataset. “Image” represents the original image; (a) shows the detection results of YOLOv8n; (b) shows the detection results of RALSD-YOLO; (c) presents the heatmap results of YOLOv8n; (d) presents the heatmap results of RALSD-YOLO.
4. Discussion
4.1. Analysis of RALSD-YOLO
Deep learning has been widely applied to detect grain crops and fruits, such as rice [46], strawberry [47], and grape [48], but research on maize tassel detection remains limited. Tassel morphology is an important indicator of the reproductive stage, directly affecting pollination and yield. In this study, tassels were classified into three growth stages to improve detection across developmental periods. The proposed RALSD-YOLO model achieved 96.8% accuracy with a model size of 3.9 MB. Compared with existing detection methods, it maintains a compact structure while achieving higher performance, operating stably under complex field conditions and is suitable for deployment on small devices or UAVs.
RALSD-YOLO achieved strong performance in detecting maize tassels at the early, middle, and late stages, with average precisions of 90.9%, 96.8%, and 98.9%. Late-stage tassels are medium-sized and contrast clearly with the background, making detection easier. Compared with other mainstream models (Table 7), its superior performance is attributed to several improvements: RVB-EMA reduces shallow-layer noise and parameters; Adown and SPPF_LSKA enhance multi-scale feature extraction; GSConv with VoVGSCSP streamlines the neck; and the LiSCDetect head enables cross-layer feature sharing, improving detection of small and occluded tassels. These changes increased accuracy by 1.3% while reducing FLOPs, parameters, and model size by 46.3%, 40.5%, and 38.1%, respectively, achieving a balance between accuracy and efficiency.
Computational efficiency is an important metric in object detection. Table 11 shows the FPS of each network. RALSD-YOLO achieves 67 FPS, slightly lower than SSD and YOLOv8n, with SSD reaching 119 FPS. Compared with YOLOv8n, RALSD-YOLO reduces parameters and computational complexity, but the improved modules increase sequential dependencies, thereby reducing parallelism and slightly lowering processing speed. Overall, RALSD-YOLO balances accuracy and efficiency, outperforming the other networks.
Table 11.
Comparison of detection speed on the test dataset.
The generalization of RALSD-YOLO was evaluated on the MTDC dataset, which differs from the MrMT dataset in acquisition devices, conditions, image styles, and annotation standards. As shown in Table 10, all metrics decreased, but precision and F1 remained above 90%. Figure 15 shows that RALSD-YOLO outperformed YOLOv8n in detection, confirming the effectiveness of the model and its stable performance across different environments.
4.2. Limitations and Future Work
In this study, the RALSD-YOLO model was applied to maize tassel detection under complex field conditions, achieving high detection precision with a lightweight design and addressing challenges such as multi-scale variation, occlusion, and background interference. However, the generalization of the model is limited by the characteristics of the MrMT dataset, which does not fully capture the diversity of maize tassels or the range of environmental conditions, including variations in illumination, occlusion, viewing angles, shooting distances, weather, and background complexity. These limitations reflect practical constraints during data collection, such as seasonal restrictions, labor-intensive annotation, and the difficulty of covering all possible scenarios. Future work will focus on validation using additional or independently collected datasets to provide a more comprehensive assessment of the model’s performance and adaptability under diverse field conditions.
Future work will focus on several directions to mitigate these limitations and strengthen model validation. First, real-world data covering a broader range of maize varieties, growth stages, and environmental conditions—particularly the complex scenarios mentioned above, including illumination, occlusion, viewing angles, and weather—will be collected to construct a more representative dataset, thereby improving the model’s robustness and generalization capability. This includes plans to evaluate the model on independently sourced datasets to verify its applicability across diverse scenarios. Second, algorithmic optimization will be explored to address the challenges of highly occluded tassel detection, focusing on more effective feature extraction and fusion strategies. Finally, the current detection framework will be extended to enable precise classification in complex environments, further exploring its potential applications in intelligent management. The high precision of RALSD-YOLO, combined with its lightweight design (1.79 M parameters, 4.40 GFLOPs), demonstrates its potential for integration into cost-effective edge computing systems. This provides a foundation for practical applications such as automated yield estimation and is expected to reduce labor costs associated with manual counting.
Based on the present study, future research should further expand the coverage of environmental interference factors and establish datasets that more closely represent real-world production fields. This approach is significant not only for the practical application of accurate maize tassel detection but also provides a reference for growth monitoring of other crops under complex conditions. The aim of this study is to develop precise and efficient intelligent agricultural detection methods and to enhance their applicability in agricultural scenarios through continuous optimization of model architectures and expansion of datasets.
5. Conclusions
The main objective of this study was to develop a lightweight model for maize tassel detection. RALSD-YOLO was constructed based on YOLOv8n, with structural modifications to the backbone, neck, and detection head aimed at improving feature extraction while reducing computational complexity. In the backbone, a lightweight feature extraction module, an improved downsampling operation, and a multi-scale attention mechanism were introduced to enhance the representation of tassels at different scales and capture relevant features more efficiently. In the neck, a streamlined structure facilitated the aggregation of fine-scale features, and the detection head was redesigned to allow feature sharing across multiple layers, improving the model’s response to small and partially occluded tassels in complex field environments. These modifications collectively contributed to a balance between computational efficiency and detection accuracy.
The model was trained and evaluated on the MrMT dataset, showing higher precision and recall than conventional detection models, including YOLOv3, YOLOv5n, YOLOv7-tiny, Faster R-CNN, and SSD. Its generalization capability was further assessed on the MTDC dataset, demonstrating stable performance across different growth stages, lighting conditions, and field environments. Analysis indicated that detection performance was affected by tassel size, overlap, and background complexity, suggesting potential limitations when applied to diverse field conditions. These findings provide insights into the factors influencing tassel detection and can guide future improvements in model design and data acquisition strategies.
Although the model achieved satisfactory performance, there remains room for improvement. Future work will focus on incorporating datasets covering a wider range of maize varieties to enhance adaptability under diverse conditions. In addition, weakly supervised learning techniques will be explored to reduce reliance on manual annotation and decrease the associated labeling workload. These developments aim to further support automated tassel monitoring and quantitative yield estimation in agricultural production.
Author Contributions
Conceptualization, H.C.; methodology, H.C.; software, H.C. and Z.Z.; validation, H.C., A.Z. and Q.L.; formal analysis, H.C. and Z.Z.; investigation, H.C., A.Z. and Q.L.; resources, S.C. and Z.X.; data curation, H.C.; writing—original draft preparation, H.C.; writing—review and editing, S.C. and Z.X.; visualization, H.C.; supervision, S.C. and Z.X.; project administration, H.C., S.C. and Z.X.; funding acquisition, S.C. and Z.X. All authors have read and agreed to the published version of the manuscript.
Funding
This research was supported by the Changchun Science and Technology Development Plan Project, the Major Science and Technology Special Project of the Changchun Satellite and Application Industry (Intelligent Evaluation of High-Precision Yield and Quality of Maize at the Plot Level Based on Integration of Satellite, Aerial, and Ground Data, No. 2024WX06), the Science and Technology Research Project of the Education Department of Jilin Province (JJKH20230344KJ), The Seventh Batch of Jilin Province Youth Science and Technology Talents Support Program (QT202322), and the Science and Technology Development Plan Project of Jilin Province, China (YDZJ202401539ZYTS).
Data Availability Statement
The original dataset used in this study was sourced from the article ‘TasselLFANet: a novel lightweight multi-branch feature aggregation neural network for high-throughput image-based maize tassels detection and counting,’ and is available in its Supplementary Materials of the aforementioned article, while the code can be obtained from the corresponding author of this paper upon request.
Acknowledgments
We would like to express our sincere gratitude to the Jilin Institute of High-Resolution Remote Sensing Applications for their valuable support and guidance during the course of this research.
Conflicts of Interest
We declare that we do not have any commercial or associative interest representing a conflict of interest in connection with the submitted manuscript.
Abbreviations
The following abbreviations are used in this manuscript:
| RALSD | C2f_RVB_EMA (R), Adown (A), SPPF_LSKA (L), SlimNeck (S), and LiSCDetect (D) |
| Faster R-CNN | Faster Region-based Convolutional Neural Network |
| SSD | Single-Shot MultiBox Detector |
| YOLO | You Only Look Once |
| ResNet | Residual Network |
| VGGNet | Visual Geometry Group Network |
| FPN | Feature Pyramid Network |
| PAN | Path Aggregation Network |
| EMA | Efficient Multi-scale Attention |
| SE | Squeeze-and-Excitation |
| LSKA | Large Selective Kernel Attention |
| LiSCDetect | Lightweight Shared Convolutional Detection Head |
| DFL | Distributional Focal Loss |
| P | Precision |
| R | Recall |
| TP | True Positive |
| FP | False Positive |
| AP | Average Precision |
| mAP | Mean Average Precision |
| FLOPs | Floating-point Operations |
References
- Su, Y.; Wu, F.; Ao, Z.; Jin, S.; Qin, F.; Liu, B.; Pang, S.; Liu, L.; Guo, Q. Evaluating maize phenotype dynamics under drought stress using terrestrial lidar. Plant Methods 2019, 15, 11. [Google Scholar] [CrossRef]
- Karami, A.; Quijano, K.; Crawford, M. Advancing tassel detection and counting: Annotation and algorithms. Remote Sens. 2021, 13, 2881. [Google Scholar] [CrossRef]
- Lambert, R.J.; Johnson, R.R. Leaf Angle, Tassel Morphology, and the Performance of Maize Hybrids1. Crop Sci. 1978, 18, 499–502. [Google Scholar] [CrossRef]
- Geraldi, I.O.; Miranda Filho, J.B.; Vencovsky, R. Estimates of genetic parameters for tassel characters in maize (Zea mays L.) and breeding perspectives. Maydica 1985, 30, 1–14. [Google Scholar]
- Kumar, A.; Desai, S.V.; Balasubramanian, V.N.; Rajalakshmi, P.; Guo, W.; Naik, B.B.; Balram, M.; Desai, U.B. Efficient maize tassel-detection method using UAV based remote sensing. Remote Sens. 2021, 23, 100549. [Google Scholar] [CrossRef]
- Liu, W.; Quijano, K.; Crawford, M.M. YOLOv5-Tassel: Detecting tassels in RGB UAV imagery with improved YOLOv5 based on transfer learning. Remote Sens. 2022, 15, 8085–8094. [Google Scholar] [CrossRef]
- Guo, Y.; Xiao, Y.; Hao, F.; Zhang, X.; Chen, J.; de Beurs, K.; He, Y.; Fu, Y.H. Comparison of different machine learning algorithms for predicting maize grain yield using UAV-based hyperspectral images. Appl. Earth Obs. 2023, 124, 103528. [Google Scholar] [CrossRef]
- Guo, Y.; Fu, Y.H.; Chen, S.; Bryant, C.R.; Li, X.; Senthilnath, J.; Sun, H.; Wang, S.; Wu, Z.; de Beurs, K. Integrating spectral and textural information for identifying the tasseling date of summer maize using UAV based RGB images. Appl. Earth Obs. 2021, 102, 102435. [Google Scholar] [CrossRef]
- Zan, X.; Zhang, X.; Xing, Z.; Liu, W.; Zhang, X.; Su, W.; Liu, Z.; Zhao, Y.; Li, S. Automatic detection of maize tassels from UAV images by combining random forest classifier and VGG16. Remote Sens. 2020, 12, 3049. [Google Scholar] [CrossRef]
- Zeng, L.; Wardlow, B.D.; Wang, R.; Shan, J.; Tadesse, T.; Hayes, M.J.; Li, D. A hybrid approach for detecting corn and soybean phenology with time-series MODIS data. Remote Sens. 2016, 181, 237–250. [Google Scholar] [CrossRef]
- Niu, Q.; Li, X.; Huang, J.; Huang, H.; Huang, X.; Su, W.; Yuan, W. A 30 m annual maize phenology dataset from 1985 to 2020 in China. Earth Syst. 2022, 14, 2851–2864. [Google Scholar] [CrossRef]
- Sakamoto, T.; Wardlow, B.D.; Gitelson, A.A.; Verma, S.B.; Suyker, A.E.; Arkebauer, T.J. A two-step filtering approach for detecting maize and soybean phenology with time-series MODIS data. Remote Sens. 2010, 114, 2146–2159. [Google Scholar] [CrossRef]
- Fan, J.; Zhang, M.; Chen, J.; Zuo, J.; Shi, Z.; Ji, M. Building change detection with deep learning by fusing spectral and texture features of multisource remote sensing images: A GF-1 and sentinel 2B Data CASE. Remote Sens. 2023, 15, 2351. [Google Scholar] [CrossRef]
- Han, L.; Yang, G.; Dai, H.; Xu, B.; Yang, H.; Feng, H.; Li, Z.; Yang, X. Modeling maize above-ground biomass based on machine learning approaches using UAV remote-sensing data. Plant Methods 2019, 15, 10. [Google Scholar] [CrossRef] [PubMed]
- Nex, F.; Armenakis, C.; Cramer, M.; Cucci, D.A.; Gerke, M.; Honkavaara, E.; Kukko, A.; Persello, C.; Skaloud, J. UAV in the advent of the twenties: Where we stand and what is next. Remote Sens. 2022, 184, 215–242. [Google Scholar] [CrossRef]
- Guo, Y.; Chen, S.; Li, X.; Cunha, M.; Jayavelu, S.; Cammarano, D.; Fu, Y. Machine learning-based approaches for predicting SPAD values of maize using multi-spectral images. Remote Sens. 2022, 14, 6290. [Google Scholar] [CrossRef]
- Colomina, I.; Molina, P. Unmanned aerial systems for photogrammetry and remote sensing: A review. Remote Sens. 2014, 92, 79–97. [Google Scholar] [CrossRef]
- Aasen, H.; Burkart, A.; Bolten, A.; Bareth, G. Generating 3D hyperspectral information with lightweight UAV snapshot cameras for vegetation monitoring: From camera calibration to quality assurance. Remote Sens. 2015, 108, 245–259. [Google Scholar] [CrossRef]
- Chen, J.; Fu, Y.; Guo, Y.; Xu, Y.; Zhang, X.; Hao, F. An improved deep learning approach for detection of maize tassels using UAV-based RGB images. Int. J. Appl. Earth Obs. Geoinf. 2024, 130, 103922. [Google Scholar] [CrossRef]
- Jia, Y.; Fu, K.; Lan, H.; Wang, X.; Su, Z. Maize tassel detection with CA-YOLO for UAV images in complex field environments. Comput. Electron. Agric. 2024, 217, 108562. [Google Scholar] [CrossRef]
- Zhou, X.; Zheng, H.; Xu, X.; He, J.; Ge, X.; Yao, X.; Cheng, T.; Zhu, Y.; Cao, W.; Tian, Y. Predicting grain yield in rice using multi-temporal vegetation indices from UAV-based multispectral and digital imagery. Remote Sens. 2017, 130, 246–255. [Google Scholar] [CrossRef]
- Bouguettaya, A.; Zarzour, H.; Kechida, A.; Taberkit, A.M. A survey on deep learning-based identification of plant and crop diseases from UAV-based aerial images. Clust. Comput. 2023, 26, 1297–1317. [Google Scholar] [CrossRef]
- Tsouros, D.C.; Bibi, S.; Sarigiannidis, P.G. A review on UAV-based applications for precision agriculture. Information 2019, 10, 349. [Google Scholar] [CrossRef]
- Ren, S.; He, K.; Girshick, R.; Sun, J. Faster r-cnn: Towards real-time object detection with region proposal networks. Adv. Neural Inf. Process. Syst. 2015, 1, 28. [Google Scholar] [CrossRef]
- Liu, W.; Anguelov, D.; Erhan, D.; Szegedy, C.; Reed, S.; Fu, C.Y.; Berg, A.C. SSD: Single shot multibox detector. In European Conference on Computer Vision; Springer International Publishing: Cham, Switzerland, 2016. [Google Scholar] [CrossRef]
- Redmon, J.; Divvala, S.; Girshick, R.; Farhadi, A. You only look once: Unified, real-time object detection. In Proceedings of the IEEE Conference on Computer Vision and Pattern Recognition, Las Vegas, NV, USA, 26 June–1 July 2016. [Google Scholar] [CrossRef]
- He, K.; Zhang, X.; Ren, S.; Sun, J. Deep residual learning for image recognition. In Proceedings of the IEEE Conference on Computer Vision and Pattern Recognition, Las Vegas, NV, USA, 26 June–1 July 2016. [Google Scholar] [CrossRef]
- Simonyan, K.; Andrew, Z. Very deep convolutional networks for large-scale image recognition. arXiv 2014, arXiv:1409.1556. [Google Scholar] [CrossRef]
- Liu, Y.; Cen, C.; Che, Y.; Ke, R.; Ma, Y.; Ma, Y. Detection of maize tassels from UAV RGB imagery with Faster R-CNN. Remote Sens. 2020, 12, 338. [Google Scholar] [CrossRef]
- Yu, X.; Yin, D.; Nie, C.; Ming, B.; Xu, H.; Liu, Y.; Bai, Y.; Shao, M.; Cheng, M.; Liu, Y. Maize tassel area dynamic monitoring based on near-ground and UAV RGB images by U-Net model. Comput. Electron. Agric. 2022, 203, 107477. [Google Scholar] [CrossRef]
- Song, C.-Y.; Zhang, F.; Li, J.-S.; Xie, J.-Y.; Yang, C.; Zhou, H.; Zhang, J.-X. Detection of maize tassels for UAV remote sensing image with an improved YOLOX model. J. Integr. Agric. 2022, 22, 1671–1683. [Google Scholar] [CrossRef]
- Terven, J.; Córdova-Esparza, D.-M.; Romero-González, J.-A. A comprehensive review of yolo architectures in computer vision: From yolov1 to yolov8 and yolo-nas. Mach. Learn. Knowl. Extr. 2023, 5, 1680–1716. [Google Scholar] [CrossRef]
- Xiao, F.; Wang, H.; Xu, Y.; Zhang, R. Fruit detection and recognition based on deep learning for automatic harvesting: An overview and review. Agronomy 2023, 13, 1625. [Google Scholar] [CrossRef]
- Liu, Y.; Zheng, H.; Zhang, Y.; Zhang, Q.; Chen, H.; Xu, X.; Wang, G. “Is this blueberry ripe?”: A blueberry ripeness detection algorithm for use on picking robots. Front. Plant Sci. 2023, 14, 1198650. [Google Scholar] [CrossRef] [PubMed]
- Zeng, T.; Li, S.; Song, Q.; Zhong, F.; Wei, X. Lightweight tomato real-time detection method based on improved YOLO and mobile deployment. Comput. Electron. Agric. 2023, 205, 107625. [Google Scholar] [CrossRef]
- Zhang, Y.; Li, L.; Chun, C.; Wen, Y.; Xu, G. Multi-scale feature adaptive fusion model for real-time detection in complex citrus orchard environments. Comput. Electron. Agric. 2024, 219, 108836. [Google Scholar] [CrossRef]
- Sparrow, R.; Howard, M. Robots in agriculture: Prospects, impacts, ethics, and policy. Precis. Agric. 2021, 22, 818–833. [Google Scholar] [CrossRef]
- Yu, Z.; Ye, J.; Li, C.; Zhou, H.; Li, X. TasselLFANet: A novel lightweight multi-branch feature aggregation neural network for high-throughput image-based maize tassels detection and counting. Front. Plant Sci. 2023, 14, 1158940. [Google Scholar] [CrossRef]
- Wang, A.; Chen, H.; Lin, Z.; Han, J.; Ding, G. Repvit: Revisiting mobile cnn from vit perspective. In Proceedings of the IEEE/CVF Conference on Computer Vision and Pattern Recognition, Seattle, WA, USA, 16–22 June 2024. [Google Scholar] [CrossRef]
- Wang, C.Y.; Yeh, I.H.; Mark Liao, H.Y. Yolov9: Learning what you want to learn using programmable gradient information. In European Conference on Computer Vision; Springer Nature: Cham, Switzerland, 2024. [Google Scholar] [CrossRef]
- Zheng, Y.; Cui, Y.; Gao, X. An infrared dim-small target detection method based on improved yolov7. In Proceedings of the 2023 Asia Conference on Computer Vision, Image Processing and Pattern Recognition, Phuket, Thailand, 28–30 April 2023. [Google Scholar] [CrossRef]
- Lau, K.W.; Po, L.M.; Rehman, Y.A.U. Large separable kernel attention: Rethinking the large kernel attention design in cnn. Expert Syst. Appl. 2024, 236, 121352. [Google Scholar] [CrossRef]
- Jiang, T.; Chen, S. A Lightweight Forest Pest Image Recognition Model Based on Improved YOLOv8. Appl. Sci. 2024, 14, 1941. [Google Scholar] [CrossRef]
- Wu, R.; Liang, P.; Huang, X.; Shi, L.; Gu, Y.; Zhu, H.; Chang, Q. Mhorunet: High-order spatial interaction unet for skin lesion segmentation. Biomed. Signal Process. Control. 2023, 88, 105517. [Google Scholar] [CrossRef]
- Zou, H.; Lu, H.; Li, Y.; Liu, L.; Cao, Z. Maize tassels detection: A benchmark of the state of the art. Plant Methods 2020, 16, 108. [Google Scholar] [CrossRef]
- Lan, M.; Liu, C.; Zheng, H.; Wang, Y.; Cai, W.; Peng, Y.; Xu, C.; Tan, S. Rice-yolo: In-field rice spike detection based on improved yolov5 and drone images. Agronomy 2024, 14, 836. [Google Scholar] [CrossRef]
- Wang, Y.; Yan, G.; Meng, Q.; Yao, T.; Han, J.; Zhang, B. DSE-YOLO: Detail semantics enhancement YOLO for multi-stage strawberry detection. Comput. Electron. Agric. 2022, 198, 107057. [Google Scholar] [CrossRef]
- Luo, W.; Xing, J.; Milan, A.; Zhang, X.; Liu, W.; Kim, T.K. Multiple object tracking: A literature review. Artif. Intell. 2020, 293, 103448. [Google Scholar] [CrossRef]
Disclaimer/Publisher’s Note: The statements, opinions and data contained in all publications are solely those of the individual author(s) and contributor(s) and not of MDPI and/or the editor(s). MDPI and/or the editor(s) disclaim responsibility for any injury to people or property resulting from any ideas, methods, instructions or products referred to in the content. |
© 2025 by the authors. Licensee MDPI, Basel, Switzerland. This article is an open access article distributed under the terms and conditions of the Creative Commons Attribution (CC BY) license (https://creativecommons.org/licenses/by/4.0/).