Article

SynerCD: Synergistic Tri-Branch and Vision-Language Coupling for Remote Sensing Change Detection

School of Computer Science and Technology, Xinjiang University, Ürümqi 830046, China
*
Author to whom correspondence should be addressed.
These authors contributed equally to this work.
Remote Sens. 2025, 17(22), 3694; https://doi.org/10.3390/rs17223694
Submission received: 15 September 2025 / Revised: 21 October 2025 / Accepted: 10 November 2025 / Published: 12 November 2025

Highlights

What are the main findings?
  • We propose SynerCD, a Siamese encoder–decoder framework that integrates frequency-domain analysis with vision-language alignment for robust remote sensing change detection.
  • Experiments on three public benchmarks demonstrate superior localization accuracy and cross-modal semantic adaptability compared with state-of-the-art methods.
What are the implications of the main findings?
  • A novel Triple-branch Synergistic Encoding (TSC) module combines Mamba-based sequence modeling and frequency decomposition to capture fine-grained structural and spectral variations.
  • A vision-attended language-guided attention (VAL-Att) module leverages CLIP prompts to dynamically align visual and semantic representations, enhancing sensitivity to subtle or ambiguous changes.

Abstract

RSCD faces persistent challenges in high-resolution imagery due to complex spatial structures, temporal heterogeneity, and semantic ambiguity. While deep learning methods have significantly advanced the field, most existing models still rely on static and homogeneous processing, treating all channels and modalities equally, which limits their capacity to capture fine-grained semantic shifts or adapt to region-dependent variations. To address these issues, we propose SynerCD, a unified Siamese encoder–decoder framework that introduces dynamic, content-adaptive perception through channel decoupling, frequency-domain enhancement, and vision-language collaboration. The encoder employs a Tri-branch Synergistic Coupling (TSC) module that dynamically rebalances channel responses and captures multi-scale spatial-frequency dependencies via Mamba-based long-sequence modeling and wavelet decomposition. The decoder integrates a vision-aware language-guided attention (VAL-Att) module, which adaptively modulates visual-textual fusion using CLIP-based semantic prompts to guide attention toward meaningful change regions. Extensive experiments on four benchmark datasets verify that SynerCD achieves superior localization accuracy and semantic robustness, establishing a dynamic and adaptive paradigm for multimodal change detection.

1. Introduction

Remote Sensing Change Detection (RSCD) aims to automatically identify temporal changes in ground objects by comparing multi-temporal remote sensing imagery [1]. It has been widely applied in various domains such as disaster assessment, urban road design, and environmental monitoring. By analyzing imagery acquired at different time points, RSCD can effectively reveal land cover transitions, the impact of natural disasters, and the progress of urbanization. High-resolution Earth observation data acquired from satellites, UAVs, and aerial platforms contain rich geometric structures and complex textures, enabling the precise capture of object-level details. These images offer valuable surface information that supports change detection tasks in applications like precision agriculture and urban planning.
In recent years, the rapid progress of deep neural networks has driven significant advances in remote sensing change detection (RSCD), where Convolutional Neural Networks (CNNs), transformers, and Mamba architectures have become the dominant paradigms. CNN-based methods [2,3,4] moved beyond handcrafted features to achieve end-to-end spatial difference modeling through convolutional operations and multi-scale fusion, yet their inherently local receptive fields restrict global context modeling. To overcome this, transformers introduced self-attention to capture long-range dependencies, using channel [5,6] and spatial attention [7,8] to enhance discrimination of change regions. However, their high computational cost and dependence on large-scale data limit efficiency and robustness in subtle or ambiguous changes. More recently, state–space models (SSMs) such as Mamba [9,10,11], achieved efficient long-range modeling with linear complexity. Frameworks like ChangeMamba [12] and CDMamba [13] confirmed the strong performance and efficiency of Mamba-based architectures. Nevertheless, existing CNN-, transformer-, and Mamba-based methods remain largely confined to intra-visual spatial representations, treating feature channels homogeneously and lacking explicit semantic disentanglement. Consequently, they struggle to capture semantic-level variations in scenarios where structural contours remain unchanged but functional semantics evolve.
Building on these developments, researchers have explored richer modeling perspectives beyond the spatial domain. The frequency-domain analysis offers a complementary view by uncovering periodic structures and latent textures overlooked in spatial representations. Methods such as DDLNet [14] and MDNet [15] employ Discrete Cosine Transform (DCT) to enhance edge responses and multi-scale structures, while WS-Net++ [16] and SpectMamba [17] utilize wavelet or Fourier transforms to capture frequency differences, improving robustness to illumination and boundary variation. Despite their effectiveness, most frequency-based methods still process spatial and frequency features within a unified channel space, limiting cross-domain complementarity. This channel-level homogeneity hinders the distinction of subtle semantic changes when geometric structures remain stable but functional semantics differ.
Motivated by the success of CLIP [18], vision-language joint representation learning has emerged as a promising direction for RSCD. Recent works including MDS-Net [19], VLCDFormer [20], and ChangeCLIP [21] adopt text-guided feature fusion to enhance semantic understanding. These approaches introduce textual prompts or natural-language descriptions to guide visual attention and enrich semantic reasoning. However, most rely on fixed prompts and uniform fusion strategies, ignoring spatial variability in image clarity, semantic intensity, and change saliency. Consequently, their performance often degrades in ambiguous, noisy, or non-semantic regions where modality contributions should adapt dynamically.
Therefore, overcoming the limitations of homogeneous channel modeling and single-modality representation has become a critical issue for improving the accuracy and robustness of remote sensing change detection. Based on this motivation, we distill our research focus into the following two key challenge:
Challenge 1: How to move beyond homogeneous processing across channels to explicitly capture semantic discrepancies along diverse attribute dimensions, thereby enhancing the model’s ability to distinguish subtle semantic shifts under unchanged structural outlines. In many real-world cases—such as farmland re-purposing (Figure 1a), building function transformation (Figure 1b), or land redevelopment (Figure 1c,d)—the external contours of objects remain stable while their semantic attributes (e.g., land-use category or functional role) change over time. These subtle shifts are difficult to distinguish because they are not accompanied by strong geometric cues, often leading to missed detections or false alarms. The core difficulty stems from the fact that most existing models typically adopt homogeneous channel modeling, treating all feature channels equally and ignoring their semantic diversity. Although works such as CICD [22], FEFNet [23], STFL-CD [24], and CGA-Net [25] have enhanced channel representations through attention mechanisms or multi-scale fusion, they still lack explicit semantic disentanglement, making it difficult to model the complex relationships among heterogeneous semantic attributes. Therefore, overcoming the limitation of uniform channel processing to achieve differentiated semantic modeling across attribute dimensions remains a key challenge for improving the semantic discriminability of RSCD models.
Challenge 2: How to dynamically calibrate the contribution of each modality to accommodate diverse change types—especially in ambiguous or weakly semantic regions—so as to prevent under-responsive feature fusion and degraded detection performance. In RS imagery, change regions often exhibit scale variation, blurred boundaries, or noise interference, where the visual modality alone tends to underperform in low-texture or weak-boundary regions. While multimodal learning provides a promising path toward semantic enhancement, it also introduces a new difficulty: misalignment between textual prompts and visual perception can misguide the fusion strategy, leading to unstable responses. Recent studies such as CKCD [26], CGNet [27], VLCDFormer [20], ChangeCLIP [21], and MDS-Net [19] have explored text-guided fusion to strengthen semantic understanding. However, most of them adopt fixed prompts and uniform weighting strategies, ignoring the spatial variability of modality reliability and resulting in degraded performance in ambiguous or non-semantic change regions. Consequently, there is an urgent need for a mechanism that can dynamically calibrate modality contributions based on regional characteristics, enabling adaptive multimodal fusion for robust change detection.
We propose SynerCD, an encoder–decoder framework for RSCD, with the core goal of improving perceptual sensitivity and discrimination in scenarios with ambiguous structural or weak semantic changes. The encoder incorporates a triple-branch synergy strategy, which explicitly disentangles feature channels and uses local modeling, global dependency modeling, and structure-preserving pathways for fine-grained feature extraction. The decoder introduces a language-driven visual attention mechanism, achieving cross-modal semantic guidance and adaptive fusion strategy based on change intensity and region characteristics. The overall framework integrates channel decoupling, frequency-domain enhancement, and modality collaboration, which significantly improves adaptability and robustness across diverse change scenarios.
Contributions of this work are as follows:
  • We design a tri-branch encoder that models local details, global frequency information, and structure-preserving features via channel decoupling. By integrating Mamba and wavelet-based enhancement, the module enables effective spatial-frequency collaborative modeling.
  • We propose a language-guided attention fusion module that leverages CLIP-encoded semantic prompts to guide image attention, allowing dynamic modulation of modality contributions and enhancing the model’s responsiveness to ambiguous and non-salient changes.
  • We construct a unified framework that integrates channel decoupling, semantic guidance, and frequency-domain enhancement, offering a new paradigm for RSCD with improved discriminative power and semantic awareness.

2. Methodology

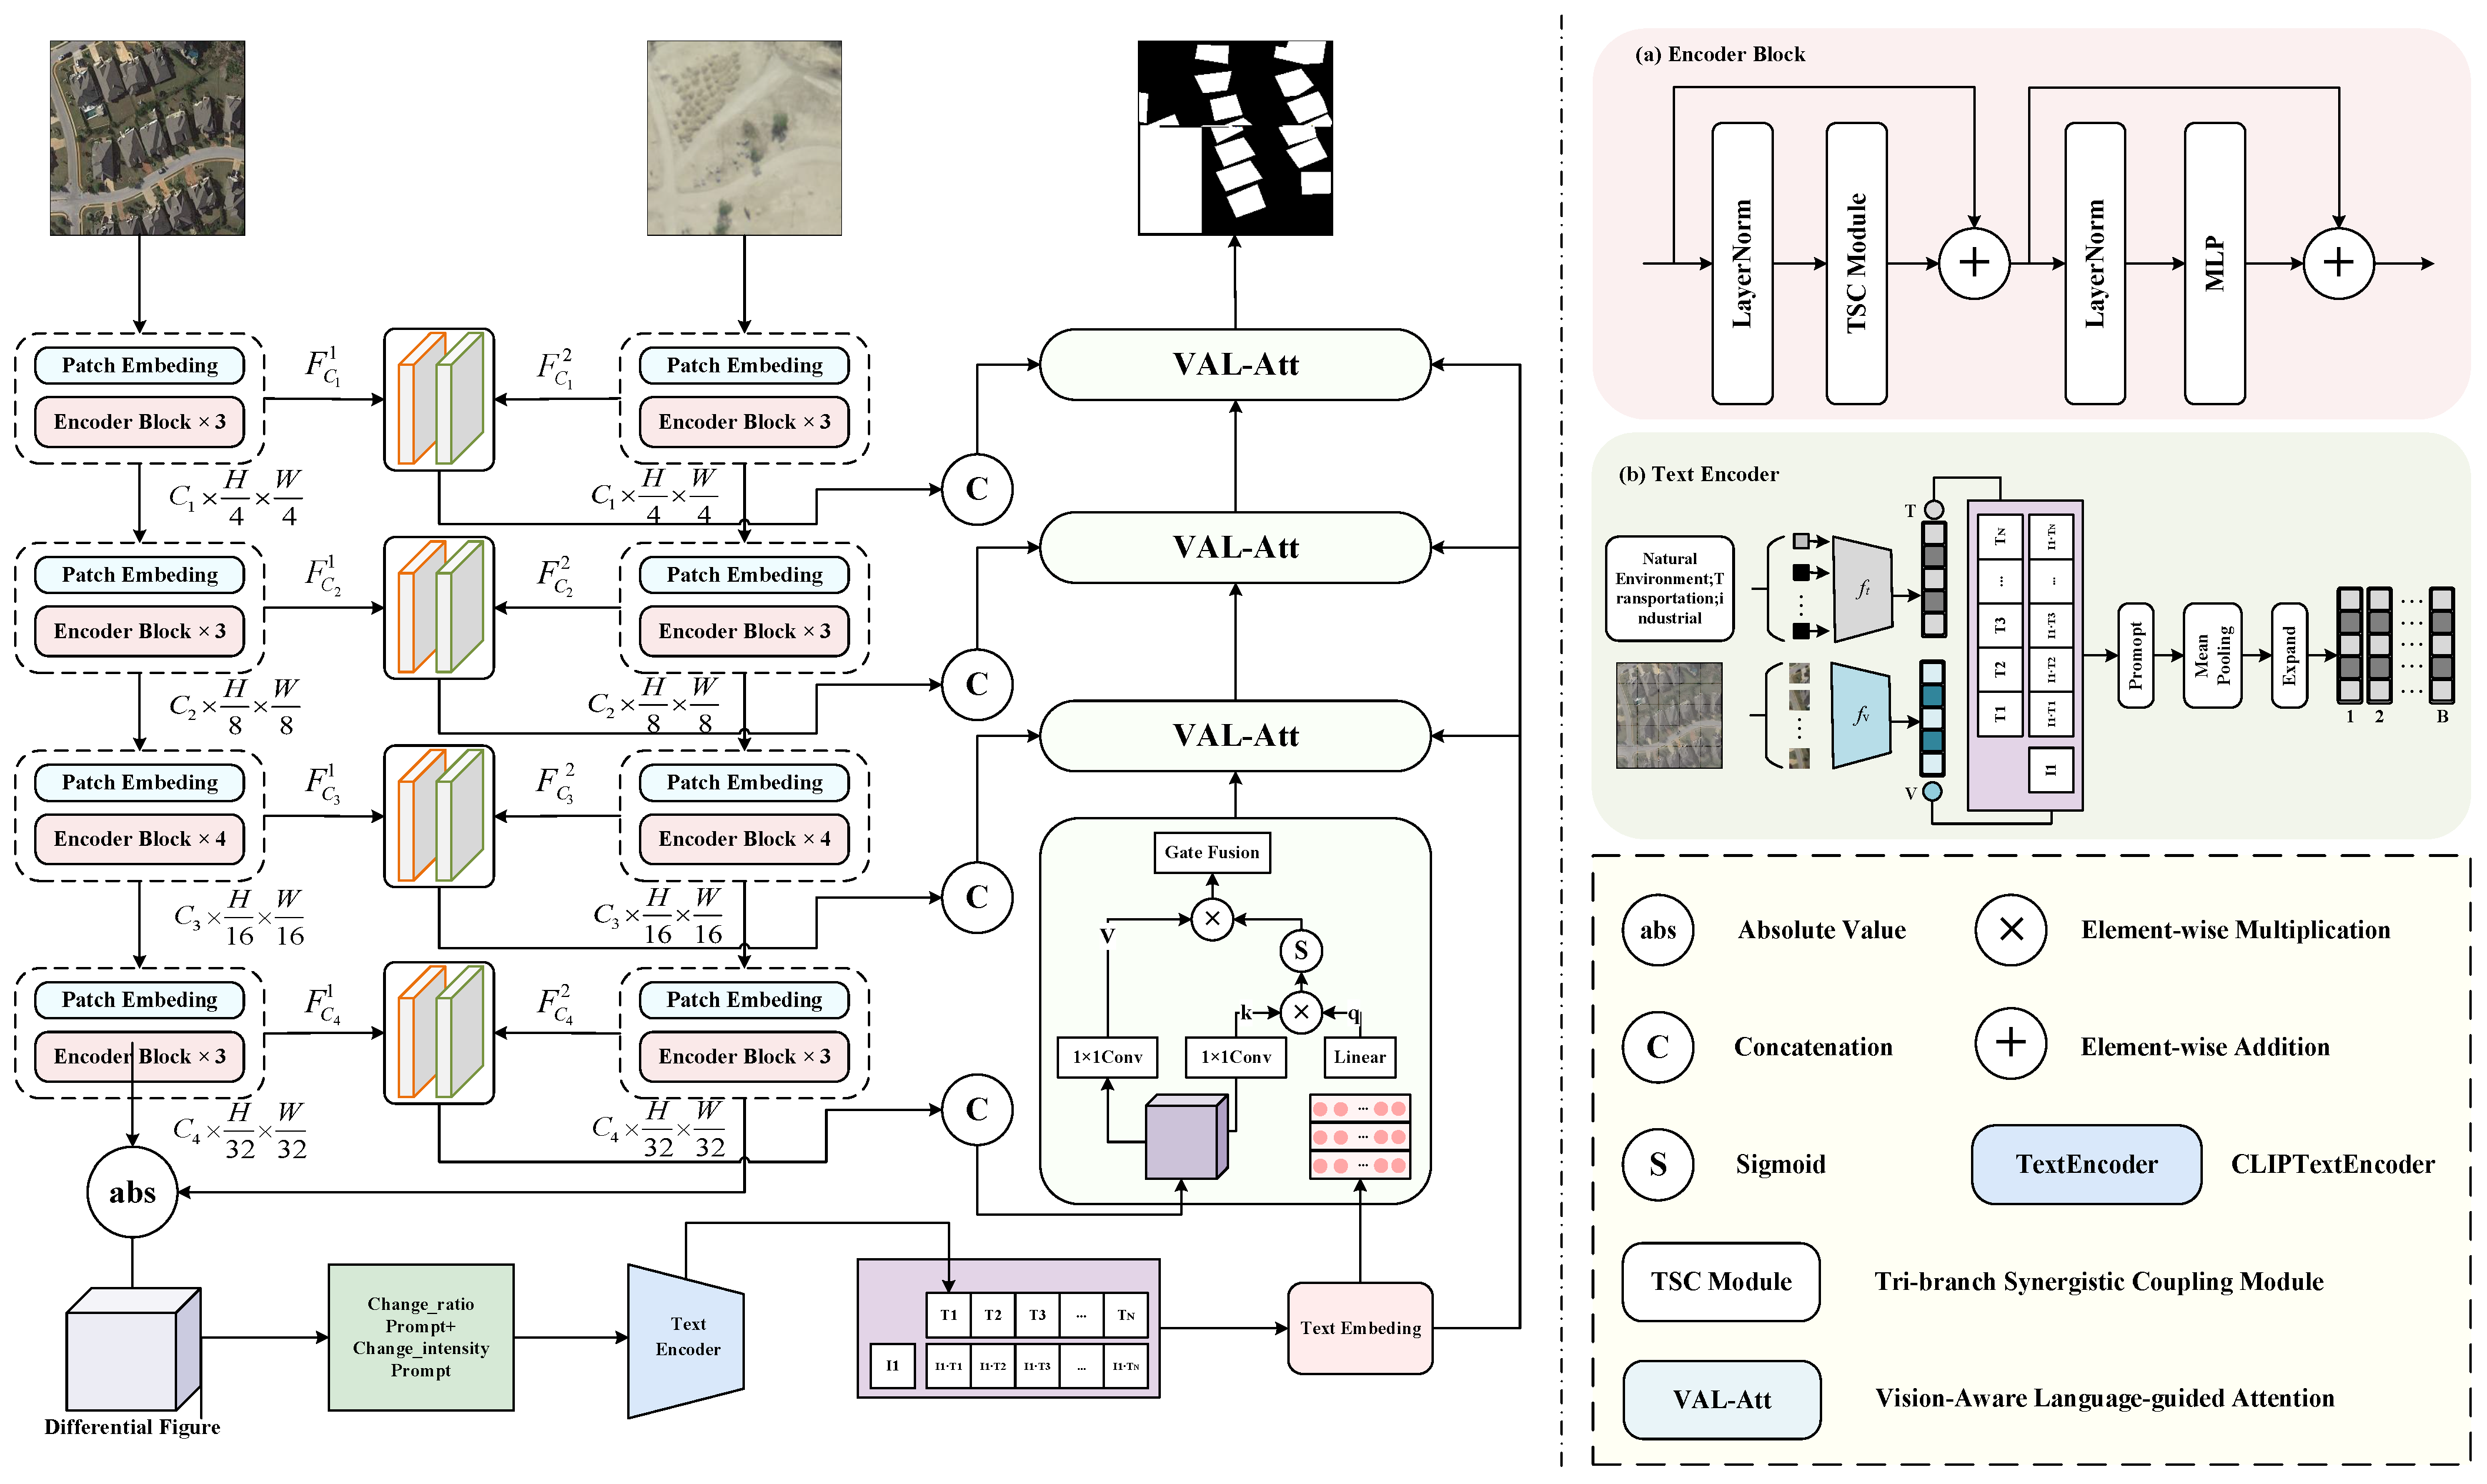
The overall architecture of the proposed model is shown in Figure 2. We introduce a Siamese encoder–decoder framework that takes a pair of images T 1 and T 2 R C × H × W as input and integrates a frequency-domain analysis with vision-language alignment for cross-modal joint modeling. The encoder follows a four-stage hierarchical transformer backbone, where the standard self-attention is replaced by our TSC module. TSC dynamically integrates Mamba-based long-sequence modeling with learned frequency decomposition, adaptively rebalancing channel responses to capture both structural spatial patterns and discriminative spectral variations. This design overcomes the limitations of purely spatial modeling and effectively captures fine-grained and periodic changes. The three-branch structure ensures robust and spectrally aware representations for downstream decoding, with four, four, seven, and four transformer blocks in each stage.
The decoder employs a multimodal progressive decoding scheme guided by CLIP-based text prompts. At each stage, language embeddings serve as query in a cross-modal attention mechanism, directing the decoder to focus on semantically relevant change regions. This semantic guidance progressively aligns visual features with linguistic priors, enhancing localization accuracy and enabling the detection of subtle or ambiguous changes beyond visual cues alone.

2.1. Tri-Branch Synergistic Coupling Module

In RSCD, it is common for object contours to undergo significant variations while their semantic categories remain unchanged, making it challenging for models to correctly identify such scenarios of subtle semantic shifts under unchanged structural outlines. Existing methods such as MSFNet [28] and CDC2F [29] incorporate frequency-domain information to enhance edge modeling, but their static frequency processing limits adaptive focus on discriminative regions, leading to false positives in structurally similar areas. Hybrid-MambaCD [30] improves semantic consistency through long-range dependency modeling, yet remains insensitive to local geometric perturbations, hindering fine-grained change detection. Thus, balancing geometric modeling and semantic discrimination under structural similarity remains a key challenge.
To address this, we propose a TSC module that integrates Mamba-based long-sequence modeling with multi-scale frequency decomposition. This design enables joint perception of spatial structural patterns and discriminative spectral variations, significantly improving the ability to handle cases with geometric changes but similar semantic content.
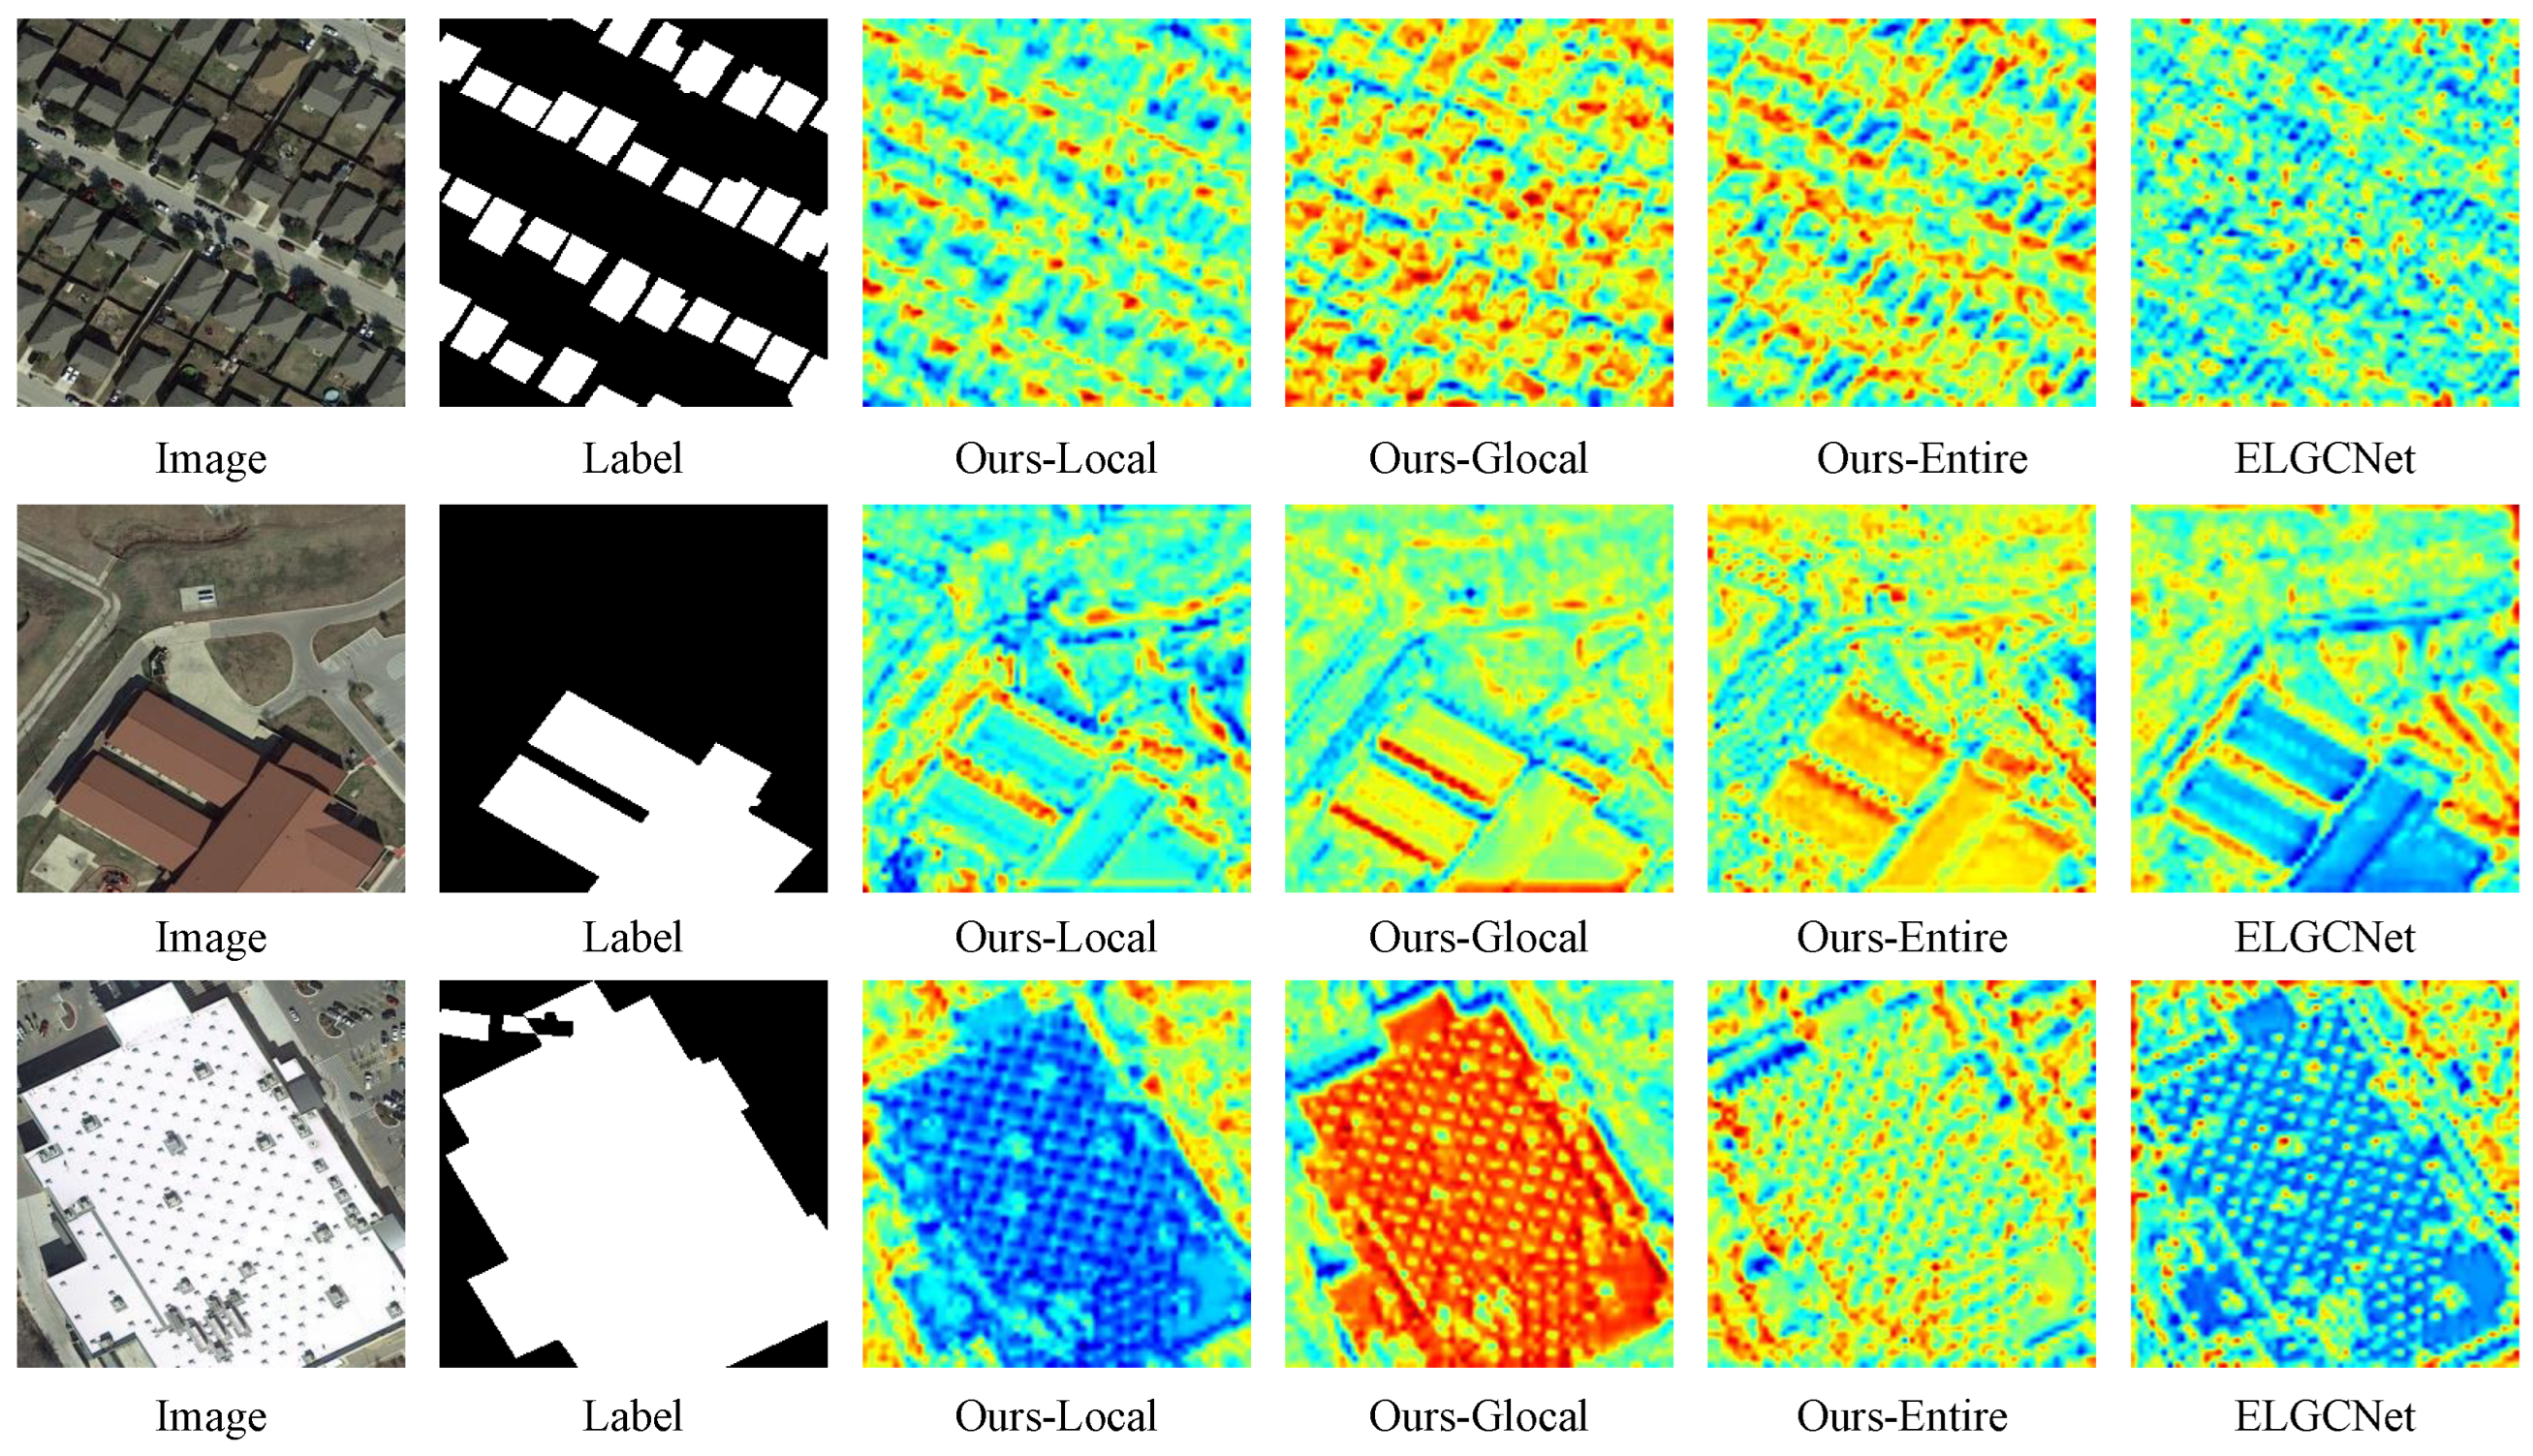
As illustrated in Figure 3, different channels often carry heterogeneous information features. ELGCNet adopts an efficient local–global context aggregation strategy to jointly model spatial details and contextual dependencies within a unified channel space. However, such a unified modeling approach compresses heterogeneous feature representations into a single space, which may lead to information loss and reduced feature discrimination. To address this issue, we propose the TSC module, as shown in the Figure 4, a multi-branch collaborative modeling structure. In this module, the input feature map is partitioned along the channel dimension into three branches as the following:
(1) The first branch integrates multi-scale frequency decomposition and long-range state–space modeling to achieve synergistic fusion between global dependencies and fine-grained structural features. Unlike conventional wavelet transforms that employ fixed filters, we introduce learned scaling coefficients that allow each frequency band to adaptively adjust its energy distribution during training. This design strengthens the model’s sensitivity to high-frequency edges and subtle semantic variations.
(2) The second branch applies multi-scale depth-wise separable convolution (DWConv) to enhance scale-aware perception and support recognition of semantic shifts accompanied by local environmental changes.
(3) The remaining features are forwarded through an identity mapping path, which retains unchanged feature distributions. This mitigates over-response phenomena—excessive activations with no semantic significance—caused by residual stacking and nonlinear transformations, thus stabilizing semantic judgement in the presence of geometric deformation.
Given the input feature F t _ i n R C × H × W , we split it along the channel dimension into [ F g t , F l t , F I t ] , each branch is designed to capture complementary characteristics.
Wavelet-Enhanced Mamba Branch (WEMamba). In the global branch, F g t R C g × H × W denotes the input feature, and its channel number C g is determined by the global ratio coefficient r g , C g = r g · C , 0 r g 1 . We propose a WEMamba structure that achieves global dependency modeling and fine-grained semantic enhancement through the synergistic integration of multi-scale frequency decomposition and state–space modeling. Specifically, the Mamba module models F g t as a spatial token sequence to encode holistic semantic structures and long-range contextual relationships. To further harmonize the energy distribution across channels, a learned scaling coefficient W is introduced to adaptively modulate the response intensity of each channel, resulting in the globally modeled spatial feature representation M g t as the following:
M g t = W SS 2 D F g t
where W R C g × 1 × 1 denotes a per-channel learned scaling factor, S S 2 D refers to the scanning mechanism in Mamba, and ⊙ indicates element-wise multiplication.
In the frequency-domain modeling stage, multi-level DWT is applied to decompose the feature representation F g t into low-frequency X L L ( i ) and high-frequency sub-bands [ X L H ( i ) , X H L ( i ) , X H H ( i ) ] . Unlike conventional wavelet transforms that employ fixed filters, each decomposition level in our design incorporates depth-wise separable convolution (DWConv) to enhance the spatial structure and directional selectivity within each sub-band. Furthermore, learned channel-wise scaling coefficients W ( i ) are introduced to dynamically recalibrate the energy distribution across frequency bands as the following:
X L L ( i ) , X L H ( i ) , X H L ( i ) , X H H ( i ) = D W T ( i ) X L L ( i 1 ) Z ( i ) = W ( i ) DWConv Cat X L L ( i ) , X L H ( i ) , X H L ( i ) , X H H ( i )
where i = 0 , 1 , , L denotes denotes the number of decomposition levels in the DWT hierarchy, X L ( 0 ) = F g t . W ( i ) denotes a per-channel learned scaling factor for the i-th level, DWConv refers to depth-wise separable convolution, and Cat represents the concatenation operation.
This design transforms traditional static wavelet filtering into a learned frequency modulation process, enabling the network to adaptively emphasize task-relevant high-frequency semantics and boundary variations during training.
The enhanced feature maps Z ( i ) are then reshaped back into four sub-band forms [ X ˜ L L ( i ) , X ˜ L H ( i ) , X ˜ H L ( i ) , X ˜ H H ( i ) ] for inverse reconstruction. During the reconstruction phase, a low-frequency residual recursion mechanism is introduced into the inverse wavelet transform (IWT). Unlike the conventional IWT that reconstructs each level solely from current coefficients, our approach injects the low-frequency reconstruction result from deeper levels R ( i + 1 ) into the current layer X ˜ L L ( i ) , allowing high-level semantic information to propagate upward through the low-frequency path as follows:
R i = I W T ( X ˜ L L ( i ) + R ( i + 1 ) , [ X ˜ L H ( i ) , X ˜ H L ( i ) , X ˜ H H ( i ) ] ) .
This recursive feedback enables shallow-layer reconstructions to integrate deep contextual semantics with fine spatial details, thereby achieving cross-layer semantic consistency and multi-scale structural coupling. Finally, the frequency-domain representation is fused with the spatial-domain feature from the Mamba modeling branch through a residual connection, forming the final output of the first branch. This dual-domain synergistic fusion effectively balances global structural coherence and local detail preservation.
Local-Fidelity Convolution Branch (LoFiConv). For the remaining features, we first isolate a subset of local channels C l according to a predefined channel ratio r l 1 r g , yielding an intermediate representation F l t . This feature subset is then evenly divided into n groups. Each group F L t R h × w × C l n is processed through a dedicated depth-wise convolutional sequence with a distinct kernel size, aiming to simulate receptive fields at multiple scales. The outputs from all groups are finally concatenated to produce the final representation F l t _ out R h × w × c δ n . This design enables the model to perceive changes ranging from small-scale geometric displacements to large-scale land cover transitions. Unlike static pyramid-based architectures, our configuration supports dynamic and fine-grained receptive field fusion within a compact computation path, enhancing the model’s adaptability to spatial heterogeneity as follows:
F L j t = DWConv ( F L t , k = ( 2 j + 1 ) ) j 1 , , n F l t out = Cat ( F L 1 t , , F L n t ) .
Identity-Preserving Branch (IPB). In the third branch, an identity mapping is applied to the remaining ( 1 r g r l ) c channels F I t R C I × H × W to preserve the original feature slices. preserves globally stable representations in unchanged regions and prevents over-transformation, which is crucial for change detection dominated by static backgrounds. It also suppresses redundant activations in the high-dimensional feature space. The final output of the TSC module is obtained by concatenating features from the WEMamba, LoFiConv, and IPB branches.
Remarks. Existing approaches enhance geometric change modeling from different perspectives. MSFNet [28] and CDC2F [29] introduce frequency information for edge sensitivity but rely on static processing. Hybrid-MambaCD [30] improves semantic consistency via long-range modeling yet responds weakly to local details. FTransDF-Net [31] models frequency-domain structures without explicit contextual fusion. In contrast, the proposed TSC module integrates frequency decomposition, multi-scale convolution, and state–space modeling in a unified framework, achieving robust distinction of subtle semantic shifts under unchanged structural outlines.

2.2. Vision-Aware Language-Guided Attention

In RSCD, visual-only feature extraction and fusion methods primarily emphasize spatial consistency or semantic discrimination. However, real-world change regions exhibit high diversity in type and scale, often accompanied by blur, structural degradation, or texture interference, leading to unstable or misaligned visual representations. Although recent works such as CASP [32] with bi-directional spatial alignment and CTD-transformer [33] with global attention improve visual modeling, they remain confined to the visual modality and lack the ability to adaptively regulate cross-modal contributions. Therefore, how to achieve dynamic modulation of modality contributions during fusion remains a key challenge for adapting to varying semantics, clarity, and structural integrity across change regions.
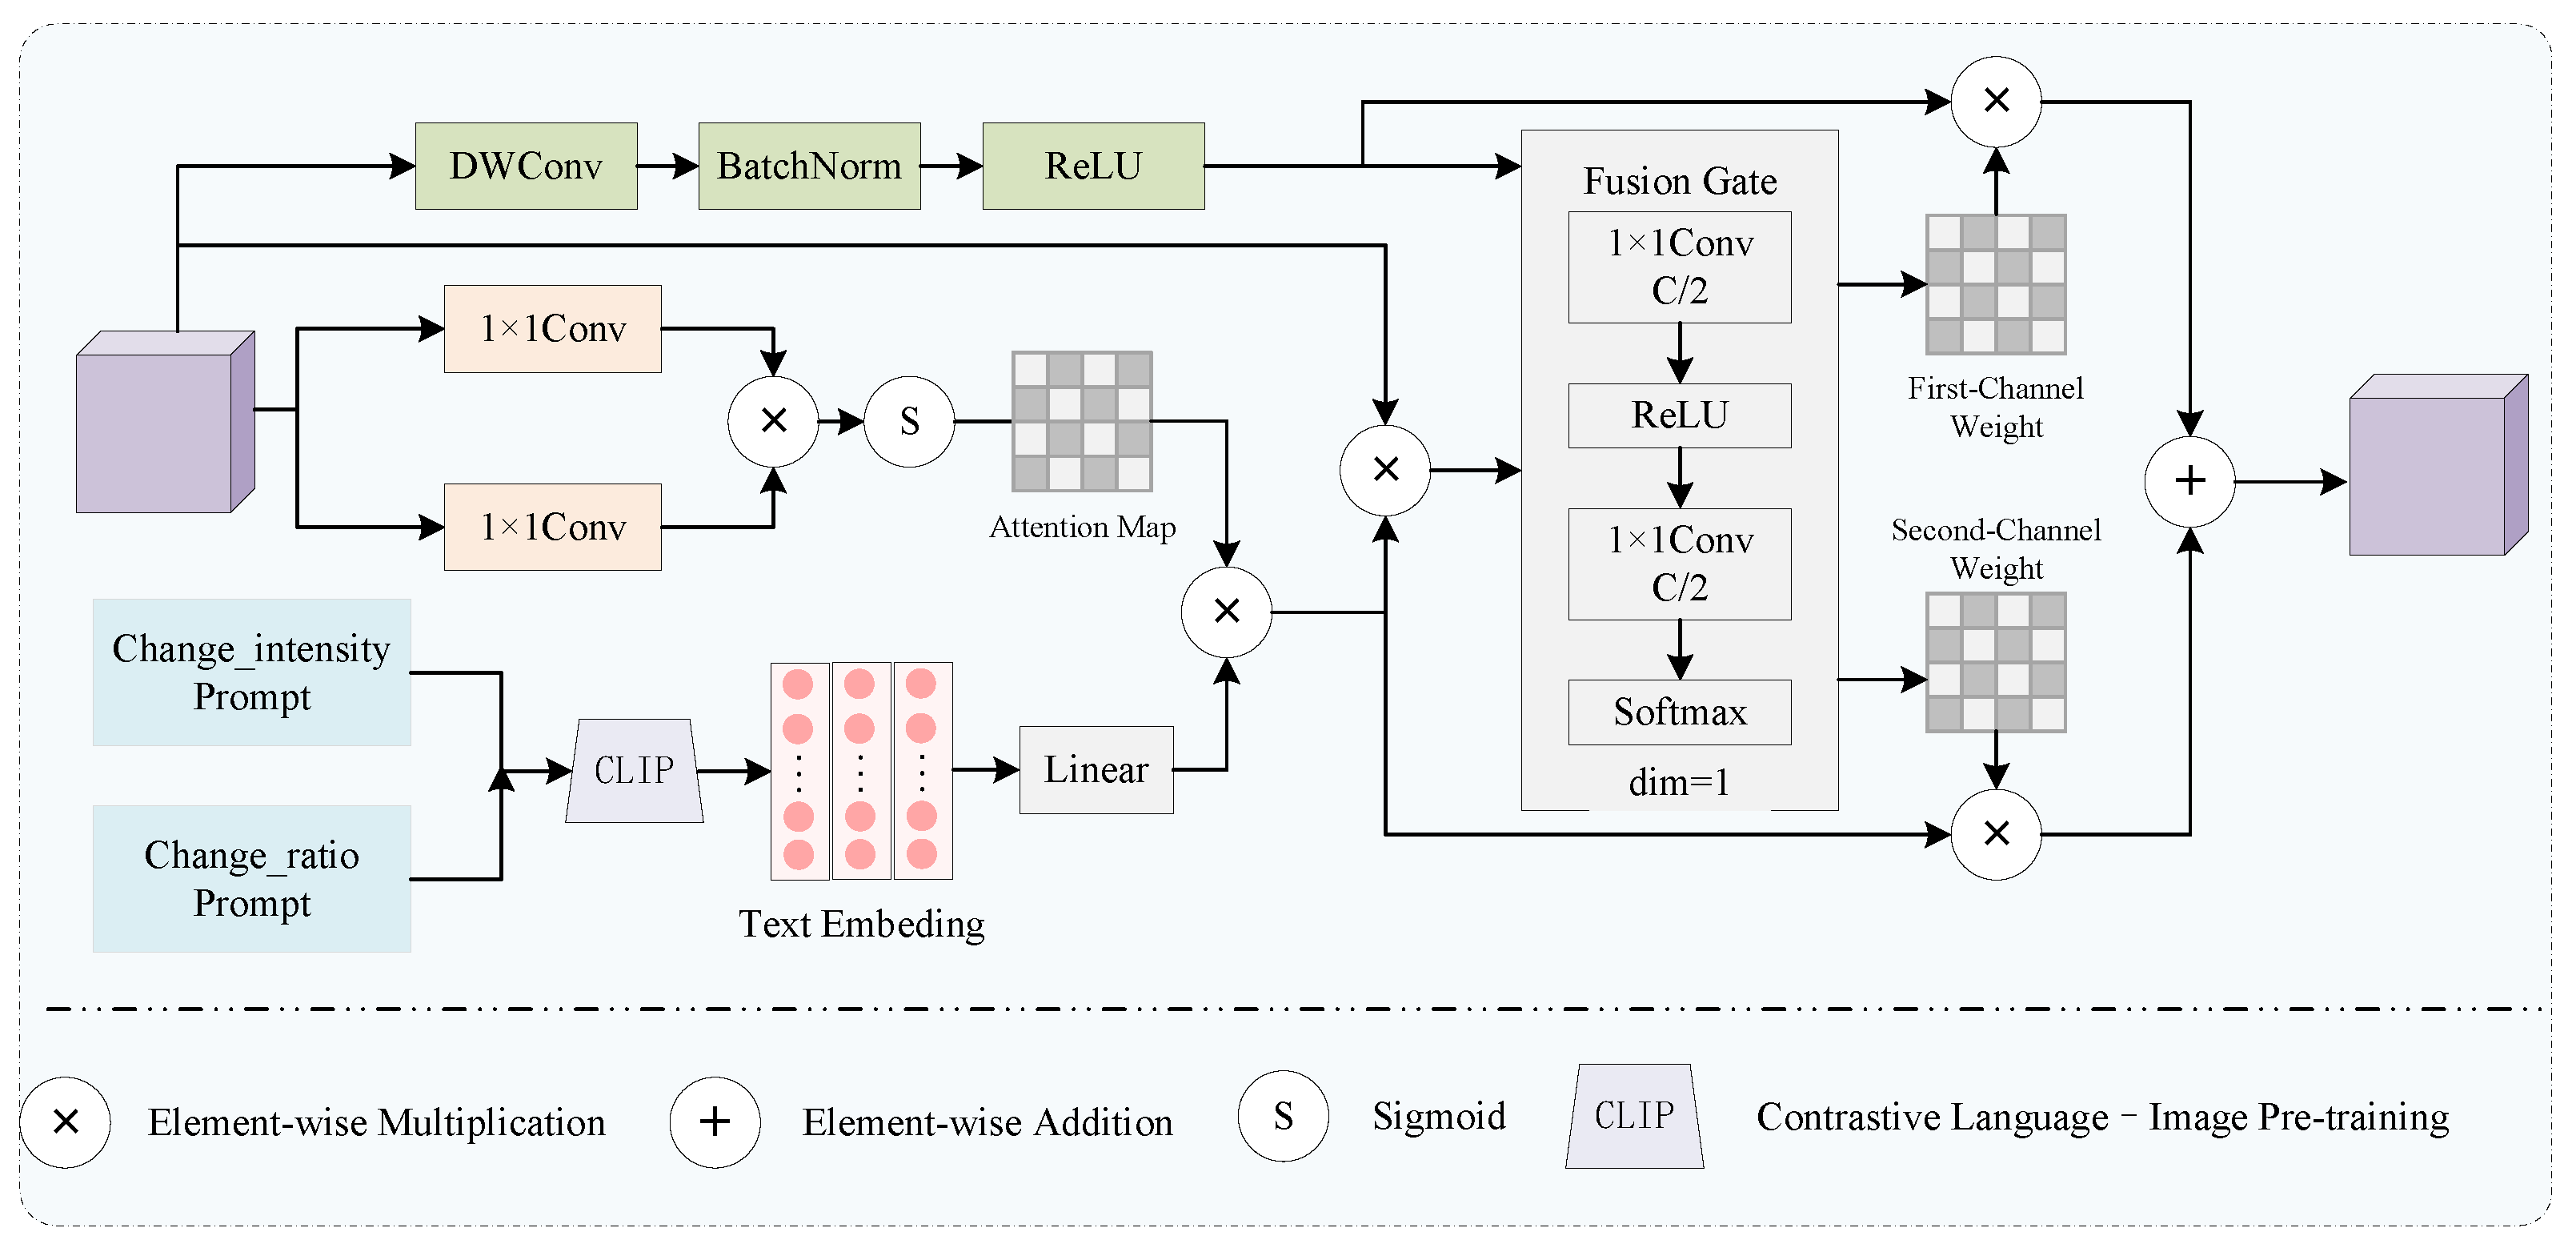
Inspired by multimodal learning, we observed that the language modality provided abstract, structurally stable, and vision-independent semantic priors, effectively compensating for visual ambiguity in weakly salient regions. For instance, CKCD [26] enhances semantic localization through textual embeddings, and CGNet [27] incorporates language prompts to better model edges and ambiguous boundaries. Based on this insight, we propose a vision-aware language-guided attention (VAL-Att) module to enable dynamic modality contribution adjustment and cross-modal semantic alignment, as shown in the Figure 5. Specifically, we leveraged CLIP to encode textual prompts describing change intensity and coverage as language embeddings, which were injected as queries into a transformer to guide attention fusion with visual features (keys and values). Compared with conventional visual attention mechanisms, our design offers two notable advantages as the following:
(1) The language prior acted as a stable semantic anchor, effectively mitigating semantic drift caused by registration errors.
(2) The inherent abstraction capability of natural language enhanced the model’s focus on ambiguous boundaries and category-uncertain regions.
Deeper layers of neural networks tend to encode more abstract and discriminative semantic representations. Therefore, we leveraged high-level semantic features from the final layer to generate a difference map that described potential change regions, enriched with both structural and semantic information. We then designed a prompt generation strategy that transformed this difference map into natural language descriptions, capturing the spatial extent and intensity of the potential changes. Specifically, we performed global statistical analysis on the difference map. The change intensity quantified the average magnitude of change across the image, while the change area ratio reflected the proportion of the image affected by changes as the following:
C I i = 1 C H W c C h H w W | D i ( c , h , w ) | C R i = 1 C H W c C h H w W Π ( | D i ( c , h , w ) | > τ )
where C I i and C R i denote the change intensity and the change region ratio, respectively. D i ( c , h , w ) represents the feature difference map, Π is an indicator function. τ = 0.1 · std ( D ) , std ( D ) denotes the standard deviation, which measures the dispersion of its value distribution.
Based on the statistical results of C I i and C R i , we categorized the change condition of each sample into multiple semantic levels and generate corresponding natural language descriptions, as shown in Table 1.
By combining the above natural language descriptions, we generated a sample-level P r o m p t ( i ) , “This remote sensing image exhibits change level, with a change intensity of intensity level.” In this way, the differential features are transformed into textual prompts in a semantic manner. These features explicitly encode the semantic differences between bi-temporal images, and the generated text prompts can express dynamic changes between images more accurately within the language modality.
We leveraged the CLIP text encoder to map prompts into a unified multimodal semantic space. Benefiting from CLIP’s strong cross-modal alignment, it effectively captured the semantic association between text and imagery. Specifically, we batched the generated prompts, tokenized them, and extracted their semantic embeddings through the CLIP text encoder T as follows:
T i = T ( Prompt ( i ) ) R d , d = 512 .
To enhance the stability of text-image matching, we applied the L2 normalization to the obtained feature vectors T i . This ensured that text and image features resided in a consistent directional space, improving cross-modal alignment and keeping the prompt embeddings within the same semantic space as the visual modality as follows:
T ˜ i , v T i T i 2 , for i = 1 , , B .
To compensate for the self-attention structure’s focus on the image’s own contextual information, while lacking explicit guidance from external semantics, we designed a text-driven cross-modal cross-attention mechanism. The core idea was to introduce semantic textual prompts, generated from the difference map, as the query in the attention mechanism. This explicitly integrated natural language guidance into image feature modeling. The fused image features were mapped into the key and value using a 1 × 1 convolution, while the textual embedding was linearly projected to form the query. The cross-modal attention mechanism is formulated as the following:
Attention ( Q t , K v , V v ) = softmax Q t K v T d k V v
where Q t = W q T ˜ i , v , K v = W k F j , V v = W v F j . W q denotes a linear projection and W k and W v represents a convolution operation.
The text-guided features are linearly projected and element-wise multiplied with the original image features F j to obtain text-enhanced representations F t e x t . To strengthen local structure modeling, we introduced a parallel path that applies a DWConv with a kernel size of 3 on the input feature F j . Moreover, to modulate the spatial influence of the textual prompt, we designed a gating mechanism. Specifically, two successive 1 × 1 convolutions followed by a Sigmoid function generate a weight vector g = [ g T , g V ] T from the fused F t e x t and D W C o n v ( F j ) , representing the contribution of the text and image features. The final gated fusion is computed as the following:
F i n a l = g T · F text + g V · ( DWConv ( F j ) )
where g T + g V 1 , when g T 1 , the model relies more on the text-guided information, whereas g V 1 indicates a stronger dependence on the image feature structure.
Remarks. Existing methods such as CASP [32] and CTD-transformer [33] mitigate registration errors via contextual alignment and structural consistency but remain confined to the visual modality, lacking semantic-level guidance in low-saliency regions. CKCD [26] introduces language prompts for semantic enhancement yet depends on static embeddings with poor adaptability to visual context. In contrast, the proposed VAL-Att embeds natural language prompts as semantic priors and employs a cross-modal attention mechanism (text as query, image as key/value), achieving explicit semantic alignment and saliency guidance for accurate change discrimination in complex scenes.

2.3. Loss Function

To effectively supervise training under severe class imbalance and complex structural changes, we designed a compound loss function that combines Dice Similarity Coefficient (DSC) loss with cross-entropy (CE) loss to jointly evaluate network performance, defined as the following:
L Dice ( y , p ) = 1 2 y p + 1 y + p + 1 L CE ( y , p ) = 1 N i = 1 N y i log ( p i ) + ( 1 y i ) log ( 1 p i )
where y and p represent ground truth (GT) and corresponding prediction map, The total loss is defined as follows
Loss ( y , p ) = λ L CE ( y , p ) + ( 1 λ ) L Dice ( y , p )
The Cross-Entropy (CE) loss serves as a pixel-wise classification objective to estimate change probabilities, but due to severe class imbalance in RSCD, it often biases toward dominant classes. To mitigate this, we introduced the dice loss, which measured region-level overlap between predictions and ground truth, enhancing robustness to foreground–background imbalance. Dice encourages boundary alignment and structural consistency, improving sensitivity to small or sparse changes. The hybrid loss thus combines pixel-level discrimination with regional consistency, achieving finer and more stable change localization.

2.4. Gradient Dynamics in Corner Cases

In RSCD, corner cases such as severe class imbalance, sparse change regions, and blurred boundaries often lead to unstable gradient behavior. For the hybrid objective, as follows:
L ( θ ) = λ L C E ( θ ) + ( 1 λ ) L D i c e ( θ ) ,
the gradient inherits different dynamics from its two components. The CE term provides sharp pixel-level signals but is sensitive to imbalance, while the dice term operates at a regional level, stabilizing small foregrounds but producing plateaued gradients when overlap is already high. The stochastic update is as follows:
θ t + 1 = θ t η ^ L ( θ t ) ,
with unbiased estimator ^ L and variance σ 2 . The stochastic descent lemma gives the following:
E L ( θ t + 1 ) L ( θ t ) η L ( θ t ) 2 + β 2 η 2 σ 2 .
In corner cases where the dice term dominates, σ 2 decreases due to regional averaging, yielding slower but steadier descent. Conversely, when CE dominates, the variance is higher, leading to faster early descent but possible oscillations. This complementary behavior explains the robustness of the combined loss.

2.5. Gradient Stability and Loss Convergence

Assuming β -smoothness, the descent lemma guarantees the following:
L ( θ t + 1 ) L ( θ t ) η 2 L ( θ t ) 2 ,
when η < 1 / β . For SGD, with step size η 1 / T ,
1 T t = 1 T E L ( θ t ) 2 = O 1 T .
Thus the hybrid loss converges in expectation under stochastic updates.
Let λ max ( 2 L ( θ t ) ) denote the sharpness. The gradient descent is stable if η < 2 / λ max . Training often operates near the edge of stability, where λ max 2 / η , yet remains effective. For SynerCD, dice reduces variance in sparse regions, CE enforces strong gradients at boundaries, and choosing η below 2 / λ ^ max ensures convergence to a stationary point. This formalizes why the hybrid loss achieves both stability and discrimination across diverse datasets.

3. Experiments

3.1. Datasets

Table 2 summarizes key properties of four dataset, including spatial resolution (ground sampling distance), image size, and the number of samples for training, validation, and testing. A detailed description is as follows:
(1) LEVIR-CD: This dataset consists of bi-temporal image pairs from various urban areas, primarily targeting building expansion and degradation. It includes diverse land cover types such as buildings and vegetation, with noticeable geographic and seasonal variations.
(2) CDD-CD: Comprising bi-temporal images from urban, rural, and ecological landscapes, this dataset highlights fine-grained changes such as building removal and vegetation shifts. It includes three types of samples: synthetic images with no displacement, synthetic images with slight displacement, and real satellite images reflecting actual scene changes.
(3) SYSU-CD: Containing 20,000 orthorectified image pairs from the Hong Kong region, this dataset captures a wide range of change scenarios including suburban development, construction sites, and coastal infrastructure expansion. It also features seasonal diversity, enabling robustness evaluation under vegetation, soil, and water fluctuations.
(4) WHU-CD: Constructed by Wuhan University, this dataset focuses on structural building changes in Christchurch, New Zealand, across pre-earthquake, post-earthquake, and reconstruction phases, emphasizing dynamic urban transformations.

3.2. Evaluation Metrics

We adopted six widely used evaluation metrics to quantitatively assess the model’s performance in RSCD, including Kappa coefficient [37], F1 score (F1) [38], precision (Pre) [39], recall (Rec) [39], intersection over union (IoU) [40], and overall accuracy (OA) [41]. These metrics provide a comprehensive evaluation from both class-wise and overall perspectives.

3.3. Implementation Details

The proposed SynerCD was implemented using the PyTorch 2.4.0 framework and trained on a single A40 GPU. During training, we adopted the Adawm optimizer with a momentum of 0.9, a weight decay of 0.0005, and an initial learning rate of 0.001. The network was trained for 300 epochs with a batch size of 16. The loss function was a weighted combination of dice loss and CE loss, with weights of 0.8 and 0.2, respectively.

3.4. Comparison with State of the Arts

To ensure fair evaluation, we strictly followed the official implementations and recommended hyperparameters of all compared methods, and unified the number of training epochs to 300. As shown in the quantitative tables and qualitative visualizations, our method achieves the best performance in terms of F1 and IoU across all three benchmark datasets.

3.4.1. Quantitative Comparison

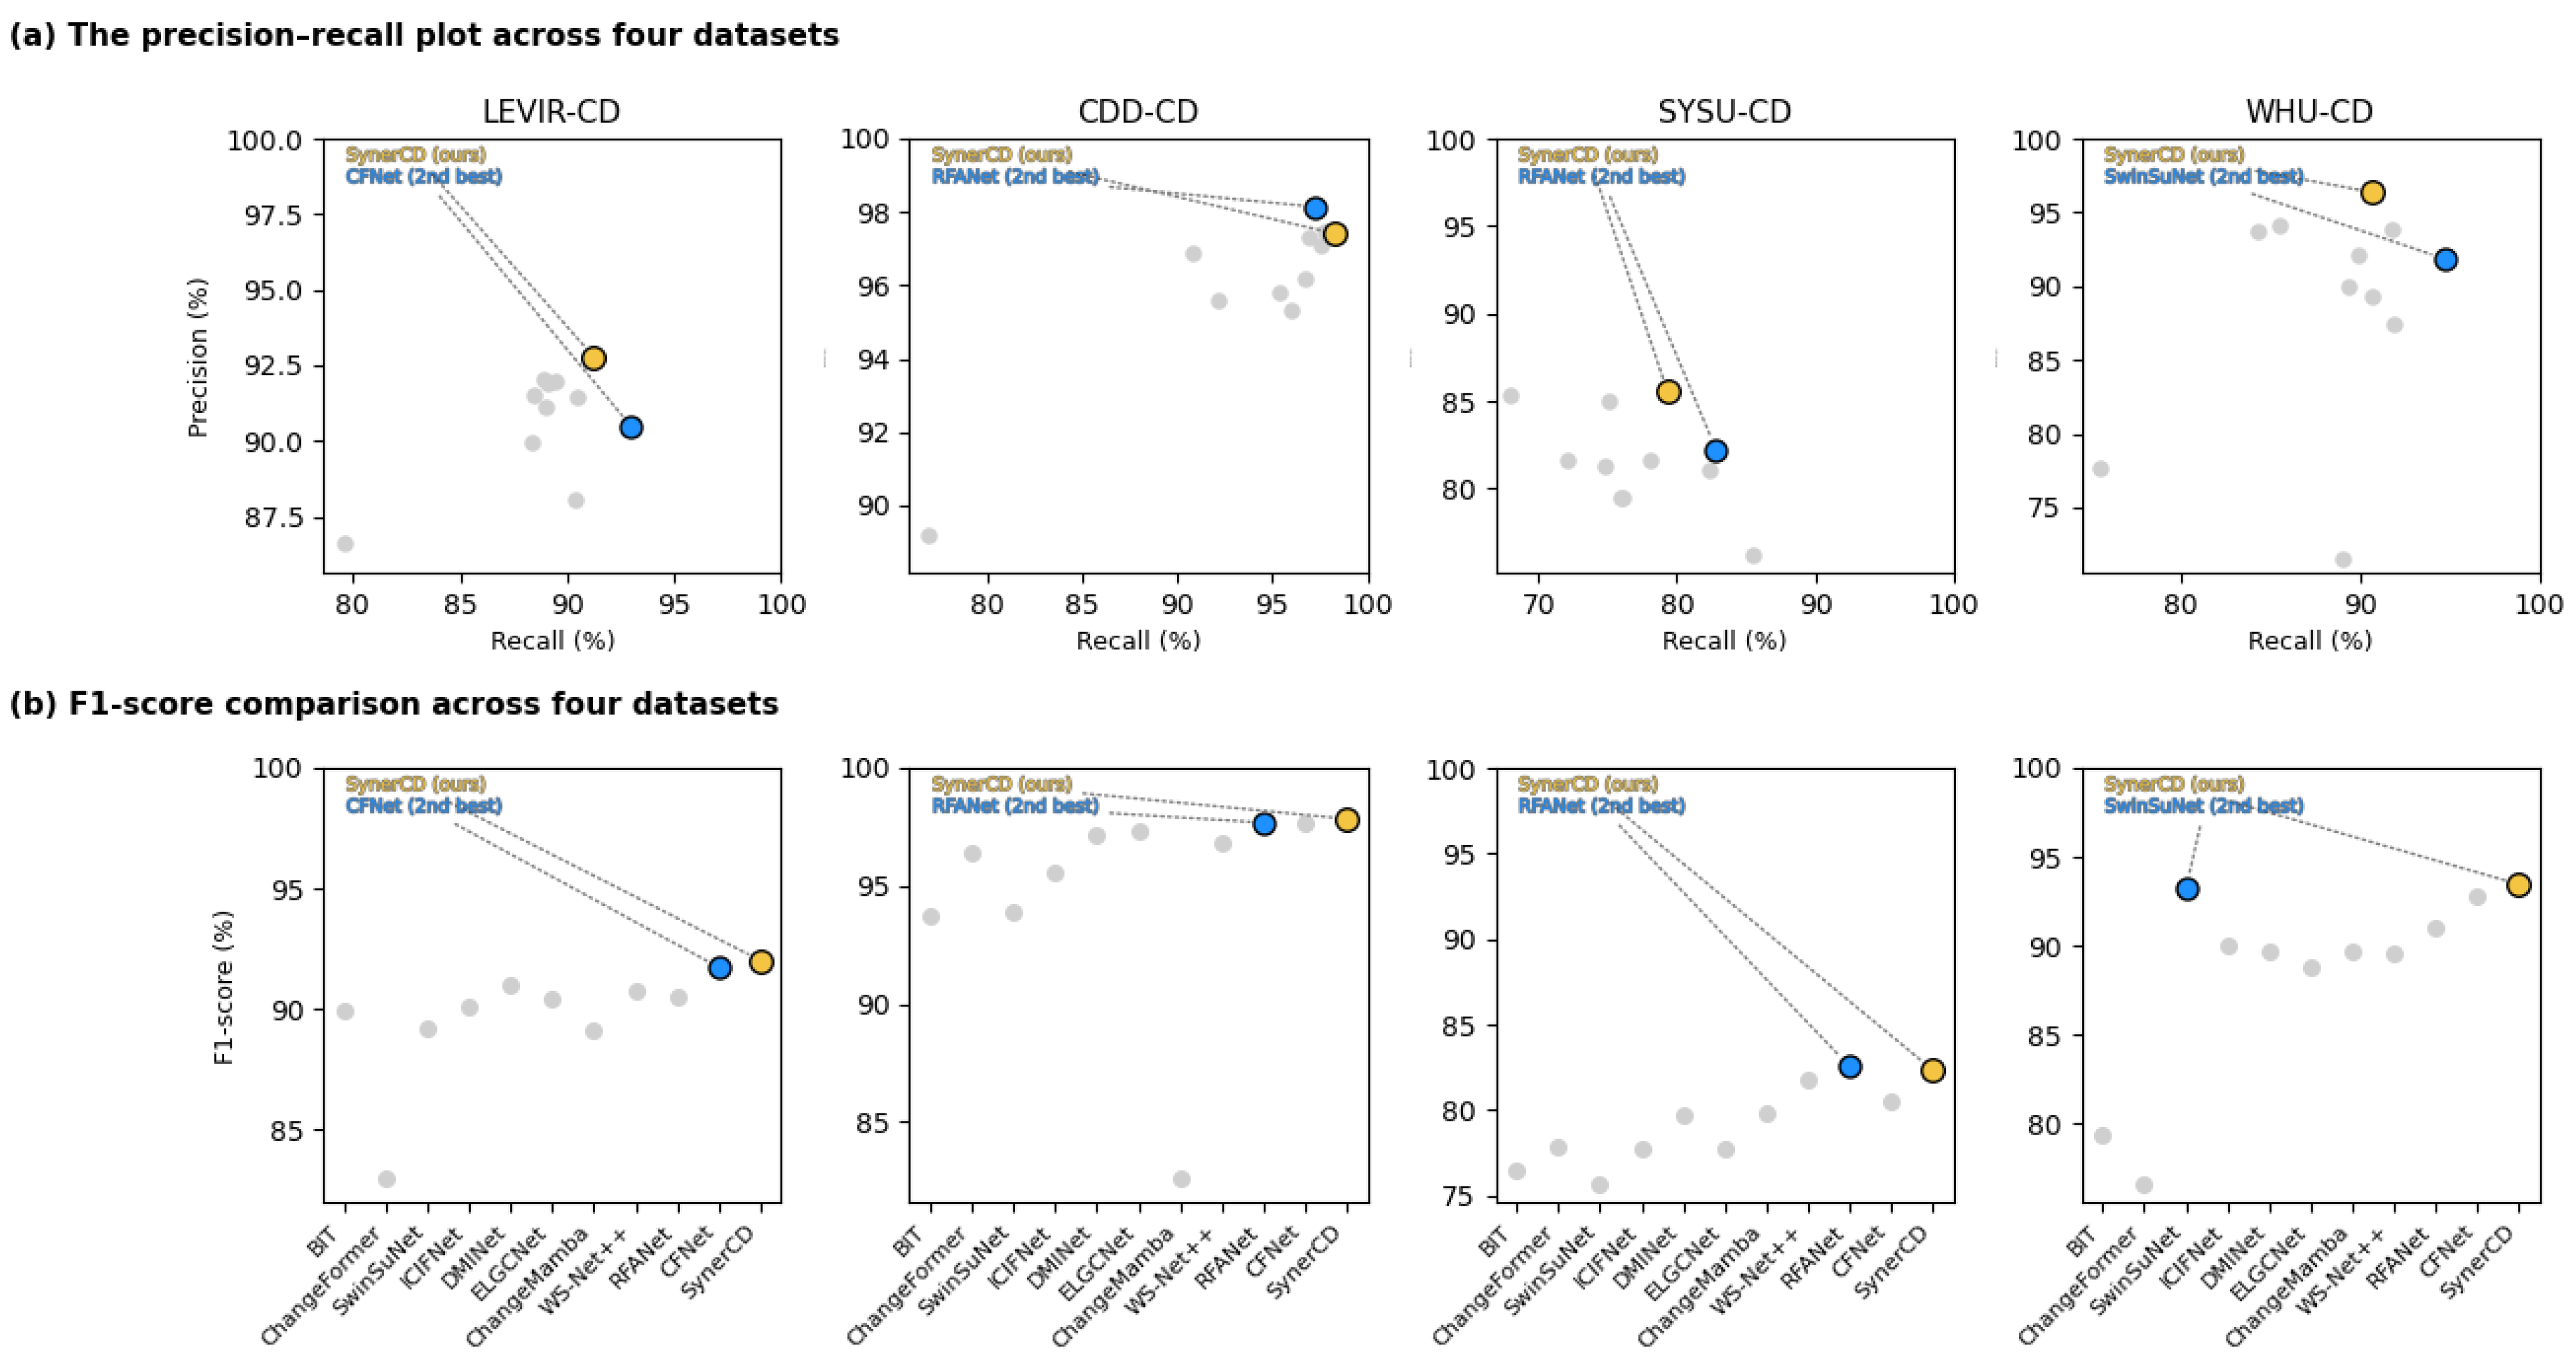
To verify the effectiveness of our model, we conducted extensive experiments on four public datasets. Table 3 and Table 4 compares the performance on LEVIR-CD, CDD-CD, SYSU-CD and WHU-CD, showing that our model consistently outperforms ten state-of-the-art methods. Specifically, on the LEVIR-CD dataset, SynerCD achieves a Kappa of 91.58% and an F1 of 92.01%, surpassing the second-best CFNet by 0.30% in Kappa, 0.29% in F1, and 0.76% in precision. On the CDD-CD dataset, SynerCD reaches 97.55% in Kappa and 97.84% in F1. Compared with WS-Net++, which is also based on wavelet transforms, SynerCD improves precision by 2.1% and IoU by 3.4%. On the SYSU-CD dataset, SynerCD attains a Kappa of 77.14% and a precision of 85.58%. Relative to SwinSuNet, a transformer-based architecture, our model improves Kappa by 7.94% and recall by 11.4%. On the WHU-CD dataset, SynerCD achieves 96.36% in precision and 87.71% in IoU. Compared with ChangeMamba, which shares the same Mamba backbone, SynerCD further improves recall by 1.37% and OA by 0.37%.
Furthermore, Figure 6a shows the precision–recall distributions of different models across four datasets. Our SynerCD consistently occupies the upper-right region, indicating superior precision and recall. Figure 6b presents the F1-score comparison grouped by model type, where SynerCD achieves the highest or near-highest F1 on most datasets while maintaining stable performance across diverse scenarios.

3.4.2. Complexity Comparison

As shown in Table 3, we compared the computational complexity of different methods in terms of the number of parameters (Params), floating-point operations (FLOPs), and inference time. The proposed SynerCD contains 13.71 M parameters, requires 30.52 GFLOPs, and achieves an inference time of 0.15 s, demonstrating a well-balanced trade-off between computational cost and detection performance. Compared with large-scale transformer-based models such as ChangeFormer (41.03 M, 202.79 G, 1.61 s) and ELGCNet (10.56 M, 187.98 G, 1.14 s), SynerCD achieves significantly lower computational complexity and faster inference, while maintaining superior accuracy. In contrast, relative to lightweight CNN-based approaches like CFNet (6.98 M, 3.84 G, 0.10 s) and DMINet (6.24 M, 14.55 G, 0.02 s), SynerCD delivers more accurate change detection results with only a moderate increase in model size and inference time. Overall, these results demonstrate that SynerCD achieves an excellent balance between efficiency and accuracy, benefiting from its synergistic transformer–Mamba architecture, which effectively reduces redundant computation while preserving high-level semantic representation capability.

3.4.3. Qualitative Comparison

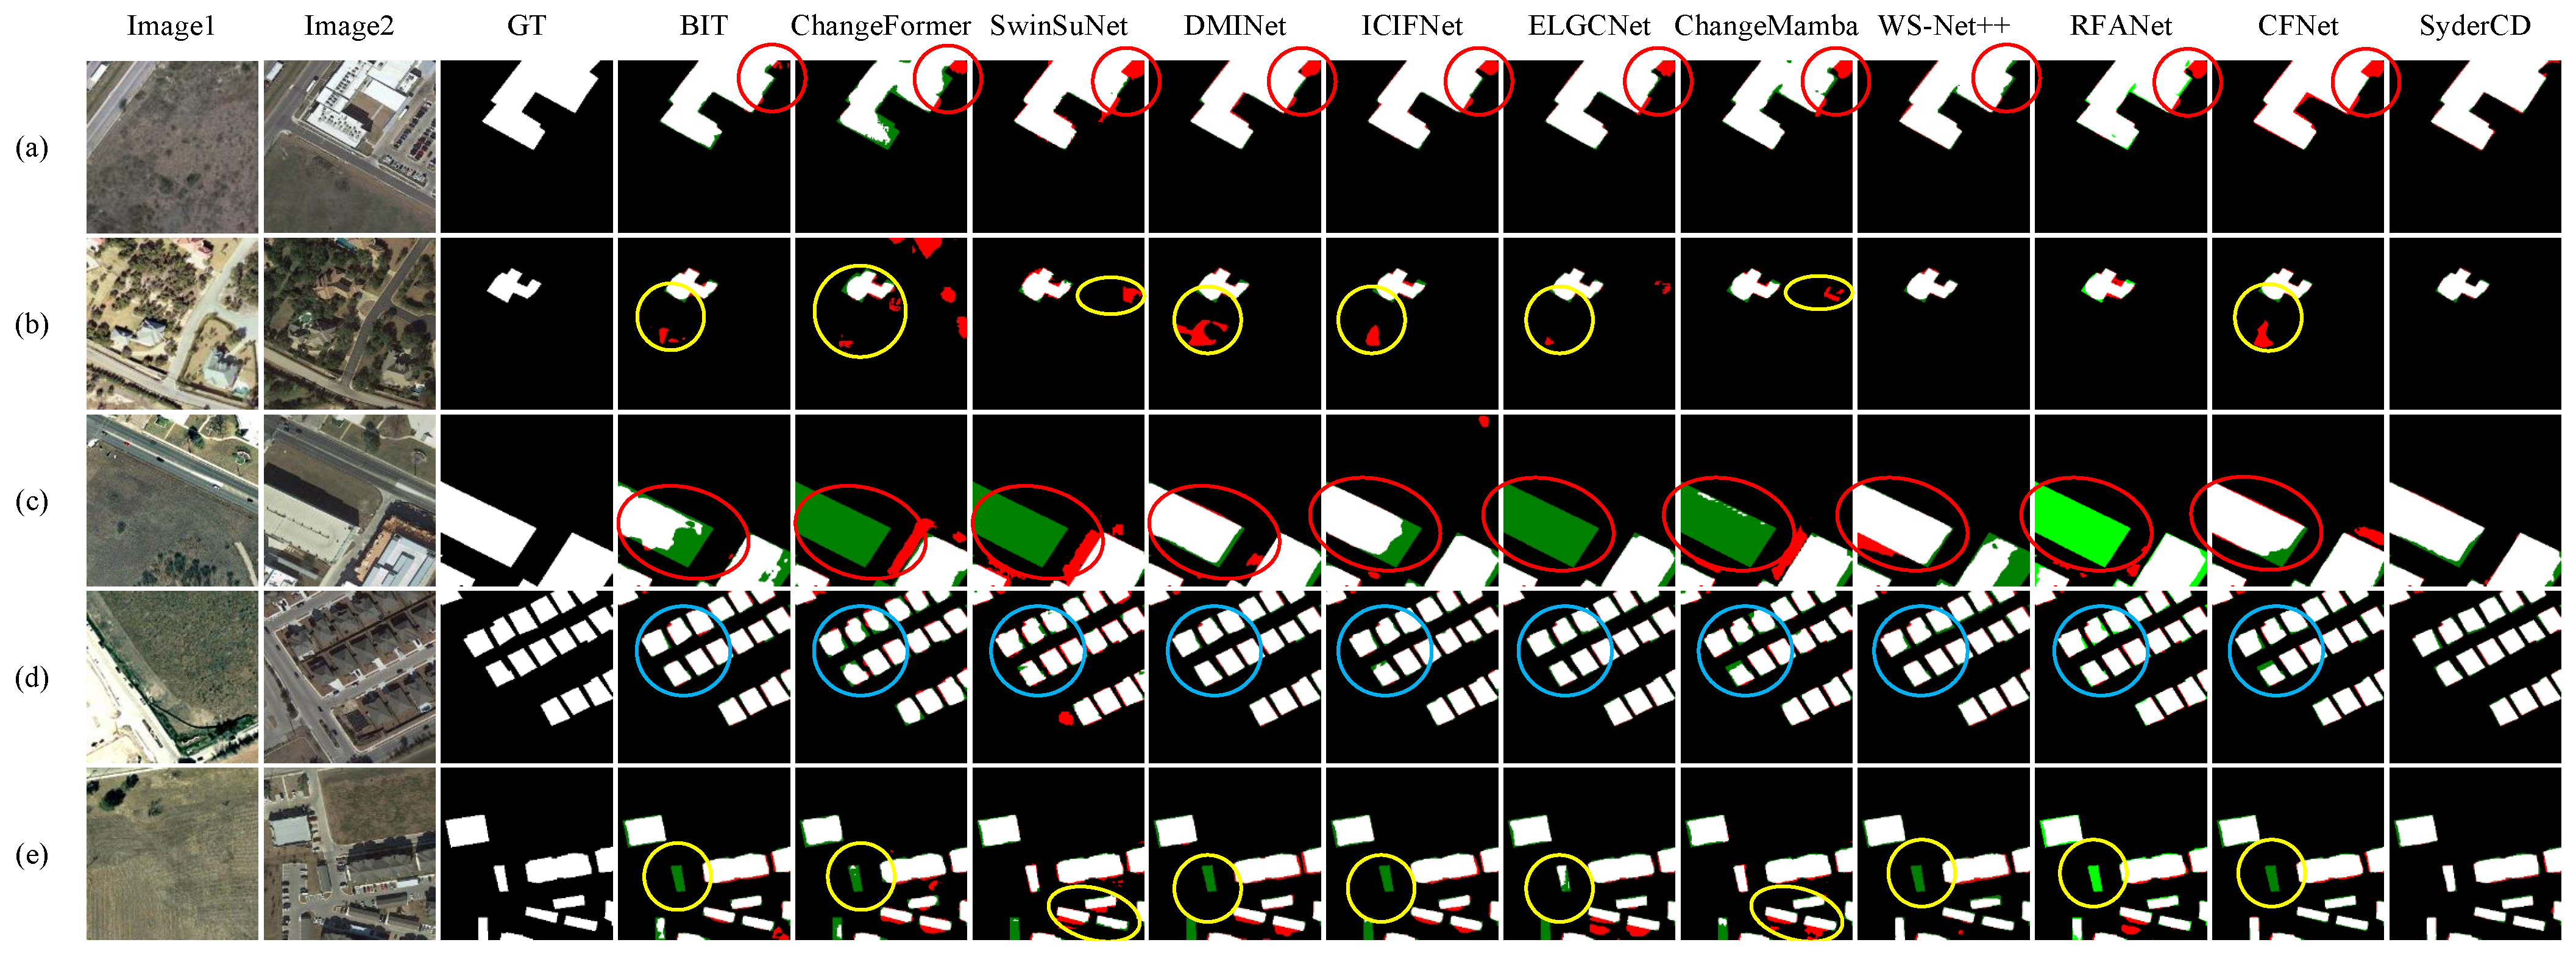
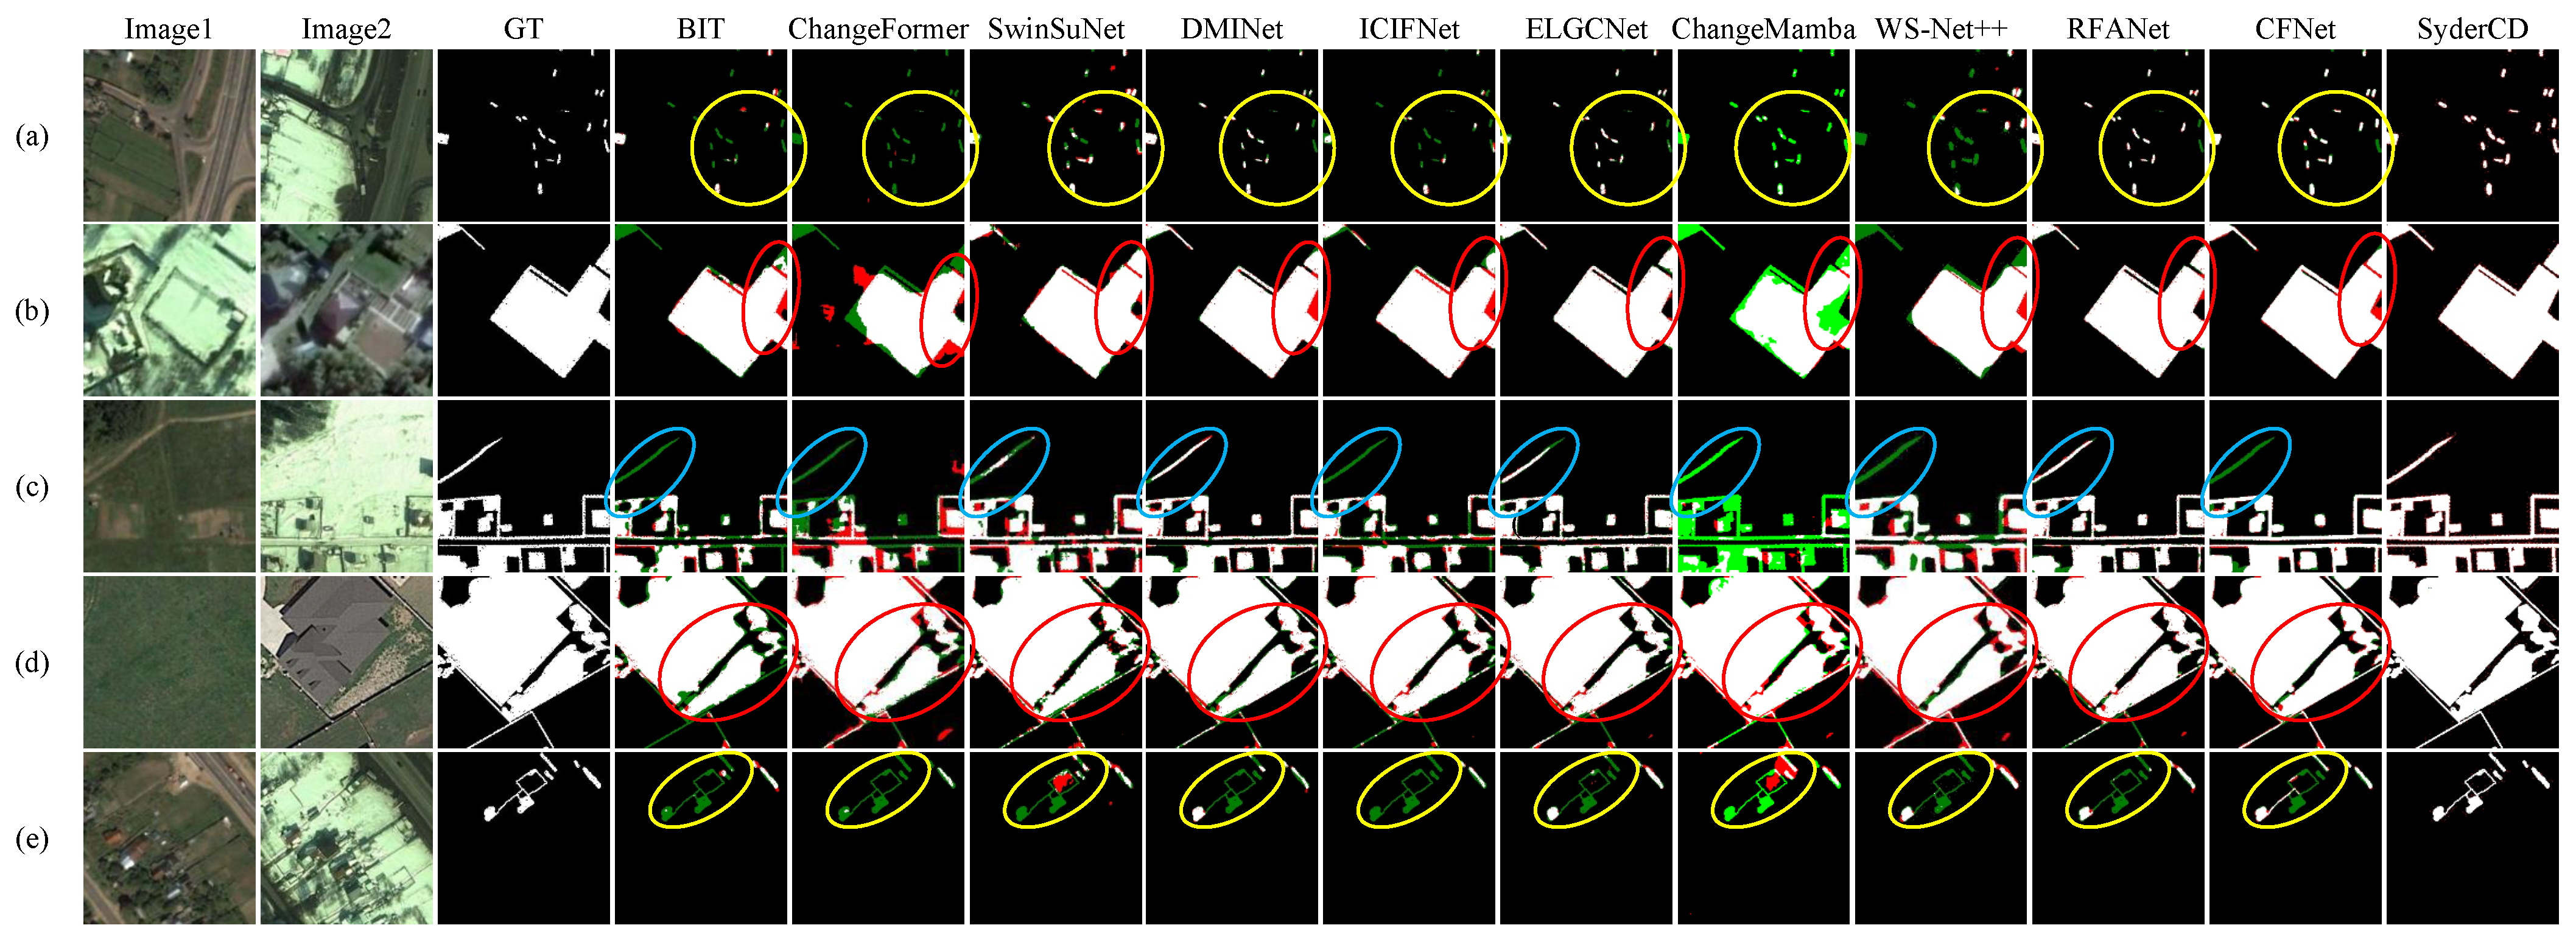
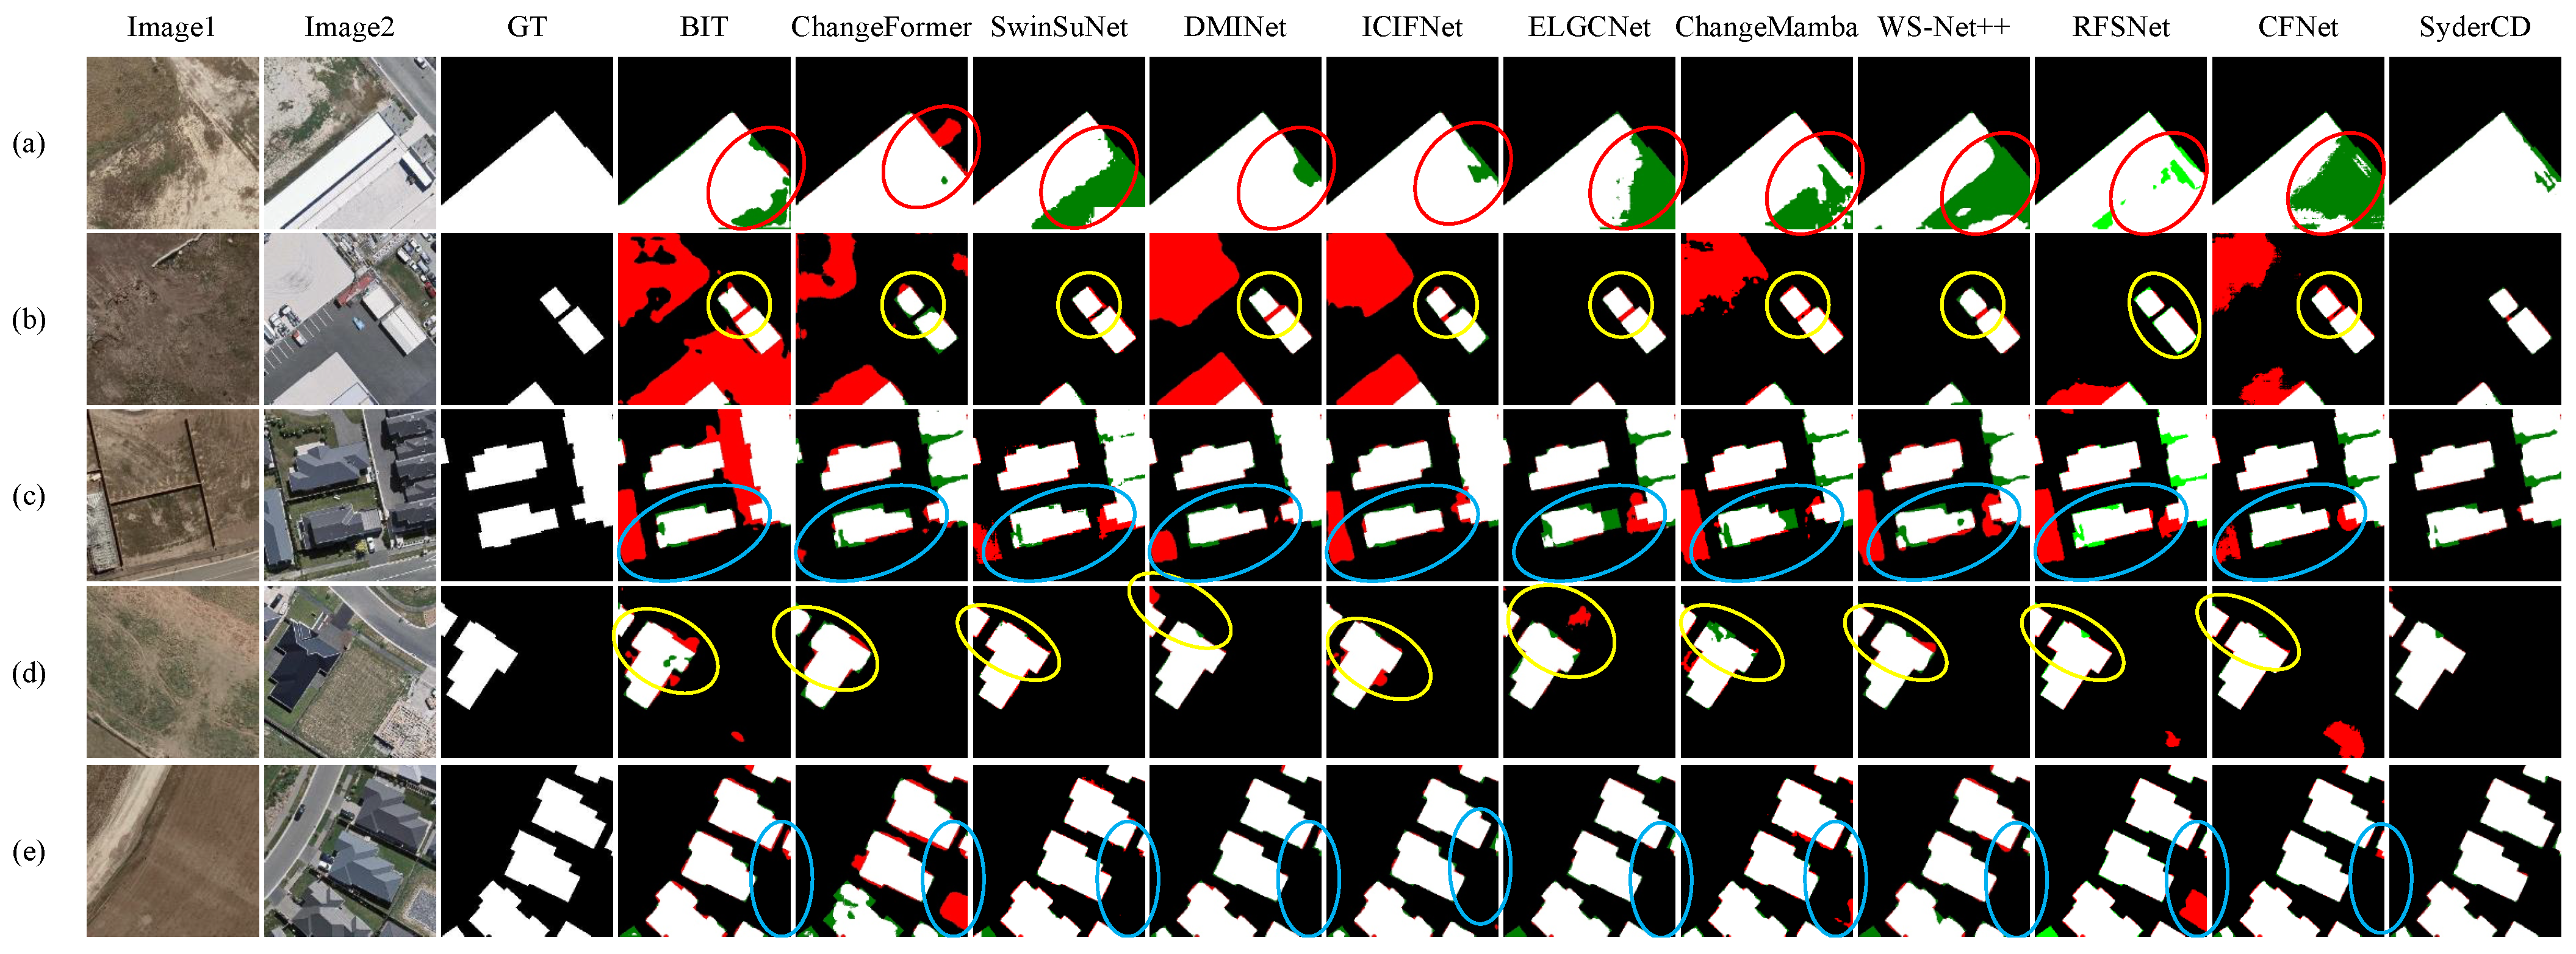
Additionally, we visualized the prediction results of all networks on the four datasets, as shown in the Figure 7, Figure 8, Figure 9 and Figure 10. In the visualization, red indicates false positives, green represents missed detections, white denotes change regions, and black corresponds to unchanged areas. From the figure, it is evident that regardless of changes caused by factors such as illumination, seasons, or soil structure, the proposed method accurately identifies the change regions while effectively mitigating the interference of pseudo-changes.
The visualization comparison on the LEVIR-CD dataset is shown in Figure 7, where we selected three representative types of change detection samples: large-scale changes (a,c), small-scale changes (b), and dense changes (d,e). In Figure 7a,c, methods such as BIT, DMINet, and RFANet are constrained by their limited receptive fields, leading to significant localization errors in the change regions (highlighted by red circles). In contrast, WS-Net++, which incorporates frequency-domain analysis, can effectively identify change regions by leveraging spectral features, but its predictions still exhibit boundary blurring due to insufficient cross-domain alignment. In Figure 7b, illumination variations introduce interference, causing most existing models to produce false detections (yellow circles), which indicates that single-channel modeling is inadequate for handling diverse types of changes. In the dense change scenarios of Figure 7d,e, our proposed SynerCD demonstrates clear superiority, producing precise and complete segmentation of change regions even under complex backgrounds.
The visualization results on the CDD-CD dataset are shown in Figure 8, covering three typical scenarios: (a,e) small-scale building changes, (b,d) large-scale building changes, and (c) intertwined changes of roads and residential areas. In Figure 8a,e, variations in imaging conditions cause most models to miss subtle changes (highlighted by yellow circles), whereas our model successfully alleviates the issue of missed detections for small targets. In Figure 8b,d models such as SwinSuNet and ChangeMamba fail to fully capture large-scale changes induced by soil condition differences (red circles), while our model effectively attends to fine-grained surface variations, achieving more accurate detection. In Figure 8c, ICIFNet and CFNet struggle to depict the overall trend of road changes (blue circles), whereas our model not only captures the complete change patterns of roads but also delineates boundaries with greater precision.
The visualization results on the SYSU-CD dataset are presented in Figure 9, where we compared two representative scenarios: port construction changes and sparse changes. In Figure 9a,b,d, all ten competing models fail to detect inconspicuous change patterns in port areas, since port expansion typically occurs in a progressive manner that is visually subtle. In contrast, our model successfully captures these fine structural variations, demonstrating superior capability in fine-grained change detection. In Figure 9c,e, due to complex backgrounds, methods such as SwinSuNet and ICIFNet are unable to accurately identify small-scale changes, while our model, guided by cross-modal alignment, effectively distinguishes real changes from background noise, yielding more stable and refined detection results.
The visualization results on the WHU-CD dataset are shown in Figure 10, where we compared three types of scenarios: large-scale changes, small-scale changes, and dense changes. In Figure 10a, due to the smooth scale of the change regions, existing models struggle to delineate the complete outlines of building changes, whereas our model effectively captures and restores the overall structures. In Figure 10b,d, most models are unable to filter out non-semantic variations such as shadows cast by buildings, leading to false detections. By contrast, our model accurately eliminates these artifacts and focuses on genuine structural changes. In Figure 10c,e, although all models are able to capture the main change regions, our model provides significantly finer boundary segmentation, producing clearer and more precise delineation of change areas.

3.5. Ablation Studies

3.5.1. Ablation of Two Modules

To further assess the impact of each proposed component on overall performance, we conducted ablation studies on the LEVIR-CD and CDD-CD datasets. These datasets differ significantly in scene complexity, object scale, and change types, providing a complementary testbed for evaluating generalization and robustness. As shown in Table 5, the baseline achieves F1 of 85.57 % and 92.01 % on the two datasets, respectively. Introducing each module individually leads to consistent performance gains, confirming their effectiveness. Notably, the full integration of the TSC module and VAL-Att achieves the highest F1 of 92.01 % and 97.84 % , respectively. This cross-dataset ablation not only validates the effectiveness of each component but also highlights their complementary roles under diverse imaging conditions and change scenarios, offering a more comprehensive understanding of real-world performance.
Contributions of WEMamba, LoFiConv, and TSC module. To evaluate the effectiveness of the proposed TSC module, we conducted a series of ablation studies on top of the baseline model, assessing the individual contributions of each branch: the LoFiConv branch, the WEMamba branch, and the full TSC configuration. The LoFiConv branch achieved Kappa score improvements of 6.39 % and 5.92 % on the two datasets, demonstrating its strength in capturing local spatial variations and fine-grained changes. The WEMamba branch, which combines the Mamba operator with wavelet-based frequency enhancement, improved IoU by 9.58 % and 9.99 % , indicating its effectiveness in modeling long-range dependencies and preserving high-frequency details for large or complex scene changes. The complete TSC module, which additionally includes an identity mapping branch for structural consistency and redundancy suppression, achieved the best overall performance, boosting F1 by 6.29 % and 5.56 % on the respective datasets. These results confirm the complementary advantages of each component and highlight the overall design’s effectiveness in balancing local detail modeling, global context understanding, and structural continuity.
Contributions of VAL-Att. To evaluate the effectiveness of introducing textual prompts in CD, we performed ablation studies based on the baseline model. As shown in the table, integrating VAL-Att improves the Kappa scores by 6.56% and 6.28% on the two datasets, respectively. This demonstrates that natural language prompts can effectively guide the model to focus on semantically relevant regions. By injecting explicit semantic priors, the VAL-Att module enhances the model’s ability to resolve ambiguities in low-contrast changes, promotes task-specific attention patterns, and improves structural consistency in predictions.
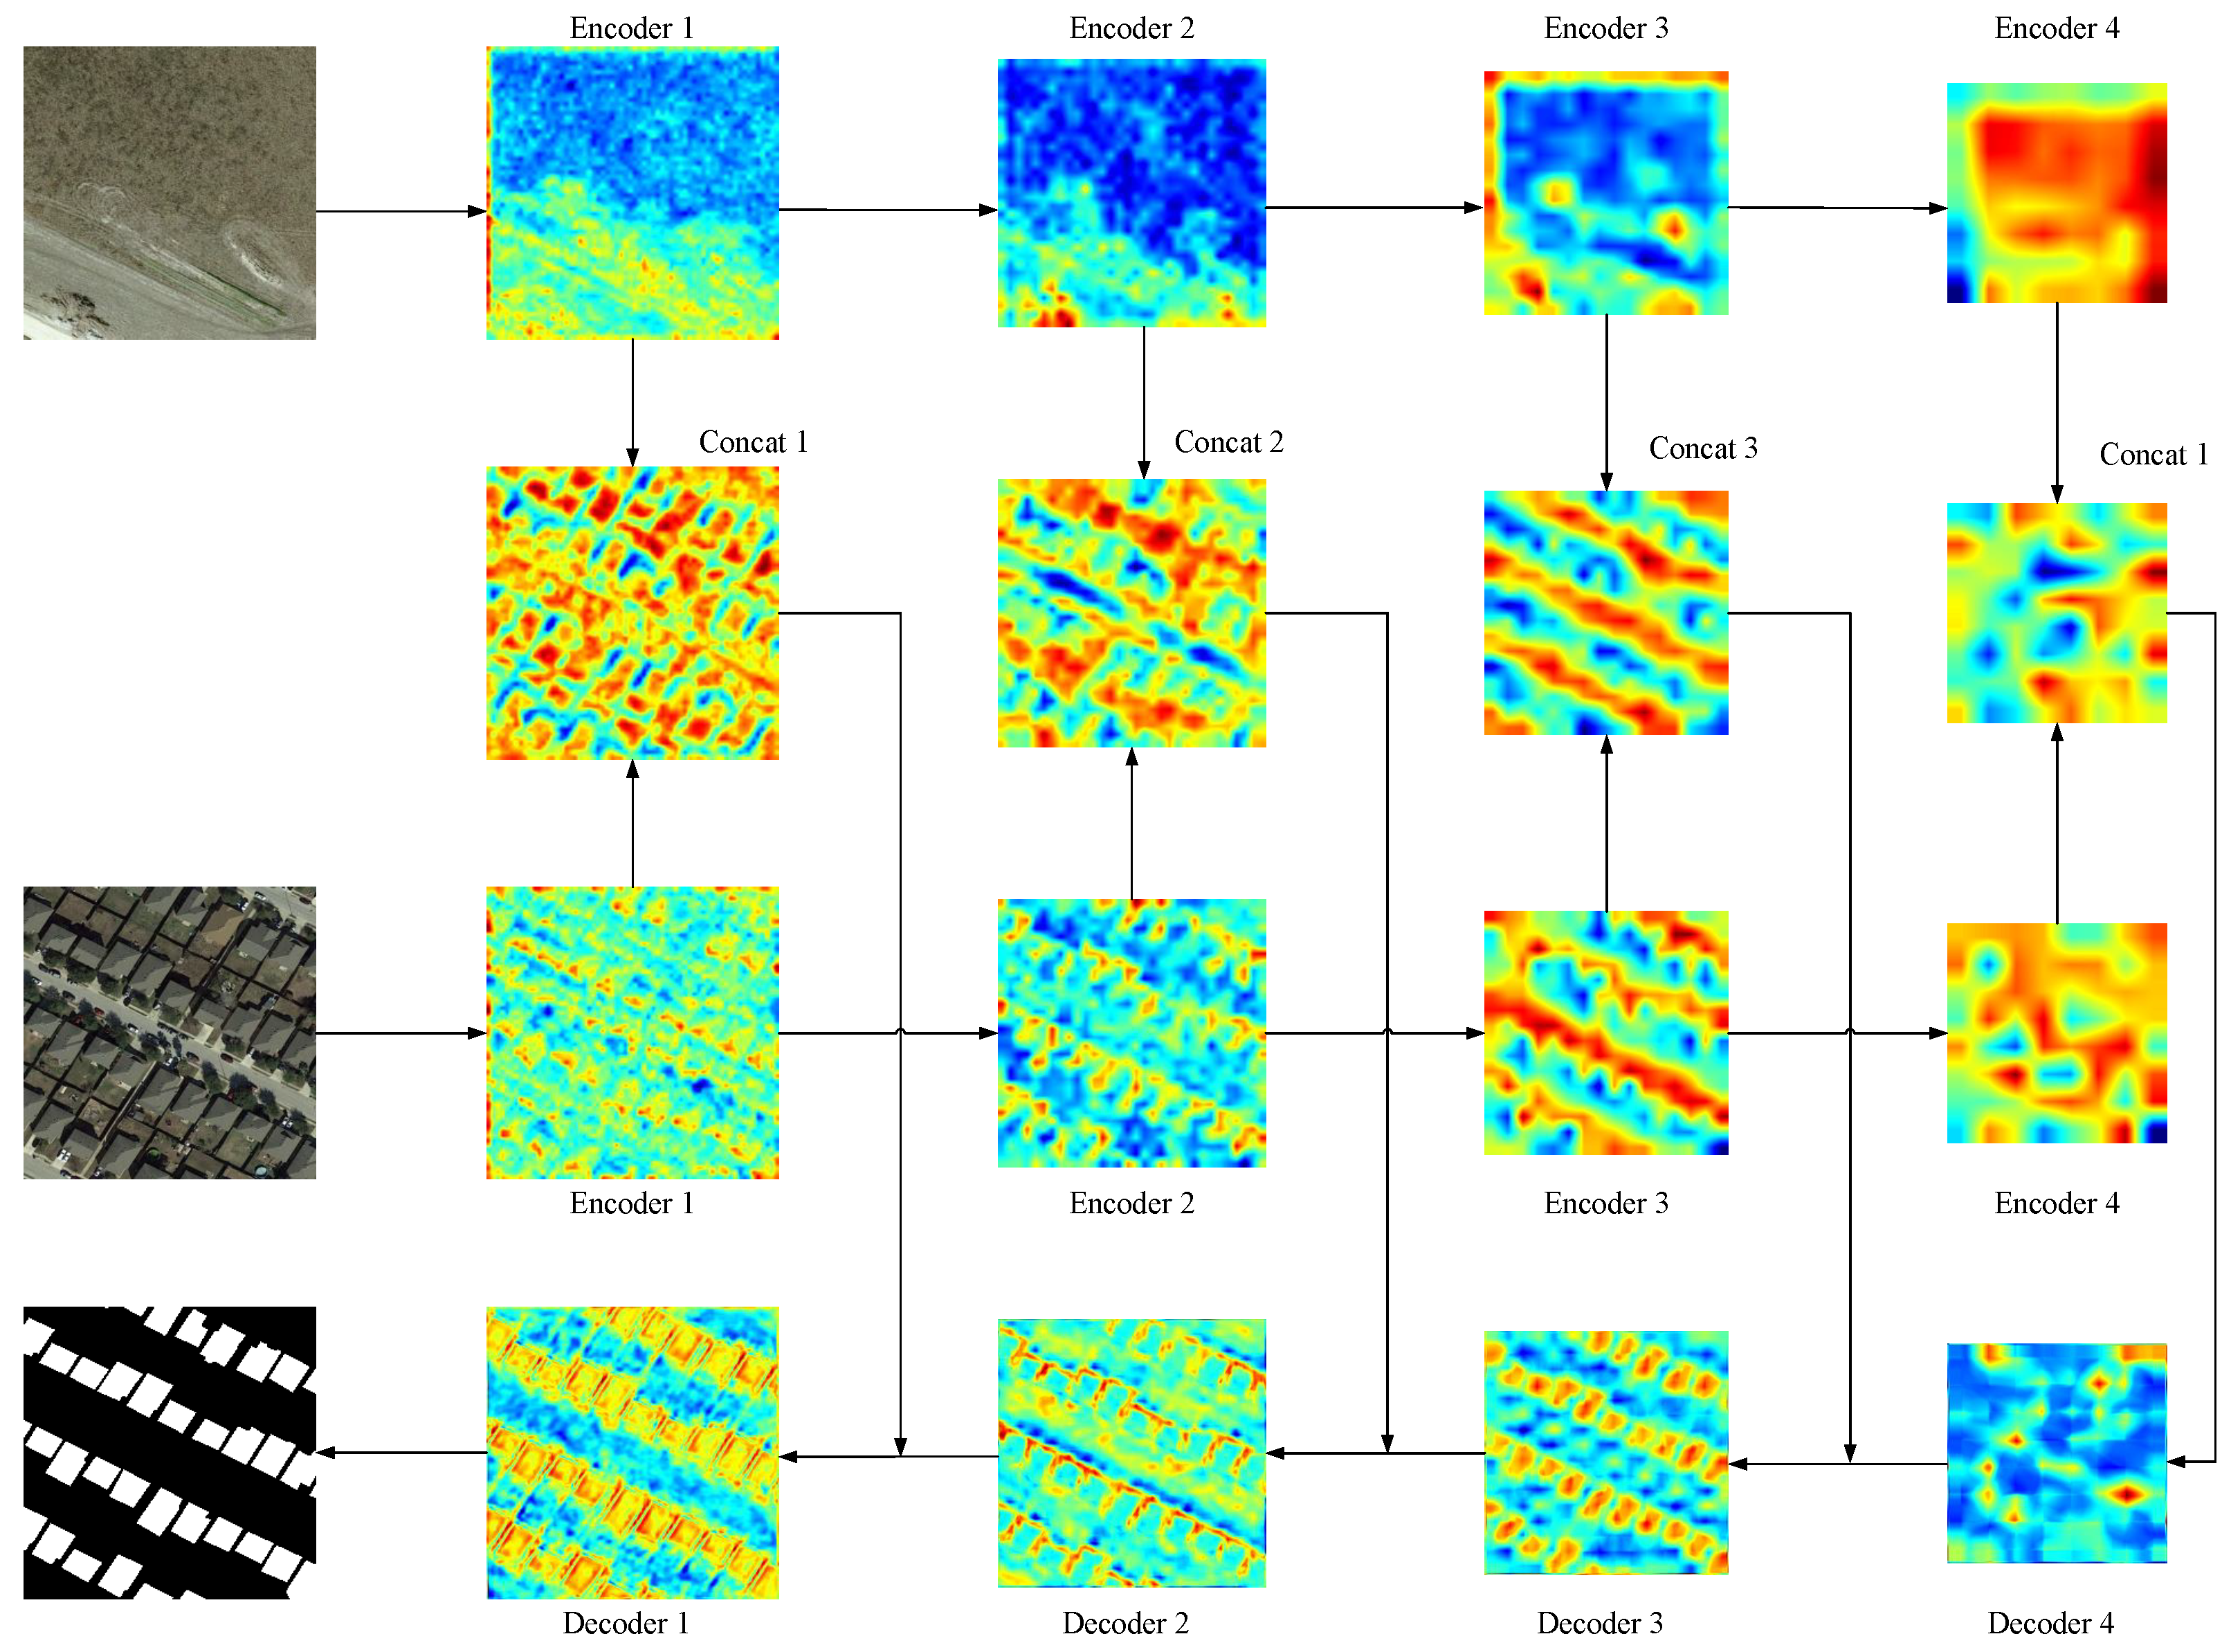
In Figure 11, to more effectively illustrate the proposed SynerCD, we visualized the activation heatmaps at each stages. In the visualization, red highlights the regions with strong responses, while blue indicates areas with weak responses. The results clearly reveal the joint spatial–frequency modeling capability of the TSC module, which emphasizes both structural layouts and fine-grained spectral variations. Subsequently, the VAL-Att mechanism injects semantic priors into the decoding process, guiding the model to selectively attend to regions highly correlated with the concept of change. Finally, after progressive decoding and fusion, the heatmaps become sharply concentrated within the actual change regions while irrelevant background responses are effectively suppressed, demonstrating the superior discrimination and localization ability of our design.

3.5.2. Ablation of Encoder Blocks

We further investigated the effect of network depth by varying the number of transformer blocks in each encoder stage, as summarized in Table 6. As the overall depth increases, performance consistently improves, with F1 rising from 91.65% to 92.01% and IoU from 84.58% to 85.20%, confirming that deeper architectures enhance feature representation. However, the contribution of each stage differs. Increasing blocks in the first and second stages yields only marginal gains, improving F1 by less than 0.2%, mainly stabilizing low-level textures. The fourth stage benefits slightly from additional blocks, but the improvement saturates, indicating redundancy. The third stage proves most critical—deepening it from five to seven blocks increases F1 by 0.2%3 and IoU by 0.39%, highlighting its role as a semantic transition layer that bridges spatial detail and global context. Ablation results demonstrate that deepening this stage to seven blocks fully exploits its potential, significantly enhancing global–local feature fusion and cross-domain modeling, and yielding the best F1 and IoU scores.

3.5.3. Ablation of Different Frequency Transform Methods

To assess the impact of different frequency-domain strategies on our encoder design, we replaced DWT with DCT and FFT for comparison. As shown in Table 7, all three variants perform well, but DWT consistently achieves slightly better results on both LEVIR-CD and CDD-CD. For instance, while DCT yields the highest Pre, it shows less stable performance across other metrics, with Rec dropping by 0.24% and 0.1%, respectively. FFT offers balanced results but falls short of optimal. The hierarchical decomposition of DWT naturally aligns with the encoder’s multi-scale design, enabling structured extraction of semantic features across spatial frequencies. In contrast, DCT emphasizes low-frequency components, suppressing high-frequency cues critical for fine-grained changes, while FFT’s complex-valued nature and sensitivity to rotation and illumination can introduce instability.

3.5.4. Ablation of Different Backbone in the Encoder

We compared several representative backbones, including ResNet18, ResNet50, PVT, Swin transformer, and ELGC, as summarized in Table 8. Convolution-based models perform relatively weakly, with ResNet50 improving F1 by only 0.16% over ResNet18. transformer-based architectures show stronger global modeling capability: PVT increases F1 by 0.58 and IoU by 0.98 compared with ResNet50, while Swin transformer and ELGC achieve comparable results around 91.7% in F1. Our proposed SynerCD encoder achieves the best overall performance, reaching 92.01 in F1 and 85.20 in IoU, outperforming PVT by 0.16% and 0.27% respectively, and surpassing Swin transformer by 0.25% and 0.43%. These consistent gains demonstrate the superiority of SynerCD in joint spatial–frequency modeling and semantic consistency maintenance.

3.5.5. Ablation of Different Attention Mechanism in the Decoder

To evaluate the effectiveness of the proposed cross-modal attention, we compared VAL-Att with several vision-only attention mechanisms on the LEVIR-CD dataset, as shown in Table 9. VAL-Att achieves the best overall performance with an F1 score of 92.01% and an IoU of 85.20%. Compared with SA, MHSA, CBAM, ShuffleAtt, and SKAtt, our method improves the F1 score by 0.67%, 0.53%, 0.15%, 0.09%, and 0.18%, and the IoU by 1.13%, 0.89%, 0.25%, 0.15%, and 0.30%, respectively. These consistent improvements demonstrate the superiority of semantic-aware cross-modal fusion over conventional visual attention. By introducing CLIP-based language prompts as semantic query, VAL-Att effectively aligns visual and textual representations, improving localization accuracy and semantic consistency in complex change regions.

3.5.6. Ablation of Different Loss Function in the Decoder

To evaluate the effect of different class-balanced objectives, we compared several representative losses, including CE, dice, CE+Focal, CE+BCL, and our proposed hybrid CE+dice loss. As shown in Table 10, the hybrid loss consistently achieves the best results on the LEVIR-CD dataset, with 92.01% F1, 85.20% IoU, and 91.58% Kappa. Compared with CE, dice, CE+Focal, and CE+BCL losses, SynerCD yields F1 gains of +0.61%, +0.25%, +0.21%, and +0.14%, and IoU gains of +1.04%, +0.43%, +0.23%, and +0.23%, respectively. These improvements confirm the complementary effect of the two components, CE enhances pixel-level discrimination, while dice enforces region-level consistency and boundary alignment. By jointly optimizing both criteria, the hybrid loss dynamically balances class proportions and spatial coherence, leading to more stable convergence and finer localization, particularly under class-imbalanced or small-change conditions.

4. Conclusions

This paper presents SynerCD, a remote sensing change detection framework that couples multi-branch collaborative modeling with vision-language attention. The encoder employs a Tri-branch Synergistic Coupling (TSC) module that integrates frequency enhancement, contextual modeling, and structure preservation through a channel grouping strategy, enabling the network to capture complex and multi-scale changes more effectively. The decoder incorporates the proposed vision-aware language-guided attention (VAL-Att), which leverages CLIP-encoded text prompts as semantic queries in a transformer to guide cross-modal attention fusion and enhance focus on semantically meaningful change regions. Extensive experiments on three public benchmarks verify that SynerCD achieves superior accuracy and robustness compared with existing methods. However, performance on the SYSU dataset remains limited due to background interference, large geometric variations, and inconsistent imaging quality. Future work will aim to enhance fine-grained change perception in complex scenes and improve adaptability to heterogeneous remote sensing sources.

Author Contributions

Conceptualization, Y.T. and P.Z.; methodology, Y.T. and P.Z.; software, Y.T., P.Z. and W.T.; validation, W.T. and S.C.; formal analysis, P.Z. and W.T.; investigation, Y.T. and S.C.; resources, L.W.; data curation, W.T.; writing—original draft preparation, Y.T. and P.Z.; writing—review and editing, S.C. and L.W.; visualization, W.T.; supervision, L.W.; project administration, L.W.; funding acquisition, L.W. All authors have read and agreed to the published version of the manuscript.

Funding

This research was funded by the Scientific and Technological Innovation 2030 major project under Grant 2022ZD0115800, Xinjiang Uygur Autonomous Region Tianshan Excellence Project under Grant 2022TSYCLJ0036, and the National Natural Science Foundation of China (Regional Project) under Grant 62466056.

Data Availability Statement

Our code is publicly available at https://github.com/tymtttttt/SynderCD (accessed on 9 November 2025) LEVIR-CD dataset is available at: https://justchenhao.github.io/LEVIR/ (accessed on 9 November 2025).

Conflicts of Interest

The authors declare no conflicts of interest.

References

  1. Miao, J.; Li, S.; Bai, X.; Gan, W.; Wu, J.; Li, X. RS-NormGAN: Enhancing change detection of multi-temporal optical remote sensing images through effective radiometric normalization. ISPRS J. Photogramm. Remote Sens. 2025, 221, 324–346. [Google Scholar] [CrossRef]
  2. Daudt, R.C.; Le Saux, B.; Boulch, A. Fully convolutional siamese networks for change detection. In Proceedings of the 2018 25th IEEE International Conference on Image Processing (ICIP), Athens, Greece, 7–10 October 2018; pp. 4063–4067. [Google Scholar]
  3. Zhang, M.; Shi, W. A feature difference convolutional neural network-based change detection method. IEEE Trans. Geosci. Remote Sens. 2020, 58, 7232–7246. [Google Scholar] [CrossRef]
  4. Hou, X.; Bai, Y.; Li, Y.; Shang, C.; Shen, Q. High-resolution triplet network with dynamic multiscale feature for change detection on satellite images. ISPRS J. Photogramm. Remote Sens. 2021, 177, 103–115. [Google Scholar] [CrossRef]
  5. Li, Z.; Tang, C.; Wang, L.; Zomaya, A.Y. Remote sensing change detection via temporal feature interaction and guided refinement. IEEE Trans. Geosci. Remote Sens. 2022, 60, 5628711. [Google Scholar] [CrossRef]
  6. Peng, D.; Bruzzone, L.; Zhang, Y.; Guan, H.; He, P. SCDNET: A novel convolutional network for semantic change detection in high resolution optical remote sensing imagery. Int. J. Appl. Earth Obs. Geoinf. 2021, 103, 102465. [Google Scholar] [CrossRef]
  7. Chen, J.; Yuan, Z.; Peng, J.; Chen, L.; Huang, H.; Zhu, J.; Liu, Y.; Li, H. DASNet: Dual attentive fully convolutional Siamese networks for change detection in high-resolution satellite images. IEEE J. Sel. Top. Appl. Earth Obs. Remote Sens. 2020, 14, 1194–1206. [Google Scholar] [CrossRef]
  8. Shi, Q.; Liu, M.; Li, S.; Liu, X.; Wang, F.; Zhang, L. A deeply supervised attention metric-based network and an open aerial image dataset for remote sensing change detection. IEEE Trans. Geosci. Remote Sens. 2021, 60, 5604816. [Google Scholar] [CrossRef]
  9. Gu, A.; Goel, K.; Ré, C. Efficiently modeling long sequences with structured state spaces. arXiv 2021, arXiv:2111.00396. [Google Scholar]
  10. Gu, A.; Dao, T. Mamba: Linear-time sequence modeling with selective state spaces. arXiv 2023, arXiv:2312.00752. [Google Scholar] [CrossRef]
  11. Zhao, S.; Chen, H.; Zhang, X.; Xiao, P.; Bai, L.; Ouyang, W. Rs-mamba for large remote sensing image dense prediction. IEEE Trans. Geosci. Remote Sens. 2024, 62, 5633314. [Google Scholar] [CrossRef]
  12. Chen, H.; Song, J.; Han, C.; Xia, J.; Yokoya, N. Changemamba: Remote sensing change detection with spatio-temporal state space model. IEEE Trans. Geosci. Remote Sens. 2024, 62, 4409720. [Google Scholar]
  13. Zhang, H.; Chen, K.; Liu, C.; Chen, H.; Zou, Z.; Shi, Z. CDMamba: Remote sensing image change detection with mamba. arXiv 2024, arXiv:2406.04207. [Google Scholar] [CrossRef]
  14. Ma, X.; Yang, J.; Che, R.; Zhang, H.; Zhang, W. Ddlnet: Boosting remote sensing change detection with dual-domain learning. In Proceedings of the 2024 IEEE International Conference on Multimedia and Expo (ICME), Niagara Falls, ON, Canada, 15–19 July 2024; pp. 1–6. [Google Scholar]
  15. Zhu, Y.; Fan, L.; Li, Q.; Chang, J. Multi-scale discrete cosine transform network for building change detection in very-high-resolution remote sensing images. Remote Sens. 2023, 15, 5243. [Google Scholar] [CrossRef]
  16. Xiong, F.; Li, T.; Yang, Y.; Zhou, J.; Lu, J.; Qian, Y. Wavelet Siamese Network with semi-supervised domain adaptation for remote sensing image change detection. IEEE Trans. Geosci. Remote Sens. 2024, 62, 5633613. [Google Scholar] [CrossRef]
  17. Dong, Z.; Cheng, D.; Li, J. SpectMamba: Remote sensing change detection network integrating frequency and visual state space model. Expert Syst. Appl. 2025, 287, 127902. [Google Scholar] [CrossRef]
  18. Radford, A.; Kim, J.W.; Hallacy, C.; Ramesh, A.; Goh, G.; Agarwal, S.; Sastry, G.; Askell, A.; Mishkin, P.; Clark, J.; et al. Learning transferable visual models from natural language supervision. In Proceedings of the International Conference on Machine Learning, PmLR, Virtual, 18–24 July 2021; pp. 8748–8763. [Google Scholar]
  19. Wang, T.; Bai, T.; Xu, C.; Zhang, E.; Liu, B.; Zhao, X.; Zhang, H. MDS-Net: An Image-Text Enhanced Multimodal Dual-Branch Siamese Network for Remote Sensing Change Detection. IEEE J. Sel. Top. Appl. Earth Obs. Remote Sens. 2025, 18, 12421–12438. [Google Scholar] [CrossRef]
  20. Qiu, J.; Liu, W.; Zhang, H.; Li, E.; Zhang, L.; Li, X. A Novel Change Detection Method Based on Visual Language from High-Resolution Remote Sensing Images. IEEE J. Sel. Top. Appl. Earth Obs. Remote Sens. 2024, 18, 4554–4567. [Google Scholar] [CrossRef]
  21. Dong, S.; Wang, L.; Du, B.; Meng, X. ChangeCLIP: Remote sensing change detection with multimodal vision-language representation learning. ISPRS J. Photogramm. Remote Sens. 2024, 208, 53–69. [Google Scholar] [CrossRef]
  22. Zheng, W.; Yang, J.; Chen, J.; He, J.; Li, P.; Sun, D.; Chen, C.; Meng, X. Cross-Temporal Knowledge Injection with Color Distribution Normalization for Remote Sensing Change Detection. IEEE J. Sel. Top. Appl. Earth Obs. Remote Sens. 2025, 18, 6249–6265. [Google Scholar] [CrossRef]
  23. Jiang, Z.; Wang, B.; Xu, X.; Zhang, Y.; Zhang, P.; Wu, Y.; Yang, H. Feature Enhancement and Feedback Network for Change Detection in Remote Sensing Images. IEEE Geosci. Remote Sens. Lett. 2025, 22, 2500905. [Google Scholar] [CrossRef]
  24. Liu, G.; Yuan, Y.; Zhang, Y.; Dong, Y.; Li, X. Style transformation-based spatial–spectral feature learning for unsupervised change detection. IEEE Trans. Geosci. Remote Sens. 2020, 60, 5401515. [Google Scholar] [CrossRef]
  25. Lin, H.; Zhao, C.; He, R.; Zhu, M.; Jiang, X.; Qin, Y.; Gao, W. CGA-Net: A CNN-GAT Aggregation Network based on Metric for Change Detection in Remote Sensing. IEEE J. Sel. Top. Appl. Earth Obs. Remote Sens. 2025, 18, 8360–8376. [Google Scholar] [CrossRef]
  26. Hoxha, G.; Chouaf, S.; Melgani, F.; Smara, Y. Change captioning: A new paradigm for multitemporal remote sensing image analysis. IEEE Trans. Geosci. Remote Sens. 2022, 60, 5627414. [Google Scholar] [CrossRef]
  27. Yin, K.; Liu, F.; Liu, J.; Xiao, L. Vision-Language Joint Learning for Box-Supervised Change Detection in Remote Sensing. In Proceedings of the IGARSS 2024-2024 IEEE International Geoscience and Remote Sensing Symposium, Athens, Greece, 7–12 July 2024; pp. 10254–10258. [Google Scholar]
  28. Guo, Z.; Chen, H.; He, F. MSFNet: Multi-scale Spatial-frequency Feature Fusion Network for Remote Sensing Change Detection. IEEE J. Sel. Top. Appl. Earth Obs. Remote Sens. 2024, 18, 1912–1925. [Google Scholar] [CrossRef]
  29. Zhang, X.; Chen, H.; Zhao, Y.; He, M.; Han, X. Change detection of buildings in remote sensing images using a spatially and contextually aware Siamese network. Expert Syst. Appl. 2025, 276, 127110. [Google Scholar] [CrossRef]
  30. Feng, Y.; Zhuo, L.; Zhang, H.; Li, J. Hybrid-MambaCD: Hybrid Mamba-CNN Network for Remote Sensing Image Change Detection With Region-Channel Attention Mechanism and Iterative Global-Local Feature Fusion. IEEE Trans. Geosci. Remote Sens. 2025, 63, 5907912. [Google Scholar] [CrossRef]
  31. Li, Z.; Zhang, Z.; Li, M.; Zhang, L.; Peng, X.; He, R.; Shi, L. Dual Fine-Grained network with frequency Transformer for change detection on remote sensing images. Int. J. Appl. Earth Obs. Geoinf. 2025, 136, 104393. [Google Scholar] [CrossRef]
  32. Wang, Q.; Zhang, M.; Ren, J.; Li, Q. Exploring Context Alignment and Structure Perception for Building Change Detection. IEEE Trans. Geosci. Remote Sens. 2025, 63, 5609910. [Google Scholar] [CrossRef]
  33. Zhang, K.; Zhao, X.; Zhang, F.; Ding, L.; Sun, J.; Bruzzone, L. Relation Changes Matter: Cross-Temporal Difference Transformer for Change Detection in Remote Sensing Images. IEEE Trans. Geosci. Remote Sens. 2023, 61, 5611615. [Google Scholar] [CrossRef]
  34. Chen, H.; Shi, Z. A spatial-temporal attention-based method and a new dataset for remote sensing image change detection. Remote Sens. 2020, 12, 1662. [Google Scholar] [CrossRef]
  35. Lebedev, M.; Vizilter, Y.V.; Vygolov, O.; Knyaz, V.A.; Rubis, A.Y. Change detection in remote sensing images using conditional adversarial networks. Int. Arch. Photogramm. Remote Sens. Spat. Inf. Sci. 2018, 42, 565–571. [Google Scholar]
  36. Ji, S.; Wei, S.; Lu, M. Fully convolutional networks for multisource building extraction from an open aerial and satellite imagery data set. IEEE Trans. Geosci. Remote Sens. 2018, 57, 574–586. [Google Scholar] [CrossRef]
  37. Cohen, J. A coefficient of agreement for nominal scales. Educ. Psychol. Meas. 1960, 20, 37–46. [Google Scholar] [CrossRef]
  38. Chinchor, N. MUC-4 evaluation metrics. In Proceedings of the 4th Message Understanding Conference (MUC-4), McLean, VA, USA, 16–18 June 1992; Association for Computational Linguistics: Stroudsburg, PA, USA, 1992; pp. 22–29. [Google Scholar]
  39. Van Rijsbergen, C. Information retrieval: Theory and practice. In Proceedings of the Joint IBM/University of Newcastle upon Tyne Seminar on Data Base Systems, Newcastle upon Tyne, UK, 4–7 September 1979; Butterworth-Heinemann: Oxford, UK, 1979; pp. 1–14. [Google Scholar]
  40. Jaccard, P. Étude comparative de la distribution florale dans une portion des Alpes et des Jura. Bull. Société Vaudoise Sci. Nat. 1901, 37, 547–579. [Google Scholar]
  41. Congalton, R.G. A review of assessing the accuracy of classifications of remotely sensed data. Remote Sens. Environ. 1991, 37, 35–46. [Google Scholar] [CrossRef]
  42. Chen, H.; Qi, Z.; Shi, Z. Remote sensing image change detection with transformers. IEEE Trans. Geosci. Remote Sens. 2021, 60, 5607514. [Google Scholar] [CrossRef]
  43. Bandara, W.G.C.; Patel, V.M. A transformer-based siamese network for change detection. In Proceedings of the IGARSS 2022-2022 IEEE International Geoscience and Remote Sensing Symposium, Kuala Lumpur, Malaysia, 17–22 July 2022; pp. 207–210. [Google Scholar]
  44. Zhang, C.; Wang, L.; Cheng, S.; Li, Y. SwinSUNet: Pure transformer network for remote sensing image change detection. IEEE Trans. Geosci. Remote Sens. 2022, 60, 5224713. [Google Scholar] [CrossRef]
  45. Feng, Y.; Xu, H.; Jiang, J.; Liu, H.; Zheng, J. ICIF-Net: Intra-Scale Cross-Interaction and Inter-Scale Feature Fusion Network for Bitemporal Remote Sensing Images Change Detection. IEEE Trans. Geosci. Remote Sens. 2022, 60, 4410213. [Google Scholar] [CrossRef]
  46. Feng, Y.; Jiang, J.; Xu, H.; Zheng, J. Change Detection on Remote Sensing Images Using Dual-Branch Multilevel Intertemporal Network. IEEE Trans. Geosci. Remote Sens. 2023, 61, 4401015. [Google Scholar] [CrossRef]
  47. Noman, M.; Fiaz, M.; Cholakkal, H.; Khan, S.; Khan, F.S. ELGC-Net: Efficient Local-Global Context Aggregation for Remote Sensing Change Detection. IEEE Trans. Geosci. Remote Sens. 2024, 62, 4701611. [Google Scholar] [CrossRef]
  48. You, Z.H.; Chen, S.B.; Wang, J.X.; Luo, B. Robust feature aggregation network for lightweight and effective remote sensing image change detection. ISPRS J. Photogramm. Remote Sens. 2024, 215, 31–43. [Google Scholar] [CrossRef]
  49. Wu, F.; Dong, S.; Meng, X. CFNet: Optimizing Remote Sensing Change Detection Through Content-Aware Enhancement. IEEE J. Sel. Top. Appl. Earth Obs. Remote Sens. 2025, 18, 14688–14704. [Google Scholar] [CrossRef]
  50. Zhang, H.; Teng, Y.; Li, H.; Wang, Z. STRobustNet: Efficient Change Detection via Spatial-Temporal Robust Representations in Remote Sensing. IEEE Trans. Geosci. Remote Sens. 2025, 63, 5612215. [Google Scholar] [CrossRef]
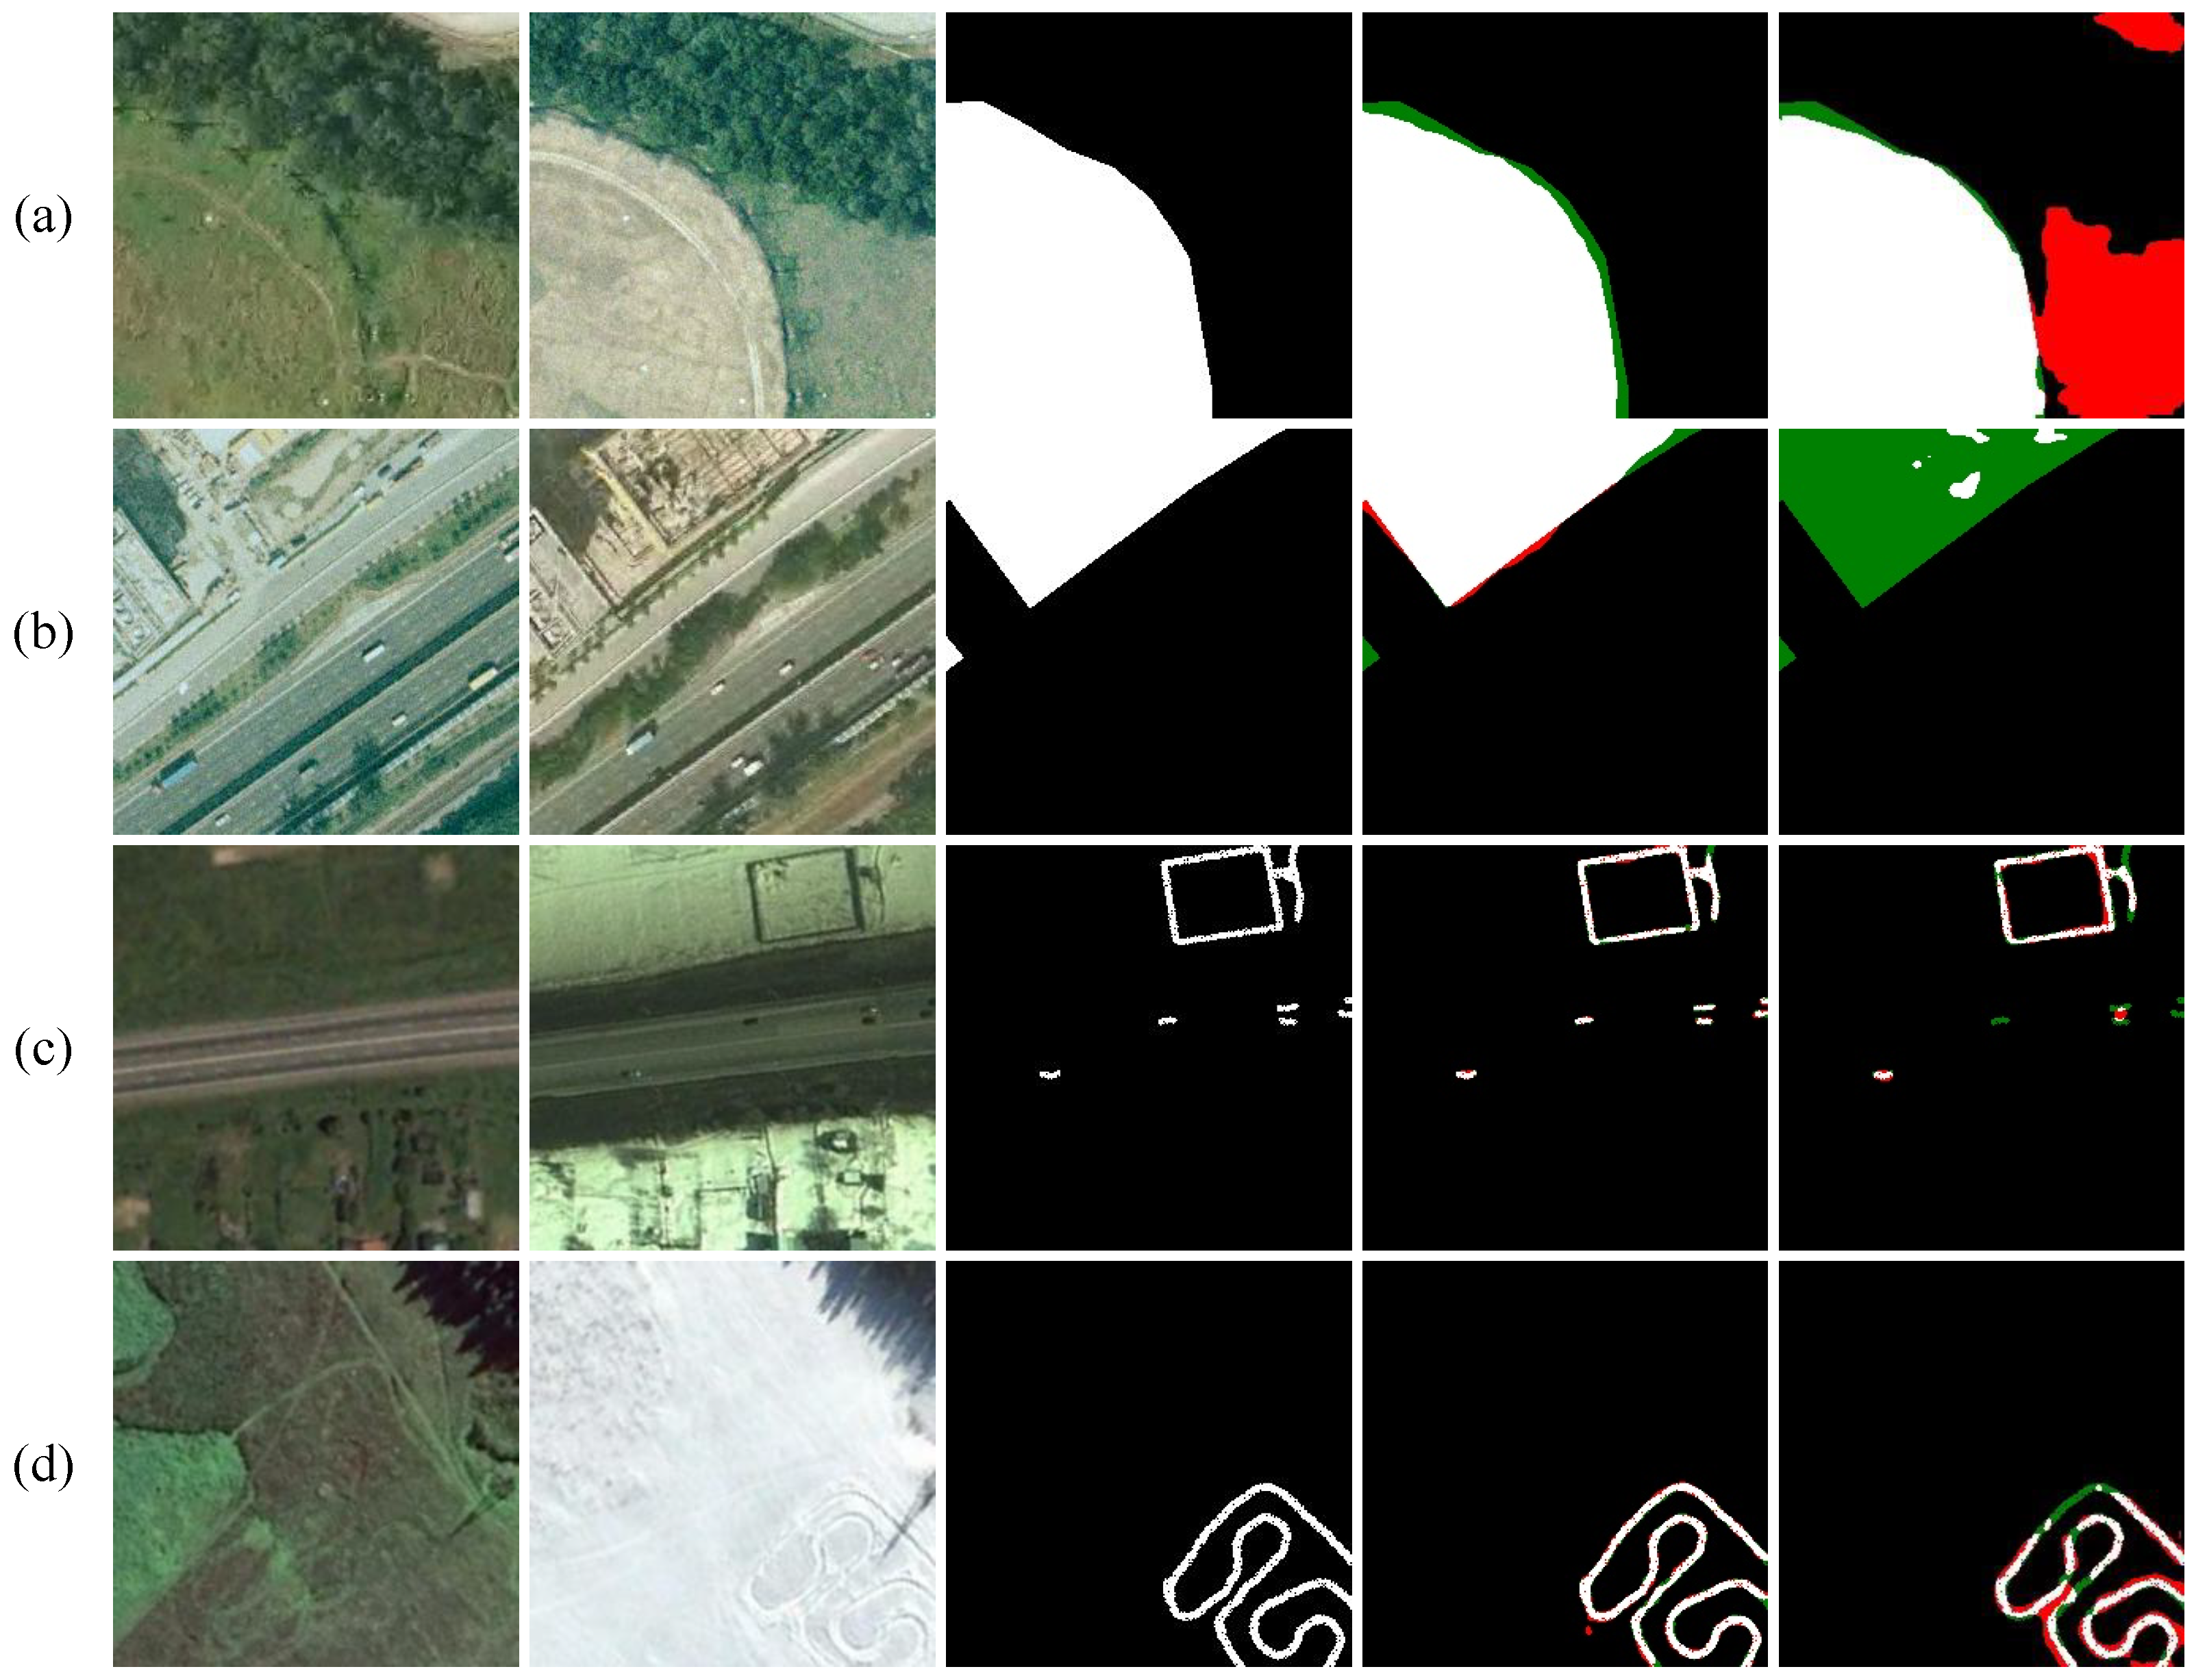
Figure 1. Several typical typical examples of “subtle semantic shifts under unchanged structural outlines” changes. (a) Farmland repurposing type. (b) Building function transformation type. (c,d) land redevelopment types. The comparison includes our model and other transformer models, with the red areas indicating false detections, the green area indicating missed areas.
Remotesensing 17 03694 g001
Figure 2. Illustration of the overall architecture of SynerCD, which adopts a Siamese encoder–decoder framework integrating vision-language coupling. The encoder mainly consists of the Tri-branch Synergistic Coupling (TSC) module, designed to disentangle local details, frequency information, and global semantics. (a) The encoder block with TSC-based feature extraction. (b) The text encoder that provides semantic prompts for cross-modal guidance during decoding.
Remotesensing 17 03694 g002
Figure 3. Visualization of heatmaps from the WEMamba branch and LoFiConv branch of the proposed SynerCD, as well as from ELGCNet with a unified channel strategy. Red regions indicate high activation, while blue regions represent low activation.
Remotesensing 17 03694 g003
Figure 4. The proposed Tri-branch Synergistic Coupling (TSC) module, which integrates local-detail extraction, frequency-domain enhancement, and global semantic modeling.
Remotesensing 17 03694 g004
Figure 5. The proposed The vision-aware language-guided attention.
Remotesensing 17 03694 g005
Figure 6. (a) The precision–recall plots and (b) F1-score comparison across four datasets.
Remotesensing 17 03694 g006
Figure 7. Visualization results of ten advanced methods and SynerCD on the LEVIR-CD dataset. Subplots (ae) represent prediction maps for four types using different methods. Red indicates false positive areas, green indicates missed areas, white represents changed areas, and black represents unchanged areas.
Remotesensing 17 03694 g007
Figure 8. Visualization results of ten advanced methods and SynerCD on the CDD-CD dataset. Subplots (ae) represent prediction maps for four types using different methods. Red indicates false-positive areas, green indicates missed areas, white represents changed areas, and black represents unchanged areas.
Remotesensing 17 03694 g008
Figure 9. Visualization results of ten advanced methods and SynerCD on the SYSU-CD dataset. Subplots (ae) represent prediction maps for four types using different methods. Red indicates false positive areas, green indicates missed areas, white represents changed areas, and black represents unchanged areas.
Remotesensing 17 03694 g009
Figure 10. Visualization results of ten advanced methods and SynerCD on the WHU-CD dataset. Subplots (ae) represent prediction maps for four types using different methods.Red indicates false positive areas, green indicates missed areas, white represents changed areas, and black represents unchanged areas.
Remotesensing 17 03694 g010
Figure 11. Network visualization taking bitemporal RS images from LEVIR-CD as an example. Red regions indicate high activation, while blue regions represent low activation.
Remotesensing 17 03694 g011
Table 1. The change intensity classification based on C R i and C I i .
CR i RangeSubtle ( 0 < CI i < 10 ) Medium ( 10 CI i < 50 ) Severe ( CI i 50 )
0 < C R i < 0.05 No significant changes (subtle)No significant changes (medium)No significant changes (severe)
0.05 C R i < 0.2 Slight changes (subtle)Slight changes (medium)Slight changes (severe)
0.2 C R i < 0.5 Moderate changes (subtle)Moderate changes (medium)Moderate changes (severe)
C R i 0.5 Large-scale changes (subtle)Large-scale changes (medium)Large-scale changes (severe)
Table 2. Introduction to four public datasets.
DatasetsSpatial ResolutionSize/ImageNumber of Samples
TrainValTest
LEVIR-CD [34]0.5 m256 × 256712010242048
CDD-CD [35]0.3 m256 × 25610,00030003000
SYSU-CD [8]0.5 m256 × 25612,00040004000
WHU-CD [36]0.2 m256 × 2565895794745
Table 3. The comparative experimental results with ten advanced methods on the LEVIR-CD and CDD-CD datasets. Red indicates optimal values of our proposed model, while blue indicates optimal values of comparison models. The results are presented in percentage (%).
ModelsTypesParams
(M)
FLOPS
(G)
Interfence
Time (s)
LEVIR-CDCDD-CD
Kappa (%)F1 (%)Pre. (%)Rec. (%)IoU (%)OA (%)Kappa (%)F1 (%)Pre. (%)Rec. (%)IoU (%)OA (%)
BIT21 [42]Transformer3.510.630.2789.4389.9691.5388.4581.7699.0092.9393.7496.8890.8088.2198.57
ChangeFormer22 [43]Transformer41.03202.791.6182.1182.9886.6579.6170.9198.3495.9696.4496.1896.7093.1299.16
SwinSuNet22 [44]Transformer28.779.050.3988.6089.1888.0490.3680.4898.8892.9893.8795.6092.2088.4598.44
ICIFNet22 [45]Transformer25.4123.840.0889.5290.0591.1289.0181.9099.0095.0095.5895.8095.3791.5498.96
DMINet23 [46]CNN6.2414.550.0290.4790.9691.4690.4683.4199.0896.7397.1297.3096.9494.4099.32
ELGCNet24 [47]Transformer10.56187.981.1489.9390.4392.0288.9082.5499.0496.9697.3297.1297.5194.7899.37
ChangeMamba24 [12]Mamba20.4712.810.0988.5789.1489.9888.3280.4298.9080.4882.6189.1776.9570.3896.18
WS-Net++24 [16]CNN33.82237.540.0390.2490.7392.0089.4983.0399.0795.4696.7995.3196.0492.3898.98
RFANet24 [48]CNN2.863.160.5489.9790.4791.9289.0782.6099.0497.3497.6898.1497.2295.4699.40
CFNet25 [49]CNN6.983.840.1091.2891.7290.4992.9884.7199.1797.2997.6397.4997.7695.3699.41
STRobustNet25 [50]CNN20.4712.810.0990.2290.7192.1589.3283.0199.0792.5293.4094.2592.5687.6198.46
SynerCDTransformer
+ Mamba
13.7130.520.1591.5892.0192.7891.2585.2099.1997.5597.8497.4198.2895.7899.49
Table 4. The comparative experimental results with ten advanced methods on the SYSU-CD and WHU-CD datasets. Red indicates optimal values of our proposed model, while blue indicates optimal values of comparison models. The results are presented in percentage (%).
ModelTypesSYSU-CDWHU-CD
Kappa (%)F1 (%)Pre. (%)Rec. (%)IoU (%)OA (%)Kappa (%)F1 (%)Pre. (%)Rec. (%)IoU (%)OA (%)
BIT21 [42]Transformer69.8676.5281.5772.0761.9889.5778.3479.3671.5889.0565.7898.02
ChangeFormer22 [43]Transformer71.4377.8881.3074.7463.7889.9975.5476.5777.6375.5462.0498.03
SwinSuNet22 [44]Transformer69.1875.6285.3267.9160.8089.6892.9493.2591.8594.6987.3599.42
ICIFNet22 [45]Transformer71.0377.7079.5375.9663.5489.7289.5189.9689.2990.6481.7599.14
DMINet23 [46]CNN74.0079.7584.9875.1266.3191.0089.1689.6387.4991.8881.2199.09
ELGCNet24 [47]Transformer71.0077.6979.4376.0363.5289.7088.2788.7593.7084.2979.7799.09
ChangeMamba24 [12]Mamba73.4579.8081.6278.0666.3990.6889.1889.6489.9589.3481.2399.12
WS-Net++24 [16]CNN76.0281.7381.0482.4269.1091.3189.1589.5994.0885.5181.1499.15
RFANet24 [48]CNN77.1282.5482.2482.8370.2791.7390.6090.9992.1689.8683.4799.24
CFNet25 [49]CNN75.0080.5676.2085.4467.4491.3392.4792.8093.7991.8286.5799.38
STRobustNet25 [50]CNN73.1279.6277.7381.5966.1490.1589.4889.9693.2686.8881.7599.09
SynerCDTransformer
+ Mamba
77.1482.3385.5879.3169.9691.9793.1793.4596.3690.7187.7199.49
Table 5. Ablation experiments on the model using the LEVIR-CD and CDD-CD datasets. Bold indicates the best result. The results are presented in percentage (%).
Num.TSC ModuleVAL-AttLEVIR-CDCDD-CD
WEMambaLoFiConvKappa (%)F1 (%)Recall (%)IoU (%)Kappa (%)F1 (%)Recall (%)IoU (%)
1 84.7985.5786.0798.5290.9692.0190.6685.21
2✓11/5000 We believe no explanation is needed here. 91.1891.6391.3784.5596.8897.2597.6894.64
3 91.0791.5290.7084.5596.8897.2597.6894.64
4 91.4291.8691.4284.9497.2497.5798.0795.25
5 91.3591.7991.0084.8297.4297.7298.1095.55
6 91.4791.9091.0785.0197.4897.7798.2095.65
7 91.3991.8390.9884.8997.5197.7898.1795.70
891.5892.0192.7885.2097.5597.8498.2895.78
Table 6. Ablation study on effect of encoder blocks on the LEVIR-CD dataset. Bold indicates the best result. The results are presented in percentage (%).
ModelsKappa (%)F1 (%)Recall (%)Precision (%)IoU (%)OA (%)
333391.2091.6592.4698.8584.5899.16
334391.3291.7692.3391.1984.7799.17
335391.3491.7892.5691.0284.8199.17
336391.4091.8492.5591.1384.9199.18
443491.2491.6892.6090.7884.6499.16
444491.4191.8492.5691.1384.9199.18
445491.4891.9192.5091.3285.0399.16
446491.5091.9392.6791.2085.0699.18
447491.5892.0192.7891.2585.2099.19
Table 7. Ablation study on the effect of different frequency transform methods on the LEVIR-CD and CDD-CD datasets. Bold indicates the best result.
MethodLEVIR-CDCDD-CD
Kappa (%)F1 (%)Pre. (%)Rec. (%)IoU (%)OA (%)Kappa (%)F1 (%)Pre. (%)Rec. (%)IoU (%)OA (%)
DCT91.4591.8992.8190.9884.9999.1897.5197.8197.4398.1895.7199.48
FFT91.4791.9192.6691.1785.0299.1897.4897.7897.3898.1895.6599.47
DWT91.5892.0192.7891.2585.2099.1997.5597.8497.4198.2895.7899.49
Table 8. Ablation study on effect of backbone on the LEVIR-CD dataset. Bold indicates the best result. The results are presented in percentage (%).
ModelKappa (%)F1 (%)Recall (%)Precision (%)IoU (%)OA (%)
ResNet1890.8191.2791.6490.9183.9599.11
ResNet5090.9891.4393.1789.7584.2199.14
PVT91.4291.8592.4191.3084.9399.18
SwinTransformer91.3291.7692.8590.6984.7799.17
ELGCA91.2691.7092.8190.6284.6799.16
SyderCD91.5892.0192.7891.2585.2099.19
Table 9. Ablation study on effect of different attention mechanisms on the LEVIR-CD dataset. Bold indicates the best result. The results are presented in percentage (%).
ModelKappa (%)F1 (%)Recall (%)Precision (%)IoU (%)OA (%)
SA90.8991.3491.7390.9784.0799.12
MHSA91.0391.4892.0290.9684.3199.14
CBAM91.4391.8692.6191.1384.9599.18
ShuffleAtt91.4991.9292.5091.3585.0599.18
SkAtt91.4091.8392.9090.7984.9099.18
SyderCD91.5892.0192.7891.2585.2099.19
Table 10. Ablation study on effect of different loss function on the LEVIR-CD dataset. Bold indicates the best result. The results are presented in percentage (%).
ModelKappa (%)F1 (%)Recall (%)Precision (%)IoU (%)OA (%)
CE Loss90.9491.4091.8690.9484.1699.13
Dice Loss91.3291.7692.4991.0484.7799.17
CE+Focal91.3791.8092.7090.9284.9799.17
CE+BCL91.4491.8792.8590.9284.9799.18
SyderCD91.5892.0192.7891.2585.2099.19
Disclaimer/Publisher’s Note: The statements, opinions and data contained in all publications are solely those of the individual author(s) and contributor(s) and not of MDPI and/or the editor(s). MDPI and/or the editor(s) disclaim responsibility for any injury to people or property resulting from any ideas, methods, instructions or products referred to in the content.