Article

Comparisons of Differential Code Bias (DCB) Estimates and Low-Earth-Orbit (LEO)-Topside Ionosphere Extraction Based on Two Different Topside Ionosphere Processing Methods

State Key Laboratory of Precision Geodesy, Innovation Academy for Precision Measurement Science and Technology, Chinese Academy of Sciences, Wuhan 430077, China
*
Author to whom correspondence should be addressed.
Remote Sens. 2025, 17(21), 3550; https://doi.org/10.3390/rs17213550
Submission received: 29 August 2025 / Revised: 23 October 2025 / Accepted: 24 October 2025 / Published: 27 October 2025
(This article belongs to the Special Issue Low Earth Orbit Enhanced GNSS: Opportunities and Challenges)

Highlights

What are the main findings?
  • Using GRACE-A data (400 km in 2016), the monthly stabilities (STDs) of GPS satellite differential code biases (DCBs) and low-earth-orbit (LEO) satellites receiver DCBs using the EP (epoch parameter)-topside vertical electron content (VEC) method are better than those using the SH (spherical harmonic)-topside VEC method. For JASON-2 data (1350 km), the STDs of GPS DCBs using the SH-topside VEC method are slightly superior to those using the EP-topside VEC method, and LEO DCBs using the two methods have similar STD results. However, the root mean square (RMS) results for GPS DCBs using the SH-topside VEC model relative to the Center for Orbit Determination in Europe (CODE) products are slightly superior to those using the EP-topside VEC method.
  • Due to the difference in orbital altitude, the results and distributions of the GRACE-topside VECs differ from those of the JASON-topside VECs, with the former being more consistent with the ground-based results, indicating that there may be different height structures in the LEO-topside VECs. Meanwhile, we applied the IRI-GIM (International Reference Ionosphere model–Global Ionosphere Map) method to compare the LEO-topside VEC results. The results indicate that the accuracy of GRACE-A-topside VECs using the EP-topside VEC method is better than that using the SH-topside VEC method, whereas for JASON-2, the two methods have similar accuracy. The temporal and spatial resolutions of the SH-topside VEC model are higher than those of the EP-topside VEC method, and the former has a wide range of usability and predictive characteristics.
What is the implication of the main finding?
  • At present, there is no research to analyze and compare the effects of the two topside VEC processing methods on DCB estimates and LEO-topside VEC extraction. It is essential to obtain more accurate global navigation satellite system (GNSS)/LEO DCBs and LEO-topside VEC parameters, particularly in future scenarios with an increase in LEO satellites, which can serve next-generation GNSS and LEO positioning.
  • For GNSS/LEO DCB estimates, different evaluation criteria yield different results. The STD results are related to the heights of LEO receivers, whereas the RMS results are not. The accuracies of the LEO-topside VEC results are related to the heights of LEO orbits. Meanwhile, the temporal and spatial resolutions of the SH-topside VEC model are higher than those of the EP-topside VECs, and the former have a wide range of usability and predictive characteristics.

Abstract

Global navigation satellite system (GNSS) differential code bias (DCB) and topside ionosphere vertical electron content (VEC) can be estimated using onboard data from low-earth-orbit (LEO) satellites. These satellites provide the potential to make up for the lack of ground-based stations in the oceanic and polar regions and establish a high-precision global ionosphere model. In order to study the influences of different LEO-topside VEC processing methods on estimates, we creatively analyzed and compared the results and accuracy of the DCBs and LEO-topside VEC estimates using two topside VEC solutions—the SH-topside VEC (spherical harmonic-topside vertical electron content) and EP-topside VEC (epoch parameter-topside vertical electron content) methods. Some conclusions are drawn as follows. (1) Using GRACE-A data (400 km in 2016), the monthly stabilities (STDs) of GPS satellite DCBs and LEO receiver DCBs using the EP-topside VEC method are better than those using the SH-topside VEC method. For JASON-2 data (1350 km), the STD results of GPS DCBs using the SH-topside VEC method are slightly superior to those using the EP-topside VEC method, and LEO DCBs using the two methods have similar STD results. However, the root mean square (RMS) results for GPS DCBs using the SH-topside VEC model relative to the Center for Orbit Determination in Europe (CODE) products are slightly superior to those using the EP-topside VEC method. (2) The peak ranges of the actual GRACE-A-topside VEC results using the SH-topside VEC and EP-topside VEC methods are within 42 and 35 TECU, respectively, while the peak ranges of the JASON-2-topside VEC results are both within 6 TECU. Additionally, only the SH-topside VEC model results are displayed due to the EP-topside VEC method not modeling VEC. Due to the difference in orbital altitude, the results and distributions of the GRACE-topside VECs differ from those of the JASON-topside VECs, with the former being more consistent with the ground-based results, indicating that there may be different height structures in the LEO-topside VECs. In addition, we applied the IRI-GIM (International Reference Ionosphere model–Global Ionosphere Map) method to compare the LEO-based topside VEC results, which indicate that the accuracy of GRACE-A-topside VEC using the EP-topside VEC method is better than that using the SH-topside VEC method, whereas for JASON-2, the two methods have similar accuracy. Meanwhile, we note that the temporal and spatial resolutions of the SH-topside VEC method are higher than those of the EP-topside VEC method, and the former has a wide range of usability and predictive characteristics. The latter seems to correspond to the single-epoch VEC mean of the former to some extent.

1. Introduction

Differential code bias (DCB) is a significant error source that must be corrected for global navigation satellite system (GNSS) positioning and ionospheric modeling [1,2,3,4,5]. DCB refers to the difference in time delay caused by the signal traveling through the hardware of the satellite or receiver. The fewer ground observation stations in the ocean and the poles limit the improvement of space atmospheric monitoring to some extent. The use of low-earth-orbit (LEO) satellites onboard GNSS observation data to determine DCB and topside ionospheric vertical electron content (VEC) can compensate for the lack of observation stations in the oceanic and polar regions, as well as establish a high-precision global ionosphere and broadcast ionosphere models, which can serve next-generation GNSS and LEO positioning. Meanwhile, LEO observation data could be a contributor to the multisource data to integrate, promoting an increase in vertical total electron content (VTEC) precision [6,7]. The Center for Orbit Determination in Europe (CODE) and other GNSS data processing facilities simultaneously estimate DCBs along with either global or local ionospheric models owing to high correlation [8,9,10,11,12,13]. Some factors could affect the precision of DCB and VTEC estimates, including the number of ground stations, station distribution, receiver type, data quality, and the ionosphere total electron content (TEC) modeling method. For example, CODE bases its estimates on over 200 ground stations [1,8]. LEO satellites can be considered mobile space-based stations to estimate GNSS satellite DCBs with uniform onboard receiver types. The onboard GNSS data from a small number of LEO satellites can be used to achieve similar results to those derived from a large number of ground-based observations. Additionally, the completed BeiDou satellite navigation system is intended to use fewer observation stations outside China to achieve the product service of positioning, such as the calculation of time group delay (TGD) parameters. The LEO satellites used to determine DCB and LEO-based topside VEC could play a significant role in improving future positioning, navigation, and timing (PNT) service systems [14,15,16].
In recent years, some studies have focused on LEO-based DCB and topside ionosphere VEC estimation. References [17,18] took the GPS satellite and LEO receiver DCBs as unknown parameters. Wautelet [19] used a least square adjustment to simultaneously estimate GPS satellite and JASON-2 receiver DCB, using VEC parameters as the epoch parameter. Some scholars [20,21] have estimated GPS satellite DCB and corresponding VEC using LEO onboard observations from the Fengyun-3C/-3D satellites. Some studies have estimated receiver DCB and LEO-based topside VEC by introducing the GPS satellite DCB [22,23,24]. Currently, some scholars use VEC as the epoch parameter in simultaneous estimation of LEO-based DCB and VEC parameters [19,20,21], and other studies adopt the spherical harmonic function to model LEO-based topside VEC [25,26,27]. For the TEC mapping function, reference [28] pointed out that the geometric mapping function proposed by Foelsche and Kirchengast [29] (referred to as the F&K function) was suitable for LEO-based TEC conversion when using LEO data. Hence, in this study, we used the F&K mapping function to convert the TEC results. Currently, there are two VEC processing methods: (1) expressing topside VEC as the epoch parameter (EP-topside VEC method) and (2) expressing topside VEC as the spherical harmonic function (SH-topside VEC method). At present, there is no research to analyze and compare the influences of the two topside VEC models on DCB and LEO-based topside VEC estimates. It is essential to obtain more accurate DCB and LEO-based topside VEC estimates, particularly in future scenarios with an increase in LEO satellites.
In this study, in order to study the influences of two LEO-topside VEC processing methods on estimates, we analyzed and compared the results and accuracies of GPS/LEO DCB estimates and LEO-topside VEC results using two VEC processing methods—the SH-topside VEC and EP-topside VEC methods. First, we present the two VEC methods for estimating DCBs and LEO-topside VEC parameters simultaneously. Second, we compare the accuracies of the GPS and LEO DCB estimates obtained using the two VEC methods. Third, we display the LEO-based topside VEC results and applied the International Reference Ionosphere (IRI) model and Global Ionosphere Map (GIM) method (IRI-GIM) to evaluate them. Finally, we draw our conclusions on the effects of two LEO-topside VEC modeling methods on estimating DCBs and LEO-topside VEC extraction.

2. Methods and Strategies

This section depicts the two LEO-based topside VEC modeling methods and the validation methods of parameter estimates.
Because more cycle slips occur in LEO onboard GNSS phase data than in ground phase observations, the carrier-to-code leveling method may introduce larger errors. Hence, we utilized LEO code observation data processed by iteration screening of LEO carrier phase observations and precise orbits, which were derived from the preprocessing strategy of LEO precise orbit determination, and we can obtain clearer code observations [27,30,31].
The geometry-free (GF) combination estimation method comprises a simpler calculation that does not require additional information. Therefore, we used GF combinations of pseudo-range observations to estimate DCB and LEO-based topside VEC parameters. Dual-frequency onboard GPS code observations are commonly expressed as shown in Equation (1). The GF combinations observations used to estimate DCB and LEO-based topside VEC parameters are expressed as shown in Equation (2) [12,32] as follows:
P r , 1 s = ρ r s + c · ( d t r d t s ) + α 1 · S T E C + c · ( b s , 1 + b r , 1 ) + ε r , 1 s   ,   α 1 = 40.28 f 1 2 P r , 2 s = ρ r s + c · ( d t r d t s ) + α 2 · S T E C + c · ( b s , 2 + b r , 2 ) + ε r , 2 s   ,   α 2 = 40.28 f 2 2
P r , G F s = P r , 1 s P r , 2 s = α · S T E C + D C B s + D C B r + ε r , G F s ,   α = 40.28 · 1 f 1 2 1 f 2 2
where the superscript s and superscript r represent the navigation satellite and LEO onboard receiver, respectively, and 1 and 2 represent the frequency number; symbols f 1 and f 2 represent the GPS L1 and L2 frequencies; ρ r s denotes the geometric distance of observations in meters; c is the light speed in vacuum;   d t r ,   t s represent the receiver and navigation satellite clock offsets, respectively; STEC is the slant total electron content of the topside ionosphere or plasmasphere in units of TECU; bs,i,br,i (i = 1,2) are the instrument delays in units of ns from navigation satellite s and onboard receiver r at two frequencies, respectively; αi (i = 1,2) and α are the coefficients of the STEC in units of m/TECU that relate to GPS L1 and L2 frequencies; P r , 1 s and P r , 2 s are the code observations in meters at GPS L1 and L2 frequencies from the navigation satellite s to the LEO satellite r; P r , G F s is the GF combination of pseudo-range observations in meters; DCBs and DCBr denote DCB values of the navigation satellite s and receiver r in units of meters, respectively; and ε r , i s   , ε r , G F s represent noises from code observations and corresponding GF combination observations, respectively.
The slant electron content (SEC) is the product of the VEC and the mapping function. The expected height of maximum electron density is called the ionospheric effective height (IEH) [28]. The F&K mapping function is a thick-layer model with an IEH layer thickness above the receiver, and that was originally developed for slant-path atmospheric water vapor conversion and was later applied to the LEO-based TEC conversion [33]. The LEO-based topside VEC can be expressed as epoch parameters (EP-topside VEC) or the spherical harmonic function (SH-topside VEC) of geomagnetic latitude and sun-fixed longitude. The GPS antenna of the JASON satellite is tilted by 15° with respect to the X/Z plane [19,34] with a minimum elevation angle of 0 °C reduced the multipath error and measurement noise to some extent. Thus, to take full advantage of the maximum number of observations to improve the accuracy of DCB and LEO-based topside VEC estimation, an elevation angle of 15 degrees was adopted.
The relationship between SEC and VEC based on the EP-topside VEC and SH-topside VEC methods [1,28,29,35] can be expressed as shown in Equations (3) and (4) as follows:
S E C = m f F & K · V E C m f F & K = 1 + ( R E + h I E H ) / R L E O cos z + ( R E + h I E H ) 2 / R L E O 2 ( sin z ) 2 h I E H = ( 0.0027 F 107 + 1.79 ) h L E O 5.52 F 107 + 1350 V E C   =   a s   e p o c h   p a r a m e t e r
S E C = m f F & K · V E C m f F & K = 1 + ( R E + h I E H ) / R L E O cos z + ( R E + h I E H ) 2 / R L E O 2 ( sin z ) 2 h I E H = ( 0.0027 F 107 + 1.79 ) h L E O 5.52 F 107 + 1350 m o d e l e d   V E C = n = 0 n max m = 0 n P ˜ n m ( sin φ ) · ( A ˜ n m cos ( m λ ) + B ˜ n m sin ( m λ ) )
where SEC and VEC represent the slant and vertical total electron contents of the topside ionosphere or plasmasphere in units of TECU, respectively; m f F & K represents the F&K mapping functions; z represents the zenith angle of the slant ray path; R E represents the earth radius in kilometers; h I E H represents the IEH in kilometers; h L E O denotes the orbit height of the LEO satellite above the Earth’s surface in kilometers; and F 107 represents the solar radio flux at 10.7 cm. In Equation (3), LEO-based topside VEC values are estimated as epoch parameters, while in the expression of modeled VEC in (4), P ˜ n m is the normalized associated Legendre functions of degree n and order m; A ˜ n m , B ˜ n m are the estimated TEC coefficients of the spherical harmonic function; symbols φ and λ are the geomagnetic latitude and the sun-fixed longitude, respectively; and n max is the maximum degree of the spherical harmonic expansion. Assuming that the modeling spacing is m and degree and order is d for the SH-topside VEC method, respectively, the number of SH-topside VEC modeling parameters is (d + 1) × (d + 1) × (24/m + 1), the number of DCB parameters is 32 + 1 = 33, and the number of total unknown parameters of the SH-topside VEC method on one day is (d + 1) × (d + 1) × (24/m + 1) + 33. Meanwhile, for the EP-topside VEC method, assuming that the number of observation epochs is n, the number of VEC values equals the number of observation epochs according to the assumption of spherical symmetry [24,33], and the number of total unknown parameters of the EP-topside VEC method on one day is n + 33. It is worth noting that the number of estimated parameters on one day for the EP-topside VEC method (about 3000) is much larger than for the SH-topside VEC method (about 600 in this paper).
Because of the close correlation between the GPS satellite and receiver DCB, resulting in a normal matrix rank deficiency, the DCB datum was defined by a zero-mean condition imposed on satellite bias estimation for decorrelation. The zero-mean condition [36] can be written as shown in Equation (5) as follows:
s = 1 S max D C B s = 0
where S max refers to the total number of observed GNSS satellites.
In this study, we used two different topside VEC processing methods—EP-topside VEC and SH-topside VEC methods—to estimate LEO-based topside VEC and daily DCB parameters of GPS satellites and LEO receivers. Using the SH-topside VEC method, the LEO-based topside VEC values were modeled using a spherical harmonic expansion of up to the degree and order of 8 in the solar geomagnetic reference frame [37]. The temporal modeling mode was set to a dynamic status, and the cadence used to estimate TEC coefficients was set to 4 h. The corresponding strategies for the DCB and LEO-based topside VEC estimation using LEO data are presented in Table 1.
After DCB estimation, the daily DCB estimates were realigned by applying a shift from non-all satellite DCB values, which can be calculated using a common set of satellites over the period of study [27]. Specifically, this shift can be considered as a mean bias computed using all common satellite DCBs, which is added to all satellite DCBs and subtracted from the receiver DCBs [19]. After the alignment [38], we evaluated the accuracy of the DCB estimates produced by the two methods, using their stability to represent internal agreement in the form of standard deviation (STD) and comparisons with CODE products to represent external agreement in the form of mean differences and RMS.
Currently, there are no external reference products for LEO-topside VEC. Thus, we designed and applied the IRI and GIM method (IRI-GIM) to evaluate the LEO-topside VEC results using the two VEC methods, which is the validation of the difference between the summed TEC of the LEO-based topside VEC and the IRI 2016 model results and the CODE GIM results. We adopted the IRI model to calculate the TEC results from ground to LEO satellites and used the CODE GIM to obtain the TEC results from ground to GNSS satellites, respectively. In the IRI 2016 model, the IRI_Shubin model was added and built using the observation data from three occultation missions (CHAMP/GRACE/COSMIC) and global observation from 62 ionosondes from 1987 to 2012 [39]. We selected the IRI_Shubin model for ionosphere F2 peak height calculation and the URSI model for F2 peak density calculation in our study. Meanwhile, the estimated LEO-topside VEC values are the results from LEO to GNSS satellites. The general calculation method of the IRI-GIM is as follows. Firstly, we added the estimated LEO-topside VECs and the results from the IRI 2016 model. Then, we compared the above summed VTEC with the CODE GIM and analyzed the reliability of the estimated LEO-topside VECs. We also described the calculation method in reference [27].

3. Results

In this section, we discuss the parameter estimation results of the two LEO-topside VEC methods using data from two LEO satellites at different altitudes (GRACE-A and JASON-2 satellite) with different heights for the period day of year (DOY) 214~244 (August) in 2016. The GRACE-A satellite is located at altitudes of approximately 400 km, and the orbits of JASON-2 above the ionosphere are at altitudes of 1350 km. We conduct the estimation of the GPS satellite DCBs, LEO receiver DCBs, and LEO-based topside VEC parameters using two different VEC processing methods (EP-topside VEC and SH-topside VEC methods), and present the evaluation results of corresponding estimates. The F&K function is used as the LEO-based TEC mapping function in this study. According to Equations (3) and (4), the priori IEH heights based on the F&K mapping function for GRACE and JASON satellites are set at 1500 and 3500 km, respectively. Hence, an elevation angle of 15° is adopted for the LEO data with a sample interval of 30 s. For DCB estimates, internal and external agreements usually apply the monthly stability (STD) and RMS of the difference between DCB estimates and CODE products. For LEO-based topside VEC, the IRI and CODE GIM (IRI-GIM) method is applied to validate and compare the results of two LEO-topside VEC processing methods.

3.1. Comparison and Precision Evaluation of GPS DCB Estimates

The daily GPS satellite DCB estimates based on the EP-topside VEC and SH-topside VEC methods are shown in Figure 1, where the GPS DCB estimates range between −10 and 10 ns. They are relatively stable and have small differences. DCB values for G04, G20, and G22 using GRACE-A data were not estimated due to a lack of observations. In Figure 1a, the time series of the GPS DCB estimates with GRACE-A data using the EP-topside VEC method are slightly smoother than those using the SH-topside VEC method. In Figure 1b, there is no significant difference between the time series of GPS DCBs with JASON-2 data using the two VEC methods.
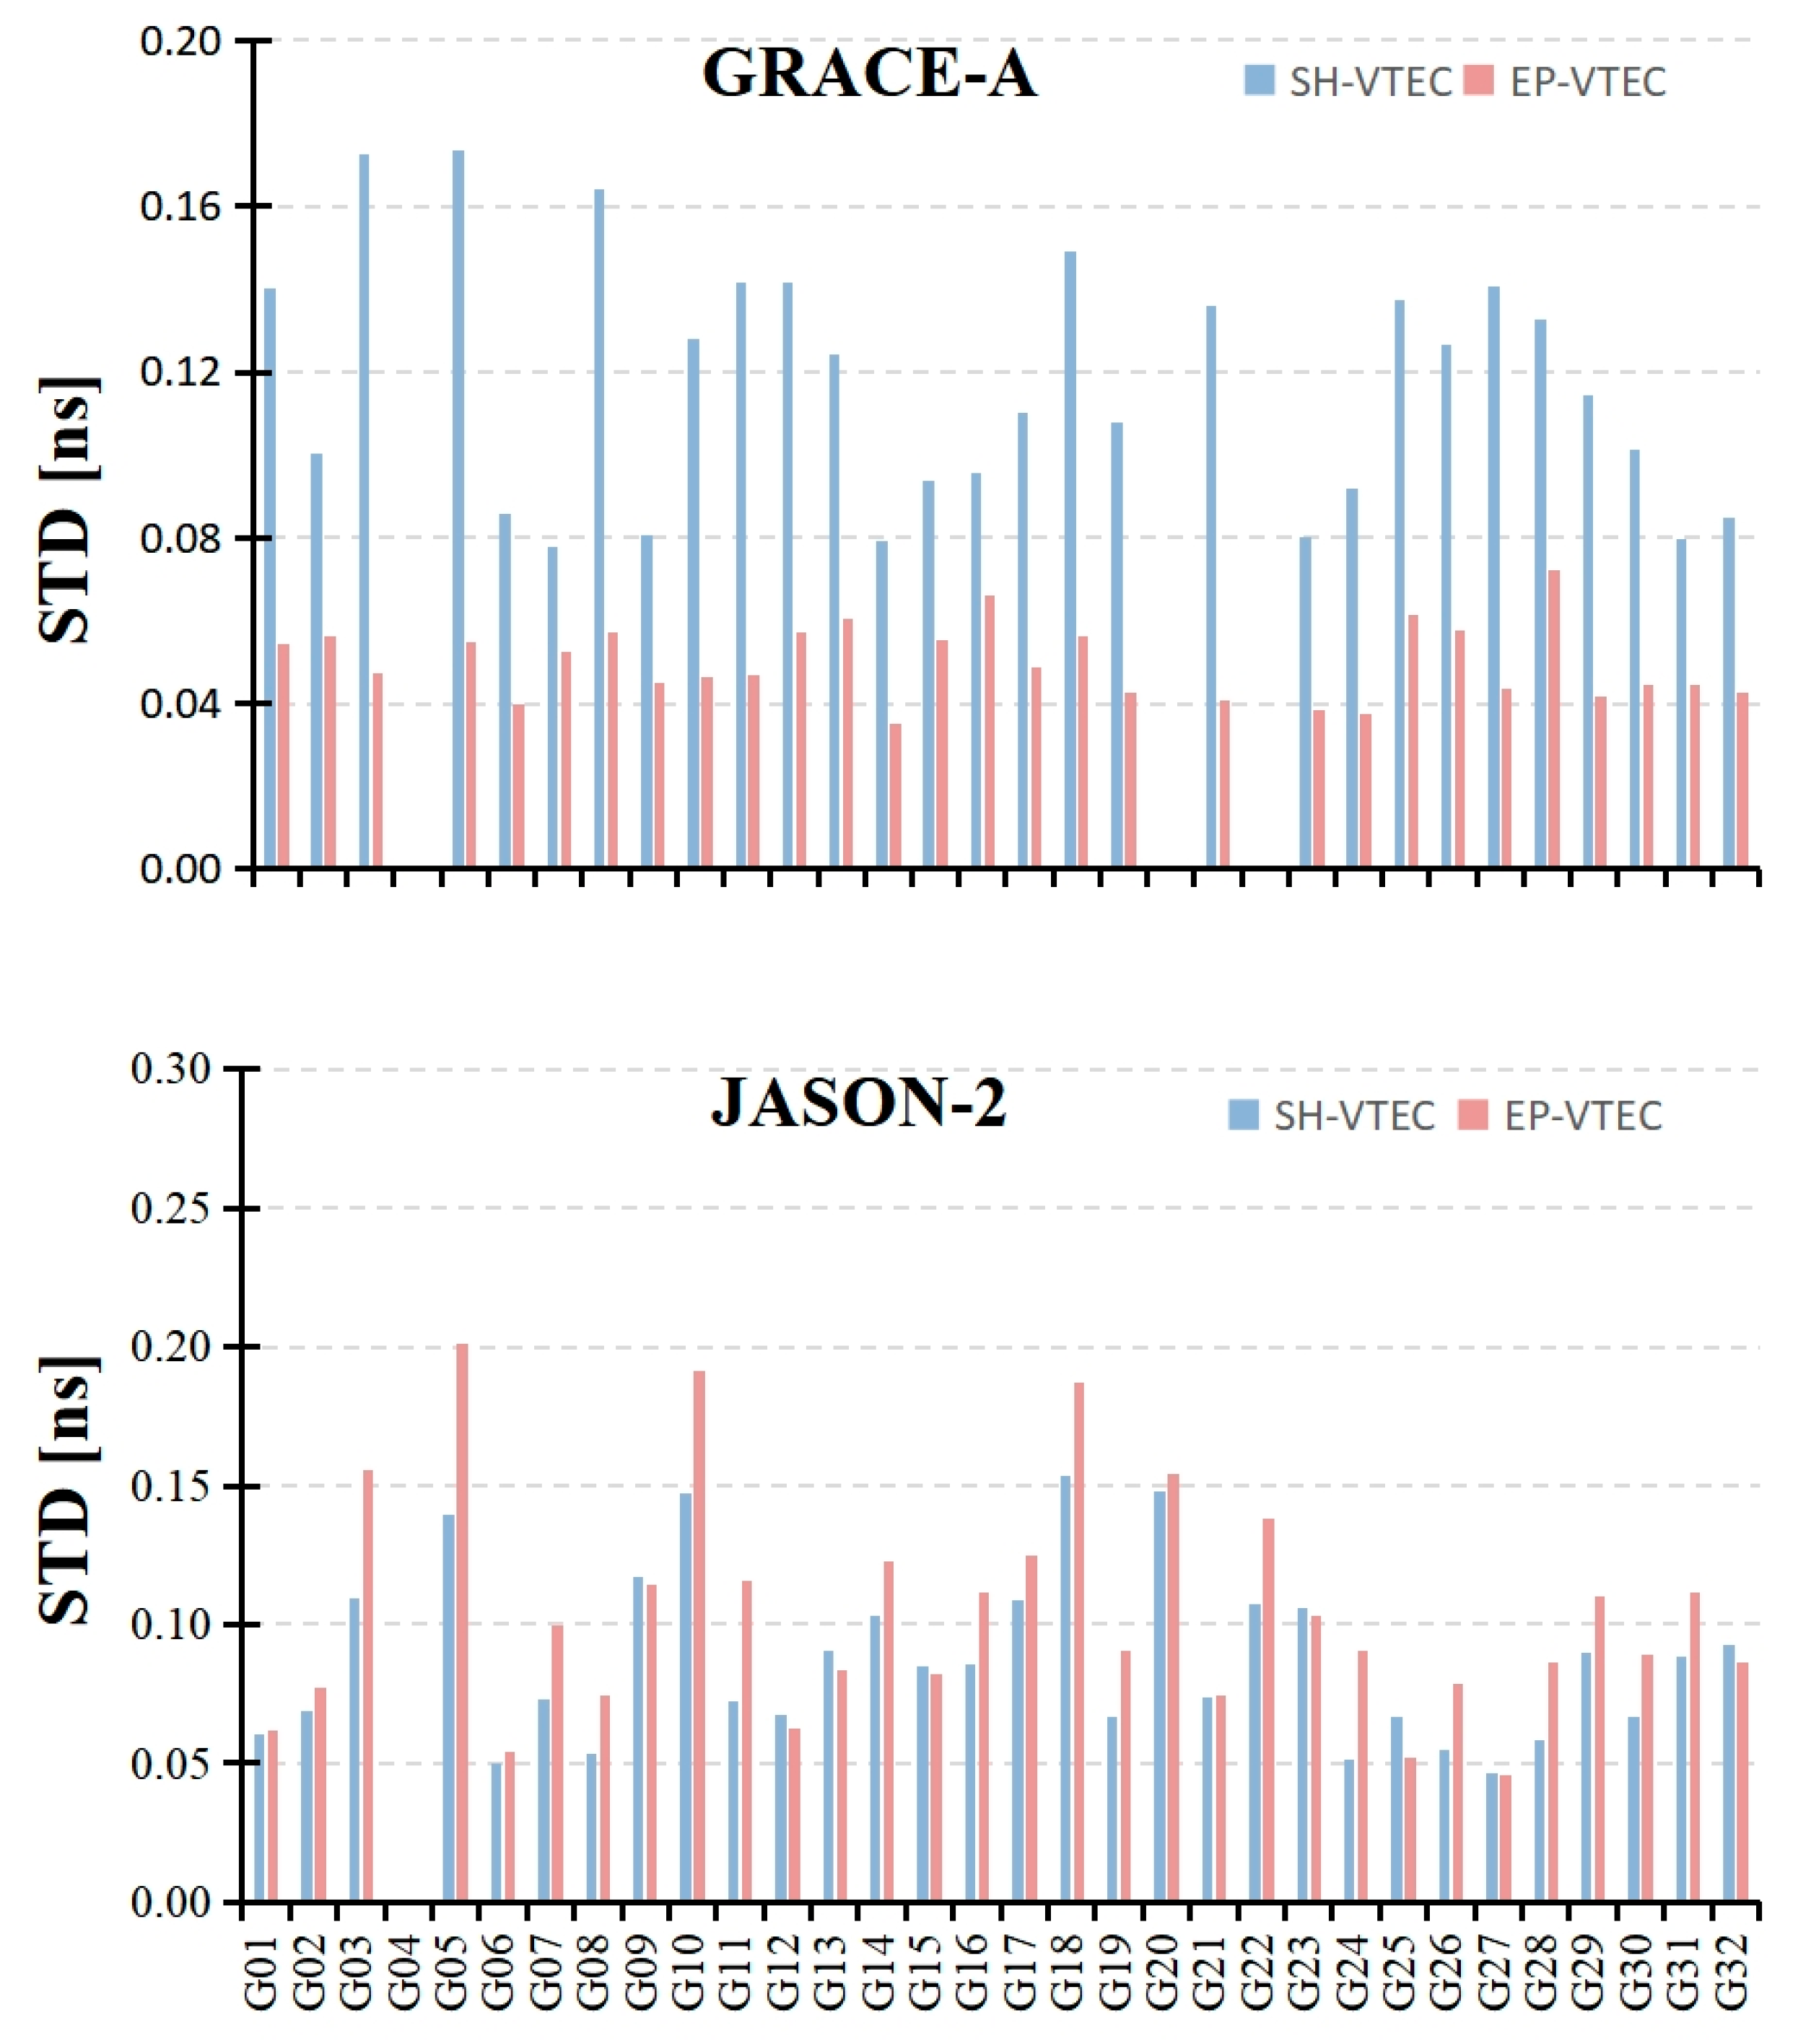
Figure 2 shows the monthly stability (STD) comparison of GPS DCBs using the SH-topside VEC and EP-topside VEC methods and different LEO data during August 2016, and the corresponding monthly STD mean results of GPS DCBs using the two solutions are displayed in Table 2. In Figure 2, the monthly STDs of GPS DCBs with GRACE-A data using the SH-topside VEC method are worse than those using the EP-topside VEC method. However, for the JASON-2 data, the monthly stabilities of GPS DCBs with the SH-topside VEC solution are superior to those using the EP-topside VEC solution. According to Table 2, the monthly STD mean values of GPS DCBs using the SH-topside VEC method for GRACE-A and JASON-2 satellites are 0.117 and 0.114 ns, respectively; the average monthly STD results using the EP-topside VEC method for two LEOs are 0.050 and 0.131 ns, respectively. We also note that the monthly STDs of GPS DCBs using the SH-topside VEC method do not change much with the LEO data at different heights, whereas the monthly stability performance of GPS DCBs using the EP-topside VEC method is related to the LEO receiver heights. This requires further investigation in future studies.
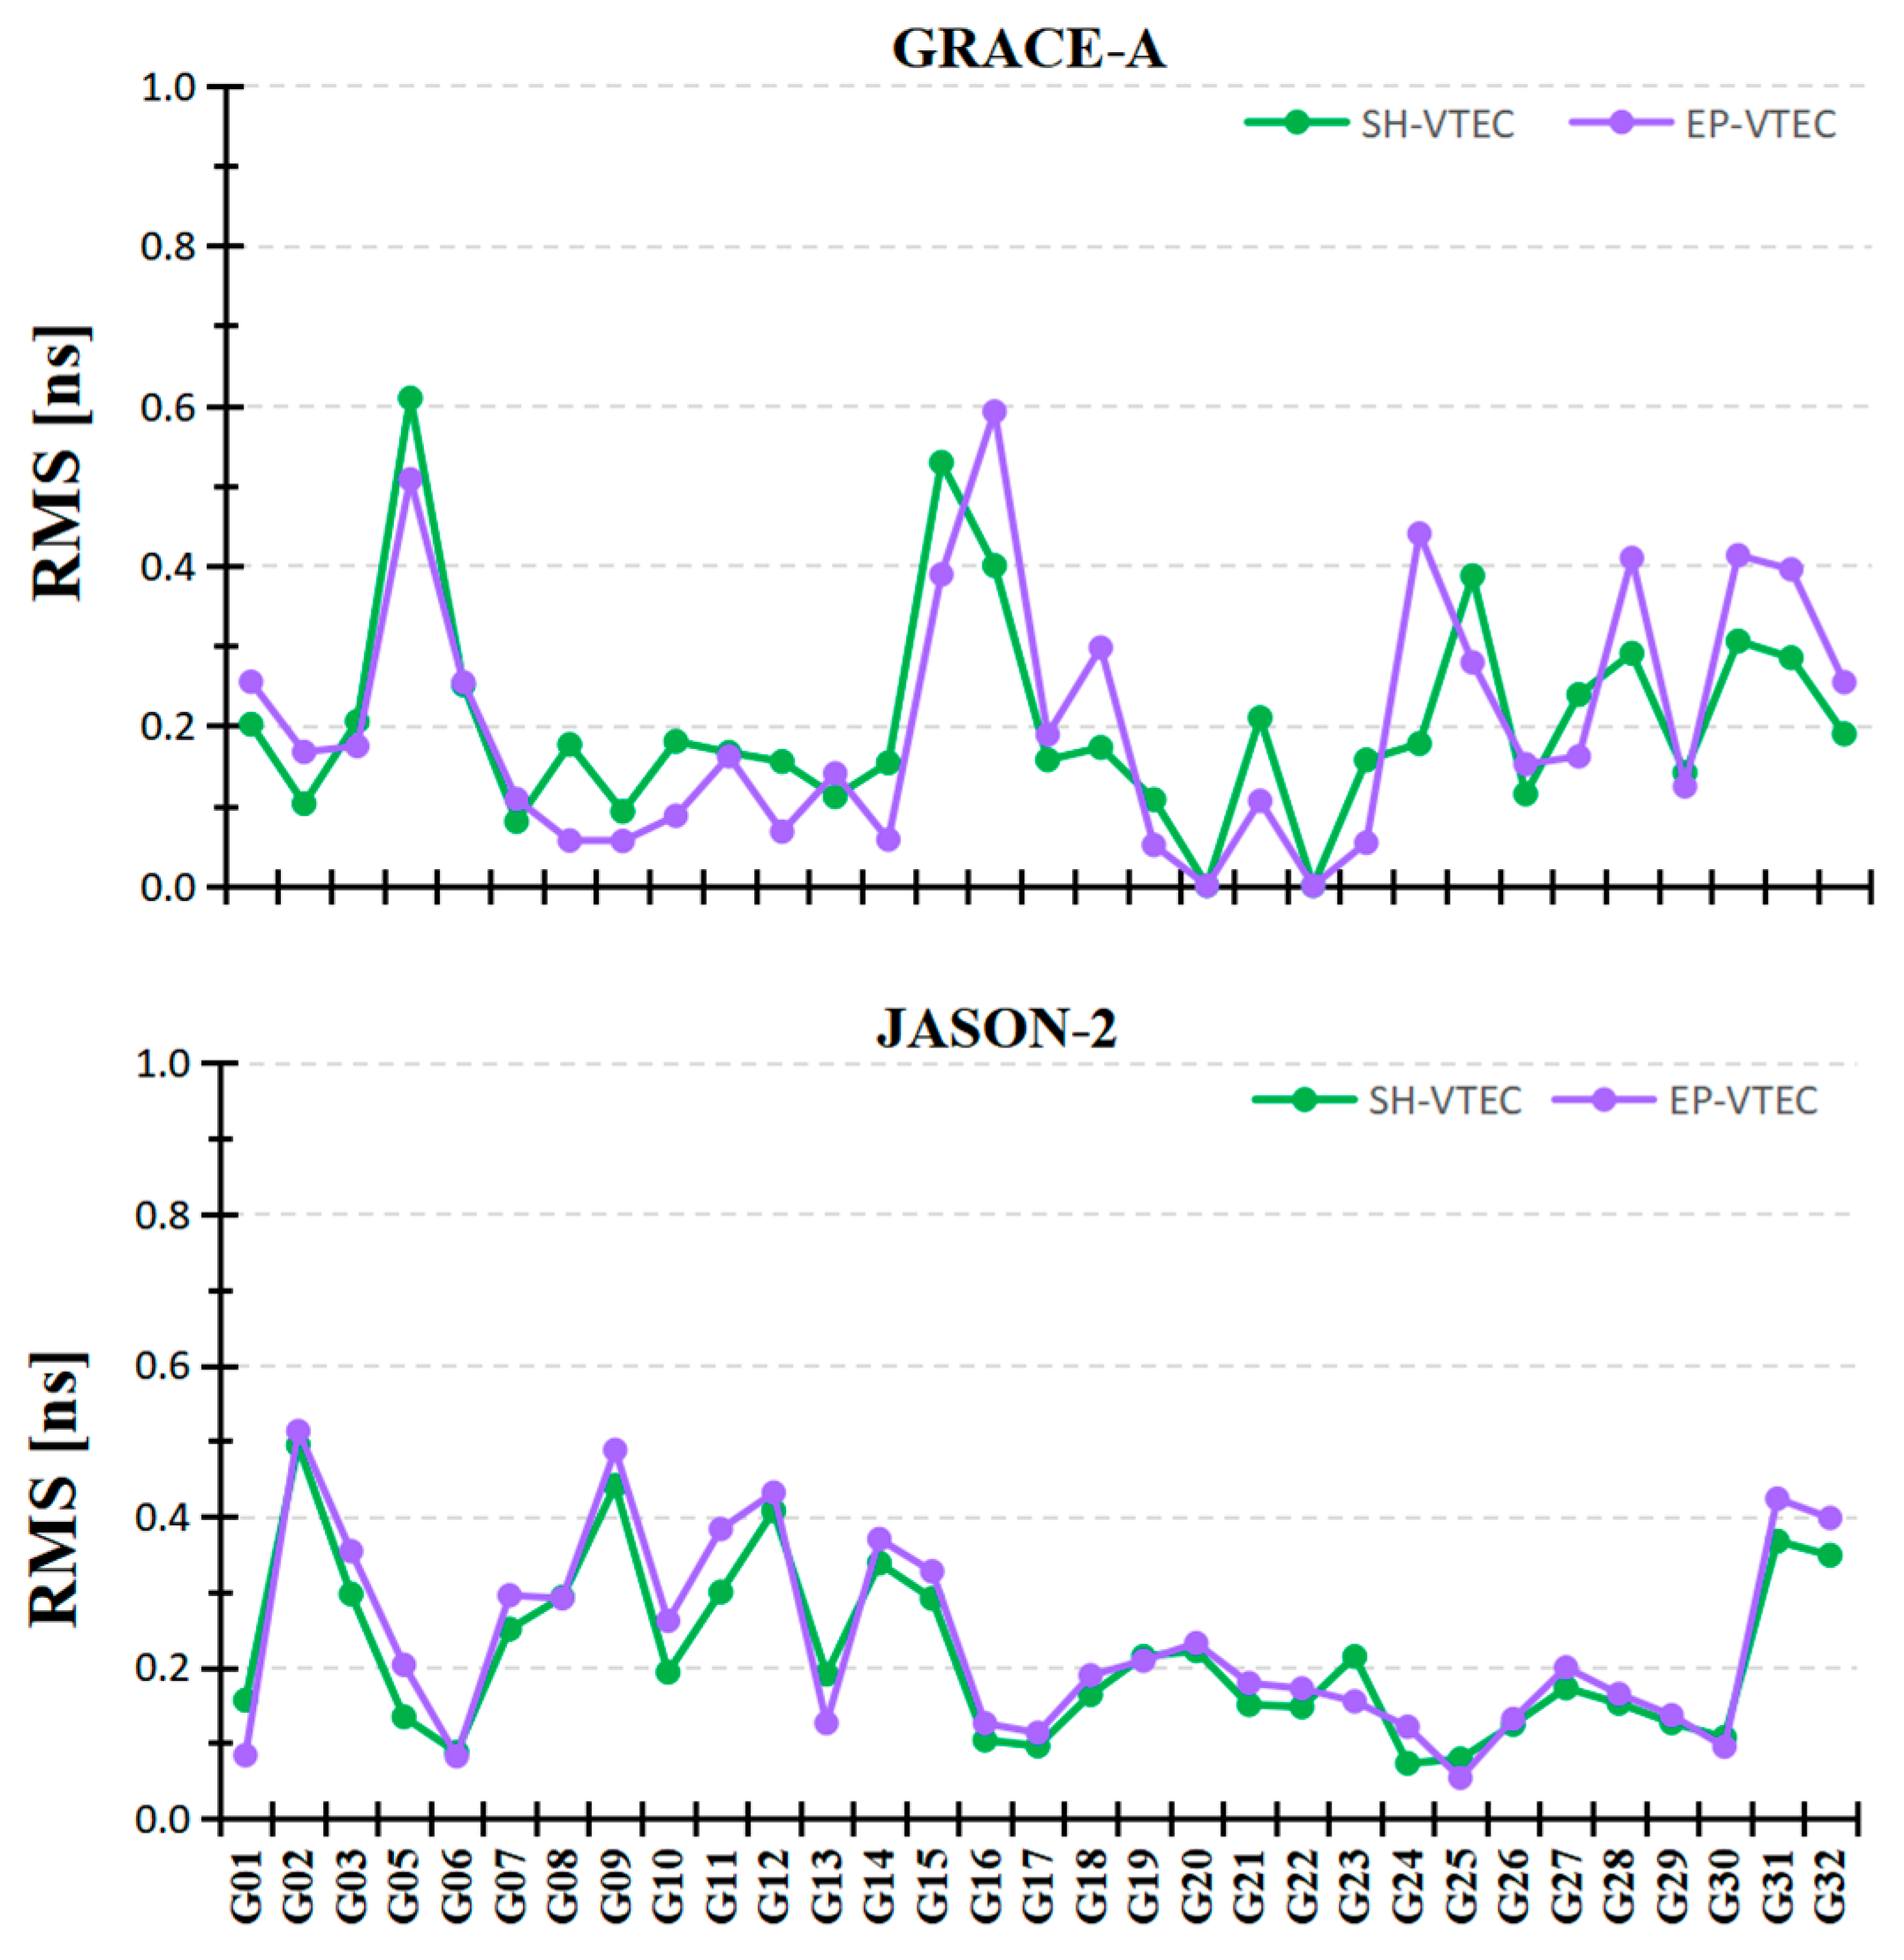
Daily CODE DCB products were used as reference products for external evaluation [1,8]. The mean and STDs of the differences between GPS DCB values estimated using the two modeling methods and CODE products for two LEO satellites are depicted in Figure 3. Figure 4 and Table 3 show the corresponding RMS and RMS mean values of GPS DCBs using the two methods. In Figure 3, the mean differences between GPS DCB estimates and CODE products range between −0.6 and 0.6 ns. The variation range in the mean differences between GPS DCB estimates and CODE products using JASON-2 data is less than that using GRACE-A data. The STDs of differences compared with CODE products using the SH-topside VEC and EP-topside VEC methods are within 0.16 and 0.20 ns, respectively, and mean STDs are all within 0.11 ns. The RMS values of the difference between the GPS DCB estimates and CODE products are mostly below 0.6 ns. According to statistics in Table 3, the RMS means of the difference between GPS DCB estimated using the SH-topside VEC method and CODE products for GRACE-A and JASON-2 data are 0.219 and 0.241 ns, respectively, while those obtained using the EP-topside VEC method for two LEOs are 0.221 and 0.256 ns, respectively. These results illustrate that the RMS values of GPS DCB estimates using the SH-topside VEC method are slightly better than those obtained using the EP-topside VEC method.

3.2. Comparison Between LEO Receiver DCB Estimates

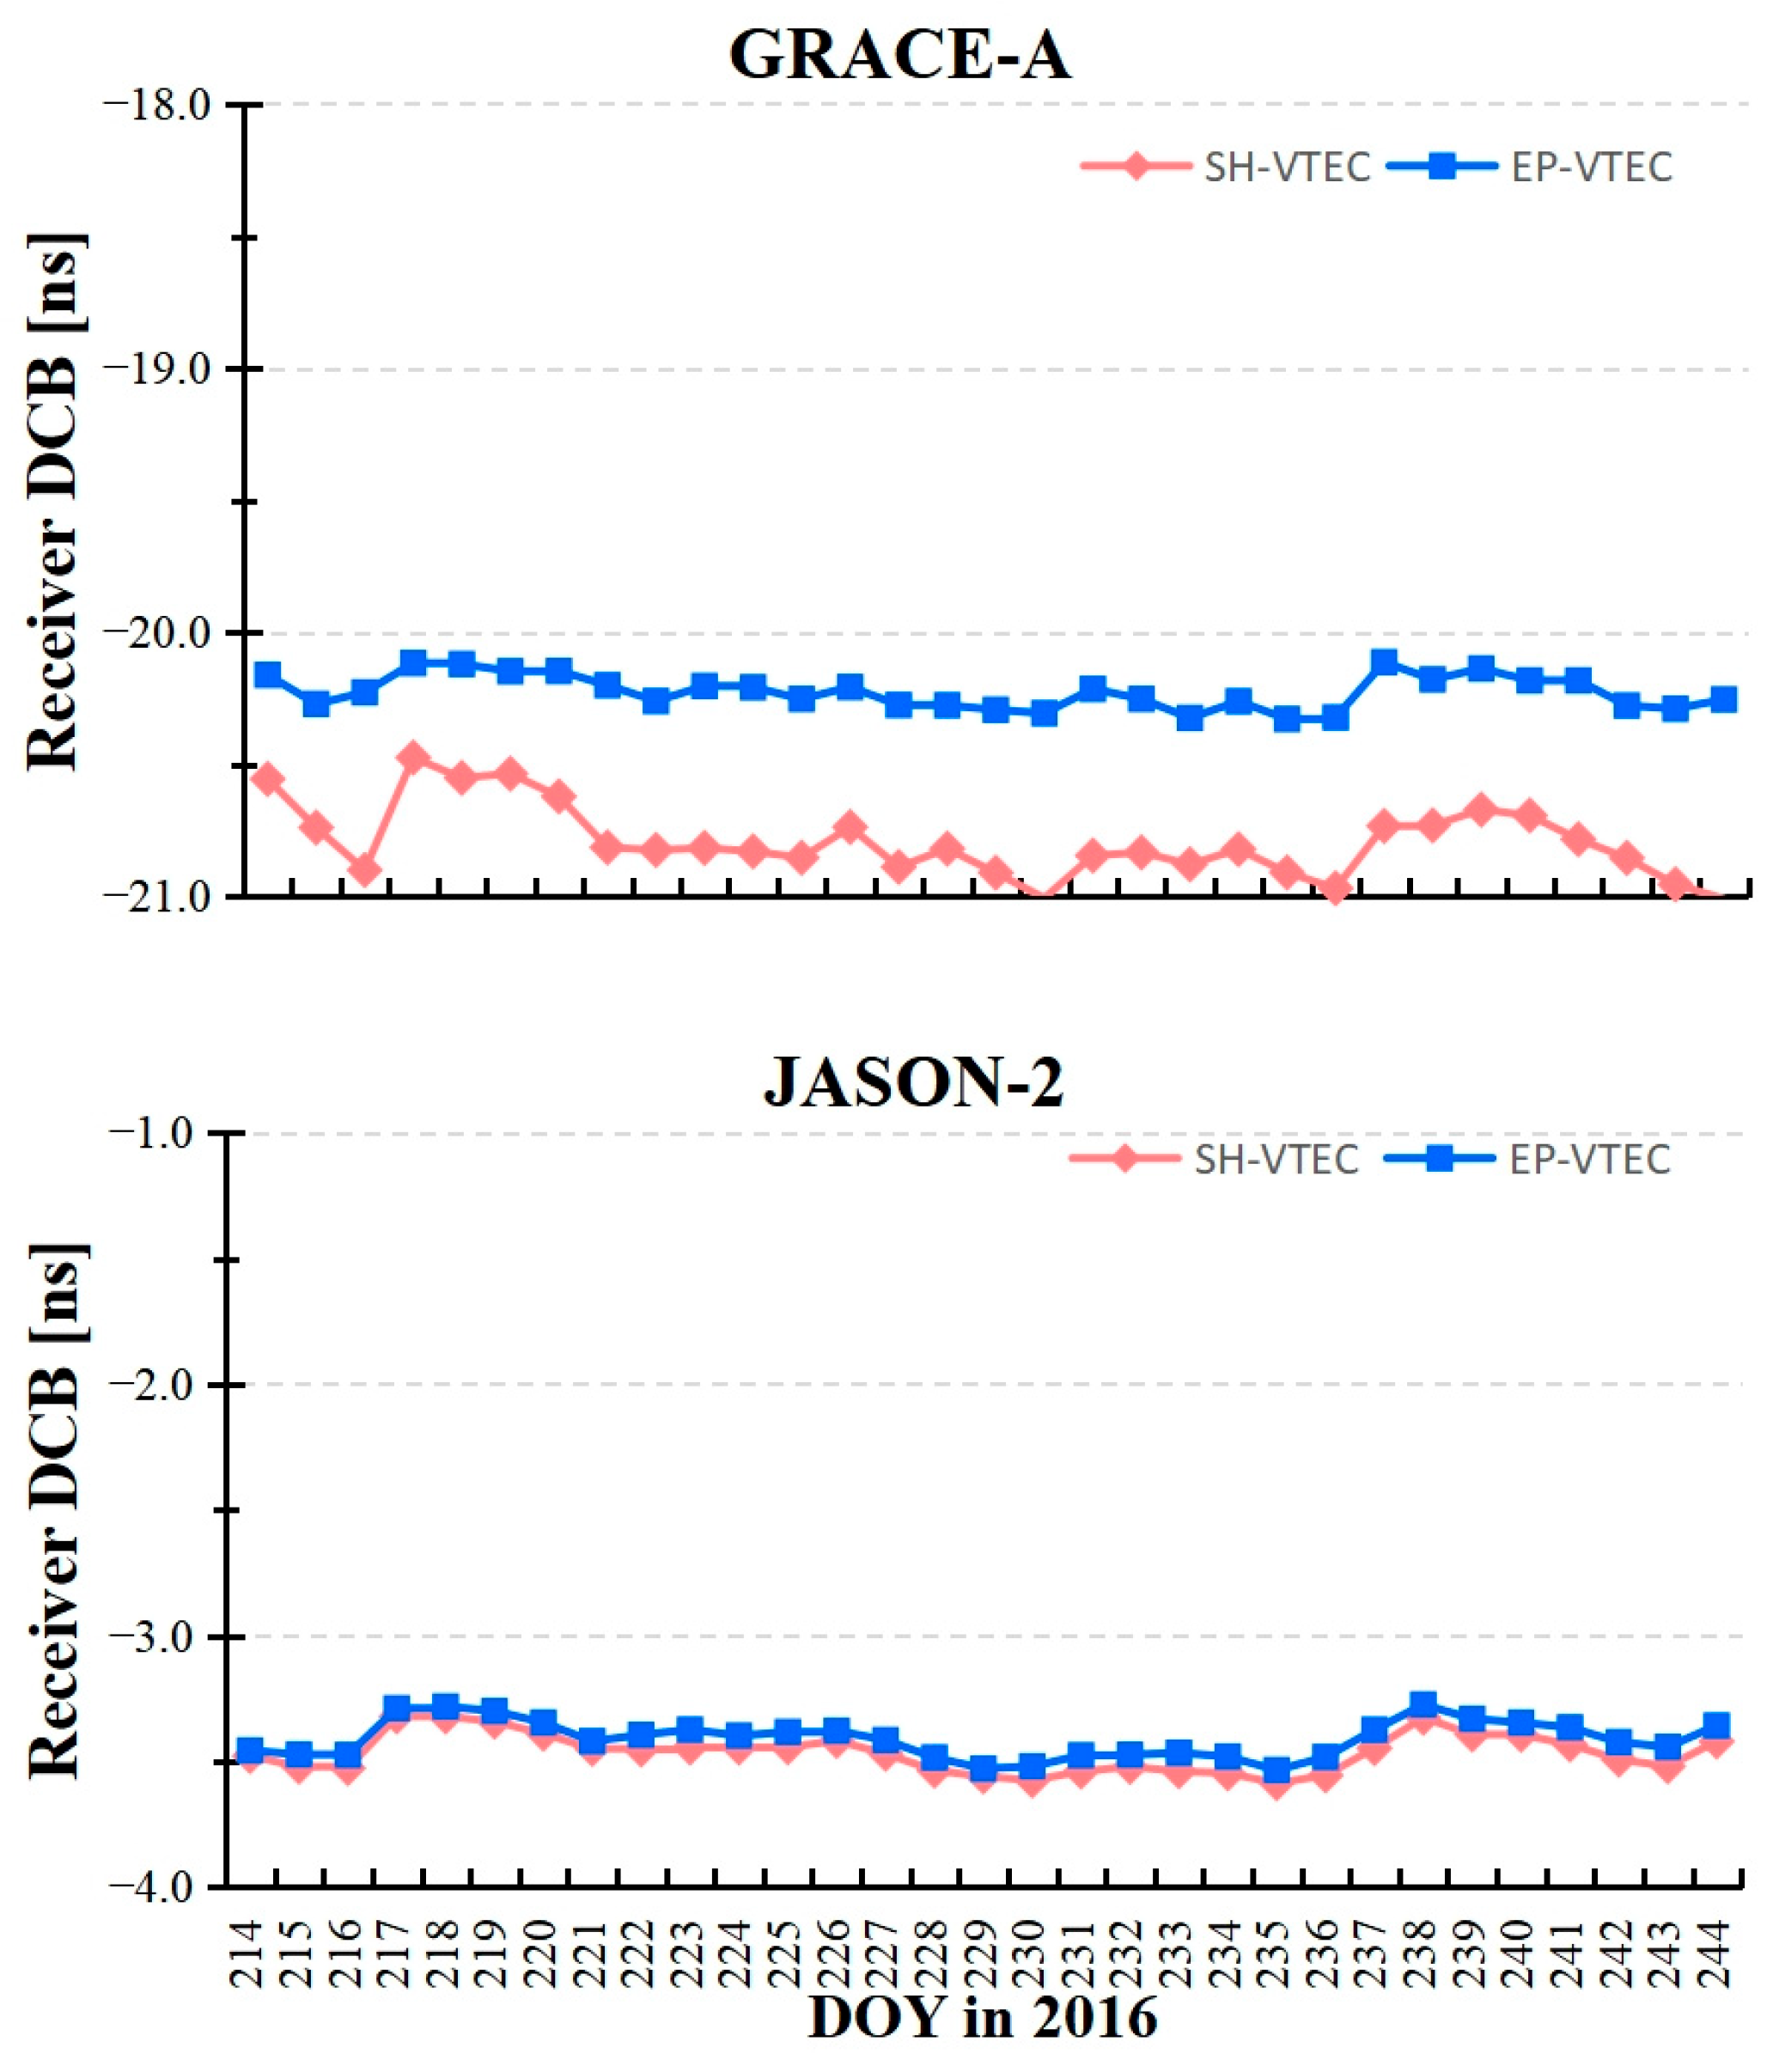
Based on the aforementioned results, this section only presents the LEO receiver DCB estimates. The time series of LEO receiver DCBs with the SH-topside VEC and EP-topside VEC methods using GRACE-A and JASON-2 data are displayed in Figure 5, and Table 4 presents the mean values and STD results for two LEO receiver DCB estimates using two VEC methods. Figure 5 shows that the differences between GRACE-A DCB estimates using the two modeling methods are within 1.0 ns, while the corresponding JASON-2 DCB values are similar to each other for the two methods. The statistics presented in Table 4 show that the differences in LEO receiver DCB means between the two methods are 0.567 and 0.034 ns for the two LEOs, respectively. There appears to be a difference of 0.5 ns in the mean of GRACE-A DCB estimates between the two methods. As the other factors are the same under the two methods, the main reason remains the difference in the LEO-topside VEC processing methods. Compared to the GPS satellite DCB estimates, the LEO-topside VEC has a greater impact on the LEO receiver DCB estimates. The STD results of GRACE-A and JASON-2 receiver DCBs using the SH-topside VEC and EP-topside VEC method are 0.138 and 0.065 ns and 0.078 and 0.075 ns, respectively. These results illustrate that GRACE-A receiver DCBs derived from the EP-topside VEC method are more stable than those obtained from the SH-topside VEC method, whereas JASON-2 receiver DCBs have similar results for the two VEC methods.

3.3. Comparison and Evaluation of LEO-Based Topside VEC Modeling Results

In this section, we present the actual estimated LEO-based topside VEC results using the SH-topside VEC and EP-topside VEC methods during August 2016, and these results are compared. Additionally, the SH-topside VEC model results are displayed. We give the IRI-GIM method to validate and compare the LEO-based topside VEC results.

3.3.1. Comparison of LEO-Based Topside VEC Results

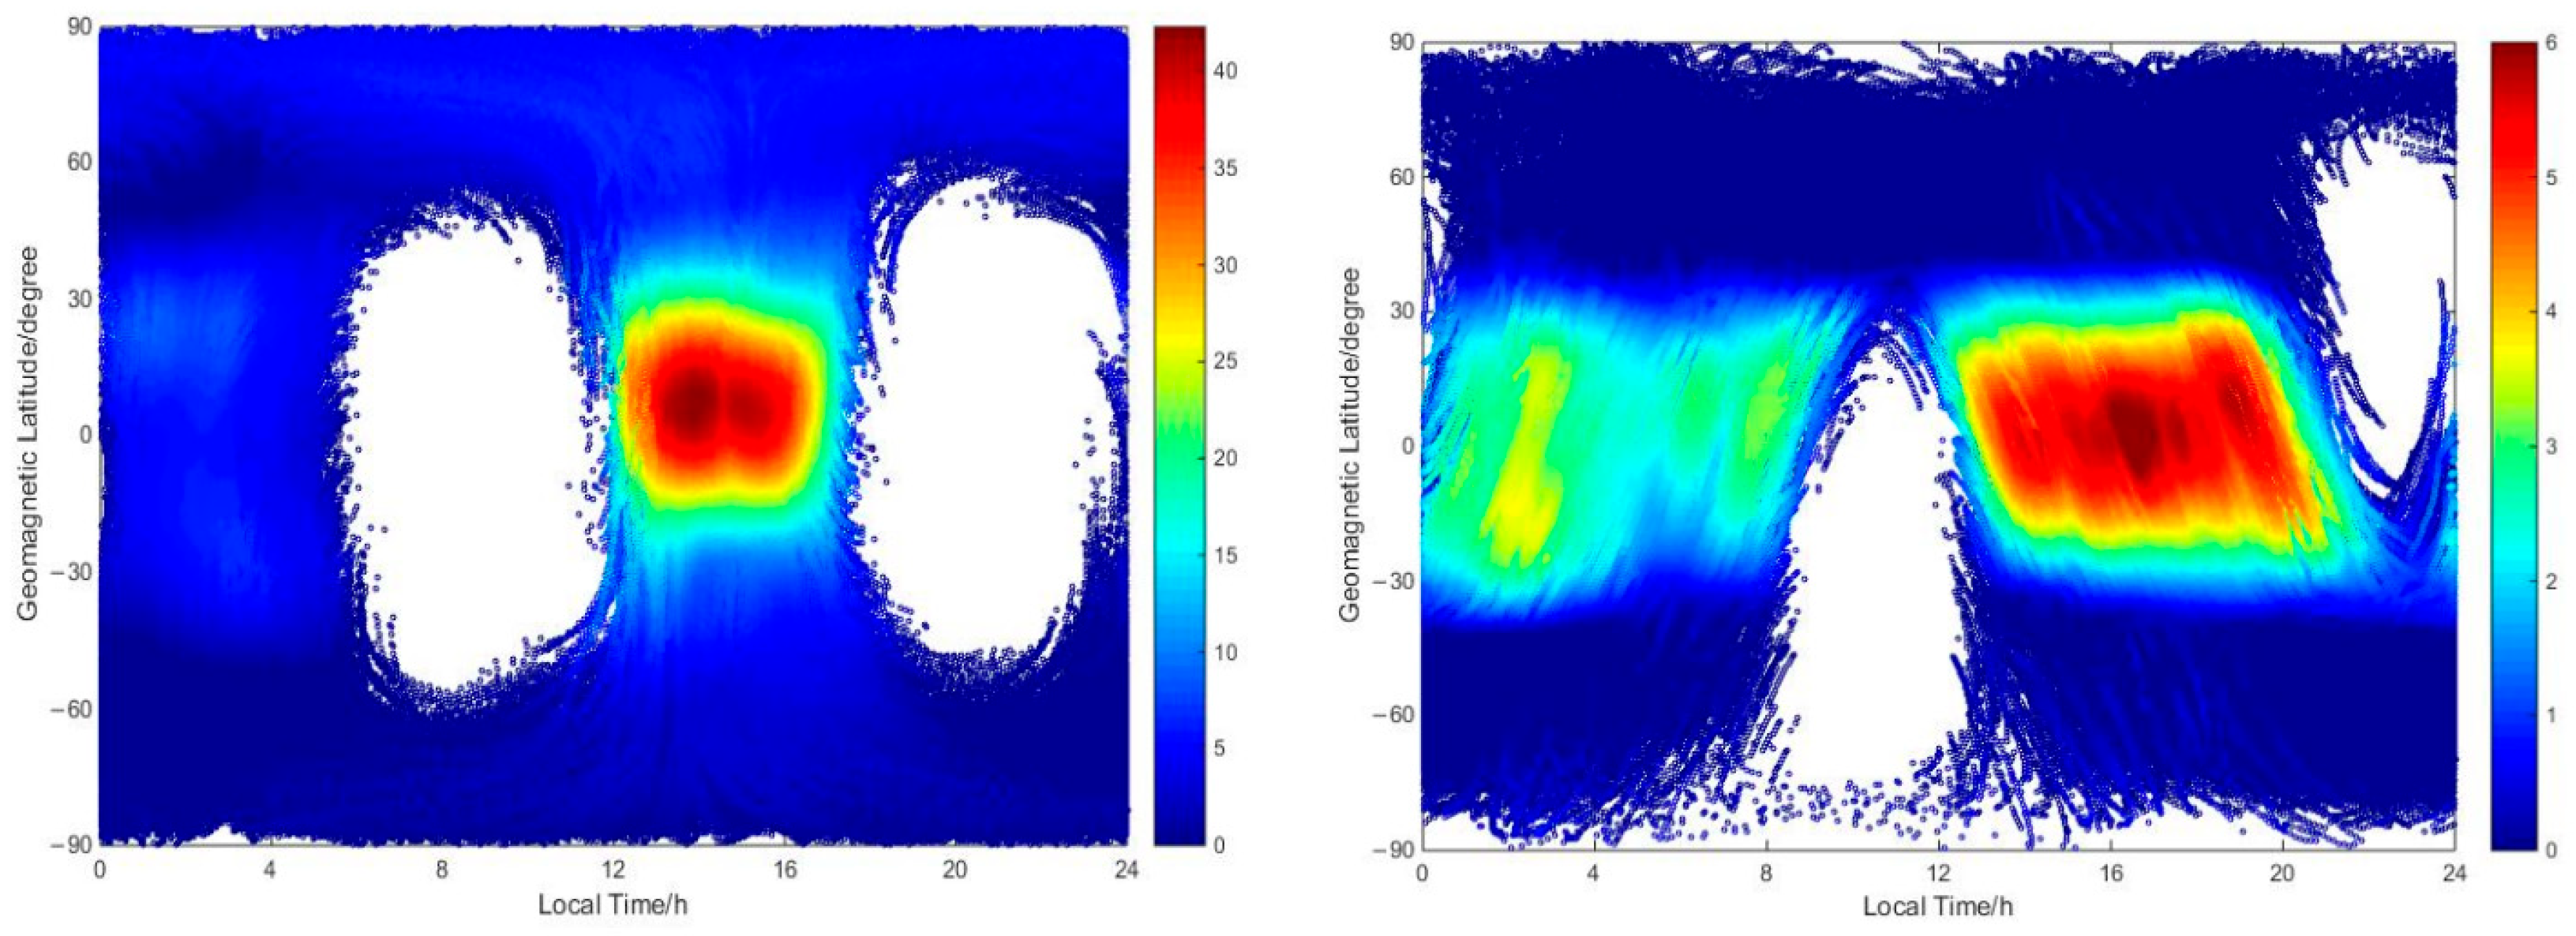
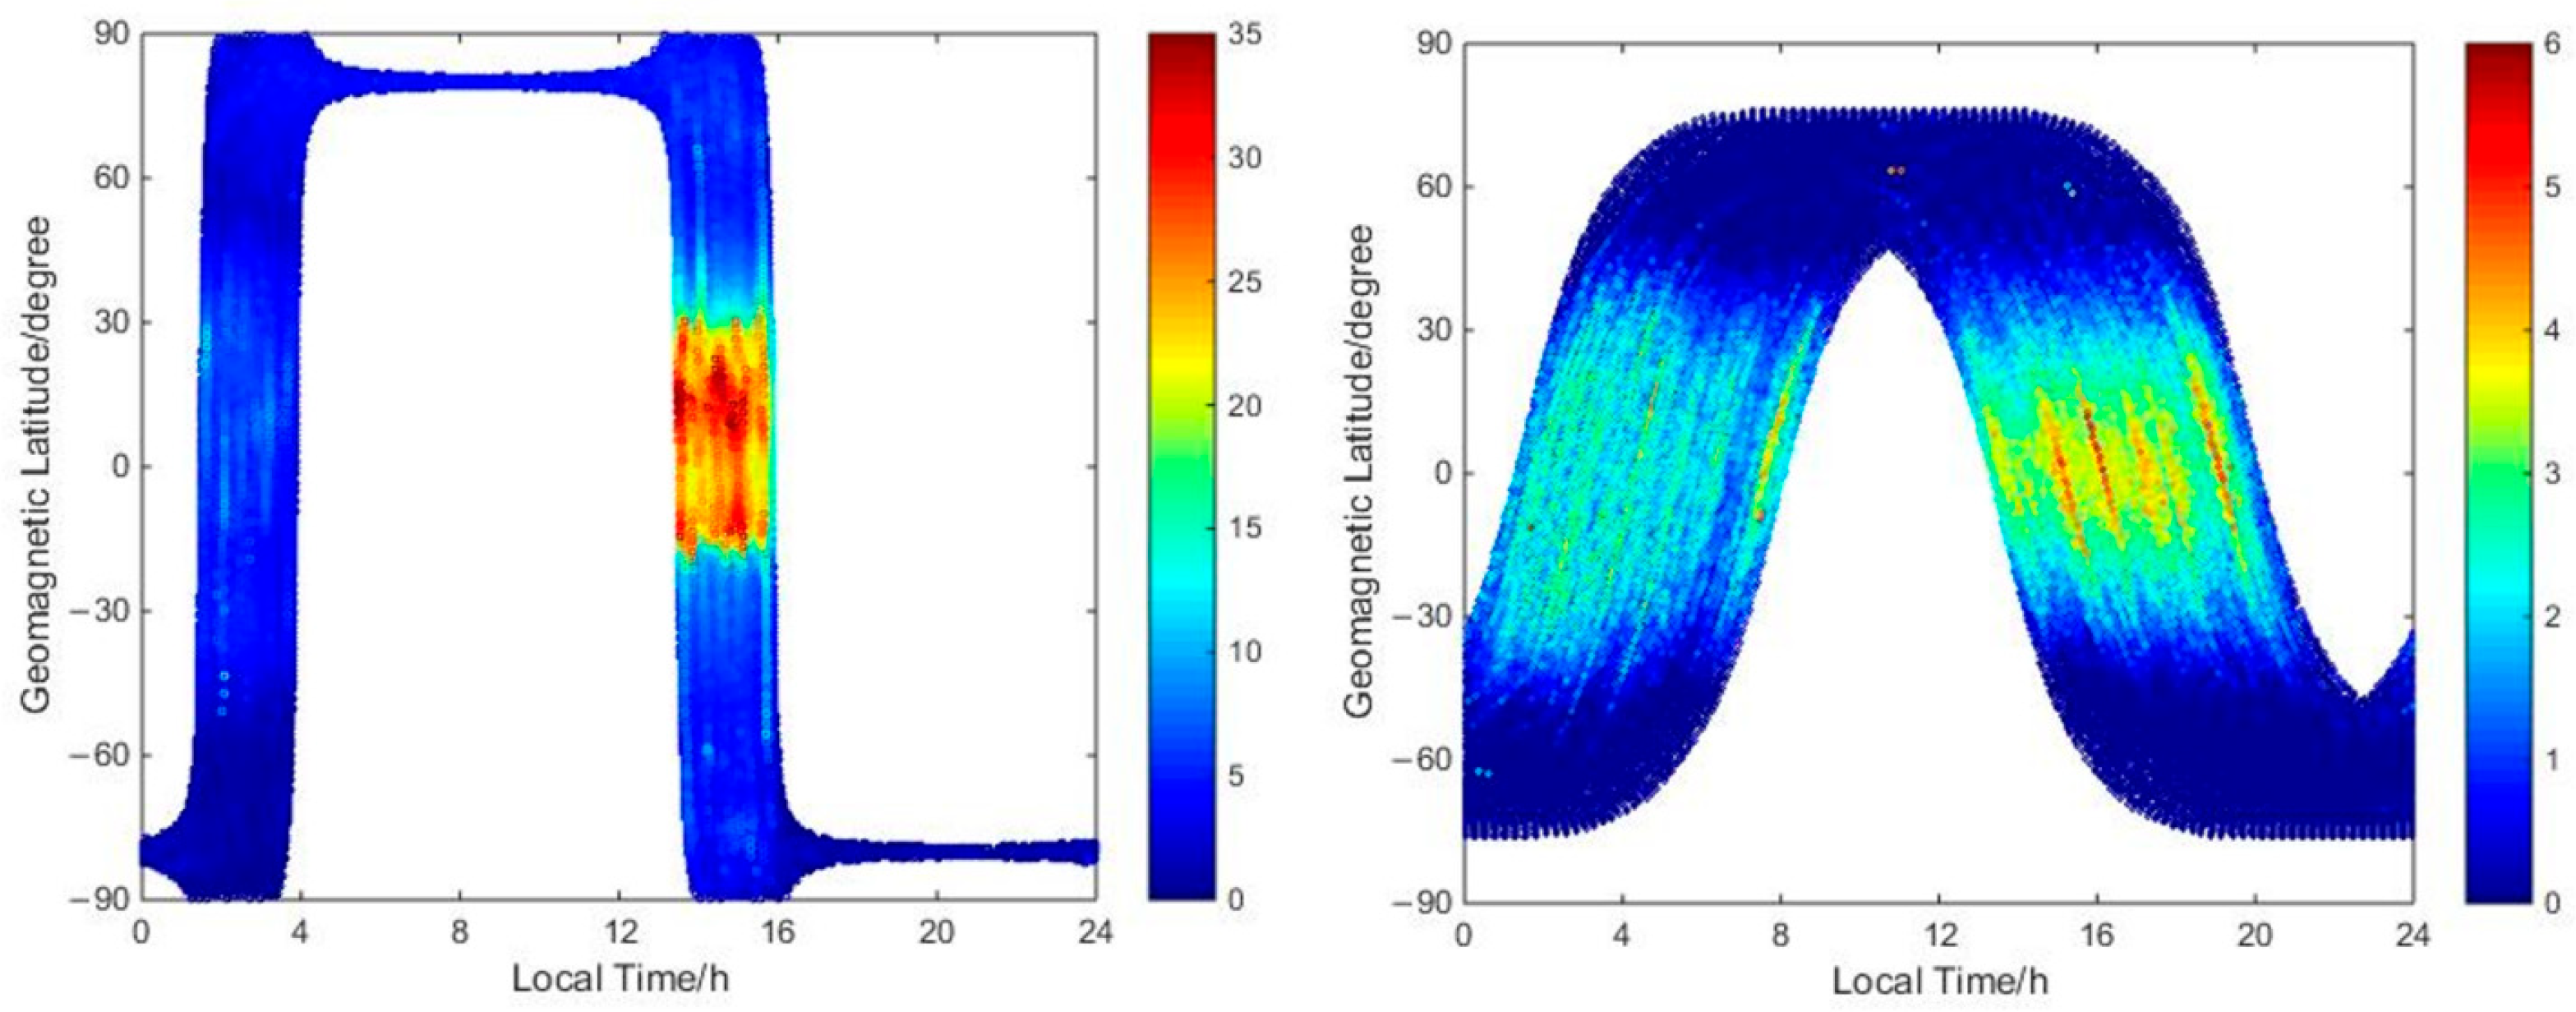
Figure 6 and Figure 7 present the actual LEO-based topside VEC scatter distribution corresponding to the Ionosphere Pierce Points (IPPs) using the SH-topside VEC and EP-topside VEC methods for two LEOs during August 2016. The peak ranges of the GRACE-A-topside VEC results using the SH-topside VEC and EP-topside VEC methods are within 42 and 35 TECU, respectively, while the peak ranges of the JASON-2-based VEC results using the two models are both within 6 TECU. As plotted in Figure 6, peak GRACE-A-topside VEC values using the SH-topside VEC method are concentrated in the ranges of 12:00–16:00 local time (LT), and peak values for JASON-2 are in the range of 12:00–20:00 LT. In Figure 7, compared with the SH-topside VEC method, the EP-topside VEC method exhibits fewer scatter distribution and estimates, because LEO-topside VEC values are estimated as epoch parameters. And the peak GRACE-A-based VEC values correspond to 13:00–18:00 LT, while those for JASON-2 are concentrated in the range of 13:00–20:00 LT. The results in Figure 6 and Figure 7 are the actual computed LEO-topside VEC results corresponding to the IPPs, not the modeling results, so there are some blanks in the figures due to only using one month of data. The peak values of the EP-topside VEC methods start at 13:00 LT because the number of IPPs and resolutions of the EP-topside VEC method using the same data period is less than those of the SH-topside VEC, and some areas are not covered.
The peak values of the LEO-topside VEC for two LEO satellites are concentrated near the magnetic equator at latitudes between approximately −20°S and 30°N, which is a weaker ionospheric equatorial ionization anomaly (EIA) phenomenon. The EIA crest is generally symmetrical about the geomagnetic equator during spring and autumn, but in the Northern Hemisphere summer, it shows a stronger presence in the Northern Hemisphere and a weaker one in the Southern Hemisphere, while the opposite occurs in the Northern Hemisphere winter [40,41]. Due to the study period being in the Northern Hemisphere summer, there is a phenomenon of the EIA crest moving towards the north and higher latitudes. In contrast, the EIA phenomenon of the GRACE-based VEC results is more obvious than that of the JASON-based VEC results due to the lower orbits of the GRACE-A satellite and closer proximity to the ground. Additionally, using the SH-topside VEC method, LEO-topside VEC are modeled as the spherical harmonic function, and the number of LEO-topside VEC values for each epoch is consistent with the number of GNSS satellites observed in each epoch. For the EP-topside VEC method, LEO-topside VEC values are estimated as the epoch parameters, with only one VEC value for each epoch. Thus, the temporal and spatial resolutions of the LEO-topside VEC estimates using the SH-topside VEC method are greater than those obtained using the EP-topside VEC method.
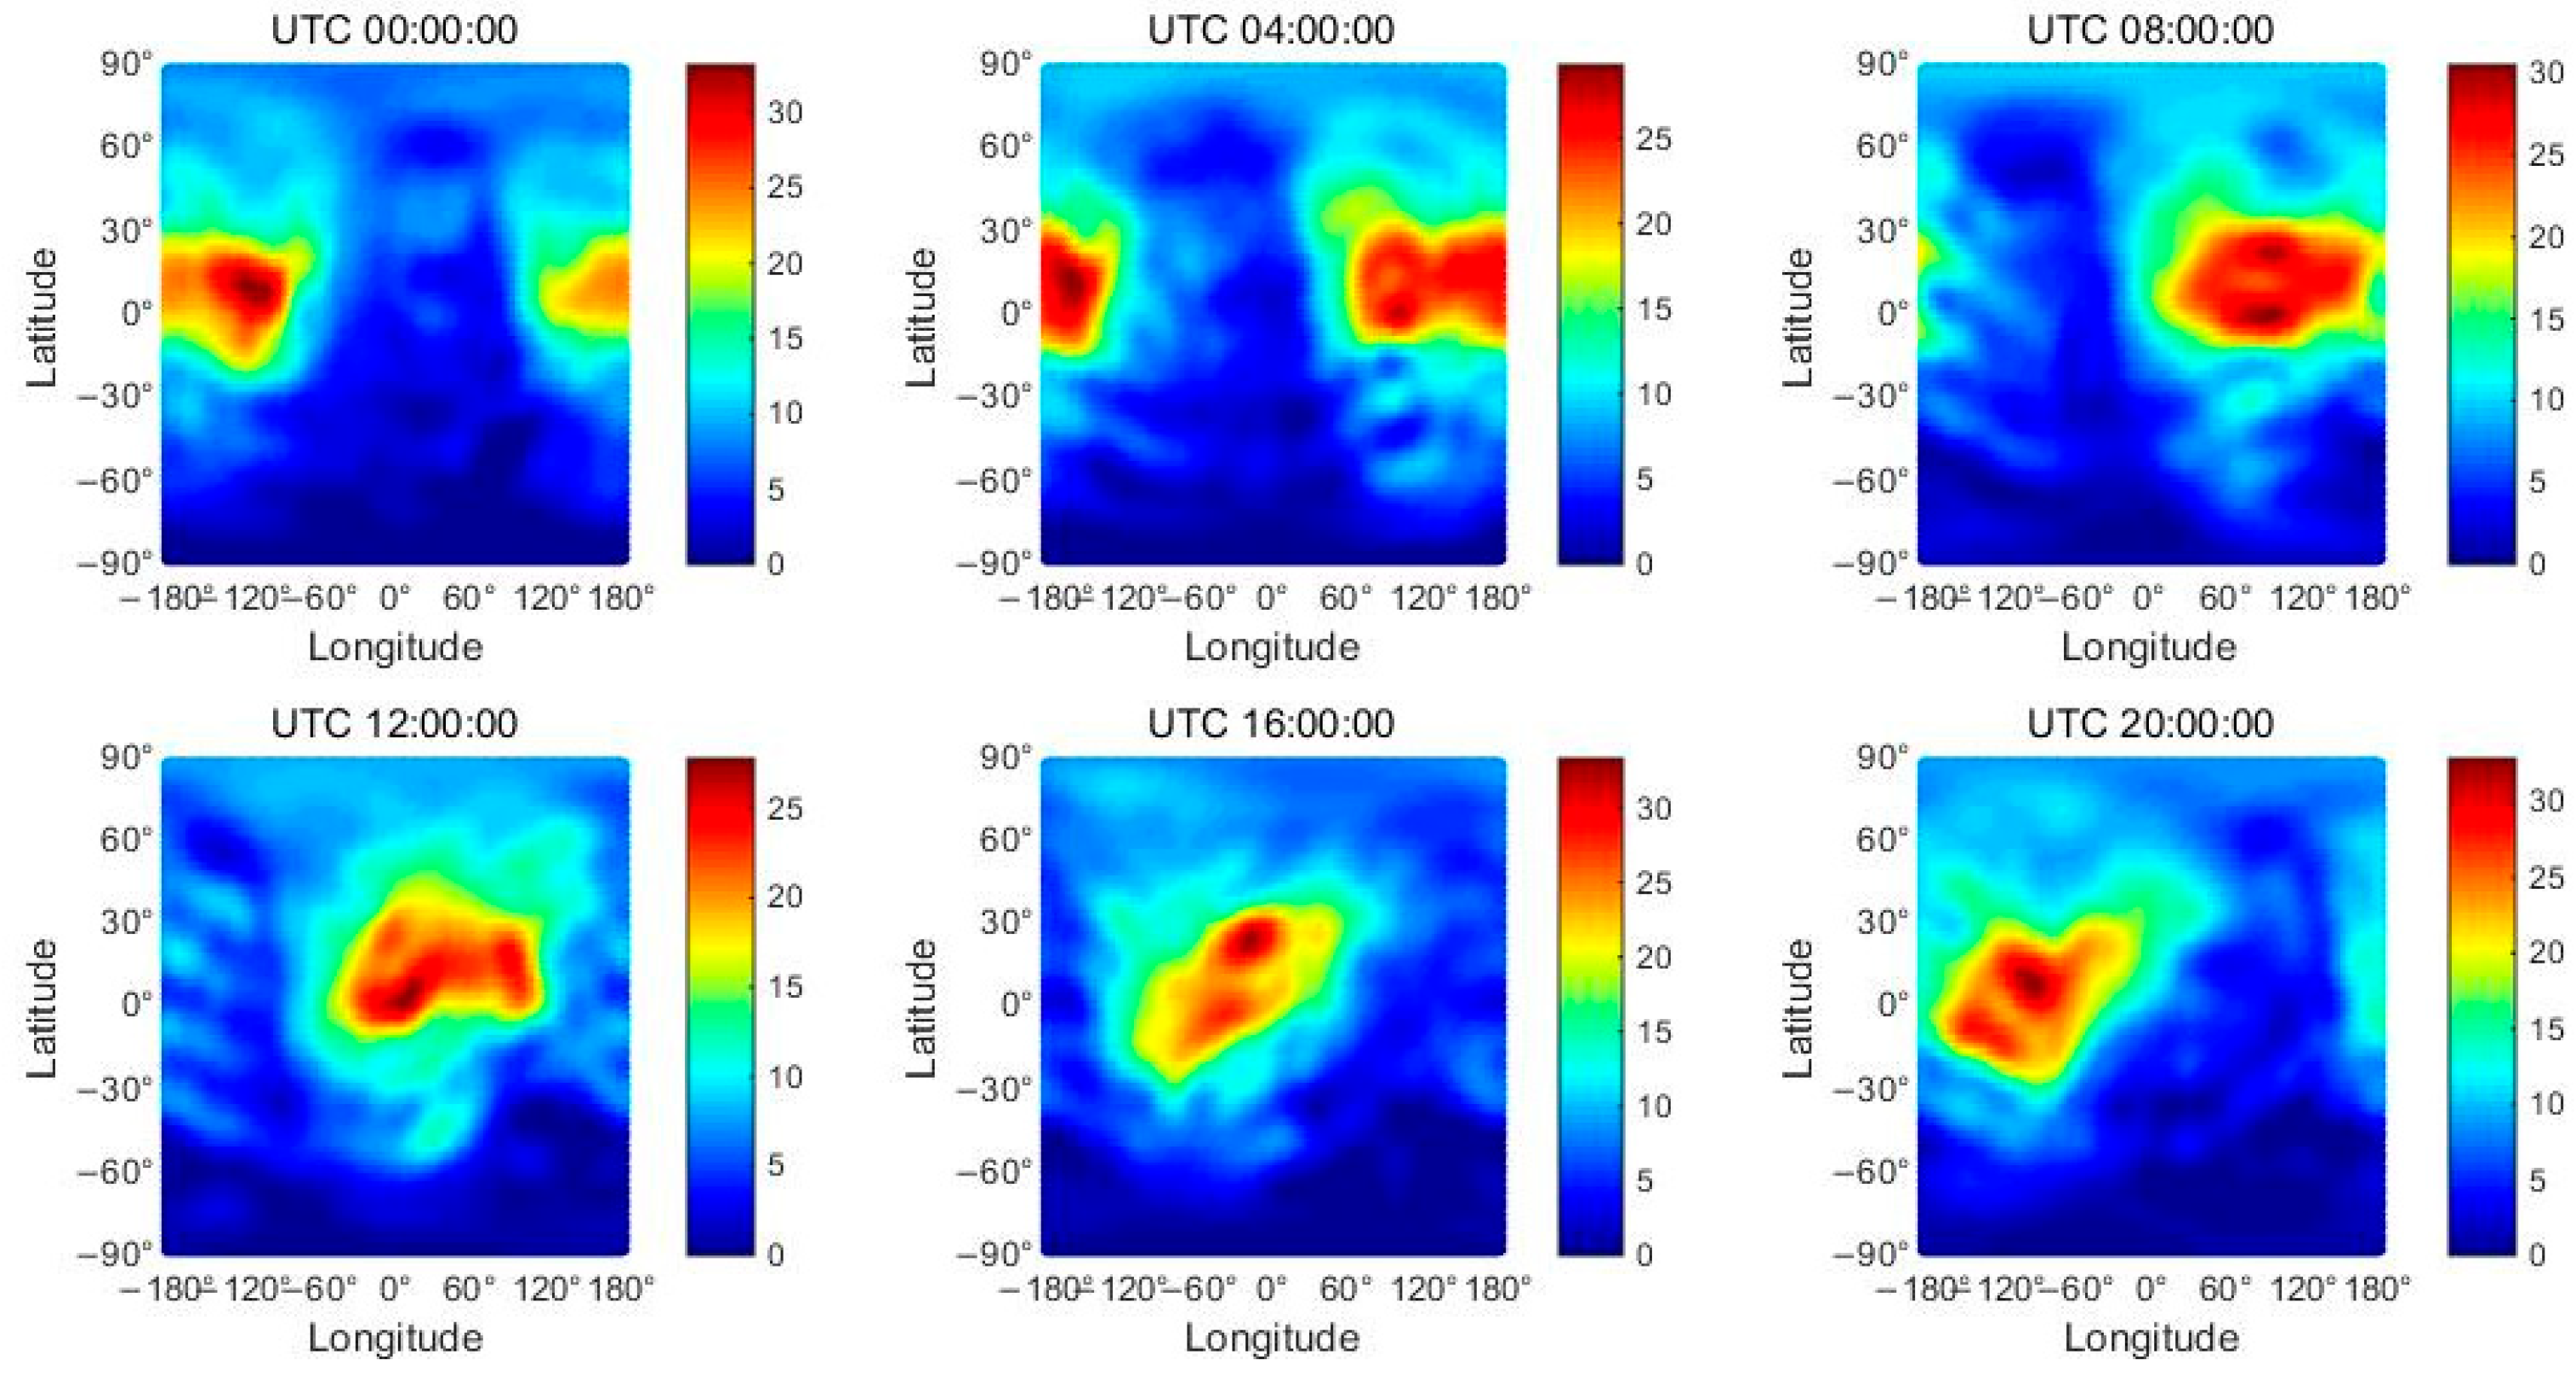
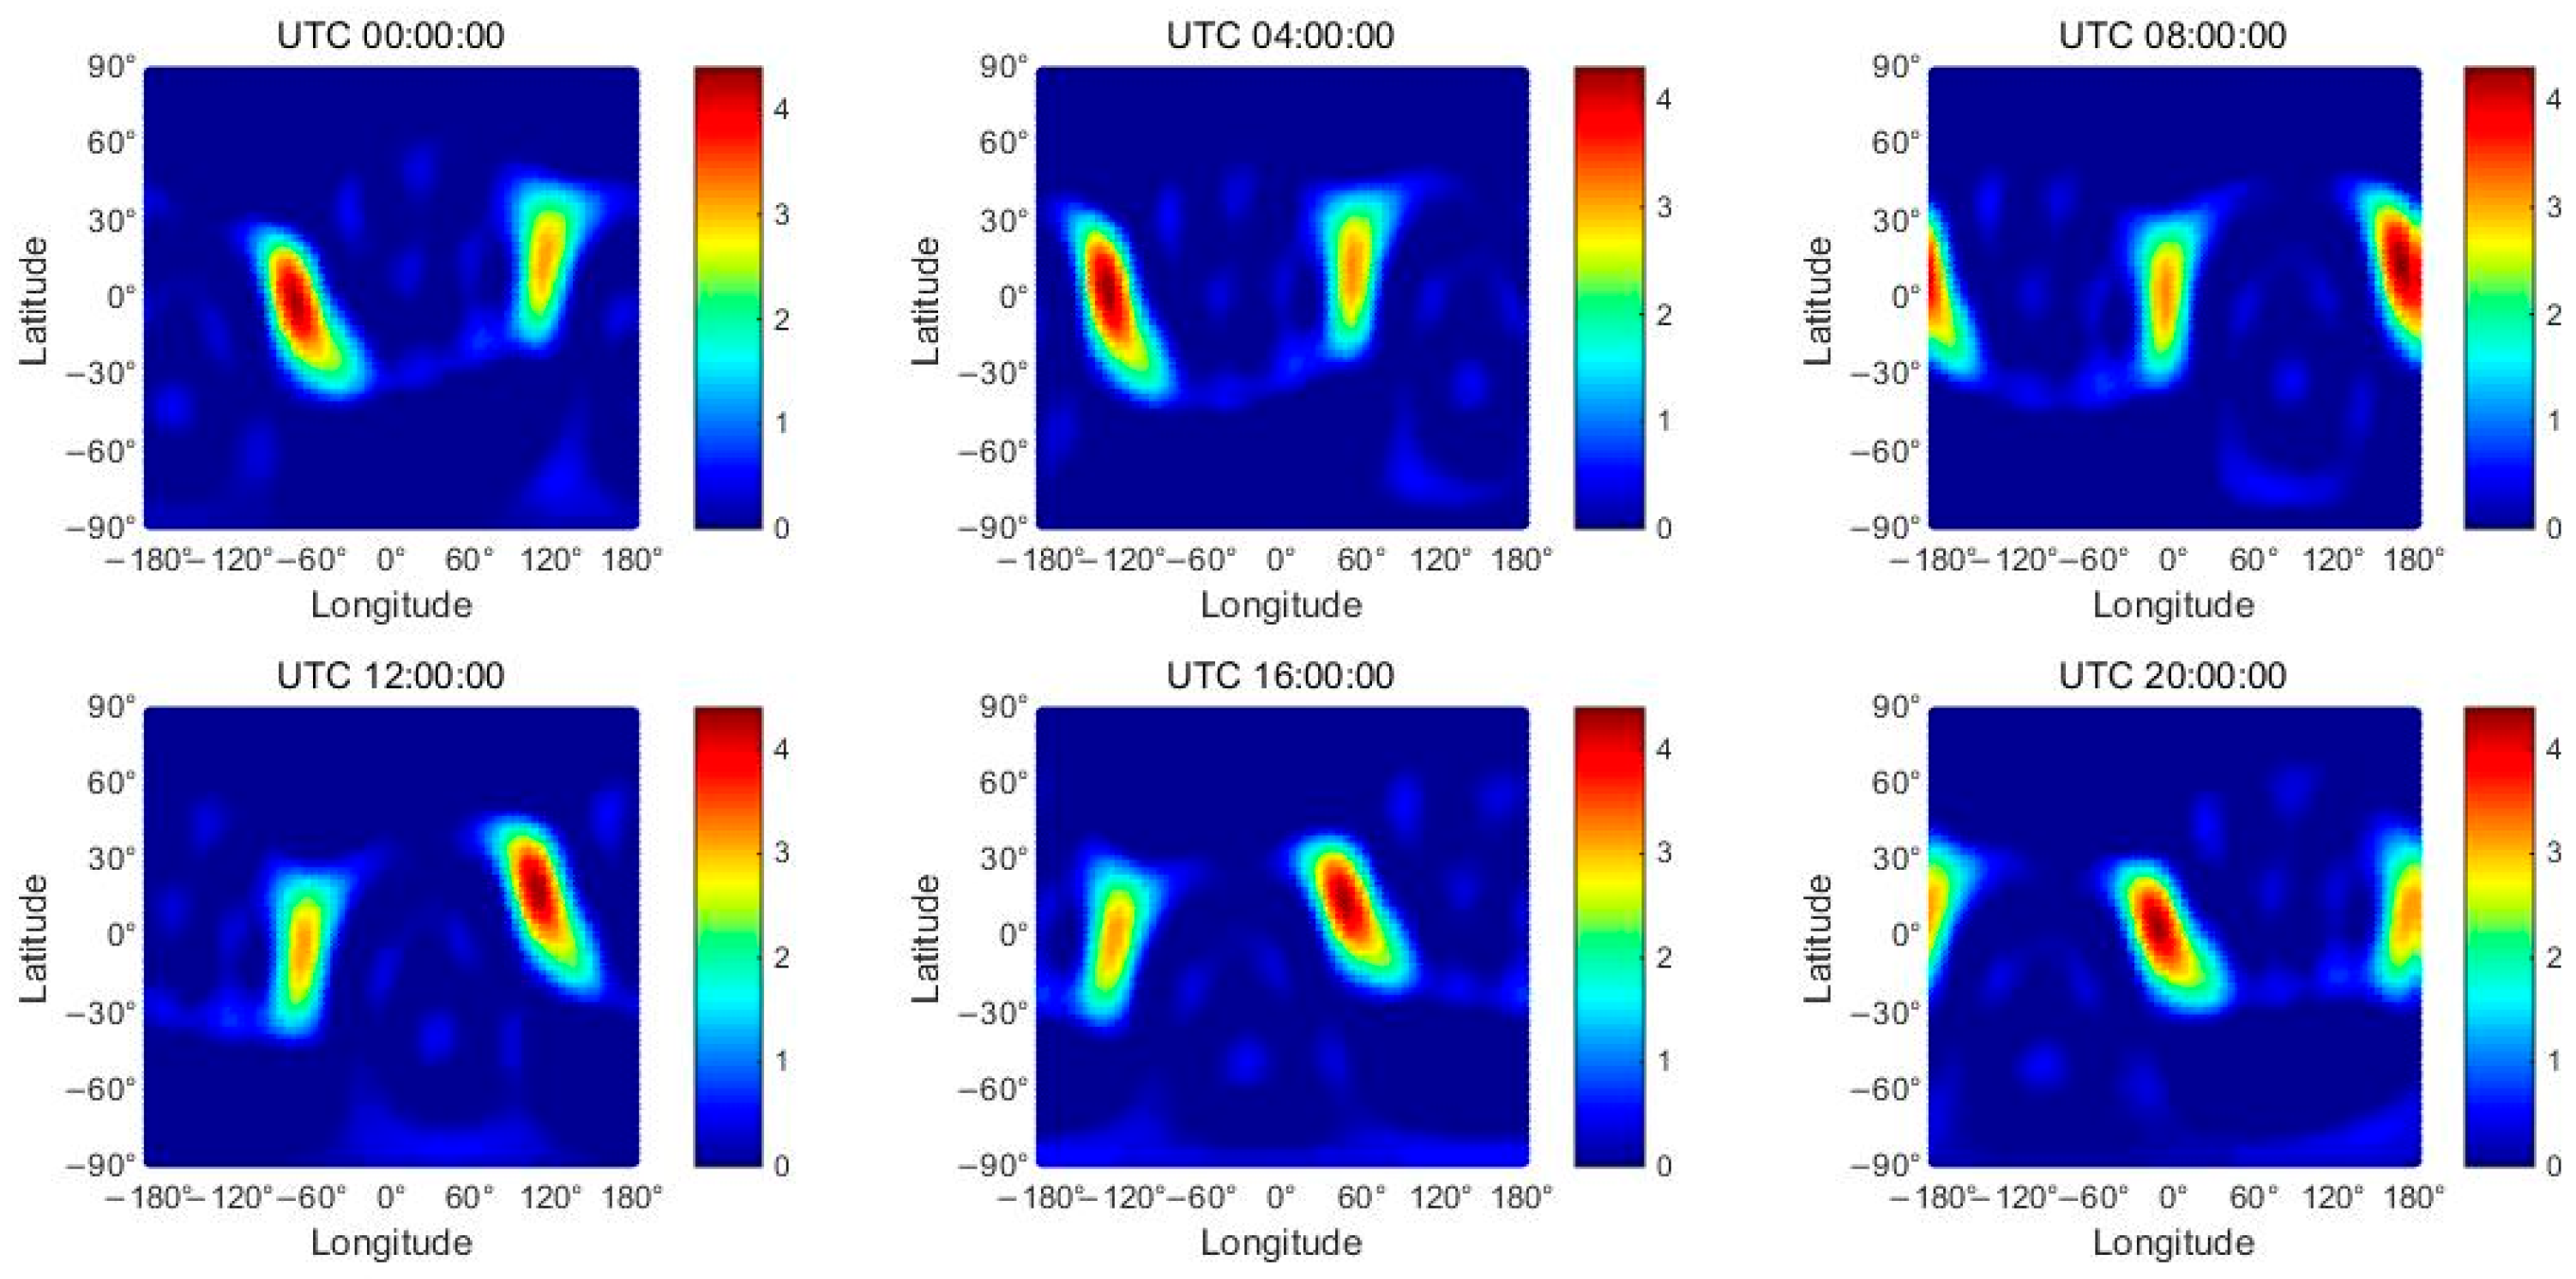
Figure 6 and Figure 7 depict the actual estimated LEO-based topside VEC results using the two methods. In addition, the VEC model map results can be displayed. We must note that the EP-topside VEC method cannot present the VEC model map, as its VEC is estimated as epoch parameters directly rather than being modeled. In contrast, the SH-topside VEC method models the VECs, and its VEC model maps can be displayed. Thus, we only present the VEC model maps of the SH-topside VEC method, which has high-resolution spatiotemporal characteristics. In Figure 8, Figure 9 and Figure 10, we show the CODE GIM, GRACE-A-topside, and JASON-2-topside VEC model maps with 4 h cadence on DOY 214 in 2016, respectively. Therefore, each map has six different subfigures corresponding to different UTCs. Similar to Figure 6, Figure 9 also exhibits the EIA phenomenon. Figure 10 is similar to Figure 7, but due to the higher orbits of JASON-2, its EIA phenomenon is not significant. In Figure 9, the peak positions and TEC distributions of GRACE-based GIM and CODE GIM are similar on DOY 214 due to the low orbit of the GRACE satellite. And the peak differences between GRACE-based GIM and CODE GIM are about 10 TECU. In Figure 10, the peak positions of JASON-2-topside VEC maps differ from those of the GRACE-A-topside VEC and CODE GIM maps, and there are two peaks in the JASON-2-based VEC on DOY 214. This two-peak phenomenon in the JASON-2-topside VEC maps is temporary and may be related to the amount of data. We can roughly compare Figure 6 (JASON-2 on the right) and Figure 10. Figure 6 and Figure 10 show the actual extracted VECs for one month and the model maps for one day using the SH-topside VEC method, respectively. In the case of a small amount of data, the result of Figure 10 may temporarily show two peaks. When using one month of data, it becomes like Figure 6. And we noted that the longitudinal widths of the LEO-topside VECs are smaller than those of the CODE GIM, which is also related to the amount of data and satellite orbit altitude. We displayed the model maps of SH-topside VEC for one day; the results for Figure 6 (using one month of data) are much better. Even though they are both LEO satellites, the higher JASON-2 orbit leads to a smaller VEC, whose widths are also not as good as GRACE VECs. In addition, we believe the main reason for the different peak positions in Figure 9 and Figure 10 is the higher orbits of JASON-2 (at 1350 km) and smaller VECs (≤5 TECU), which leads to the JASON-based VECs not following the characteristics and distribution of ground-based TEC. In contrast, the similarity of VEC distributions between GRACE-based GIM and CODE GIM is higher than that of JASON-2-based GIM due to the lower LEO orbits (only 400 km in 2016). Hence, to some extent, the GRACE-based VECs follow the characteristics and distribution of ground-based TECs. These results indicate that the LEO-topside VECs and EIA may have different altitude structures.

3.3.2. Evaluation of LEO-Based Topside VEC Results

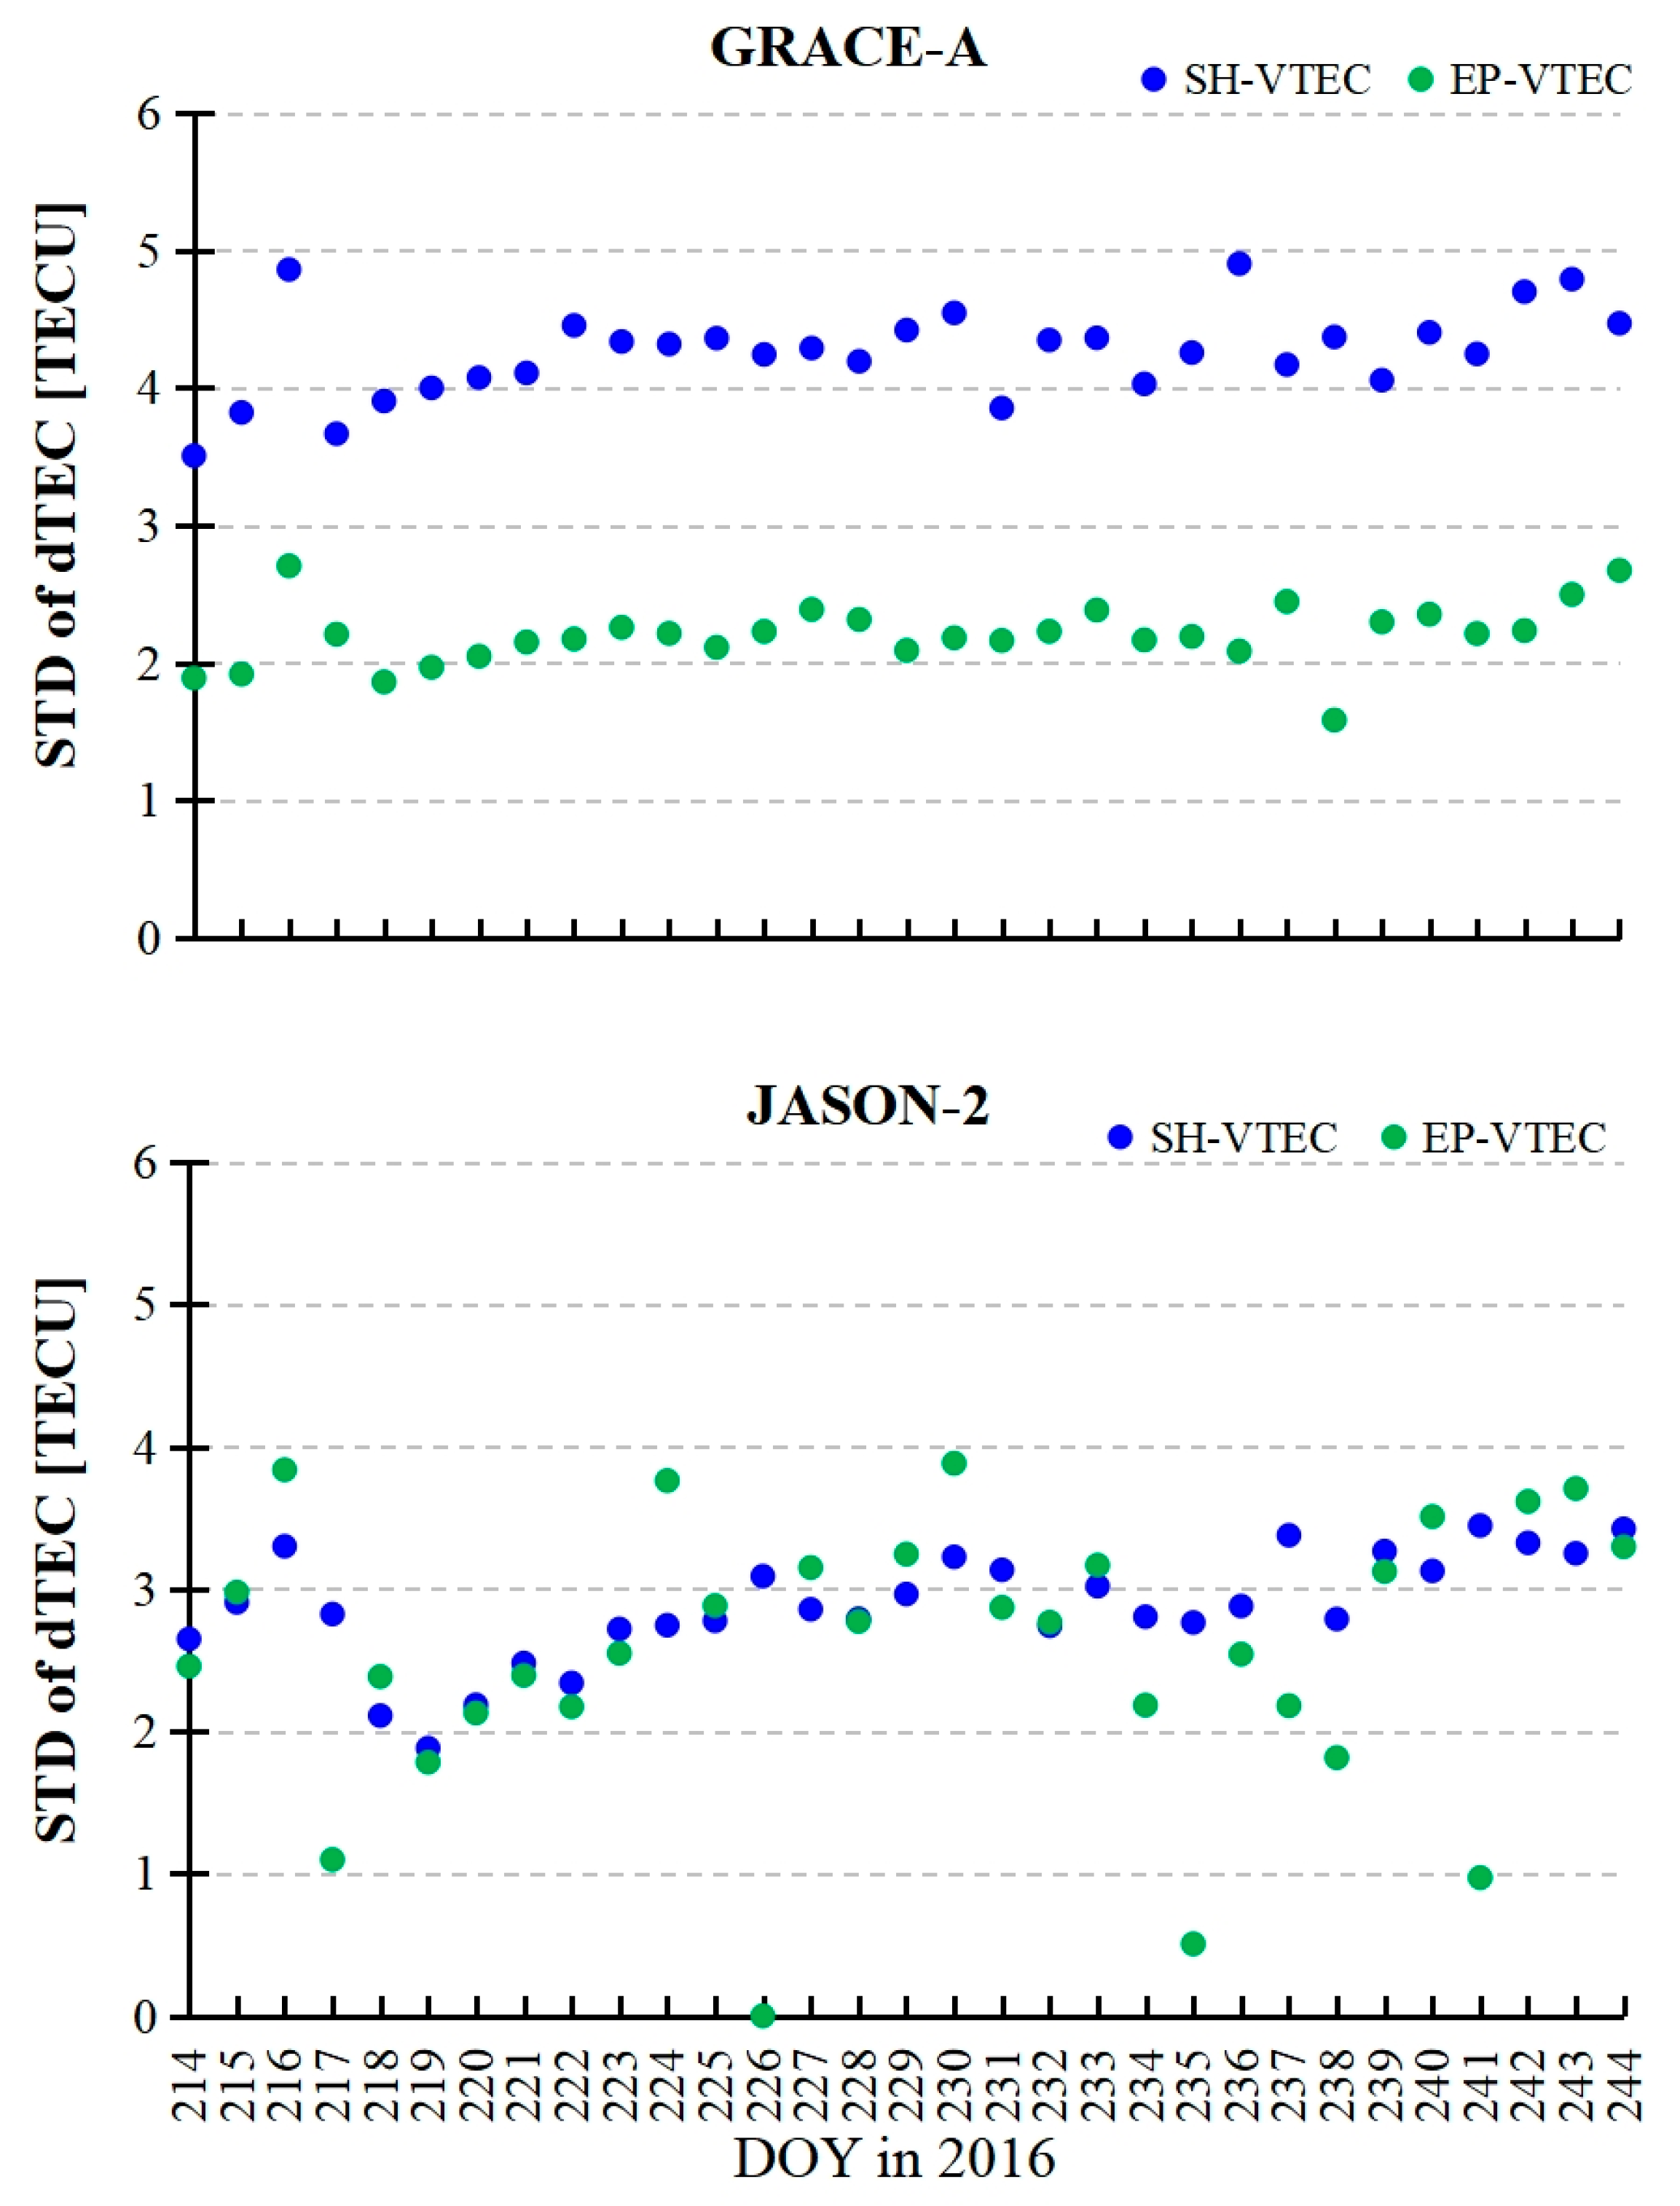
The STD for the differences between the sum TEC of LEO-topside VEC and IRI 2016, and the CODE GIM, during August 2016, are depicted in Figure 11. The STD values of the differences between the sum TEC of the LEO-based topside VEC and IRI VTEC and the CODE GIM fluctuate below 5 TECU. For GRACE-A, the STDs of the differences using the EP-topside VEC method are better than those using the SH-topside VEC method. According to statistics, the STD means of the SH-topside VEC and EP-topside VEC methods for GRACE-A using the IRI-GIM validation method are 4.2 and 2.2 TECU, respectively. There is a roughly 2 TECU difference between the two VEC methods in the verification results of GRACE-A-topside VECs. Additionally, there appear to be some differences in the mean of GRACE-A DCB estimates between the two methods in Table 4. Although the IRI is an empirical climatological model and it has model and prediction errors [42], these results also seem to have a certain degree of self-consistency. This further demonstrates that, compared to the GNSS satellite DCB, the two LEO-topside VEC processing methods have a greater impact on the stability of the LEO-topside VEC and LEO DCB estimates. For JASON-2, the two LEO-based topside VEC modeling methods have similar STD results, and the STD means using the two VEC methods are 2.9 and 2.6 TECU, respectively. In summary, for GRACE-A, the validation results using the EP-topside VEC method are superior to those using the SH-topside VEC method, while for JASON-2, the two VEC methods have similar validation results.

4. Discussion

For GRACE-A at an altitude of 400 km, the validation results using the EP-topside VEC method for DCB STDs and VEC results are better than those using the SH-topside VEC method. But for JASON-2 at an altitude of 1350 km, STDs for LEO DCBs and the LEO-based topside VEC results using two VEC methods have similar validation results, and the STDs for GPS DCBs using the SH-topside VEC are slightly superior to those using the EP-topside VEC method. However, the RMS results of the difference for GPS DCBs using the SH-topside VEC model relative to CODE products are slightly superior to those using the EP-topside VEC method. We must note that the temporal and spatial resolutions of the SH-topside VEC model are higher than those of the EP-topside VEC method, and the former has a wide range of usability and predictive characteristics. Due to the difference in orbital altitude, the results and distributions of the GRACE-topside VECs differ from those of the JASON-topside VECs, with the former being more consistent with the ground-based results, indicating that there may be different height structures in the LEO-topside VECs.

5. Conclusions

In this study, in order to study the influences of two topside VEC processing methods on estimates, we performed two LEO-based topside VEC modeling methods—the EP-topside VEC and SH-topside VEC methods—using two different LEO satellite data to simultaneously estimate GPS satellite DCB, LEO receiver DCB, and LEO-based topside VEC. After evaluating and comparing the results of DCB and LEO-based topside VEC using the two VEC methods, the following conclusions can be drawn:
(1)
Using GRACE-A data obtained at an altitude of 400 km, the DCB estimates for GPS satellites and LEO receivers using the EP-topside VEC method are more stable than those using the SH-topside VEC method. In contrast, using the JASON-2 data at a height of 1350 km, the monthly stabilities of estimated GPS DCBs using the SH-topside VEC method are better than those using the EP-topside VEC method, while LEO receiver DCB stabilities derived from the two VEC solutions are similar to each other. The monthly stabilities of GPS and LEO DCB estimates obtained using the EP-topside VEC method are related to LEO receiver altitude. Using both GRACE-A and JASON-2 data, the RMS results of the difference for GPS DCBs using the SH-topside VEC method relative to CODE products are more accurate than those using the EP-topside VEC method. The stability and accuracy of LEO-based DCB estimates are similar to those using ground-based results.
(2)
The peak ranges of the GRACE-A-topside VEC results using the SH-topside VEC and EP-topside VEC methods are within 42 and 35 TECU, respectively, while the peak ranges of the JASON-2-topside VEC results using the two models are both within 6 TECU. The study period coincides with summer, and the EIA region moves northward. In contrast, the EIA phenomenon of the GRACE-topside VEC results is more obvious than that of the JASON-topside VEC results due to the lower orbits of the GRACE satellite and closer proximity to the ground. Additionally, the SH-topside VEC model maps are only displayed due to the EP-topside VEC method not modeling VEC. The results and distributions of the GRACE-topside VECs differ from those of the JASON-topside VECs due to the difference in orbital altitude, with the former being more consistent with the ground-based results, indicating that there may be different height structures in the LEO-topside VEC. The LEO-based topside VEC results are validated using the IRI-GIM method. For GRACE-A at an altitude of 400 km (in 2016), the validation results using the EP-topside VEC method for DCB STDs and VEC results are better than those using the SH-topside VEC method, while for JASON-2 at an altitude of 1350 km, the results using the two VEC methods have similar validation results.
We must note that the temporal and spatial resolutions of the SH-topside VEC model are higher than those of the EP-topside VEC methods. The former may have a wider availability, and the latter seems to correspond to the single-epoch VEC mean of the former to some extent. The LEO observation data can be used to estimate DCBs and extract LEO-topside VECs to establish GNSS and LEO high-precision global ionosphere and broadcast ionosphere models in the future, which can serve next-generation GNSS and LEO positioning.

Author Contributions

In this work, M.L. proposed the idea, conducted the experiments, and wrote the initial draft. Y.Y., J.O., and B.T. helped improve the manuscript. All authors have read and agreed to the published version of the manuscript.

Funding

This research was funded by the Major Program (JD) of Hubei Province (2023BAA025), the Strategic Talent Cultivation Project of Hubei Province (KJCXRC202400130, 2024DJA016), the China Natural Science Funds (42504036), the Natural Science Foundation of Hubei Province (2025AFB371), and the National Key Research Program of China (2023YFA1009102).

Data Availability Statement

CODE’s DCB products can be found at ftp.aiub.unibe.ch/CODE/. The spaceborne data for JASON-2 and GRACE-A satellites are available at ftp://avisoftp.cnes.fr/AVISO/pub/ and ftp://isdcftp.gfz-potsdam.de/ (accessed on 10 November 2023).

Acknowledgments

The authors would like to thank the GFZ and CNES for providing GRACE and JASON onboard GNSS data and the CODE for providing the GNSS satellite orbits, clocks, and DCB precise products. We are also grateful to the IRI Working Group for providing the IRI-2016 model code in Fortran.

Conflicts of Interest

The authors declare no conflicts of interest.

References

  1. Schaer, S. Mapping and Predicting the Earth’s Ionosphere Using the Global Positioning System. Ph.D. Thesis, University of Berne, Bern, Switzerland, 1999. [Google Scholar]
  2. Yuan, Y. Study on Theories and Methods of Correcting Ionospheric Delay and Monitoring Ionosphere Based on GPS. Ph.D. Thesis, Institute of Geodesy and Geophysics, Chinese Academy of Sciences, Wuhan, China, 2002. [Google Scholar]
  3. Hernández-Pajares, M.; Juan, J.M.; Sanz, J.; Orus, R.; Garcia-Rigo, A.; Feltens, J.; Komjathy, A.; Schaer, S.C.; Krankowski, A. The IGS VTEC maps: A reliable source of ionospheric information since 1998. J. Geod. 2009, 83, 263–275. [Google Scholar] [CrossRef]
  4. Montenbruck, O.; Hauschild, A. Code biases in multi-GNSS point positioning. In Proceedings of the ION ITM 2013, San Diego, CA, USA, 28–30 January 2013. [Google Scholar]
  5. Liu, T.; Zhang, B. Estimation of code observation-specific biases (OSBs) for the modernized multi-frequency and multi-GNSS signals: An undifferenced and uncombined approach. J. Geod. 2021, 95, 97. [Google Scholar] [CrossRef]
  6. Hernández-Pajares, M.; Lyu, H.; Garcia-Fernandez, M.; Orús-Pérez, R. A new way of improving global ionospheric maps by ionospheric tomography: Consistent combination of multi-GNSS and multi-space geodetic dual-frequency measurements gathered from vessel-, LEO-and ground-based receivers. J. Geod. 2020, 94, 73. [Google Scholar] [CrossRef]
  7. Ren, X.; Zhang, X.; Schmidt, M.; Zhao, Z.; Chen, J.; Zhang, J.; Li, X. Performance of GNSS global ionospheric modeling augmented by LEO constellation. Earth Space Sci. 2019, 7, e2019EA000898. [Google Scholar] [CrossRef]
  8. Schaer, S. Activities of IGS Bias and Calibration Working Group. In IGS Technical Report 2011; Meindl, M., Dach, R., Jean, Y., Eds.; Astronomical Institute, University of Berne: Berne, Switzerland, 2012; pp. 139–154. [Google Scholar]
  9. Krankowski, A.; Shagimuratov, I.I.; Ephishov, I.I.; Krypiak-Gregorczyk, A.; Yakimova, G. The occurrence of themid-latitude ionospheric trough in GPS-TEC measurements. Adv. Space Res. 2009, 43, 1721–1731. [Google Scholar] [CrossRef]
  10. Hernández-Pajares, M.; Juan, J.M.; Sanz, J.; Aragón-Àngel, À.; García-Rigo, A.; Salazar, D.; Escudero, M. The ionosphere: Effects, GPS modeling and the benefits for space geodetic techniques. J. Geod. 2011, 85, 887–907. [Google Scholar] [CrossRef]
  11. Li, Z.; Yuan, Y.; Li, H.; Ou, J.; Huo, X. Two-step method for the determination of the differential code biases of COMPASS satellites. J. Geod. 2012, 86, 1059–1076. [Google Scholar] [CrossRef]
  12. Wang, N.; Yuan, Y.; Li, Z.; Montenbruck, O.; Tan, B. Determination of differential code biases with multi-GNSS observations. J. Geod. 2015, 90, 209–228. [Google Scholar] [CrossRef]
  13. Jin, R.; Jin, S.; Feng, G. M_DCB: Matlab code for estimating GNSS satellite and receiver differential code biases. GPS Solut. 2012, 16, 541–548. [Google Scholar] [CrossRef]
  14. Yang, Y. Concepts of comprehensive PNT and related key technologies. Acta Geod. Cartogr. Sin. 2016, 45, 505–510. (In Chinese) [Google Scholar]
  15. Yang, Y.; Mao, Y.; Ren, X.; Jia, X.; Sun, B. Demand and key technology for a LEO constellation as augmentation of satellite navigation systems. Satell. Navig. 2024, 5, 11. [Google Scholar] [CrossRef]
  16. Zhang, X.; Ma, F. Review of the development of LEO navigation-augmented GNSS. Acta Geod. Cartogr. Sin. 2019, 48, 1073–1087. [Google Scholar]
  17. Lin, J.; Yue, X.; Zhao, S. Estimation and analysis of GPS satellite DCB based on LEO observations. GPS Solut. 2014, 20, 251–258. [Google Scholar] [CrossRef]
  18. Zhong, J.; Lei, J.; Dou, X.; Yue, X. Is the long-term variation of the estimated GPS differential code biases associated with ionospheric variability? GPS Solut. 2015, 20, 313–319. [Google Scholar] [CrossRef]
  19. Wautelet, G.; Loyer, S.; Mercier, F.; Perosanz, F. Computation of GPS P1–P2 Differential Code Biases with JASON-2. GPS Solut. 2017, 21, 1619–1631. [Google Scholar] [CrossRef]
  20. Li, W.; Li, M.; Shi, C.; Fang, R.; Zhao, Q.; Meng, X.; Bai, W. GPS and BeiDou Differential Code Bias Estimation Using Fengyun-3C Satellite Onboard GNSS Observations. Remote Sens. 2017, 9, 1239. [Google Scholar] [CrossRef]
  21. Li, X.; Ma, T.; Xie, W.; Zhang, K.; Huang, J.; Ren, X. FY-3D and FY-3C onboard observations for differential code biases estimation. GPS Solut. 2019, 23, 57. [Google Scholar] [CrossRef]
  22. Zhang, X.; Tang, L. Estimation of COSMIC LEO satellite GPS receiver differential code bias. Chin. J. Geophys. 2014, 57, 377–383. (In Chinese) [Google Scholar]
  23. Zakharenkova, I.; Cherniak, I. How can GOCE and TerraSAR-X contribute to the topside ionosphere and plasmasphere research? Space Weather 2015, 13, 271–285. [Google Scholar] [CrossRef]
  24. Zhong, J.; Lei, J.; Yue, X.; Dou, X. Determination of differential code bias of GNSS receiver onboard low earth orbit satellite. IEEE Trans. Geosci. Remote Sens. 2016, 54, 4896–4905. [Google Scholar] [CrossRef]
  25. Chen, P.; Yao, Y.; Li, Q.; Yao, W. Modeling the plasmasphere based on LEO satellites onboard GPS measurements. J. Geophys. Res. Space Phys. 2017, 122, 1221–1233. [Google Scholar] [CrossRef]
  26. Ren, X.; Chen, J.; Zhang, X.; Schmidt, M.; Li, X.; Zhang, J. Mapping topside ionospheric vertical electron content from multiple LEO satellites at different orbital altitudes. J. Geod. 2020, 94, 86. [Google Scholar] [CrossRef]
  27. Liu, M.; Yuan, Y.; Huo, X.; Li, M.; Chai, Y. Simultaneous estimation of GPS P1-P2 differential code biases using low earth orbit satellites data from two different orbit heights. J. Geod. 2020, 94, 121. [Google Scholar] [CrossRef]
  28. Zhong, J.; Lei, J.; Dou, X.; Yue, X. Assessment of vertical TEC mapping functions for space-based GNSS observations. GPS Solut. 2015, 20, 353–362. [Google Scholar] [CrossRef]
  29. Foelsche, U.; Kirchengast, G. A simple “geometric” mapping function for the hydrostatic delay at radio frequencies and assessment of its performance. Geophys. Res. Lett. 2002, 29, 111-1–111-4. [Google Scholar] [CrossRef]
  30. Jäggi, A.; Hugentobler, U.; Beutler, G. Pseudo-Stochastic Orbit Modeling Techniques for Low-Earth Orbiters. J. Geod. 2006, 80, 47–60. [Google Scholar] [CrossRef]
  31. Kang, Z.; Tapley, B.; Bettadpur, S.; Ries, J.; Nagel, P.; Pastor, R. Precise orbit determination for the GRACE mission using only GPS data. J. Geod. 2006, 80, 322–331. [Google Scholar] [CrossRef]
  32. Montenbruck, O.; Hauschild, A.; Steigenberger, P. Diferential code bias estimation using Multi-GNSS observations and global ionosphere maps. Navigation 2014, 61, 191–201. [Google Scholar] [CrossRef]
  33. Yue, X.; Schreiner, W.S.; Hunt, D.C.; Rocken, C.; Kuo, Y.H. Quantitative evaluation of the low Earth orbit satellite based slant total electron content determination. Space Weather 2011, 9, S09001. [Google Scholar] [CrossRef]
  34. Cerri, L.; Berthias, J.P.; Bertiger, W.I.; Haines, B.J.; Lemoine, F.G.; Mercier, F.; Ries, J.C.; Willis, P.; Zelensky, N.P.; Ziebart, M. Precision Orbit Determination Standards for the Jason Series of Altimeter Missions. Mar. Geod. 2010, 33, 379–418. [Google Scholar] [CrossRef]
  35. Klobuchar, J.A. A First-Order World-Wide Ionospheric Time-Delay Algorithm; Air Force Cambridge Research Labs: Bedford, MA, USA, 1975; No. 324. [Google Scholar]
  36. IGS. IGS Technical Report 2011; Astronomical Institute, University of Berne: Berne, Switzerland, 2012. [Google Scholar]
  37. Wang, Y.; Liu, M.; Yuan, Y.; Wang, G.; Geng, H. Effects of topside ionosphere modeling parameters on differential code bias (DCB) estimation using LEO satellite observations. Remote Sens. 2023, 15, 5335. [Google Scholar] [CrossRef]
  38. Sanz, J.; Miguel-Juan, J.; Rovira-Garcia, A.; Gonza’lez-Casado, G. GPS differential code biases determination: Methodology and analysis. GPS Solut. 2017, 21, 1549–1561. [Google Scholar] [CrossRef]
  39. Bilitza, D.; Altadill, D.; Truhlik, V.; Shubin, I.; Galkin, I.; Reinisch, B.; Huang, X. International Reference Ionosphere 2016: From ionospheric climate to real-time weather predictions. Space Weather 2017, 15, 418–429. [Google Scholar] [CrossRef]
  40. Huang, Y.N.; Cheng, K. Solar cycle variations of the equatorial ionospheric anomaly in total electron content in Asian region. J. Geophys. Res. 1996, 101, 24513–24520. [Google Scholar] [CrossRef]
  41. Zhong, J.; Lei, J.; Wang, W.; Burns, A.G.; Yue, X.; Dou, X. Longitudinal variations of topside ionospheric and plasmaspheric TEC. J. Geophys. Res. 2017, 122, 6737–6760. [Google Scholar] [CrossRef]
  42. Zhao, X.; Ning, B.; Zhang, M.; Hu, L. Comparison of the Ionospheric F2 Peak Height Between Ionosonde Measurements and IRI2016 Predictions over China. Adv. Space Res. 2017, 60, 1524–1531. [Google Scholar] [CrossRef]
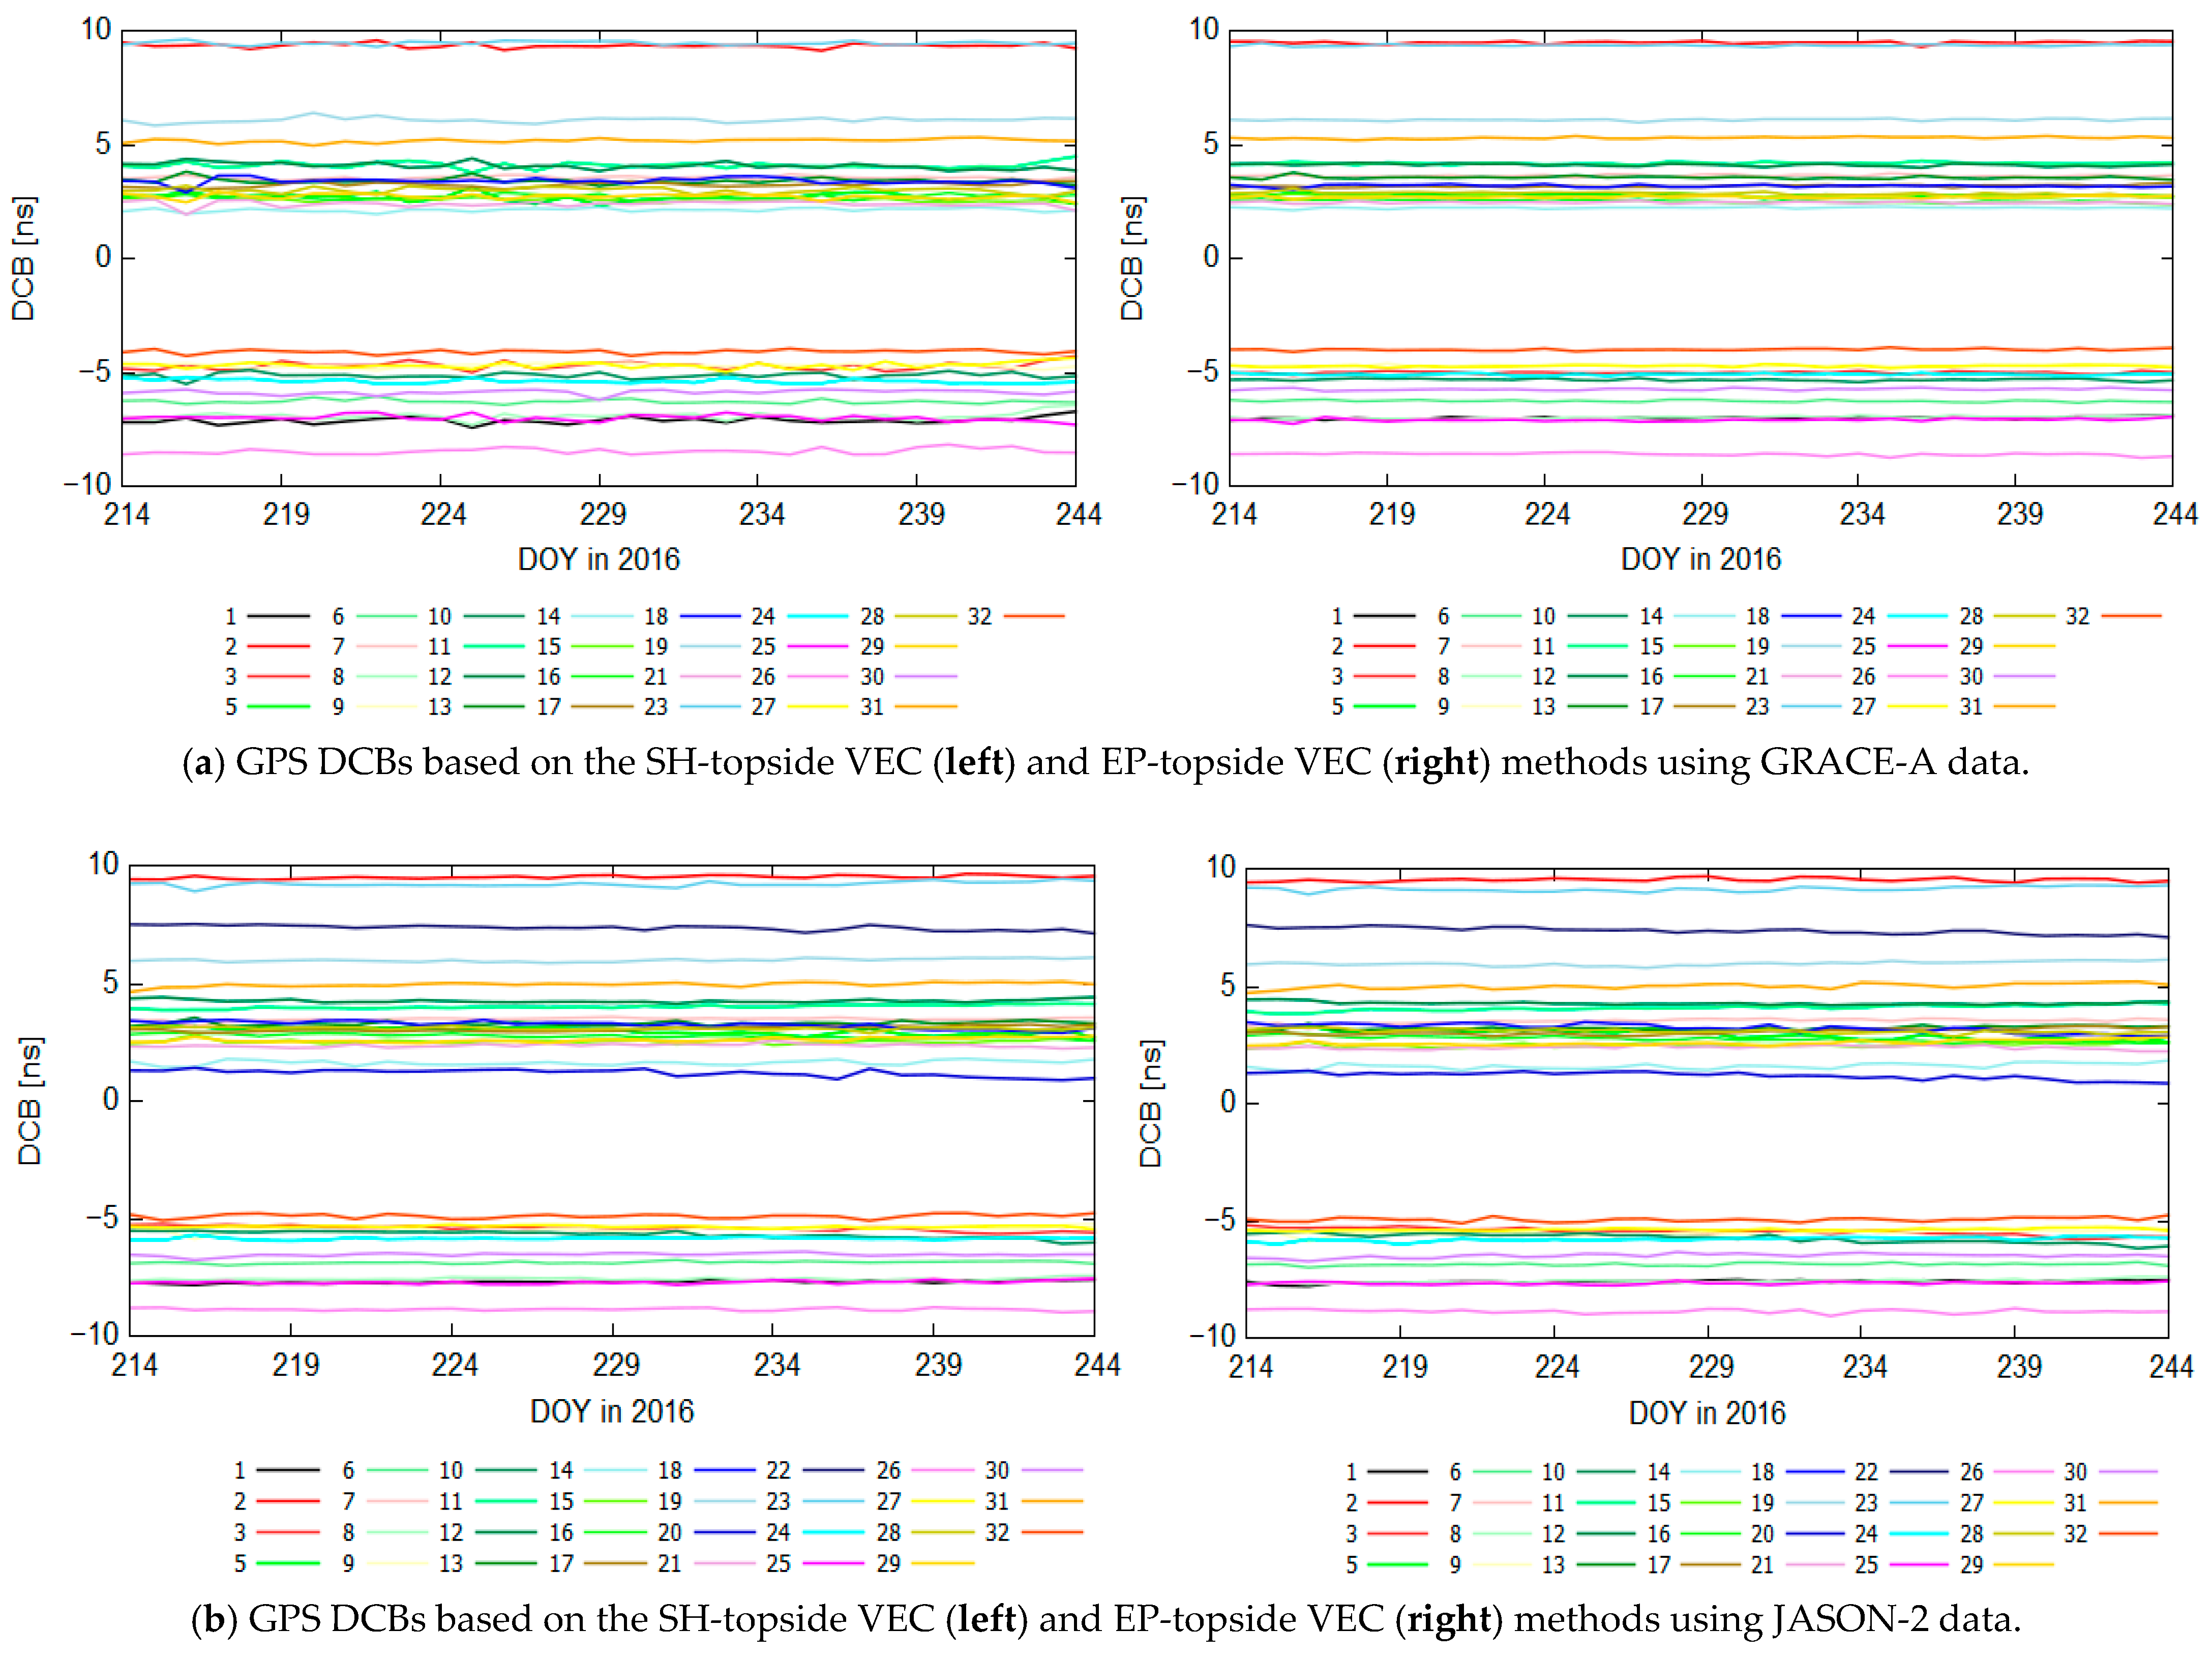
Figure 1. Daily GPS DCB estimates using GRACE-A and JASON-2 data during August 2016. (a) Represents the daily GPS DCBs based on the two modeling methods using GRACE-A data, respectively; (b) denotes the GPS DCBs with the two methods using JASON-2 data, respectively.
Remotesensing 17 03550 g001
Figure 2. Monthly stability of GPS DCBs based on the SH-topside VEC and EP-topside VEC solutions during August 2016. The blue and pink columns represent the monthly stability obtained from the two solutions, respectively.
Remotesensing 17 03550 g002
Figure 3. Mean and STD results of the difference between GPS DCB estimates and CODE products using data from GRACE-A and JASON-2 satellites during August 2016. Green and purple dots denote the SH-topside VEC and EP-topside VEC methods, respectively.
Remotesensing 17 03550 g003
Figure 4. RMS results of the difference between GPS DCB estimates and CODE products using data from two LEO satellites during August 2016. Green and purple dots denote the SH-topside VEC and EP-topside VEC methods, respectively.
Remotesensing 17 03550 g004
Figure 5. Time series of two LEO onboard receiver DCBs during August 2016. The blue and pink lines represent the LEO receiver DCBs using the SH-topside VEC and EP-topside VEC methods, respectively.
Remotesensing 17 03550 g005
Figure 6. LEO-based topside VEC scatter distribution using the SH-topside VEC method for GRACE-A (left) and JASON-2 (right) during August 2016, considering the local time as the x-axis.
Remotesensing 17 03550 g006
Figure 7. LEO-based topside VEC scatter distribution using the EP-topside VEC method for GRACE-A (left) and JASON-2 (right) during August 2016, considering the local time as the x-axis.
Remotesensing 17 03550 g007
Figure 8. CODE Global Ionosphere Map (GIM) on DOY 214 in 2016 (unit: TECU).
Remotesensing 17 03550 g008
Figure 9. GRACE-A-based GIM on DOY 214 in 2016 (unit: TECU).
Remotesensing 17 03550 g009
Figure 10. JASON-2-based GIM on DOY 214 in 2016 (unit: TECU).
Remotesensing 17 03550 g010
Figure 11. STD for differences between the summed TEC of the LEO-based topside VEC and International Reference Ionosphere (IRI) 2016 model, and the CODE GIM, using GRACE-A and JASON-2 data during August 2016. The blue and green dots represent the STDs of differences using the SH-topside VEC and EP-topside VEC methods, respectively.
Remotesensing 17 03550 g011
Table 1. Estimation strategies based on low-earth-orbit (LEO) satellites data.
Option/ParameterSelection/Description
Data preprocessing
ObservationsCode and phase observations of the ionosphere-free combination
Data interval10 s
Satellite ephemeris and clockCenter for Orbit Determination in Europe (CODE) precise products
Cut-off elevation angle
Attitude
GPS antenna phase center (APC)
Attitude files
Corrected
LEO receiver APCCorrected
LEO receiver clocksEstimated
LEO satellite orbitsIntroduced as priori orbits, calculated by reduced dynamic
precision orbit determination
Screening solutionsResiduals and root mean square (RMS) screening iteratively
Differential code bias (DCB)
estimation
ObservationsCode observations of the geometry-free (GF) combination
Cut-off elevation angle
Data interval
15°
30 s
GPS satellite DCBsDaily constants for P1–P2
LEO receiver DCBsDaily constants for P1–P2
Mapping function+F&K + EP-topside VEC: F&K function + epoch parameters in daily solution
Vertical electron content (VEC)F&K + SH-topside VEC: F&K function+ spherical harmonic modeling:
degree and order of 8, dynamic parameter spacing of 4 h
DatumZero-mean condition for all observation satellite DCBs
Table 2. Monthly stability (STD) statistics of GPS DCBs (in ns) using the SH-topside VEC and EP-topside VEC methods using two LEO datasets.
LEOSH-Topside VECEP-Topside VEC
GRACE-A0.117
0.114
0.050
0.131
JASON-2
Table 3. RMS statistics of GPS DCBs (in ns) using the SH-topside VEC and EP-topside VEC methods using two LEO datasets.
LEOSH-Topside VECEP-Topside VEC
GRACE-A0.219
0.241
0.221
0.256
JASON-2
Table 4. Mean values and STD statistics for two LEO receiver DCBs using the two methods [ns].
ReceiverSH-Topside VECEP-Topside VEC
MeanSTDMeanSTD
GRACE-A−20.7930.138−20.2260.065
JASON-2−3.4460.078−3.4120.075
Disclaimer/Publisher’s Note: The statements, opinions and data contained in all publications are solely those of the individual author(s) and contributor(s) and not of MDPI and/or the editor(s). MDPI and/or the editor(s) disclaim responsibility for any injury to people or property resulting from any ideas, methods, instructions or products referred to in the content.