Highlights
What are the main findings?
- We identified a ~150 km-long surface rupture with an estimated magnitude of about Mw 7.6 along the Tanlu Fault in Northeast China.
- The time range of the latest paleo-earthquake event determined by multiple new trenches is longer than 2000 years for the newly identified rupture.
What is the implication of the main finding?
- Expands the traditional view of the history of the Tanlu Fault’s segmented faulting since the Holocene.
- Be aware of the urgency of strong earthquakes that may be triggered via Coulomb stress triggering of far-field repeated great earthquakes in weak tectonic activity areas.
Abstract
Quantitative investigation of major fault zones with low slip rates and long recurrence intervals in densely populated regions is essential for understanding earthquake recurrence and assessing seismic hazard. The Tanlu Fault Zone, a major lithospheric boundary extending from eastern China into Russia, provides a key case study. Through remote sensing interpretation integrated with seismic-geological evidence, we identified a ~150 km-long fresh surface rupture zone along the Yilan–Yitong Fault in the Fangzheng–Tangyuan region of Heilongjiang Province, NE China. Chronological constraints from previous and recent trenching indicate that the most recent event occurred in the late Holocene, with an estimated magnitude of Mw ≈ 7.6, comparable to the scale of AD 1668 Tancheng earthquake in North China. The northeastern section of the Tanlu Fault Zone is also subject to long-term far-field Coulomb stress loading from subduction of the Pacific Plate beneath the Eurasian Plate. Although the fault exhibits long recurrence intervals, the urgency of future strong earthquakes cannot be overlooked. Furthermore, our results suggest that the northeastern Tanlu Fault Zone is characterized by segmentation, underscoring the need for refined paleoseismic investigations to constrain recurrence behavior and seismic hazard in Northeast China.
1. Introduction
The primary objective of quantitative research on active faults is to investigate slip rates and patterns of major earthquake ruptures through the integrated application of multiple techniques, thereby assessing the future seismogenic potential of active faulting [1,2,3,4,5,6,7,8,9]. For active faults with high slip rates—such as plate boundary faults (e.g., the San Andreas Fault zone) [9,10,11,12] or active block boundary faults (e.g., the Haiyuan and Altyn Tagh fault zones) [5,13]—future seismic hazards can be reliably estimated using paleoseismic records and average recurrence intervals, even by GNSS [4,14,15]. In contrast, those less-active faults with lower slip rates pose greater challenges and uncertainties [8,16,17]. Their long recurrence intervals result in limited historical records, yet the earthquakes they generate can cause devastating impacts [3,18,19]. For instance, before the year 2008, the epicenter was considered a low-hazard area; however, the Mw = 7.9 Wenchuan earthquake produced a ~240 km coseismic surface rupture along the Longmenshan fault zone and caused catastrophic losses [3]. Consequently, detailed investigations of low slip rate boundary faults, particularly those situated near densely populated urban areas, are essential to constrain their segmentation patterns and recurrence intervals of strong earthquakes.
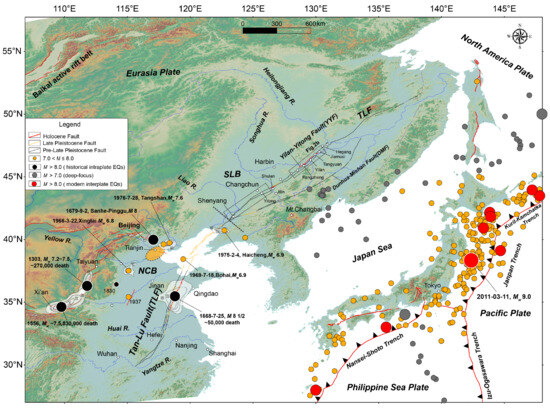
Figure 1.
Tectonic setting of the Tan-Lu Fault zone (TLF) in Northeast Asia. The Yilan-Yitong Fault (YYF) and the Dunhua-Mishan Fault (DMF) are the two main branches of TLF in northeast China. Both YYF and DMF have no recorded history of strong earthquakes due to their limited population distribution. However, since 2011, clear evidence of Holocene activity of YYF has been discovered in Fangzheng County and nearby regions [20,21]. Subsequently, in-depth research on earthquake geology has gradually increased [21,22,23,24,25,26,27]. The DMF controls the distribution of deep-source earthquakes in mainland China. The North China section of the TLF Zone experienced a strong earthquake of ~M8.0 in 1668 AD, resulting in over 50,000 deaths. The Bohai Bay segment of TLF, which intersects with the Zhangjiakou-Bohai Seismic Zone (ZBSZ), has historically experienced numerous strong earthquakes within the sea. The red line along the TLF shows the confirmed activity during the Holocene. Note that YYF and DMF are the segments closest to the strong earthquakes (i.e., 11 March 2011, Tohoku-Oki earthquake with moment magnitude of Mw = 9.0) of the plate boundary between the northwest Pacific and North American plates, so they are also more obviously affected by the Kunlun stress effect of far-field strong earthquakes [6,28].
The Tanlu (Tancheng-Lujiang) Fault Zone (TLF) is a central boundary fault system located in the densely populated and economically developed eastern region of China (Figure 1). It forms a first-order tectonic boundary between the Northeast Asia Active Block and the North China Block, extending northeastward into Russia [8,28,29,30,31]. Within China, it runs approximately 2400 km in a northeast–southwest direction, from Wuxue City (formerly known as Guangji County), east of Wuhan City, Hubei Province, to Luobei County, north of Hegang City, Heilongjiang Province. The Zhangjiakou–Bohai Seismic Zone (ZBSZ) divides it into two segments: the Northeast China section and the North China section [32,33,34,35].
The TLF has experienced episodes of strike-slip, normal-slip, and compressional faulting [1,36,37,38], although its present slip rate is relatively low [2,24]. The distribution of large earthquakes along the fault zone is highly heterogeneous. The North China section has produced the Anqiu earthquake (M = 7.0, 70 BC) and the Tancheng earthquake (M = 8.5, 1668), while the Bohai Bay area, where the fault intersects the ZBSZ, has hosted multiple strong offshore earthquakes. By contrast, the Northeast China section has experienced only a limited number of moderate events (M < 6) in the past 120 years, leading some Chinese scholars to assume the absence of active faults in this region initially [38].
The northeastern segment of the TLF comprises the Yilan–Yitong Fault (YYF) in the north and the Dunhua–Mishan Fault (DMF) in the south. The latter controls the spatial distribution of deep-focus earthquakes in Northeast China (Figure 1). Since the discovery of a ~70 km-long Holocene surface rupture near Fangzheng County on the YYF [20,21,22,23,24,25,26], multiple additional Holocene-active fault traces have been identified along YYF, including rupture segments near Shulan City, Shangzhi City, and Tangyuan County (Figure 1). These findings demonstrate that previously unrecognized portions of the YYF remain seismically active. With the growing evidence for Holocene activity, reassessing the seismic potential of the Tanlu Fault Zone has become increasingly urgent. A key step in this process is the quantitative evaluation of rupture dimensions along individual fault segments, which directly constrains estimates of their seismogenic risk.
This study examines whether the Fangzheng–Yilan Holocene rupture zone extends northeastward. Through a combination of remote sensing interpretation and trench investigations, we determine the minimum rupture length of the YYF (may be buried for some sections but still active in the near future), establish the timing of its most recent paleo-earthquake event, and assess its potential risk based on estimation by moment magnitude calculation [39,40]. The results provide new insights into the seismic hazard of the YYF and contribute to more robust seismic risk assessments for Northeast China.
2. Geological Setting
The Tan-Lu Fault (TLF) is the longest fault zone in eastern China (Figure 1). Its southern end extends from Wuxue City on the left bank of the Yangtze River, trending northward through Anhui Province (the capital city of Hefei is adjacent to TLF), Jiangsu Province, Shandong Province, and Bohai Bay, before continuing into Liaoning Province, Jilin Province, and Heilongjiang Province, the three provincial capitals are all close to TLF, and the fault passes directly through the Shenyang City (Figure 2) [1,41]. TLF extends for approximately 2400 km, with a general northeast orientation [37,42]. The TLF experienced large-scale sinistral strike-slip motion during the Late Mesozoic. From the Late Cretaceous to the Early Tertiary, the fault zone underwent intense extensional deformation, producing a structural pattern of “horsts sandwiched between two grabens” in the west–east direction [37,43,44]. Since the Late Quaternary, the fault has been characterized by right-lateral strike-slip movement, accompanied by a minor thrust component.
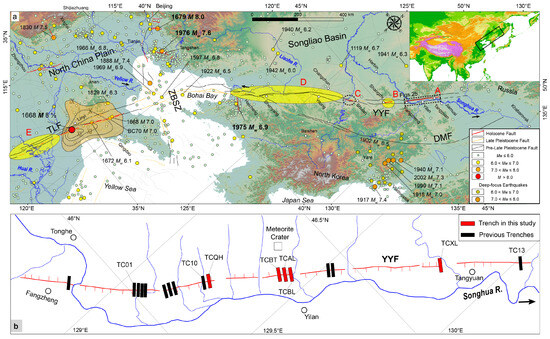
Figure 2.
(a) Simplified distribution map of the TLF (the part located in China). The relatively continuous Holocene active fault segments (marked as A–C) found in the northeastern section of the TLF are situated in northeast Jilin Province and Heilongjiang Province. However, the longer stretch from Shenyang City to Changchun (marked as D) shows no clear evidence of recent activity. The North China section of the TLF also contains localized earthquake-deficient gaps (marked as E) [33]. Note that the continuous rupture segment A studied in this paper is comparable in scale to the coseismic surface rupture zone of the 1668 earthquake in the Shandong section of the TLF [38]. (b) The distribution of linear scarps and the spatial locations of the main excavated trenches along the extension of the YYF from Fangzheng County to Tangyuan County. The black rectangles represent excavations by previous researchers [21,22,23,24,25,26,27], the black arrow showing the river direction of Songhua River.
In North China, Holocene activity of the TLF has been mainly concentrated within the eastern graben, where the newly active fault, named F5, corresponds to the coseismic surface rupture of the 1668 Tancheng earthquake. Estimates of the surface rupture length vary considerably, with the maximum reaching ~230 km [43,44,45], while other studies suggest values of 130–160 km [46].
During the Early Cretaceous, tectonic processes of TLF propagated northeastward into Northeast Asia, leading to the development of the Yilan–Yitong Fault (YYF) [1,37,47]. Geophysical exploration profiles indicate that the YYF extends as a lithospheric-scale structure, cutting through both the crust and upper mantle, whereas the DMF shows a less pronounced deep continuation. Consequently, the YYF is considered to play a dominant role [18,29].
YYF is located to the east of the Songliao Basin, and is mainly composed of two parallel branch faults, which control the formation of the Yilan–Yitong Graben system (YYG). A series of narrow graben are aligned along YYF. From northeast to southwest, the principal grabens include the Tangyuan graben, Fangzheng graben, Shulan graben, and Yitong graben [36]. The Fangzheng Graben comprises a thick Paleogene sedimentary sequence, with a thickness of 4–5 km [20,48,49]. Petroleum geophysical data and cross-sectional interpretations reveal that two major border faults bind the Fangzheng Graben. Then, a newborn fault named Yihantong Fault within the graben controls the sedimentary filling and divides the graben into two depressions [15,36]. The surface of Fangzheng Graben is presently covered by a less than 100-m-thick sequence of Quaternary gravels and sandy clays.
3. Methods and Data
We employed high-resolution optical imagery from Chinese satellites, including GF-1 (2 m), GF-2 (1 m), and GF-6 (2 m), acquired between 2014 and 2019, to systematically interpret the fault lineaments of YYF from Fangzheng County to Tangyuan County. To enhance interpretive accuracy, we preferentially selected images obtained after winter snowfall. Snow cover effectively masks non-tectonic linear features, thereby improving fault scarp recognition. Historical imagery from Google Earth (GE), local aerial photographs from the 1950s to 1960s, and USGS Keyhole imagery from the 1960s to 1970s were also consulted to verify key sites. Temporal comparisons across different datasets proved essential for confirming the presence and continuity of fault scarps.
Because the Songhuajiang River and other numerous tributaries traverse the YYF, where floodplains and low terraces are heavily modified by fluvial erosion and local agricultural activities, an integrated multi-source interpretation approach was adopted. At trench excavation sites and critical geomorphic locations, drone-based surveys (UAV, Unmanned Aerial Vehicle, DJI Matrice 4E) were conducted to acquire centimeter-scale orthophotos and digital elevation models (DEMs), which enabled precise measurement of scarp heights.
We excavated or cleared five trenches across locations where linear scarps were most prominent (Figure 2b). Chronological constraints on the most recent surface-rupturing events were obtained from three of these trenches [5,49]. Excavations were conducted perpendicular to the fault trace, utilizing a combination of mechanical digging, manual cleaning, and leveling. Stratigraphic relationships and fault planes exposed within the trenches were documented through detailed field photography, sketching, and on-site interpretation. Dating samples were collected from trenches to constrain the age of the stratigraphic sequence and to obtain a more precisely defined age range for earthquake events. Thirty AMS-14C were processed and tested in Beta Analytic Inc. in the USA (Table 1). Calibration of radiocarbon ages was conducted using Oxcal v4.3.2 with the IntCal 09 atmospheric model.

Table 1.
List of dating ages of AMS-14C samples from trenches along the YYF in this study.
4. Results
4.1. Remote Sensing Interpretation of Linear Landform Scarps
Building upon the previously reported ~70 km linear geomorphic scarp within the Fangzheng Graben [20,26], we reveal a relatively continuous scarp extending northeastward from Xinxing Reservoir (46.164325°N, 129.226789°E) for more than 80 km (Figure 2b). This feature originates at a break point southwest of Fangzheng County and terminates northeast of Tangyuan County, yielding a cumulative length of interpreted linear scarps exceeding 160 km (Figure 3). These scarps are situated within the Fangzheng and Tangyuan grabens, predominantly developed on multiple terrace levels along the left bank of the Songhua River, and locally traversing the floodplains of its tributaries.
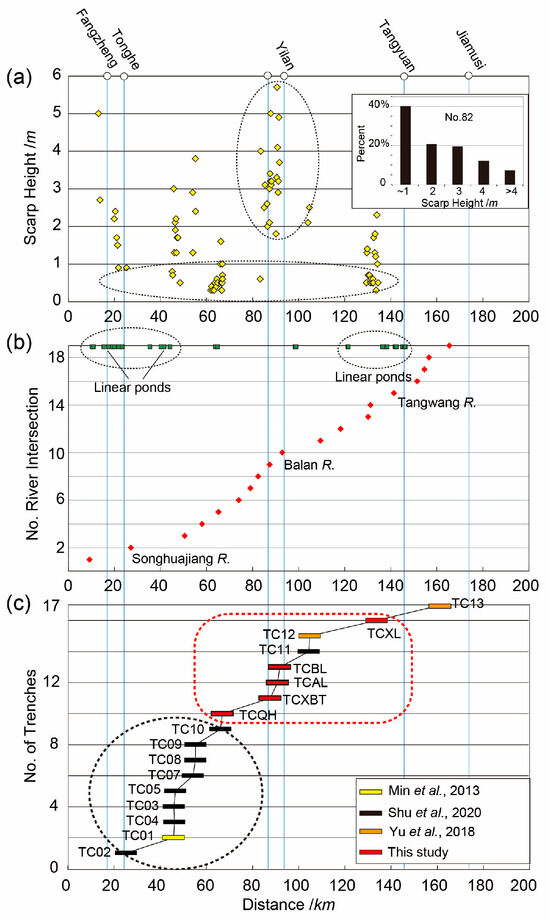
Figure 3.
(a) Heights of 82 scarps on the YYF from Fangzheng County to Tangyuan County, obtained using UAV DEM. The statistical interval in the upper right corner indicates that over 60% of the scarps are less than 2 m high, suggesting that the height of the linear scarps, primarily located on the low terraces on the left bank of the Songhuajiang River, is predominantly less than 2 m high, which, induced by the coseismic scarps located at floodplain and low terraces, may be easily reshaped by river erosion. (b) The intersection of the fault with the Songhua River mainstream and its tributaries along the fault zone (red dots) is shown, along with the distribution of linear, string-like lakes (blue squares) along the YYF. (c) The distribution of trenches excavated in this study and by previous Chinese scholars along the YYF [21,22,23,26]. The figure shows that the five trenches excavated and/or cleared in this study cover the northeast segment of the Yilan-Tangyuan fault traces.
The southwestern termination of the linear scarp is located at the confluence of the Songhuajiang River and its tributaries on the right bank, where it appears as a surface scarp approximately 0.5 m in height [25,26]. A chain of lakes is distributed along this interpreted trace of scarps, which dips to the northwest; Fangzheng Lake in Fangzheng County is a representative example (Figure 3b). After crossing the Songhuajiang River northeastward, the interpreted fault trace is expressed as a ~1 m-high scarp on the first terrace, dipping to the southeast (Figure 2b). Multiple trenches excavated in this segment between 2010 and 2014 (Figure 2b, black rectangle) [20,21,22,25,26] confirmed that the surface scarp corresponds to fault breakpoints exposed in the trench logs. From Xinxing Reservoir to the northwest of Yilan County, the scarp again dips northwest (Figure 4a). Four trenches were excavated in this segment in this paper; three of them provided systematic chronological constraints on the most recent paleoseismic events (Figure 4b).
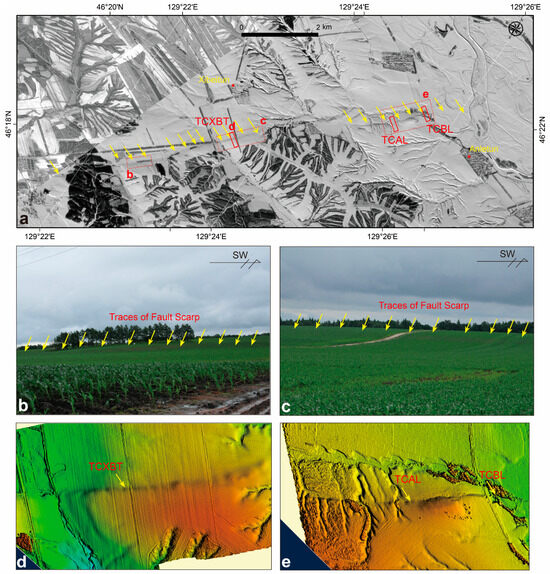
Figure 4.
(a) GF-1 satellite imagery acquired after snowfall at high latitudes clearly reveals a linear scarp along the traces of YYF near Xibeitun village (indicated by the yellow arrow); red rectangle shows the location of trenches in this study. See location at Figure 2b. The linear scarp extends along different terraces on the left bank of the Songhuajiang River, with the scarp trending northwest and striking Northeast. The linear scarp is also clearly visible on the floodplain of a Songhuajiang River tributary, indicating its Holocene activity. (b,c) Field photographs show the continuity of the scarp with several meters of vertical height. (d,e) The linear scarp via UAV-DEM; the yellow arrows show the locations of trenches in this study.
Between Yilan County and Xianglan Township, the linear scarps are predominantly developed on the floodplain of a Songhuajiang River tributary (Figure 5a), where they have low relief and dip southeastward. Near Xianglan Township, local changes in scarp morphology are evident, and trenching along the right bank of the Tangwang River (a primary tributary to Songhuajiang River) confirmed surface faulting of the overlying strata (Figure 5b). Northeast of Tangyuan County, the scarps decrease in height. They are associated with a linear array of beaded lakes [22,23]. Trenching results reported by [22,23,24] further corroborate the correspondence between these scarps and fault exposures in profile (Figure 6).
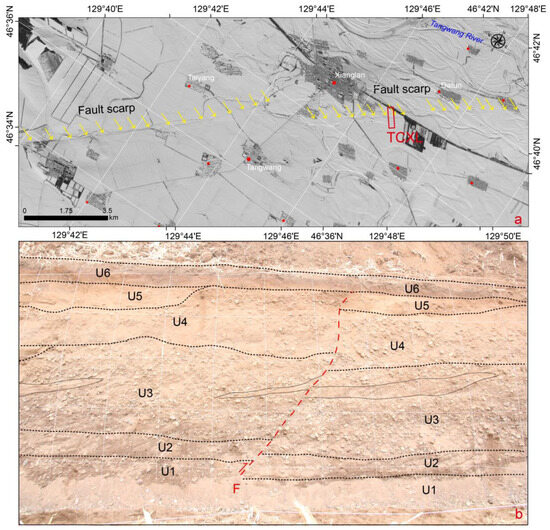
Figure 5.
(a) The fault trace between Yilan County and Tangyuan County is clearly visible on GF-1 satellite imagery after snowfall. Near Xianglan Township, the fault crosses the floodplain and low terraces of the Tangwang River (a major tributary of the Songhua River on the left bank), with a relatively consistent linear extension, indicating YYF with faulting activity in this section during the Holocene. See location at Figure 2b. (b) A section of a trench (designated TCXL) excavated along the right bank of the Tangwang River shows thrust faulting within the Holocene alluvial gravel layer. The offset is slight, approximately 20 cm, and the fault trace extends to the near-surface.
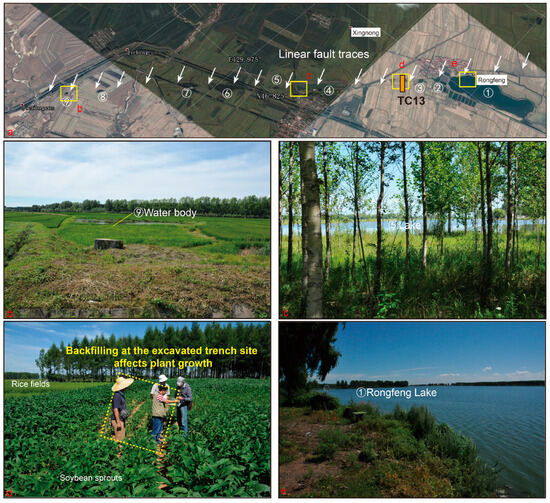
Figure 6.
(a) The linear extension of YYF at the northeastern Tangyuan County is characterized by a series of small lakes (numbered 1–9), which is similar to that observed near the Fangzheng segment of the YYF [21]. (b,c,e) Field photographs of lakes at different locations along YYF. (d) The significant difference in the local soybean growth between the natural soil and at the trench site after backfilling [22,23,24].
Our current measurements using a local high-resolution DEM indicate that approximately 40% of the scarps are less than 1 m high, and 60% of the geomorphic scarps are less than 2 m high (Figure 3a and Figure 4d,e). The interpreted fault scarps have undergone dual transformation due to river erosion and local planting over the past 100 years, resulting in a gentler slope (Figure 4b,c). The interpreted fault scarps are positionally consistent with the fault profiles interpreted from 3D seismic profiles [36]. This suggests that our interpretation, despite the variations in the dip of the scarps at different intervals, may reflect the localized deformation characteristics of current thrust-dominated activities.
4.2. Trenches Interpretation
4.2.1. Qinghe Trench (TCQH)
The Qinghe Trench (TCQH) (46.175351°N, 129.246225°E) is located ~600 m north of Xinxing Reservoir, on a fault scarp dipping northwest beneath the original forest cover (Figure 2b). Following land clearance for modern agriculture (primarily soybean and corn), the scarp became more visible. Post-snowfall satellite imagery revealed a continuous ~300 m-long surface trace, directly connected to the ~70 km rupture segment interpreted by [21]. Despite agricultural modification of the upper soil, the original scarp morphology is relatively well preserved.
The Trench TCQH was excavated perpendicular to the fault, extending ~20 m in length, 6 m in width, and 5 m in depth. Both walls expose major and subsidiary fault strands that reach the near-surface. Given the focus of this study on the timing of the most recent Holocene earthquake, only the middle and upper sections of the south wall are described in detail (Figure 7). The stratigraphy primarily consists of modern soils, residual slope deposits, and weathered bedrock. It can be subdivided into five units (Units U1–U5, from top to base). Unit U1 is a gray-black soil horizon with a 30–50 cm thick cultivated layer at the surface. It is not displaced by faulting. Unit U2 is a reddish-brown silt–clay horizon (~60 cm thick), free of gravel. The base of U2 is displaced by the main fault (F1). Unit U3, a gray-black sandy clay (~50 cm thick), is displaced across F1 with ~2.3 m of reverse offset, expressed as the east-side of Unit U3 overthrusting the west-side of Unit U3. Unit U4 is a sandy clay horizon 0.8–1.2 m thick, showing numerous fractures and small offsets across F1. Unit U5 forms the basal deposits of the exposure, thickening eastward and incompletely exposed to the west side. The base of fault F1 is not visible. This unit consists of swamp-derived muds and sands that are highly deformed by folding and faulting, with local bedding overturned to near-vertical orientations. Four subsidiary faults disrupt Unit U5, although only F1 propagates upward to offset the base of Unit U4.
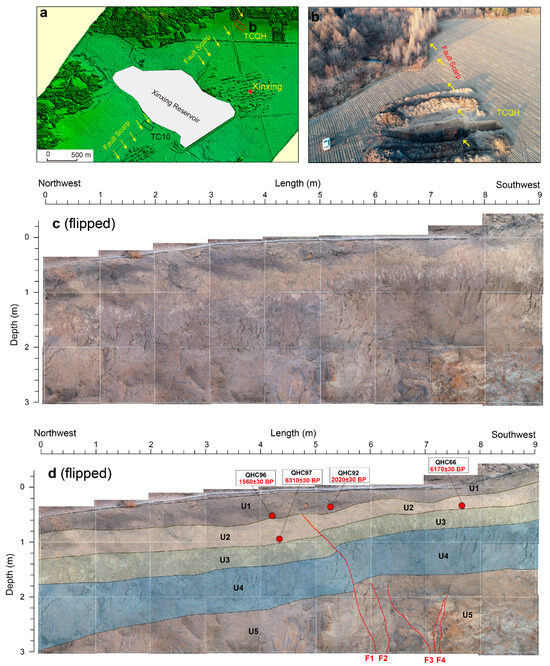
Figure 7.
UAV-DEM showing the clear linear fault scarp connecting the previous study around Xinxing Reservoir (a), Trench of TCQH crossing the scarp (b), original photo mosaic (c) (flipped), and interpretation results (d) (flipped) of a trench (No. TCQH) section excavated along the fault scarp at Xinxing Village, Qinghe Township (46.175351°N, 129.246225°E). The trench of TCQH located northeast of the Trench of TC10 excavated by [25] serves as a key trench for establishing the consistency of late Holocene activity of the YYF around Fangzheng County with that of Yilan and Tangyuan Counties. Four AMS-14C samples near the surface sedimentary layers of the trench log confirm the latest activity event in the late Holocene.
Nowadays cultivation typically disturbs only the upper ~30 cm of soil. At F1, however, U1 thickens to 40–60 cm, suggesting that the lower part of Unit U1 is unaffected by recent human activity. Accordingly, the age of the undeformed base of U1 provides the youngest constraint on the most recent surface-rupturing earthquake. Units U2–U5 all exhibit varying degrees of thrust displacement along F1, but the offsets are comparatively minor. Thus, the age of the base of Unit U2 provides a maximum constraint for the latest event, while the top of U2 would provide a tighter bound.
AMS-14C samples QHC96 and QHC92, collected from either side of F1 at the base of Unit U1, yielded Late Holocene ages of 1560 ± 30 BP and 2020 ± 30 BP (Table 1), respectively. Samples QHC97 and QHC66, taken from the base of U2, produced ages of 6310 ± 30 BP and 6170 ± 30 BP (Table 1). These results indicate that U2 was deposited during the middle Holocene, and that the most recent earthquake occurred close to the top of Unit U2, with an age approaching that of QHC92 (Figure 7d).
4.2.2. Xibeitun Trench (TCXBT)
The Trench TCXBT (46.326129°N, 129.392496°E) is located on a linear fault scarp southeast of Xibeitun Village, Songhuajiang Farm (Figure 4a). The scarp dips to the NW, displaying a series of fine ridges along its strike, with a maximum height difference of ~7 m. In November 2018, a trench ~40 m long was excavated perpendicular to the fault strike, exposing a deformation zone ~6 m wide (Figure 8). Before cultivation, this area consisted of low-mountain forestland. Although the original forest was later cleared, subsequent mechanized agricultural practices have not significantly disturbed the near-surface soils, such as those in Trench TCQH. Thus, the stratigraphy at TCXBT reliably records the Late Quaternary history of faulting.
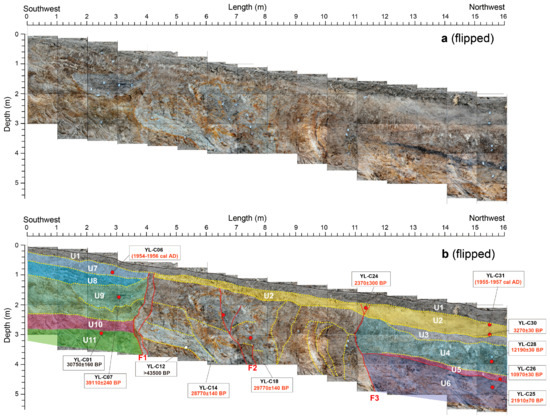
The interpreted TCXBT trench profile is 16 m in length (Figure 8), while the actual trenching job has a length of ~40 m, a 4 m opening, and a depth of ~3.5 m. Since this paper focuses on the distribution of linear scarps and the identification of recent paleoseismic events, only the north wall of the trench is described in detail here (Figure 8). Within a 6 m zone bounded by faults F1 and F3, the strata are strongly deformed, steep, and poorly stratified, with only the main boundaries below Unit U2 clearly distinguishable. On the right side of F3, the strata can be subdivided into six Units (U1–U6). Unit U1 is a 40–60 cm thick surface soil horizon, gray-black in color, containing sand and fine gravel, with a dense vegetation root system. Remnants of cultivated crops (corn leaves, roots) and natural rhizomes (e.g., reeds) are preserved. Unit U2 is a gray to gray-brown silt layer with variable thickness (40–80 cm), containing scattered plant roots. F3 faults the unit. Unit U3 is a localized brown lens, 20–40 cm thick, confined to the right side of the profile. It does not contact the main faults. Unit U4 is a gray-black unit, 0.8–1.3 m thick, composed of blocky, frost-shattered soil likely related to periglacial processes of the Last Glacial period. Unit U5 is a black, lens-shaped, organic-rich muddy deposit, 0.05–0.2 m thick (locally >0.3 m). Its geometry suggests deposition in a localized pond or swamp northwest of the trench, subsequently tilted and uplifted by tectonic activity. Unit U6 is a yellowish-brown to gray-white deformed stratum, at least 1.5 m thick, with tilted bedding indicating modification by faulting. On the left side of F1, six Units (U7–U11) can be identified beneath Unit U1. Their bedding is nearly horizontal, showing limited tectonic disturbance, except for the lenticular Unit U9 layer. F1 displaces all six units. Three major faults—F1, F2, and F3—are exposed in the section. F1 and F3 bound the fault-affected zone, while F2 is developed within it. Both F1 and F2 displace the U2 layer, which is overlain by the Unit U1 horizon, thereby constraining the most recent surface-rupturing event to the interval between the deposition of Units U2 and U1.
We got two AMS-14C samples from U2 yielded ages of 1955–1957 cal AD (YL-C31, top of U2, also base of Unit U1) and 3270 ± 30 BP (YL-C30, base of U1) (Table 1). Another sample from Unit U2 near F3 (YL-C24) yielded an age of 2370 ± 300 BP, suggesting that YL-C31 was contaminated by modern carbon and that Unit U2 is younger than YL-C24. Samples from U4–U6 (YL-C28, YL-C26, YL-C25) yielded Late Pleistocene ages (Table 1). A sample from Unit U7 (YL-C06) may also have been contaminated by modern carbon, whereas samples from Unit U9 and Unit U11 yielded older ages consistent with the strata near F2. These results indicate that strata on the left side of F3 are generally older, while those on the right side preserve a more complete and undisturbed depositional sequence, better recording seismic events. Taken together, the dating results suggest that the most recent surface-rupturing earthquake recorded at TCXBT occurred after 2370 ± 30 BP (Figure 8).
4.2.3. Anle Trench (TCAL)
The Anle Trench (TCAL) (46.351685°N, 129.422448°E) is located approximately 5 km northeast of the Xibeitun Trench TCXBT (Figure 4a). It lies on a terrace along the right bank of a secondary tributary of the Danqing River, itself a primary tributary of the Songhuajiang River. The site features a well-developed linear scarp exceeding 6 m in height, with multiple gullies developed along its trace. The trench was excavated between two gullies, oriented perpendicular to the scarp. The excavation measured ~20 m in length, with a 4 m wide opening and a basal width of ~1.5 m. Both walls were logged and interpreted in detail (Figure 9, Figure 10 and Figure 11).
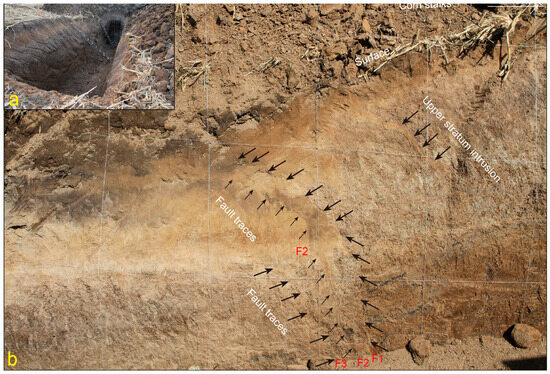
Figure 9.
(a) Overall photograph of the Trench of TCAL during excavation (the ladder used for the trenching work is for scale). (b) A magnified view of the north wall section near the fault traces. There are three visible faults (black arrows indicate the exposed locations). F3 has not yet reached the current surface, while F1 and F2 are active in a thrust style. The upper faulted points are covered by the current surface cultivated layer. The whole width of the deformation zone at this trench is approximately 2 m.
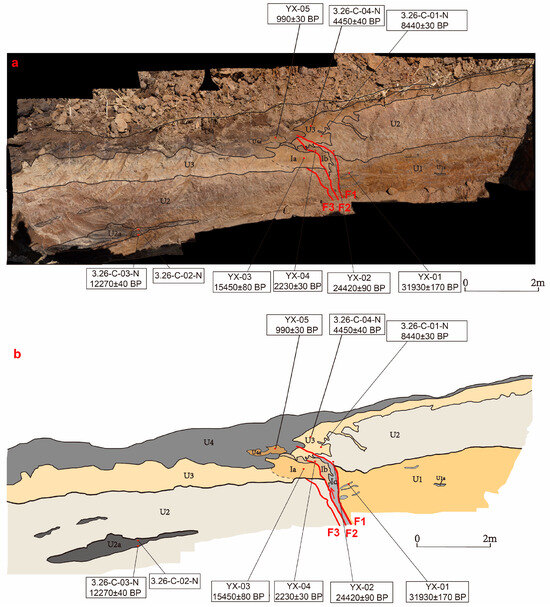
From the north wall of the TCAL trench, the exposed strata can be subdivided into units U1–U4 (Figure 10). Three faults (F1–F3) are recognized, all exhibiting thrust activity, though their upper terminations differ in exposure. Unit U1, the oldest deposit, is preserved on the right side of F1 but absent on the left. The dating result from sample YX-01 yielded 31,930 ± 170 BP, placing U1 in the late Late Pleistocene. The Unit U1 is ~2 m thick, yellowish-brown, and moderately bedded. Unit U2, a gray-black stratum with localized lens-shaped organic-rich deposits (Unit U2a), is displaced by all three faults with cumulative offsets > 1.5 m. Sample YX-02a from Unit U2a yielded an age of 12,270 ± 40 BP (Table 1), indicating a late Late Pleistocene age.
The Unit U3, composed of gray-white to yellow-brown deposits with an irregular basal contact, is offset by F1 and F2 but not by F3. Two samples from U3 on the right side of F1 yielded ages of 8440 ± 30 BP (near its base) and 4450 ± 40 BP (near its top) (Table 1), constraining U3 to the Early–Middle Holocene. The absence of displacement across F3 indicates that its most recent activity predates deposition of Unit U3. A thin wedge-shaped deposit (Unit Ia), dated to 15,450 ± 80 BP (sample YX-03), overlies the upper termination of F3, further constraining its last event. Unit U4 is a gray-black near-surface soil horizon enriched in humus. Its thickness varies significantly across the profile, reaching 0.8–1.0 m on the left but thinning to 0.2–0.3 m on the right due to slope effects and modern cultivation. Sample YX-05 from U4 yielded 990 ± 30 BP, dating the deposit to the late Holocene. Additional wedge-shaped layers (Units Ib and Ic) are present between F1 and F2. Samples YX-04 (2230 ± 30 BP) and YX-02 (24,420 ± 90 BP) suggest multi-stage fault activity, though they do not directly constrain the latest events of F1 and F2.
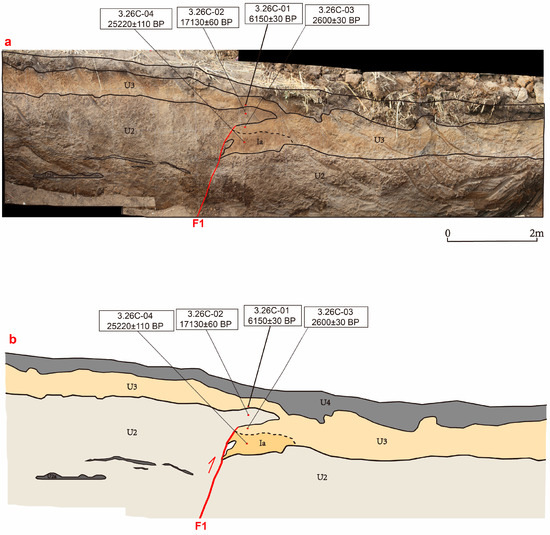
The south wall of the trench of TCAL reveals a broadly similar stratigraphy, though U1 and wedges Ib–Ic are absent. A wedge-shaped Unit Ia yielded an age of 25,220 ± 110 BP, placing it in the Late Pleistocene. A sample near the top of U2 yielded an age of 17,130 ± 60 BP, which is older than the U2a age from the north wall, suggesting that U2 may be younger than 17,130 ± 60 BP. Two dates from Unit U3 were obtained: 6150 ± 30 BP and 2600 ± 30 BP. The latter is likely contaminated by modern carbon, given its inconsistency with other dating ages from Unit U3 (Figure 11).
The interpreted faults are clearly expressed in both trench walls, with the most recent displacement cutting Unit U3 but overlain by Unit U4. This constrains the most recent surface-rupturing event to between 4450 ± 40 BP and 990 ± 30 BP. Considering possible contamination of the 2600 ± 30 BP result, the most plausible timing of the latest event is shortly before ~2 ka (Table 1).
4.2.4. Baile Trench (TCBL) and Baile Trench (TCBL)
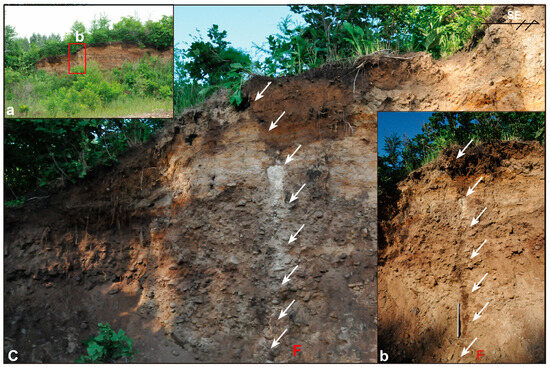
The Baile Trench (TCBL) (46.355441°N, 129.426357°E) is located approximately 300 m north of the Trench TCAL. It is situated within an abandoned mining site that was excavated by residents for the extraction of riverbed gravel and sand. Fault exposure within these deposits was confirmed through interpretation of the scarp’s extension direction. The gravels adjacent to the fault plane exhibit preferred orientation. The upper fault tip is exposed near the surface (Figure 12). Owing to the extensive chronological constraints already available from the Trench TCAL, only excavation and cleaning were conducted at TCBL to verify the spatial consistency between the fault exposure and the distribution of the fault scarp. North of the Trench TCBL, the fault trace extends gradually into the floodplain and valley of the Danqing River, where it becomes discontinuous. However, its overall trend remains consistent with the linear scarp near Xianglan (Figure 4a).
The Xianglan Trench (TCXL) (46.648904°N, 129.779595°E) is located in Rijiu Village, east of Xianglan Township. The trench was excavated across a fault scarp dipping northwest (Figure 5a,b). Stratigraphic exposures in the trench reveal six Units (U1–U6) from bottom to top. Unit U1 is a near-surface cultivated soil layer approximately 30 cm thick, while the remaining units consist primarily of sandy gravel. Locally, lens-shaped sand bodies (e.g., Unit U3) are present, reflecting poor depositional stability. The trench exposes a thrust fault verging from the southeast toward the northwest, consistent with the scarp dip. Deformation features include pronounced displacement of Unit U2 and localized offset of sand lenses within Unit U3. The upper fault tip offsets Unit U4 but is overlain by Unit U6, constraining a relatively recent activity phase within the Trench TCXL.
The Trench TCXL is located on the first terrace of the right bank of the Tangwang River. The mean age of first terraces in the reference area has been reported as 7.9 ± 0.7 ka [25]. Accordingly, the latest event recorded at Trench TCXL must postdate 7.9 ± 0.7 ka and is likely closer to the deposition age of Unit U5. However, in the absence of reliable dating results, the most reasonable interpretation is that the latest faulting event occurred during the late Holocene.
5. Discussion
5.1. Estimation of the Maximum Magnitude of the Earthquake of YYF
Previous studies have identified eight Holocene-active fault segments within the YYF fault zone through remote sensing interpretation and trenching. Among these, the Fangzheng–Tonghe segment is the largest, extending for more than 70 km [20,21,22,23,24]. Additional fault segments include a ~10 km section near Yilan County, which was confirmed by trenching as late Pleistocene activity [23], and a ~12 km section near Tangyuan County, identified as late Holocene activity [23]. In addition, the rupture lengths of the Shangzhi and Yanshou sections south of the Fangzheng section are relatively small, and there is a long section in between with no linear signs of activity on the surface. Therefore, these two faults do not have synchronous activity with the Fangzheng section [23,24,25,26].
We confirmed that the Fangzheng–Tonghe segment of YYF from the Xinxing Reservoir to the northern part of Tangyuan County (Figure 2) is laterally continuous. Evidence from five trenches (Figure 5, Figure 6, Figure 7, Figure 8, Figure 9 and Figure 10) in this study further substantiates its Holocene activity, with topographic scarps directly corresponding to the exposed upper fault breakpoints. These results demonstrate that the three previously recognized independent active faults within the Fangzheng–Tangyuan section of the YYF are in fact part of a single integrated rupture segment (Figure 2), consistent with structures revealed by petroleum geophysical surveys in the graben [36].
This study thus establishes the existence of a continuous rupture segment, previously underestimated, within the Fangzheng–Tangyuan section of the YYF. The total length of this segment is approximately 155 km (Figure 2b), extending between 45.803095°N, 128.723111°E (about 10 km southwest of Fangzheng County) and 46.857715°N, 130.028787°E (about 15 km northeast of Tangyuan County). For comparison, the rupture scale of the 1668 Tancheng earthquake along the Shandong section of the TLF has been debated. Some studies suggest a rupture length of up to 230 km extending to Suqian, Jiangsu Province [38,50], while other scholars estimate 120–160 km. Although recent seismological studies suggest a longer, more profound rupture length [51], trenching along the TLF in Jiangsu Province and Anhui Province indicates recurrence intervals of tens of thousands of years since the late Pleistocene, which is inconsistent with the timing of the 1668 event [38]. Based on trenching results and surface rupture investigations, we infer that the rupture length of the 1668 Tancheng earthquake did not exceed 160 km and was most likely concentrated between Juxian County and Xinyi City of TLF. This rupture scale is comparable to the length of the Fangzheng–Tangyuan segment of the YYF. If both the North China and Northeast China portions of the TLF exhibited low slip rates and long earthquake recurrence intervals during the Holocene and Pleistocene, the Fangzheng–Tangyuan section of the YYF would likely have produced a rupture event of a scale like that of the 1668 Tancheng earthquake.
Regarding magnitude estimates, earlier earthquake catalogs assigned the 1668 Tancheng earthquake a magnitude of M = 8.5, based on empirical relationships between maximum intensity and magnitude [52] by using the equation as follows,
where I0 means the maximum intensity of the epicenter, which is defined by [52]; however, this method does not account for rupture length and may have led to overestimation [5,13,53,54]. Since the mid-20th century, earthquake magnitudes have been recorded in terms of moment magnitude, Mw, with [39] providing empirical scaling relationships between rupture length and Mw for various faulting styles. Leonard (2014) proposed an updated fault-scaling relationship [40]. If the TLF is considered a strike-slip to compressional structure, the appropriate regressions are:
where SRL (in km) is the Surface Rupture Length [39] and L (in km) is the length of coseismic surface rupture [40].
M = 0.58 I0 + 1.5
Mw = 5.16 + 1.12 × log(SRL) for strike-slip faults
Mw = 5.00 + 1.22 × log(SRL) for thrust faults
Mw = 5.08 + 1.16 × log(SRL) for all fault types
Mw = 5.27 + 1.0 × log(L) for interplate strike slip faults
Using a rupture length of 160 km for the 1668 event yields Mw = 7.6–7.7, significantly smaller than the previously assigned M = 8.5. Even if the maximum rupture length of 220 km is adopted, the calculated magnitude is Mw ≈ 7.8, only marginally larger. This is consistent with the magnitude of the 1920 Haiyuan earthquake [5,13]. These results underscore the need to reassess the source parameters of historical large earthquakes, particularly magnitude, in terms of rupture scale and seismic moment release. For the ~155 km length of the Fangzheng-Tangyuan segment of the YYF, the estimated moment magnitude is Mw ≈ 7.6, directly comparable to the magnitude of the most significant historical event along the TLF. This value is significantly larger than the previous magnitude of M = 7.5 [20,21], based on the last recorded length of 70 km [55].
5.2. When Did the Most Recent Event (E1) of YYF Occur?
Defining the time interval for the latest earthquake in the ~155 km long Fangzheng-Tangyuan segment of the YYF requires a comprehensive analysis of multiple trenching results. Currently, over ten trenches have been excavated in this area (Figure 2b). Most of these trenches have been used to interpret the main fault surface. However, the reliable age of the latest event within a single trench is often limited. Here, based on the fundamental assumptions of long recurrence intervals and low slip rates [38,56], we propose that the YYL could have experienced only a single strong earthquake event during the Holocene in the Fangzheng-Tangyuan segment. This is also confirmed by paleoseismic sequences from multiple trenches [22,23,24].
Figure 13 shows the range of the latest event defined in this study and previous studies. We find that a relatively large number of trenches have been excavated in the ~70 km rupture zone between Fangzheng and Xinxing Reservoir. Still, the overall age of the event determined is relatively small. Min et al. (2013) used the younger of two 14C samples from the latest fault-displaced strata (1730 ± 40 BP and 4710 ± 40 BP) in their first trench as the lower limit for the latest event [21]. Shu et al. (2020) used 1730 ± 40 BP as the upper limit for the E1 event, based on the age of 770 ± 30 BP in the undisplaced strata overlying the other trenches, as the upper limit for the earthquake event within the ~70 km rupture segment [26].
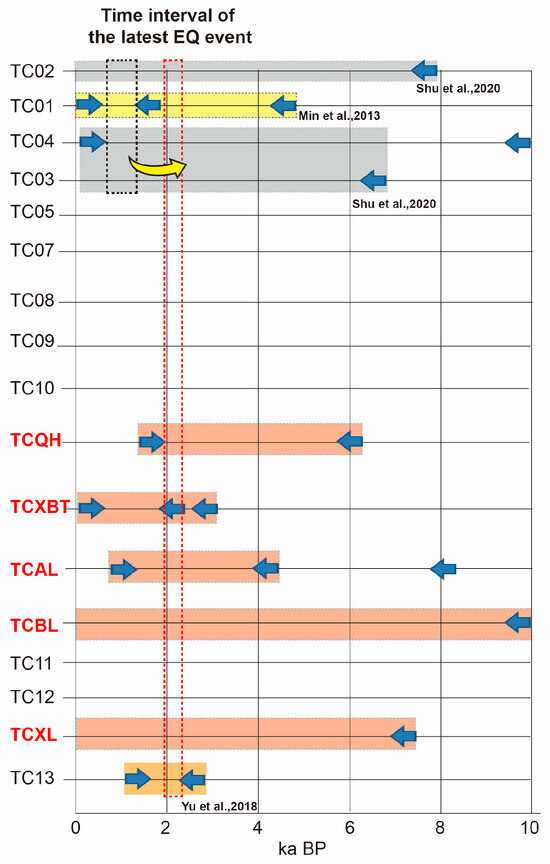
Figure 13.
The most recent credible earthquake in the Fangzheng-Tangyuan section of YYF is estimated to have occurred between 1500 and 3000 years ago (red dashed rectangle), with a median age of approximately 2200 years, which is 500 years later than the initial trenching results [20,21,22,23,24,25,26]. Although the Holocene black soil in Northeast China is relatively thick, there is a lack of chronological samples that can be used for trenching to accurately date earthquake events. A comprehensive comparison of multiple trenches is needed for an exhaustive definition.
In this study, based on three trenches excavated between Xinxing Reservoir and Yilan County, we yielded a relatively high number of age results, constrained the age of the latest earthquake event to be between 990 ± 30 BP (from Trench TCAL) and 6170 ± 30 BP (from Trench TCQH). Refs. [22,23,24] constrained the E1 event near Tangyuan to between 1500 ± 600 BP (OSL sample age) and 2680 ± 30 BP (AMS-14C sample age) (Table 1). Combining the latest results of E1 event constraints from different researchers, we believe that the most recent event (E1) of the largest rupture segment on the YYF should be constrained to a time range of between 1500 and 3270 BP. Recent regional archeological findings from the Fangzheng-Tangyuan rupture section of the YYF confirm that the destruction of numerous sites dating from the Han Dynasty to the Wei, Jin, and Southern and Northern Dynasties along the Songhua River in Fangzheng-Yilan-Tangyuan-Jiamusi, located along the YYF, does not involve a large-scale, concentrated, strong earthquake as a causal explanation, nor has any soil liquefaction been found along the river’s low terraces, which could be associated with a decisive earthquake rupture [56,57,58,59,60]. This suggests that site destruction in China since the Han Dynasty is unrelated to the adjacent YYF destruction. Therefore, no recent reports of YYF-induced destruction have been found in archeological excavations of numerous sites in the Songhuajiang River and Mudanjiang River basins since the Han Dynasty, which supports the conclusion that the lower limit of the latest event, 1730 ± 40 BP, is not appropriate. Its lower limit of age may be in the middle and late Holocene, which was not recorded in historical documents of the time. It is reasonable that it was not recorded in archeological sites after the Han Dynasty.
5.3. Strong Earthquake Hazard Under a Low Slip Rate Background
We confirm the existence of a continuous late Holocene rupture zone of approximately 155 km along the Fangzheng–Tangyuan section of the YYF. The most recent strong earthquake associated with this segment is estimated to have reached a moment magnitude of Mw ≈ 7.6, comparable in rupture scale to the 1668 Tancheng earthquake [46,61,62,63,64,65,66,67,68,69,70]. Based on this new understanding, the substantial earthquake hazard of the YYF fault zone merits close attention, particularly considering the rapid urbanization, high population density, and the concentration of major lifeline projects constructed and operated along its trace over the past century (e.g., the Harbin–Jiamusi High-Speed Railway and multiple oil pipelines).
The long-range influence of Pacific Plate subduction is especially pronounced in eastern China, including North and Northeast China [58,59,65,66,67]. The tectonic evolution of the Tanlu Fault Zone has been characterized by shifts in its movement patterns in response to changes along the plate boundary [37]. Its latest movement is dominated by thrusting, with a minor strike-slip component [47]. Along a ~200 km section of the YYF, GNSS measurements indicate a slip rate of ~1 mm/yr, while some observations suggest minor extensional deformation [14]. Shu et al. (2014) constrained the slip rate to 0.41–0.7 mm/yr [25]. In comparison, the Shandong section of the TLF previously yielded a geologically estimated strike-slip rate of ~2 mm/yr, partly influenced by the superposition of multiple paleoseismic events in trench studies [35].
However, more recent estimates suggest only ~0.7 mm/yr, highlighting the current low activity level and long recurrence intervals of tens of thousands of years. Similar low slip rates are observed in both the Shandong and northeastern sections of the TLF. Given that the Fangzheng–Tangyuan section of the YYF was most recently active in the mid-to-late Holocene, its present slip rate is expected to be relatively low. Nevertheless, the 2011 Mw = 9.0 Tōhoku great earthquake induced significant Coulomb stress increases in the YYF [6,14,47,56]. Strong earthquakes of Mw ≥ 8 along the Japan Trench recur on average every 500–900 years [47,58,59]. Thus, the cumulative impact of repeated coseismic stress transfer from subduction zone earthquakes may substantially influence the seismogenic potential and urgency of the Fangzheng–Tangyuan segment.
It should be emphasized that the paleoseismic recurrence history of this >150 km-long Holocene-active rupture remains incomplete and preliminary. Available trenching data are limited and provide few reliable age constraints [20,23,25,61]. Future large-scale trenching at favorable stratigraphic sites is required to reconstruct a continuous paleoseismic event sequence since the late Pleistocene. Such work would provide critical constraints on recurrence intervals in the Fangzheng–Yilan–Tangyuan region and form the basis for robust earthquake hazard assessment. In addition, few detailed seismic–geological investigations have yet confirmed the most recent activity of the long Shenyang–Changchun segment in the northeastern TLF. Given the partially concealed nature of the YYF, more comprehensive surveys are also needed for the Jiamusi–Hegang fault north of Tangyuan County. Together, these investigations would enable a systematic assessment of Holocene segmentation, seismogenic potential, and the relative urgency of future strong earthquakes along the YYF.
6. Conclusions
Based on detailed interpretation of high-resolution multi-source satellite imagery, aerial photographs, and UAV data, combined with chronological constraints from five cross-fault trench sites, we have obtained new insights into the recent activity of the Fangzheng–Tangyuan section of the Yilan–Yitong Graben, located in the northeastern segment of the Tanlu Fault Zone. The following results were obtained:
1. A continuous Holocene rupture zone, approximately 155 km in length, is identified along the Fangzheng–Tangyuan section of the Yilan–Yitong Fault. These linear scarps are mainly developed on river terraces of varying levels along the left bank of the Songhua River and represent newly formed faults within the Fangzheng and Tangyuan Grabens. The estimated moment magnitude of the most recent large earthquake is Mw ≈ 7.6, exceeding the previously assumed M 7.5 and comparable in rupture scale to the 1668 Tancheng earthquake.
2. The lower bound for the most recent paleoseismic event, constrained by newly excavated trenches, falls within the mid-to-late Holocene, concentrated between ~1500 BP and ~3270 BP. This timing is consistent with earlier age estimates of ~770 BP and ~1730 BP, suggesting that the latest strong earthquake on the Yilan–Yitong Fault occurred later than previously inferred. This interpretation also aligns with regional archeological evidence indicating the absence of significant earthquake damage at numerous sites along the fault zone since the Han Dynasty.
3. Future assessments of substantial earthquake hazard along the Yilan–Yitong Fault should prioritize large-scale, systematic trenching of Holocene-active segments to establish more robust quantitative constraints on recurrence intervals, and valuation of the cumulative influence of far-field Coulomb stress loading from repeated large subduction-zone earthquakes along the Japan Trench.
These results highlight the significant seismogenic potential of the Fangzheng–Tangyuan section of the Yilan–Yitong Fault and emphasize the urgent need to integrate paleoseismic, archeological, and geodetic evidence into seismic hazard mitigation strategies, particularly for lifeline infrastructure such as high-speed railways, pipelines, and densely populated urban centers along the fault zone.
Author Contributions
Conceptualization, Y.X. and P.Y.; methodology, Q.W. and Y.X.; software, Y.X.; validation, P.Y., Q.W. and Y.X.; formal analysis, Q.W.; field investigation, Y.X., P.Y., Q.W., C.H., S.L., J.K., W.L., P.D., Y.Z., Z.Z. and Q.T.; resources, Q.W.; data curation, Y.X.; writing—original draft preparation, Y.X. and Q.W.; writing—review and editing, Y.X.; visualization, Y.X.; supervision, Y.X. and P.Y.; project administration, Y.X.; funding acquisition, Y.X. and P.Y. All authors have read and agreed to the published version of the manuscript.
Funding
This research was jointly funded by the Basic Research Program of the Institute of Earthquake Forecasting, China Earthquake Administration (IEF, CEA) (Grant Nos. CEAIEF20240302, CEAIEF20250101), the National Natural Science Foundation of China (Grant Nos. 42072248, 42202212) and Tianjin Natural Science Foundation Youth Fund (Grant No.23JCQNJC02000).
Data Availability Statement
The data presented in this study are available from the corresponding author, upon reasonable request.
Acknowledgments
The first author and corresponding author thank Xiwei Xu at China University of Geoscience (Beijing), Min Wei and Xiaoping Yang at the Institute of Geology, China Earthquake Administration, and Bo Wan from Liaoning Earthquake Agency for their help and valuable comments during the field survey. The authors thank the three anonymous reviewers and the handling editor for their constructive suggestions, which helped them improve the quality of the manuscript.
Conflicts of Interest
The authors declare no conflicts of interest or personal relationships that could have appeared to influence the work reported in this paper.
References
- Xu, J.; Zhu, G.; Tong, W.; Cui, K.; Liu, Q. Formation and evolution of the Tancheng-Lujiang wrench fault system: A major shear system to the northwest of the Pacific Ocean. Tectonophysics 1987, 134, 273–310. [Google Scholar] [CrossRef]
- Zhang, P.; Min, W.; Deng, Q.; Mao, F. Paleoearthquake rupture behavior and recurrence of great earthquakes along the Haiyuan fault, northwestern China. Sci. China Ser. D 2005, 48, 364–375. [Google Scholar] [CrossRef]
- Xu, X.; Wen, X.; Yu, G.; Chen, G.; Klinger, Y.; Hubbard, J.; Shaw, J. Co-seismic reverse- and oblique-slip surface faulting generated by the 2008 MW 7.9 Wenchuan earthquake, China. Geology 2009, 37, 515–518. [Google Scholar] [CrossRef]
- Wang, X.; Chen, Q.; Niu, F.; Wei, S.; Ning, J.; Li, J.; Wang, W.; Buchen, J.; Liu, L. Distinct slab interfaces imaged within the mantle transition zone. Nat. Geosci. 2020, 13, 822–827. [Google Scholar] [CrossRef]
- Liu-Zeng, J.; Shao, Y.; Klinger, Y.; Xie, K.; Yuan, D.; Lei, Z. Variability in magnitude of paleo-earthquakes revealed by trenching and historical records, along the Haiyuan Fault, China. J. Geophys. Res. Solid Earth 2015, 120, 8304–8333. [Google Scholar] [CrossRef]
- Shao, Z.; Zhan, W.; Zhang, L.; Xu, J. Analysis of the far-field co-seismic and post-seismic responses caused by the 2011 Mw 9.0 Tohoku-Oki Earthquake. Pure Appl. Geophys. 2016, 173, 411–424. [Google Scholar] [CrossRef]
- Shi, X.; Tapponnier, P.; Wang, T.; Wei, S.; Wang, Y.; Wang, X.; Jiao, L. Triple junction kinematics accounts for the 2016 Mw 7.8 Kaikoura earthquake rupture complexity. Proc. Natl. Acad. Sci. USA 2019, 116, 26367–26375. [Google Scholar] [CrossRef]
- Han, Z.; Xu, J.; Ran, Y.; Chen, L.; Yang, X. Active blocks and strong seismic activity in North China region. Sci. China Ser. D Earth Sci. 2003, 46 (Suppl. S2), 153–167. [Google Scholar] [CrossRef]
- Biasi, G.P.; Weldon, R.J. Estimating surface rupture length and magnitude of paleoearthquakes from point measurements of rupture displacement. Bull. Seismol. Soc. Am. 2006, 96, 1612–1623. [Google Scholar] [CrossRef][Green Version]
- Arrowsmith, J.R.; Zielke, O. Tectonic geomorphology of the San Andreas fault zone from high resolution topography: An example from the Cholame segment. Geomorphology 2009, 113, 70–81. [Google Scholar] [CrossRef]
- Zielke, O.; Arrowsmith, J.R.; Ludwig, L.G.; Akciz, S.O. High-resolution topography-derived offsets along the 1857 Fort Tejon earthquake rupture trace, San Andreas fault. Bull. Seismol. Soc. Am. 2012, 102, 1135–1154. [Google Scholar] [CrossRef]
- Zielke, O.; Arrowsmith, J.R.; Ludwig, L.G.; Akciz, S.O. Slip in the 1857 and earlier large earthquakes along the Carrizo Plain, San Andreas fault. Science 2010, 327, 1119–1122. [Google Scholar] [CrossRef] [PubMed]
- Ou, Q.; Kulikova, G.; Yu, J.; Elliott, A.; Parsons, B.; Walker, R. Magnitude of the 1920 Haiyuan earthquake reestimated using seismological and geomorphological methods. J. Geophys. Res. Solid Earth 2020, 125, e2019JB019244. [Google Scholar] [CrossRef]
- Meng, G.; Su, X.; Wu, W.; Nikolay, S.; Takahashi, H.; Ohzono, M.; Gerasimenko, M. Crustal deformation of northeastern China following the 2011 Mw 9.0 Tohoku, Japan earthquake estimated from GPS observations: Strain heterogeneity and seismicity. Remote Sens. 2019, 11, 3029. [Google Scholar] [CrossRef]
- Zhang, Y.; Zheng, W.; Wang, Y.; Zhang, D.; Tian, Y.; Wang, M.; Zhang, Z.; Zhang, P. Contemporary deformation of the North China plain from global positioning system data. Geophys. Res. Lett. 2018, 45, 1851–1859. [Google Scholar] [CrossRef]
- Carboni, F.; Occhipinti, M.; Lanari, R.; Medina, F.; Cherkaoui, T.; Gaspari, R.; Faccenna, F. Strain partitioning and fault interaction during the 2023 Mw 6.8 Al-Haouz earthquake, Western High Atlas, Morocco. J. Struct. Geol. 2025, 195, 105394. [Google Scholar] [CrossRef]
- Molnar, P. The brittle-plastic transition, earthquakes, temperatures, and strain rates. J. Geophys. Res. Solid Earth 2020, 125, e2019JB019335. [Google Scholar] [CrossRef]
- Yin, A.; Yu, X.; Shen, Z.K.; Liu-Zeng, J. A possible seismic gap and high earthquake hazard in the North China Basin. Geology 2015, 43, 19–22. [Google Scholar] [CrossRef]
- Zhang, P.; Deng, Q.; Zhang, G.; Ma, J.; Gan, W.; Min, W.; Mao, F.; Wang, Q. Active tectonic blocks and strong earthquakes in the continent of China. Sci. China Ser. D Earth Sci. 2003, 46 (Suppl. S2), 13–24. [Google Scholar] [CrossRef]
- Min, W.; Jiao, D.C.; Zhou, B.G.; Sheng, J.; Chen, T. The significance of discovery on Holocene activity on the Yilan-Yitong fault in northeast China. Seismol. Geol. 2011, 33, 74–79, (In Chinese with English Abstract). [Google Scholar]
- Min, W.; Liu, Y.; Jiao, D.; Shen, J.; Pan, X. Evidence for Holocene activity of the Yilan-Yitong fault, northeastern section of the Tan-Lu fault zone in Northeast China. J. Asian Earth Sci. 2013, 67, 207–216. [Google Scholar] [CrossRef]
- Yu, Z.; Yin, N.; Shu, P.; Li, J.; Wei, Q.; Min, W.; Zhang, P. Late Quaternary paleoseismicity and seismic potential of the Yilan-Yitong Fault Zone in NE China. J. Asian Earth Sci. 2018, 151, 197–225. [Google Scholar] [CrossRef]
- Yu, Z.; Zhang, P.; Min, W.; Wei, Q.; Liu, Y. Late Holocene slip rate and average recurrence interval of great earthquakes on the Shangzhi segment of the Yilan-Yitong Fault Zone, northeastern China: Constraints from paleo-earthquakes and historical written records. Isl. Arc 2018, 27, e12231. [Google Scholar] [CrossRef]
- Yu, Z.; Yin, N.; Yang, Y.; Li, L.; Ma, Y. Late Quaternary right-lateral slip rate along the Tangyuan segment of the Yilan–Yitong Fault Zone on the NE China Plain. Front. Earth Sci. 2024, 12, 1413084. [Google Scholar] [CrossRef]
- Shu, P.; Min, W.; Liu, Y.; Yu, Z. Tectonic activity and geomorphic features of the Fangzheng section of Yilan-Yitong Fault in the Late Quaternary period. Technol. Earthq. Disaster Prev. 2014, 9, 226–237, (In Chinese with English Abstract). [Google Scholar]
- Shu, P.; Min, W.; Liu, Y.; Xu, X.; Li, K.; Yu, Z.; Yang, H.; Luo, H.; Wei, S.; Fang, L. Late Quaternary paleoseismology and faulting behavior of the Yilan-Yitong fault zone and implications for seismic hazards of the Tanlu fault zone, eastern China. J. Asian Earth Sci. 2020, 201, 104509. [Google Scholar] [CrossRef]
- Wei, Q.; Ha, G.; Min, W.; Zhu, M. Geometry and Kinematics of Northmost Yilan-Yitong Fault Zone, China: Insights from Shallow Seismic Data and Field Investigation. Sustainability 2024, 16, 1943. [Google Scholar] [CrossRef]
- Wang, H.; Liu, M.; Cao, J.; Shen, X.; Zhang, G. Slip rates and seismic moment deficits on major active faults in mainland China. J. Geophys. Res. Solid Earth 2011, 116, B02405. [Google Scholar] [CrossRef]
- Guo, H.; Jiang, W.; Xie, X. Late-Quaternary strong earthquakes on the seismogenic fault of the 1976 Ms7.8 Tangshan earthquake, Hebei, as revealed by drilling and trenching. Sci. China Earth Sci. 2011, 54, 1696–1715. [Google Scholar] [CrossRef]
- Li, Z.; Ni, S.; Roecker, S.; Bao, F.; Wei, X.; Yue, D. Seismic imaging of source region in the 1976 Ms 7.8 Tangshan earthquake sequence and its implications for the seismogenesis of intraplate earthquakes. Bull. Seismol. Soc. Am. 2018, 108, 1302–1313. [Google Scholar] [CrossRef]
- Wang, K.; Chen, Q.F.; Sun, S.; Wang, A. Predicting the 1975 Haicheng earthquake. Bull. Seismol. Soc. Am. 2006, 96, 757–795. [Google Scholar] [CrossRef]
- Xu, M.; Li, Y.; Hou, H.; Wang, C.; Gao, R.; Wang, H.; Han, Z.; Zhou, A. Structural characteristics of the Yilan–Yitong and Dunhua–Mishan faults as northern extensions of the Tancheng–Lujiang Fault Zone: New deep seismic reflection results. Tectonophysics 2017, 706, 35–45. [Google Scholar] [CrossRef]
- Shao, Z.; Wu, Y.; Ji, L.; Diao, F.; Shi, F.; Li, Y.; Long, F.; Zhang, H.; Wang, W.; Wei, W.; et al. Assessment of strong earthquake risk in the Chinese mainland from 2021 to 2030. Earthq. Res. Adv. 2023, 3, 100177. [Google Scholar] [CrossRef]
- Wen, X.; Xu, X.; Long, F.; Xia, C. Frequency-magnitude relationship models for assessment of maximum magnitudes of potential earthquakes on moderately and weakly active faults in eastern China mainland. Seismol. Geol. 2007, 29, 236–253. [Google Scholar]
- Huang, J.; Zhao, D. High-resolution mantle tomography of China and surrounding regions. J. Geophys. Res. Solid Earth 2006, 111, B09305. [Google Scholar] [CrossRef]
- Chen, D.; Zhang, F.; Chen, H.; Dilek, Y.; Yang, S. Structural architecture and tectonic evolution of the Fangzheng sedimentary basin (NE China), and implications for the kinematics of the Tan-Lu fault zone. J. Asian Earth Sci. 2015, 106, 34–48. [Google Scholar] [CrossRef]
- Zhu, G.; Liu, C.; Gu, C.; Zhang, S.; Li, Y.; Su, N.; Xiao, S. Oceanic plate subduction history in the western Pacific Ocean: Constraint from late Mesozoic evolution of the Tan-Lu Fault Zone. Sci. China Earth Sci. 2018, 61, 386–405. [Google Scholar] [CrossRef]
- Li, K.; Xu, X.; Wei, L.; Wang, Q.; Shu, P. Evidence of long recurrence times and low slip rate along the 1668 Tancheng earthquake fault. Chin. Sci. Bull. 2019, 64, 1168–1178. [Google Scholar] [CrossRef]
- Wells, D.L.; Coppersmith, K.J. New empirical relationships among magnitude, rupture length, rupture width, rupture area, and surface displacement. Bull. Seismol. Soc. Am. 1994, 84, 974–1002. [Google Scholar] [CrossRef]
- Leonard, M. Self-consistent earthquake fault-scaling relations: Update and extension to stable continental strike-slip faults. Bull. Seismol. Soc. Am. 2014, 104, 2953–2965. [Google Scholar] [CrossRef]
- Allen, M.B.; Macdonald, D.I.M.; Xun, Z.; Vincent, S.J.; Brouet-Menzies, C. Early Cenozoic two-phase extension and late Cenozoic thermal subsidence and inversion of the Bohai Basin, northern China. Mar. Pet. Geol. 1997, 14, 951–972. [Google Scholar] [CrossRef]
- Gu, C.; Zhu, G.; Zhai, M.; Lin, S.; Song, L.; Liu, B. Features and origin time of Mesozoic strike-slip structures in the Yilan-Yitong Fault Zone. Sci. China Earth Sci. 2016, 59, 2389–2410. [Google Scholar] [CrossRef]
- Chao, H.; Li, J.; Cui, Z.; Zhao, Q. Discussion on several problems related to the seismic fault of the 1668 Tancheng earthquake (M = 8.5). North China Earthq. Sci. 1997, 15, 18–25, (In Chinese with English Abstract). [Google Scholar]
- Wang, H. Holocene slip rate, paleoearthquakes, and recurrence interval of strong earthquakes on the fault where 1668 earthquake M = 8.5 earthquake occurred, Shandong Province. Northwestern Seismol. J. 1995, 17, 206–224, (In Chinese with English Abstract). [Google Scholar]
- Lin, W.; Gao, W. The occurrence intervals of large earthquake in the Yishu fault zone. Earthq. Res. China 1987, 3, 34–40, (In Chinese with English Abstract). [Google Scholar]
- Gao, W.; Li, J.; Li, Q. Geological Map of the Tan-Lu Active Fault Zone (1:50 000), Geological Mapping Group of the Tan-Lu Active Fault Zone; Seismological Press: Beijing, China, 2013. [Google Scholar]
- Wang, M.; Shen, Z. Present-day crustal deformation of continental China derived from GPS and its tectonic implications. J. Geophys. Res. Solid Earth 2020, 125, e2019JB018774. [Google Scholar] [CrossRef]
- Su, Z.; Xu, X.; Liang, S.; Wang, E. Seismotectonics of the 2017–2018 Songyuan Earthquake Sequence, Northeastern China: Passive Bookshelf Faulting and Block Rotation in the Songliao Basin. Seismol. Res. Lett. 2020, 91, 1593–1605. [Google Scholar] [CrossRef]
- McCalpin, J.P. Paleoseismology; Academic Press-Elsevier: New York, NY, USA, 2009; pp. 1–629. [Google Scholar]
- Cao, J.; Ran, Y.; Xu, H. Holocene activity of the Anqiu-Juxian fault on the Jiangsu segment of the Tanlu fault zone and its tectonics implications. Chin. J. Geophys. 2018, 61, 2828–2844, (In Chinese with English Abstract). [Google Scholar]
- Wang, J.; Main, I. Strong historical earthquakes and their relationships with the Tan-Lu fault system and modern seismicity in eastern China. Nat. Hazards 2023, 115, 539–564. [Google Scholar] [CrossRef]
- Gu, G.; Lin, T.; Shi, Z. Catalogue of Chinese Earthquakes (1831 BC–1969 AD); Science Press: Beijing, China, 1983. [Google Scholar]
- Feng, X.; Ma, J.; Zhou, Y.; England, P.; Parsons, B.; Rizza, M.A.; Walker, R.T. Geomorphology and Paleoseismology of the Weinan fault, Shaanxi, central China, and the source of the 1556 Huaxian earthquake. J. Geophys. Res. Solid Earth 2020, 125, e2019JB017848. [Google Scholar] [CrossRef]
- Xu, Y.; He, H.; Deng, Q.; Allen, B.M.; Sun, H.; Bi, L. The CE 1303 Hongdong earthquake and the Huoshan Piedmont Fault, Shanxi Graben: Implications for magnitude limits of normal fault earthquakes. J. Geophys. Res. Solid Earth 2018, 123, 3098–3121. [Google Scholar] [CrossRef]
- Deng, Q.D.; Yu, G.H.; Ye, W.H. Relationship between earthquake magnitude and parameters of surface ruptures associated with historical earthquakes. In Research on Active Fault (2); Seismological Press: Beijing, China, 1993; pp. 247–264, (In Chinese with English Abstract). [Google Scholar]
- Wang, M.; Li, Q.; Wang, F.; Zhang, R.; Wang, Y. Far-field coseismic displacements associated with the 2011 Tohoku-oki earthquake in Japan observed by Global Positioning System. Chin. Sci. Bull. 2011, 56, 2419–2424, (In Chinese with English Abstract). [Google Scholar] [CrossRef]
- Jiang, W.; Zhang, J.; Han, Z.; Tian, T.; Jiao, Q.; Wang, X.; Jiang, H. Characteristic slip of strong earthquakes along the Yishu fault zone in east China evidenced by offset landforms. Tectonics 2017, 36, 1947–1965. [Google Scholar] [CrossRef]
- Uchida, N.; Bürgmann, R. A decade of lessons learned from the 2011 Tohoku-Oki earthquake. Rev. Geophys. 2021, 59, e2020RG000713. [Google Scholar] [CrossRef]
- Usami, K.; Ikehara, K.; Kanamatsu, T.; McHugh, C. Supercycle in great earthquake recurrence along the Japan Trench over the last 4000 years. Geosci. Lett. 2018, 5, 11. [Google Scholar] [CrossRef]
- Heilongjiang Provincial Institute of Cultural Relics and Archaeology. Fenglin City: Archaeological Excavation Report 1998–2000; Science Press: Beijing, China, 2019. (In Chinese) [Google Scholar]
- Xu, W.; Wang, J.; Yin, J. Late Quaternary faulted landforms and recent activity of the eastern segment of the Nanbei River–Boli Fault. J. Struct. Geol. 2024, 183, 105128. [Google Scholar] [CrossRef]
- Klinger, Y.; Etchebes, M.; Tapponnier, P.; Naarteau, C. Characteristic slip for five great earthquakes along the Fuyun fault in China. Nat. Geosci. 2011, 4, 389–392. [Google Scholar] [CrossRef]
- Li, S.; Chen, Q.; Zhao, L.; Zhu, L.; Gao, Z. Anomalous focal mechanism of the May 2011 Mw 5.7 deep earthquake in Northeastern China: Regional waveform inversion and possible mechanism. Chin. J. Geophys. 2013, 56, 2959–2970. [Google Scholar]
- Li, Z. Collision between the North and South China blocks: A crustal-detachment model for suturing in the region east of the Tanlu fault. Geology 1994, 22, 739–742. [Google Scholar] [CrossRef]
- Liu, M.; Yang, Y.; Shen, Z.; Wang, S.; Wang, M.; Wan, Y. Active tectonics and intracontinental earthquakes in China: The kinematics and geodynamics. Geol. Soc. Am. 2007, 42, 299–318. [Google Scholar]
- Liu, T.; Fu, G.; She, Y.; Meng, G.; Zou, Z.; Wu, W.; Shestakov, N.; Gerasimenko, M.; Bykov, V.; Puppatenko, V. Post-seismic deformation following the 2011 Mw9. 0 Tohoku–Oki earthquake and its impact on Northeast Asia. Geophys. J. Int. 2023, 235, 1479–1492. [Google Scholar] [CrossRef]
- Ren, Z.; Zhang, Z.; Chen, T.; Yan, S.; Yin, J.; Zhang, P.; Zheng, W.; Zhang, H.; Li, C. Clustering of offsets on the Haiyuan fault and their relationship to paleoearthquakes. Geol. Soc. Am. Bull. 2016, 128, 3–18. [Google Scholar] [CrossRef]
- Tian, J.; Ye, G.; Ding, Z.; Wu, Q.; Wei, W.; Jin, S.; Xie, C. A study of the deep electrical structure of the northern segment of the Tan-Lu fault zone, NE China. J. Asian Earth Sci. 2019, 170, 118–127. [Google Scholar] [CrossRef]
- Wang, L.; Liu, J.; Zhao, J.; Zhao, J. Coseismic Slip and Post-seismic Relaxation of the 2011 M9.0 Tohoku-oki Earthquake and its Influence on China Mainland. Earthquake 2013, 3, 238–247, (In Chinese with English Abstract). [Google Scholar]
- Yan, S.; Zhou, L.; Yu, S.; Lu, P. A documentary record of earthquake-induced floods and risk assessment in the lower Yellow River during the past 700 years. Holocene 2025, 35, 977–985. [Google Scholar] [CrossRef]
Disclaimer/Publisher’s Note: The statements, opinions and data contained in all publications are solely those of the individual author(s) and contributor(s) and not of MDPI and/or the editor(s). MDPI and/or the editor(s) disclaim responsibility for any injury to people or property resulting from any ideas, methods, instructions or products referred to in the content. |
© 2025 by the authors. Licensee MDPI, Basel, Switzerland. This article is an open access article distributed under the terms and conditions of the Creative Commons Attribution (CC BY) license (https://creativecommons.org/licenses/by/4.0/).