Article

A Satellite-Based Assessment of Divergent Carbon–Water Trends: Vegetation Greening Coincides with Declining Water Use Efficiency in the Haihe River Basin (2001–2023)

School of Landscape Architecture, Beijing Forestry University, Beijing 100083, China
*
Author to whom correspondence should be addressed.
Remote Sens. 2025, 17(21), 3505; https://doi.org/10.3390/rs17213505
Submission received: 19 August 2025 / Revised: 1 October 2025 / Accepted: 14 October 2025 / Published: 22 October 2025

Highlights

What are the main findings?
  • Despite a significant increase in vegetation productivity (greening) in the Haihe River Basin from 2001–2023, the basin-wide Water Use Efficiency (WUE) paradoxically showed a statistically significant decline.
  • The decline was primarily driven by climate warming, which increased evapotranspiration (ET) at a proportionally faster rate than gross primary production (GPP), overwhelming the beneficial effects of rising precipitation.
What is the implication of the main finding?
  • The current greening trajectory in the Haihe River Basin is hydrologically unsus-tainable, as increasing vegetation is consuming water with decreasing efficiency, undermining long-term water security in an already water-scarce region
  • Ecological restoration policies must shift from a singular focus on maximizing vegetation cover (‘greening’) to promoting ‘sustainable and water-wise greening,’ which necessitates assessing the hydro-ecological trade-offs of restoration strategies.

Abstract

In the context of global change, assessing the sustainability of ecological restoration in water-scarce regions presents a critical scientific challenge. The Haihe River Basin (HRB), vital to China’s food and water security, has experienced extensive greening over the past two decades. However, the hydrological cost of this greening remains uncertain. This study leverages multi-source satellite remote sensing data (MODIS, CLCD) from 2001 to 2023 to investigate the hydrological implications of this greening. Our analysis reveals a stark ‘decoupling’: despite significant increases in Gross Primary Production (GPP) (9.45 g C·m−2·yr−1, p < 0.01), the basin-wide Water Use Efficiency (WUE) exhibited a gradual yet statistically significant decline (slope = −0.01 g C·m−2·mm−1·yr−1, p < 0.01). In contrast, Carbon Use Efficiency (CUE) demonstrated no significant basin-wide trend but exhibited significant spatial decreases in mature forest areas. Spatially, the trends are heterogeneous; while 40.80% of the basin showed improved WUE, a significant decrease was observed in only 2.88% of the area, primarily in high-productivity agricultural zones. This localized decline, however, was substantial enough (with mean rates of decrease exceeding −0.06 g C·m−2·mm−1·yr−1) to influence the basin-wide average downward. Attribution analysis identified that climate change, particularly rising temperatures and the associated increase in vapor pressure deficit (VPD), were the dominant drivers of this decline by stimulating evapotranspiration (ET) at a rate faster than GPP enhancement. Collectively, our findings suggest that the observed greening trajectory in the HRB, while increasing carbon uptake, is becoming progressively less water-efficient, indicating a path of hydrological unsustainability. This research highlights the urgent need for hydrologically informed policies in ecological restoration, shifting the focus from simple ‘greening’ towards achieving ‘sustainable and hydrologically sound greening’.

1. Introduction

Global climate has undergone significant changes since the start of the 21st century, manifested primarily through rising temperatures and increased frequency and intensity of extreme weather events such as heatwaves, droughts, and heavy rainfall [1,2]. These changes present formidable challenges to the stability of terrestrial ecosystems and human well-being. As the main components of land ecosystems, forests, grasslands, and agricultural lands, where green vegetation acts as the primary producer, regulate carbon and water cycles in response to environmental changes [3]. Understanding the coupling relationship between carbon and water processes within these ecosystems is essential for assessing ecosystem function and resilience under global change [4].
Two key metrics commonly used to characterize this coupling are Vegetation Carbon Use Efficiency (CUE) and Vegetation Water Use Efficiency (WUE). CUE is typically defined as the ratio of Net Primary Productivity (NPP) to Gross Primary Productivity (GPP) [5,6], reflecting the ecosystem’s efficiency in converting assimilated carbon into biomass after accounting for autotrophic respiration. WUE is commonly calculated as the ratio of GPP to Evapotranspiration (ET) [7], indicating the amount of carbon fixed per unit of water lost through evapotranspiration. These indicators collectively reveal vegetation strategies for resource optimization and are fundamental parameters for evaluating ecosystem functioning [8,9].
The spatiotemporal patterns of CUE and WUE are influenced by a complex interplay of natural and anthropogenic factors. Climatic variables such as temperature, precipitation, and solar radiation are known to significantly impact these efficiencies [10]. For example, rising temperatures can decrease CUE by stimulating respiration more than photosynthesis, while water availability often exerts primary control over WUE, especially in arid and semi-arid regions. Land use and land cover change (LUCC) is another critical driver. Different vegetation types exhibit distinct CUE and WUE characteristics due to varying physiological traits and carbon allocation strategies [11]. Consequently, human-induced land transformations—such as afforestation, agricultural expansion, or urbanization—directly alter vegetation composition and subsequently reconfigure regional carbon and water cycles [12,13,14].
The Haihe River Basin (HRB), a political and economic hub in North China, is a region grappling with the dual pressures of climate change and intense human activity, manifesting most acutely in profound water scarcity [15]. The basin has experienced a trend of increasing precipitation, including extreme events [16], yet its per capita water resources are among the lowest in China. This water stress is exacerbated by the demands of intensive irrigated agriculture and the rapid expansion of the Beijing–Tianjin–Hebei urban agglomeration, threatening both regional ecological security and sustainable socioeconomic development [17,18].
Extensive research has been conducted globally and in China on the spatiotemporal variations in vegetation carbon–water fluxes and efficiencies [19,20,21]. Studies have demonstrated that CUE is significantly influenced by environmental conditions and ecosystem types [11], while WUE shows high sensitivity to climate change, with precipitation [9,10] and temperature [10,11] often identified as primary drivers. However, differing methodologies and spatiotemporal scales have led to inconsistent conclusions regarding regional WUE trends [22,23,24]. LUCC is recognized as a key factor altering ecosystem structure and function, thereby affecting CUE and WUE [12]. For example, forest expansion can enhance carbon sinks [25], but can also increase total ET [13], creating complex trade-offs. Research specifically within the HRB has explored the dynamics of ET and GPP [26], highlighting the positive impact of vegetation restoration on productivity [27]. However, a clear consensus on the net effect of these changes on ecosystem efficiency is lacking. Some studies indicate an ET increase due to LUCC [26], while others report periodic declines in both ET and GPP due to drought [28], pointing to the complex and often contradictory interplay of factors.
Despite this growing body of work, several critical knowledge gaps remain for the HRB: Firstly, while studies acknowledge the joint regulation by climate and land use [11,12], a systematic quantification of their relative contributions and interactions in this critically water-stressed basin is lacking. Secondly, much of the research has focused on single fluxes (e.g., GPP or ET) [26], without an integrated exploration of the CUE and WUE metrics, which provide deeper insights into ecosystem functional strategies. Most importantly, a critical question remains unanswered: does the widely observed ‘greening’ in the HRB, a primary goal of ecological restoration, translate into improved ecosystem water use efficiency in this profoundly water-stressed basin? This potential decoupling represents a major uncertainty for regional sustainability. There is a pressing need for a comprehensive, simultaneous assessment of both CUE (carbon allocation efficiency) and WUE (water–carbon coupling efficiency) to unravel their divergent responses and potential trade-offs under the dual pressures of climate change and intense land use modification.
To address these gaps, this study comprehensively investigates the spatiotemporal dynamics of vegetation productivity (NPP and GPP), ET, and their efficiency metrics (CUE and WUE) in the HRB from 2001 to 2023. We aim to: (1) quantify the trends of these key ecological indicators; (2) critically assess whether the observed greening has led to improved water-use efficiency or if it coincides with a subtle but persistent decline in this crucial indicator; and (3) uncover the underlying mechanisms of the carbon–water decoupling phenomenon and discuss its implications for sustainable ecosystem management. The findings will provide a scientific basis for optimizing water resource management and ecological restoration strategies in the HRB and other similar water-limited, intensively managed regions worldwide.

2. Materials and Methods

2.1. Study Area

The Haihe River Basin is located in North China (112–120°E, 35–43°N), serving as the political, economic, and cultural center of China [15]. It encompasses a total area of approximately 318,000 km2, including major cities such as Beijing and Tianjin, as well as parts of Hebei, Shanxi, Shandong, Henan, Inner Mongolia and Liaoning. The basin’s terrain is high in the west and low in the east, with the Taihang Mountains and Loess Plateau in the west and the North China Plain in the east (Figure 1).
Climatically, the basin belongs to the temperate monsoon climate zone. The average annual precipitation is 500–600 mm, but its spatial distribution is highly uneven, showing a pattern of “more in the southeast and less in the northwest,” with over 70% of the precipitation concentrated between June and September [29]. In recent years, influenced by climate change and human activities, water resource shortages have become prominent in the basin, despite an increasing trend in extreme precipitation events [16]. Per capita water resources are critically low, and the expansion of the Beijing–Tianjin–Hebei urban agglomeration has further intensified water use pressure, threatening both ecological security and sustainable development.
The predominant vegetation types are temperate deciduous broadleaf forests and agricultural vegetation. The plain areas are primarily characterized by wheat-corn rotation systems, while mountainous areas host natural secondary forests and planted forests [30].
The Haihe River Basin is one of China’s most highly urbanized regions. Accompanied by rapid urbanization and high-intensity agricultural development, over 60% of the cultivated land employs irrigation [31]. This, coupled with rising industrial water demand, poses severe challenges to the regional ecological environment. Under the national strategy of Beijing–Tianjin–Hebei coordinated development, achieving a balance between economic growth and environmental protection has become a major challenge. This practical need makes the study of vegetation carbon and water use efficiencies in the basin not only scientifically significant but also of great practical value [17,18].

2.2. Data Sources and Pre-Processing

This study utilized a suite of multi-source datasets to comprehensively analyze the carbon–water dynamics in the Haihe River Basin (Table 1). To ensure data consistency and analytical reliability, all datasets underwent a consistent pre-processing workflow tailored to their specific characteristics.

2.2.1. Vegetation Data

Vegetation productivity and evapotranspiration data for the 2001–2023 period were sourced from the NASA Moderate Resolution Imaging Spectroradiometer (MODIS) Version 6.1 product suite [33,34]. Specifically, annual Net Primary Production (NPP) was obtained directly from the MOD17A3HGF product. To derive annual Gross Primary Production (GPP) and Evapotranspiration (ET), 8-day composite data from the MOD17A2HGF and MOD16A2GF products were utilized. These time-series datasets were processed on the Google Earth Engine (GEE) platform, where missing values were filled using linear interpolation before summing the valid 8-day pixel values to generate continuous annual total GPP and ET layers.

2.2.2. Meteorological Data

To ensure consistency among climatic drivers, key meteorological variables for the 2001–2023 period were primarily sourced from the ERA5-Land reanalysis dataset produced by the European Centre for Medium-Range Weather Forecasts (ECMWF). This included hourly data for 2 m air temperature and surface solar radiation downwards (SSRD), both at a native resolution of 0.1°. Daily precipitation data were obtained from the Climate Hazards Group InfraRed Precipitation with Station data (CHIRPS) Daily v2.0 dataset, which has a spatial resolution of 0.05°. All meteorological datasets were temporally aggregated from their native resolutions (hourly or daily) to an annual scale for trend analysis.

2.2.3. Topographic Data

Topographic data were represented by a Digital Elevation Model (DEM) derived from the Shuttle Radar Topography Mission (SRTM) 1 Arc-Second Global product, which features a spatial resolution of approximately 30 m. The SRTM is a product of a joint mission by the National Aeronautics and Space Administration (NASA; Washington, DC, USA) and the National Geospatial-Intelligence Agency (NGA; Springfield, VA, USA), and the data were acquired from the U.S. Geological Survey (USGS; Reston, VA, USA). The DEM was used to define the study area’s elevation and terrain features after being clipped using the vector boundary of the Haihe River Basin in ArcGIS 10.8.

2.2.4. Land Use Data

Annual land cover data from 2001 to 2023 were sourced from the 30 m China Land Cover Dataset (CLCD), developed by Yang and Huang [32]. This dataset classifies the land surface into nine primary types, including cropland, forest, shrub, grassland, water, ice and snow, barren, impervious surface, and wetland. The high-resolution data were used to analyze land use transformations and their impacts on CUE and WUE.

2.2.5. Data Pre-Processing

To ensure data quality and analytical reliability, this study conducted systematic pre-processing. A unified GeoTIFF format and WGS 1984 UTM Zone 50N projected coordinate system were adopted for all raster datasets. To address resolution differences, all datasets were resampled to a 500 m resolution to match the MODIS products, ensuring spatial consistency. Bilinear interpolation was used for continuous data (e.g., DEM, climate variables), while the nearest neighbor method was applied to categorical land use data to determine the dominant land cover type within each 500 m pixel. While interpolating coarser meteorological data to a finer resolution can introduce uncertainty, this unified 500 m scale is necessary for pixel-wise comparison with the primary MODIS vegetation datasets. The potential for mixed-pixel effects, especially when integrating 30 m land use data, is acknowledged as a limitation in the Discussion. For quality control, outliers were identified using the 5th and 95th percentiles and scrutinized with spatial autocorrelation analysis before removal or replacement. Missing values in continuous spatial data were filled using the Inverse Distance Weighting (IDW) method. This rigorous pre-processing workflow created a standardized and consistent dataset, establishing a solid foundation for subsequent analysis.

2.3. Research Methods

To comprehensively analyze the spatiotemporal dynamics of vegetation carbon and water use efficiencies and attribute their drivers, a multi-step analytical framework was implemented. This framework included the calculation of efficiency metrics, trend analysis, trend persistence evaluation, and a modeling approach to disentangle the contributions of climate change and human activities. The overall workflow of this study is depicted in Figure 2.

2.3.1. Calculation of Vegetation Carbon and Water Use Efficiencies

In this study, Vegetation Carbon Use Efficiency (CUE) is defined as the ratio of Net Primary Productivity (NPP) to Gross Primary Productivity (GPP), and Vegetation Water Use Efficiency (WUE) is defined as the ratio of Gross Primary Productivity (GPP) to actual Evapotranspiration (ET). The calculation formulas are as follows:
C U E = N P P G P P
W U E = G P P E T
where CUE is the vegetation carbon use efficiency (dimensionless); NPP and GPP are the net and gross primary productivity of vegetation, respectively (units: g C·m−2); ET is the actual evapotranspiration of vegetation (units: mm); and WUE is the vegetation water use efficiency (units: g C·m−2·mm−1).

2.3.2. Spatiotemporal Trend and Significance Analysis

To quantify the spatial change trends of CUE and WUE from 2001 to 2023, this study combined the Theil-Sen slope estimator with the Mann–Kendall (MK) significance test. This non-parametric approach is robust to outliers and does not assume a normal data distribution [35]. The formula for the Theil-Sen slope (β) is:
β = M e d i a n X j X i j i   f o r   j > i
where β is the estimated trend magnitude; X i and X j are the data values at time steps i and j, respectively.
The Mann–Kendall (MK) test was used to assess the statistical significance of the trend. It is a non-parametric test method suitable for determining whether data has a downward or upward trend over a period of time [36,37]. Given { C U E i }, i = 2001, …, 2020, the Z statistic is defined as:
Z = S 1 v a r   ( S ) ,   S > 0   0 ,   S = 0 S + 1 v a r   ( S ) ,   S < 0
where
S = j = 1 n 1 i = j + 1 n s g n ( C U E j C U E i )
s g n ( C U E j C U E i ) = 1 ,   C U E j C U E i > 0 0 ,   C U E j C U E i = 0 1 ,   C U E j C U E i < 0
v a r ( S ) = n ( n 1 ) ( 2 n + 5 ) 18
In the formula, C U E i and C U E j are the average CUE values for pixels in the ith and jth year, respectively, n represents the number of years, and s g n is the sign function. In this study, a trend was considered statistically significant at a significance level of p < 0.05, corresponding to |Z| > 1.96.

2.3.3. Trend Persistence Analysis

This study uses the Hurst exponent (H) analysis to evaluate the persistence of future changes in WUE and CUE, quantifying the self-similarity of the time series [38]. The Hurst exponent value (H) ranges between 0 and 1. When 0.5 < H < 1, it indicates a positive correlation, meaning the series tends to exhibit persistent behavior (i.e., a current trend is likely to continue). When H = 0.5, it indicates random walk behavior. When 0 < H < 0.5, it indicates a negative correlation or anti-persistent behavior, meaning a current trend is likely to reverse.

2.3.4. Attribution of Vegetation Trends Using Multiple Linear Regression

To disentangle the relative impacts of climate change and human activities on the trends of CUE and WUE, a pixel-based multiple linear regression (MLR) model was established [39,40]. This approach assumes that the observed inter-annual variations in CUE or WUE (Y) can be explained by variations in key climate factors:
Y = a × T m p + b × P r e + c × S r a d + ε
where Y is the dependent variable (annual CUE or WUE); Tmp, Pre, and Srad are the independent climate variables (annual mean temperature, total precipitation, and total solar radiation, respectively); a, b, and c are the partial regression coefficients; and ε is the residual term, representing the variance not explained by the selected climate variables and used as a proxy for the impact of non-climatic drivers, primarily interpreted as the net effect of human activities.
The long-term trend of a variable (e.g., S l o p e W U E ) can be decomposed into contributions from each driver. The contribution of a specific climate factor ( C f a c t o r ) is calculated as:
C f a c t o r = C o e f f i c i e n t f a c t o r × S l o p e f a c t o r
where C f a c t o r is the contribution of a specific climate factor to the overall trend of Y; C o e f f i c i e n t f a c t o r is the partial regression coefficient for that factor from the MLR model; and S l o p e f a c t o r is the long-term trend (calculated using Theil-Sen).
The contribution from human activities ( C h u m ) is the trend in the residual term (ε) of the regression:
C h u m = S l o p e ε
where C h u m is the contribution attributed to human activities; S l o p e ε is the long-term trend of the regression residuals (ε).
Thus, the observed trend is additively decomposed as:
S l o p e o b s C T m p + C P r e + C S r a d + C h u m
where S l o p e o b s is the observed trend of CUE or WUE, and the terms on the right are the calculated contributions from temperature, precipitation, solar radiation, and human activities, respectively.
Finally, the relative contribution rate of each climate factor was calculated to assess its proportional influence among all climatic drivers.

2.3.5. Sensitivity Analysis

To complement the attribution analysis, we conducted a sensitivity analysis to determine which climate variable exerts the strongest control over CUE and WUE within our model, regardless of its long-term trend. The sensitivity coefficient (Sk) measures the percentage change in the dependent variable (e.g., WUE) resulting from a 1% change in an independent climate variable, holding other variables constant. It is defined as:
S k f a c t o r = C o e f f c i e n t f a c t o r × ( M e a n f a c t o r / M e a n Y )
where S k f a c t o r is the sensitivity coefficient for a specific climate factor; M e a n f a c t o r is the long-term mean of the climate factor; and M e a n Y is the long-term mean of the dependent variable (CUE or WUE). A higher absolute value of Sk indicates that the ecosystem variable is more sensitive to changes in that particular climate factor, highlighting its primary role in governing the system’s response.

3. Results

3.1. Spatiotemporal Patterns and Trends of Vegetation Productivity, Evapotranspiration, and Water–Carbon Use Efficiency

3.1.1. Spatiotemporal Distribution of Vegetation Factors

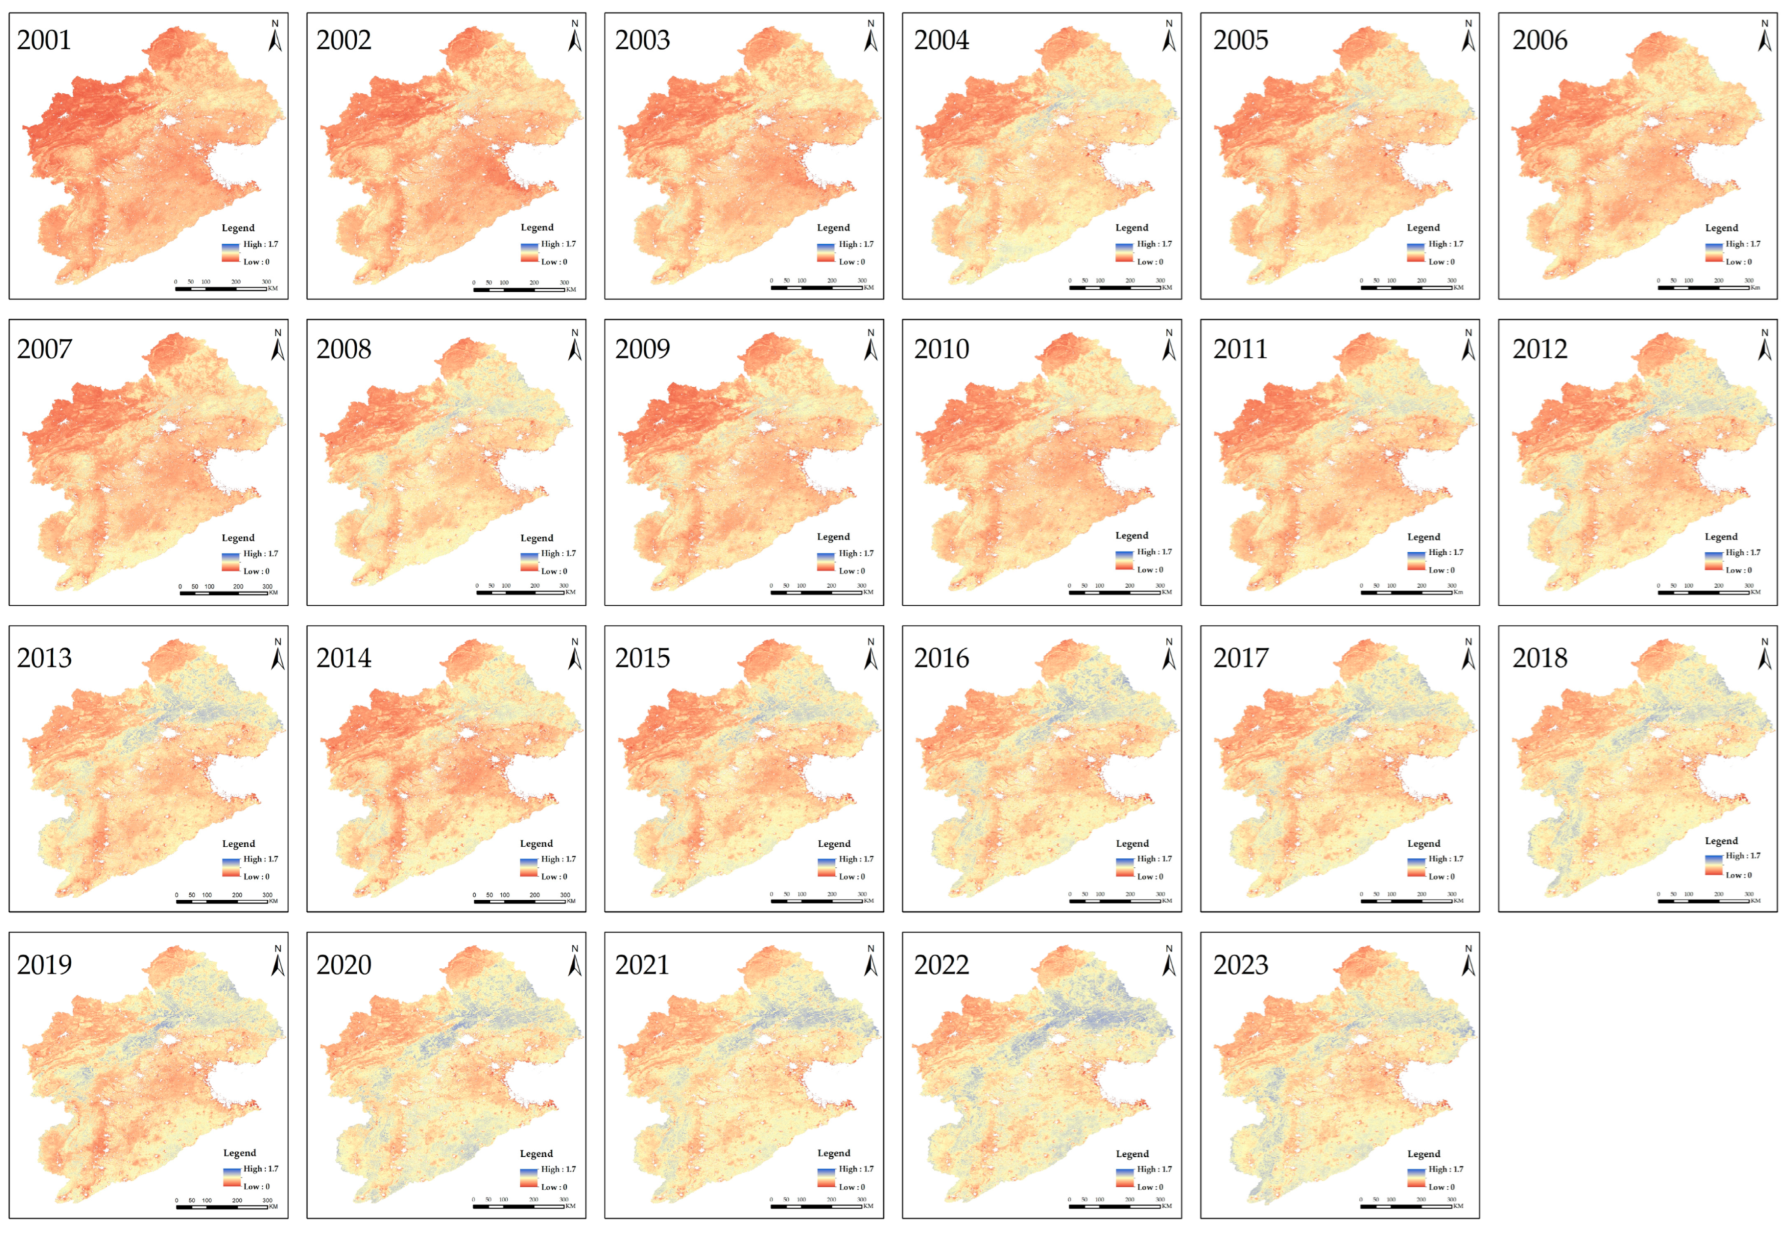
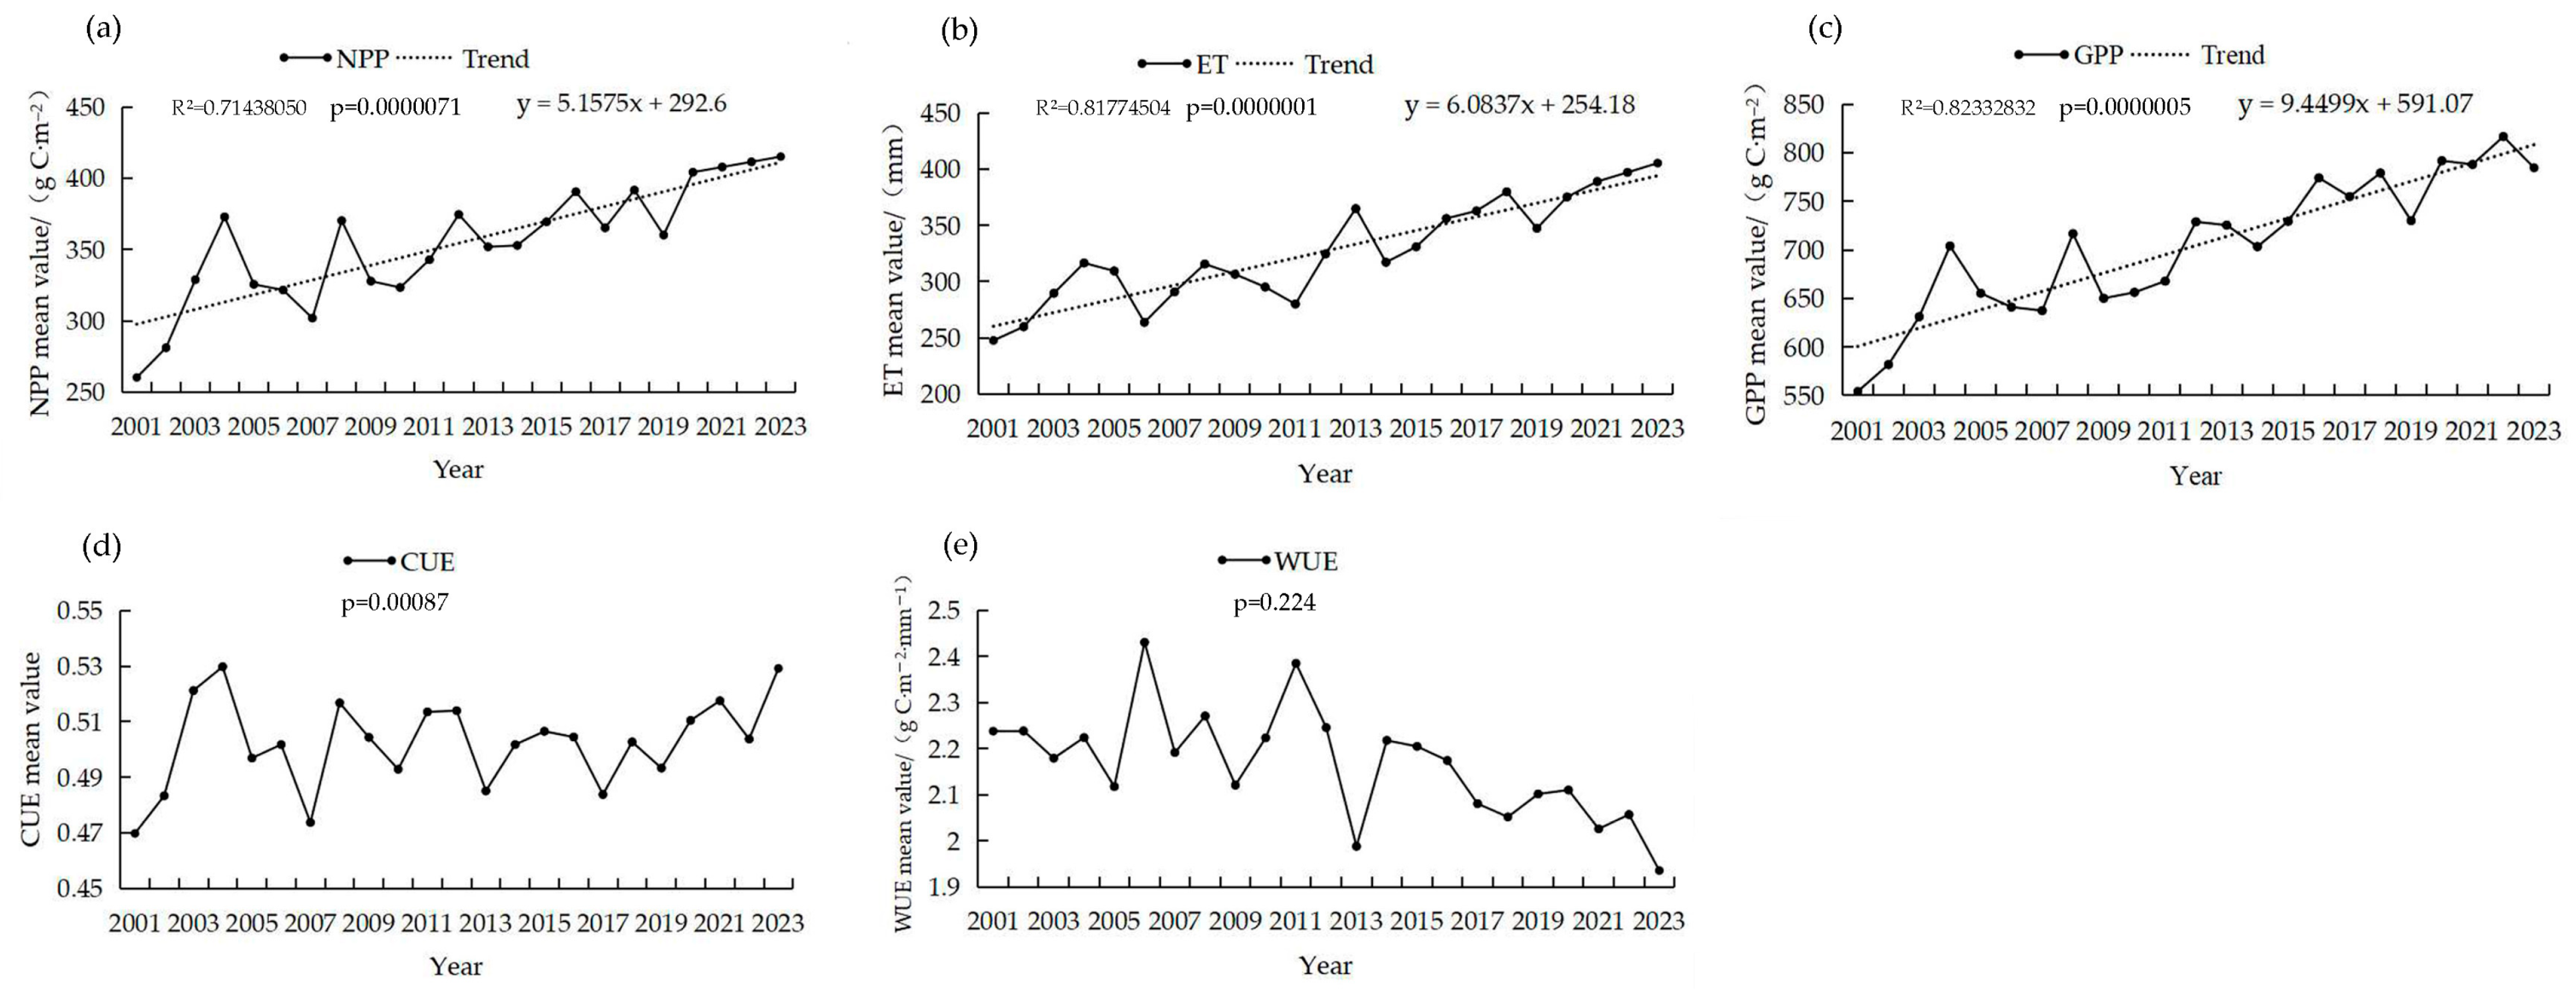
From 2001 to 2023, the mean annual net primary productivity (NPP) in the HRB was 388.24 g C·m−2. NPP exhibited significant spatial heterogeneity (Appendix A, Figure A1), with high values (>400 g C·m−2) mainly distributed at the southern foot of the Yanshan Mountains in the northeast and the transitional zone from hills to plains at the eastern foot of the Taihang Mountains in the southwest. These areas are characterized by cropland and forests with high vegetation cover. Low values (<300 g C·m−2) were primarily located in the northwestern parts of the basin, dominated by Grassland with sparser vegetation cover. Temporally, the basin-wide mean NPP showed a fluctuating increasing trend with a rate of 5.16 g C·m−2·yr−1 (p < 0.01) (Figure 3a).
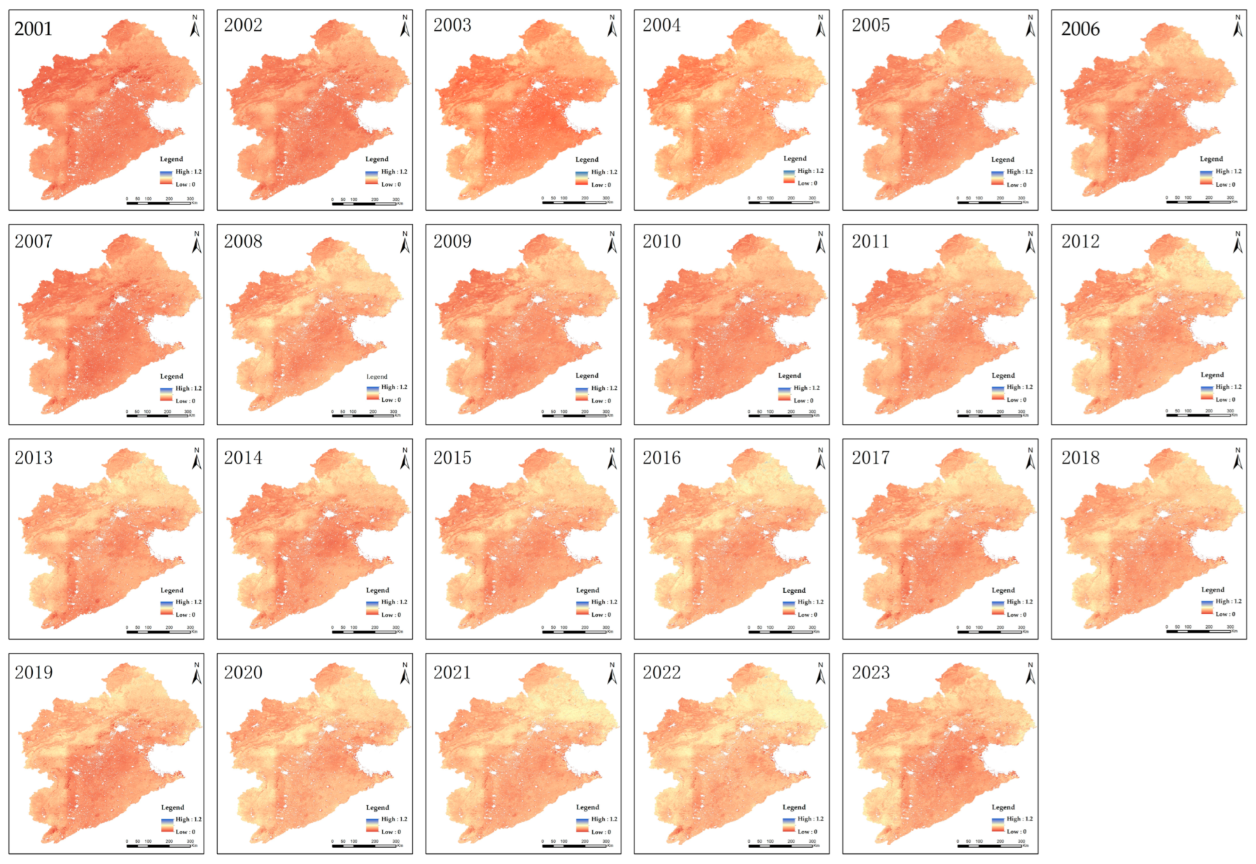
The mean annual gross primary productivity (GPP) was 704.47 g C·m−2 (Figure A2). Similar to NPP, GPP exhibited a clear gradient distribution, with high values (>600 g C·m−2) concentrated in the southern North China Plain, southern Yanshan–Taihang mountainous areas, and the northeastern region. Low values (<400 g C·m−2) were mainly found in the northwest. The spatial distribution of GPP was highly consistent with that of NPP. The basin-wide mean GPP also showed a fluctuating increasing trend with a rate of 9.45 g C·m−2·yr−1 (p < 0.01) (Figure 3b).
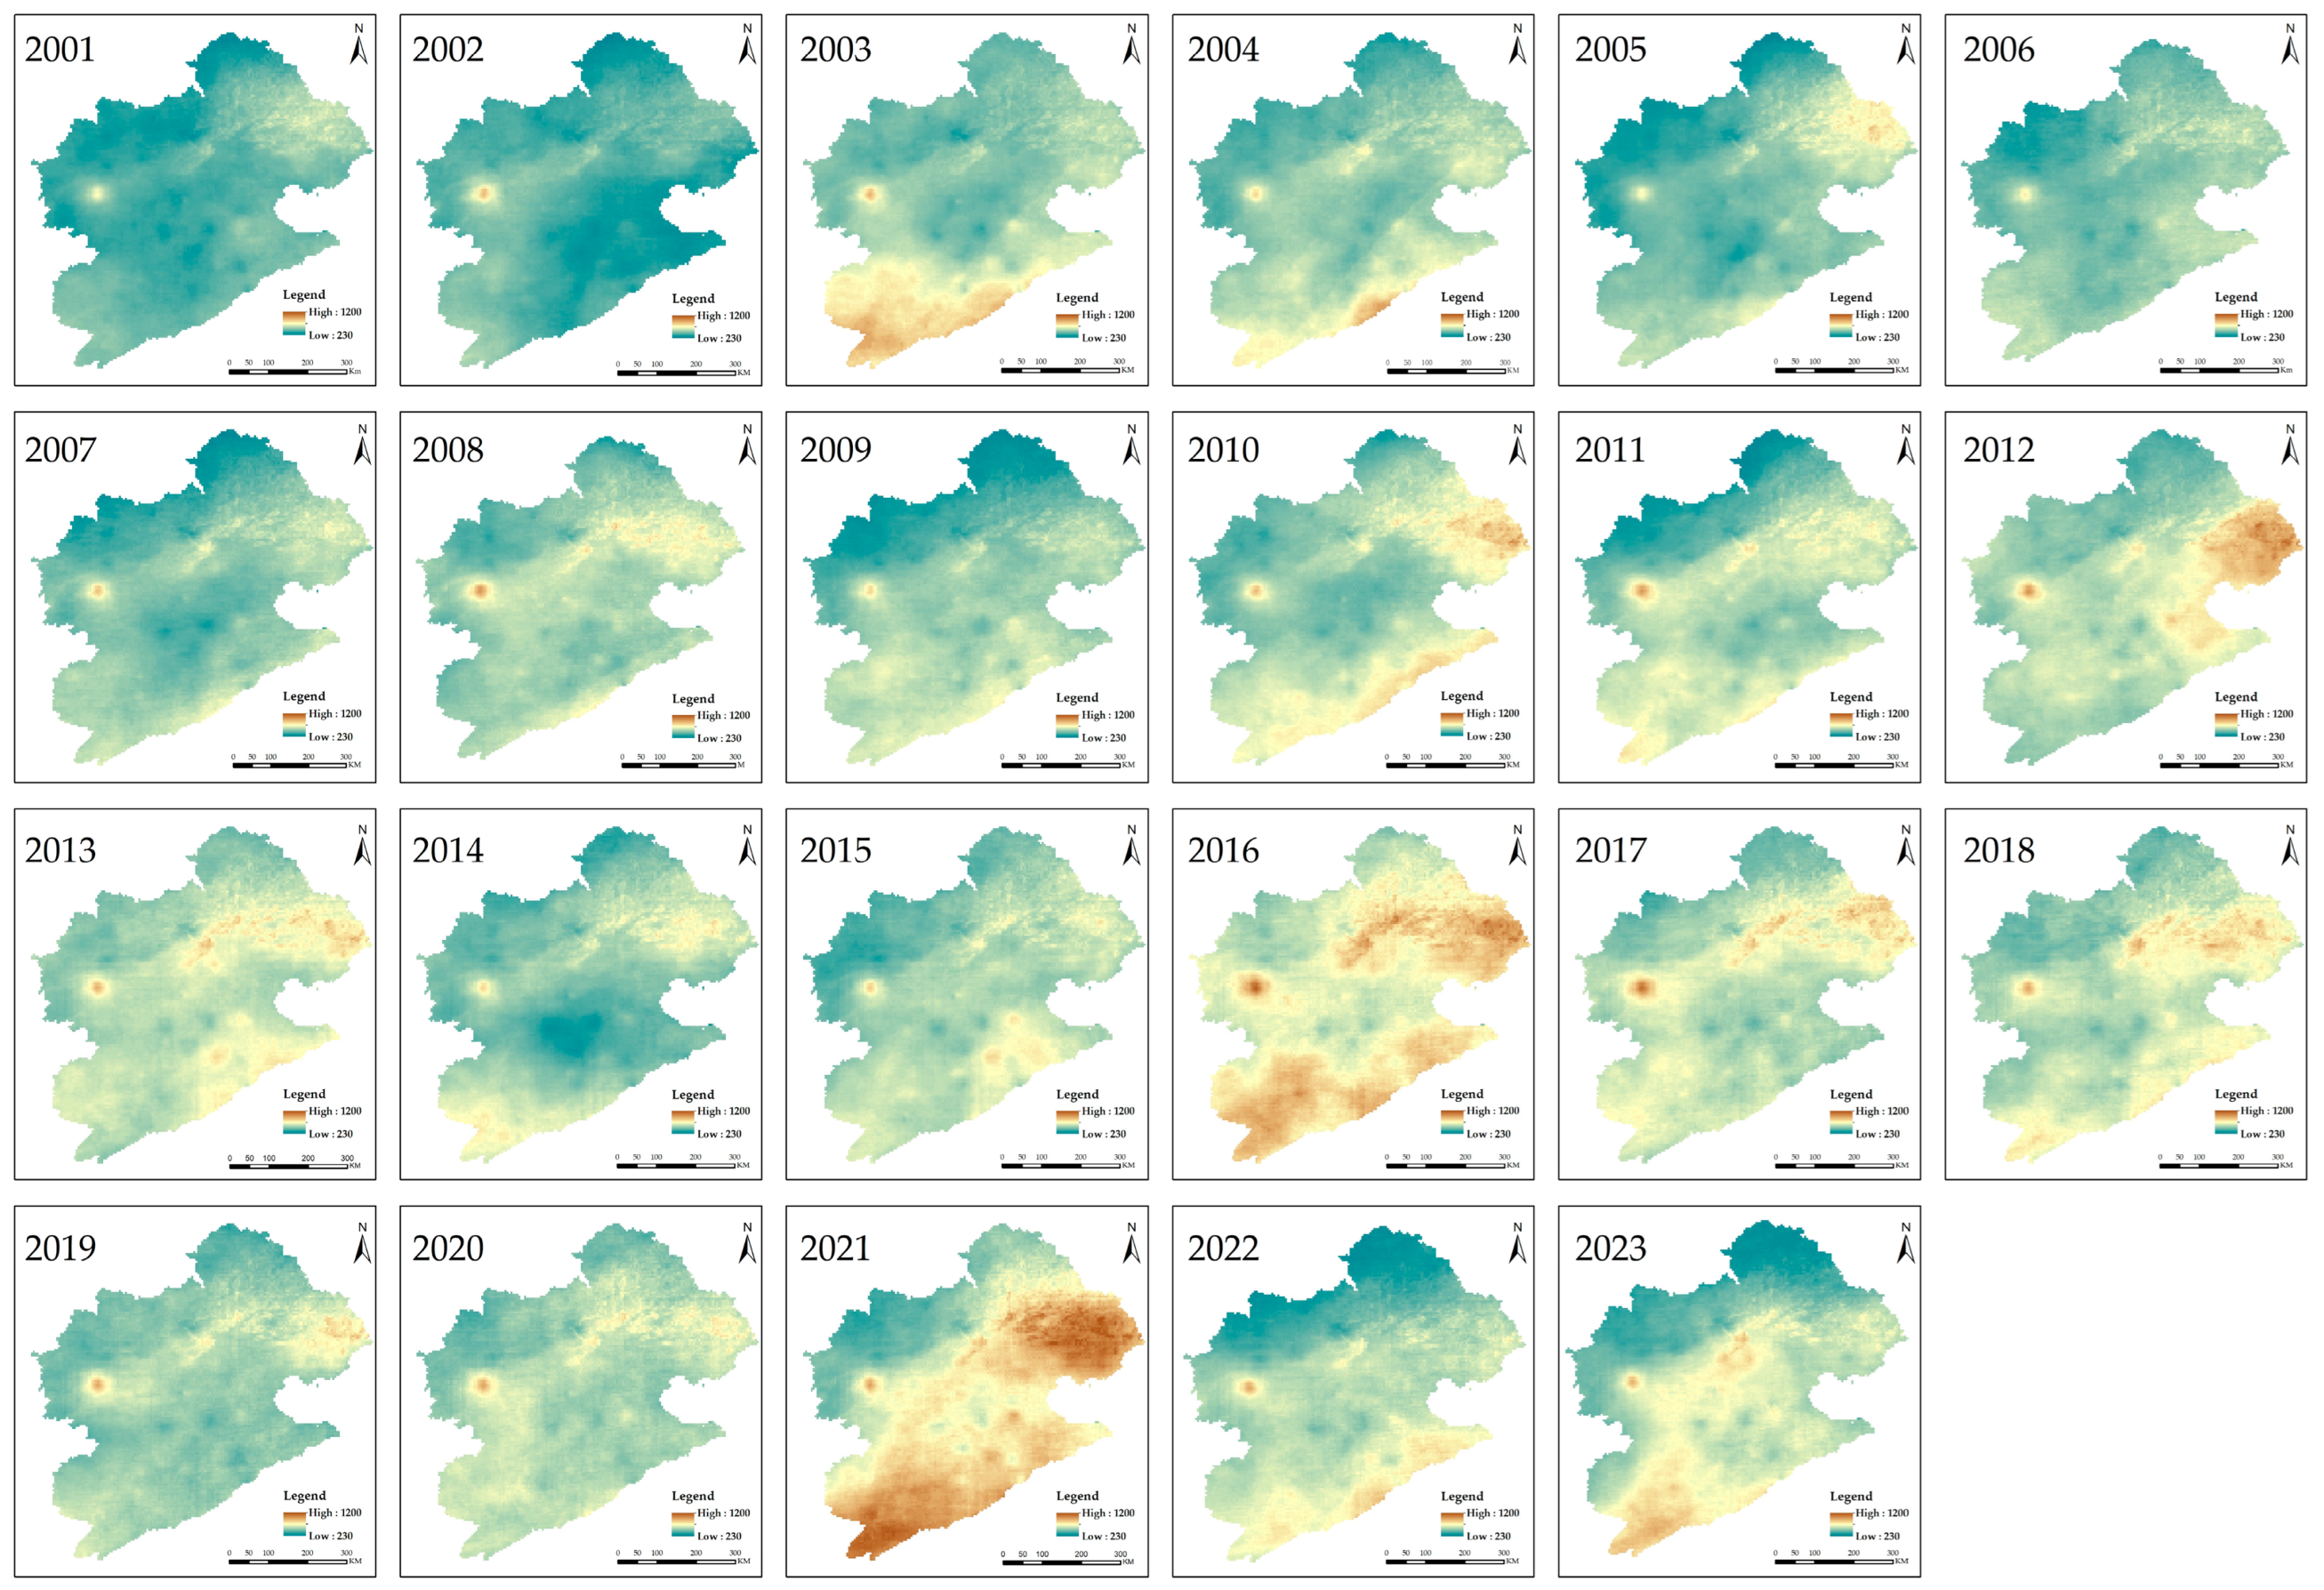
The mean annual actual evapotranspiration (ET) was 327.18 mm (Figure A3). ET generally decreased from northeast to southwest. High values (>500 mm) were observed in the northeastern forested areas of the Yanshan–Taihang Mountains and the agricultural areas in the southern North China Plain. Low values (<300 mm) were mainly in the northwestern basin. The basin-wide mean ET showed a fluctuating increasing trend with a rate of 6.08 mm·yr−1 (p < 0.01) (Figure 3c).
Overall, NPP, GPP, and ET all showed increasing trends from 2001 to 2023, with GPP exhibiting the highest increasing rate, followed by ET, and then NPP.

3.1.2. Spatiotemporal Distribution of Vegetation Carbon and Water Use Efficiencies

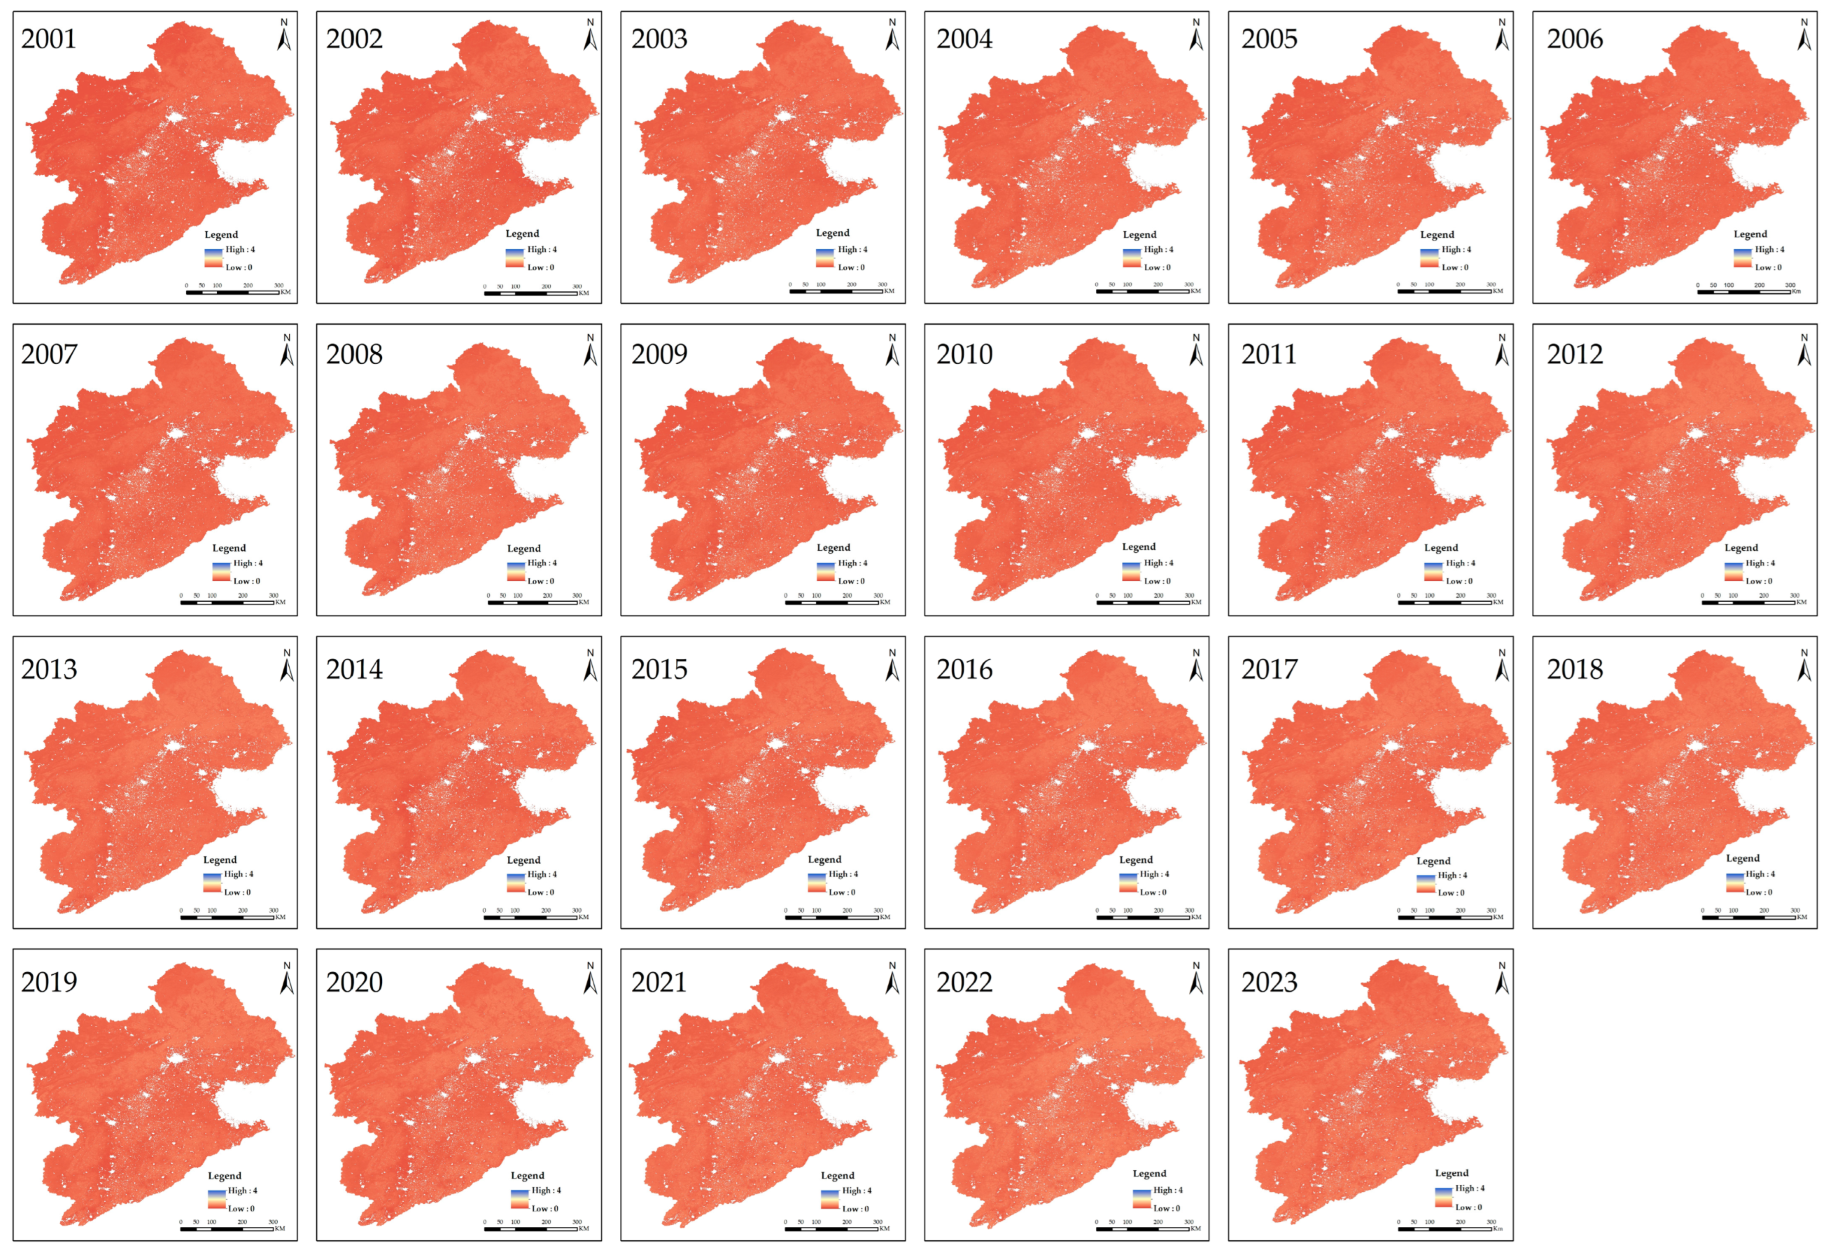
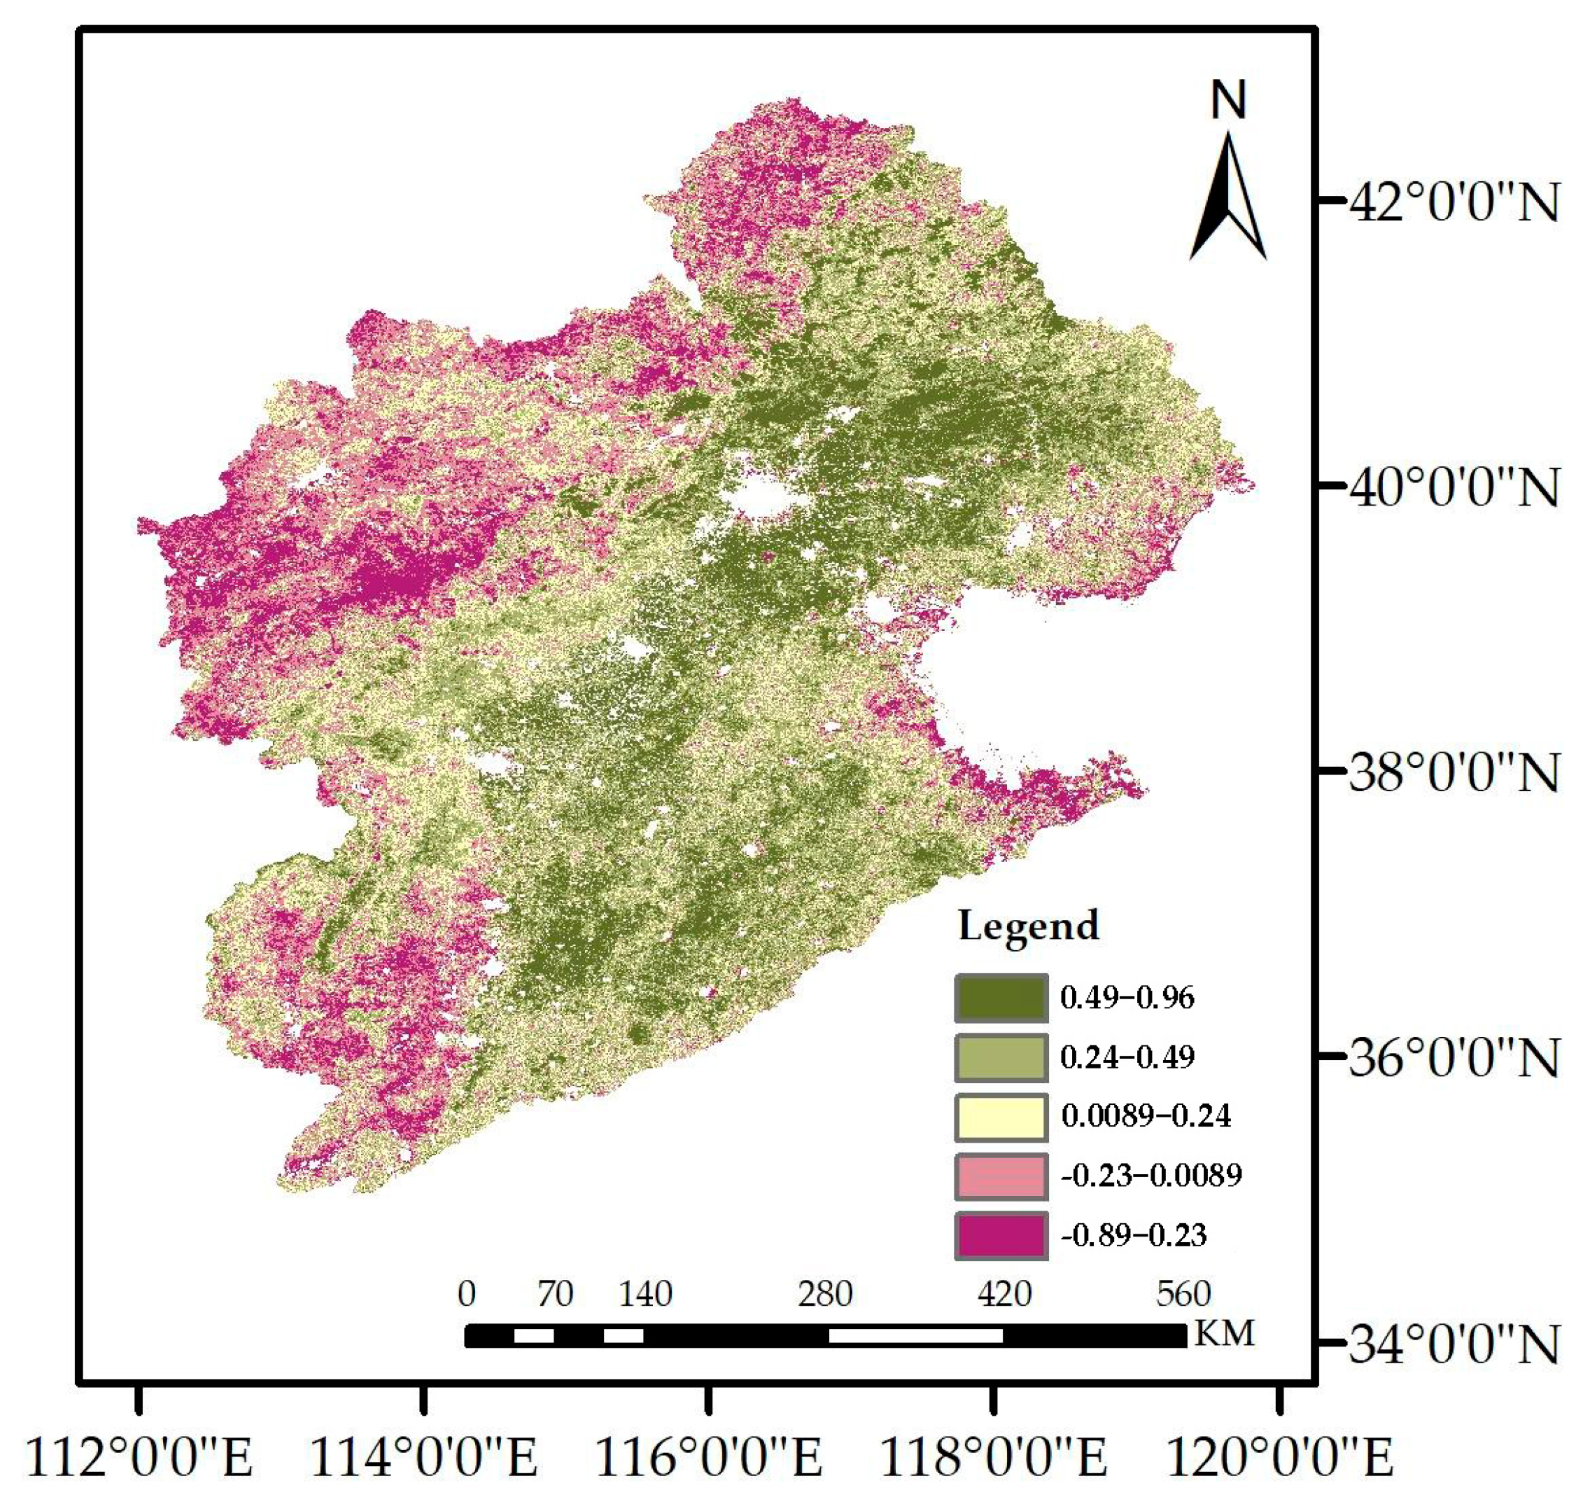
Over the study period, the basin-wide mean CUE was 0.502, showing a fluctuating upward trend (slope = 0.0006 yr−1, p > 0.05), but not statistically significant (Figure 3d). Spatially, CUE exhibited a gradient distribution with higher values in the northwest and lower values in the southeast (Figure 4). In the annual average across the study period (using 2022 as a representative year for illustration), areas with CUE > 0.5 accounted for approximately 64% of the basin, while areas with CUE < 0.5 accounted for about 36%.
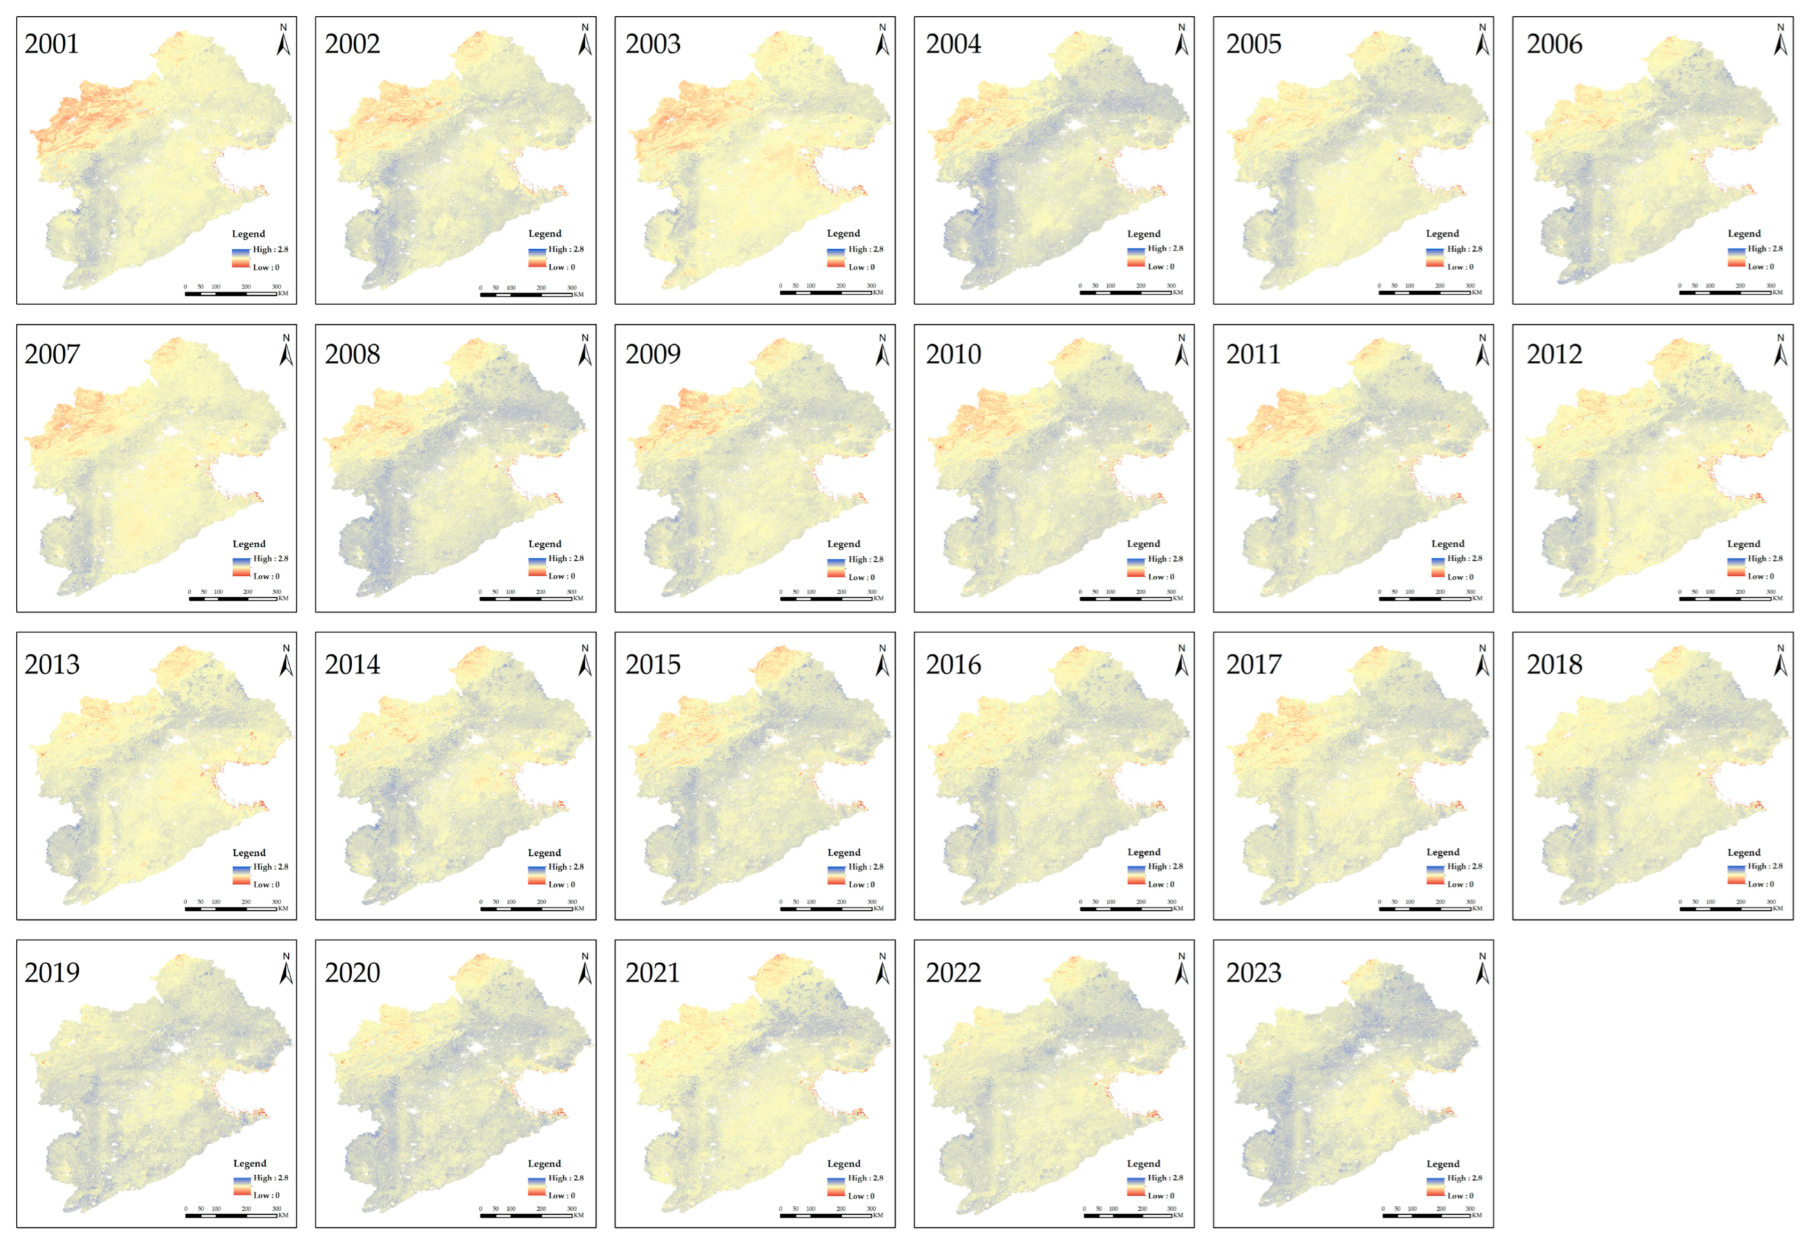
Over the entire 23-year period, the basin-wide WUE showed a fluctuating but statistically significant decreasing trend (slope = −0.01 g C·m−2·mm−1·yr−1, p < 0.01) (Figure 3e). It is crucial to note that while the slope’s magnitude (−0.01) indicates a gradual rate of decline, its high statistical significance (p < 0.01) confirms that this is not a random fluctuation but a consistent and persistent downward trajectory over the past two decades. This finding resolves any apparent discrepancy between the visually subtle trend in the time-series plot and its robust statistical certainty, highlighting a slow but undeniable erosion of water efficiency. Spatially, higher WUE values were observed in the western mountainous areas and northeastern regions, while lower values were found in the northwest (Figure 5). Areas with WUE > 2.0 g C·m−2·mm−1 comprised approximately 34.5% of the study area, while the majority (64.3%) fell within the range of 0.8–2.0 g C·m−2·mm−1.
The spatial distributions of high CUE and high WUE did not completely overlap. The mean CUE values across different land use types ranked as follows: barren land (0.660) > grassland (0.611) > forest (0.505) > shrub (0.503) > cropland (0.4986) > impervious land (0.4985). The extremely high CUE for barren land is considered a data artifact. It is important to note that CUE for ‘barren land’ likely represents sparsely vegetated pixels within this land cover class, as MODIS GPP/NPP for truly bare surfaces would be near zero, making the CUE ratio unstable and physically questionable. The higher CUE in grassland compared to forest is plausible, as mature forests often allocate a larger fraction of GPP to autotrophic respiration for maintenance of large biomass, whereas grasslands can have a higher proportion of production allocated to new growth. Mean WUE values ranked as: shrub (1.541 g C·m−2·mm−1) > forest (1.515 g C·m−2·mm−1) > grassland (1.475 g C·m−2·mm−1) > impervious land (1.398 g C·m−2·mm−1) > cropland (1.397 g C·m−2·mm−1) > barren land (0.940 g C·m−2·mm−1). Shrub and forest exhibited higher mean WUE than other land use types.

3.1.3. Evolution Trend of Vegetation Carbon and Water Use Efficiencies

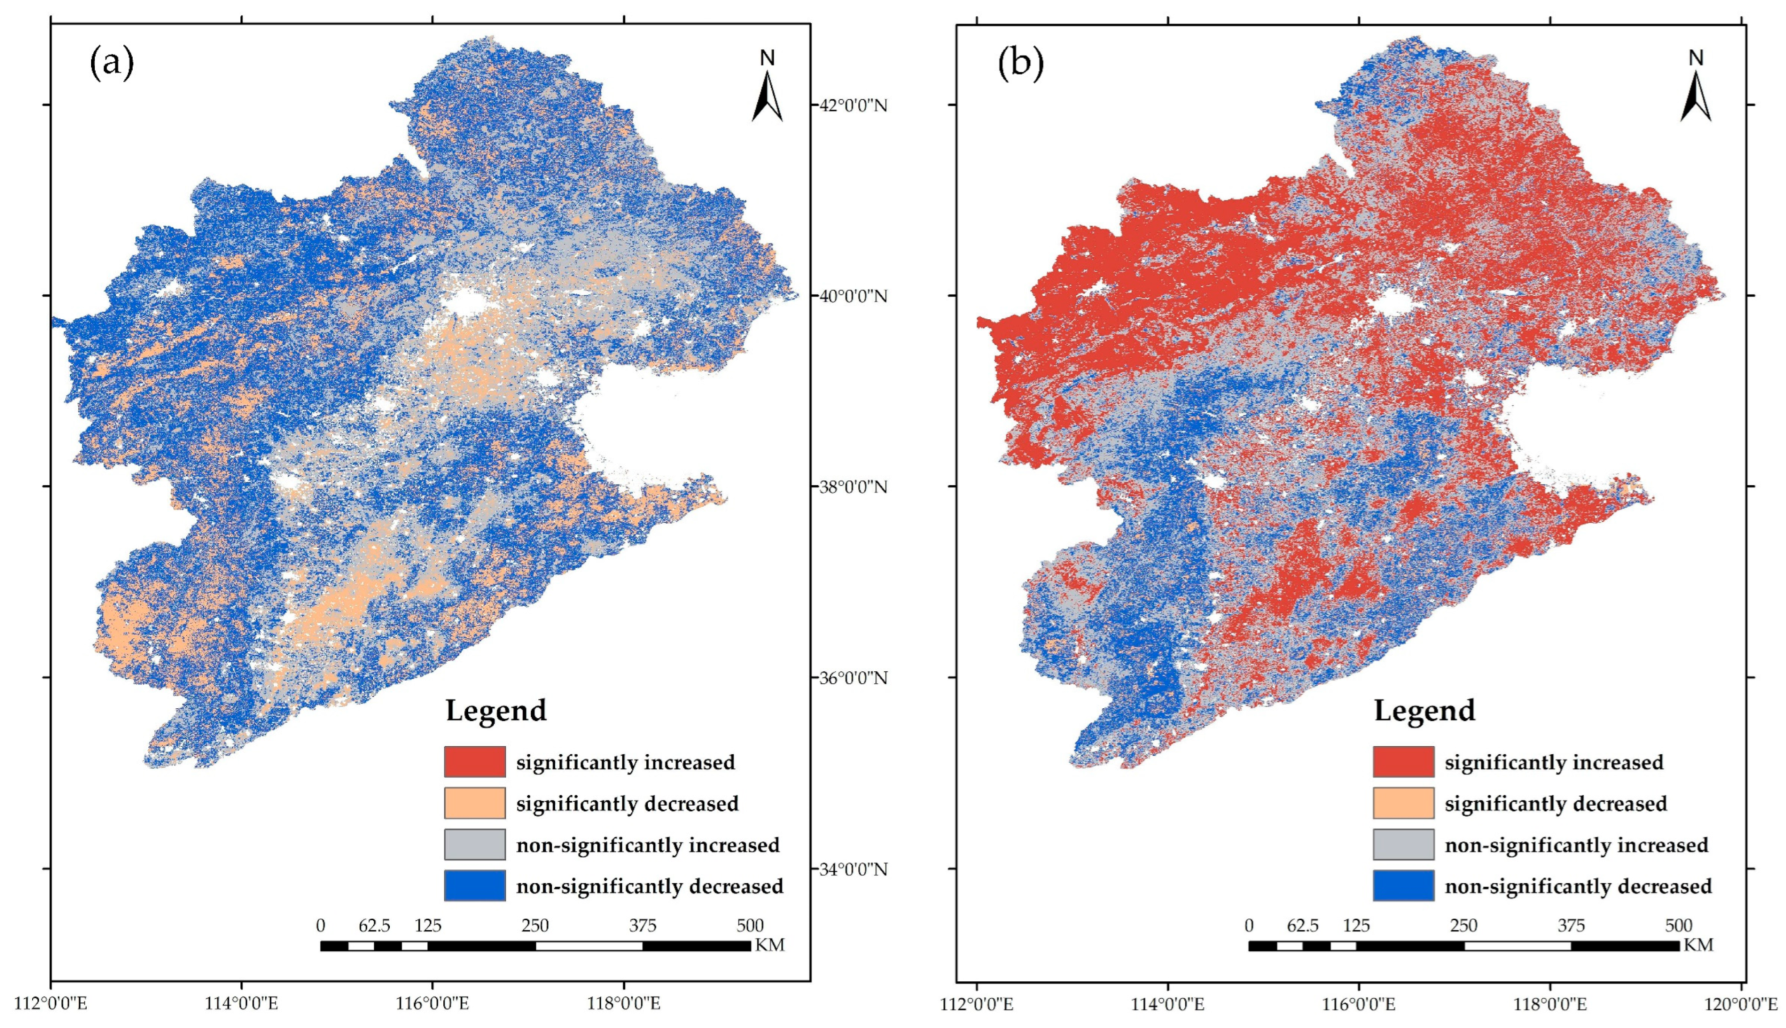
The Theil-Sen trend analysis (β) for CUE ranged from −0.036 to 0.026 yr−1 (Figure 6). Areas with a decreasing trend were more widespread (45.51% non-significant and 15.65% significant) than those with an increasing trend (31.87% non-significant and 6.97% significant). The significant decreases (15.65%) were mainly concentrated in the western mountainous region.
The Theil-Sen trend analysis (β) for WUE ranged from −0.089 to 2.15 g C·m−2·mm−1·yr−1 (Figure 6). The majority of the study area (78.56%) exhibited an increasing trend. Specifically, 40.80% of the area showed a significant increasing trend (|Z| > 1.96), located primarily in the northern region, while 37.76% showed a non-significant increase. In contrast, only a small portion of the basin experienced a decrease, with 2.88% showing a significant decline and 18.56% a non-significant decline, mostly concentrated in the southern region. The apparent contradiction between a basin-wide decreasing trend (Figure 3e) and a spatially dominant increasing trend is resolved by noting that the magnitude of decline in the southern areas was substantially larger than the magnitude of increase elsewhere, thus driving the overall average downward.
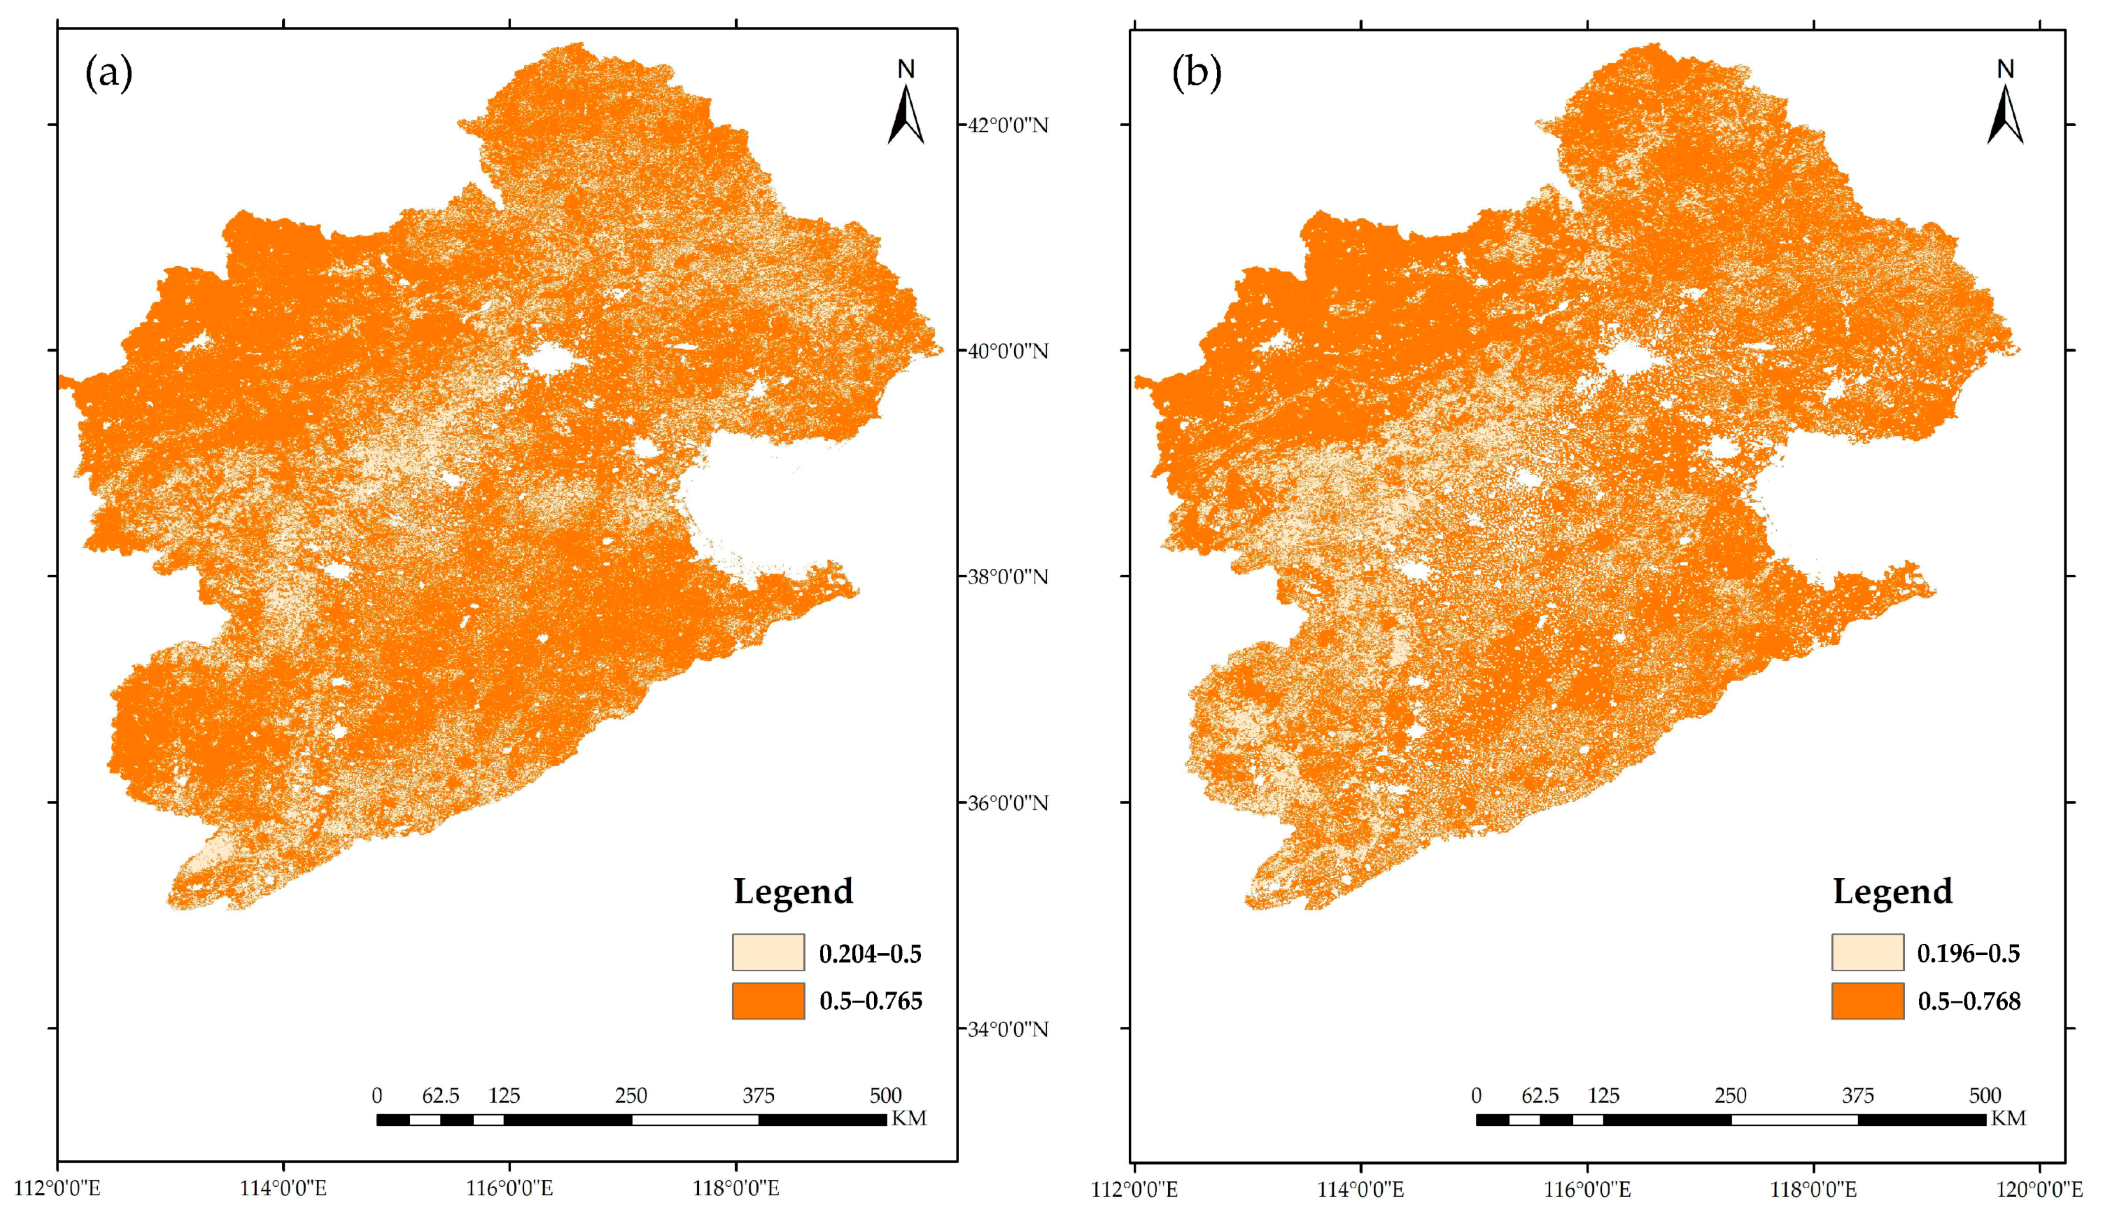
Hurst index analysis indicated that CUE changes generally showed strong persistence (H > 0.5), ranging from 0.204 to 0.765 (Figure 7a). High H values (strong persistence) were widespread in Urban and Cropland areas, particularly within the Beijing–Tianjin–Hebei core region and surrounding intensive agricultural zones. Areas with low H values (H < 0.5), indicating weaker persistence or anti-persistence, were less prevalent and mainly found in ecological transition zones such as mountainous areas.
WUE changes also showed general persistence (H > 0.5), ranging from 0.196 to 0.768 (Figure 7b). However, areas with weaker persistence (H < 0.5) were more spatially concentrated and corresponded with recent urban expansion areas.

3.2. Spatiotemporal Patterns and Changes in Climate Factors and Land Use

3.2.1. Spatiotemporal Distribution of Climate Factors

The mean annual temperature (Temp) in the HRB from 2001 to 2023 was 19.12 °C (Figure A4). Temperatures were higher in the southeastern plain areas, with the highest values in southern Hebei Province, and lower in the northeastern region (including northern Hebei, Liaoning, and Inner Mongolia) due to higher latitude and altitude.
The mean annual precipitation (Precip) was 557.32 mm (Figure A5). Higher precipitation was concentrated in northeastern and southern Hebei Province, influenced by monsoons and terrain uplift. Lower precipitation was found primarily in the northwestern region.
The mean annual solar radiation (SR) was 5735.14 MJ·m−2 (Figure A6). Higher solar radiation was concentrated in the northwestern region, attributed to higher altitude. Lower solar radiation was observed in the northeastern region.

3.2.2. Evolution Trend of Climate Factors

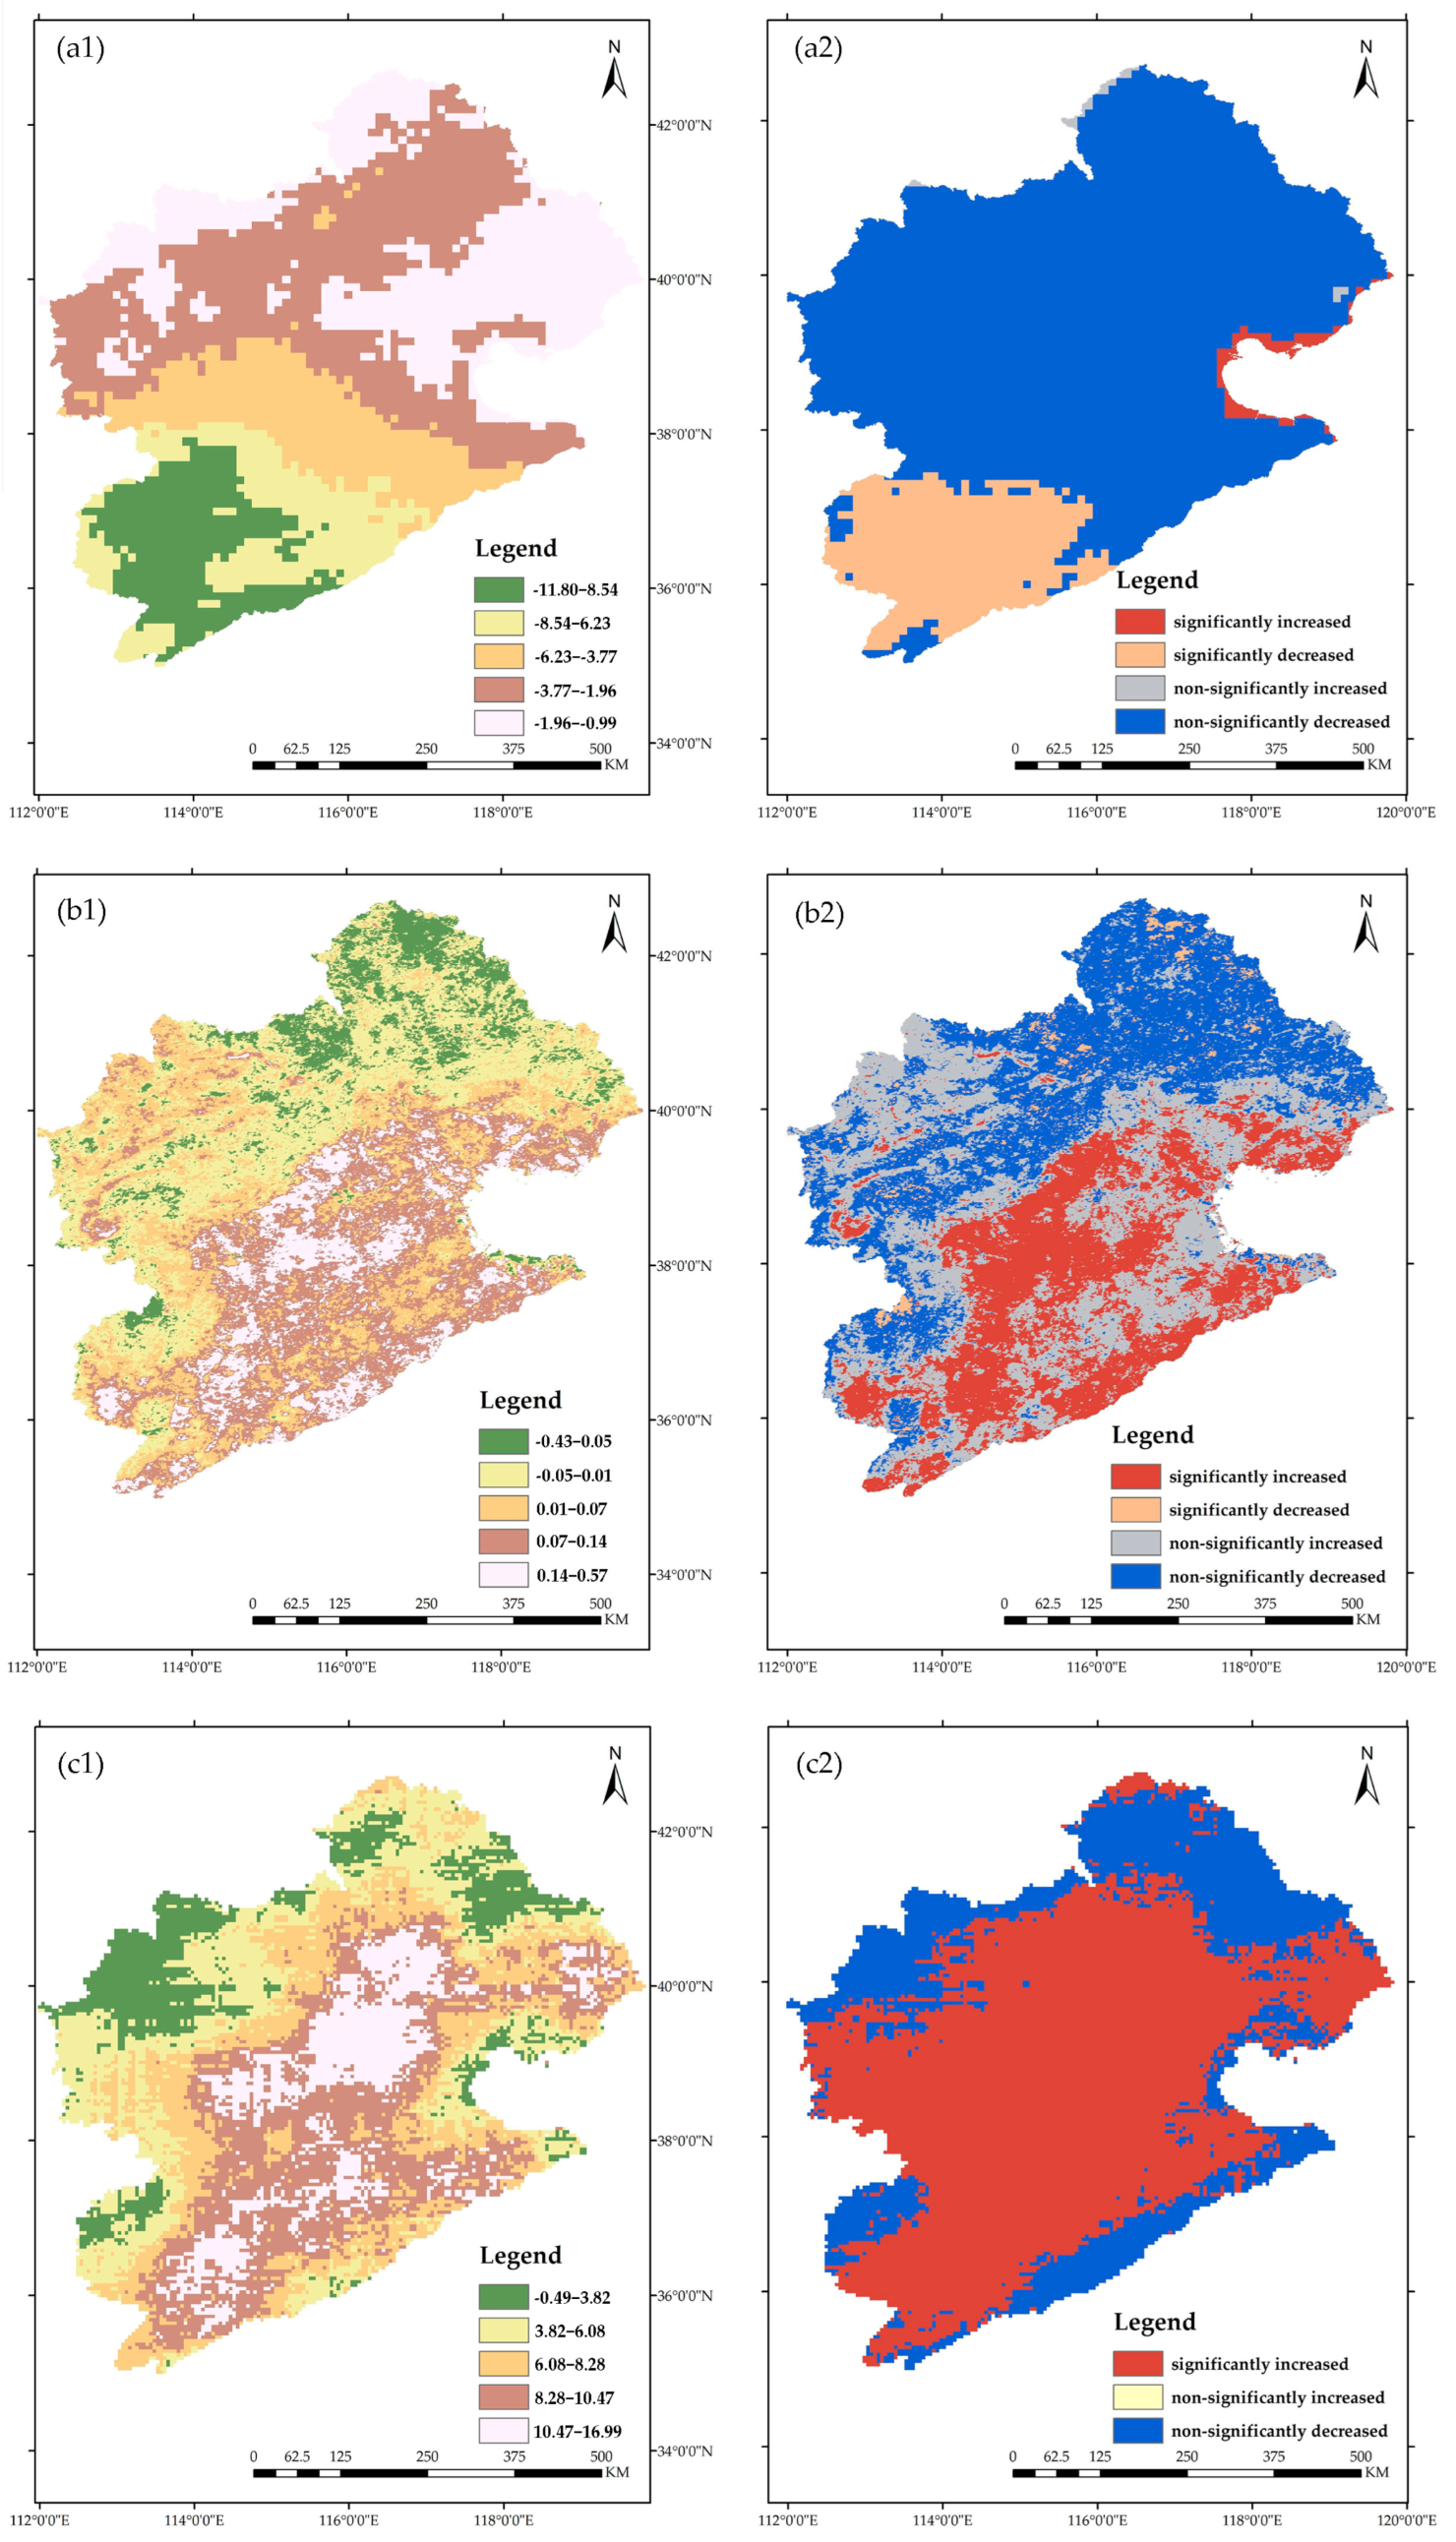
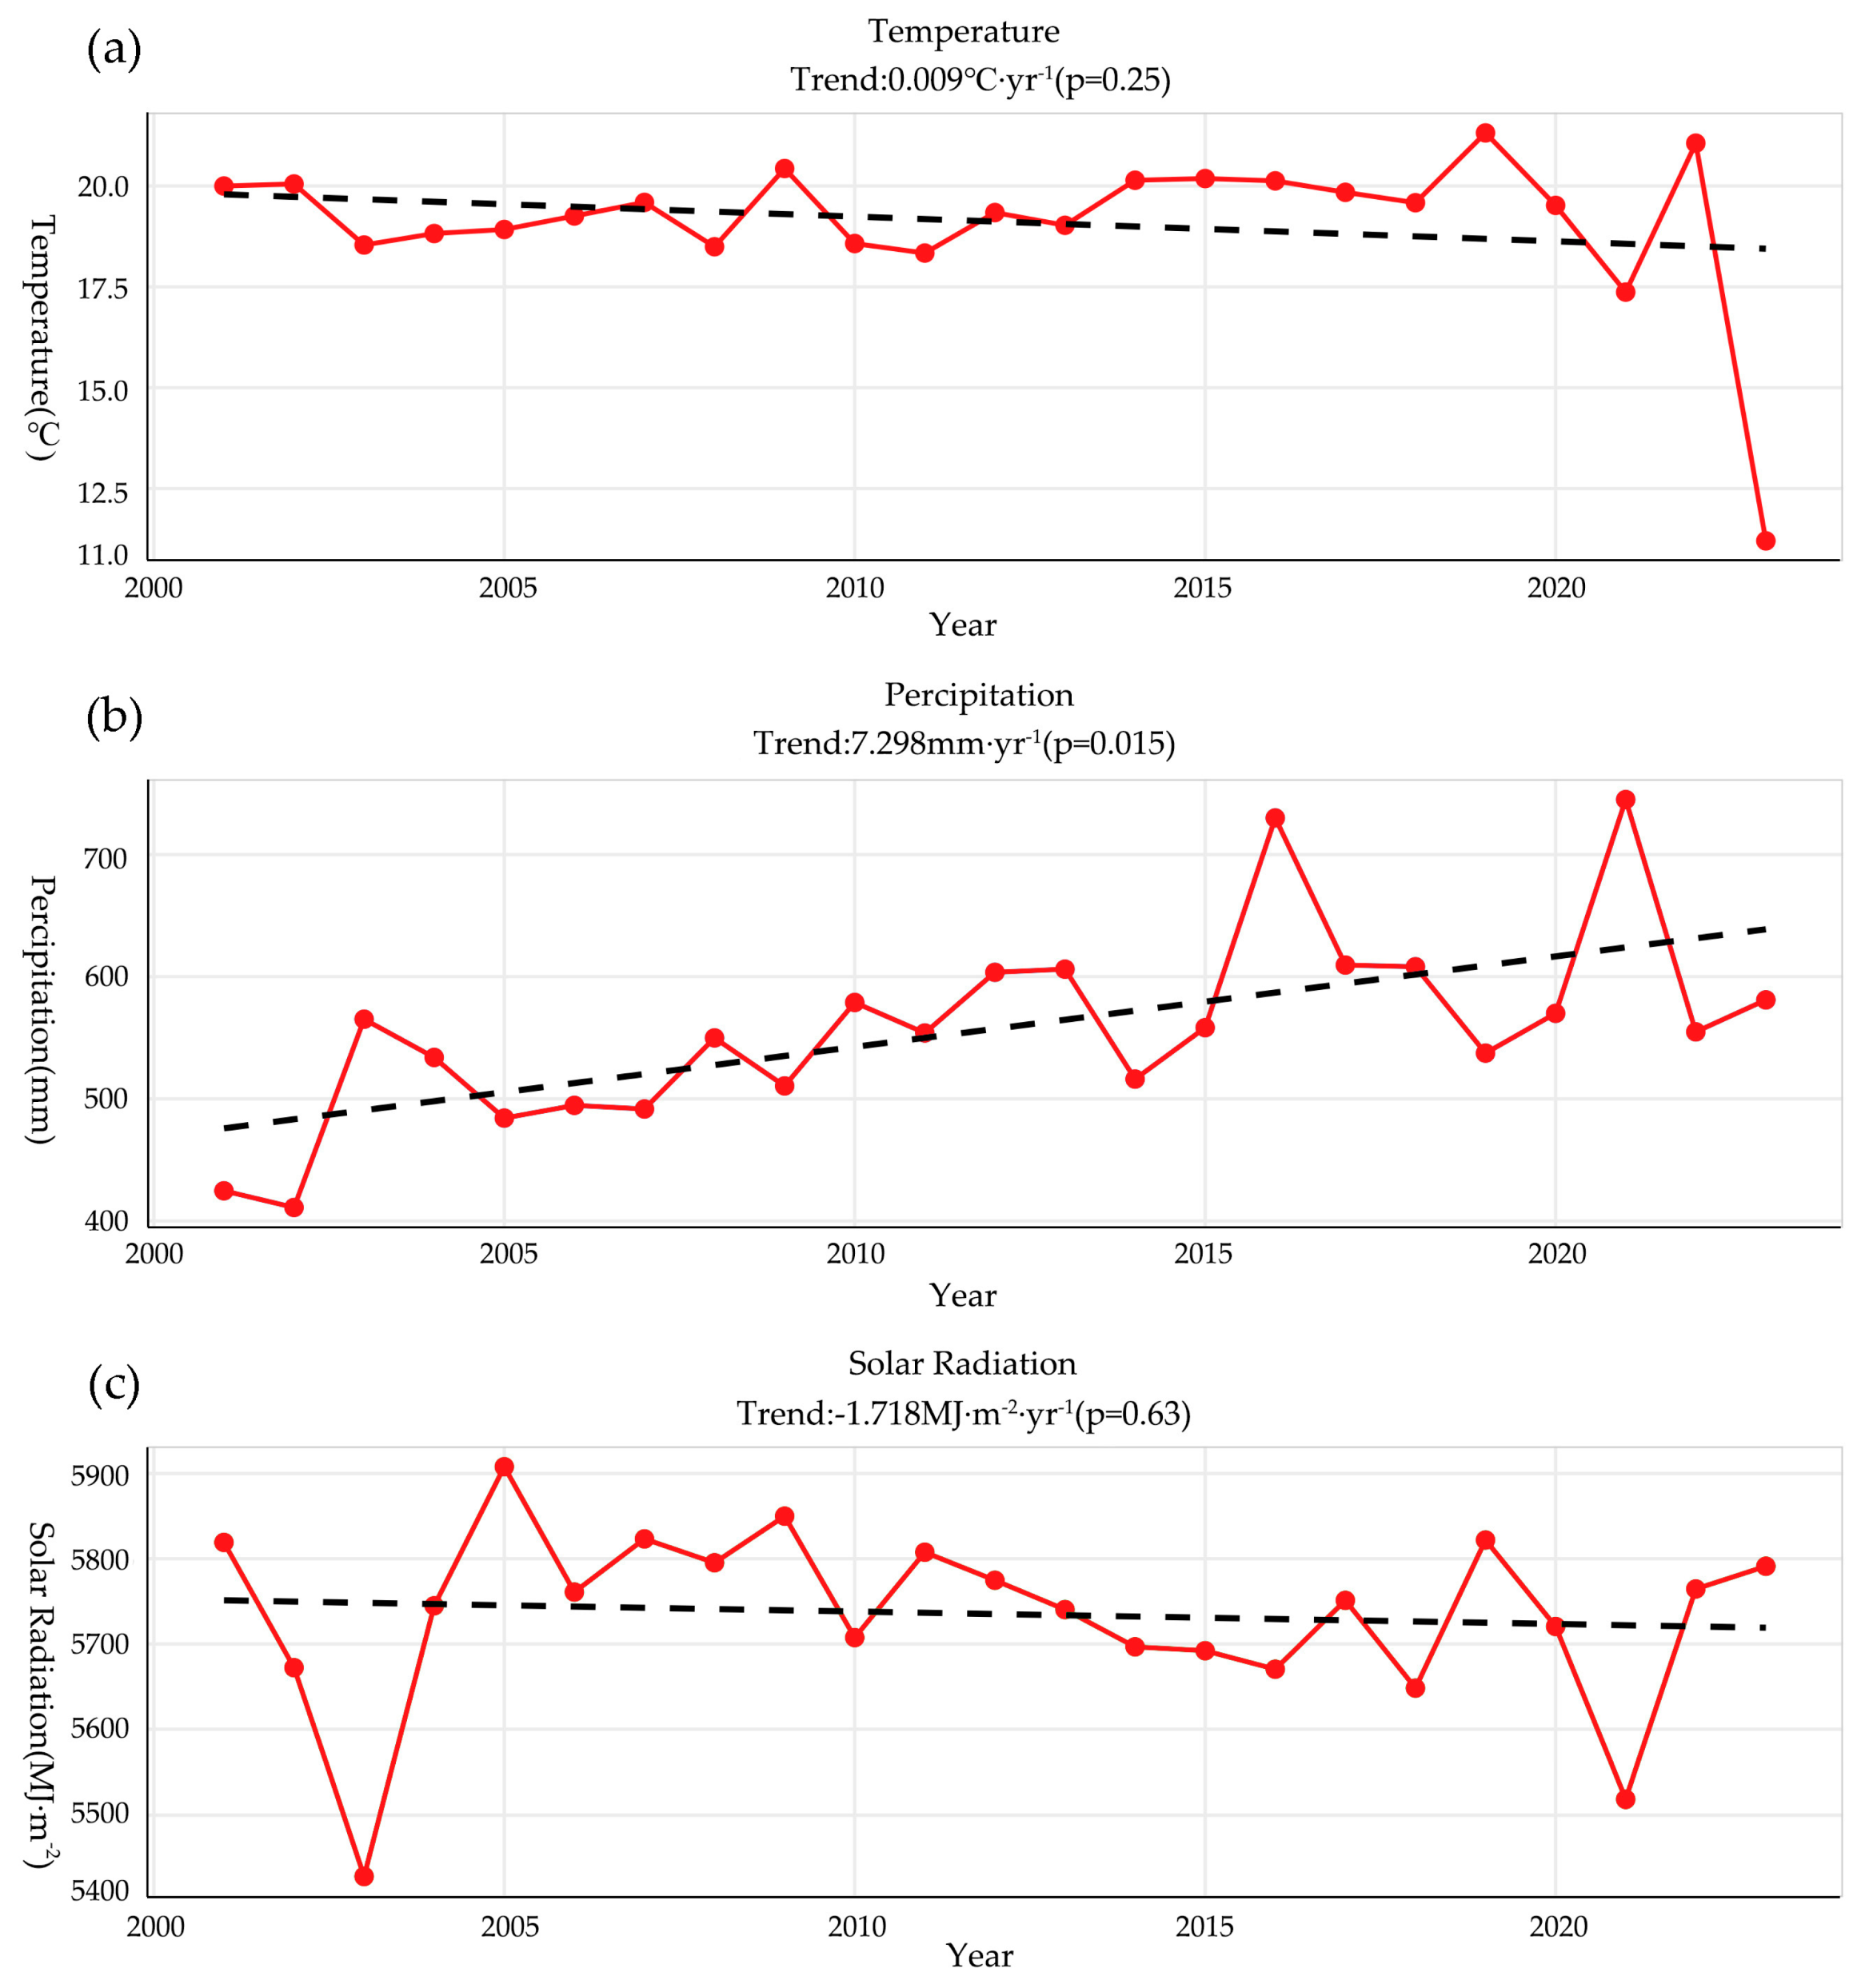
Temperature trends (Theil-Sen slope β) ranged from −0.47 to 0.526 °C·yr−1 (Figure 8(a1,a2)). A larger proportion of the area showed an increasing trend. Significant warming trends (∣Z∣ > 1.96) were found in 26.7% of the area, located around the Bohai Sea and in the southeastern basin (southern Hebei, Tianjin, northern Shandong, and Henan). The overall basin-wide mean temperature showed a fluctuating increasing trend, with a non-significant linear rate of 0.009 °C·yr−1 (p > 0.05) (Figure 9a).
Precipitation trends ranged from −0.49 to 16.99 mm·yr−1 (Figure 8(b1,b2)). Most areas showed an increasing trend, which was generally significant (∣Z∣ > 1.96). Stronger increasing trends were observed in the central basin (Beijing, central and southern Hebei, northern Shandong, and Henan). The overall basin-wide mean precipitation showed a fluctuating increasing trend with a significant linear rate of 7.298 mm·yr−1 (p < 0.05) (Figure 9b).
Solar radiation trends ranged from −11.80 to 0.99 MJ·m−2·yr−1 (Figure 8(c1,c2)). Most areas showed a decreasing trend (negative β). The decrease was significant in the southern region (∣Z∣ > 1.96) and less significant in the north. The overall basin-wide mean solar radiation showed a fluctuating decreasing trend with a non-significant linear rate of −1.718 MJ·m−2·yr−1 (p > 0.05) (Figure 9c). Years with high precipitation often corresponded to lower solar radiation, indicating the attenuating effect of cloud cover.

3.2.3. Land Use Change

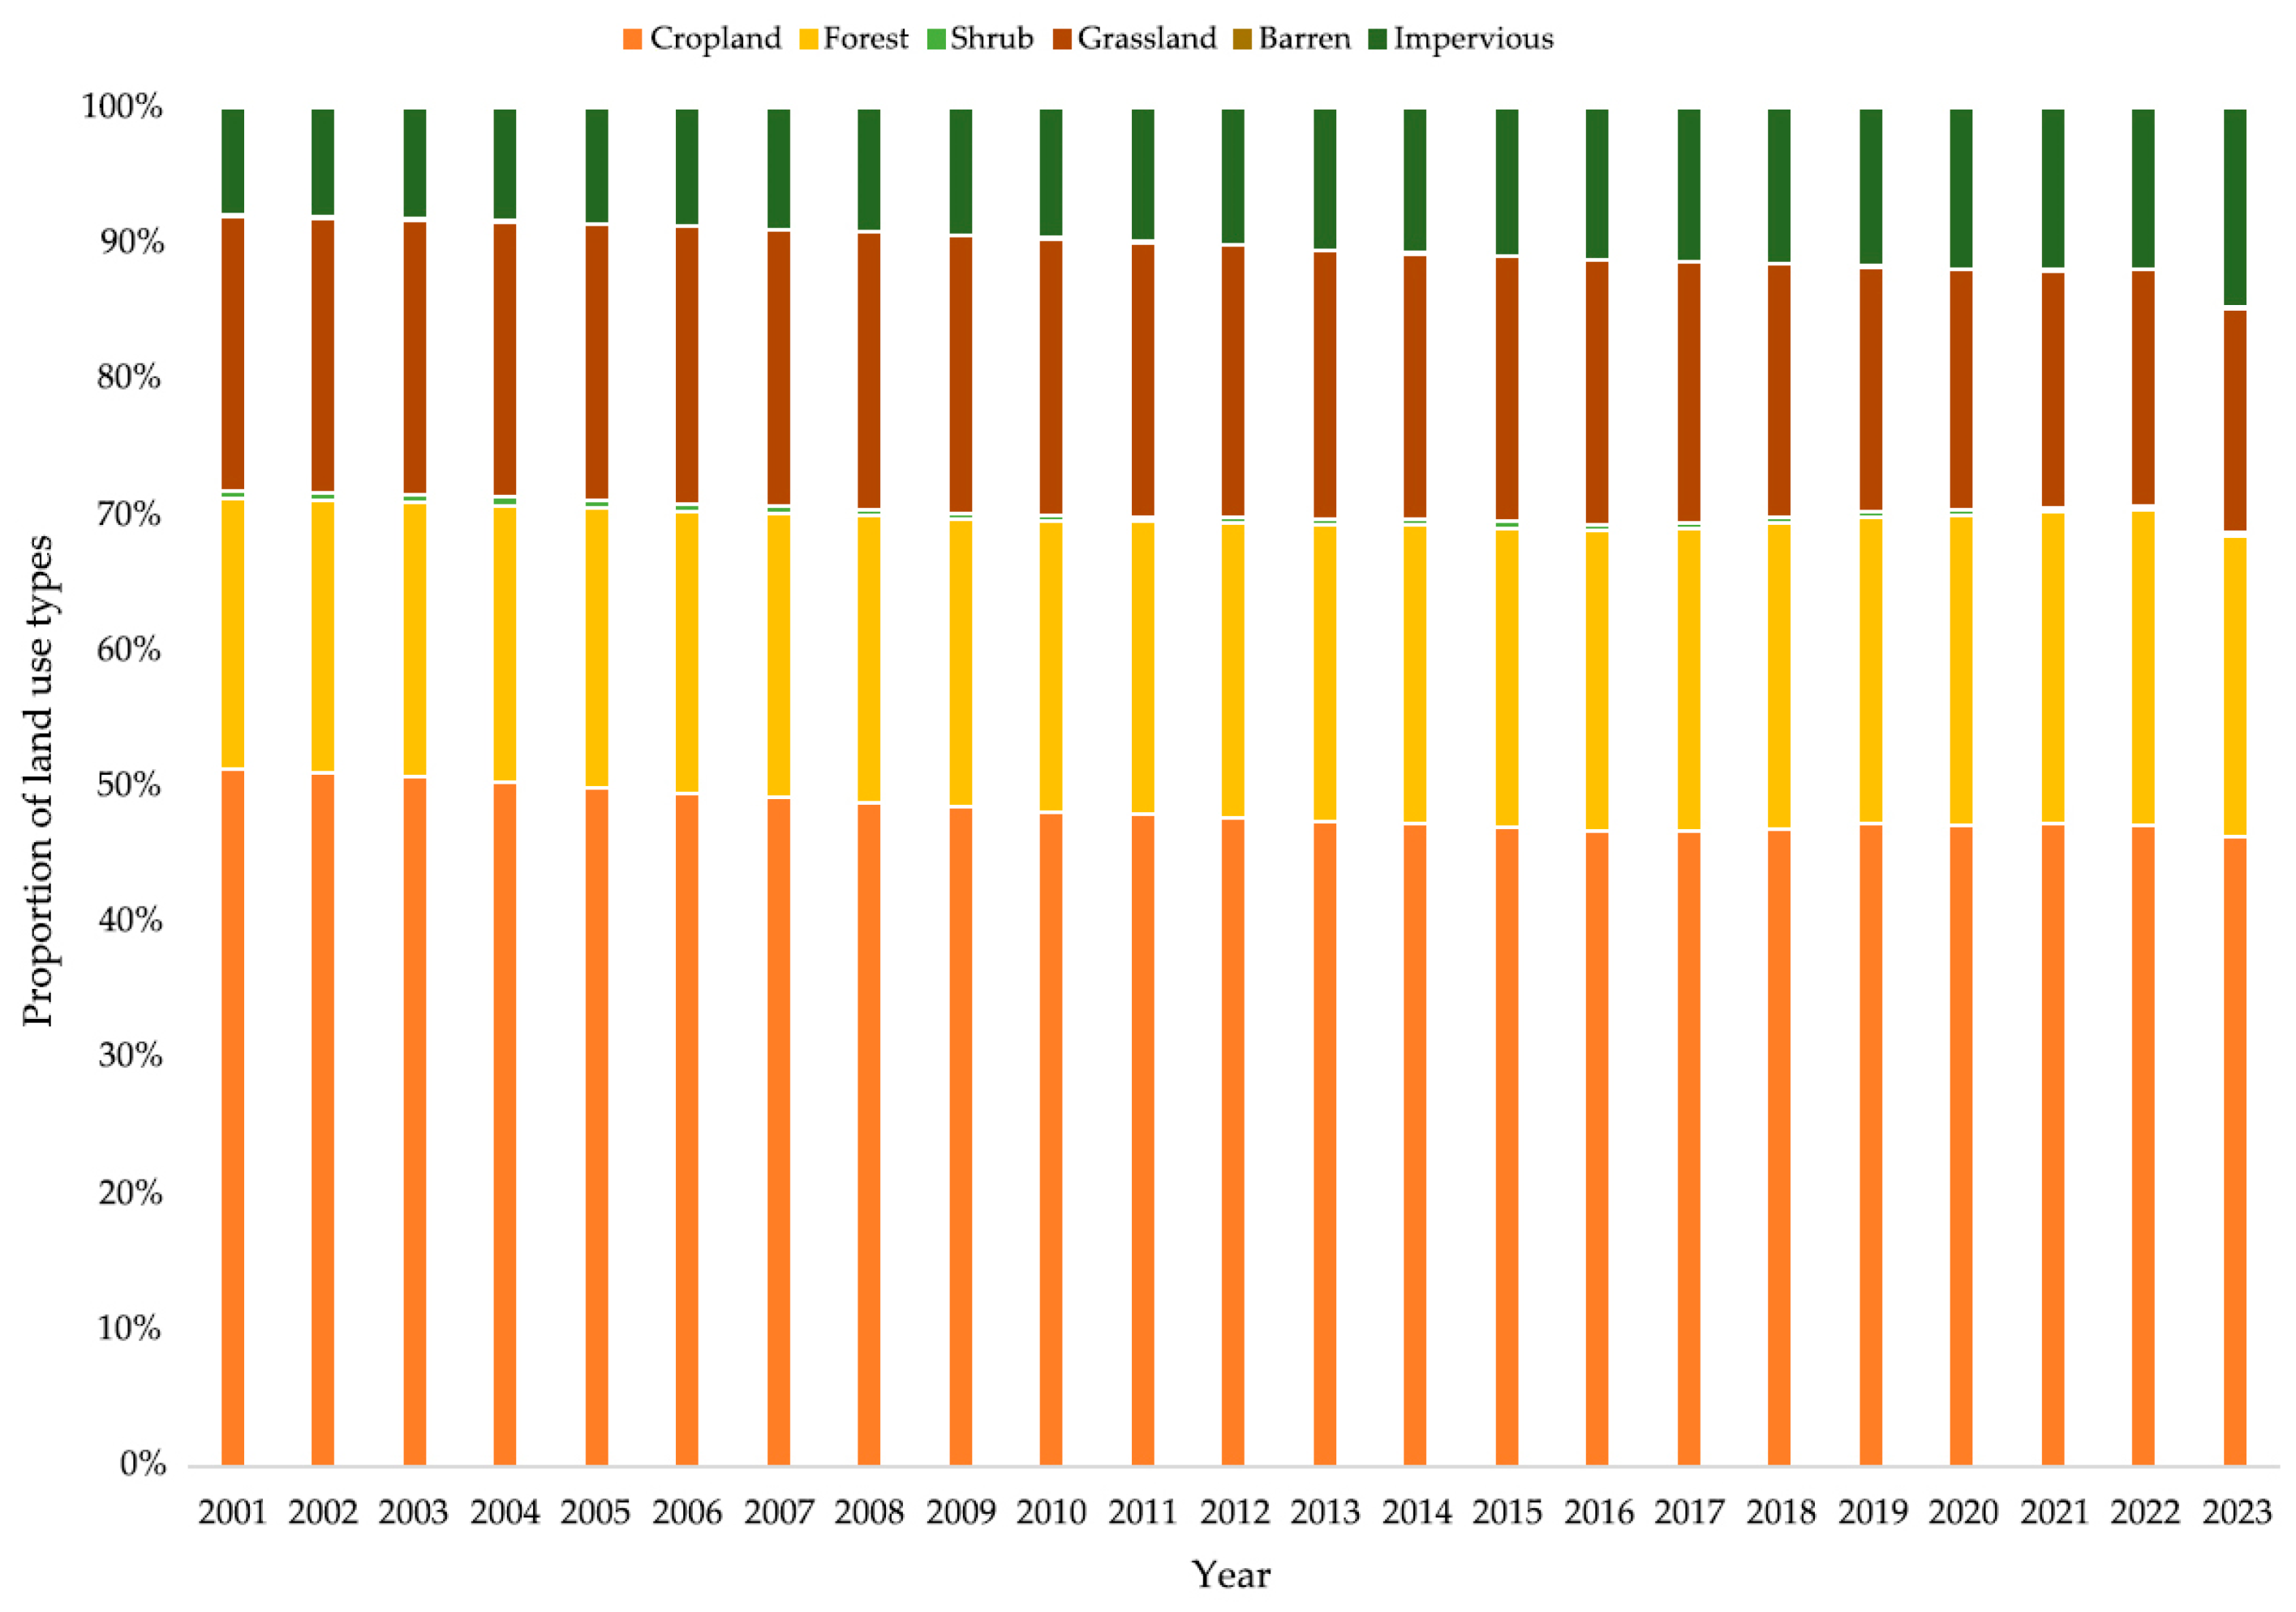
From 2001 to 2023, the dominant land use types in the HRB were cropland, grassland, and forest (Figure 10). Over this period, cropland area decreased from 154,725.75 km2 to 146,104.15 km2 (a reduction of 8621.6 km2). Grassland area decreased by 9134.22 km2, and shrub decreased by 804.01 km2. Concurrently, forest area increased by 10,122.69 km2, and impervious area increased significantly by 22,649.35 km2 (from 7.94% to 14.54% of the total area). This indicates that land use change was primarily driven by the conversion of other land types to impervious and forest land, reflecting both rapid urbanization and ecological restoration efforts.

3.3. Influences of Climate and Land Use Change on Vegetation Water–Carbon Use Efficiency

3.3.1. Partial Correlation Between Vegetation Carbon and Water Use Efficiencies

The partial correlation between CUE and WUE exhibited distinct spatial patterns across the HRB (Figure 11). Significant positive correlations were observed in the northwestern and southwestern regions. Conversely, significant negative correlations were found in the eastern plain areas. Most areas showed no significant correlation between CUE and WUE.

3.3.2. Partial Correlation Between Climate Factors and Vegetation Carbon and Water Use Efficiencies

Controlling for other climate factors, temperature showed a predominantly negative partial correlation with CUE across the basin, ranging from −0.86 to 0.83 (Figure 12a). Significant positive correlations were found in the northwest and parts of the eastern coastal areas, while significant negative correlations were observed in the northeast.
Precipitation was predominantly positively correlated with CUE, ranging from −0.79 to 0.87 (Figure 12b). Significant positive correlations were concentrated in the southeastern plain. Significant negative correlations were located in high-altitude northwestern areas.
Solar radiation was predominantly negatively correlated with CUE, ranging from −0.86 to 0.67 (Figure 12c). Significant positive correlations were found in the northwestern mountainous areas and eastern coastal areas. Significant negative correlations were concentrated in the southern and northeastern basin.
For WUE, temperature showed a predominantly negative partial correlation, ranging from −0.88 to 0.90 (Figure 13a). Significant positive correlations were observed in the southeastern plain, while negative correlations were dominant in the northwest. Precipitation was predominantly positively correlated with WUE, ranging from −0.77 to 0.85 (Figure 13b). Significant positive correlations were concentrated in the northern region. Significant negative correlations were found in the southwestern and southeastern corners. Solar radiation was predominantly negatively correlated with WUE, ranging from −0.83 to 0.82 (Figure 13c). Significant positive correlations were found in the southwestern corner. Significant negative correlations were concentrated in the northern region.
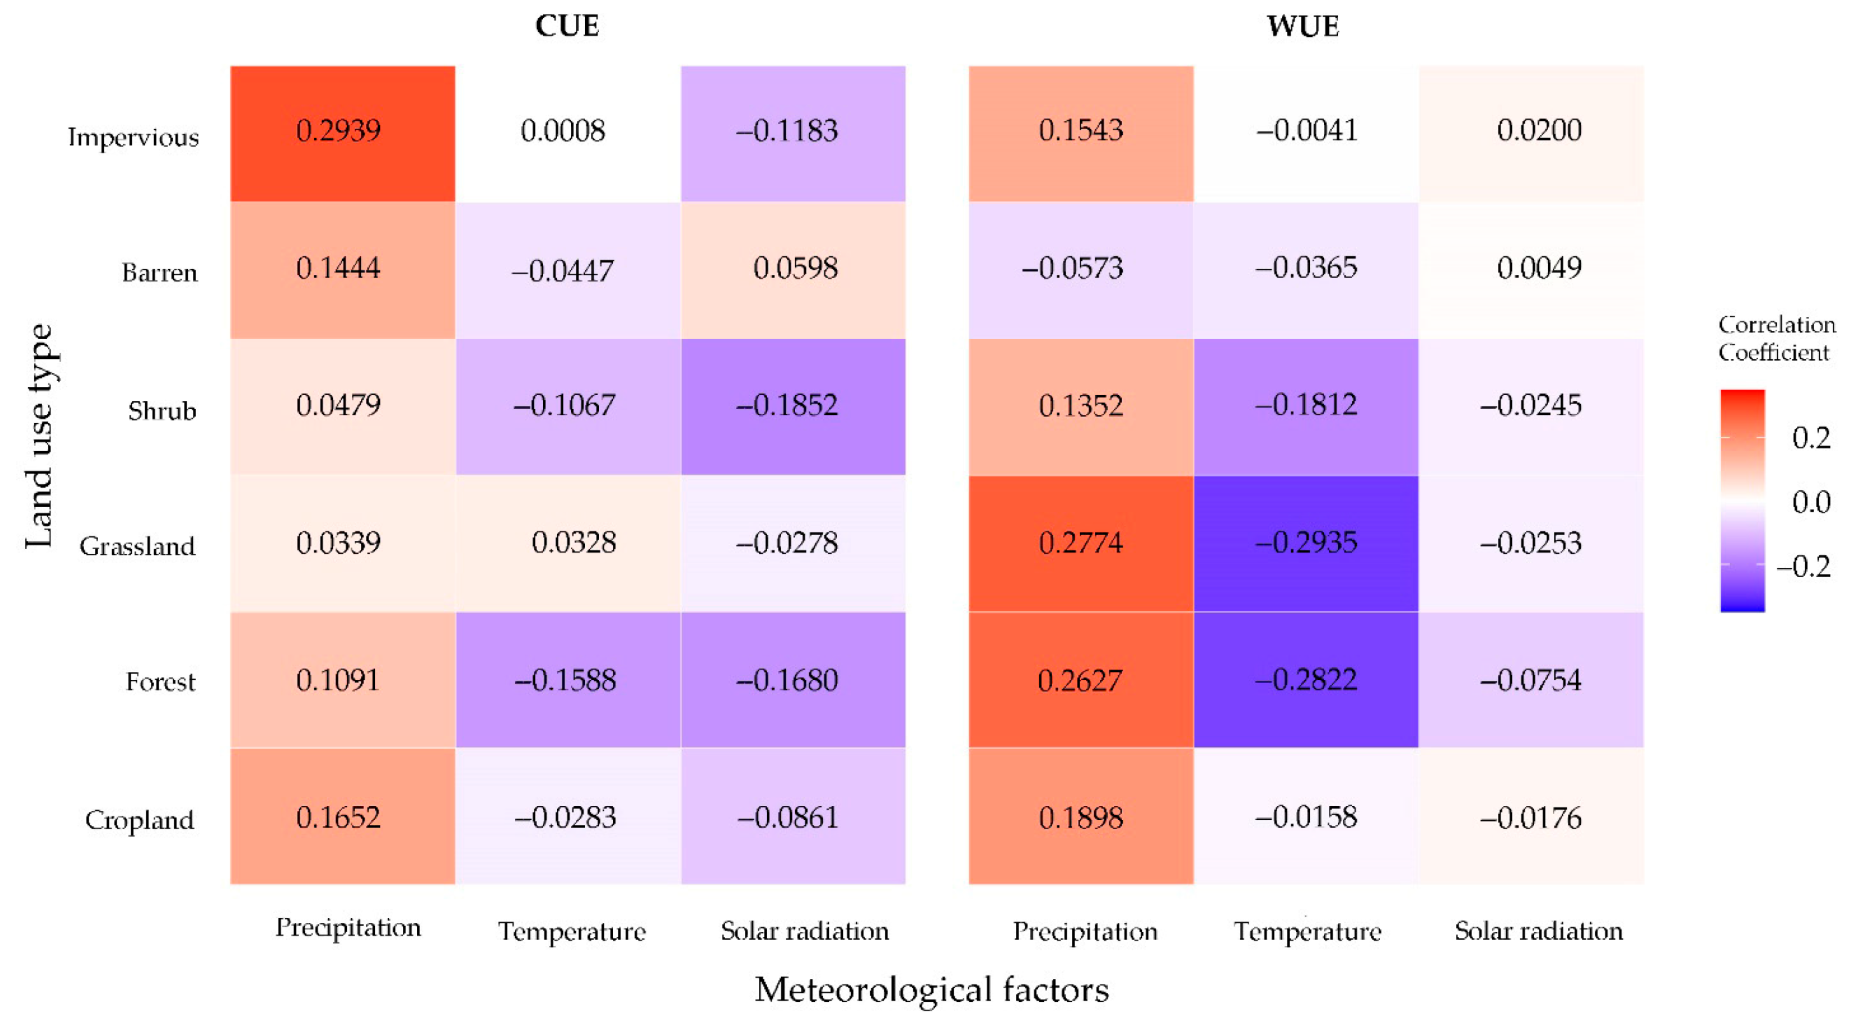
Partial correlations between climate factors and CUE/WUE varied across land use types (Figure 14). For CUE, precipitation showed positive correlations across all studied land use types. Temperature was positively correlated with CUE in grassland and impervious areas. Solar radiation was positively correlated with CUE only in barren land. For WUE, precipitation showed positive correlations in all types except barren land. Temperature showed negative correlations with WUE across all land use types. Solar radiation was positively correlated with WUE in cropland, forest, grassland, and impervious areas.

3.3.3. Partial Correlation Between Climate Factors and C-W Process Elements (NPP, GPP, ET)

Analyzing the partial correlations between climate factors and the components NPP, GPP, and ET provides insight into the underlying mechanisms. Temperature exhibited varied partial correlations with NPP, ranging from −0.88 to 0.88 (Figure A7). More areas showed negative correlations, particularly in the north and west, while positive correlations were observed in parts of the central and southeastern plain. Precipitation was predominantly positively correlated with NPP, ranging from −0.71 to 0.90. Stronger positive correlations were concentrated in the southern and western regions. Solar radiation showed predominantly negative correlations with NPP, ranging from −0.85 to 0.66, with stronger negative correlations in the southern and eastern regions.
Temperature had partial correlations with GPP ranging from −0.89 to 0.92 (Figure A8), showing a similar spatial pattern to NPP, with more negative correlations in the north and mostly positive or insignificant correlations in the central and southern regions. Precipitation was strongly and universally positively correlated with GPP across the HRB, ranging from −0.74 to 0.92. Stronger positive correlations were found in the western and southern regions. Solar radiation partial correlations with GPP ranged from −0.80 to 0.72, showing predominantly negative correlations, particularly in the southern and eastern regions.
Temperature partial correlations with ET ranged from −0.66 to 0.64 (Figure A9). Negative correlations were dominant in the northern, northeastern, and northwestern mountainous areas, while positive correlations were observed in the southern region. Precipitation partial correlations with ET ranged from −0.24 to 0.76, showing significant spatial heterogeneity. Positive correlations were observed in the central and western regions, while negative correlations appeared in the southern region. Solar radiation partial correlations with ET ranged from −0.47 to 0.19. Positive correlations were dominant overall, particularly in the northeast, while negative correlations were found in the western and southern mountainous areas.

3.3.4. Contribution Values of Climate Factors to Vegetation Carbon and Water Use Efficiencies

To dissect the drivers behind the observed trends, we quantitatively decomposed the trends into contributions from individual climate factors (temperature, precipitation, solar radiation) and a residual human activity term, based on the multiple linear regression and sensitivity analysis approach detailed in Section 2.3.
For CUE, which showed no significant basin-wide trend, the contributions of different drivers were relatively balanced and small in magnitude, with no single factor exerting a dominant basin-wide influence (Figure A10).
For WUE, the attribution analysis provides a clear and quantitative explanation for the basin-wide decline in WUE despite greening. As detailed below, our model quantitatively deconstructs the observed basin-wide WUE decline (total trend = −0.01 g C·m−2·mm−1·yr−1). The decomposition reveals that rising temperature exerted a strong negative contribution of −0.025 g C·m−2·mm−1·yr−1, while increasing precipitation provided a substantial positive contribution of +0.020 g C·m−2·mm−1·yr−1. The contributions from solar radiation (−0.002 g C·m−2·mm−1·yr−1) and the residual human activity term (−0.003 g C·m−2·mm−1·yr−1) were comparatively smaller. This reveals a climatic tug-of-war: the detrimental warming effect, with a magnitude of −0.025, ultimately overwhelmed the beneficial precipitation effect of +0.020, resulting in the net negative trend observed across the basin.
This dynamic also explains the spatial heterogeneity observed in Figure 6. In the northern 40.80% of the basin where WUE showed a significant increase, the positive contribution from precipitation was the dominant climatic force, averaging +0.035 g C·m−2·mm−1·yr−1 in these areas and overpowering the local warming effects. In contrast, within the southern agricultural plains where significant declines were concentrated, the negative contribution from temperature was exceptionally strong, locally reaching values as low as −0.040 g C·m−2·mm−1·yr−1, which far exceeded any positive local precipitation effects.
This conclusion is strongly reinforced by our sensitivity analysis. The finding that WUE is most sensitive to temperature (SkTmp = 0.67), followed by precipitation (SkPre = 0.58) and solar radiation (SkSrad = 0.21), is critical. The high sensitivity to temperature signifies that the basin’s water use efficiency is structurally vulnerable to warming; even a modest increase in temperature can induce a substantial negative response in WUE, thereby providing the mechanism for its dominant role in driving the long-term decline.

3.3.5. Relative Contribution Rates of Climate Factors to Vegetation Carbon and Water Use Efficiencies

When analyzing the relative influence among climate factors based on the magnitude of their contributions, precipitation emerged as having the largest overall impact on both CUE (38.66%) and WUE (40.61%) (Figure 15 and Figure 16). However, for WUE, this metric must be interpreted with caution. While precipitation had the largest absolute impact, its influence was predominantly positive. Therefore, the overall declining trend of WUE across the basin cannot be attributed to precipitation. Instead, temperature, with the second-highest relative contribution (34.82%), exerted a consistently negative influence that ultimately drove the net downward trend. This distinction is crucial: precipitation dictates much of the inter-annual variability and spatial pattern of WUE, but rising temperature is the primary culprit behind the basin’s long-term, systematic decline in water use efficiency.

4. Discussion

This study investigated the spatiotemporal dynamics of vegetation carbon use efficiency (CUE) and water use efficiency (WUE) in the Haihe River Basin (HRB) from 2001 to 2023, analyzing the influence of climate change and land use change. Our findings reveal a critical trade-off of successful greening accompanied by declining water use efficiency, underscore the divergent biophysical controls governing CUE and WUE, and highlight the overwhelming influence of precipitation in this semi-arid ecosystem.

4.1. The Decoupling of Greening and Water Use Efficiency: Increased Productivity Does Not Guarantee Improved Water Use Efficiency

A central and alarming finding of our study is the gradual but statistically significant deterioration of water use efficiency that has accompanied the basin’s greening trend. Despite commendable increases in GPP and NPP (Figure 3a,b), the overall WUE exhibited a persistent and significant decline (slope = −0.01, p < 0.01) (Figure 3e). This occurs because the basin-wide increase in ET (6.08 mm·yr−1) was proportionally greater than the increase in GPP (9.45 g C·m−2·yr−1), leading to a net decline in the GPP/ET ratio. This finding constitutes a stark carbon–water trade-off in the HRB: ecological restoration efforts, while successful in increasing biomass, have simultaneously led to a less efficient ecosystem in terms of water consumption.
Our attribution analysis (Section 3.3.4) provides a clear biophysical mechanism for this decoupling. The decline is primarily a climate-driven phenomenon resulting from the competing effects of precipitation and temperature. While increasing precipitation had a widespread positive effect on WUE, the negative impact of regional warming proved to be the decisive factor. Rising temperatures increase the atmospheric vapor pressure deficit (VPD), a key metric of atmospheric dryness strongly correlated with temperature, which enhances the atmospheric demand for water, thereby stimulating ET more strongly than it enhances photosynthesis [41,42]. This disproportionate response, where water loss accelerates faster than carbon gain, directly reduces WUE. Land use change, particularly afforestation, can further exacerbate this issue. While new forests are effective at increasing GPP, they often have higher ET rates than the grasslands or croplands they replace [26,43], contributing to the overall increase in water consumption that underpins the declining efficiency. Therefore, the observed persistent decline in WUE, even at a modest annual rate, serves as a critical early warning that the HRB’s ecosystem is on a hydrologically unsustainable trajectory.

4.2. Divergent Biophysical Controls on Carbon Allocation (CUE) and Water–Carbon Coupling (WUE)

This research reveals that CUE and WUE, while related, are governed by fundamentally different ecological processes, as evidenced by their distinct spatial patterns and trends. CUE, the ratio of NPP to GPP, reflects the efficiency of internal carbon allocation, partitioning photosynthates between growth (NPP) and autotrophic respiration (Ra). The observed significant decreasing trend in CUE in the mature forested areas of the western mountains (Figure 6), despite high GPP, is consistent with ecosystem succession theory. As forests mature, an increasing fraction of GPP is allocated to maintaining the large standing biomass through respiration, rather than accumulating new biomass, thus lowering the CUE [44]. This process is likely exacerbated by regional warming (Figure 8(a1,a2)), as plant respiration is often more sensitive to temperature increases than photosynthesis [45], further reducing the carbon available for growth.
In contrast, WUE represents the efficiency of ecosystem-atmosphere exchange, balancing carbon uptake against water loss through transpiration. Its spatial pattern, with higher values in forested regions and lower values in grasslands, is primarily dictated by vegetation structure and physiology. Forests, with their extensive root systems and greater control over stomatal conductance, can often achieve higher WUE than grasslands, especially under moderate water stress. The strong positive correlation between WUE and precipitation across most of the basin (Figure 13b) underscores that in this semi-arid landscape, water availability is the ultimate constraint on stomatal opening and photosynthetic activity. Thus, while CUE dynamics are strongly tied to ecosystem age and thermal conditions influencing respiration, WUE dynamics are more directly coupled to hydroclimatic controls on stomatal behavior. The analysis of both metrics is therefore crucial for a holistic understanding of ecosystem functional changes.

4.3. Attribution of Trends: The Competing Roles of Water Supply, Atmospheric Demand, and Land Use

Our attribution analysis confirms a nuanced reality: while precipitation (water supply) is the most influential climatic factor determining the spatial patterns and year-to-year variability of WUE, rising temperature (atmospheric demand) is the primary driver of its long-term basin-wide decline. The high relative contribution of precipitation (Figure 16) underscores that in this rain-fed ecosystem, water availability remains the fundamental control on ecosystem function. However, the consistent, warming-induced negative contribution to WUE (Figure A11) reveals that the background effect of climate change is steadily eroding this efficiency. This finding highlights the basin’s profound vulnerability not just to drought, but also to persistent warming. Land use change acts as a critical modulator of these climatic effects, with afforestation locally enhancing WUE but increasing total water consumption, and urbanization creating non-productive surfaces.

4.4. Uncertainties, Limitations, and Future Directions

While this study provides valuable insights, certain limitations must be acknowledged. Our conclusions, while statistically robust based on the data used, are contingent on the accuracy of these public datasets. The reliance on remote sensing products and climate reanalysis data carries inherent uncertainties and spatial resolutions that may smooth over fine-scale variability. While widely accepted for large-scale trend analysis, these products can contain errors that may influence absolute values, although trend detection is generally more robust. The resolution mismatch between the 30 m CLCD land use data and the 500 m MODIS data can introduce mixed pixel effects, particularly in heterogeneous landscapes, potentially diluting the true impact of land use conversions at fine scales [46]. Furthermore, the statistical methods used (partial correlation, contribution analysis) identify associations but do not definitively prove causality or capture complex non-linear interactions and feedbacks.
A significant un-modeled driver is the atmospheric CO2 fertilization effect. Rising atmospheric CO2 is known to enhance intrinsic water use efficiency (iWUE) by allowing plants to acquire more carbon per unit of water transpired [47,48]. The fact that we observed a declining basin-wide WUE in an era of rapidly rising CO2 is therefore particularly compelling. It strongly suggests that the negative impacts of increased atmospheric water demand (driven by warming and higher VPD) and the hydrological consequences of land use change are powerful enough to counteract or even overwhelm any potential benefits from CO2 fertilization in this region. This makes our finding of a hydrologically unsustainable greening trend even more consequential. Other potentially important drivers, such as nitrogen deposition, and specific human activities like irrigation intensity and scheduling, were not explicitly isolated as their signals are often conflated with broader land use categories or the residual term due to data constraints.
Future research should focus on: (1) employing process-based ecosystem models (e.g., BIOME-BGC, CLM) to better elucidate the underlying mechanisms driving the observed CUE and WUE changes and to project future dynamics under various climate and land use scenarios, explicitly incorporating CO2 effects; (2) incorporating a wider range of environmental factors and human interventions such as irrigation data; (3) conducting analyses at finer spatial and temporal resolutions using newer satellite data (e.g., from Sentinel, ECOSTRESS, GEDI) to capture local heterogeneity and seasonal variability; and (4) validating results with field observations from a network of eddy covariance flux towers representing different land use types in the HRB.

4.5. Broader Implications for Sustainable Management

Our findings issue a stark warning against pursuing “greening at any cost” policies in water-limited basins. The HRB case study demonstrates that focusing solely on vegetation cover or carbon sequestration as metrics of restoration success can be misleading and hydrologically unsustainable, as it may obscure underlying water stresses. For sustainable ecosystem management and water security in the HRB and similar regions worldwide, policies must evolve towards a more integrated, water-centric approach.
This necessitates two key policy shifts: (1) The implementation of spatially explicit eco-hydrological assessments prior to further large-scale afforestation, evaluating the trade-offs between carbon sequestration benefits and the impacts on local and downstream water availability. (2) Promoting “hydro-ecological” restoration practices, such as prioritizing the use of drought-tolerant native species (e.g., shrubs and grasses) over high-water-demand tree species in inappropriate locations, and integrating soil and water conservation measures alongside revegetation efforts. Ultimately, balancing the dual goals of ecological restoration and water security requires a nuanced understanding of the intricate trade-offs within the carbon–water nexus, moving beyond simplistic metrics of success.

5. Conclusions

This study provides a comprehensive assessment of vegetation carbon–water relations in the water-scarce Haihe River Basin over the past two decades. Our principal conclusions are as follows:
A critical decoupling of carbon–water trends defines the Haihe River Basin’s recent ecological trajectory. While vegetation productivity (NPP and GPP) increased significantly across the HRB from 2001 to 2023, this came at a high hydrological cost: basin-wide mean WUE (GPP/ET) showed a gradual yet statistically significant downward trend. This decoupling indicates that the current greening is hydrologically inefficient and is steadily undermining long-term water security.
Climate warming is the primary driver of declining water use efficiency. Our attribution analysis confirms this decoupling is primarily driven by rising temperatures, whose negative impact—by increasing atmospheric water demand—outweighed the positive effects of increasing precipitation and the greening process itself.
Spatially divergent trends reveal a complex interplay of local drivers. CUE significantly decreased in western mountainous forests (15.65% of the area), likely linked to forest maturation. Conversely, WUE significantly increased in the northern basin (40.80%), driven by beneficial precipitation, while strong warming-induced declines in small but critical southern agricultural areas (2.88%) were potent enough to lower the entire basin’s average WUE.
Policy implications call for a shift from ‘greening’ to ‘sustainable greening’. The expansion of forests and impervious areas has significantly altered regional carbon–water trade-offs. Our research underscores that future ecological restoration and water resource management policies in the HRB must move beyond a singular focus on vegetation cover and explicitly integrate hydro-ecological trade-off assessments to ensure the long-term sustainability of both the ecosystem and regional water security.

Author Contributions

Conceptualization, F.X. and X.W.; methodology, F.X. and J.G.; software, F.X. and J.G.; validation, F.X. and J.G.; formal analysis, F.X. and J.G.; investigation, F.X. and J.G.; resources, F.X. and J.G.; data curation, F.X. and J.G.; writing—original draft preparation, F.X. and J.G.; writing—review and editing, F.X. and X.W.; visualization, F.X. and J.G.; supervision, F.X. and X.W.; project administration, F.X. and X.W.; funding acquisition, F.X. and X.W. All authors have read and agreed to the published version of the manuscript.

Funding

This research was funded by the Fundamental Research Funds for the Central Universities, grant number 2024SKQ08 and the MOE (Ministry of Education in China) Project of Humanities and Social Sciences, grant number 23YJCZH252.

Data Availability Statement

All data can be found on the website provided.

Conflicts of Interest

The authors declare no conflicts of interest.

Appendix A

Figure A1. Spatial Distribution of Net Primary Productivity (NPP).
Remotesensing 17 03505 g0a1
Figure A2. Spatial Distribution of Gross Primary Productivity (GPP).
Remotesensing 17 03505 g0a2
Figure A3. Spatial Distribution of Actual Evapotranspiration (ET).
Remotesensing 17 03505 g0a3
Figure A4. Spatial Distribution of Temperature.
Remotesensing 17 03505 g0a4
Figure A5. Spatial Distribution of Precipitation.
Remotesensing 17 03505 g0a5
Figure A6. Spatial Distribution of Solar Radiation.
Remotesensing 17 03505 g0a6
Figure A7. Partial Correlation between Temperature (a), Precipitation (b), Solar Radiation (c) and NPP.
Remotesensing 17 03505 g0a7
Figure A8. Partial Correlation between Temperature (a), Precipitation (b), Solar Radiation (c) and GPP.
Remotesensing 17 03505 g0a8
Figure A9. Partial Correlation between Temperature (a), Precipitation (b), Solar Radiation (c) and ET.
Remotesensing 17 03505 g0a9
Figure A10. Contribution values of Temperature (a), Precipitation (b) and Solar Radiation (c) to CUE (Unit: yr−1).
Remotesensing 17 03505 ga10
Figure A11. Contribution values of Temperature (a), Precipitation (b) and Solar Radiation (c) to the WUE trend (Unit: g C·m−2·mm−1·yr−1).
Remotesensing 17 03505 ga11

References

  1. IPCC. Summary for Policymakers. In Climate Change 2021: The Physical Science Basis. Contribution of Working Group I to the Sixth Assessment Report of the Intergovernmental Panel on Climate Change; Masson-Delmotte, V., Zhai, P., Pirani, A., Connors, S.L., Péan, C., Berger, S., Caud, N., Chen, Y., Eds.; Cambridge University Press: Cambridge, UK, 2021; pp. 3–32. [Google Scholar]
  2. Seneviratne, S.I.; Zhang, X.; Adnan, M.; Badi, W.; Dereczynski, C.; Di Luca, A.; Ghosh, S.; Iskandar, I.; Kossin, J.; Lewis, S.; et al. Weather and Climate Extreme Events in a Changing Climate. In Climate Change 2021: The Physical Science Basis. Contribution of Working Group I to the Sixth Assessment Report of the Intergovernmental Panel on Climate Change; Cambridge University Press: Cambridge, UK, 2021; pp. 1513–1766. [Google Scholar]
  3. Bonan, G.B. Forests and climate change: Forcings, feedbacks, and the climate benefits of forests. Science 2008, 320, 1444–1449. [Google Scholar] [CrossRef]
  4. Reichstein, M.; Bahn, M.; Ciais, P.; Frank, D.; Mahecha, M.D.; Seneviratne, S.I.; Zscheischler, J.; Beer, C.; Buchmann, N.; Frank, D.C.; et al. Climate extremes and the carbon cycle. Nature 2013, 500, 287–295. [Google Scholar] [CrossRef] [PubMed]
  5. Waring, R.H.; Landsberg, J.J.; Williams, M. Net primary production of forests: A constant fraction of gross primary production? Tree Physiol. 1998, 18, 129–134. [Google Scholar] [CrossRef]
  6. DeLucia, E.H.; Drake, J.E.; Thomas, R.B.; Gonzalez-Meler, M. Forest carbon use efficiency: Is respiration a constant fraction of gross primary production? Glob. Change Biol. 2007, 13, 1157–1167. [Google Scholar] [CrossRef]
  7. Tang, X.; Li, H.; Desai, A.R.; Vargas, R.; Göckede, M.; Chen, J.; Schwalm, C.R.; Baldocchi, D. How is water use efficiency of terrestrial ecosystems distributed and changing on Earth? Sci. Rep. 2014, 4, 7483. [Google Scholar] [CrossRef] [PubMed]
  8. Ponce Campos, G.E.; Moran, M.S.; Huete, A.; Zhang, Y.; Bresloff, C.; Huxman, T.E.; Eamus, D.; Bosch, D.D.; Buda, A.R.; Gunter, S.A.; et al. Ecosystem resilience despite large-scale altered hydroclimatic conditions. Nature 2013, 494, 349–352. [Google Scholar] [CrossRef]
  9. Sun, Y.; Piao, S.; Huang, M.; Ciais, P.; Zeng, Z.; Cheng, L.; Li, X.; Zhang, T.; Mao, J.; Peng, S.; et al. Global patterns and climate drivers of water-use efficiency in terrestrial ecosystems. Glob. Ecol. Biogeogr. 2016, 25, 311–323. [Google Scholar] [CrossRef]
  10. Huang, M.; Piao, S.; Sun, Y.; Ciais, P.; Cheng, L.; Mao, J.; Poulter, B.; Shi, X.; Zeng, Z.; Wang, Y. Change in terrestrial ecosystem water-use efficiency over the last three decades. Glob. Change Biol. 2015, 21, 2366–2378. [Google Scholar] [CrossRef]
  11. Zhang, Y.; Yu, G.; Yang, J.; Wimberly, M.C.; Zhang, X.; Tao, J.; Jiang, Y.; Zhu, J. Climate-driven global changes in carbon use efficiency. Glob. Ecol. Biogeogr. 2014, 23, 144–155. [Google Scholar] [CrossRef]
  12. Piao, S.; Wang, X.; Park, T.; Chen, C.; Lian, X.; Cescatti, A.; Huntingford, C.; Myneni, R.B. Characteristics, drivers and feedbacks of global greening. Nat. Rev. Earth Environ. 2020, 1, 14–27. [Google Scholar] [CrossRef]
  13. Li, Y.; Piao, S.; Li, L.; Chen, A.; Wang, X.; Ciais, P.; Huang, L.; Lian, X.; Peng, S.; Zeng, Z.; et al. Divergent hydrological response to large-scale afforestation and vegetation greening in China. Sci. Adv. 2018, 4, eaar4182. [Google Scholar] [CrossRef]
  14. Tang, L.; Chen, X.; Cai, X.; Li, J. Disentangling the roles of land-use-related drivers on vegetation greenness across China. Environ. Res. Lett. 2021, 16, 124033. [Google Scholar] [CrossRef]
  15. Yang, W.; Zhao, Y.; Wang, Q.; Guan, B. Climate, CO2, and anthropogenic drivers of accelerated vegetation greening in the Haihe River Basin. Remote Sens. 2022, 14, 268. [Google Scholar] [CrossRef]
  16. Zou, W.; Yin, S.; Wang, W. Spatial interpolation of the extreme hourly precipitation at different return levels in the Haihe River basin. J. Hydrol. 2021, 598, 126273. [Google Scholar] [CrossRef]
  17. Martinsen, G.; Liu, S.; Mo, X.; Bauer-Gottwein, P. Optimizing water resources allocation in the Haihe River basin under groundwater sustainability constraints. J. Geogr. Sci. 2019, 29, 935–958. [Google Scholar] [CrossRef]
  18. Kang, J.; Zi, X.; Wang, S.; He, L. Evaluation and optimization of agricultural water resources carrying capacity in Haihe River Basin, China. Water 2019, 11, 999. [Google Scholar] [CrossRef]
  19. Zhang, Y.; Song, C.; Sun, G.; Band, L.E.; McNulty, S.; Noormets, A.; Zhang, Q.; Zhang, Z. Development of a coupled carbon and water model for estimating global gross primary productivity and evapotranspiration based on eddy flux and remote sensing data. Agric. For. Meteorol. 2016, 223, 116–131. [Google Scholar] [CrossRef]
  20. Han, L.; Wang, Q.; Chen, Z.; Yu, G.; Zhou, G.; Chen, S.; Li, Y.-N.; Zhang, Y.-P.; Yan, J.-H.; Wang, M.; et al. Spatial patterns and climate controls of seasonal variations in carbon fluxes in China’s terrestrial ecosystems. Glob. Planet. Change 2020, 189, 103175. [Google Scholar] [CrossRef]
  21. Zhu, Z.; Piao, S.; Myneni, R.B.; Huang, M.; Zeng, Z.; Canadell, J.G.; Ciais, P.; Sitch, S.; Friedlingstein, P.; Arneth, A.; et al. Greening of the Earth and its drivers. Nat. Clim. Change 2016, 6, 791–795. [Google Scholar] [CrossRef]
  22. Ge, J.; Zou, C. Impacts of woody plant encroachment on regional climate in the southern Great Plains of the United States. J. Geophys. Res. D 2013, 118, 9093–9104. [Google Scholar] [CrossRef]
  23. Cheng, L.; Zhang, L.; Wang, Y.; Canadell, J.G.; Chiew, F.H.; Beringer, J.; Li, L.; Miralles, D.G.; Piao, S.; Zhang, Y. Recent increases in terrestrial carbon uptake at little cost to the water cycle. Nat. Commun. 2017, 8, 110. [Google Scholar] [CrossRef]
  24. Zhou, S.; Williams, A.P.; Berg, A.M.; Cook, B.I.; Zhang, Y.; Hagemann, S.; Lorenz, R.; Seneviratne, S.; Gentine, P. Land–atmosphere feedbacks exacerbate concurrent soil drought and atmospheric aridity. Proc. Natl. Acad. Sci. USA 2019, 116, 18848–18853. [Google Scholar] [CrossRef]
  25. Keenan, T.F.; Prentice, I.C.; Canadell, J.G.; Williams, C.A.; Wang, H.; Raupach, M.; Collatz, G.J. Recent pause in the growth rate of atmospheric CO2 due to enhanced terrestrial carbon uptake. Nat. Commun. 2016, 7, 13428. [Google Scholar] [CrossRef]
  26. Sun, S.; Chen, B.; Yan, J.; Van Zwieten, L.; Wang, H.; Dong, J.; Fu, P.; Song, Z. Potential impacts of land use and land cover change (LUCC) and climate change on evapotranspiration and gross primary productivity in the Haihe River Basin, China. J. Clean. Prod. 2024, 476, 143729. [Google Scholar] [CrossRef]
  27. Lei, H.; Yang, D.; Huang, M. Impacts of climate change and vegetation dynamics on runoff in the mountainous region of the Haihe River basin in the past five decades. J. Hydrol. 2014, 511, 786–799. [Google Scholar] [CrossRef]
  28. Sun, Y.; Shan, M.; Pei, X.; Zhang, X.; Yang, Y. Assessment of the impacts of climate change and human activities on vegetation cover change in the Haihe River basin, China. Phys. Chem. Earth 2020, 115, 102834. [Google Scholar] [CrossRef]
  29. Liu, L.; Lei, Y.; Zhuang, M.; Ding, S. The impact of climate change on urban resilience in the Beijing-Tianjin-Hebei region. Sci. Total Environ. 2022, 827, 154157. [Google Scholar] [CrossRef] [PubMed]
  30. Zou, Y.; Chen, W.; Li, S.; Wang, T.; Yu, L.; Xu, M.; Singh, R.P.; Liu, C. Spatio-Temporal changes in vegetation in the last two decades (2001–2020) in the Beijing–Tianjin–Hebei region. Remote Sens. 2022, 14, 3958. [Google Scholar] [CrossRef]
  31. Li, X.; Xu, W.; Song, S.; Sun, J. Sources and spatiotemporal distribution characteristics of nitrogen and phosphorus loads in the Haihe River Basin, China. Mar. Pollut. Bull. 2023, 189, 114756. [Google Scholar] [CrossRef]
  32. Yang, J.; Huang, X. 30 m annual land cover dataset and its dynamics in China from 1990 to 2019. Earth Syst. Sci. Data 2021, 13, 3907–3925. [Google Scholar] [CrossRef]
  33. Running, S.W.; Zhao, M. Daily GPP and annual NPP (MOD17A2/A3) products NASA Earth Observing System MODIS land algorithm. In MOD17 User’s Guide; NASA: Washington, DC, USA, 2015; pp. 1–28. [Google Scholar]
  34. Mu, Q.; Zhao, M.; Running, S.W. Improvements to a MODIS global terrestrial evapotranspiration algorithm. Remote Sens. Environ. 2011, 115, 1781–1800. [Google Scholar] [CrossRef]
  35. Sen, P.K. Estimates of the regression coefficient based on Kendall’s tau. J. Am. Stat. Assoc. 1968, 63, 1379–1389. [Google Scholar] [CrossRef]
  36. Mann, H.B. Nonparametric Tests Against Trend. Econ. J. Econ. Soc. 1945, 13, 245. [Google Scholar] [CrossRef]
  37. Kendall, M.G. Rank Correlation Methods; Griffin: London, UK, 1948. [Google Scholar]
  38. Hurst, H.E. Long-Term Storage Capacity of Reservoirs. Trans. Am. Soc. Civ. Eng. 1951, 116, 770–799. [Google Scholar] [CrossRef]
  39. Dettinger, M.D.; Cayan, D.R. Large-Scale Atmospheric Forcing of Recent Trends toward Early Snowmelt in California. J. Clim. 1995, 8, 606–623. [Google Scholar] [CrossRef]
  40. Piao, S.; Yin, G.; Tan, J.; Cheng, L.; Huang, M.; Li, Y.; Liu, R.; Mao, J.; Myneni, R.B.; Peng, S.; et al. Detection and attribution of vegetation greening trend in China over the last 30 years. Glob. Change Biol. 2015, 21, 1601–1609. [Google Scholar] [CrossRef]
  41. Yuan, W.; Zheng, Y.; Piao, S.; Ciais, P.; Lombardozzi, D.; Wang, Y.; Ryu, Y.; Chen, G.; Dong, W.; Hu, Z.; et al. Increased atmospheric vapor pressure deficit reduces global vegetation growth. Sci. Adv. 2019, 5, eaax1396. [Google Scholar] [CrossRef]
  42. Novick, K.A.; Ficklin, D.L.; Stoy, P.C.; Williams, C.A.; Bohrer, G.; Oishi, A.C.; Papuga, S.A.; Blanken, P.D.; Noormets, A.; Phillips, R.P.; et al. The increasing importance of atmospheric demand for ecosystem water and carbon cycles. Nat. Clim. Change 2016, 6, 1023–1027. [Google Scholar] [CrossRef]
  43. Murray, B.C. Trading water for carbon with biological sequestration. Science 2005, 310, 1944–1947. [Google Scholar] [CrossRef] [PubMed]
  44. Xu, H.; Xiao, J.; Zhang, Z.; Ollinger, S.V.; Hollinger, D.Y.; Pan, Y.; Wan, J. Canopy photosynthetic capacity drives contrasting age dynamics of resource use efficiencies between mature temperate evergreen and deciduous forests. Glob. Change Biol. 2020, 26, 6156–6167. [Google Scholar] [CrossRef] [PubMed]
  45. Heskel, M.A.; O’Sullivan, O.S.; Reich, P.B.; Tjoelker, M.G.; Weerasinghe, L.K.; Penillard, A.; Egerton, J.J.G.; Creek, D.; Bloomfield, K.J.; Xiang, J.; et al. Convergence in the temperature response of leaf respiration across biomes and plant functional types. Proc. Natl. Acad. Sci. USA 2016, 113, 3832–3837. [Google Scholar] [CrossRef] [PubMed]
  46. Fisher, P.F. The pixel: A snare and a delusion. Int. J. Remote Sens. 1997, 18, 679–685. [Google Scholar] [CrossRef]
  47. Frank, D.C.; Poulter, B.; Saurer, M.; Esper, J.; Huntingford, C.; Helle, G.; Treydte, K.; Zimmermann, N.E.; Leuenberger, M.C.; Verstege, A.; et al. Water-use efficiency and transpiration across European forests during the Anthropocene. Nat. Clim. Change 2015, 5, 579–583. [Google Scholar] [CrossRef]
  48. Ainsworth, E.A.; Long, S.P. What have we learned from 15 years of free-air CO2 enrichment (FACE)? A meta-analytic review of the responses of photosynthesis, canopy properties and plant production to rising CO2. New Phytol. 2005, 165, 351–372. [Google Scholar] [CrossRef]
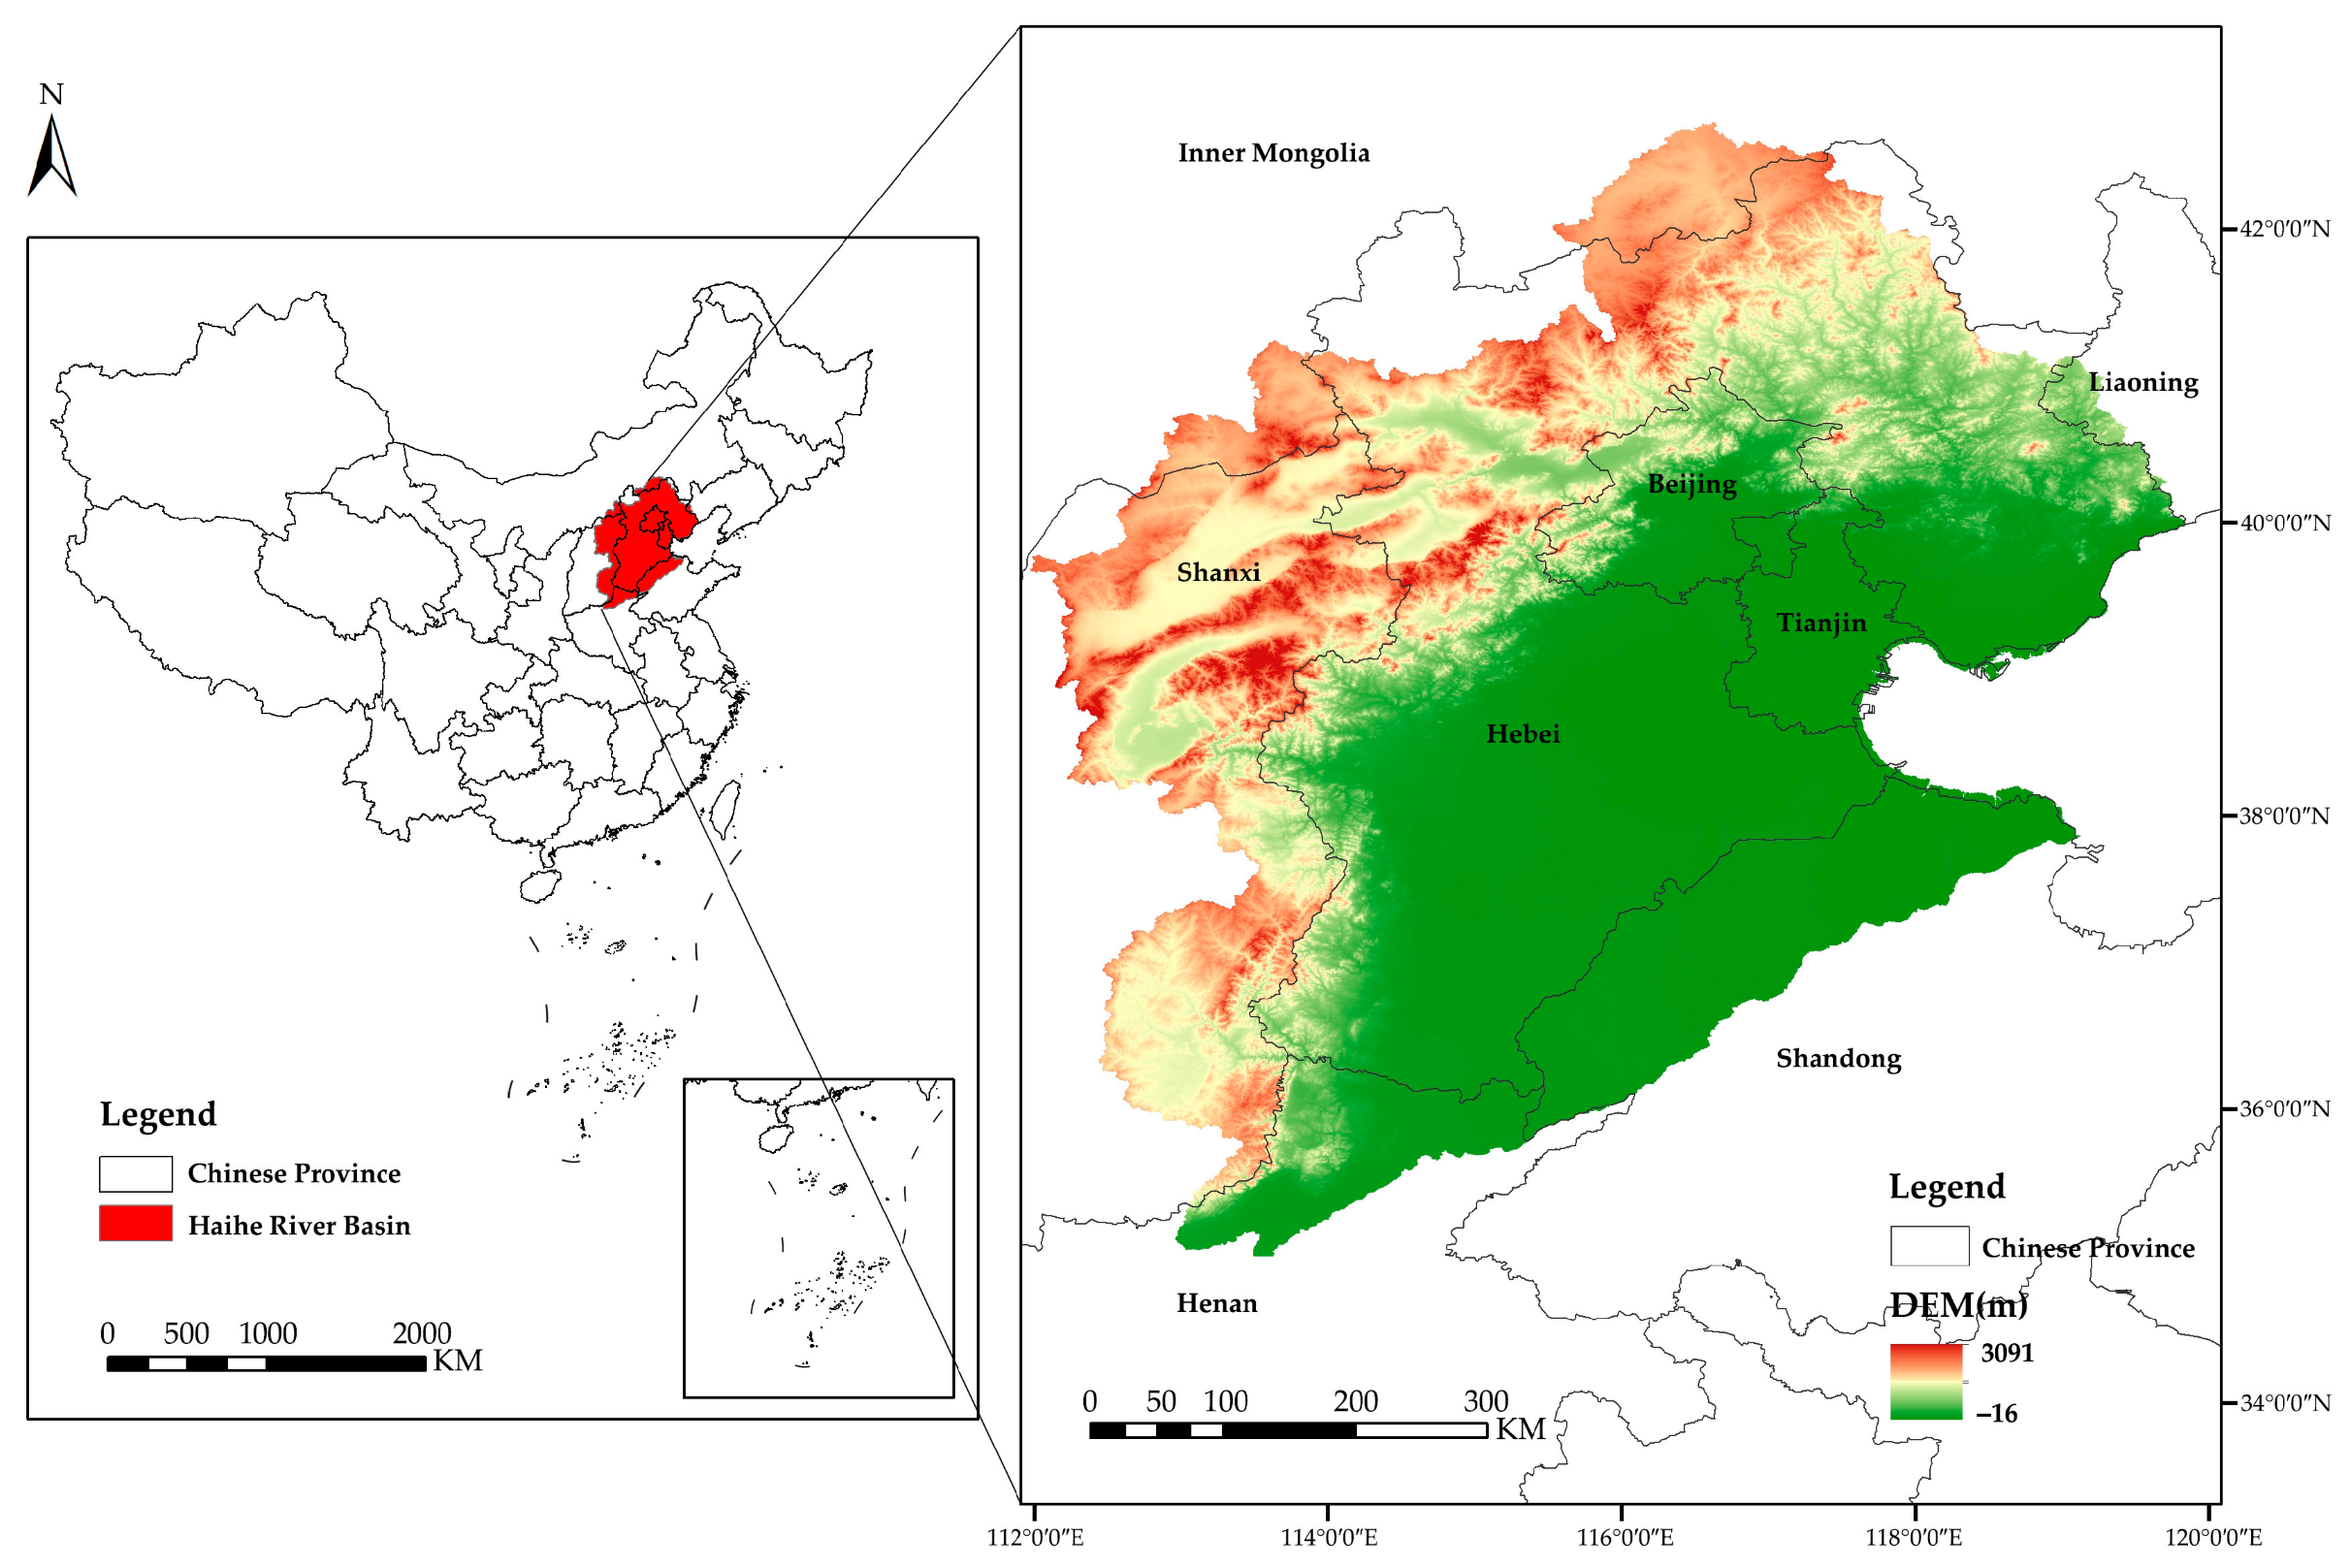
Figure 1. Location of study area.
Remotesensing 17 03505 g001
Figure 2. Methodological flowchart of the study.
Remotesensing 17 03505 g002
Figure 3. Inter-annual Variation in NPP (a), GPP (b), ET (c), CUE (d) and WUE (e). The equations represent linear trends, with all trends for NPP, GPP, and ET being statistically significant (p < 0.01).
Remotesensing 17 03505 g003
Figure 4. Spatial Distribution of mean annual vegetation Carbon Use Efficiency (CUE) for the period 2001–2023.
Remotesensing 17 03505 g004
Figure 5. Spatial Distribution of mean annual vegetation Water Use Efficiency (WUE) for the period 2001–2023.
Remotesensing 17 03505 g005
Figure 6. Trend (Theil-Sen Slope) and Significance (Mann–Kendall Z) of CUE (a) and WUE (b).
Remotesensing 17 03505 g006
Figure 7. Hurst Index of CUE (a) and WUE (b).
Remotesensing 17 03505 g007
Figure 8. Trend (Theil-Sen Slope) and Significance (Mann–Kendall Z) of Temperature (a1,a2), Precipitation (b1,b2), Solar Radiation (c1,c2).
Remotesensing 17 03505 g008
Figure 9. Inter-annual Variations and Trends of Climate Factors: Temperature (a), Precipitation (b), Solar Radiation (c).
Remotesensing 17 03505 g009
Figure 10. Change in Land Use Type.
Remotesensing 17 03505 g010
Figure 11. Partial Correlation between CUE and WUE.
Remotesensing 17 03505 g011
Figure 12. Partial Correlation between CUE and Temperature (a), Precipitation (b), Solar Radiation (c).
Remotesensing 17 03505 g012
Figure 13. Partial Correlation between WUE and Temperature (a), Precipitation (b), Solar Radiation (c).
Remotesensing 17 03505 g013
Figure 14. Average Partial Correlation between Precipitation, Temperature, Solar Radiation and CUE and WUE under Different Land Use Types.
Remotesensing 17 03505 g014
Figure 15. Relative contribution rate of Temperature (a), Precipitation (b), Solar Radiation (c) to the CUE trend.
Remotesensing 17 03505 g015
Figure 16. Relative contribution rate of Temperature (a), Precipitation (b), Solar Radiation (c) to the WUE trend.
Remotesensing 17 03505 g016
Table 1. Data resolution and source.
Data NameSpecific Data (Unit)Product NameSpatial ResolutionTemporal ResolutionSource
Vegetation DataGPP (g C·m−2)MOD17A2HGF (v061)500 m8-dayNASA LP DAAC 1
NPP (g C·m−2)MOD17A2HGF (v061)500 mAnnualNASA LP DAAC 1
ET (mm)MOD16A2GF (v061)500 m8-dayNASA LP DAAC 1
Meteorological DataTemperature (°C)ERA5-Land0.1°HourlyEuropean Centre for Medium-Range Weather Forecasts (ECMWF)
Precipitation (mm)CHIRPS Daily v2.00.05°DailyUCSB Climate Hazards Center
Solar Radiation (MJ·m−2)ERA5-Land0.1°HourlyEuropean Centre for Medium-Range Weather Forecasts (ECMWF)
Topographic DataDEM (m)SRTM-1 Arc-Second Global30 mN/AU.S. Geological Survey (USGS)
Land Use DataLand Use/Land CoverCLCD30 mAnnualYang and Huang [32]
1 LP DAAC: Land Processes Distributed Active Archive Center.
Disclaimer/Publisher’s Note: The statements, opinions and data contained in all publications are solely those of the individual author(s) and contributor(s) and not of MDPI and/or the editor(s). MDPI and/or the editor(s) disclaim responsibility for any injury to people or property resulting from any ideas, methods, instructions or products referred to in the content.